Generated with Pix4Dmapper Discovery version 1.4.46 Quality Report Important: Click on the different icons for: Help to analyze the results in the Quality Report Additional information about the feature Click here for additional tips to analyze the Quality Report Summary Project beyondtoxics Processed 2016-Sep-03 21:33:52 Camera Model Name FC300X_3.6_4000x3000 (RGB) Average Ground Sampling Distance (GSD) 8.11 cm / 3.19 in Area Covered 1.5418 km 2 / 154.18 ha / 0.5956 sq. mi. / 381.183 acres Image Coordinate System WGS84 Output Coordinate System WGS84 / UTM zone 10N Processing Type full Aerial nadir Feature Extraction Image Scale 1 Camera Model Parameter Optimization optimize externals and all internals Time for Initial Processing (without report) 02h:01m:55s Quality Check Images median of 48753 keypoints per image Dataset 449 out of 449 images calibrated (100%), all images enabled Camera Optimization 5.62% relative difference between initial and final focal length Matching median of 33265 matches per calibrated image Georeferencing no 3D GCP Preview Figure 1: Orthomosaic and the corresponding sparse Digital Surface Model (DSM) before densification.

Welcome message from author
This document is posted to help you gain knowledge. Please leave a comment to let me know what you think about it! Share it to your friends and learn new things together.
Transcript

Generated with Pix4Dmapper Discovery version 1.4.46
Quality Report
Important: Click on the different icons for:
Help to analyze the results in the Quality Report
Additional information about the feature
Click here for additional tips to analyze the Quality Report
Summary
Project beyondtoxicsProcessed 2016-Sep-03 21:33:52Camera Model Name FC300X_3.6_4000x3000 (RGB)Average Ground Sampling Distance (GSD) 8.11 cm / 3.19 in
Area Covered 1.5418 km2 / 154.18 ha / 0.5956 sq. mi. / 381.183 acresImage Coordinate System WGS84Output Coordinate System WGS84 / UTM zone 10NProcessing Type full Aerial nadirFeature Extraction Image Scale 1Camera Model Parameter Optimization optimize externals and all internalsTime for Initial Processing (without report) 02h:01m:55s
Quality Check
Images median of 48753 keypoints per image
Dataset 449 out of 449 images calibrated (100%), all images enabled
Camera Optimization 5.62% relative difference between initial and final focal length
Matching median of 33265 matches per calibrated image
Georeferencing no 3D GCP
Preview
Figure 1: Orthomosaic and the corresponding sparse Digital Surface Model (DSM) before densification.
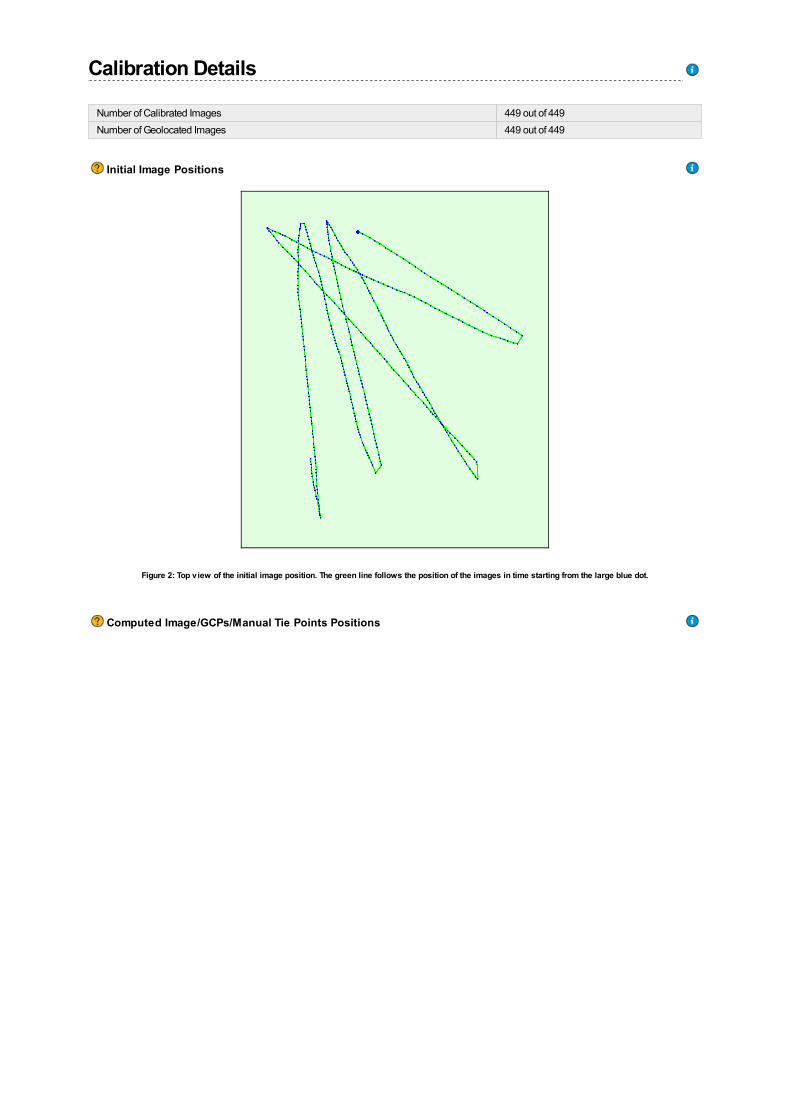
Calibration Details
Number of Calibrated Images 449 out of 449Number of Geolocated Images 449 out of 449
Initial Image Positions
Figure 2: Top view of the initial image position. The green line follows the position of the images in time starting from the large blue dot.
Computed Image/GCPs/Manual Tie Points Positions
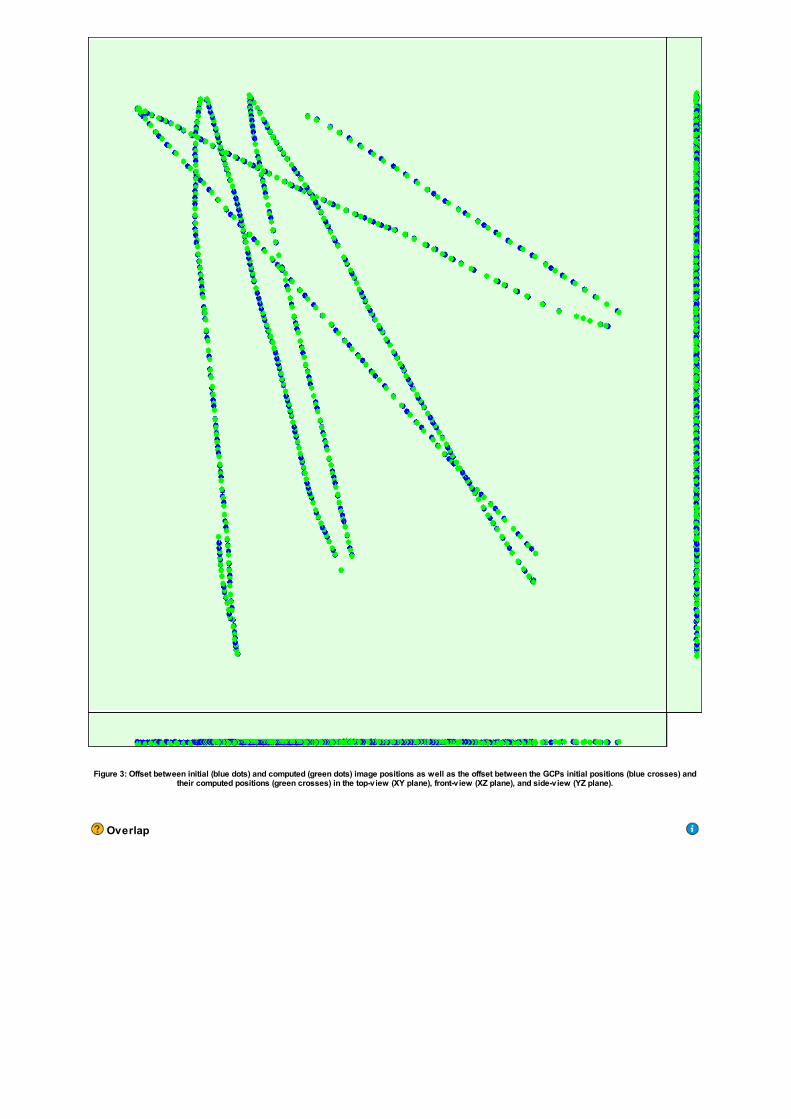
Figure 3: Offset between initial (blue dots) and computed (green dots) image positions as well as the offset between the GCPs initial positions (blue crosses) andtheir computed positions (green crosses) in the top-view (XY plane), front-view (XZ plane), and side-view (YZ plane).
Overlap

Number of overlapping images: 1 2 3 4 5+
Figure 4: Number of overlapping images computed for each pixel of the orthomosaic. Red and yellow areas indicate low overlap for which poor results may be generated. Green areas indicate an overlap of over 5 images for every pixel. Good
quality results will be generated as long as the number of keypoint matches is also sufficient for these areas (see Figure 5 for keypoint matches).
Bundle Block Adjustment Details
Number of 2D Keypoint Observations for Bundle Block Adjustment 14339237Number of 3D Points for Bundle Block Adjustment 2871195Mean Reprojection Error [pixels] 0.24575
Internal Camera Parameters
FC300X_3.6_4000x3000 (RGB). Sensor Dimensions: 6.317 [mm] x 4.738 [mm]
EXIF ID: FC300X_3.6_4000x3000
FocalLength
PrincipalPoint x
PrincipalPoint y R1 R2 R3 T1 T2
InitialValues
2285.714 [pixel]3.610 [mm]
2000.000 [pixel]3.159 [mm]
1500.000 [pixel]2.369 [mm] 0.000 0.000 0.000 0.000 0.000
OptimizedValues
2414.247 [pixel]3.813 [mm]
1964.234 [pixel]3.102 [mm]
1508.009 [pixel]2.382 [mm] -0.009 0.001 0.015 -0.000 -0.001
2D Keypoints Table
Number of 2D Keypoints per Image Number of Matched 2D Keypoints per ImageMedian 48753 33265Min 24334 6842Max 60350 45942Mean 46961 31936
3D Points from 2D Keypoint Matches
Number of 3D Points Observed

In 2 Images 1032602In 3 Images 478573In 4 Images 309399In 5 Images 221900In 6 Images 168760In 7 Images 128898In 8 Images 99905In 9 Images 79806In 10 Images 64755In 11 Images 53076In 12 Images 43803In 13 Images 35391In 14 Images 28477In 15 Images 23134In 16 Images 19007In 17 Images 15232In 18 Images 12798In 19 Images 10546In 20 Images 8654In 21 Images 6979In 22 Images 5574In 23 Images 4377In 24 Images 3573In 25 Images 2899In 26 Images 2372In 27 Images 1905In 28 Images 1547In 29 Images 1245In 30 Images 1084In 31 Images 876In 32 Images 665In 33 Images 574In 34 Images 489In 35 Images 398In 36 Images 344In 37 Images 283In 38 Images 223In 39 Images 195In 40 Images 165In 41 Images 131In 42 Images 100In 43 Images 90In 44 Images 56In 45 Images 60In 46 Images 49In 47 Images 27In 48 Images 35In 49 Images 21In 50 Images 25In 51 Images 17In 52 Images 16In 53 Images 15In 54 Images 11In 55 Images 12In 56 Images 7In 57 Images 11In 58 Images 6In 59 Images 6In 60 Images 6In 61 Images 3

In 62 Images 3In 63 Images 1In 64 Images 2In 66 Images 1In 68 Images 1
3D Points from 2D Keypoint Matches
Number of matches25 222 444 666 888 1111 1333 1555 1777 2000
Figure 5: Top view of the image computed positions with a link between matching images. The darkness of the links indicates the number of matched 2D keypointsbetween the images. Bright links indicate weak links and require manual tie points or more images.
Geolocation Details
Absolute Geolocation Variance
0 out of 449 geolocated and calibrated images have been labeled as inaccurate.
Min Error [m] Max Error [m] Geolocation Error X [%] Geolocation Error Y [%] Geolocation Error Z [%]- -15.00 0.00 0.00 0.00-15.00 -12.00 0.00 0.67 0.00-12.00 -9.00 0.89 4.45 0.00-9.00 -6.00 4.23 7.57 0.00-6.00 -3.00 5.57 13.14 0.00-3.00 0.00 39.87 26.28 59.910.00 3.00 36.08 20.71 37.193.00 6.00 10.69 12.03 2.906.00 9.00 2.67 10.91 0.009.00 12.00 0.00 4.01 0.0012.00 15.00 0.00 0.22 0.0015.00 - 0.00 0.00 0.00Mean -0.000857 0.001137 -0.072231Sigma 3.001527 5.090300 1.272607RMS Error 3.001527 5.090300 1.274655
Min Error and Max Error represent geolocation error intervals between -1.5 and 1.5 times the maximum accuracy of all the images. Columns X, Y, Z show thepercentage of images with geolocation errors within the predefined error intervals. The geolocation error is the difference between the intial and computed image

positions. Note that the image geolocation errors do not correspond to the accuracy of the observed 3D points.
Relative Geolocation Variance
Relative Geolocation Error Images X [%] Images Y [%] Images Z [%][-1.00, 1.00] 86.41 66.82 100.00[-2.00, 2.00] 99.78 96.21 100.00[-3.00, 3.00] 100.00 100.00 100.00Mean of Geolocation Accuracy 5.000000 5.000000 10.000000Sigma of Geolocation Accuracy 0.000000 0.000000 0.000000
Images X, Y, Z represent the percentage of images with a relative geolocation error in X, Y, Z.
Point Cloud Densification details
Summary
Processing Type aerial nadirImage Scale multiscale, 1/4 (quarter image size, fast)Point Density optimalMinimum Number of Matches 3Use Densification Area yesUse Annotations yesTime for Densification (without report and 3D textured mesh) 01h:21m:22s
Results
Number of 3D Densified Points 6508307
Average Density (per m3) 2.01
Related Documents