Overweight and obesity among Australian children and adolescents

Welcome message from author
This document is posted to help you gain knowledge. Please leave a comment to let me know what you think about it! Share it to your friends and learn new things together.
Transcript
Overweight and obesity affects 25% of Australian children and adolescents, and is associated with poorer health and wellbeing and higher health-care costs. Some children and adolescents are more likely to be overweight or obese, such as Indigenous children and children living in disadvantaged areas. Many factors contribute to the development of overweight and obesity, including environmental influences and individual behaviours.
Stronger evidence, better decisions, improved health and welfare
Overweight and obesity among Australian children and adolescents

Overweight and obesity among Australian children and adolescents
The Australian Institute of Health and Welfare is a major national agency whose purpose is to create authoritative and accessible information and statistics that inform decisions and
improve the health and welfare of all Australians.
© Australian Institute of Health and Welfare 2020
This product, excluding the AIHW logo, Commonwealth Coat of Arms and any material owned by a third party or protected by a trademark, has been released under a Creative Commons BY 3.0 (CC BY 3.0) licence. Excluded material owned by third parties may include, for example, design and layout, images obtained under licence from third parties and signatures. We have made all reasonable efforts to identify and label material owned by third parties.
You may distribute, remix and build upon this work. However, you must attribute the AIHW as the copyright holder of the work in compliance with our attribution policy available at www.aihw.gov.au/copyright/. The full terms and conditions of this licence are available at http://creativecommons.org/licenses/by/3.0/au/.
A complete list of the Institute’s publications is available from the Institute’s website www.aihw.gov.au.
ISBN 978-1-76054-707-3 (Online)ISBN 978-1-76054-708-0 (Print)
Suggested citationAustralian Institute of Health and Welfare 2020. Overweight and obesity among Australian children and adolescents. Cat. no. PHE 274. Canberra: AIHW.
Australian Institute of Health and WelfareBoard ChairMrs Louise Markus
Chief Executive Officer Mr Barry Sandison
Any enquiries relating to copyright or comments on this publication should be directed to:
Australian Institute of Health and WelfareGPO Box 570Canberra ACT 2601Tel: (02) 6244 1000Email: [email protected]
Published by the Australian Institute of Health and Welfare.
Please note that there is the potential for minor revisions of data in this report.
Please check the online version at www.aihw.gov.au for any amendments.
iii
ContentsSummary . . . . . . . . . . . . . . . . . . . . . . . . . . . . . . . . . . . . . . . . . . . . . . . . . . . . . . . . . . . . . . . . . . . . . . . . . . . v
1 Introduction . . . . . . . . . . . . . . . . . . . . . . . . . . . . . . . . . . . . . . . . . . . . . . . . . . . . . . . . . . . . . . . . . . . . . 1
Why is it important to monitor overweight and obesity in children and adolescents? . . . . . . . . 1
How is overweight and obesity measured? . . . . . . . . . . . . . . . . . . . . . . . . . . . . . . . . . . . . . . . . . . . . . 2
Purpose of this report . . . . . . . . . . . . . . . . . . . . . . . . . . . . . . . . . . . . . . . . . . . . . . . . . . . . . . . . . . . . . . . 3
Structure of this report . . . . . . . . . . . . . . . . . . . . . . . . . . . . . . . . . . . . . . . . . . . . . . . . . . . . . . . . . . . . . . 3
2 Who is affected and how has this changed over time? . . . . . . . . . . . . . . . . . . . . . . . . . . . . . . . . 4
How common is overweight and obesity among children and adolescents? . . . . . . . . . . . . . . . . 5
How does overweight and obesity vary by age and sex? . . . . . . . . . . . . . . . . . . . . . . . . . . . . . . . 5
Overweight and obesity is most common among children and adolescents who live in Inner regional areas . . . . . . . . . . . . . . . . . . . . . . . . . . . . . . . . . . . . . . . . . . . . . . . . . . . . . . . . . 6
Children and adolescents living in disadvantaged areas are more likely to be overweight or obese . . . . . . . . . . . . . . . . . . . . . . . . . . . . . . . . . . . . . . . . . . . . . . . . . . . . . . . . . . 7
How common is overweight and obesity among Aboriginal and Torres Strait Islander children and adolescents? . . . . . . . . . . . . . . . . . . . . . . . . . . . . . . . . . . . . . . . . . . . . . . . . . . . . . 8
Disability is associated with higher rates of overweight and obesity . . . . . . . . . . . . . . . . . . . . . 11
How have rates of overweight and obesity changed over time? . . . . . . . . . . . . . . . . . . . . . . . . . . . 12
What patterns are seen when the same children and adolescents are followed over time? . . . . . . . . . . . . . . . . . . . . . . . . . . . . . . . . . . . . . . . . . . . . . . . . . . . . . . . . . . . . . . . . . . . . . . 13
What proportion of children and adolescents change weight categories over time? . . . . . . . 18
Are today’s children, adolescents and young people more likely to be overweight or obese than people at the same age in previous years? . . . . . . . . . . . . . . . . . . . . . . . . . . . . . 20
3 What are the causes of overweight and obesity in children and adolescents? . . . . . . . . . . 24
Poor diets are a major contributor to overweight and obesity . . . . . . . . . . . . . . . . . . . . . . . . . . . . 25
Do Australian children and adolescents meet the Australian Dietary Guidelines? . . . . . . . . . 26
Sugar-sweetened drinks are especially popular among teenage boys . . . . . . . . . . . . . . . . . . . 26
Physical inactivity and sedentary behaviour increase the risk of overweight and obesity . . . . . . 26
Do children and adolescents meet the guidelines for physical activity and sedentary behaviour? . . . . . . . . . . . . . . . . . . . . . . . . . . . . . . . . . . . . . . . . . . . . . . . . . . . . . . . . . . 27
Many other factors contribute to overweight and obesity . . . . . . . . . . . . . . . . . . . . . . . . . . . . . . . . 28
Individual factors . . . . . . . . . . . . . . . . . . . . . . . . . . . . . . . . . . . . . . . . . . . . . . . . . . . . . . . . . . . . . . . . 28
Family influences . . . . . . . . . . . . . . . . . . . . . . . . . . . . . . . . . . . . . . . . . . . . . . . . . . . . . . . . . . . . . . . . 28
Community influences . . . . . . . . . . . . . . . . . . . . . . . . . . . . . . . . . . . . . . . . . . . . . . . . . . . . . . . . . . . 30
Societal influences . . . . . . . . . . . . . . . . . . . . . . . . . . . . . . . . . . . . . . . . . . . . . . . . . . . . . . . . . . . . . . . 32
iv
4 What are the impacts of overweight and obesity in children and adolescents? . . . . . . . . . 34
Overweight and obesity contributes to poorer physical health . . . . . . . . . . . . . . . . . . . . . . . . . . . . 34
Psychological health and wellbeing are negatively affected . . . . . . . . . . . . . . . . . . . . . . . . . . . . . . . 35
Children and adolescents may be subject to weight stigma, discrimination and bullying . . . 35
Quality of life and mental health can be negatively impacted by overweight and obesity . . . 36
Obesity is linked to poorer educational outcomes . . . . . . . . . . . . . . . . . . . . . . . . . . . . . . . . . . . . . . . 37
There are substantial economic impacts of overweight and obesity . . . . . . . . . . . . . . . . . . . . . . . 37
5 Reducing overweight and obesity in children and adolescents . . . . . . . . . . . . . . . . . . . . . . . . 39
What can be done to help individuals? . . . . . . . . . . . . . . . . . . . . . . . . . . . . . . . . . . . . . . . . . . . . . . . . 39
What can be done to help the population? . . . . . . . . . . . . . . . . . . . . . . . . . . . . . . . . . . . . . . . . . . . . . 41
What is being done around the world? . . . . . . . . . . . . . . . . . . . . . . . . . . . . . . . . . . . . . . . . . . . . . . 41
What is Australia doing? . . . . . . . . . . . . . . . . . . . . . . . . . . . . . . . . . . . . . . . . . . . . . . . . . . . . . . . . . . 42
Appendix A: Defining and measuring overweight and obesity . . . . . . . . . . . . . . . . . . . . . . . . . . . . . 44
Measuring overweight and obesity in children and adolescents . . . . . . . . . . . . . . . . . . . . . . . . . . . 44
Appendix B: Data sources and methods . . . . . . . . . . . . . . . . . . . . . . . . . . . . . . . . . . . . . . . . . . . . . . . . 46
Australian Bureau of Statistics surveys . . . . . . . . . . . . . . . . . . . . . . . . . . . . . . . . . . . . . . . . . . . . . . . . 46
Data sources . . . . . . . . . . . . . . . . . . . . . . . . . . . . . . . . . . . . . . . . . . . . . . . . . . . . . . . . . . . . . . . . . . . . 46
Methods . . . . . . . . . . . . . . . . . . . . . . . . . . . . . . . . . . . . . . . . . . . . . . . . . . . . . . . . . . . . . . . . . . . . . . . 47
Longitudinal Study of Australian Children . . . . . . . . . . . . . . . . . . . . . . . . . . . . . . . . . . . . . . . . . . . . . . 49
Data sources . . . . . . . . . . . . . . . . . . . . . . . . . . . . . . . . . . . . . . . . . . . . . . . . . . . . . . . . . . . . . . . . . . . . 49
Methods . . . . . . . . . . . . . . . . . . . . . . . . . . . . . . . . . . . . . . . . . . . . . . . . . . . . . . . . . . . . . . . . . . . . . . . 50
Sampling error . . . . . . . . . . . . . . . . . . . . . . . . . . . . . . . . . . . . . . . . . . . . . . . . . . . . . . . . . . . . . . . . . . . . . 52
Relative standard error, margin of error and confidence intervals . . . . . . . . . . . . . . . . . . . . . . 52
Significance testing . . . . . . . . . . . . . . . . . . . . . . . . . . . . . . . . . . . . . . . . . . . . . . . . . . . . . . . . . . . . . . 52
Acknowledgments . . . . . . . . . . . . . . . . . . . . . . . . . . . . . . . . . . . . . . . . . . . . . . . . . . . . . . . . . . . . . . . . . . 53
Abbreviations . . . . . . . . . . . . . . . . . . . . . . . . . . . . . . . . . . . . . . . . . . . . . . . . . . . . . . . . . . . . . . . . . . . . . . 53
Glossary . . . . . . . . . . . . . . . . . . . . . . . . . . . . . . . . . . . . . . . . . . . . . . . . . . . . . . . . . . . . . . . . . . . . . . . . . . . . 54
References . . . . . . . . . . . . . . . . . . . . . . . . . . . . . . . . . . . . . . . . . . . . . . . . . . . . . . . . . . . . . . . . . . . . . . . . . 58
List of tables . . . . . . . . . . . . . . . . . . . . . . . . . . . . . . . . . . . . . . . . . . . . . . . . . . . . . . . . . . . . . . . . . . . . . . . . 66
List of figures . . . . . . . . . . . . . . . . . . . . . . . . . . . . . . . . . . . . . . . . . . . . . . . . . . . . . . . . . . . . . . . . . . . . . . . 66
Related publications . . . . . . . . . . . . . . . . . . . . . . . . . . . . . . . . . . . . . . . . . . . . . . . . . . . . . . . . . . . . . . . . 67
Overweight and obesity among Australian children and adolescents v
Summary
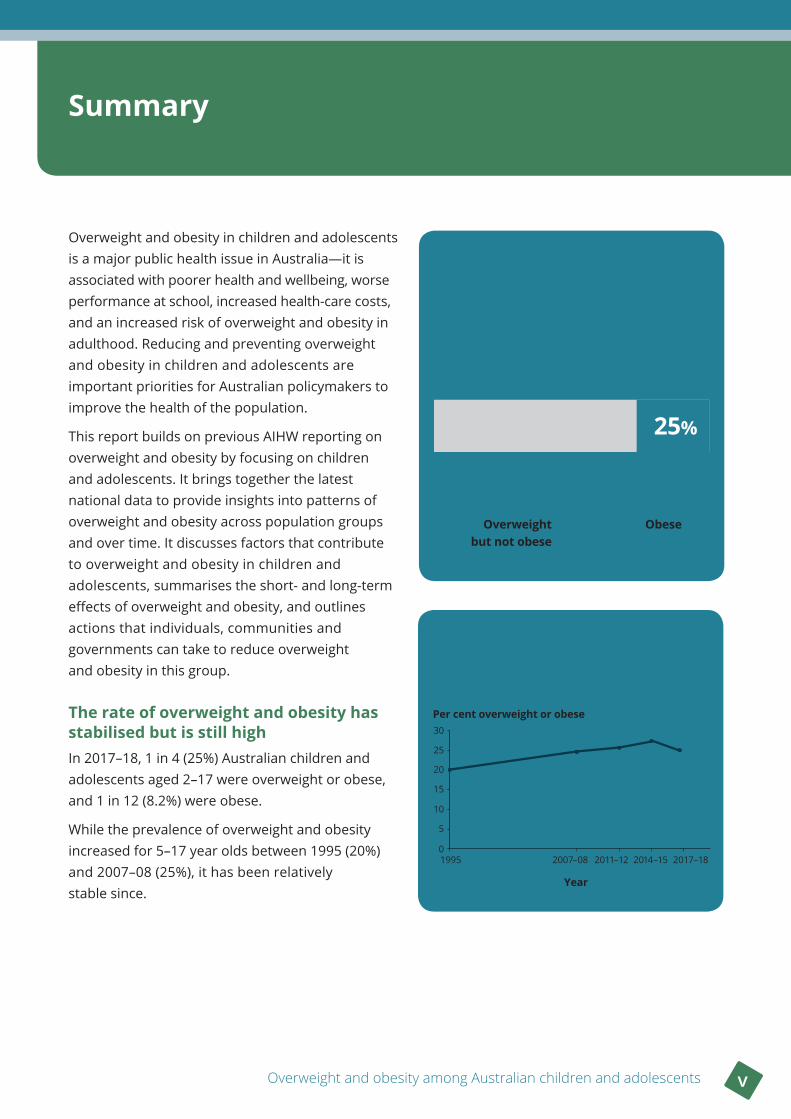
Overweight and obesity in children and adolescents is a major public health issue in Australia—it is associated with poorer health and wellbeing, worse performance at school, increased health-care costs, and an increased risk of overweight and obesity in adulthood. Reducing and preventing overweight and obesity in children and adolescents are important priorities for Australian policymakers to improve the health of the population.
This report builds on previous AIHW reporting on overweight and obesity by focusing on children and adolescents. It brings together the latest national data to provide insights into patterns of overweight and obesity across population groups and over time. It discusses factors that contribute to overweight and obesity in children and adolescents, summarises the short- and long-term effects of overweight and obesity, and outlines actions that individuals, communities and governments can take to reduce overweight and obesity in this group.
The rate of overweight and obesity has stabilised but is still high In 2017–18, 1 in 4 (25%) Australian children and adolescents aged 2–17 were overweight or obese, and 1 in 12 (8.2%) were obese.
While the prevalence of overweight and obesity increased for 5–17 year olds between 1995 (20%) and 2007–08 (25%), it has been relatively stable since.
For children aged 5–17, the prevalence of overweight and obesity rose from 1995 to 2007–08 and remained relatively stable to 2017–18
Per cent overweight or obese
Year
2017–182014–152011–122007–081995
30
10
20
0
25
5
15
Aged 2–17
8.2%
Obese 17%
Overweight but not obese
Overweight or obese
25%
vi Summary
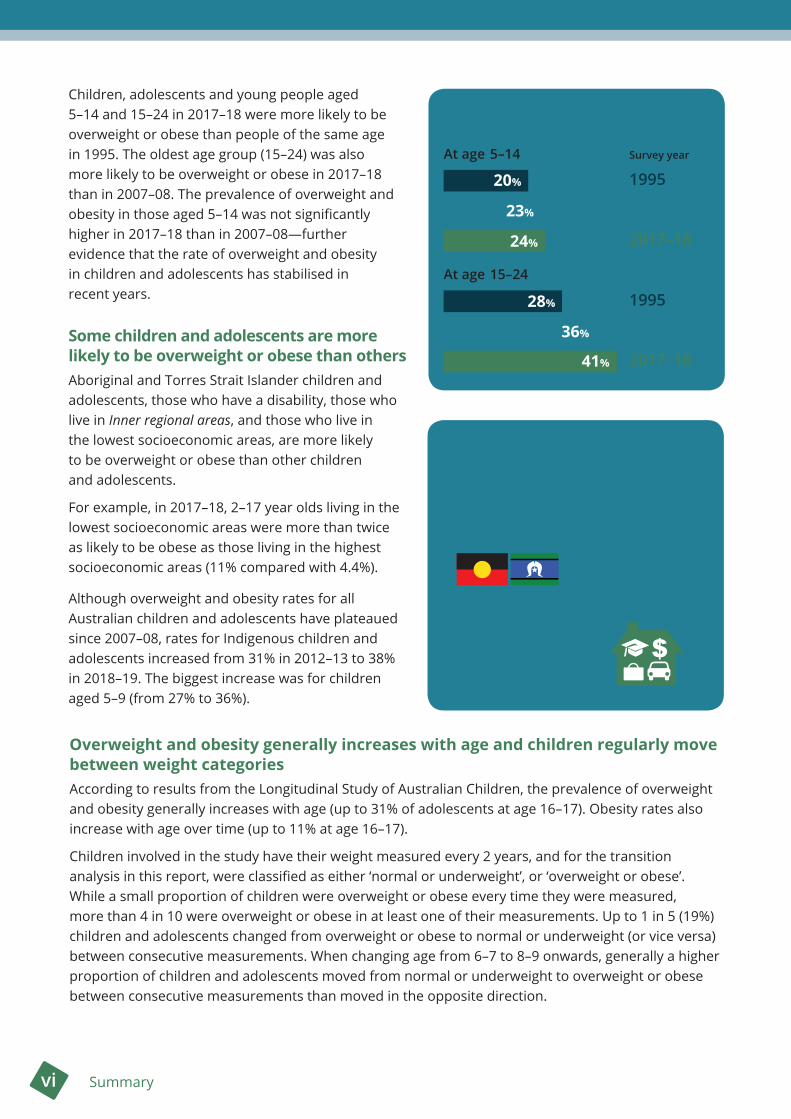
Children, adolescents and young people aged 5–14 and 15–24 in 2017–18 were more likely to be overweight or obese than people of the same age in 1995. The oldest age group (15–24) was also more likely to be overweight or obese in 2017–18 than in 2007–08. The prevalence of overweight and obesity in those aged 5–14 was not significantly higher in 2017–18 than in 2007–08—further evidence that the rate of overweight and obesity in children and adolescents has stabilised in recent years.
Some children and adolescents are more likely to be overweight or obese than othersAboriginal and Torres Strait Islander children and adolescents, those who have a disability, those who live in Inner regional areas, and those who live in the lowest socioeconomic areas, are more likely to be overweight or obese than other children and adolescents.
For example, in 2017–18, 2–17 year olds living in the lowest socioeconomic areas were more than twice as likely to be obese as those living in the highest socioeconomic areas (11% compared with 4.4%).
Although overweight and obesity rates for all Australian children and adolescents have plateaued since 2007–08, rates for Indigenous children and adolescents increased from 31% in 2012–13 to 38% in 2018–19. The biggest increase was for children aged 5–9 (from 27% to 36%).
Indigenous children and adolescents, those who have a disability, those living in Inner regional areas and those who are in lower socioeconomic groups are more likely to be overweight or obese
Proportion of overweight and obese children and adolescents
At age 5–14
At age 15–24
Overweight and obesity generally increases with age and children regularly move between weight categoriesAccording to results from the Longitudinal Study of Australian Children, the prevalence of overweight and obesity generally increases with age (up to 31% of adolescents at age 16–17). Obesity rates also increase with age over time (up to 11% at age 16–17).
Children involved in the study have their weight measured every 2 years, and for the transition analysis in this report, were classified as either ‘normal or underweight’, or ‘overweight or obese’. While a small proportion of children were overweight or obese every time they were measured, more than 4 in 10 were overweight or obese in at least one of their measurements. Up to 1 in 5 (19%) children and adolescents changed from overweight or obese to normal or underweight (or vice versa) between consecutive measurements. When changing age from 6–7 to 8–9 onwards, generally a higher proportion of children and adolescents moved from normal or underweight to overweight or obese between consecutive measurements than moved in the opposite direction.
20%
24%
23%
28%
36%
41%
1995
1995
2007–08
2007–08
2017–18
2017–18
Survey year
Overweight and obesity among Australian children and adolescents vii
Many factors contribute to overweight and obesity Although overweight and obesity is mainly caused by an energy imbalance (where too much energy is taken in through food and drink, and not enough energy is expended through physical activity), many other factors contribute to the development of excess weight in children and adolescents. These include rapid weight gain during infancy, poor sleep, having parents who are overweight or obese, and exposure to marketing of unhealthy food that is targeted at children and adolescents.
Overweight and obesity has substantial health, wellbeing and financial costsChildren and adolescents who are overweight or obese are more likely to have poorer physical health than children and adolescents who are of normal weight. They may also be subjected to bullying and teasing, which can lead to poorer mental health and quality of life. These negative outcomes worsen as the severity of obesity increases. Obesity is also associated with poorer academic performance, and higher health-care costs.
Wide-ranging actions can help prevent overweight and obesityHealth professionals can support children, adolescents and their families to prevent the development of overweight and obesity by encouraging healthy diets, physical activity and limited sedentary time. These actions are most effective when accompanied by policies to change environments that are conducive to the development of overweight and obesity in the population. Obesity prevention policies in Australia and worldwide include specific strategies for targeting overweight and obesity in children and adolescents, such as limiting the marketing and availability of unhealthy food and drinks.

Overweight and obesity among Australian children and adolescents 1
1 Introduction
Overweight and obesity in children and adolescents is a serious public health issue, with the prevalence of childhood and adolescent overweight and obesity increasing worldwide between 1975 and 2016 (NCD Risk Factor Collaboration 2017b). In 2016, 1 in 5 (19%) males and 1 in 6 (17%) females aged 5–19 were overweight or obese worldwide (NCD Risk Factor Collaboration 2017a). For children aged 0–5, an estimated 1 in 15 (6.7%) were overweight or obese in 2010 (de Onis et al. 2010).
While the rise in excess weight in children and adolescents has plateaued in recent years in some high-income countries like Australia, overweight and obesity rates remain high (NCD Risk Factor Collaboration 2017b; Olds et al. 2010). In Australia, 1 in 4 (25%) children and adolescents aged 2–17 are now overweight or obese, with about 1 in 12 (8.2%) obese (ABS 2018b).
Why is it important to monitor overweight and obesity in children and adolescents?Overweight and obesity can adversely affect children and adolescents’ health and wellbeing and increase the risk of overweight and obesity—and its related serious health problems—in adulthood (CDC 2016; Hayes et al. 2019). Children and adolescents with obesity are estimated to be 5 times as likely as those who are not obese, to be obese as adults, and obesity in adolescence is very likely to persist into adulthood (Simmonds et al. 2016).
The earlier in life a child becomes overweight or obese, the greater portion of their life they are likely to live with excess weight, increasing their exposure to the associated health risks (The Obesity Collective 2019; World Cancer Research Fund/American Institute for Cancer Research 2018). Earlier onset and longer duration of obesity-related health conditions increases the risk of premature illness and disease, reduced quality of life, and earlier death (Abdullah et al. 2011; Kelsey et al. 2014).
As the severity of overweight and obesity increases, the effects on health and wellbeing worsen (WHO 2000). Compared with children with moderate obesity, those with severe obesity are at an increased risk of adult obesity, premature death, and health problems such as hypertension, type 2 diabetes, and fatty liver disease (Bass & Eneli 2015).
Overweight and obesity places a large burden on the health-care system, with more severe levels of obesity associated with higher health costs (AIHW 2017a; PwC Australia 2015). In 2015, 8.4% of the disease burden in Australia was due to overweight and obesity, making it the second-leading risk factor contributing to disease burden after tobacco use (AIHW 2019a).
Children and adolescents who are overweight or obese may experience weight-based bullying and teasing, which can lead to reduced quality of life and wellbeing (Bass & Eneli 2015; Pont et al. 2017). Children and adolescents with obesity also tend to perform worse academically compared with those with a normal weight (Black et al. 2015; OECD 2019).
2 Chapter 1 Introduction
Behaviours that can affect a person’s weight, such as dietary intake, physical activity and sedentary behaviour, are established in childhood and tend to continue into adulthood (Biddle et al. 2010; Brown et al. 2017; Craigie et al. 2011). Children start forming preferences for certain foods, and learning behaviours related to diet and activities at a young age (Brown et al. 2017). Children’s diet and activities often change once they start school and are exposed to peers and different environments (NCD Risk Factor Collaboration 2017b). Adolescence introduces new challenges, including more independence in deciding what to eat and what activities to participate in. Adolescence is also associated with changing eating habits (such as irregular meals), more inactivity, and physiological changes that can increase fat deposition, especially in girls (NHMRC 2013b).
Monitoring overweight and obesity in children and adolescents helps identify patterns and trends, which can inform the development of prevention strategies to reduce the persistence of overweight and obesity into adulthood.
Box 1 .1: How are children and adolescents defined?• In this report, children and adolescents are defined as those aged under 18 years.
• Most results are presented for age groups within the 2–17 year age range.
• Data for adolescents and young adults aged 15–24 years (referred to here as ‘young people’) are also included.
How is overweight and obesity measured? The most common way of measuring overweight and obesity is to calculate a person’s body mass index (BMI), by dividing their weight in kilograms by their height in metres squared (kg/m2). The resulting number is classified into a BMI category of either underweight, normal weight, overweight or obese.
To account for changes in children and adolescents’ body composition as they grow, age and sex are taken into account when assessing their BMI. International cut-off points based on age and sex are used when assessing their BMI at a population level (Cole et al. 2000). See Appendix A for more information on measuring overweight and obesity.
How reliable is body mass index?
BMI is useful for measuring overweight and obesity in large-scale surveys to assess health at a population level. However, differences in body composition mean that BMI can be an imprecise measure of overweight and obesity at an individual level, with a higher BMI not always associated with higher body fat (Dollman & Olds 2006; Telford et al. 2019). This is particularly true of children and adolescents, whose height and body composition are continually changing as they grow.
Overweight and obesity among Australian children and adolescents 3
Purpose of this report This report builds on previous AIHW reporting on overweight and obesity (AIHW 2017a, 2017b, 2019g) to focus specifically on children and adolescents. Early intervention in childhood and adolescence is critical for preventing overweight and obesity in the population, as highlighted in national strategies such as the National Action Plan for the Health of Children and Young People 2020–2030 (Department of Health 2019b).
This report draws together the latest available data from a range of nationally representative sources, including the Australian Bureau of Statistics’ (ABS) National Health Survey, the ABS’s National Aboriginal and Torres Strait Islander Health Survey, and Growing Up in Australia: the Longitudinal Study of Australian Children. Results of new data analysis are presented, to provide insights into patterns of overweight and obesity in Australian children and adolescents, across population groups and over time.
The report also includes a discussion of factors contributing to overweight and obesity in children and adolescents, impacts of overweight and obesity in this age group, and strategies for reducing overweight and obesity.
Structure of this report• This Introduction summarises why monitoring overweight and obesity in children and adolescents
is important, explains how overweight and obesity is measured, and provides an overview of what the report will cover.
• Chapter 2 presents information on the prevalence of overweight and obesity among children and adolescents, including trends over time, and differences between population groups. It also looks at patterns in overweight and obesity when the same children and adolescents are monitored over time, and investigates whether children and adolescents born more recently are more likely to be overweight or obese than people at the same age in previous years.
• Chapter 3 summarises some of the main causes of overweight and obesity in children and adolescents, including diet and physical activity levels, as well as a range of individual, family, community and societal influences.
• Chapter 4 discusses some of the health, wellbeing, educational and economic impacts of childhood and adolescent overweight and obesity.
• Chapter 5 looks at approaches for reducing overweight and obesity in children and adolescents at an individual level, as well as broader strategies for addressing overweight and obesity at a population level.

4 Chapter 2 Who is affected and how has this changed over time?
2 Who is affected and how has this changed over time?
Key findings
• One quarter (25%) of Australian children and adolescents aged 2–17 were overweight or obese in 2017–18, and 8.2% were obese.
• The obesity rate in the lowest socioeconomic areas (11%) was more than twice as high as the rate in the highest areas (4.4%).
• The proportion of Aboriginal and Torres Strait Islander children and adolescents aged 2–17 who were overweight or obese increased from 31% in 2012–13 to 38% in 2018–19. The biggest increase was for those aged 5–9 (from 27% to 36%).
• The prevalence of overweight and obesity, and obesity alone, increased for 5–17 year old Australians between 1995 and 2007–08, but has been relatively stable since.
• When measuring the same children every 2 years in the Longitudinal Study of Australian Children, overweight and obesity generally increased with age. Over 4 in 10 were overweight or obese at least once but only a small proportion of children were overweight or obese every time they were measured.
• Adolescents and young people aged 15–24 in 2017–18 were more likely to be overweight or obese compared with people at the same age 10 and 22 years earlier.
This chapter uses nationally representative cross-sectional survey data to provide a ‘snapshot’ of the proportion of the population who are overweight or obese at a point in time. Changes in prevalence over time and variation between population groups are also discussed.
Using longitudinal analysis that tracks the same individuals over time, this chapter explores the persistence of overweight and obesity in 2 cohorts of children and adolescents, and the proportion whose weight category changes from normal to overweight or obese (and vice versa) over time.
Through a birth cohort analysis of cross-sectional data from 3 time points (1995, 2007–08 and 2017–18), this chapter also investigates whether children, adolescents and young people born more recently are more likely to be overweight or obese than people at the same age in previous years.
All results are based on BMI calculated using the age- and sex-specific ranges considered appropriate for children and adolescents developed by Cole et al. (2000) (see Appendix A).
Supplementary tables for the data presented in figures in this report (including prevalence estimates and confidence intervals) are available at https://www.aihw.gov.au/reports/overweight-obesity/overweight-obesity-australian-children-adolescents/data.
Throughout this report, all reported differences between groups—such as age groups, boys and girls, socioeconomic areas, and Indigenous and non-Indigenous children—are statistically significant, unless stated otherwise.
Overweight and obesity among Australian children and adolescents 5
How common is overweight and obesity among children and adolescents?In 2017–18, according to data from the National Health Survey, one quarter (25%) of Australian children and adolescents aged 2–17 were overweight or obese—17% were overweight but not obese, and 8.2% were obese (ABS 2018b).
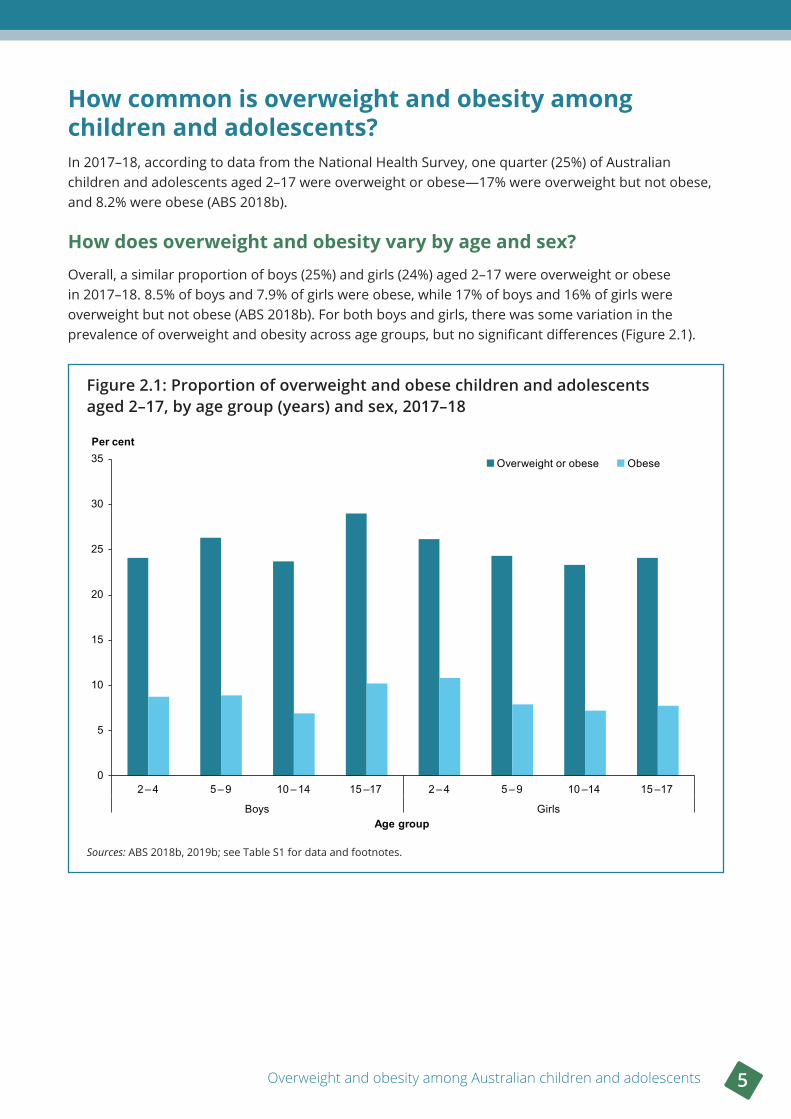
How does overweight and obesity vary by age and sex?Overall, a similar proportion of boys (25%) and girls (24%) aged 2–17 were overweight or obese in 2017–18. 8.5% of boys and 7.9% of girls were obese, while 17% of boys and 16% of girls were overweight but not obese (ABS 2018b). For both boys and girls, there was some variation in the prevalence of overweight and obesity across age groups, but no significant differences (Figure 2.1).
Figure 2 .1: Proportion of overweight and obese children and adolescents aged 2–17, by age group (years) and sex, 2017–18
Sources: ABS 2018b, 2019b; see Table S1 for data and footnotes.
0
5
10
15
20
25
30
35
2 – 4 5 – 9 10 – 14 15 –17 2 – 4 5 – 9 10 –14 15 –17
Boys Girls
Per cent
Age group
Overweight or obese Obese
6 Chapter 2 Who is affected and how has this changed over time?
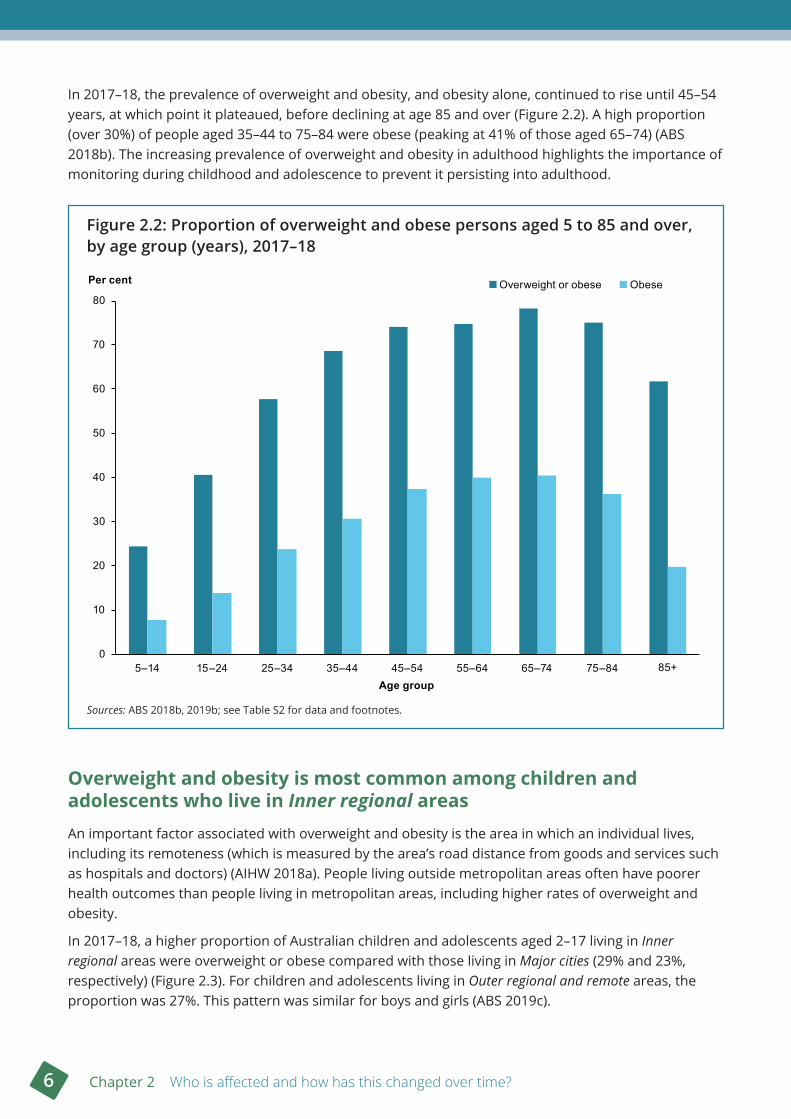
In 2017–18, the prevalence of overweight and obesity, and obesity alone, continued to rise until 45–54 years, at which point it plateaued, before declining at age 85 and over (Figure 2.2). A high proportion (over 30%) of people aged 35–44 to 75–84 were obese (peaking at 41% of those aged 65–74) (ABS 2018b). The increasing prevalence of overweight and obesity in adulthood highlights the importance of monitoring during childhood and adolescence to prevent it persisting into adulthood.
Figure 2 .2: Proportion of overweight and obese persons aged 5 to 85 and over, by age group (years), 2017–18
Sources: ABS 2018b, 2019b; see Table S2 for data and footnotes.
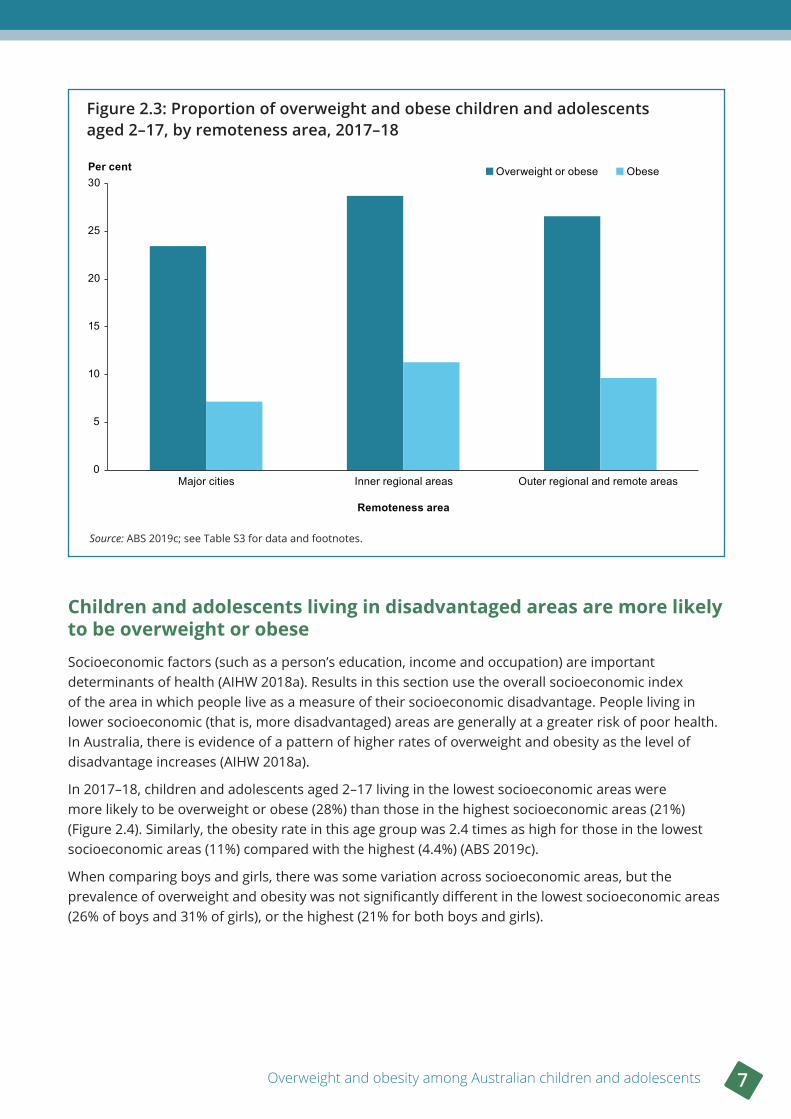
Overweight and obesity is most common among children and adolescents who live in Inner regional areasAn important factor associated with overweight and obesity is the area in which an individual lives, including its remoteness (which is measured by the area’s road distance from goods and services such as hospitals and doctors) (AIHW 2018a). People living outside metropolitan areas often have poorer health outcomes than people living in metropolitan areas, including higher rates of overweight and obesity.
In 2017–18, a higher proportion of Australian children and adolescents aged 2–17 living in Inner regional areas were overweight or obese compared with those living in Major cities (29% and 23%, respectively) (Figure 2.3). For children and adolescents living in Outer regional and remote areas, the proportion was 27%. This pattern was similar for boys and girls (ABS 2019c).
0
10
20
30
40
50
60
70
80
5–14 15–24 25–34 35–44 45–54 55–64 65–74 75–84 85+
Per cent
Age group
Overweight or obese Obese
Overweight and obesity among Australian children and adolescents 7
Figure 2 .3: Proportion of overweight and obese children and adolescents aged 2–17, by remoteness area, 2017–18
Source: ABS 2019c; see Table S3 for data and footnotes.
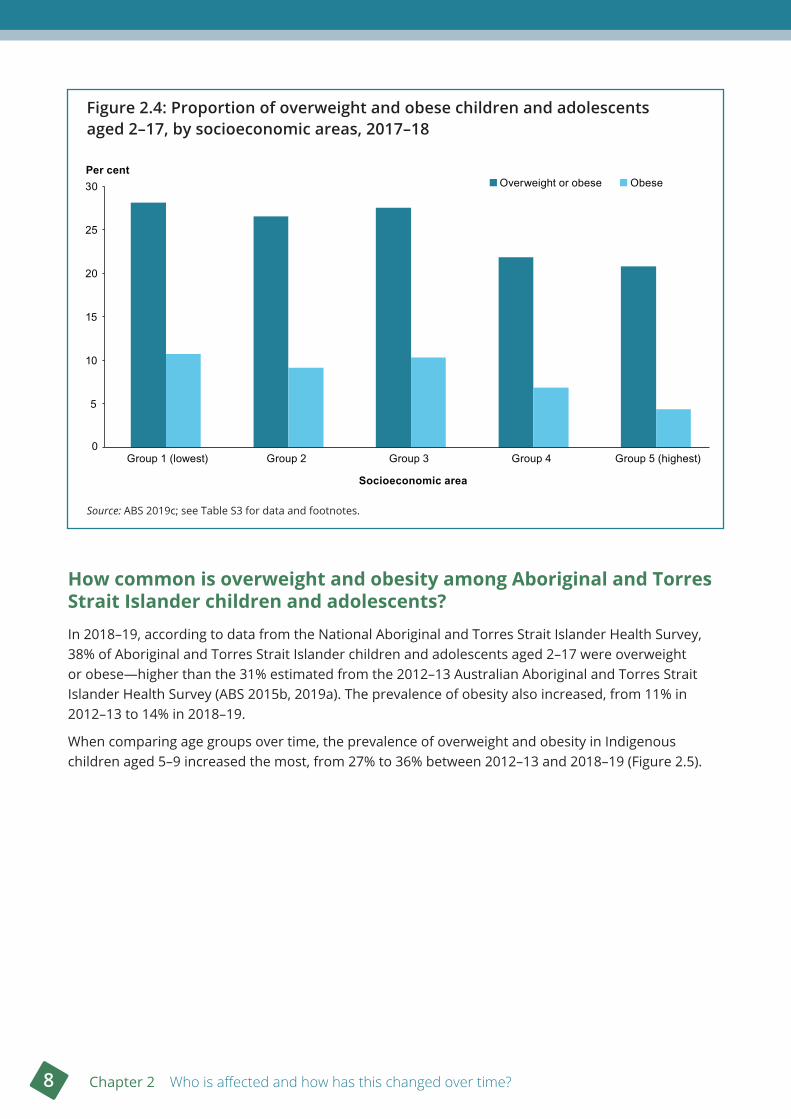
Children and adolescents living in disadvantaged areas are more likely to be overweight or obeseSocioeconomic factors (such as a person’s education, income and occupation) are important determinants of health (AIHW 2018a). Results in this section use the overall socioeconomic index of the area in which people live as a measure of their socioeconomic disadvantage. People living in lower socioeconomic (that is, more disadvantaged) areas are generally at a greater risk of poor health. In Australia, there is evidence of a pattern of higher rates of overweight and obesity as the level of disadvantage increases (AIHW 2018a).
In 2017–18, children and adolescents aged 2–17 living in the lowest socioeconomic areas were more likely to be overweight or obese (28%) than those in the highest socioeconomic areas (21%) (Figure 2.4). Similarly, the obesity rate in this age group was 2.4 times as high for those in the lowest socioeconomic areas (11%) compared with the highest (4.4%) (ABS 2019c).
When comparing boys and girls, there was some variation across socioeconomic areas, but the prevalence of overweight and obesity was not significantly different in the lowest socioeconomic areas (26% of boys and 31% of girls), or the highest (21% for both boys and girls).
0
5
10
15
20
25
30
Major cities Inner regional areas Outer regional and remote areas
Per cent
Remoteness area
Overweight or obese Obese
8 Chapter 2 Who is affected and how has this changed over time?
Figure 2 .4: Proportion of overweight and obese children and adolescents aged 2–17, by socioeconomic areas, 2017–18
Source: ABS 2019c; see Table S3 for data and footnotes.
How common is overweight and obesity among Aboriginal and Torres Strait Islander children and adolescents? In 2018–19, according to data from the National Aboriginal and Torres Strait Islander Health Survey, 38% of Aboriginal and Torres Strait Islander children and adolescents aged 2–17 were overweight or obese—higher than the 31% estimated from the 2012–13 Australian Aboriginal and Torres Strait Islander Health Survey (ABS 2015b, 2019a). The prevalence of obesity also increased, from 11% in 2012–13 to 14% in 2018–19.
When comparing age groups over time, the prevalence of overweight and obesity in Indigenous children aged 5–9 increased the most, from 27% to 36% between 2012–13 and 2018–19 (Figure 2.5).
0
5
10
15
20
25
30
Group 1 (lowest) Group 2 Group 3 Group 4 Group 5 (highest)
Per cent
Socioeconomic area
Overweight or obese Obese
Overweight and obesity among Australian children and adolescents 9
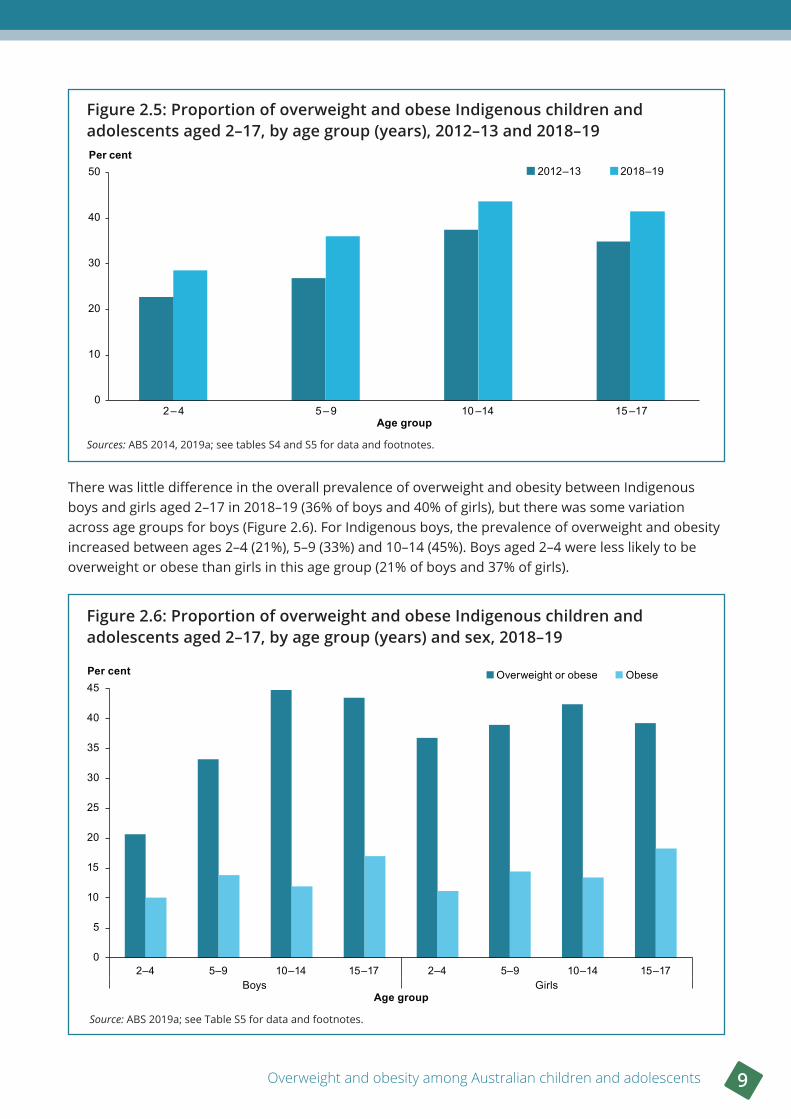
Figure 2 .5: Proportion of overweight and obese Indigenous children and adolescents aged 2–17, by age group (years), 2012–13 and 2018–19
Sources: ABS 2014, 2019a; see tables S4 and S5 for data and footnotes.
There was little difference in the overall prevalence of overweight and obesity between Indigenous boys and girls aged 2–17 in 2018–19 (36% of boys and 40% of girls), but there was some variation across age groups for boys (Figure 2.6). For Indigenous boys, the prevalence of overweight and obesity increased between ages 2–4 (21%), 5–9 (33%) and 10–14 (45%). Boys aged 2–4 were less likely to be overweight or obese than girls in this age group (21% of boys and 37% of girls).
Figure 2 .6: Proportion of overweight and obese Indigenous children and adolescents aged 2–17, by age group (years) and sex, 2018–19
Source: ABS 2019a; see Table S5 for data and footnotes.
0
10
20
30
40
50
2 – 4 5 – 9 10 –14 15 –17
Per cent
Age group
2012–13 2018–19
0
5
10
15
20
25
30
35
40
45
2–4 5–9 10–14 15–17 2–4 5–9 10–14 15–17Boys Girls
Per cent
Age group
Overweight or obese Obese
10 Chapter 2 Who is affected and how has this changed over time?
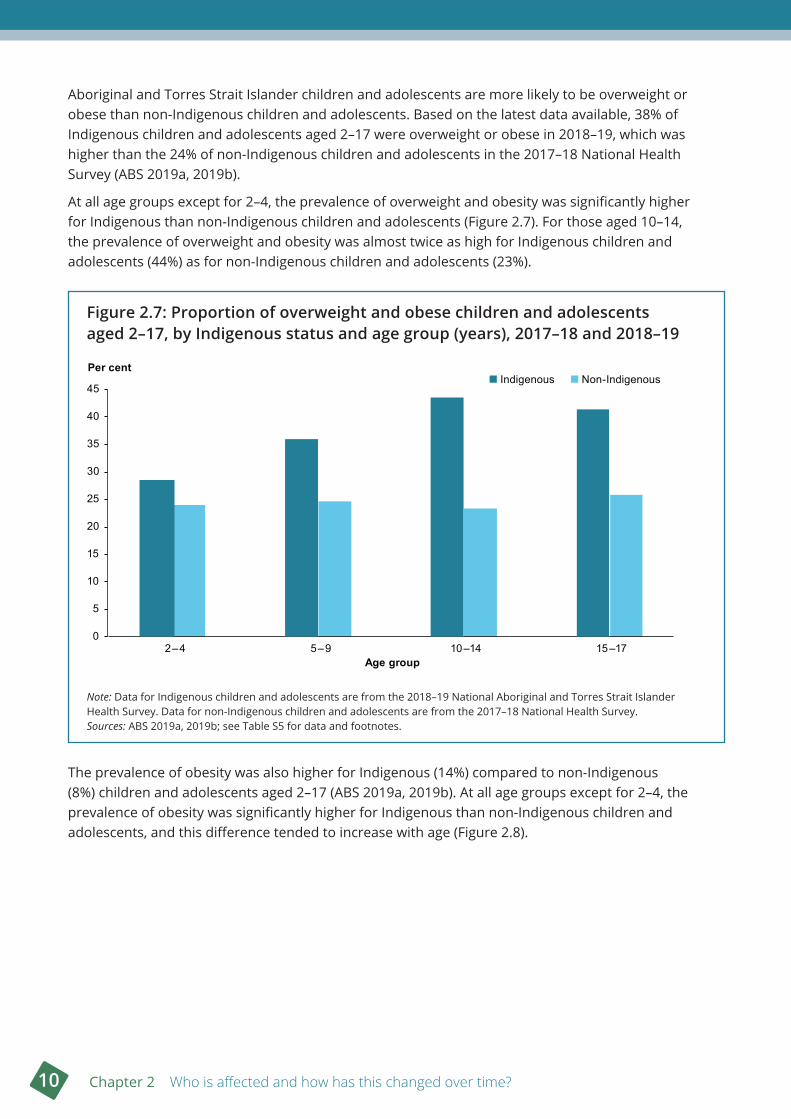
Aboriginal and Torres Strait Islander children and adolescents are more likely to be overweight or obese than non-Indigenous children and adolescents. Based on the latest data available, 38% of Indigenous children and adolescents aged 2–17 were overweight or obese in 2018–19, which was higher than the 24% of non-Indigenous children and adolescents in the 2017–18 National Health Survey (ABS 2019a, 2019b).
At all age groups except for 2–4, the prevalence of overweight and obesity was significantly higher for Indigenous than non-Indigenous children and adolescents (Figure 2.7). For those aged 10–14, the prevalence of overweight and obesity was almost twice as high for Indigenous children and adolescents (44%) as for non-Indigenous children and adolescents (23%).
Figure 2 .7: Proportion of overweight and obese children and adolescents aged 2–17, by Indigenous status and age group (years), 2017–18 and 2018–19
Note: Data for Indigenous children and adolescents are from the 2018–19 National Aboriginal and Torres Strait Islander Health Survey. Data for non-Indigenous children and adolescents are from the 2017–18 National Health Survey.Sources: ABS 2019a, 2019b; see Table S5 for data and footnotes.
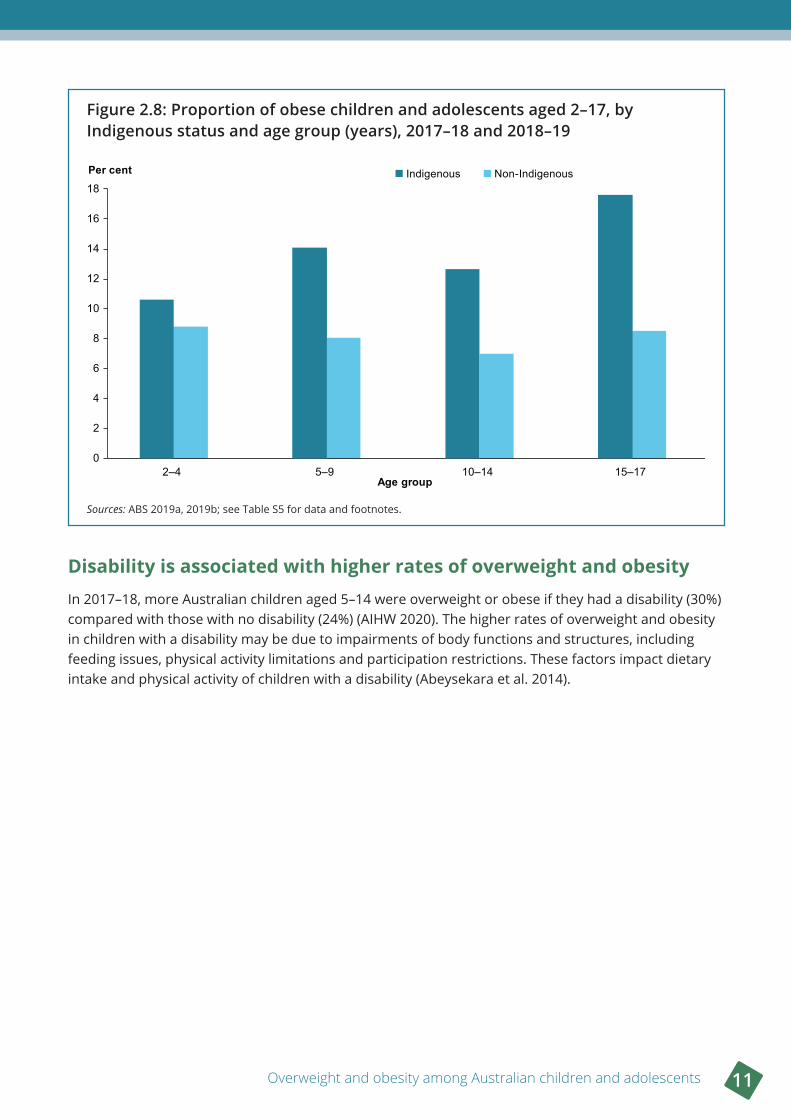
The prevalence of obesity was also higher for Indigenous (14%) compared to non-Indigenous (8%) children and adolescents aged 2–17 (ABS 2019a, 2019b). At all age groups except for 2–4, the prevalence of obesity was significantly higher for Indigenous than non-Indigenous children and adolescents, and this difference tended to increase with age (Figure 2.8).
0
5
10
15
20
25
30
35
40
45
2–4 5–9 10–14 15–17
Indigenous Non-IndigenousPer cent
Age group
Overweight and obesity among Australian children and adolescents 11
Figure 2 .8: Proportion of obese children and adolescents aged 2–17, by Indigenous status and age group (years), 2017–18 and 2018–19
Sources: ABS 2019a, 2019b; see Table S5 for data and footnotes.
Disability is associated with higher rates of overweight and obesityIn 2017–18, more Australian children aged 5–14 were overweight or obese if they had a disability (30%) compared with those with no disability (24%) (AIHW 2020). The higher rates of overweight and obesity in children with a disability may be due to impairments of body functions and structures, including feeding issues, physical activity limitations and participation restrictions. These factors impact dietary intake and physical activity of children with a disability (Abeysekara et al. 2014).
0
2
4
6
8
10
12
14
16
18
2–4 5–9 10–14 15–17
Per cent
Age group
Indigenous Non-Indigenous
12 Chapter 2 Who is affected and how has this changed over time?
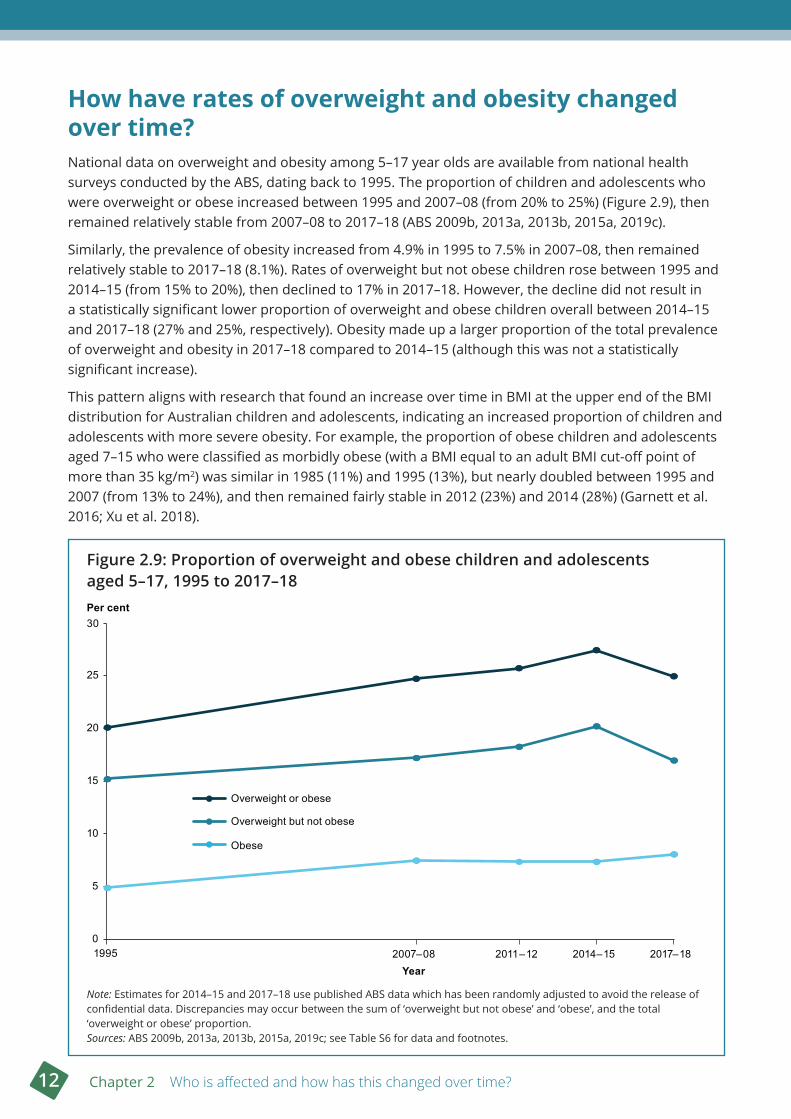
How have rates of overweight and obesity changed over time?National data on overweight and obesity among 5–17 year olds are available from national health surveys conducted by the ABS, dating back to 1995. The proportion of children and adolescents who were overweight or obese increased between 1995 and 2007–08 (from 20% to 25%) (Figure 2.9), then remained relatively stable from 2007–08 to 2017–18 (ABS 2009b, 2013a, 2013b, 2015a, 2019c).
Similarly, the prevalence of obesity increased from 4.9% in 1995 to 7.5% in 2007–08, then remained relatively stable to 2017–18 (8.1%). Rates of overweight but not obese children rose between 1995 and 2014–15 (from 15% to 20%), then declined to 17% in 2017–18. However, the decline did not result in a statistically significant lower proportion of overweight and obese children overall between 2014–15 and 2017–18 (27% and 25%, respectively). Obesity made up a larger proportion of the total prevalence of overweight and obesity in 2017–18 compared to 2014–15 (although this was not a statistically significant increase).
This pattern aligns with research that found an increase over time in BMI at the upper end of the BMI distribution for Australian children and adolescents, indicating an increased proportion of children and adolescents with more severe obesity. For example, the proportion of obese children and adolescents aged 7–15 who were classified as morbidly obese (with a BMI equal to an adult BMI cut-off point of more than 35 kg/m2) was similar in 1985 (11%) and 1995 (13%), but nearly doubled between 1995 and 2007 (from 13% to 24%), and then remained fairly stable in 2012 (23%) and 2014 (28%) (Garnett et al. 2016; Xu et al. 2018).
Figure 2 .9: Proportion of overweight and obese children and adolescents aged 5–17, 1995 to 2017–18
Note: Estimates for 2014–15 and 2017–18 use published ABS data which has been randomly adjusted to avoid the release of confidential data. Discrepancies may occur between the sum of ‘overweight but not obese’ and ‘obese’, and the total ‘overweight or obese’ proportion.Sources: ABS 2009b, 2013a, 2013b, 2015a, 2019c; see Table S6 for data and footnotes.
0
5
10
15
20
25
30
1995 2007–08 2011–12 2014–15 2017–18
Per cent
Year
Overweight or obese
Overweight but not obese
Obese
Overweight and obesity among Australian children and adolescents 13
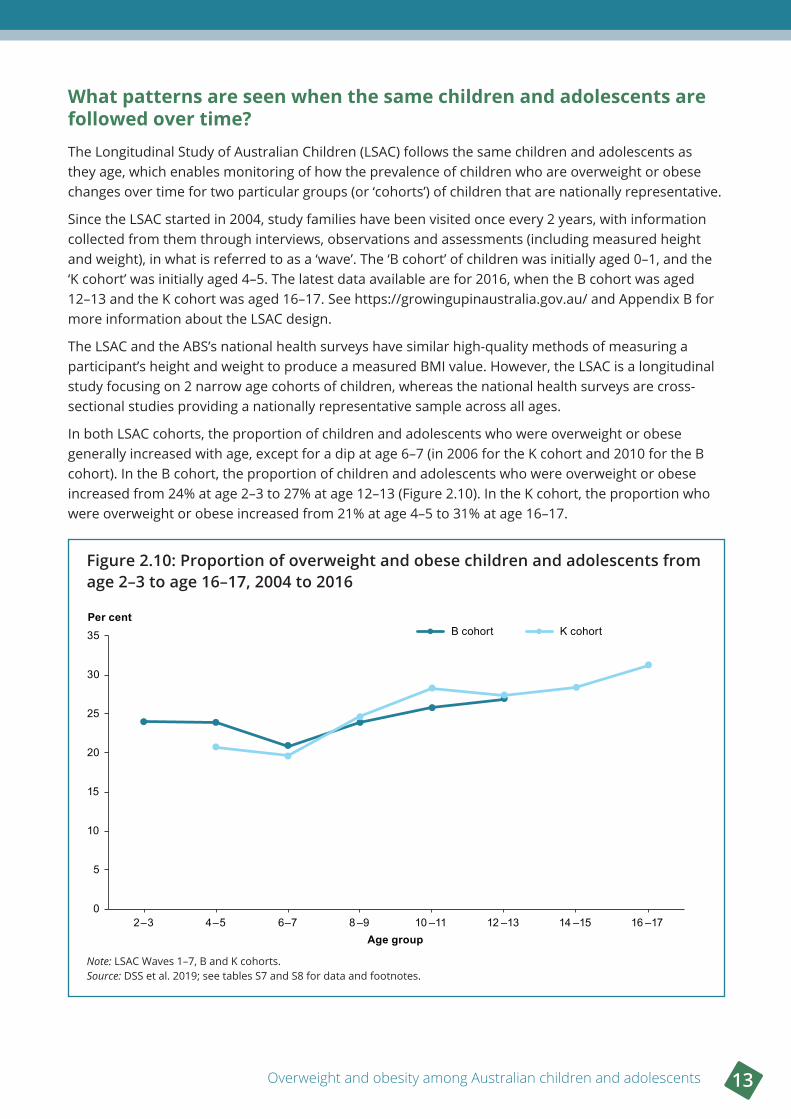
What patterns are seen when the same children and adolescents are followed over time? The Longitudinal Study of Australian Children (LSAC) follows the same children and adolescents as they age, which enables monitoring of how the prevalence of children who are overweight or obese changes over time for two particular groups (or ‘cohorts’) of children that are nationally representative.
Since the LSAC started in 2004, study families have been visited once every 2 years, with information collected from them through interviews, observations and assessments (including measured height and weight), in what is referred to as a ‘wave’. The ‘B cohort’ of children was initially aged 0–1, and the ‘K cohort’ was initially aged 4–5. The latest data available are for 2016, when the B cohort was aged 12–13 and the K cohort was aged 16–17. See https://growingupinaustralia.gov.au/ and Appendix B for more information about the LSAC design.
The LSAC and the ABS’s national health surveys have similar high-quality methods of measuring a participant’s height and weight to produce a measured BMI value. However, the LSAC is a longitudinal study focusing on 2 narrow age cohorts of children, whereas the national health surveys are cross-sectional studies providing a nationally representative sample across all ages.
In both LSAC cohorts, the proportion of children and adolescents who were overweight or obese generally increased with age, except for a dip at age 6–7 (in 2006 for the K cohort and 2010 for the B cohort). In the B cohort, the proportion of children and adolescents who were overweight or obese increased from 24% at age 2–3 to 27% at age 12–13 (Figure 2.10). In the K cohort, the proportion who were overweight or obese increased from 21% at age 4–5 to 31% at age 16–17.
Figure 2 .10: Proportion of overweight and obese children and adolescents from age 2–3 to age 16–17, 2004 to 2016
Note: LSAC Waves 1–7, B and K cohorts.Source: DSS et al. 2019; see tables S7 and S8 for data and footnotes.
0
5
10
15
20
25
30
35
2–3 4–5 6–7 8 –9 10 –11 12 –13 14 –15 16 –17
Per cent
Age group
B cohort K cohort
14 Chapter 2 Who is affected and how has this changed over time?
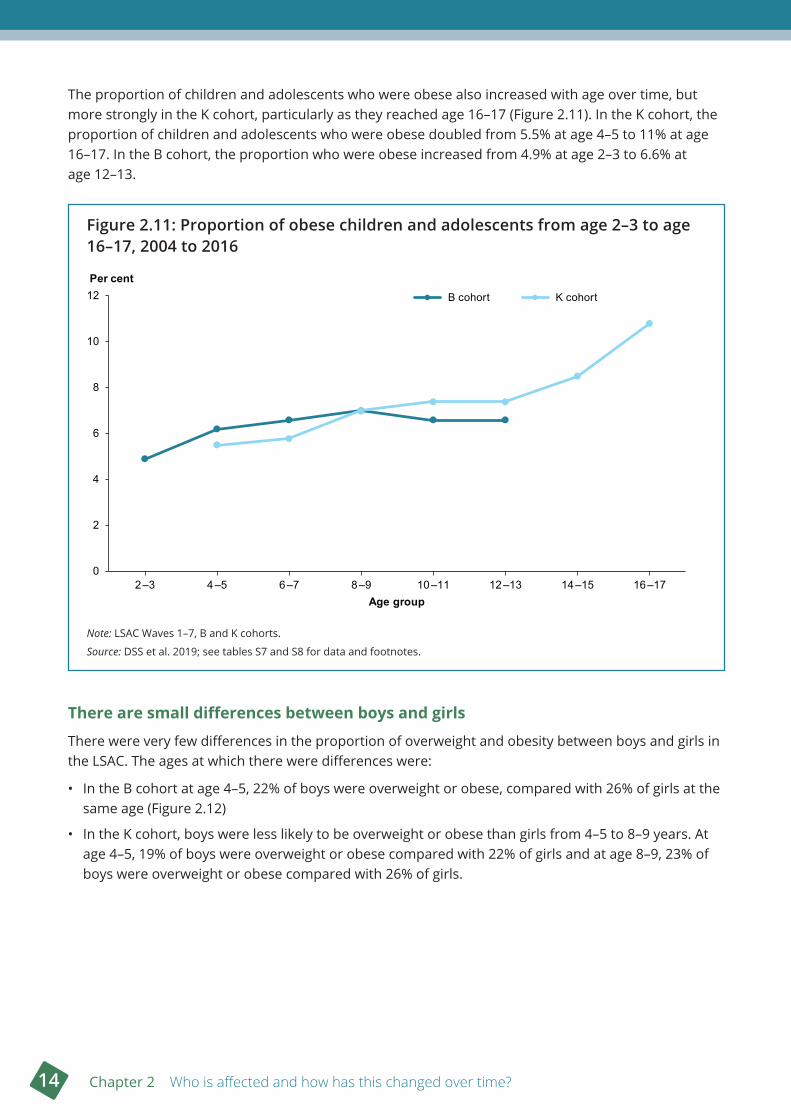
The proportion of children and adolescents who were obese also increased with age over time, but more strongly in the K cohort, particularly as they reached age 16–17 (Figure 2.11). In the K cohort, the proportion of children and adolescents who were obese doubled from 5.5% at age 4–5 to 11% at age 16–17. In the B cohort, the proportion who were obese increased from 4.9% at age 2–3 to 6.6% at age 12–13.
Figure 2 .11: Proportion of obese children and adolescents from age 2–3 to age 16–17, 2004 to 2016
Note: LSAC Waves 1–7, B and K cohorts.
Source: DSS et al. 2019; see tables S7 and S8 for data and footnotes.
There are small differences between boys and girls
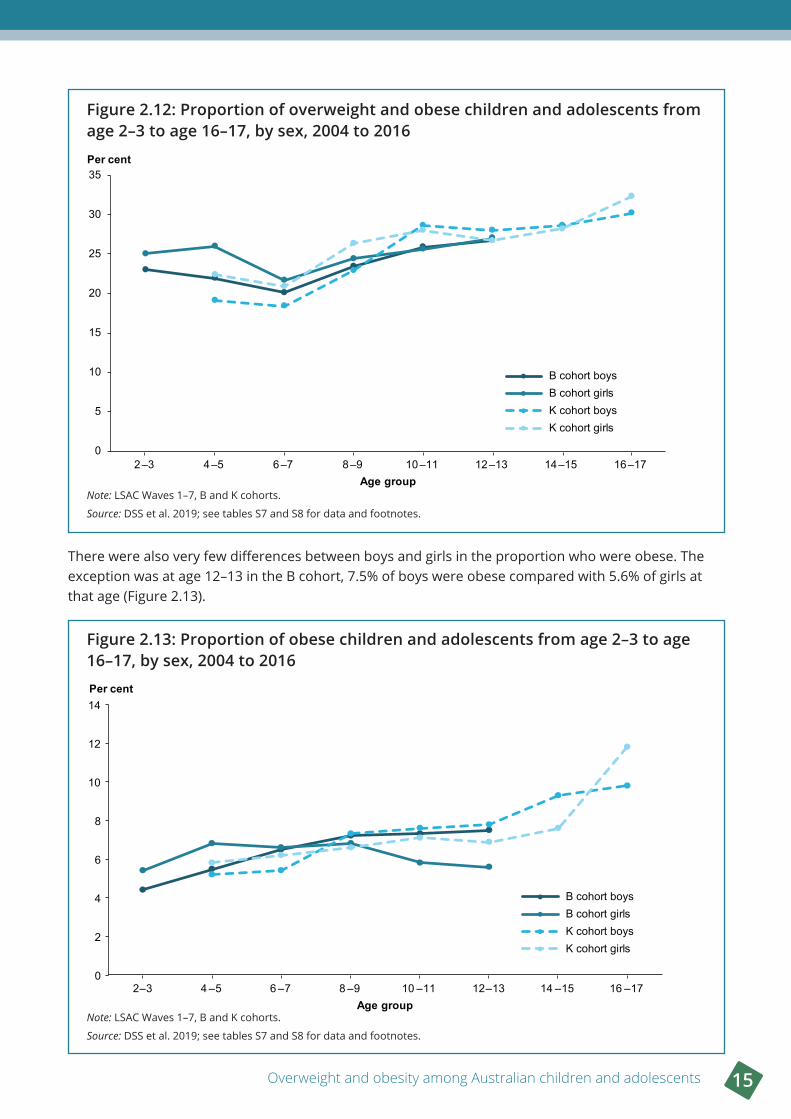
There were very few differences in the proportion of overweight and obesity between boys and girls in the LSAC. The ages at which there were differences were:
• In the B cohort at age 4–5, 22% of boys were overweight or obese, compared with 26% of girls at the same age (Figure 2.12)
• In the K cohort, boys were less likely to be overweight or obese than girls from 4–5 to 8–9 years. At age 4–5, 19% of boys were overweight or obese compared with 22% of girls and at age 8–9, 23% of boys were overweight or obese compared with 26% of girls.
0
2
4
6
8
10
12
2–3 4–5 6–7 8–9 10–11 12–13 14–15 16–17
Per cent
Age group
B cohort K cohort
B cohort K cohort
Overweight and obesity among Australian children and adolescents 15
Figure 2 .12: Proportion of overweight and obese children and adolescents from age 2–3 to age 16–17, by sex, 2004 to 2016
Note: LSAC Waves 1–7, B and K cohorts.
Source: DSS et al. 2019; see tables S7 and S8 for data and footnotes.
There were also very few differences between boys and girls in the proportion who were obese. The exception was at age 12–13 in the B cohort, 7.5% of boys were obese compared with 5.6% of girls at that age (Figure 2.13).
Figure 2 .13: Proportion of obese children and adolescents from age 2–3 to age 16–17, by sex, 2004 to 2016
Note: LSAC Waves 1–7, B and K cohorts.
Source: DSS et al. 2019; see tables S7 and S8 for data and footnotes.
0
5
10
15
20
25
30
35
2–3 4–5 6–7 8–9 10–11 12–13 14–15 16–17
Per cent
Age group
B cohort boysB cohort girlsK cohort boysK cohort girls
0
2
4
6
8
10
12
14
2–3 4 –5 6 –7 8 –9 10 –11 12–13 14 –15 16 –17
Per cent
Age group
B cohort boysB cohort girlsK cohort boysK cohort girls
16 Chapter 2 Who is affected and how has this changed over time?
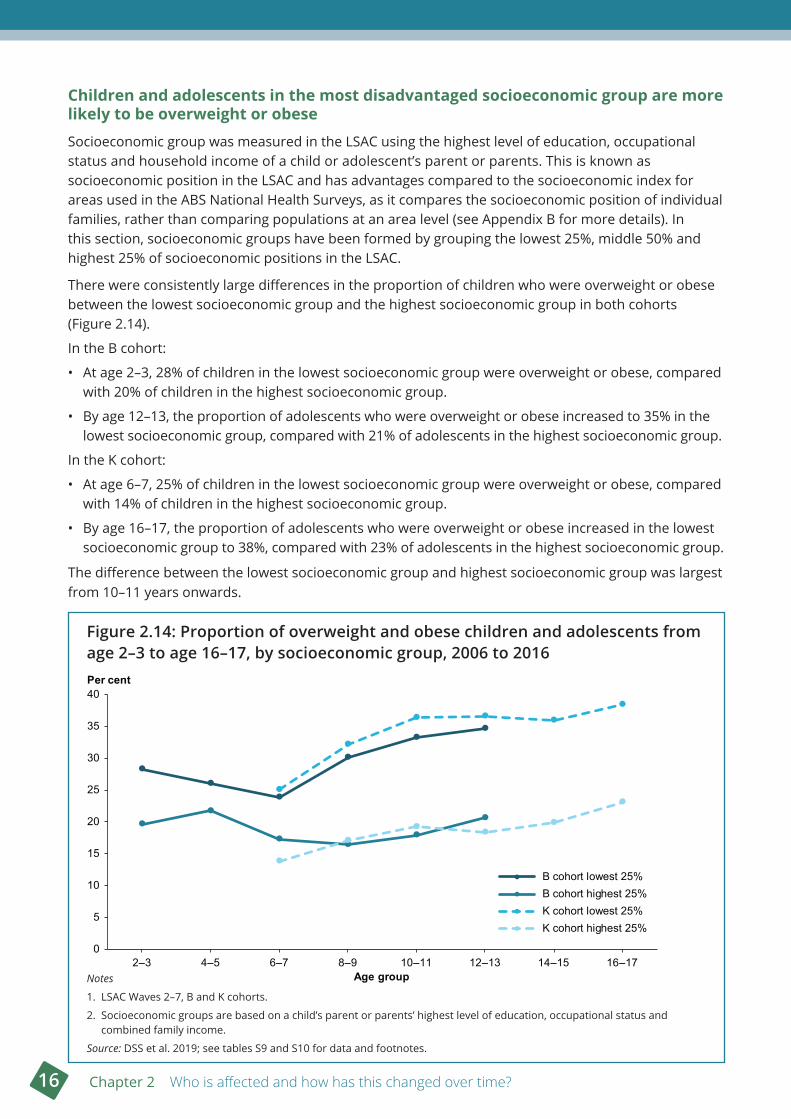
Children and adolescents in the most disadvantaged socioeconomic group are more likely to be overweight or obese
Socioeconomic group was measured in the LSAC using the highest level of education, occupational status and household income of a child or adolescent’s parent or parents. This is known as socioeconomic position in the LSAC and has advantages compared to the socioeconomic index for areas used in the ABS National Health Surveys, as it compares the socioeconomic position of individual families, rather than comparing populations at an area level (see Appendix B for more details). In this section, socioeconomic groups have been formed by grouping the lowest 25%, middle 50% and highest 25% of socioeconomic positions in the LSAC.
There were consistently large differences in the proportion of children who were overweight or obese between the lowest socioeconomic group and the highest socioeconomic group in both cohorts (Figure 2.14).
In the B cohort:
• At age 2–3, 28% of children in the lowest socioeconomic group were overweight or obese, compared with 20% of children in the highest socioeconomic group.
• By age 12–13, the proportion of adolescents who were overweight or obese increased to 35% in the lowest socioeconomic group, compared with 21% of adolescents in the highest socioeconomic group.
In the K cohort:
• At age 6–7, 25% of children in the lowest socioeconomic group were overweight or obese, compared with 14% of children in the highest socioeconomic group.
• By age 16–17, the proportion of adolescents who were overweight or obese increased in the lowest socioeconomic group to 38%, compared with 23% of adolescents in the highest socioeconomic group.
The difference between the lowest socioeconomic group and highest socioeconomic group was largest from 10–11 years onwards.
Figure 2 .14: Proportion of overweight and obese children and adolescents from age 2–3 to age 16–17, by socioeconomic group, 2006 to 2016
Notes
1. LSAC Waves 2–7, B and K cohorts.
2. Socioeconomic groups are based on a child’s parent or parents’ highest level of education, occupational status and combined family income.
Source: DSS et al. 2019; see tables S9 and S10 for data and footnotes.
0
5
10
15
20
25
30
35
40
2–3 4–5 6–7 8–9 10–11 12–13 14–15 16–17
Per cent
Age group
B cohort lowest 25%B cohort highest 25%K cohort lowest 25%K cohort highest 25%
Overweight and obesity among Australian children and adolescents 17
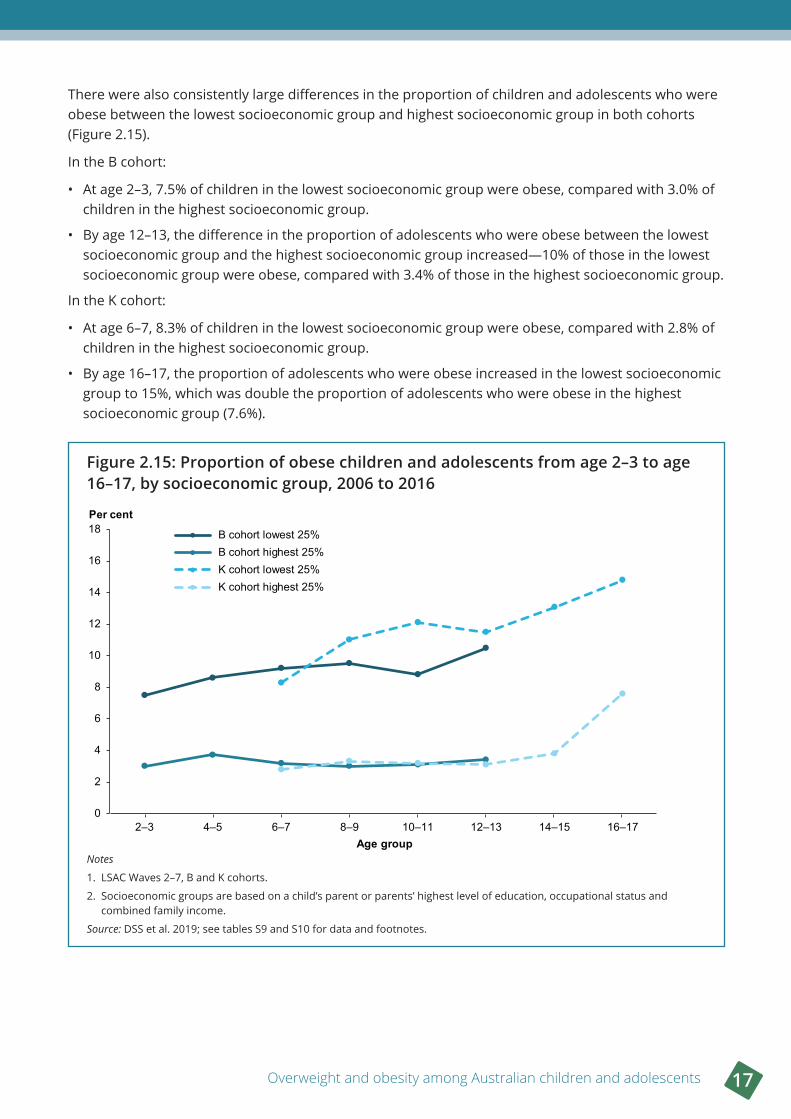
There were also consistently large differences in the proportion of children and adolescents who were obese between the lowest socioeconomic group and highest socioeconomic group in both cohorts (Figure 2.15).
In the B cohort:
• At age 2–3, 7.5% of children in the lowest socioeconomic group were obese, compared with 3.0% of children in the highest socioeconomic group.
• By age 12–13, the difference in the proportion of adolescents who were obese between the lowest socioeconomic group and the highest socioeconomic group increased—10% of those in the lowest socioeconomic group were obese, compared with 3.4% of those in the highest socioeconomic group.
In the K cohort:
• At age 6–7, 8.3% of children in the lowest socioeconomic group were obese, compared with 2.8% of children in the highest socioeconomic group.
• By age 16–17, the proportion of adolescents who were obese increased in the lowest socioeconomic group to 15%, which was double the proportion of adolescents who were obese in the highest socioeconomic group (7.6%).
Figure 2 .15: Proportion of obese children and adolescents from age 2–3 to age 16–17, by socioeconomic group, 2006 to 2016
Notes
1. LSAC Waves 2–7, B and K cohorts.
2. Socioeconomic groups are based on a child’s parent or parents’ highest level of education, occupational status and combined family income.
Source: DSS et al. 2019; see tables S9 and S10 for data and footnotes.
0
2
4
6
8
10
12
14
16
18
2–3 4–5 6–7 8–9 10–11 12–13 14–15 16–17
Per cent
Age group
B cohort lowest 25%B cohort highest 25%K cohort lowest 25%K cohort highest 25%
18 Chapter 2 Who is affected and how has this changed over time?
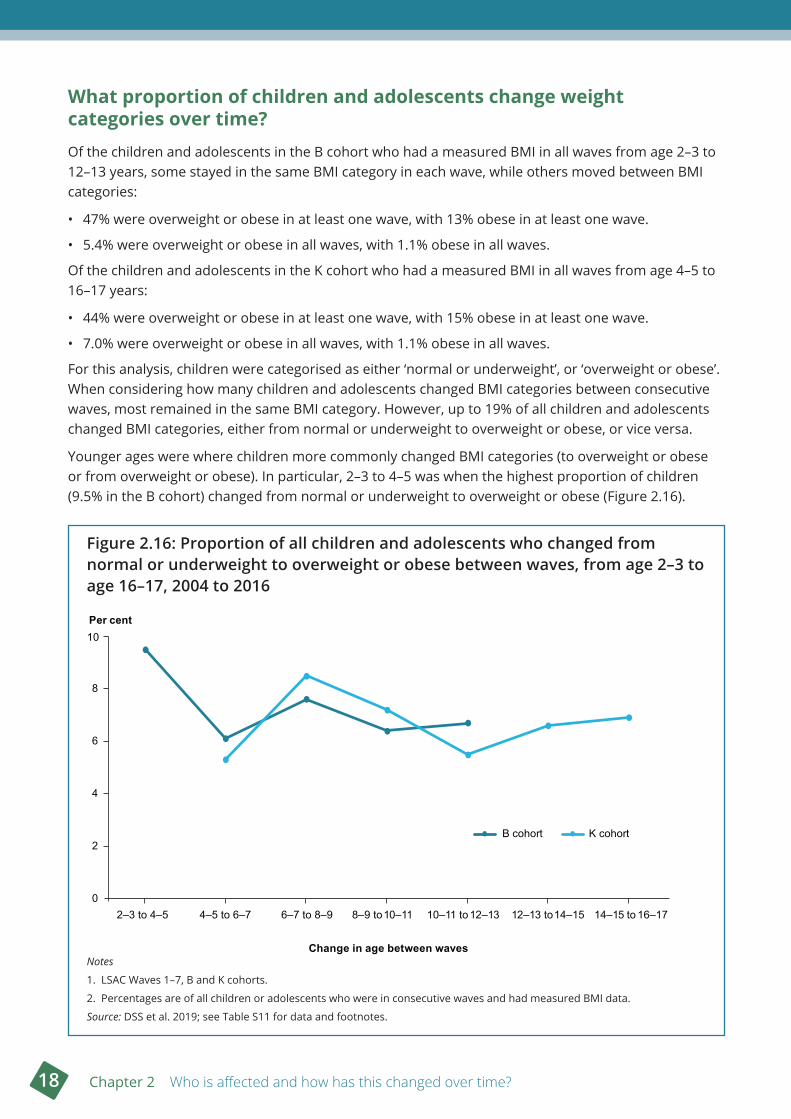
What proportion of children and adolescents change weight categories over time?Of the children and adolescents in the B cohort who had a measured BMI in all waves from age 2–3 to 12–13 years, some stayed in the same BMI category in each wave, while others moved between BMI categories:
• 47% were overweight or obese in at least one wave, with 13% obese in at least one wave.
• 5.4% were overweight or obese in all waves, with 1.1% obese in all waves.
Of the children and adolescents in the K cohort who had a measured BMI in all waves from age 4–5 to 16–17 years:
• 44% were overweight or obese in at least one wave, with 15% obese in at least one wave.
• 7.0% were overweight or obese in all waves, with 1.1% obese in all waves.
For this analysis, children were categorised as either ‘normal or underweight’, or ‘overweight or obese’. When considering how many children and adolescents changed BMI categories between consecutive waves, most remained in the same BMI category. However, up to 19% of all children and adolescents changed BMI categories, either from normal or underweight to overweight or obese, or vice versa.
Younger ages were where children more commonly changed BMI categories (to overweight or obese or from overweight or obese). In particular, 2–3 to 4–5 was when the highest proportion of children (9.5% in the B cohort) changed from normal or underweight to overweight or obese (Figure 2.16).
Figure 2 .16: Proportion of all children and adolescents who changed from normal or underweight to overweight or obese between waves, from age 2–3 to age 16–17, 2004 to 2016
Notes
1. LSAC Waves 1–7, B and K cohorts.
2. Percentages are of all children or adolescents who were in consecutive waves and had measured BMI data.
Source: DSS et al. 2019; see Table S11 for data and footnotes.
0
2
4
6
8
10Per cent
Change in age between waves
B cohort K cohort
2–3 to 4–5 4–5 to 6–7 6–7 to 8–9 8–9 to 10–11 10–11 to 12–13 12–13 to 14–15 14–15 to 16–17
Overweight and obesity among Australian children and adolescents 19
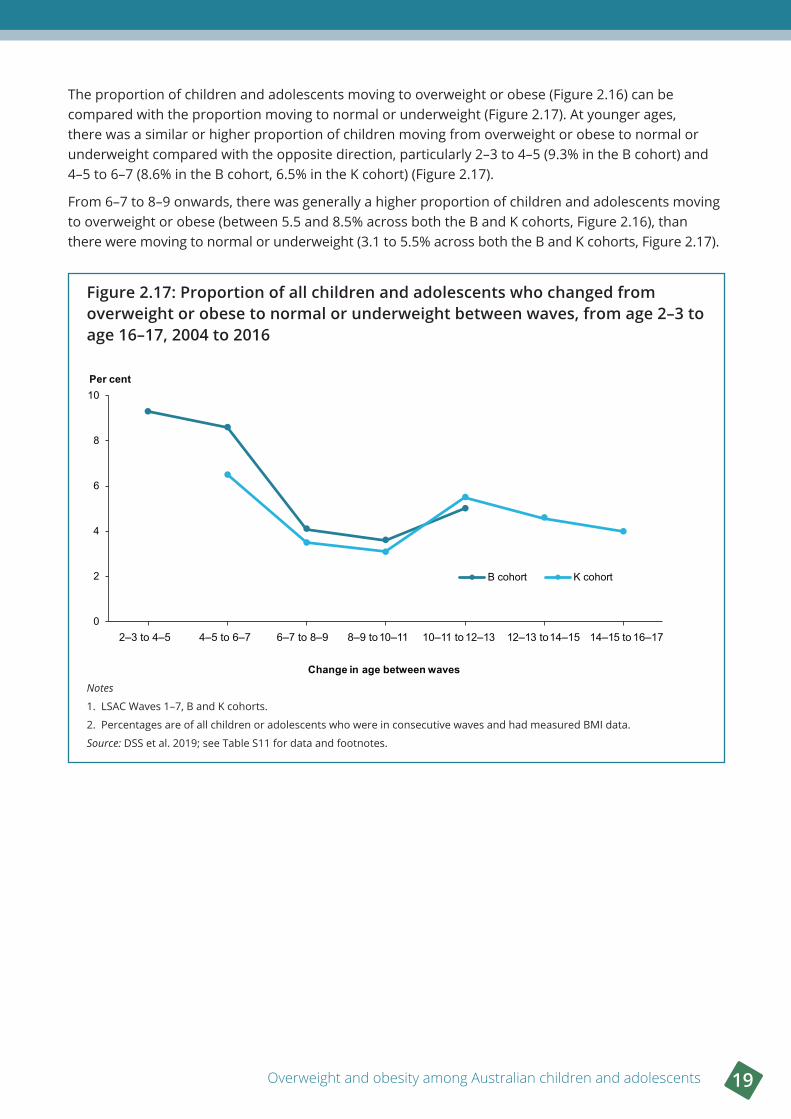
The proportion of children and adolescents moving to overweight or obese (Figure 2.16) can be compared with the proportion moving to normal or underweight (Figure 2.17). At younger ages, there was a similar or higher proportion of children moving from overweight or obese to normal or underweight compared with the opposite direction, particularly 2–3 to 4–5 (9.3% in the B cohort) and 4–5 to 6–7 (8.6% in the B cohort, 6.5% in the K cohort) (Figure 2.17).
From 6–7 to 8–9 onwards, there was generally a higher proportion of children and adolescents moving to overweight or obese (between 5.5 and 8.5% across both the B and K cohorts, Figure 2.16), than there were moving to normal or underweight (3.1 to 5.5% across both the B and K cohorts, Figure 2.17).
Figure 2 .17: Proportion of all children and adolescents who changed from overweight or obese to normal or underweight between waves, from age 2–3 to age 16–17, 2004 to 2016
Notes
1. LSAC Waves 1–7, B and K cohorts.
2. Percentages are of all children or adolescents who were in consecutive waves and had measured BMI data.
Source: DSS et al. 2019; see Table S11 for data and footnotes.
0
2
4
6
8
10Per cent
Change in age between waves
B cohort K cohort
2–3 to 4–5 4–5 to 6–7 6–7 to 8–9 8–9 to 10–11 10–11 to 12–13 12–13 to 14–15 14–15 to 16–17
20 Chapter 2 Who is affected and how has this changed over time?
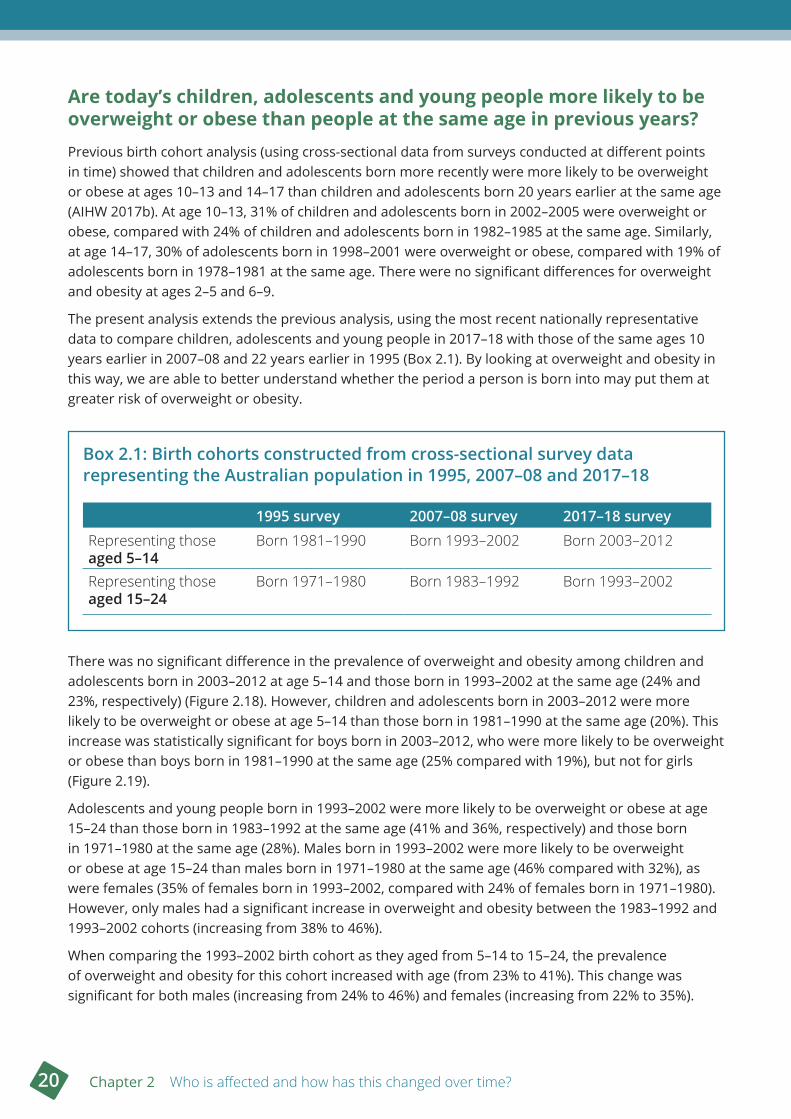
Are today’s children, adolescents and young people more likely to be overweight or obese than people at the same age in previous years? Previous birth cohort analysis (using cross-sectional data from surveys conducted at different points in time) showed that children and adolescents born more recently were more likely to be overweight or obese at ages 10–13 and 14–17 than children and adolescents born 20 years earlier at the same age (AIHW 2017b). At age 10–13, 31% of children and adolescents born in 2002–2005 were overweight or obese, compared with 24% of children and adolescents born in 1982–1985 at the same age. Similarly, at age 14–17, 30% of adolescents born in 1998–2001 were overweight or obese, compared with 19% of adolescents born in 1978–1981 at the same age. There were no significant differences for overweight and obesity at ages 2–5 and 6–9.
The present analysis extends the previous analysis, using the most recent nationally representative data to compare children, adolescents and young people in 2017–18 with those of the same ages 10 years earlier in 2007–08 and 22 years earlier in 1995 (Box 2.1). By looking at overweight and obesity in this way, we are able to better understand whether the period a person is born into may put them at greater risk of overweight or obesity.
Box 2 .1: Birth cohorts constructed from cross-sectional survey data representing the Australian population in 1995, 2007–08 and 2017–18
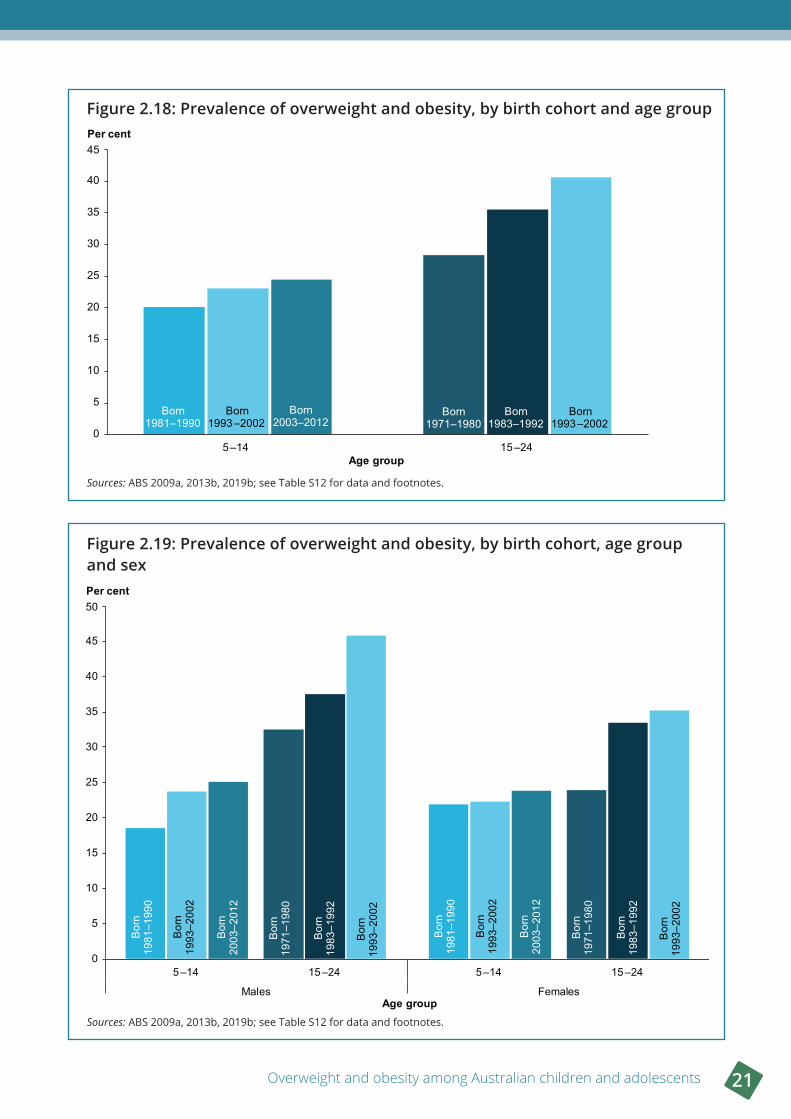
There was no significant difference in the prevalence of overweight and obesity among children and adolescents born in 2003–2012 at age 5–14 and those born in 1993–2002 at the same age (24% and 23%, respectively) (Figure 2.18). However, children and adolescents born in 2003–2012 were more likely to be overweight or obese at age 5–14 than those born in 1981–1990 at the same age (20%). This increase was statistically significant for boys born in 2003–2012, who were more likely to be overweight or obese than boys born in 1981–1990 at the same age (25% compared with 19%), but not for girls (Figure 2.19).
Adolescents and young people born in 1993–2002 were more likely to be overweight or obese at age 15–24 than those born in 1983–1992 at the same age (41% and 36%, respectively) and those born in 1971–1980 at the same age (28%). Males born in 1993–2002 were more likely to be overweight or obese at age 15–24 than males born in 1971–1980 at the same age (46% compared with 32%), as were females (35% of females born in 1993–2002, compared with 24% of females born in 1971–1980). However, only males had a significant increase in overweight and obesity between the 1983–1992 and 1993–2002 cohorts (increasing from 38% to 46%).
When comparing the 1993–2002 birth cohort as they aged from 5–14 to 15–24, the prevalence of overweight and obesity for this cohort increased with age (from 23% to 41%). This change was significant for both males (increasing from 24% to 46%) and females (increasing from 22% to 35%).
1995 survey 2007–08 survey 2017–18 survey
Representing those aged 5–14
Born 1981–1990 Born 1993–2002 Born 2003–2012
Representing those aged 15–24
Born 1971–1980 Born 1983–1992 Born 1993–2002
Overweight and obesity among Australian children and adolescents 21
Figure 2 .18: Prevalence of overweight and obesity, by birth cohort and age group
Sources: ABS 2009a, 2013b, 2019b; see Table S12 for data and footnotes.
Figure 2 .19: Prevalence of overweight and obesity, by birth cohort, age group and sex
Sources: ABS 2009a, 2013b, 2019b; see Table S12 for data and footnotes.
0
5
10
15
20
25
30
35
40
45
5–14 15–24
Per cent
Age group
Born1993–2002
Born1993–2002
Born2003–2012
Born1983–1992
Born1981–1990
Born1971–1980
0
5
10
15
20
25
30
35
40
45
50
5–14 15–24 5–14 15–24
Males Females
Per cent
Age group
Bor
n19
81–1
990
Bor
n19
93–2
002
Bor
n19
93–2
002
Bor
n20
03–2
012
Bor
n19
71–1
980
Bor
n19
83–1
992
Bor
n19
81–1
990
Bor
n19
93–2
002
Bor
n19
93–2
002
Bor
n20
03–2
012
Bor
n19
71–1
980
Bor
n19
83–1
992
22 Chapter 2 Who is affected and how has this changed over time?
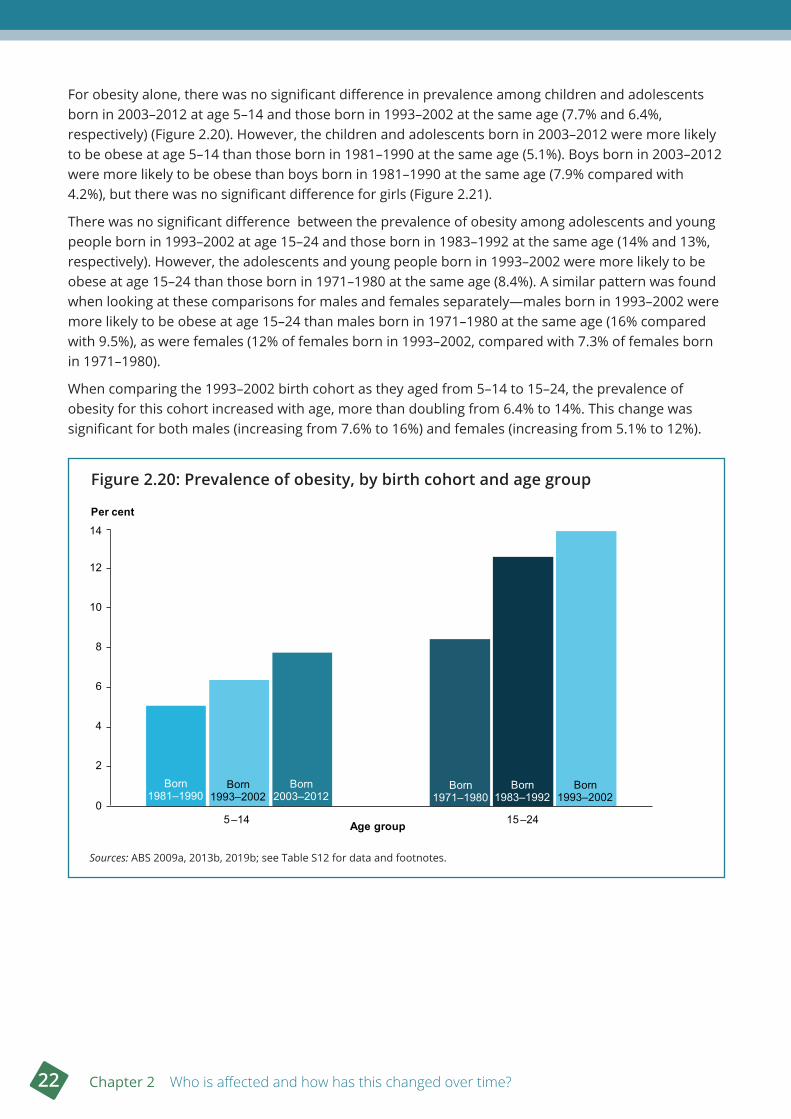
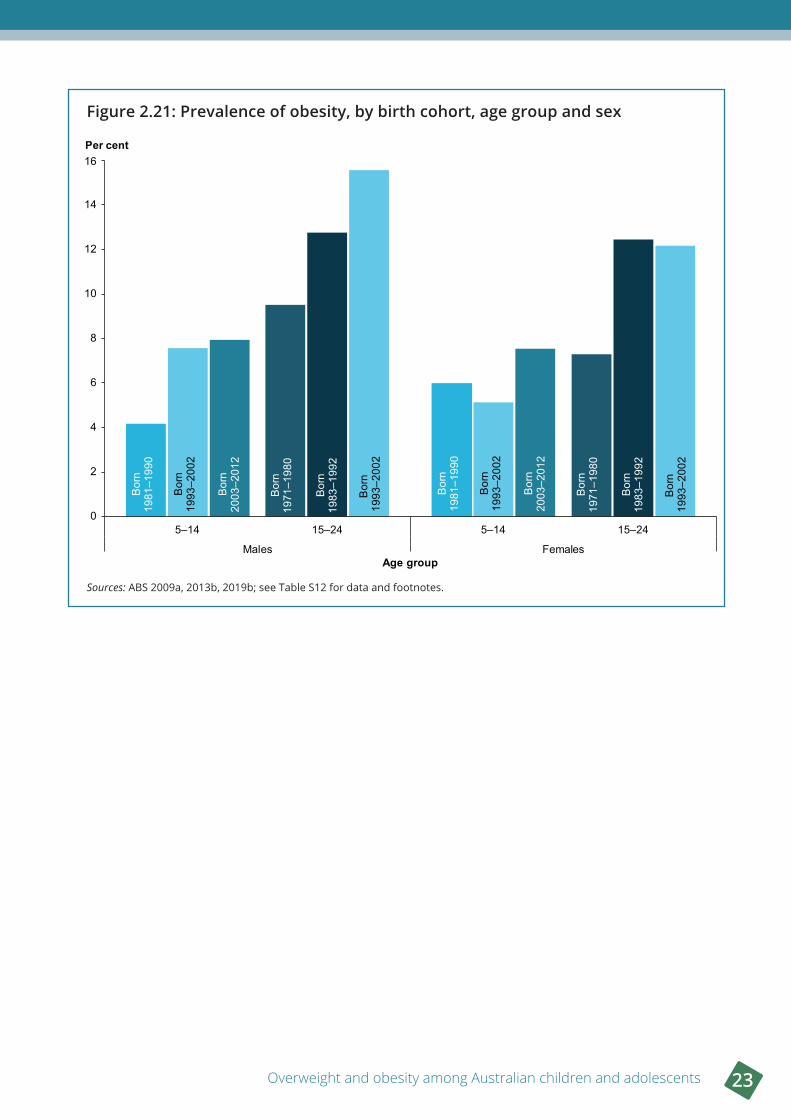
For obesity alone, there was no significant difference in prevalence among children and adolescents born in 2003–2012 at age 5–14 and those born in 1993–2002 at the same age (7.7% and 6.4%, respectively) (Figure 2.20). However, the children and adolescents born in 2003–2012 were more likely to be obese at age 5–14 than those born in 1981–1990 at the same age (5.1%). Boys born in 2003–2012 were more likely to be obese than boys born in 1981–1990 at the same age (7.9% compared with 4.2%), but there was no significant difference for girls (Figure 2.21).
There was no significant difference between the prevalence of obesity among adolescents and young people born in 1993–2002 at age 15–24 and those born in 1983–1992 at the same age (14% and 13%, respectively). However, the adolescents and young people born in 1993–2002 were more likely to be obese at age 15–24 than those born in 1971–1980 at the same age (8.4%). A similar pattern was found when looking at these comparisons for males and females separately—males born in 1993–2002 were more likely to be obese at age 15–24 than males born in 1971–1980 at the same age (16% compared with 9.5%), as were females (12% of females born in 1993–2002, compared with 7.3% of females born in 1971–1980).
When comparing the 1993–2002 birth cohort as they aged from 5–14 to 15–24, the prevalence of obesity for this cohort increased with age, more than doubling from 6.4% to 14%. This change was significant for both males (increasing from 7.6% to 16%) and females (increasing from 5.1% to 12%).
Figure 2 .20: Prevalence of obesity, by birth cohort and age group
Sources: ABS 2009a, 2013b, 2019b; see Table S12 for data and footnotes.
0
2
4
6
8
10
12
14
5–14 15–24
Per cent
Age group
Born1993–2002
Born1993–2002
Born2003–2012
Born1983–1992
Born1981–1990
Born1971–1980
Overweight and obesity among Australian children and adolescents 23
Figure 2 .21: Prevalence of obesity, by birth cohort, age group and sex
Sources: ABS 2009a, 2013b, 2019b; see Table S12 for data and footnotes.
0
2
4
6
8
10
12
14
16
5–14 15–24 5–14 15–24
Males Females
Per cent
Age group
Bor
n19
81–1
990
Bor
n19
93–2
002
Bor
n19
93–2
002
Bor
n20
03–2
012
Bor
n19
71–1
980
Bor
n19
83–1
992
Bor
n19
81–1
990
Bor
n19
93–2
002
Bor
n19
93–2
002
Bor
n20
03–2
012
Bor
n19
71–1
980
Bor
n19
83–1
992
24 Chapter 3 What are the causes of overweight and obesity in children and adolescents?
3 What are the causes of overweight and obesity in children and adolescents?
Key findings
• The development of overweight and obesity is primarily due to an energy imbalance, where too much energy is taken in through food and drink, and not enough energy is expended through physical activity. However, there are many other contributing factors, such as individual genetics, and a range of influences from families, communities and broader society.
• Diet and participation in physical activity generally worsen with age—adolescents eat more discretionary food, less fruit, and exercise less than younger children.
• One in 6 boys aged 14–17 consume sugar-sweetened drinks daily, more than double the proportion of teenage girls (1 in 14).
• Children and adolescents who do not get enough sleep are more likely to be overweight or obese.
• Children are exposed to junk food marketing almost 30 times per day and are highly susceptible to its messages.
Overweight and obesity is primarily caused by an energy imbalance, where the energy intake through eating and drinking exceeds the energy expended through physical activity over a sustained period (AIHW 2016). Even a small energy imbalance over time can lead to excess weight gain—for example, 200–300 kilojoules (equivalent to just 1 or 2 sweet biscuits) in excess of daily energy requirements can result in excessive weight gain in children if not offset by sufficient physical activity (Mitchell & Baur 2019; Plachta-Danielzik et al. 2008).
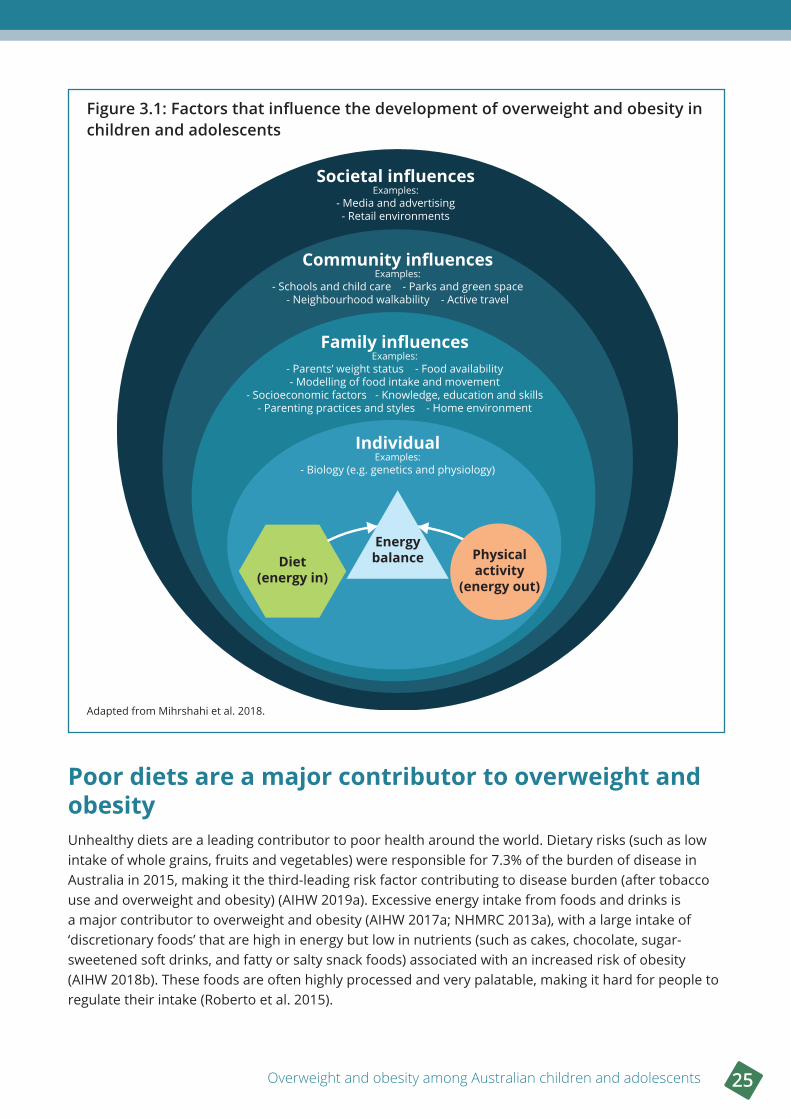
The imbalance between diet and physical activity is influenced by a complex interplay of factors, including individual, family, community and societal influences (Figure 3.1) (AIHW 2017a; Mihrshahi et al. 2018; NHMRC 2013b). At a population level, environmental and societal changes are likely to be the main contributor to increasing rates of overweight and obesity (Ebbeling et al. 2002; WHO 2000). These changes have created an ‘obesogenic environment’ that promotes obesity by influencing the amount and type of food eaten and physical activity undertaken (Egger & Swinburn 1997; Swinburn et al. 1999). This obesogenic environment includes homes, schools and broader environmental influences such as health systems and the food industry (Swinburn et al. 1999).
Overweight and obesity among Australian children and adolescents 25
Figure 3 .1: Factors that influence the development of overweight and obesity in children and adolescents
Adapted from Mihrshahi et al. 2018.
Poor diets are a major contributor to overweight and obesityUnhealthy diets are a leading contributor to poor health around the world. Dietary risks (such as low intake of whole grains, fruits and vegetables) were responsible for 7.3% of the burden of disease in Australia in 2015, making it the third-leading risk factor contributing to disease burden (after tobacco use and overweight and obesity) (AIHW 2019a). Excessive energy intake from foods and drinks is a major contributor to overweight and obesity (AIHW 2017a; NHMRC 2013a), with a large intake of ‘discretionary foods’ that are high in energy but low in nutrients (such as cakes, chocolate, sugar-sweetened soft drinks, and fatty or salty snack foods) associated with an increased risk of obesity (AIHW 2018b). These foods are often highly processed and very palatable, making it hard for people to regulate their intake (Roberto et al. 2015).
Societal influencesExamples:
- Media and advertising- Retail environments
Community influencesExamples:
- Schools and child care - Parks and green space- Neighbourhood walkability - Active travel
Family influencesExamples:
- Parents’ weight status - Food availability- Modelling of food intake and movement
- Socioeconomic factors - Knowledge, education and skills- Parenting practices and styles - Home environment
IndividualExamples:
- Biology (e.g. genetics and physiology)
Diet(energy in)
Energybalance Physical
activity(energy out)
26 Chapter 3 What are the causes of overweight and obesity in children and adolescents?
Do Australian children and adolescents meet the Australian Dietary Guidelines?The Australian Dietary Guidelines provide recommendations for healthy eating (NHMRC 2013a). They recommend consuming a varied diet from the 5 food groups (vegetables, fruit, grain foods, lean meats and alternatives, and dairy products and alternatives), and limiting the consumption of foods containing saturated fat, added sugars and added salt, and alcohol.
Most Australian children and adolescents do not meet the dietary guidelines, and this starts from an early age (AIHW 2018b). A high proportion of children and adolescents’ energy intake is from discretionary foods (such as cakes, sweet biscuits and potato chips), and this increases with age (from 30% of total energy intake for 2–3 year olds to 41% for 14–18 year olds) (AIHW 2018b). In 2017–18, only 1 in 16 (6.3%) children aged 2–17 met the recommended daily consumption of vegetables, and the proportion of children meeting the recommended daily fruit intake declined with age, from most 2–3 year olds (97%) to fewer than 3 in 5 (58%) 14–17 year olds (ABS 2018b).
There are no nationally representative Australian data on adherence to the Australian Dietary Guidelines in children aged under 2 years. However, a study of children in Melbourne whose families were participating in a lifestyle intervention found that the vast majority (91%) of children at 9 months of age were not meeting the dietary guidelines to limit or avoid consumption of discretionary foods (NHMRC 2012) (defined in this study as 0 serves) (Spence et al. 2018). This increased to 99% not meeting the guidelines at age 1.5 years. At 9 months, most children met the guidelines for fruit intake (98%) and vegetable intake (96%), but at age 1.5 years, this had dropped to 89% for fruit, and just 3% for vegetables (Spence et al. 2018).
Sugar-sweetened drinks are especially popular among teenage boysThe consumption of sugar-sweetened drinks (such as soft drinks, energy drinks and sports drinks) is associated with an increased risk of obesity (WHO 2016b), and the Australian Dietary Guidelines recommend limiting their intake. In 2017–18, more than 2 in 5 (41%) children aged 2–17 consumed sugar-sweetened drinks at least once a week, with consumption generally increasing with age and generally higher for boys. Adolescents aged 14–17 were the most likely to consume sugar-sweetened drinks daily—nearly 1 in 6 (16%) boys aged 14–17 were daily consumers, which was more than double the proportion of girls (1 in 14, or 7%) (ABS 2018b).
Physical inactivity and sedentary behaviour increase the risk of overweight and obesityPhysical activity is any body movement produced by skeletal muscles that uses energy (WHO 2018). It includes structured activities such as sport or organised recreation, and unstructured activities such as walking or cycling for leisure or transport (NHMRC 2013a). Being physically active is important across all ages, and contributes to healthy growth and development in children and adolescents (WHO 2018).
Insufficient physical activity is detrimental to health—in 2015, physical inactivity accounted for 2.5% of disease burden in Australia, and was causally linked to the burden from diseases such as type 2 diabetes, bowel cancer, dementia, coronary heart disease and stroke (AIHW 2019b). Being physically active reduces several risk factors to health, including overweight and obesity (AIHW 2019f). Low levels of physical activity and high levels of sedentary behaviours (that require little energy expenditure, such as sitting or lying down), contribute to overweight and obesity (NHMRC 2013b).
Overweight and obesity among Australian children and adolescents 27
Children often spend much of their waking day sitting (Salmon et al. 2011), with common sedentary activities for children and adolescents including screen-based activities (such as watching television, and using devices such as smart phones and computers for schoolwork or leisure), as well as sitting in cars and classrooms (Active Healthy Kids Australia 2018). Screen-based activities are strongly linked to obesity in both adults and young people, with higher overweight and obesity rates associated with high screen time (independent of physical activity) (Banks et al. 2011; Boone et al. 2007; Salmon et al. 2011). Fewer hours of screen time in adolescence have been shown to reduce the likelihood of obesity in adulthood (Boone et al. 2007).
Do children and adolescents meet the guidelines for physical activity and sedentary behaviour?The Australian 24-Hour Movement Guidelines provide recommendations for minimum levels of physical activity, maximum amounts of sedentary activities (including screen-based activities) and optimal sleep levels in a 24-hour period for children and young people for their healthy growth and development (Department of Health 2019a). The guidelines vary by age group, and are available at https://www1.health.gov.au/internet/main/publishing.nsf/Content/health-pubhlth-strateg-phys-act-guidelines.
The latest available Australian survey data from 2011–12 showed that the likelihood of children and adolescents meeting the physical activity guidelines decreased with age (AIHW 2018c):
• 61% of 2–5 year olds met the guideline of doing at least 180 minutes of physical activity per day
• 26% of 5–12 year olds met the guideline of doing at least 60 minutes of physical activity per day
• 7.9% of 13–17 year olds met the guideline of doing at least 60 minutes of physical activity per day.
This aligns with global research across 146 countries that found that the majority (81%) of school-going adolescents aged 11–17 were insufficiently active in 2016 (Guthold et al. 2019).
Most children and adolescents also did not meet the sedentary screen-based behaviour guidelines in 2011–12 (AIHW 2018c):
• 25% of 2–5 year olds met the guideline of no more than 60 minutes of sedentary screen time per day
• 35% of 5–12 year olds met the guideline of no more than 120 minutes of sedentary screen time per day
• 20% of 13–17 year olds met the guideline of no more than 120 minutes of sedentary screen time per day. A particularly low proportion of adolescent boys aged 13–17 (15%) met the guideline for sedentary screen-based activity (compared with 26% of girls of the same age).
Results from the national AusPlay Survey found that in 2017, 74% of children aged 0–14 participated in organised sports or physical activities outside of school hours at least once over the past 12 months, with 63% participating at least once a week (ASC 2018). Participation was highest in the 9–11 age group. Children were more likely to participate in organised physical activity outside school hours if they either were from a high-income family, had a parent who participated in sports or physical activity, or had 1 or 2 siblings. Of children who did not participate in organised physical activities, the most common barrier to participation for younger children aged 8 and under was parents considering them to be too young. For older children and adolescents aged 9–14, a range of barriers were reported, including the child not liking physical activity, not having enough time, and participation not being a priority (ASC 2018). For more information on the AusPlay Survey, see https://www.clearinghouseforsport.gov.au/research/smi/ausplay.
28 Chapter 3 What are the causes of overweight and obesity in children and adolescents?
Many other factors contribute to overweight and obesity
Individual factors
Genetics and biology play a role
Certain biological syndromes can contribute to overweight and obesity in some people (Anderson & Butcher 2006), and genetic factors also determine an individual’s predisposition to becoming obese (Black et al. 2018a; Ebbeling et al. 2002; Frayling et al. 2007). Epigenetic factors (alterations in gene expression that can be caused by a range of factors, such as intrauterine growth restriction, and passed between generations) are also likely to play a role (NHMRC 2013b). Genetic and epigenetic factors are thought to predispose some people to obesity by affecting the way the body regulates energy balance (NHMRC 2013b). Robust data on the contribution of genetic and epigenetic factors to overweight and obesity in Australia are limited (AIHW 2018a).
Poor sleep is linked to childhood obesity
Poor sleep patterns are associated with an increased risk of childhood obesity (WHO 2016b). For example, short sleep duration in children has been linked to a 45% increased risk of developing childhood obesity (Li et al. 2017), and sleeping for 8 hours or less on a usual school night was associated with higher odds of being overweight or obese in Australian adolescents aged 12–17, after adjusting for demographic characteristics and health behaviours (Morley et al. 2012).
There is also evidence of a longer-term impact of childhood sleeping problems on the development of obesity later in life, with a longitudinal study finding that childhood sleeplessness and irregular sleeping patterns at ages 2–4 were associated with higher BMI and higher prevalence of obesity at age 21 (Al Mamun et al. 2007). While the relationship between insufficient sleep and obesity is not fully understood, possible factors include hormonal changes affecting appetite and the type of food eaten, tiredness leading to less physical activity during the day, and more opportunities for food intake while awake (Al Mamun et al. 2007; Li et al. 2017).
Family influences
Parents’ weight can influence a child’s likelihood of developing obesity
The children of parents with obesity are at a higher risk of becoming obese themselves, which is thought to be due to both inherited genes, as well as the shared family environment in which infants and toddlers model their parents’ and families’ eating and physical activity behaviours (Haire-Joshu & Tabak 2016; NHMRC 2013b). The risk of obesity is greater when both parents (rather than one) are overweight or obese (NHMRC 2013a).
Some studies have found childhood obesity to be more strongly associated with maternal weight than paternal weight (e.g. Whitaker et al. 2010). Many studies focus on maternal factors contributing to childhood obesity (Haire-Joshu & Tabak 2016; Woo Baidal et al. 2016), and the influence of maternal health during pregnancy on the child’s health is widely accepted (McPherson et al. 2014). However, there is emerging evidence that the weight of both parents at the time of conception may play a role, with paternal obesity at conception having a potential epigenetic influence on the child’s risk of obesity later in life (Haire-Joshu & Tabak 2016; McPherson et al. 2014; WHO 2016b). Almost half (46%) of mothers who gave birth in 2017 were classified as overweight or obese at their first antenatal visit, with one-fifth (20%) obese and one-quarter (26%) overweight but not obese (AIHW 2019c).
Overweight and obesity among Australian children and adolescents 29
A child’s earliest experiences can have long-term effects on their weight
The ‘first 1,000 days’ of a child’s life (considered to be the period from conception to age 2) is a critical period for the development of childhood obesity (Woo Baidal et al. 2016). In addition to a mother’s weight, other factors in this period that are associated with an increased risk of childhood obesity include maternal diabetes (pre-existing or gestational), prenatal tobacco exposure, high or low infant birth weight, and rapid infant weight gain (Mameli et al. 2016; NHMRC 2013b; WHO 2016b; Woo Baidal et al. 2016; Zheng et al. 2018).
Breastfeeding (compared to formula-feeding) is associated with a reduced risk of becoming obese in childhood, adolescence and early adulthood (NHMRC 2013a), although studies investigating the possible protective role of breastfeeding in preventing obesity have shown inconsistent results (Woo Baidal et al. 2016). Any protective role may to be due to different child growth rates, with breastfed infants generally showing a slower growth curve compared to formula-fed infants (Mameli et al. 2016). Australia’s infant feeding guidelines recommend exclusive breastfeeding of infants to around 6 months of age when appropriate solid foods are introduced, and continued breastfeeding until 12 months of age and beyond, for as long as the mother and infant desire (NHMRC 2012).
BMI normally falls after the age of about 1 until about 5–7 years of age, at which point BMI begins to increase (Lobstein et al. 2004; NHMRC 2013b). This rise (known as the ‘adiposity rebound’) is a normal part of a child’s growth, but an earlier and rapid rebound has been linked to the development of obesity later in life (Ebbeling et al. 2002; Lobstein et al. 2004; NHMRC 2013b).
Family food preferences and eating behaviours can influence children becoming overweight or obese
Australians are spending more hours at work, leaving less time for meal preparation (AIHW 2017a). Families often eat out of home more and at home rely more on pre-prepared convenience food that can be prepared quickly and easily (AIHW 2017a; Mitchell & Baur 2019). These foods are often energy-dense, nutrient-poor and are widely available and inexpensive (Roberto et al. 2015). The increased consumption of energy-dense convenience foods has been linked to increases in childhood obesity (Anderson & Butcher 2006). Portion sizes have also become larger, with the energy per typical portion of many common discretionary foods (such as pizza, cake and ice cream) higher in 2011–12 compared with 1995 (Zheng et al. 2017). Larger portion sizes promote overeating (Roberto et al. 2015), increase daily energy intake, and increase the likelihood of obesity (Zheng et al. 2017).
The food available in the home can influence children becoming overweight or obese. For example, a New South Wales study of primary and secondary school children found that the prevalence of eating meals or snacks from fast-food outlets at home at least once a week was higher among children in the obese BMI category (28%), compared with children in the healthy weight BMI category (19%) (Hardy et al. 2016). Other factors associated with overweight and obesity included usually having soft drinks available in the home, unrestricted snacking, eating dinner in front of the TV 5 or more times per week, and not eating breakfast (Hardy et al. 2016).
Studies conducted in Western Australia also found that a higher density of healthy food outlets around the homes of study children was associated with a reduced risk of being overweight or obese (Miller et al. 2014).
One way children learn is through observing and copying (or ‘modelling’) the behaviours, attitudes and preferences of others. Both healthy behaviours such as fruit and vegetable intake and physical activity participation, as well as unhealthy behaviours such as screen time are modelled (Christian et al. 2013; Lee et al. 2018; Zecevic et al. 2010). This incorporates parenting styles and practices, as well as
30 Chapter 3 What are the causes of overweight and obesity in children and adolescents?
the accessibility and availability of healthy food and physical activities, which can influence children’s weight, unhealthy food intake and screen time (Berge et al. 2015; Haycraft et al. 2017; Reicks et al. 2015; Wake et al. 2007; Yu & Baxter 2016).
Sedentary behaviour at home is associated with overweight and obesity
Technological changes have meant that we are less physically active in our daily lives than in the past, where physical activity was part of life rather than something we set out to do (Anderson & Butcher 2006). Research has shown associations with sedentary and screen time activities and obesity (Morley et al. 2012; Niven et al. 2014).
A study of New South Wales primary and secondary school children found that, in 2015, 22% of children and adolescents had a television in the bedroom and that children in the overweight but not obese, and obese BMI categories were more likely to have a television in the bedroom (26% and 31%, respectively), compared with children and adolescents in the normal weight category (21%) (Hardy et al. 2016).
Family influences on childhood overweight and obesity are explored in greater detail in the report Childhood overweight and obesity—the impact of the home environment (AIHW forthcoming 2021).
Community influences
The types of food available in and near schools influence students’ food choices
Schools have a substantial influence on students’ dietary intake, with children and adolescents consuming up to 2 meals and snacks per day at school, 5 days a week (Espinel & King 2009). The food sold in school canteens, cafeterias and vending machines affects the food choices students can make at school.
The 2010 National Healthy School Canteens Guidelines aim to increase the availability of healthy food and limit less healthy options available in Australian school canteens. Implementation of these guidelines is at the discretion of state and territory governments, with some implementing the guidelines in full, and others incorporating some components into their own systems (Department of Health 2013). Recent studies have found that, while there appears to be a general acceptance of the guidelines, few schools are compliant with the system and there is currently no regular monitoring system to enforce the state and territory guidelines (Woods et al. 2014). In a study of 263 school menus, schools in Western Australia were the most compliant with their own state and territory guidelines, with 62% of menus adhering to the guidelines. Compliance in other states and territories to local guidelines ranged from 5% to 35%. Another study of 200 school canteen menus found that a majority of unhealthy items sold in canteens were priced lower than healthy items (Billich et al. 2018).
The food that is available in close proximity to schools is also an important component of the food environment for children and adolescents. Several international and Australian studies have found that a high density of fast-food outlets and convenience stores within walking distance of schools influences the purchasing and consumption patterns of children and adolescents (Day & Pearce 2011; Forsyth et al. 2012; He et al. 2012; Nixon & Doud 2011). Additional studies have also found that the density of fast-food outlets is higher around disadvantaged schools, with the risk of exposure to fast food being up to 9.5 times higher for students attending these schools than for students attending more advantaged schools in some parts of Australia (Coffee et al. 2016).
Overweight and obesity among Australian children and adolescents 31
There may be barriers to participating in physical activity at school
There are limited national data on the amount of physical activity children undertake at school (Active Healthy Kids Australia 2018). In a New South Wales schools study, up to 17% of urban primary schools did not deliver physical education (PE) lessons, with the main barrier to promoting physical activity reported as competing demands on curriculum time. All secondary schools in the study delivered PE lessons, but around 27% of urban schools and 25% of rural schools reported that their PE facilities were poor or fair and in need of improvement (Hardy et al. 2016).
Providing ‘playground markings’ to indicate activity zones (such as an area for sporting activities), in conjunction with providing physical structures (such as soccer goal posts and basketball hoops) has been shown to increase the physical activity levels of schoolchildren (aged 5–12) during recess in the short to medium term (Escalante et al. 2013).
While there are national guidelines in the Australian Curriculum (ACARA 2019) about how physical activity can be used for learning, and what types of movement children of each age should be undertaking, there is no rule or recommendation regarding the frequency or duration of school-based physical activity.
The food available in child care centres does not always meet dietary guidelines
Child care environments can impact the dietary behaviours and physical activity of children who attend them. In 2017, it was estimated that over a quarter (27%) of children aged 0–12 years attended some form of formal child care in Australia (which includes regulated before- and after-school care, long day care and family day care) (ABS 2018a).
Formal child care centres are advised to follow menu-planning guidelines based on the Australian Dietary Guidelines and other guidelines (Healthy Eating Advisory Service 2016). A study of 90 formal child care centres in New South Wales found that none of them provided food in line with the guidelines for all food groups. In particular, no service met the recommendations for vegetables, although compliance with fruit and dairy guidelines was higher (Yoong et al. 2014).
Studies conducted in New Zealand, where nutrition policies for child care centres are similar to Australia, have indicated that most participating formal child care centres did not meet nutrition guidelines for quantity, variety, and limiting certain foods (such as those low in nutrients and high in salt, sugar and/or saturated fat) (Gerritsen et al. 2017).
Neighbourhood walkability and green space may have positive effects
Australian and international research indicates that greener neighbourhoods can be beneficial to children’s weight status, especially for boys (Davand et al. 2014; Lachowycz & Jones 2011; Sanders et al. 2015b). A study tracking children between the ages of 6 and 13 found the benefits of green space (such as parks and gardens) on weight status emerged as children grew older, and that there was little additional benefit after a small amount of extra green space was available (Sanders et al. 2015b). Neighbourhood walkability (a measure of how well the design of a neighbourhood promotes active forms of travel) has also been found to have a positive impact on children’s weight status (Casey et al. 2014).
Evidence to support interactions between green space access and neighbourhood walkability and child BMI measures is inconsistent, and further research is required (Casey et al. 2014).
32 Chapter 3 What are the causes of overweight and obesity in children and adolescents?
Active travel is beneficial, but safety concerns may be a barrier
There is evidence of a relationship between active travel to school (such as walking and cycling) and reduced overweight and obesity in children and adolescents (Lubans et al. 2011; Østergaard et al. 2012). Self-reported data from national studies suggest that about 44% of Australian secondary school students usually actively travel to and from school. However, estimates of the proportion of primary school children using active travel varied substantially across states, from 19% to 53% (Active Healthy Kids Australia 2018).
In a study of New South Wales primary and secondary school students, active travel was the least common mode of travel to school (15% of respondents), and also from school (17%) (Hardy et al. 2016).
International research indicates that the greatest barrier to children actively travelling to and from school is parental concerns about traffic safety (DeWeese et al. 2013; Henne et al. 2014). Perceived traffic safety and aspects of the built environment (such as footpaths and zebra crossings) may increase children’s levels of activity, such as outdoor play (Aarts et al. 2012).
Societal influences
Food marketing is often targeted at children and adolescents
Children and adolescents are highly susceptible to the influence of the marketing of unhealthy food and beverages (WHO 2016b), with marketing shown to influence children’s food preferences, purchase requests and consumption patterns (WHO 2010). Marketing and exposure to unhealthy products helps shape children’s taste expectations and preferences from a young age (Roberto et al. 2015), and are linked to childhood obesity (WHO 2000).
Before the age of 7 or 8, children tend to regard advertising as entertaining, unbiased information and, while there are regulations in Australia relating to advertising junk food to children (MacKay et al. 2011; Parliament of Australia 2008), the average Australian child aged 5–8 years is estimated to be exposed to over 800 unhealthy food advertisements every year (Smithers et al. 2018; Waters et al. 2010). There is strong evidence to support the effect of these advertisements on food purchases (Cancer Council 2014; Scully et al. 2012).
Results from analysis of national data collected from secondary schools indicate that greater exposure to marketing on commercial television, print media, digital media and public transport were all independently associated with students’ food choices, and those who viewed more than 2 hours of commercial television per day were more likely to report higher consumption of energy-dense and nutrient-poor foods (Scully et al. 2012).
Childhood obesity researchers have highlighted marketing strategies that are targeted at children, such as the use of cartoon characters to promote junk food, the association between junk foods and organised sports, and integrated marketing and promotion of junk foods in supermarkets. According to recent evidence:
• Children aged 4–6 years believe a product tastes better if it has a cartoon character on the pack (Roberto et al. 2010)—additional research found that half (52%) of packaged foods with cartoons or character promotions aimed at children were unhealthy (OPC 2017).
• Children aged 10–14 years think food and drink sponsors of their local sports clubs are ‘cool’ and like to return the favour by buying their products (Kelly et al. 2011).
Overweight and obesity among Australian children and adolescents 33
• Excluding supermarkets and convenience stores, children are exposed to junk food marketing messages almost 30 times per day at home, schools, food venues, recreation venues and other public spaces (Signal et al. 2017).
• The majority (84%) of food and beverage advertisements in Sydney metropolitan train stations are for unhealthy products (Sainsbury et al. 2017). In addition, a study in the Greater Sydney area estimated that 75% of the food and beverage advertisements children are exposed to on train, bus and walking routes to school are for discretionary items (Richmond et al. 2020).
• Unhealthy foods are usually situated in reach and sight of children and promoted in a way that encourages children to pressure their parents to purchase these items (referred to as ‘pester power’). Promotions such as competitions and movie tie-ins (such as promotional foods and toys) are also commonly featured in supermarkets, grocery stores and milk bars to encourage pester power for foods located in-store (MacKay et al. 2011).
New media platforms, such as YouTube, apps and ‘advergames’ (online or digital games that are sponsored or created by private companies to promote their products) are also of concern. Research conducted both internationally and in Australia has suggested that about 70% of children and adolescents are exposed to food marketing on apps (Kent et al. 2019), and that playing food-based advergames has a similar impact on children’s food intake as food advertisements on television (OPC 2018). Further, food and beverage advertising is the most common advertisement type shown on YouTube content popular with children (Tan et al. 2018).
Research has also shown that, due to the nature of content presented on these new media platforms, children may find it more difficult to discern when they are being advertised to, particularly when advertising messaging is folded into content created by vloggers or similar content creators (OPC 2018). Additionally, there is very limited government regulation around children’s exposure to fast-food marketing on digital platforms, and controls on advertising to children are largely monitored by industry self-regulation (OPC 2018). Given that children’s interactions with these platforms may have more than doubled in recent years (OPC 2018), this is an emerging area where further research on the impact on childhood obesity is required. The impact on children’s consumption patterns, due to social media platforms’ use of algorithms for the personalisation of advertising, also warrants investigation.
34 Chapter 4 What are the impacts of overweight and obesity in children and adolescents?
Key findings
• Overweight and obesity in childhood and adolescence is associated with poorer short- and long-term physical health.
• Overweight and obesity can have a negative effect on psychological health, wellbeing and quality of life, particularly through victimisation and bullying.
• Obesity is associated with poorer academic performance.
• Overweight and obesity cost the Australian economy an estimated $11.8 billion in 2017–18.
Overweight and obesity contributes to a range of poorer health and wellbeing outcomes in children and adolescents, with higher levels of overweight and obesity associated with worse outcomes (WHO 2000).
Overweight and obesity contributes to poorer physical healthShort-term physical health problems associated with childhood and adolescent obesity include dyslipidemia (abnormal levels of fats in the blood), hypertension, non-alcoholic fatty liver disease, polycystic ovarian syndrome, obstructive sleep apnoea, and type 2 diabetes (Kelsey et al. 2014). Children who have obesity are also at increased risk of gastrointestinal, musculoskeletal and orthopaedic complications (WHO 2016b), impaired glucose tolerance, insulin resistance, asthma, gallstone, and heartburn (CDC 2016). Australian burden of disease analysis found that in 2015, overweight and obesity was causally linked to asthma from the age of 5 and over, and to 14 types of cancer from age 15 and over (AIHW 2019a).
Because childhood obesity is a strong predictor of obesity in adulthood (WHO 2016b), a serious potential long-term consequence of childhood obesity is its persistence into adulthood and the health risks that accompany adult obesity (WHO 2000). In 2015, 8.4% of the total burden of disease in Australia was due to overweight and obesity, second only to tobacco use (9.3%) as a risk factor contributing to disease burden (AIHW 2019a). Overweight and obesity was also the leading risk factor contributing to living with ill health (non-fatal burden) in 2015 (AIHW 2019a).
The adverse health impacts of overweight and obesity in adulthood include an increased risk of cardiovascular disease, type 2 diabetes, non-alcoholic fatty liver disease, asthma, obstructive sleep apnoea, polycystic ovarian syndrome, infertility, orthopaedic complications, psychiatric disease, and cancer (Kelsey et al. 2014). Other chronic conditions linked to being overweight or obese include chronic kidney disease, dementia, gallbladder disease, gout, and back pain and problems (AIHW 2019d).
4 What are the impacts of overweight and obesity in children and adolescents?
Overweight and obesity among Australian children and adolescents 35
Overweight and obesity is also associated with an increased risk of premature death (WHO 2000). A meta-analysis of data from almost 4 million adults across 4 continents found that overweight and obesity was associated with a higher death rate from all causes, as well as death due to coronary heart disease, stroke, respiratory conditions, and cancer (The Global BMI Mortality Collaboration 2016). An increased duration of obesity has been shown to be associated with an increased risk of mortality, suggesting that the earlier onset of obesity in childhood and adolescence and greater number of years living with obesity will increase the risk of mortality in adult populations (Abdullah et al. 2011).
Because of the strong correlation between BMI in childhood and BMI in adulthood, it can be difficult to determine the effects of childhood obesity on adult health outcomes, independent of adult BMI (Kelsey et al. 2014). Longitudinal studies have found mixed results as to whether childhood BMI influences adult health outcomes, independent of adult BMI (Kelsey et al. 2014). When studies adjust for adult BMI in their analyses, some find a reduced association between obesity in childhood and adolescence and adverse adult health outcomes (Park et al. 2012; Reilly & Kelly 2011). There is also evidence that people who were overweight or obese in childhood but have a healthy BMI in adulthood have a similar risk of cardiovascular disease as adults who had never been overweight or obese (Juonala et al. 2011). This highlights the importance of preventing and treating overweight and obesity in childhood and adolescence before it persists into adulthood.
Psychological health and wellbeing are negatively affected
Children and adolescents may be subject to weight stigma, discrimination and bullying Overweight and obesity is generally perceived as undesirable in industrialised countries like Australia, and is often associated with negative stereotypes such as laziness and a lack of discipline (Pont et al. 2017; WHO 2000). This stereotyping and devaluation of an individual because of their overweight or obesity (or ‘weight stigma’) is common, with even preschool-aged children attributing negative characteristics to people with larger body sizes (Pont et al. 2017).
Weight stigma in children and adolescents is commonly experienced as victimisation, teasing and bullying from school peers, with the likelihood of being victimised by peers increasing as BMI increases (Pont et al. 2017). Across 32 Organisation for Economic Co-operation and Development (OECD) member countries, a stronger relationship between obesity and bullying has been found for girls, with girls with obesity 3.1 times more likely to be bullied than girls of a healthy weight, compared to 1.8 times in boys (OECD 2019).
Family members, teachers, the media, and health-care professionals may also be a source of weight stigma (Pont et al. 2017). Weight stigma in a health-care setting can reduce the quality of care provided (Dietz et al. 2015; Pont et al. 2017; World Cancer Research Fund/American Institute for Cancer Research 2018), and lead to a reluctance in overweight and obese individuals to seek preventative health care (Pont et al. 2017). In adults, weight discrimination is associated not only with psychological distress and poorer health outcomes, but with a reduction in life expectancy (after controlling for behavioural and clinical risk factors) (Sutin et al. 2015).
36 Chapter 4 What are the impacts of overweight and obesity in children and adolescents?
Quality of life and mental health can be negatively impacted by overweight and obesityThe effect of overweight and obesity on a child or adolescent’s health and wellbeing is often assessed through questionnaires (completed by the child and/or a parent) that assess their subjective health-related quality of life (HRQoL), along dimensions such as physical, emotional, social, and school functioning (Buttitta et al. 2014). Research has generally found that overweight and obesity in children and adolescents is associated with lower overall HRQoL compared with children of a normal weight (Buttitta et al. 2014; Russell-Mayhew et al. 2012; Sanders et al. 2015a), particularly for the physical and social dimensions (Buttitta et al. 2014; Jansen et al. 2013; Tsiros et al. 2009).
The negative impact on HRQoL increases with the degree of obesity (Buttitta et al. 2014), with children and adolescents with severe obesity aged 5–18 in a clinical setting found to have similar HRQoL to children and adolescents diagnosed as having cancer (a chronic health condition known to be associated with impaired HRQoL) (Schwimmer et al. 2003). Longitudinal research suggests that the association between overweight and obesity and poorer HRQoL emerges at about 6–7 years of age, that the association strengthens with age, and that poorer HRQoL is mostly a result of higher BMI (rather than a cause) (Jansen et al. 2013).
As well as HRQoL, overweight and obesity in children and adolescents is associated with depression, emotional and behavioural problems, and lower self-esteem (Sanders et al. 2015a). For example, longitudinal analyses of Australian data found that obesity was associated with increased emotional problems among 4–13 year old boys and girls, and with increased peer problems in boys. These problems were most strongly related to internalising behaviours such as sadness, fearfulness, social withdrawal and poor interaction with peers (Black & Kassenboehmer 2017).
Contemporary modern cultures often idealise thin or even ‘ultra-thin’ bodies, especially for women, which can contribute to body dissatisfaction and unhealthy eating behaviours (O’Connor et al. 2018). The 2019 Mission Australia Youth Survey showed that, while 3 in 10 of all young people aged 15–19 were extremely or very concerned about body image, the proportion of females who were extremely or very concerned was almost 3 times as high as for males (43% and 14%, respectively) (Carlisle et al. 2019). Traits associated with eating disorders (such as binge eating) have been found to be more prevalent in adolescents with obesity, particularly girls (Russell-Mayhew et al. 2012). Weight-based teasing has also been found to be associated with unhealthy eating practices in adolescent boys and girls, which may contribute to increased body weight (Pont et al. 2017).
Victimisation based on weight stigma appears to play a strong role in the adverse impact on mental health and wellbeing. Even after accounting for BMI and other factors (such as age and sex), weight-based teasing and bullying has been associated with increased vulnerability to depression, anxiety, substance use, low self-esteem and poor body image (Pont et al. 2017). This suggests that being discriminated against (rather than just higher body weight) contributes to these poorer outcomes (Pont et al. 2017). Similarly, a meta-analysis of studies of 10–19 year olds with overweight and obesity found that participating in weight management interventions led to increased HRQoL. However, weight loss was not significantly associated with improved HRQoL—rather, improved HRQoL appeared to be related to interventions focusing on improving psychological wellbeing (such as building self-esteem and body image), and parental and peer support (Murray et al. 2018). This suggests that negative social impacts of overweight and obesity (such as bullying and social isolation) may contribute to reduced HRQoL more than weight status itself (Murray et al. 2018).
Overweight and obesity among Australian children and adolescents 37
Obesity is linked to poorer educational outcomes Children with obesity tend to perform worse academically compared with children of a normal weight, with a negative relationship found between obesity and cognitive skills (Black et al. 2015). There are several factors that may underlie this pattern, such as ill health caused by obesity having an impact on school attendance and performance, and weight-based teasing and bullying leading to psychosocial problems and poor self-esteem, in turn impacting learning and cognition (Black & Kassenboehmer 2017; Pont et al. 2017). Poor nutrition and a lack of physical activity may also play a role, for example by impacting concentration at school (OECD 2019). Across 32 OECD countries, children aged 11–15 of a healthy weight were on average 13% more likely to report good school performance than children with obesity (after adjusting for mediating and confounding factors such as family affluence, life satisfaction and bullying) (OECD 2019).
As well as an association between obesity and poorer academic performance, a possible causal relationship was found in an OECD longitudinal analysis, with obesity at a young age appearing to affect later educational attainment in some OECD countries (OECD 2019). Australian longitudinal research also found that, after controlling for factors such as sociodemographic characteristics and past cognitive achievement, obesity was associated with lower maths and literacy test scores for boys (but not girls), measured by NAPLAN scores in children aged 8–13 in grades 3, 5 and 7 (Black et al. 2015).
There are substantial economic impacts of overweight and obesityPoor health associated with overweight and obesity places a large cost burden on the health-care system, individuals, families and carers through both direct and indirect costs. Direct costs include higher health-care costs and higher demand on health-care services, while indirect costs include productivity losses, carer costs, government payments for people living with an illness, injury or disability and forgone taxation revenue (AIHW 2019d).
The estimated cost of adult obesity to the Australian economy in 2011–12 was $8.6 billion (in 2014–15 dollars). This included $3.8 billion in direct costs (for example, $1.2 billion on hospital care and $1.4 billion on pharmaceuticals), and $4.8 billion in indirect costs (including $3.4 billion on foregone tax) (PwC Australia 2015). It was estimated that, if no further action is taken to slow the rise in obesity, there will be $87.7 billion in additional direct and indirect costs due to obesity between 2015–16 and 2024–25. These estimates did not include the costs of childhood obesity, due to limited available evidence to estimate costs (PwC Australia 2015). Based on increases in the consumer price index (CPI) since 2011–12, it was estimated that in 2017–18, direct costs rose to $5.4 billion and indirect costs to $6.4 billion (The Obesity Collective 2019). However, projecting future obesity costs likely underestimates the actual costs, as health inflation is generally higher than general inflation (CPI) (AIHW 2019e).
OECD analysis estimates that from 2020 to 2050, OECD countries will spend on average 8.4% of their total annual health budgets on treating diseases caused by overweight and obesity (primarily diabetes, cardiovascular diseases, dementia and cancer). In addition, gross domestic product is predicted to be on average 3.3% lower each year due to the impacts of overweight and obesity on life expectancy, health expenditure and labour market output (OECD 2019).
There is a relationship between childhood overweight and obesity and higher health-care costs in the short term. For example, being overweight or obese at age 4–5 was associated with higher medical and pharmaceutical costs for Australian children in their first 5 years at school (Au 2012), and excess
38 Chapter 4 What are the impacts of overweight and obesity in children and adolescents?
health-care costs (under the Medicare Benefits Schedule and Pharmaceutical Benefits Scheme) associated with overweight and obesity have been shown to accrue from 4–5 years of age (Clifford et al. 2015).
In another study of children aged 6–13, the annual (non-hospital) Medicare cost for each child who was overweight was $63 (28%) higher, and for children who were obese, was $103 (45%) higher than for children with a BMI in the normal range. This was mainly due to a higher number of general practitioner and specialist visits. This was estimated to represent an additional annual cost of $43.2 million (in 2015 Australian dollars) to the Australian government in Medicare costs due to childhood overweight and obesity (Black et al. 2018a).
A study of 2–5 year old Australian pre-schoolers in a low-socioeconomic region of Sydney who had participated in a health intervention program found that health-care costs of children with obesity were 1.62 times those of children with a normal weight (Hayes et al. 2016). This was mostly due to higher odds of children with obesity being hospitalised compared to children with a normal weight. No significant differences were found when comparing children who were overweight with those with a normal weight.
Longer-term economic impacts of obesity have also been found. For example, longitudinal evidence from Britain found economic penalties in adulthood associated with obesity in adolescence (for women, but not men), with a relationship found between obesity at age 16 and lower household income in adulthood, compared to women who were a normal weight at age 16 (Black et al. 2018b).
Overweight and obesity among Australian children and adolescents 39
Key findings
• A comprehensive approach is required to prevent and reduce overweight and obesity in children and adolescents. This includes support from health-care professionals, and lifestyle interventions that target energy intake, physical activity and behavioural change.
• These approaches are most effective when accompanied by national policies such as laws and regulations, tax and price interventions, community-based interventions, and health promotion campaigns.
• There are global strategies for reducing overweight and obesity—for example, the World Health Organization’s Report of the Commission on Ending Childhood Obesity recommends actions for preventing and reducing childhood and adolescent obesity worldwide, focusing on the obesogenic environment and critical elements of the lifecourse.
• Australia implements a broad range of preventive health initiatives that aim to reduce overweight and obesity, and a national obesity strategy is currently being developed.
The prevalence of overweight and obesity in children and adolescents has plateaued in some high-income countries like Australia, which may be due to public health initiatives and increased awareness of the risk factors (NCD Risk Factor Collaboration 2017b; Wabitsch et al. 2014). However, since prevalence remains high by historic standards, a comprehensive and multifaceted approach is needed to reduce the prevalence of overweight and obesity (AIHW 2017a).
What can be done to help individuals?Health professionals can assist children, adolescents and families to maintain a healthy weight by advising on early feeding and children’s diets, encouraging physical activity, and recommending limits to sedentary time (Mihrshahi et al. 2018). The purpose of primary prevention is to prevent the development of overweight and obesity. Secondary prevention focuses on early detection and preventing progression, while tertiary prevention aims to manage and reduce the consequences of established overweight and obesity (Tasmanian Department of Health 2013; WHO 2004). For children and adolescents who are already affected by overweight and obesity, lifestyle interventions (including reduced energy intake and sedentary behaviour, increased physical activity, and measures to support behavioural change) are recommended, and should involve parents, carers and families as well as include support from health-care professionals (NHMRC 2013b).
Weight maintenance (rather than loss) is recommended for most children and adolescents, as this allows a gradual decline in BMI as children grow. However, for post-pubescent adolescents with more severe obesity (BMI equal to adult BMI cut-off points of more than 40 kg/m2, or more than 35 kg/m2 with obesity-related health complications), where other interventions have not been effective, referral
5 Reducing overweight and obesity in children and adolescents
40 Chapter 5 Reducing overweight and obesity in children and adolescents
for bariatric (weight loss) surgery may be considered (NHMRC 2013b). Other interventions such as drug therapy options or very low energy diets may also be considered for some individuals, under intensive monitoring by health professionals (Mihrshahi et al. 2018).
Box 5 .1: Case study—the Nepean Blue Mountains Family Metabolic Health Service The Nepean Blue Mountains Family Metabolic Health Service (‘the Service’) is Australia’s first public, multidisciplinary, tertiary obesity service. It primarily treats patients with severe obesity. It is located at Nepean Hospital in western Sydney, which services areas with high rates of overweight and obesity, a high concentration of fast-food outlets, and high levels of socioeconomic disadvantage.
The Service includes a paediatric clinic to treat children and adolescents with obesity aged 2–15. Patients referred to the paediatric clinic often:
• have one or more obese parents who live on minimal incomes, with high stress and/or medical co-morbidities
• suffer psychological illness due to bullying and weight stigma, and feel excluded from school and peer interactions
• have multiple medical conditions including diabetes, sleep disorders, and joint and mobility limitations
• have a diagnosis of autism spectrum disorder, attention deficit hyperactivity disorder or oppositional defiant disorder.
The clinic team includes endocrinologists, nurses, dietitians, clinical psychologists and physiotherapists. In a submission to the Senate Select Committee into the Obesity Epidemic in Australia, the Service encouraged policy-makers to take steps to complement medical obesity services, such as:
• regulating the number of fast-food and takeaway venues
• increasing the number of venues selling healthy food options
• diversifying urban planning and encouraging the construction of green spaces and safe paths for walking and cycling
• supporting workplace agreements which promote flexible working arrangements to allow more time to shop and prepare meals at home and provide time for family-oriented physical activity
• improving public transport to minimise time spent in cars
• implementing education programs for children from a young age, including mandatory classes in shopping, menu planning, food budgeting and cooking.
The Service emphasised in their submission that severe social and economic disadvantage contribute to an obesogenic environment producing higher rates of overweight and obesity, with implications for health and the local economy. The Service is an example of community- and regional-level prevention, management and treatment activities that considers determinants outside individual action.
Source: Nepean Blue Mountains Family Metabolic Health Service 2020; Nepean Family Obesity Service 2018.
Overweight and obesity among Australian children and adolescents 41
What can be done to help the population?While individual-level approaches are important to reduce overweight and obesity, these are most effective when accompanied by broader policies targeted at a population level to reduce obesity-conducive environments (Mihrshahi et al. 2018). Such strategies include (AIHW 2017a):
• laws and regulations, such as restrictions on the marketing of less healthy (including energy-dense, nutrient-poor) food and drinks to children, and requiring nutritional information to be displayed on menus
• tax and price interventions, such as taxes on less healthy foods and drinks
• community-based interventions, such as programs that promote healthy eating and physical activity in the home, schools, and early child education and care services
• public education or health promotion approaches, such as social marketing campaigns that encourage physical activity and maintenance of a healthy weight.
See A picture of overweight and obesity in Australia (AIHW 2017a) for an overview of population health approaches targeting overweight and obesity, and examples of Australian state and territory government infrastructure support actions and policy actions targeting food environments.
What is being done around the world?There are a number of global initiatives that aim to reduce overweight and obesity, thereby reducing non-communicable diseases (NCDs) such as cardiovascular diseases, cancers, chronic respiratory diseases and diabetes. For example, the World Health Organization’s (WHO) Global Action Plan for the Prevention and Control of Noncommunicable Diseases 2013–2020 (WHO 2013) outlines policy measures that can be taken to prevent and control NCDs. One of the 9 targets is to ‘Halt the rise in obesity by 2025’ (WHO 2016a), which includes recommended priority actions and interventions to achieve this target (Box 5.2).
The importance of preventing and treating NCDs worldwide is also recognised in the United Nations’ 2030 Agenda for Sustainable Development, which includes a global target to ‘reduce by one third premature mortality from non-communicable diseases through prevention and treatment and promote mental health and well-being’ by 2030 (United Nations 2015).
Box 5 .2: WHO priority actions and interventions to help achieve the target of halting the rise in obesity by 2025• Promote, protect and support breastfeeding and healthy complementary feeding practices
• Establish fiscal policies to reduce the consumption of sugar-sweetened beverages
• Improve the provision of healthy food in public institutions, such as schools and through social security programmes
• Implement public campaigns and social marketing initiatives on healthy dietary practices and physical activity
• Establish easy to understand nutrition labelling schemes on food products
• Develop guidelines and recommendations or policy measures that engage different actors in the food system to:- reduce the content of free sugars and fat in food and beverages- reduce portion size- increase availability, affordability and consumption of healthy foods, including fruits and vegetables
• Restrict marketing of foods high in sugars, fat and salt to children. Source: WHO 2016a.
42 Chapter 5 Reducing overweight and obesity in children and adolescents
The WHO has also developed a set of specific recommendations to prevent and reduce childhood and adolescent obesity worldwide (WHO 2016b). The recommendations are grouped into 6 areas (Box 5.3), focusing on the obesogenic environment and critical elements of the lifecourse, recognising that no single intervention will successfully address childhood obesity (WHO 2016b).
Box 5 .3: Key action areas from the WHO Report of the Commission on Ending Childhood Obesity • Implement comprehensive programs that promote the intake of healthy foods and reduce the
intake of unhealthy foods and sugar-sweetened beverages by children and adolescents
• Implement comprehensive programs that promote physical activity and reduce sedentary behaviours in children and adolescents
• Integrate and strengthen guidance for non-communicable disease prevention with current guidance for preconception and antenatal care, to reduce the risk of childhood obesity
• Provide guidance on, and support for, healthy diet, sleep and physical activity in early childhood to ensure children grow appropriately and develop healthy habits
• Implement comprehensive programs that promote healthy school environments, health and nutrition literacy and physical activity among school-age children and adolescents
• Provide family-based, multicomponent, lifestyle weight management services for children and young people who are obese.
Source: WHO 2016b.
What is Australia doing?Australia implements a broad range of multi-faceted and multi-sectoral national and state and territory focused preventive health initiatives, which aim to reduce overweight and obesity prevalence. Some of the relevant national preventive health policies are summarised below.
The National Action Plan for the Health of Children and Young People 2020–2030 recognises that there are a range of health needs, risks and influences experienced by children and young people at different stages of life (Department of Health 2019b). One of the recommended actions to address chronic conditions and preventive health is to ‘Continue promoting and refining preventive health strategies and interventions addressing sleep, nutrition, physical activity, and overweight and obesity’. This includes specific recommendations aimed at children and adolescents, such as supporting and evaluating school-based programs relating to nutrition and physical activity.
The National Strategic Framework for Chronic Conditions recognises that there are often similar underlying principles for the prevention and management of many chronic conditions. Strategic Priority Area 1.1—‘Promote health and reduce risk’ identifies overweight and obesity, and Strategic Priority Area 1.3—‘Critical life stages’ identifies issues related to maternal health, children and young people as important areas contributing to Objective 1—‘Focus on prevention for a healthier Australia’ (AHMAC 2017).
Overweight and obesity among Australian children and adolescents 43
The Australian National Diabetes Strategy 2016–2020 presents ways for states and territories to work with the Australian Government to develop and support approaches for diabetes prevention and management. Goal 1—‘Prevent people developing type 2 diabetes’ lists potential areas for action to reduce modifiable risk factors (including overweight and obesity), such as embedding physical activity and healthy eating in everyday life (including in schools) (Department of Health 2015).
The Australian National Breastfeeding Strategy: 2019 and Beyond recognises that breastfeeding protects children against illnesses and helps to reduce the risk of overweight and obesity. Mothers with obesity are also listed as a priority population within the Strategy (COAG Health Council 2019a).
In October 2016, Australian and state and territory Health Ministers (through the then Council of Australian Governments (COAG) Health Council) endorsed five actions to limit the impact of unhealthy food and drink on children under the following areas: health care, schools, children’s sport and recreation, food promotion, and food regulation. In August 2018, Health Ministers endorsed a National Interim Guide to Reduce Children’s Exposure to Unhealthy Food and Drink Promotion for voluntary use by governments in their settings (COAG Health Council 2018). The interim status of this guideline reflects the need to consider the latest available evidence from the next review of the Australian Dietary Guidelines (NHMRC 2013a), and maintain responsiveness to community expectations around the promotion of unhealthy food and drinks to children.
In 2018, the then COAG Health Council agreed that a National Obesity Strategy Working Group would develop a national obesity strategy to guide sustained preventive action over the next 10 years, to reduce overweight and obesity in Australia (COAG Health Council 2019b). The strategy will ensure a nationally collaborative and cohesive approach to addressing obesity and identify actions and priorities for all levels of governments, as well as provide a focus for multi-sectoral partnerships. The national obesity strategy will be informed by a range of information including: a 2018 Senate Select Committee Inquiry into the Obesity Epidemic (Senate Select Committee into the Obesity Epidemic in Australia 2018); a 2019 National Obesity Summit that brought together obesity experts to prioritise action areas for the strategy; 2 independent reviews of current evidence (Friel & Goldman 2019; Sacks et al. 2019); and a public consultation process.
The development of a National Preventive Health Strategy (NPHS) was announced by Minister Hunt at the Public Health Association of Australia’s 2019 Preventive Health Conference in June 2019. The NPHS is intended to help all Australians improve their health at all stages of life, through early intervention, better information, and targeting modifiable risk factors and the broader causes of poor health. Both primary (disease prevention) and secondary prevention (early detection) will be considered. The areas of cancer screening, immunisation, education, obesity, and alcohol, tobacco and other drugs will be integral to the NPHS. A public consultation process will occur in the second half of 2020 (Department of Health 2020).
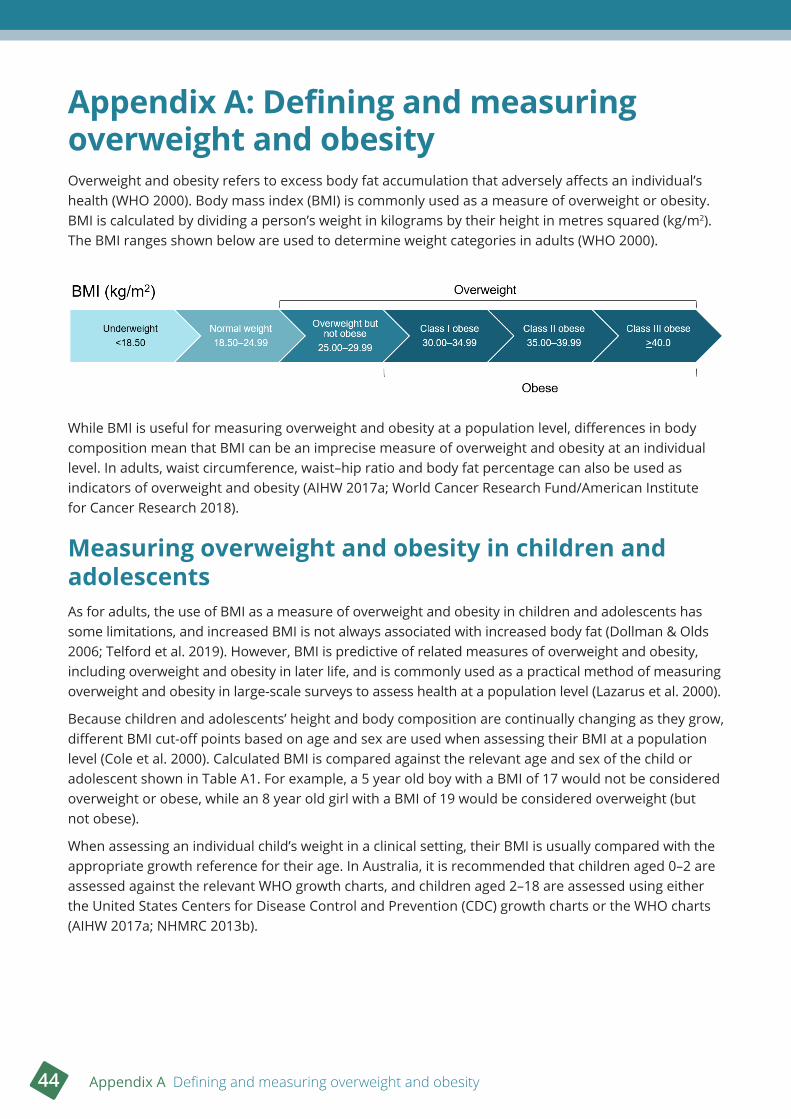
44 Appendix A Defining and measuring overweight and obesity
Appendix A: Defining and measuring overweight and obesityOverweight and obesity refers to excess body fat accumulation that adversely affects an individual’s health (WHO 2000). Body mass index (BMI) is commonly used as a measure of overweight or obesity. BMI is calculated by dividing a person’s weight in kilograms by their height in metres squared (kg/m2). The BMI ranges shown below are used to determine weight categories in adults (WHO 2000).
While BMI is useful for measuring overweight and obesity at a population level, differences in body composition mean that BMI can be an imprecise measure of overweight and obesity at an individual level. In adults, waist circumference, waist–hip ratio and body fat percentage can also be used as indicators of overweight and obesity (AIHW 2017a; World Cancer Research Fund/American Institute for Cancer Research 2018).
Measuring overweight and obesity in children and adolescentsAs for adults, the use of BMI as a measure of overweight and obesity in children and adolescents has some limitations, and increased BMI is not always associated with increased body fat (Dollman & Olds 2006; Telford et al. 2019). However, BMI is predictive of related measures of overweight and obesity, including overweight and obesity in later life, and is commonly used as a practical method of measuring overweight and obesity in large-scale surveys to assess health at a population level (Lazarus et al. 2000).
Because children and adolescents’ height and body composition are continually changing as they grow, different BMI cut-off points based on age and sex are used when assessing their BMI at a population level (Cole et al. 2000). Calculated BMI is compared against the relevant age and sex of the child or adolescent shown in Table A1. For example, a 5 year old boy with a BMI of 17 would not be considered overweight or obese, while an 8 year old girl with a BMI of 19 would be considered overweight (but not obese).
When assessing an individual child’s weight in a clinical setting, their BMI is usually compared with the appropriate growth reference for their age. In Australia, it is recommended that children aged 0–2 are assessed against the relevant WHO growth charts, and children aged 2–18 are assessed using either the United States Centers for Disease Control and Prevention (CDC) growth charts or the WHO charts (AIHW 2017a; NHMRC 2013b).
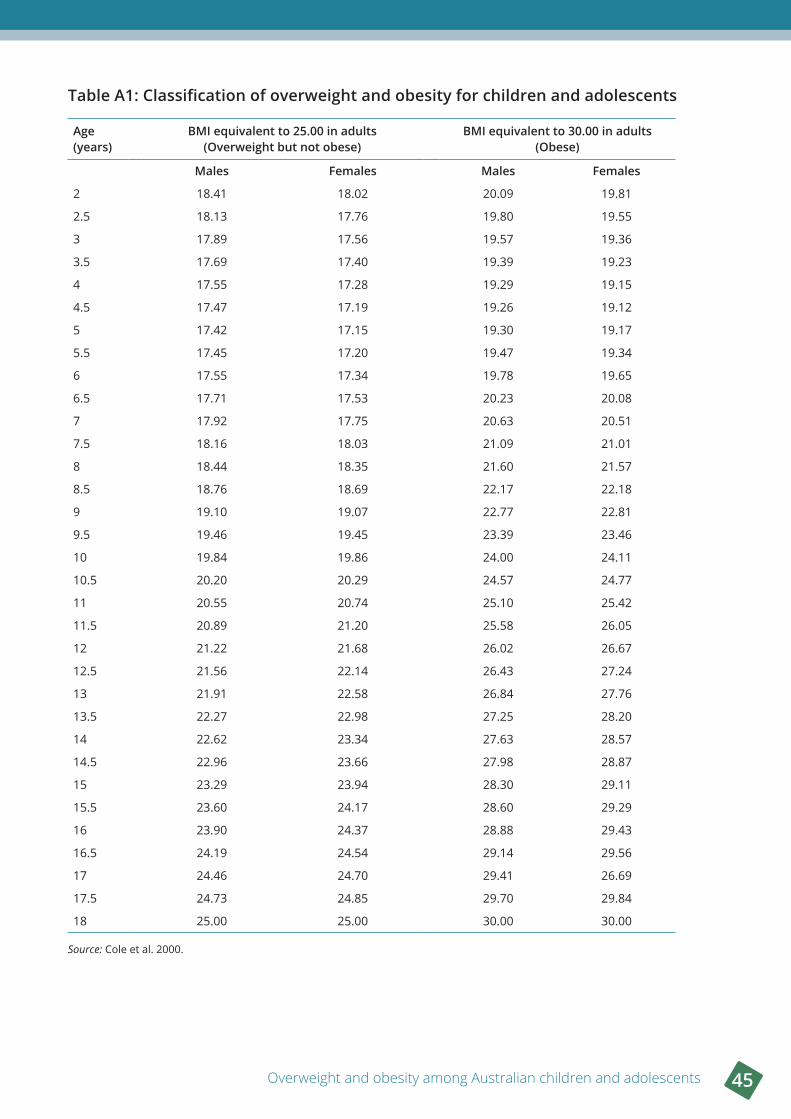
Overweight and obesity among Australian children and adolescents 45
Table A1: Classification of overweight and obesity for children and adolescents
Age (years)
BMI equivalent to 25 .00 in adults (Overweight but not obese)
BMI equivalent to 30 .00 in adults (Obese)
Males Females Males Females
2 18.41 18.02 20.09 19.81
2.5 18.13 17.76 19.80 19.55
3 17.89 17.56 19.57 19.36
3.5 17.69 17.40 19.39 19.23
4 17.55 17.28 19.29 19.15
4.5 17.47 17.19 19.26 19.12
5 17.42 17.15 19.30 19.17
5.5 17.45 17.20 19.47 19.34
6 17.55 17.34 19.78 19.65
6.5 17.71 17.53 20.23 20.08
7 17.92 17.75 20.63 20.51
7.5 18.16 18.03 21.09 21.01
8 18.44 18.35 21.60 21.57
8.5 18.76 18.69 22.17 22.18
9 19.10 19.07 22.77 22.81
9.5 19.46 19.45 23.39 23.46
10 19.84 19.86 24.00 24.11
10.5 20.20 20.29 24.57 24.77
11 20.55 20.74 25.10 25.42
11.5 20.89 21.20 25.58 26.05
12 21.22 21.68 26.02 26.67
12.5 21.56 22.14 26.43 27.24
13 21.91 22.58 26.84 27.76
13.5 22.27 22.98 27.25 28.20
14 22.62 23.34 27.63 28.57
14.5 22.96 23.66 27.98 28.87
15 23.29 23.94 28.30 29.11
15.5 23.60 24.17 28.60 29.29
16 23.90 24.37 28.88 29.43
16.5 24.19 24.54 29.14 29.56
17 24.46 24.70 29.41 26.69
17.5 24.73 24.85 29.70 29.84
18 25.00 25.00 30.00 30.00
Source: Cole et al. 2000.
46 Appendix B Data sources and methods
Appendix B: Data sources and methodsThis Appendix provides an overview of the key data sources used in this report, and a summary of the analytical methods used.
Australian Bureau of Statistics surveys
Data sourcesThis report uses data from the following surveys conducted by the Australian Bureau of Statistics (ABS):
• 2018–19 National Aboriginal and Torres Strait Islander Health Survey (NATSIHS)
• 2017–18 National Health Survey (NHS)
• 2014–15 NHS
• 2012–13 Australian Aboriginal and Torres Strait Islander Health Survey (AATSIHS)
• 2011–12 Australian Health Survey (AHS)
• 2007–08 NHS
• 1995 National Nutrition Survey (NNS).
These data sources were chosen because they provide nationally representative measured height and weight data. Information on the surveys, including data quality statements, are available on the ABS website (www.abs.gov.au).
The scope of these surveys was restricted to residents of private dwellings, and excluded residents of non-private dwellings such as hospitals, nursing homes, hotels, motels, boarding schools, and prisons.
The 2017–18 NHS, 2014–15 NHS, 2011–12 AHS, 2007–08 NHS and 1995 NNS excluded people living in very remote areas of Australia and discrete Aboriginal and Torres Strait Islander communities.
The 2018–19 NATSIHS and 2012–13 AATSIHS only collected information from people who identified as Aboriginal or Torres Strait Islander. These surveys included people living in non-remote and remote areas, including discrete Aboriginal and Torres Strait Islander communities.
The sample size in each survey varied, with about:
• 10,600 Aboriginal and Torres Strait Islander people surveyed in the 2018–19 NATSIHS
• 21,000 people surveyed in the 2017–18 NHS
• 19,300 people surveyed in the 2014–15 NHS
• 12,900 Aboriginal and Torres Strait Islander people surveyed in the 2012–13 AATSIHS
• 31,800 people surveyed in the 2011–12 AHS
• 20,800 people surveyed in the 2007–08 NHS
• 13,800 people surveyed in the 1995 NNS.
All of these surveys (except the 2007–08 NHS) included measured height and weight data for people aged 2 and over. The 2007–08 NHS included these data for people aged 5 and over.
Each survey included the collection of measured height and weight by trained interviewers. The tools used for measuring height and weight varied over time, and in particular this changed the maximum weight that could be measured. For example, the 1995 NNS used scales that could weigh a maximum
Overweight and obesity among Australian children and adolescents 47
weight of 140 kg. However, the 2007–08 NHS used scales that could weigh a maximum weight of 150 kg, and the 2017–18 NHS used scales that could weigh a maximum weight of 200 kg.
The response rates for physical measures varied between surveys with decreasing response rates over time. The ABS imputed BMI for those people for whom BMI was not measured in the 2014–15 NHS, 2017–18 NHS and 2018–19 NATSIHS. In this method, participants with a missing response were given the response of similar participants.
A very similar imputation method was used for the 2017–18 NHS and the 2018–19 NATSIHS, but this method was different for adults and children. For adults, the similarity of participants was based on age group, sex, part of state, self-perceived body mass, level of exercise, whether or not a participant had high cholesterol as a long-term health condition, and self-reported BMI category (calculated from self-reported height and weight) (ABS 2019d, 2019e). For 2–14 year olds, the similarity was based on age group, sex, self-reported BMI and part of state, while for 15–17 year olds, level of exercise and self-perceived body mass (only if a person answered for themselves) were also used.
The imputation method for 2014–15 NHS was similar to 2017–18 NHS and 2018–19 NATSIHS, except it did not use self-reported BMI (ABS 2015a).
There was no imputation of BMI in the 1995 NNS, 2007–08 NHS, 2011–12 AHS and 2012–13 AATSIHS.
For each survey, the ABS allocated a person weight to each participant, corresponding to how many people in the population they each represented. Estimates based on the person weights can be used to infer results for the in-scope population. Note that these person weights are separate to the body weight measurements that are used in the calculation of BMI.
Methods
Crude prevalence estimates
Crude prevalence estimates are presented as percentages in this report. Crude prevalence, as a percentage, is defined as the number of people with a particular characteristic, divided by the number of people in the population of interest, multiplied by 100.
In calculating crude prevalence estimates, those people for whom BMI was not available were excluded from the denominator. For the 2014–15 NHS, 2017–18 NHS and the 2018–19 NATSIHS, imputed data were used for those people for whom BMI had not been measured.
All crude prevalence estimates in this report are weighted estimates that use person weights allocated to each survey participant by the ABS.
The jack-knife weight replication method was used to derive the standard error (SE) for each estimate, using replicate weights provided by the ABS.
The statistical significance of any difference in prevalence (percentage) estimates between people across time or population groups (e.g. between age groups, socioeconomic quintile, or sex) was assessed using z scores or 95% confidence intervals.
Measuring overweight and obesity
For children and adolescents, age- and sex-specific half-year BMI cut-off points were used to classify overweight and obesity (Cole et al. 2000), and underweight (Cole et al. 2007).
48 Appendix B Data sources and methods
Birth cohort analysis
Birth cohort analysis can be used to identify birth cohorts (groups of people born in the same year or years) that are particularly at risk of a health outcome (Keyes et al. 2010), such as overweight and obesity. A birth cohort effect could occur because:
• a population-level environmental cause of the health outcome is unequally distributed across a population and across time (for example, younger people today may have higher access to and consumption of energy-dense foods than younger people of previous generations)
• a population-level environmental cause of the health outcome differentially affects age groups who are in a critical developmental period (for example, exposure to an obesogenic environment may affect younger people more than older people through shaping of lifelong food and physical activity behaviours) (Keyes et al. 2010; Wilson & Abbott 2018).
The prevalence of a health outcome is also affected by age effects (accumulated exposure to a cause and/or physiological changes that occur with aging) and period effects (population-wide exposures that occur at a particular point in time) (Keyes et al. 2010). Age, period and cohort effects are all related—this analysis does not attempt to separate these effects.
The birth cohort analysis results in this report use the 1995 NNS, 2007–08 NHS and 2017–18 NHS.
This analysis did not track the same individuals over time. Rather, birth cohorts were constructed using cross-sectional survey data representing the Australian population at various time points. This approach treated, for example, survey participants aged 5–14 in 2007–08, and survey participants aged 15–24 in 2017–18 as representative of the same group of people (those born in 1993–2002) as they aged 10 years between the surveys.
Year of birth was approximated by subtracting age at survey from survey year. For the 2007–08 NHS and the 2017–18 NHS, interviews were conducted in 2 calendar years (for example, interviews for the 2007–08 NHS were conducted from August 2007 to June 2008). Details of which year an individual was interviewed were not available in the data sets. For these surveys, this analysis assigned survey year as 1995 for the NNS, 2007 for the 2007–08 NHS and 2017 for the 2017–18 NHS.
Records were then grouped into cohorts based on approximated year of birth, using 10-year spans. The width of the spans was chosen to ensure that there was no overlap of birth cohorts at the time points compared.
For each birth cohort, at each survey year, the prevalence of overweight and obesity was calculated based on BMI.
The statistical significance of any difference in prevalence (percentage) estimates between people in each birth cohort at each age was assessed using z scores or 95% confidence intervals.
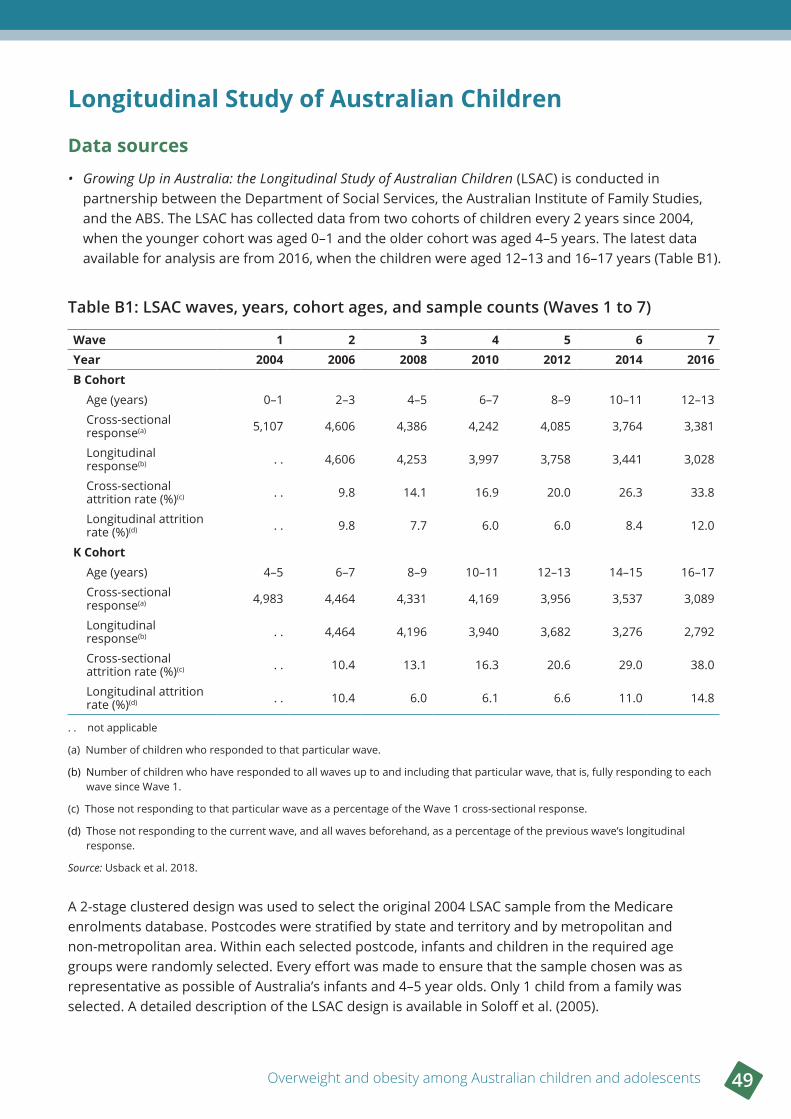
Overweight and obesity among Australian children and adolescents 49
Longitudinal Study of Australian Children
Data sources• Growing Up in Australia: the Longitudinal Study of Australian Children (LSAC) is conducted in
partnership between the Department of Social Services, the Australian Institute of Family Studies, and the ABS. The LSAC has collected data from two cohorts of children every 2 years since 2004, when the younger cohort was aged 0–1 and the older cohort was aged 4–5 years. The latest data available for analysis are from 2016, when the children were aged 12–13 and 16–17 years (Table B1).
Table B1: LSAC waves, years, cohort ages, and sample counts (Waves 1 to 7)
Wave 1 2 3 4 5 6 7Year 2004 2006 2008 2010 2012 2014 2016B Cohort
Age (years) 0–1 2–3 4–5 6–7 8–9 10–11 12–13
Cross-sectional response(a) 5,107 4,606 4,386 4,242 4,085 3,764 3,381
Longitudinal response(b) . . 4,606 4,253 3,997 3,758 3,441 3,028
Cross-sectional attrition rate (%)(c) . . 9.8 14.1 16.9 20.0 26.3 33.8
Longitudinal attrition rate (%)(d) . . 9.8 7.7 6.0 6.0 8.4 12.0
K CohortAge (years) 4–5 6–7 8–9 10–11 12–13 14–15 16–17
Cross-sectional response(a) 4,983 4,464 4,331 4,169 3,956 3,537 3,089
Longitudinal response(b) . . 4,464 4,196 3,940 3,682 3,276 2,792
Cross-sectional attrition rate (%)(c) . . 10.4 13.1 16.3 20.6 29.0 38.0
Longitudinal attrition rate (%)(d) . . 10.4 6.0 6.1 6.6 11.0 14.8
. . not applicable
(a) Number of children who responded to that particular wave.
(b) Number of children who have responded to all waves up to and including that particular wave, that is, fully responding to each wave since Wave 1.
(c) Those not responding to that particular wave as a percentage of the Wave 1 cross-sectional response.
(d) Those not responding to the current wave, and all waves beforehand, as a percentage of the previous wave’s longitudinal response.
Source: Usback et al. 2018.
A 2-stage clustered design was used to select the original 2004 LSAC sample from the Medicare enrolments database. Postcodes were stratified by state and territory and by metropolitan and non-metropolitan area. Within each selected postcode, infants and children in the required age groups were randomly selected. Every effort was made to ensure that the sample chosen was as representative as possible of Australia’s infants and 4–5 year olds. Only 1 child from a family was selected. A detailed description of the LSAC design is available in Soloff et al. (2005).
50 Appendix B Data sources and methods
Data were collected from the child’s primary carer, and from the child themselves (when they were an appropriate age) via a range of methods (including face-to-face interviews and self-completion questionnaires). Physical measurements were also obtained, including the child’s height (for those aged 2 years and older) and weight. See the 2018 LSAC data user guide for more information on physical measurements (AIFS 2018).
MethodsThe LSAC analysis tracks the same individuals over time from 2004 to 2016, with interviews and measurements taken every 2 years.
Measures used from the LSAC were height, weight and BMI. The sociodemographic data items used were age, sex and socioeconomic position (also referred to as socioeconomic group).
Prevalence estimates
Estimates of prevalence for each wave used all children and adolescents who responded and had a measured height and weight in that wave.
The measured height and weight were used to calculate a BMI for each child by dividing their weight (in kilograms) by their height (in metres squared).
For children and adolescents, age- and sex-specific half- and whole-year BMI cut-off points were used to classify overweight and obesity (Cole et al. 2000). The appropriate age cut-off was determined by rounding a child’s age to the nearest half- or whole-year.
For each wave, the cross-sectional weight of all children who responded to that wave was used. Estimates based on these weights can be used to infer results for the in-scope population.
Socioeconomic position
Family socioeconomic position (SEP) was originally developed by Blakemore et al. (2009) as a composite measure of the relative socioeconomic position of families using combined annual family income, highest level of education and occupational status. This takes into account both resource-based factors (e.g. income) and social-based factors (e.g. occupational prestige).
Socioeconomic position was updated by Baker et al. (2017) to use a new occupational prestige classification (the Australian and New Zealand Standard Classification of Occupations 2006). This new socioeconomic position measure (SEP2) was created for wave 2 onwards and is the measure used in this report.
Weighted quartiles of socioeconomic position were created to form 4 groups with approximately equal-sized portions of the in-scope population. Weighted quartiles were used to help account for some of the non-response that may have occurred over time that could be related to socioeconomic position.
This report focuses on comparisons between the lowest 25% and highest 25% of socioeconomic position, which are referred to as the lowest socioeconomic group and highest socioeconomic group.
The socioeconomic position measures used in the LSAC analysis are distinct from the Socio-Economic Indexes for Areas (SEIFA) measures created by the ABS and used in NHS data. The area-based measures take into account the characteristics of an area as measured by the ABS Census of Population and Housing. These area-based measures do not necessarily describe the individual circumstances of a family, as they refer to the area as a whole.
Overweight and obesity among Australian children and adolescents 51
Transitions and persistence of overweight and obesity
As a measure of how overweight and obesity can change over time, this report shows the proportion of children in consecutive waves who changed weight categories, out of all children (with a measured BMI).
Figure 2.16 shows the proportion of children who changed from normal or underweight to overweight or obese, out of all children across each pair of consecutive waves. Figure 2.17 shows the proportion of children who changed from overweight or obese to normal or underweight, out of all children across each pair of consecutive waves.
Children who were normal weight and underweight were grouped for simplicity. The proportion of children who were underweight was generally small, ranging from 5% to 7%, while the proportion of children who were normal weight ranged from 62% to 75% across both cohorts.
All children who responded to consecutive waves and had measured BMI values were included in these transition graphs. The cross-sectional weight of the latter of each pair of waves was used to represent the in-scope population.
Other measures of transitions of overweight and obesity
Four other measures were used to describe the transitions and persistence of overweight and obesity in the LSAC cohorts. These include:
• proportion of children or adolescents who were overweight or obese in any wave
• proportion of children or adolescents who were overweight or obese in every wave
• proportion of children or adolescents who were obese in any wave
• proportion of children or adolescents who were obese in every wave.
These measures used the cohorts of children or adolescents who had responded to and had a measured BMI value in every wave. These measures used the longitudinal weight in wave 7 for both cohorts.
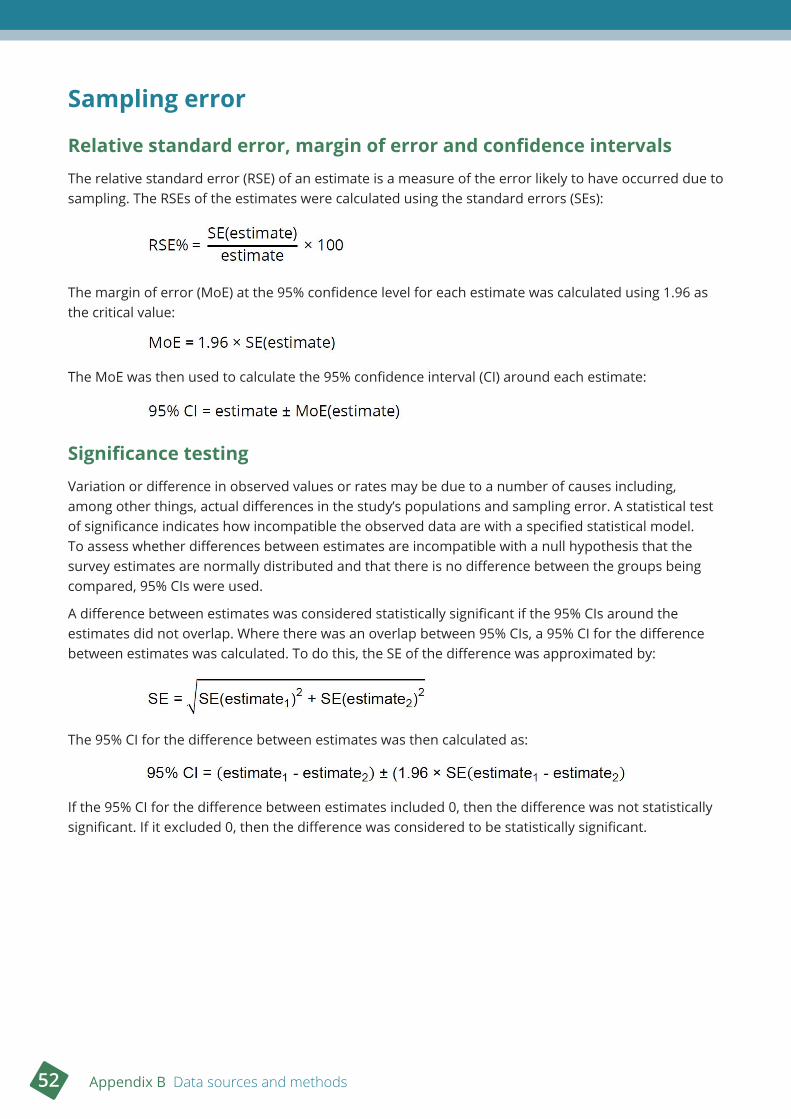
52 Appendix B Data sources and methods
Sampling error
Relative standard error, margin of error and confidence intervalsThe relative standard error (RSE) of an estimate is a measure of the error likely to have occurred due to sampling. The RSEs of the estimates were calculated using the standard errors (SEs):
The margin of error (MoE) at the 95% confidence level for each estimate was calculated using 1.96 as the critical value:
The MoE was then used to calculate the 95% confidence interval (CI) around each estimate:
Significance testingVariation or difference in observed values or rates may be due to a number of causes including, among other things, actual differences in the study’s populations and sampling error. A statistical test of significance indicates how incompatible the observed data are with a specified statistical model. To assess whether differences between estimates are incompatible with a null hypothesis that the survey estimates are normally distributed and that there is no difference between the groups being compared, 95% CIs were used.
A difference between estimates was considered statistically significant if the 95% CIs around the estimates did not overlap. Where there was an overlap between 95% CIs, a 95% CI for the difference between estimates was calculated. To do this, the SE of the difference was approximated by:
The 95% CI for the difference between estimates was then calculated as:
If the 95% CI for the difference between estimates included 0, then the difference was not statistically significant. If it excluded 0, then the difference was considered to be statistically significant.
Overweight and obesity among Australian children and adolescents 53
AcknowledgmentsChloe Groves, Kevin Monahan, Lizzie Gorrell and Ruby Brooks of the Population Health Unit at the Australian Institute of Health and Welfare (AIHW) wrote this report, under the guidance of Claire Sparke, Richard Juckes and Fleur de Crespigny. Jacinta Blazevska, Sarp Kaya, Jen Kerrigan, Chris Rompotis, and Micaella Watson provided assistance.
Fadwa Al-Yaman, Michelle Gourley, Sally Mills, and Geoff Neideck from the AIHW reviewed the report and provided valuable input and advice. Ian Caterson and Annette Dobson from the AIHW Obesity Expert Group, and Gary Rauber and Laurent Schmutz from Sport Australia provided useful feedback.
The Department of Health funded this report. The authors acknowledge the helpful input from individual staff members from the Department of Health.
This paper uses unit record data from Growing Up in Australia: the Longitudinal Study of Australian Children (LSAC) conducted by the Australian Government Department of Social Services (DSS). The findings and views reported in this paper, however, are those of the authors and should not be attributed to the Australian Government, DSS, or any of DSS’s contractors or partners. DOI:10.26193/F2YRL5.
AbbreviationsAATSIHS Australian Aboriginal and Torres Strait Islander Health Survey
ABS Australian Bureau of Statistics
AHMAC Australian Health Ministers’ Advisory Council
AHS Australian Health Survey
AIHW Australian Institute of Health and Welfare
BMI body mass index
CDC Centers for Disease Control and Prevention
COAG Council of Australian Governments
DSS Department of Social Services
HRQoL health-related quality of life
LSAC Longitudinal Study of Australian Children
NAPLAN National Assessment Program—Literacy and Numeracy
NATSIHS National Aboriginal and Torres Strait Islander Health Survey
NHMRC National Health and Medical Research Council
NHS National Health Survey
NNS National Nutrition Survey
NPHS National Preventive Health Strategy
OECD Organisation for Economic Co-operation and Development
WHO World Health Organization
54 Glossary
GlossaryAboriginal or Torres Strait Islander: A person of Aboriginal and/or Torres Strait Islander descent who identifies as an Aboriginal and/or Torres Strait Islander. See also Indigenous.
asthma: A common, chronic inflammatory disease of the air passages that presents as episodes of wheezing, breathlessness and chest tightness due to widespread narrowing of the airways and obstruction of airflow.
back pain and problems: A range of conditions related to the bones, joints, connective tissue, muscles and nerves of the back. Back problems are a substantial cause of disability and lost productivity.
body mass index (BMI): The most commonly used method of assessing whether a person is normal weight, underweight, overweight or obese (see obesity). It is calculated by dividing the person’s weight (in kilograms) by their height (in metres) squared—that is, kg ÷ m2. For both men and women, underweight is a BMI below 18.5, normal weight is from 18.5 to less than 25, overweight but not obese is from 25 to less than 30, and obese is 30 and over. Sometimes overweight and obese are combined—defined as a BMI of 25 and over.
built environment: The human-made surroundings where people live, work and recreate. It includes buildings and parks as well as supporting infrastructure such as transport, water and energy networks.
burden of disease: The quantifiable impact of a disease, injury or risk factor on a population, using the disability-adjusted life year (DALY) measure.
cancer: A large range of diseases where some of the body’s cells become defective, begin to multiply out of control, invade and damage the area around them, and can then spread to other parts of the body to cause further damage.
cardiovascular disease/condition: Any disease of the circulatory system, namely the heart (cardio) or blood vessels (vascular). Includes angina, heart attack, and stroke.
chronic kidney disease: Refers to all conditions of the kidney, lasting at least 3 months, where a person has had evidence of kidney damage and/or reduced kidney function, regardless of the specific cause.
cohort: A group of people who share a similar characteristic (for example, age).
coronary heart disease: A disease due to blockages in the heart’s own (coronary) arteries, expressed as angina or a heart attack.
dementia: A term used to describe a group of similar conditions characterised by the gradual impairment of brain function. It is commonly associated with memory loss, but can affect speech, cognition (thought), behaviour and mobility. An individual’s personality may also change, and health and functional ability decline as the condition progresses.
disability-adjusted life year (DALY): A year of healthy life lost, either through premature death or, equivalently, through living with ill health due to illness or injury. It is the basic unit used in burden of disease and injury estimates.
discretionary foods: Foods and drinks not necessary to provide the nutrients the body needs, but which may add variety. Many are high in saturated fats, sugars, salt and/or alcohol, and are energy dense.
Overweight and obesity among Australian children and adolescents 55
fatty liver disease: A common liver disease that is caused by an accumulation of fat in the liver which can cause serious complications such as cirrhosis.
gallbladder disease: Refers to a collection of conditions affecting the gallbladder, including gallstones.
gastrointestinal: A term relating to the stomach and the intestine.
gestational diabetes: A form of diabetes that is first diagnosed during pregnancy (gestation). It may disappear after pregnancy but signals a high risk of diabetes occurring later on in life.
gout: A disease brought on by excess uric acid in the blood, causing attacks of joint pain (most often in the big toe) and other problems.
green spaces: Areas of public and private land such as nature reserves, public parks, residential gardens, sporting facilities, beachfronts and waterways.
hypertension/high blood pressure: Definitions can vary but a well-accepted definition is from the World Health Organization: a systolic blood pressure of 140 mmHg or more or a diastolic blood pressure of 90 mmHg or more, or if [the person is] receiving medication for high blood pressure.
impaired glucose tolerance: A condition in which blood glucose levels are higher than normal but less than required for a diagnosis of diabetes, but which signal an increased risk of developing type 2 diabetes.
Indigenous: A person of Aboriginal and/or Torres Strait Islander descent who identifies as an Aboriginal and/or Torres Strait Islander. See also Aboriginal or Torres Strait Islander.
insulin resistance: A condition in which the cells in the muscles, fat and liver do not respond correctly to the hormone insulin, which impairs the uptake of glucose in the blood. As a result, blood glucose levels are higher than normal, which causes the pancreas to overproduce insulin.
longitudinal study: A research method that collects data from the same individuals over time.
Medicare: A national, government-funded scheme that subsidises the cost of personal medical services for all Australians and aims to help them afford medical care. The Medicare Benefits Schedule (MBS) is the listing of the Medicare services subsidised by the Australian Government. The schedule is part of the wider Medicare Benefits Scheme (Medicare).
mortality: Number or rate of deaths in a population during a given time period.
musculoskeletal: A term that relates to the muscles, joints and bones.
obesity: Marked degree of overweight, defined for population studies as a body mass index of 30 or over. See also overweight.
obesogenic environment: An environment that promotes obesity among individuals and populations. It includes physical, economic, political and sociocultural factors.
obstructive sleep apnoea: A disorder in which a person repeatedly stops breathing during sleep. It has the same cause as snoring—reduced air flow at the back of the mouth—but is more extreme. More common in males and people who are obese, it leads to poorer mental functioning during the day and a greater risk of accidents.
organised sport/organised physical activities: Activities done through an organisation, such as a club or sporting body; this may also include school physical education classes.
overweight: Defined for the purpose of population studies as a body mass index of 25 or over. See also obesity.
56 Glossary
overweight but not obese: Defined for the purpose of population studies as a body mass index between 25 and less than 30.
polycystic ovarian syndrome (PCOS): A hormonal condition in women which presents with symptoms including excess body hair, raised testosterone levels, irregular or infrequent menstruation and multiple cysts on the ovaries. PCOS is associated with a higher risk of type 2 diabetes, infertility and cardiometabolic conditions.
premature deaths/premature mortality: Deaths that occur at a younger age than a selected cut-off. The age below which deaths are considered premature can vary depending on the purpose of the analysis and the population under investigation.
prevalence: The number or proportion (of cases, instances, and so forth) in a population at a given time. For example, in relation to cancer, refers to the number of people alive who had been diagnosed with cancer in a prescribed period (usually 1, 5, 10 or 26 years).
psychological distress: Unpleasant feelings or emotions that affect a person’s level of functioning and interfere with the activities of daily living. This distress can result in having negative views of the environment, others and oneself, and manifest as symptoms of mental illness, including anxiety and depression.
quartile: A statistical term describing the division of data observations into four intervals.
rate: A rate is one number (the numerator) divided by another number (the denominator). The numerator is commonly the number of events in a specified time. The denominator is the population ‘at risk’ of the event. Rates (crude, age-specific and age-standardised) are generally multiplied by a number such as 100,000 to create whole numbers.
remoteness areas: These regions are defined by the Australian Statistical Geographical Standard (ASGS) and based on the Accessibility/Remoteness Index of Australia which uses the road distance to goods and services (such as general practitioners, hospitals and specialist care) to measure relative accessibility of regions around Australia.
respiratory condition: A chronic respiratory condition affecting the airways and characterised by symptoms such as wheezing, shortness of breath, chest tightness and cough. Conditions include asthma and chronic obstructive pulmonary disease (COPD)—which includes emphysema and chronic bronchitis.
screen time/screen-based activities: Activities done in front of a screen, such as watching television, using a computer, or playing video games.
sedentary activity/behaviour: Activity that involves sitting or lying down requiring very little energy expenditure. Sedentary activities can occur at work (for example, sitting at a desk), in the home (for example, watching television, reading, or playing video games) and during transport (for example, sitting in the car or on the bus).
socioeconomic areas: Based on the Index of Relative Socio-Economic Disadvantage, part of the Socio-Economic Indexes for Areas (SEIFA) created from Census data, which aims to represent the socioeconomic position of Australian communities and reflect the overall or average level of disadvantage of the population in an area.
Overweight and obesity among Australian children and adolescents 57
Socio-Economic Indexes for Areas (SEIFA): A set of indexes, created from Census data, that aim to represent the socioeconomic position of Australian communities and identify areas of advantage and disadvantage. The index value reflects the overall or average level of disadvantage of the population of an area; it does not show how individuals living in the same area differ from each other in their socioeconomic group.
socioeconomic group: See socioeconomic position.
socioeconomic position: An indication of how ‘well off’ a person or group is. In this report, socioeconomic position is measured using two separate methods. For ABS survey data, socioeconomic position is measured using socioeconomic areas. For LSAC data, this is measured with an index called family socioeconomic position (SEP), which is a combination of the highest level of education, occupational status and combined family income for each family. Families have been sorted into 3 groups—the lowest 25%, middle 50% and highest 25% of socioeconomic position—and these are referred to as the lowest, middle and highest socioeconomic groups.
stroke: An event that occurs when an artery supplying blood to the brain suddenly becomes blocked or bleeds. A stroke often causes paralysis of parts of the body normally controlled by that area of the brain, or speech problems and other symptoms.
type 2 diabetes: The most common form of diabetes, occurring mostly in people aged 40 and over, and marked by reduced or less effective insulin.
underweight: A category defined for population studies as a body mass index less than 18.5.
58 References
ReferencesAarts MJ, de Vries SI, van Oers HAM & Schuit AJ 2012. Outdoor play among children in relation to neighborhood characteristics: a cross-sectional neighborhood observation study. International Journal of Behavioral Nutrition and Physical Activity 9(98):1–11.
Abdullah A, Wolfe R, Stoelwinder JU, de Courten M, Stevenson C, Walls HL et al. 2011. The number of years lived with obesity and the risk of all-cause and cause-specific mortality. International Journal of Epidemiology 40(4):985–96.
Abeysekara P, Turchi R & O’Neil M 2014. Obesity and children with special healthcare needs: special considerations for a special population. Current Opinion in Pediatrics 26(4):508–15.
ABS (Australian Bureau of Statistics) 2009a. Microdata: National Health Survey, Basic and Expanded CURF, 2007–08. ABS cat. no. 4324.0.55.001. Findings based on Expanded Confidentialised Unit Record File analysis. Canberra: ABS.
ABS 2009b. National Health Survey: summary of results, 2007–08 (reissue). ABS cat. no. 4364.0. Canberra: ABS.
ABS 2013a. Australian Health Survey: updated results, 2011–12. ABS cat. no. 4364.0.55.003. Canberra: ABS.
ABS 2013b. Microdata: National Nutrition Survey, 1995. ABS cat. no. 4807.0.30.001. Findings based on Basic Confidentialised Unit Record File analysis. Canberra: ABS.
ABS 2014. Australian Aboriginal and Torres Strait Islander Health Survey: updated results, 2012–13. ABS cat. no. 4727.0.55.006. Canberra: ABS.
ABS 2015a. National Health Survey: first results, 2014–15. ABS cat. no. 4364.0.55.001. Canberra: ABS.
ABS 2015b. Microdata: Australian Aboriginal and Torres Strait Islander Health Survey, core content—risk factors and selected health conditions, 2012–13. ABS cat. no. 4715.0.30.003. Findings based on Expanded Confidentialised Unit Record File analysis. Canberra: ABS.
ABS 2018a. Childhood education and care, Australia, June 2017. Cat. no. 4402.0. Canberra: ABS.
ABS 2018b. National Health Survey: first results, 2017–18. ABS cat. no. 4364.0.55.001. Canberra: ABS.
ABS 2019a. Microdata: National Aboriginal and Torres Strait Islander Health Survey, 2018–19. ABS cat no. 4715.0.55.001. Findings based on detailed microdata analysis. Canberra: ABS.
ABS 2019b. Microdata: National Health Survey, 2017–18. ABS cat. no. 4324.0.55.001. Findings based on detailed microdata analysis. Canberra: ABS.
ABS 2019c. National Health Survey, 2017–18. Customised data report. Canberra: ABS.
ABS 2019d. National Health Survey: users’ guide, 2017–18. ABS cat. no. 4363.0. Canberra: ABS.
ABS 2019e. National Aboriginal and Torres Strait Islander Health Survey, 2018–19. ABS cat. no. 4715.0. Canberra: ABS.
ACARA (Australian Curriculum, Assessment and Reporting Authority) 2019. Health and physical education. Sydney: ACARA. Viewed 12 March 2020, https://www.australiancurriculum.edu.au/f-10-curriculum/health-and-physical-education/.
Active Healthy Kids Australia 2018. Muscular fitness: it’s time for a jump start! The 2018 Active Healthy Kids Australia report card on physical activity for children and young people. Adelaide: Active Healthy Kids Australia.
AHMAC (Australian Health Ministers’ Advisory Council) 2017. National Strategic Framework for Chronic Conditions. Canberra: Australian Government.
AIFS (Australian Institute of Family Studies) 2018. The Longitudinal Study of Australian Children: data user guide December 2018. Melbourne: AIFS.
AIHW (Australian Institute of Health and Welfare) 2016. Australia’s health 2016. Australia’s health no. 15. Cat. no. AUS 199. Canberra: AIHW.
AIHW 2017a. A picture of overweight and obesity in Australia. Cat. no. PHE 216. Canberra: AIHW.
AIHW 2017b. Overweight and obesity in Australia: a birth cohort analysis. Cat. no. PHE 215. Canberra: AIHW.
AIHW 2018a. Australia’s health 2018. Australia’s health no. 16. Cat. no. AUS 221. Canberra: AIHW.
AIHW 2018b. Nutrition across the life stages. Cat. no. PHE 227. Canberra: AIHW.
Overweight and obesity among Australian children and adolescents 59
AIHW 2018c. Physical activity across the life stages. Cat. no. PHE 225. Canberra: AIHW.
AIHW 2019a. Australian Burden of Disease Study: impact and causes of illness and death in Australia 2015. Australian Burden of Disease Study series no. 19. Cat. no. BOD 22. Canberra: AIHW.
AIHW 2019b. Australian Burden of Disease Study 2015: interactive data on risk factor burden. Cat. no. BOD 25. Canberra: AIHW.
AIHW 2019c. Australia’s mothers and babies 2017: in brief. Perinatal Statistics series no. 35. Cat. no. PER 100. Canberra: AIHW.
AIHW 2019d. Data sources for monitoring overweight and obesity in Australia. Cat. no. PHE 244. Canberra: AIHW.
AIHW 2019e. Health expenditure Australia 2017–18. Health and welfare expenditure series no.65. Cat. no. HWE 77. Canberra: AIHW.
AIHW 2019f. Insufficient physical activity. Cat. no. PHE 248. Canberra: AIHW.
AIHW 2019g. Overweight and obesity: an interactive insight. Cat. no. PHE 251. Canberra: AIHW.
AIHW 2020. Australia’s children. Cat. no. CWS 69. Canberra: AIHW.
AIHW (forthcoming 2021). Childhood overweight and obesity—the impact of the home environment. Canberra: AIHW.
Al Mamun A, Lawlor DA, Cramb S, O’Callaghan M, Williams G & Najman J 2007. Do childhood sleeping problems predict obesity in young adulthood? Evidence from a prospective birth cohort study. American Journal of Epidemiology 166(12):1368–73.
Anderson PM & Butcher KE 2006. Childhood obesity: trends and potential causes. The Future of Children 16(1):19–45.
Au N 2012. The health care cost implications of overweight and obesity during childhood. Health Services Research 47(2):655–76.
ASC (Australian Sports Commission) 2018. AusPlay Focus: children’s participation in organised physical activity outside of school hours. Canberra: Australian Sports Commission.
Baker K, Sipthorp M & Edwards B 2017. A longitudinal measure of socioeconomic position in LSAC. Longitudinal Study of Australian Children Technical Paper No. 18. Melbourne: AIFS.
Banks E, Jorm L, Rogers K, Clements M & Bauman A 2011. Screen-time, obesity, ageing and disability: findings from 91 266 participants in the 45 and Up Study. Public Health Nutrition 14(1):34–43.
Bass R & Eneli I 2015. Severe childhood obesity: an under-recognised and growing health problem. Postgraduate Medical Journal 91:639–45.
Berge JM, Meyer CS, Loth K, MacLehose R & Neumark-Sztainer D 2015. Parent/adolescent weight status concordance and parent feeding practices. Pediatrics 136(3):e591–8.
Biddle SJ, Pearson N, Ross GM & Braithwaite R 2010. Tracking of sedentary behaviours of young people: a systematic review. Preventive Medicine 51(5):345–51.
Billich N, Adderley M, Ford L, Keeton I, Pamlermo C, Peeters A et al. 2018. The relative price of healthy and less healthy foods available in Australian school canteens. Health Promotion International 34(4):1–10.
Black N, Johnston DW & Peeters A 2015. Childhood obesity and cognitive achievement. Health Economics 24(9):1082–100.
Black N & Kassenboehmer SC 2017. Getting weighed down: the effect of childhood obesity on the development of socioemotional skills. Journal of Human Capital 11(2):263–95.
Black N, Hughes R & Jones AM 2018a. The health care costs of childhood obesity in Australia: an instrumental variables approach. Economics & Human Biology 31:1–13.
Black N, Kung CSJ & Peeters A 2018b. For richer, for poorer: the relationship between adolescent obesity and future household economic prosperity. Preventive Medicine 111:142–50.
Blakemore T, Strazdins L & Gibbings J 2009. Measuring family socioeconomic position. Australian Social Policy No. 8. Canberra: Department of Families, Housing, Community Services and Indigenous Affairs, 121–68.
Boone JE, Gordon-Larsen P, Adair LS & Popkin BM 2007. Screen time and physical activity during adolescence: longitudinal effects on obesity in young adulthood. International Journal of Behavioral Nutrition and Physical Activity 4:26.
60 References
Brown V, Moodie M, Baur L, Wen LM & Hayes A 2017. The high cost of obesity in Australian pre-schoolers. Australian and New Zealand Journal of Public Health 41(3):323–4.
Buttitta M, Iliescu C, Rousseau A & Guerrien A 2014. Quality of life in overweight and obese children and adolescents: a literature review. Quality of Life Research 23(4):1117–39.
Cancer Council 2014. Position statement—food marketing to children. Sydney: Cancer Council Australia.
Carlisle E, Fildes J, Hall S, Perrens B, Perdriau A & Plummer J 2019. Youth Survey report 2019. Sydney: Mission Australia.
Casey R, Oppert JM, Weber C, Charreire H, Salze P, Badariotti D et al. 2014. Determinants of childhood obesity: What can we learn from built environment studies? Food Quality and Preference 31:164–72.
CDC (Centers for Disease Control and Prevention) 2016. Childhood obesity causes & consequences. Atlanta: CDC. Viewed 1 May 2019, https://www.cdc.gov/obesity/childhood/causes.html.
Christian MS, Evans CE, Hancock N, Nykjaer C & Cade JE 2013. Family meals can help children reach their 5 a day: a cross-sectional survey of children’s dietary intake from London primary schools. Journal of Epidemiology and Community Health 67(4):332–8.
Clifford SA, Gold L, Mensah FK, Jansen PW, Lucas N, Nicholson JM et al. 2015. Health-care costs of underweight, overweight and obesity: Australian population-based study. Journal of Paediatrics and Child Health 51(12):1199–206.
COAG (Council of Australian Governments) Health Council 2018. National interim guide to reduce children’s exposure to unhealthy food and drink promotion. Canberra: COAG Health Council.
COAG Health Council 2019a. Australian national breastfeeding strategy: 2019 and beyond. Canberra: COAG Health Council.
COAG Health Council 2019b. Have your say on a national obesity strategy: consultation paper. Canberra: COAG Health Council.
Coffee NT, Kennedy HP & Niyonsenga T 2016. Fast-food exposure around schools in urban Adelaide. Public Health Nutrition 19(17):3095–15.
Cole TJ, Bellizzi MC, Flegal KM & Dietz WH 2000. Establishing a standard definition for child overweight and obesity worldwide: international survey. The BMJ 320:1240–3.
Cole TJ, Flegal KM, Nicholls D & Jackson AA 2007. Body mass index cut offs to define thinness in children and adolescents: international survey. The BMJ 335(7612):194.
Craigie AM, Lake AA, Kelly SA, Adamson AJ & Mathers JC 2011. Tracking of obesity-related behaviours from childhood to adulthood: a systematic review. Maturitas 70:266–84.
Davand P, Villanueva CM, Font-Ribera L, Martinez D, Basagana X, Belmonte J et al. 2014. Risks and benefits of green spaces for children: a cross-sectional study of associations with sedentary behavior, obesity, asthma, and allergy. Environmental Health Perspectives 122(12):1329–35.
Day PL & Pearce J 2011. Obesity-promoting food environments and the spatial clustering of food outlets around schools. American Journal of Preventive Medicine 40(2):113–21.
de Onis M, Blössner M & Borghi E 2010. Global prevalence and trends of overweight and obesity among preschool children. American Journal of Clinical Nutrition 92(5):1257–64.
Department of Health 2013. 2010 National healthy school canteens guidelines. Canberra: Department of Health. Viewed 22 August 2019, https://www1.health.gov.au/internet/main/publishing.nsf/Content/phd-nutrition-canteens.
Department of Health 2015. Australian national diabetes strategy 2016–2020. Canberra: Department of Health.
Department of Health 2019a. Australia’s physical activity and sedentary behaviour guidelines and the Australian 24-hour movement guidelines. Canberra: Department of Health. Viewed 5 August 2019, https://www1.health.gov.au/internet/main/publishing.nsf/Content/health-pubhlth-strateg-phys-act-guidelines.
Department of Health 2019b. National action plan for the health of children and young people 2020–2030. Canberra: Department of Health.
Department of Health 2020. National preventive health strategy. Canberra: Department of Health. Viewed 4 June 2020, https://www1.health.gov.au/internet/main/publishing.nsf/Content/national-preventive-health-strategy.
Overweight and obesity among Australian children and adolescents 61
DSS (Department of Social Services), Australian Institute of Family Studies & Australian Bureau of Statistics 2019. Growing Up in Australia: Longitudinal Study of Australian Children (LSAC) Release 7.2 (Waves 1–7). ADA Dataverse.
DeWeese RS, Yedidia MJ, Tulloch DL & Ohri-Vachaspati P 2013. Neighborhood perceptions and active school commuting in low-income cities. American Journal of Preventive Medicine 45(4):393–400.
Dietz WH, Baur LA, Hall K, Puhl RM, Taveras EM, Uauy R et al. 2015. Management of obesity: improvement of health-care training and systems for prevention and care. Lancet 385(9986):2521–33.
Dollman J & Olds TS 2006. Secular changes in fatness and fat distribution in Australian children matched for body size. International Journal of Pediatric Obesity 1(2):109–13.
Ebbeling CB, Pawlak DB & Ludwig DS 2002. Childhood obesity: public-health crisis, common sense cure. Lancet 360(9331):473–82.
Egger G & Swinburn B 1997. An “ecological” approach to the obesity pandemic. The BMJ 315(7106):477–80.
Escalante Y, García-Hermoso A, Backx K & Saavedra JM 2013. Playground designs to increase physical activity levels during school recess: a systematic review. Health Education & Behavior 41(2):138–44.
Espinel PT & King L 2009. A framework for monitoring overweight and obesity in NSW. Sydney: NSW Department of Health; Physical Activity Nutrition Obesity Research Group.
Forsyth A, Wall M, Larson N, Story M & Neumark-Sztainer D 2012. Do adolescents who live or go to school near fast-food restaurants eat more frequently from fast-food restaurants? Health & Place 18(6):1261–9.
Frayling TM, Timpson NJ, Weedon MN, Zeggini E, Freathy RM & Lindgren CM 2007. A common variant in the FTO gene is associated with body mass index and predisposes to childhood and adult obesity. Science 316(5826):889–94.
Friel S & Goldman S 2019. Addressing the social and commercial determinants of healthy weight: an evidence check rapid review brokered by the Sax Institute (www.saxinstitute.org.au) for the Queensland Department of Health on behalf of the national obesity strategy working group. Sydney: Sax Institute.
Garnett SP, Baur LA, Jones AMD & Hardy LL 2016. Trends in the prevalence of morbid and severe obesity in Australian children aged 7–15 years, 1985–2012. PLoS ONE 11(5):e0154879.
Gerritsen S, Dean B, Morton SMB & Wall CR 2017. Do childcare menus meet nutrition guidelines? Quantity, variety and quality of food provided in New Zealand early childhood education services. Australian and New Zealand Journal of Public Health 41(4):345–51.
Guthold R, Stevens G, Riley LM & Bull FC 2019. Global trends in insufficient physical activity among adolescents: a pooled analysis of 298 population-based surveys with 1·6 million participants. Lancet Child & Adolescent Health 4(1):23–35.
Haire-Joshu D & Tabak R 2016. Preventing obesity across generations: evidence for early life intervention. Annual Review of Public Health 37:253–71.
Hardy LL, Mihrshahl S, Drayton BA & Bauman A 2016. NSW Schools Physical Activity and Nutrition Survey (SPANS) 2015: full report. Sydney: NSW Department of Health.
Haycraft E, Karasouli E & Meyer C 2017. Maternal feeding practices and children’s eating behaviours: a comparison of mothers with healthy weight versus overweight/obesity. Appetite 116:395–400.
Hayes A, Chevalier A, D’Souza M, Baur L, Wen LM & Simpson J 2016. Early childhood obesity: association with healthcare expenditure in Australia. Obesity 24(8):1752–8.
Hayes A, Tan EJ, Lung T, Brown V, Moodie M & Baur L 2019. A new model for evaluation of interventions to prevent obesity in early childhood. Frontiers in Endocrinology (Lausanne) 10:132.
He M, Tucker P, Gilliland J, Irwin JD, Larsen K & Hess P 2012. The influence of local food environments on adolescents’ food purchasing behaviors. International Journal of Environmental Research and Public Health 9(4):1458–71.
Healthy Eating Advisory Service 2016. Menu planning guidelines for long day care. Victoria: State of Victoria. Viewed 15 October 2019, http://heas.health.vic.gov.au/early-childhood-services/menu-planning/long-day-care/guidelines.
Henne HM, Tandon PS, Frank LD & Saelens BE 2014. Parental factors in children’s active transport to school. Public Health Nutrition 128(7):643–6.
62 References
Jansen PW, Mensah FK, Clifford S, Nicholson JM & Wake M 2013. Bidirectional associations between overweight and health-related quality of life from 4–11 years: Longitudinal Study of Australian Children. International Journal of Obesity 37(10):1307–13.
Juonala M, Magnussen CG, Berenson GS, Venn A, Burns TL & Sabin MA 2011. Childhood adiposity, adult adiposity, and cardiovascular risk factors. New England Journal of Medicine 365:1876–85.
Kelly B, Baur LA, Bauman AR, King L & Chapman K 2011. “Food company sponsors are kind, generous and cool”: (mis)conceptions of junior sports players. The International Journal of Behavioural Nutrition and Physical Activity 8:95.
Kelsey MM, Zaepfel A, Bjornstad P & Nadeau KJ 2014. Age-related consequences of childhood obesity. Gerontology 60(3):222–8.
Kent M, Pauze E, Roy EA, de Billy N & Czoli C 2019. Children and adolescents’ exposure to food and beverage marketing in social media apps. Pediatric Obesity 14(6):e12508.
Keyes KM, Utz RL, Robinson W & Li G 2010. What is a cohort effect? Comparison of three statistical methods for modeling cohort effects in obesity prevalence in the United States, 1971–2006. Social Science & Medicine 70(7):1100–8.
Lachowycz K & Jones AP 2011. Greenspace and obesity: a systematic review of the evidence. Obesity Reviews 12(5):e183–e9.
Lazarus R, Wake M, Hesketh K & Waters E 2000. Change in body mass index in Australian primary school children, 1985–1997. International Journal of Obesity 2000 24(6):679–84.
Lee EY, Hesketh KD, Rhodes RE, Rinaldi CM, Spence JC & Carson V 2018. Role of parental and environmental characteristics in toddlers’ physical activity and screen time: Bayesian analysis of structural equation models. International Journal of Behavioral Nutrition and Physical Activity 15(1):17.
Li L, Zhang S, Huang Y & Chen K 2017. Sleep duration and obesity in children: a systematic review and meta-analysis of prospective cohort studies. Journal of Paediatrics and Child Health 53(4):378–85.
Lobstein T, Baur L & Uauy R for the IASO International Obesity TaskForce 2004. Obesity in children and young people: a crisis in public health. Obesity Reviews 5 (Supplement 1):4–85.
Lubans DR, Boreham CA, Kelly P & Foster CE 2011. The relationship between active travel to school and health-related fitness in children and adolescents: a systematic review. International Journal of Behavioral Nutrition and Physical Activity 8:5.
MacKay S, Antonopoulos N, Martin J & Swinburn B 2011. A comprehensive approach to protecting children from unhealthy food advertising. Melbourne: Obesity Policy Coalition.
Mameli C, Mazzantini S & Zuccotti GV 2016. Nutrition in the first 1000 days: the origin of childhood obesity. International Journal of Environmental Research and Public Health 13(9): E838.
McPherson NO, Fullston T, Aitken RJ & Lane M 2014. Paternal obesity, interventions, and mechanistic pathways to impaired health in offspring. Annals of Nutrition and Metabolism 64(3–4):231–8.
Mihrshahi S, Gow ML & Baur LA 2018. Contemporary approaches to the prevention and management of paediatric obesity: an Australian focus. Medical Journal of Australia 209(6):267–74.
Miller LJ, Joyce S, Carter S & Yun G 2014. Associations between childhood obesity and the availability of food outlets in the local environment: a retrospective cross-sectional study. American Journal of Health Promotion 28(6):e137–e45.
Mitchell J & Baur L 2019. Childhood overweight and obesity: evidence, prevention and response. Public Health Research & Practice 29(1):e2911900.
Morley BC, Scully ML, Niven PH, Okely AD, Baur LA, Pratt IS et al. 2012. What factors are associated with excess body weight in Australian secondary school students? Medical Journal of Australia 196(3):189–92.
Murray M, Pearson JL, Dordevic AL & Bonham MP 2018. The impact of multicomponent weight management interventions on quality of life in adolescents affected by overweight or obesity: a meta-analysis of randomized controlled trials. Obesity Reviews 20(2):278–89.
NCD Risk Factor Collaboration 2017a. Child and adolescent body mass index—global data download. Viewed 19 November 2019, http://ncdrisc.org/data-downloads-adiposity-ado.html.
Overweight and obesity among Australian children and adolescents 63
NCD Risk Factor Collaboration 2017b. Worldwide trends in body-mass index, underweight, overweight and obesity from 1975 to 2016: a pooled analysis of 2416 population-based measurement studies in 128.9 million children, adolescents and adults. Lancet 390 (10113):2627–42.
Nepean Blue Mountains Family Metabolic Health Service 2020. Viewed 14 May 2020, https://www.nbmlhd.health.nsw.gov.au/nbmlhd-outpatient-clinic-service-directory/nepean-hospital-outpatient-clinics/family-metabolic-health-service.
Nepean Family Obesity Service 2018. Nepean Family Obesity Service submission to the Select Committee into the obesity epidemic in Australia, July 2018. Penrith: Nepean Family Obesity Service.
NHMRC (National Health and Medical Research Council) 2012. Infant feeding guidelines. Canberra: NHMRC.
NHMRC 2013a. Australian Dietary Guidelines. Canberra: NHMRC.
NHMRC 2013b. Clinical practice guidelines for the management of overweight and obesity in adults, adolescents and children in Australia. Melbourne: NHMRC.
Niven P, Scully M, Morley B, Baur L, Crawford D, Pratt IS et al. 2014. What factors are associated with frequent unhealthy snack-food consumption among Australian secondary-school students? Public Health Nutrition 18(2):2153–60.
Nixon H & Doud L 2011. Do fast food restaurants cluster around high schools? A geospatial analysis of proximity of fast food restaurants to high schools and the connection to childhood obesity rates. Journal of Agriculture, Food Systems, and Community Development 2(1):181–94.
OPC (Obesity Policy Coalition) 2017. More than half of foods aimed at kids are unhealthy: research (media release). Viewed 15 May 2020, https://www.opc.org.au/media/media-releases/more-than-half-of-foods-aimed-at-kids-unhealthy-research.html.
OPC 2018. How unhealthy food is marketed to children through digital media: policy brief. Victoria: OPC.
O’Connor M, Warren D & Daraganova G 2018. Eating problems in mid-adolescence. In: Warren D & Daraganova G (eds). Growing up in Australia—the Longitudinal Study of Australian Children, annual statistical report 2017. Melbourne: AIFS, 113–124.
OECD (Organisation for Economic Co-operation and Development) 2019. The heavy burden of obesity: the economics of prevention. Paris: OECD Health Policy Studies.
Olds T, Tomkinson GR, Ferrar KE & Maher CA 2010. Trends in the prevalence of childhood overweight and obesity in Australia between 1985 and 2008. International Journal of Obesity 34(1):57–66.
Østergaard L, Grøntved A, Børrestad AB, Froberg K, Gravesen M & Andersen LB 2012. Cycling to school is associated with lower BMI and lower odds of being overweight or obese in a large population-based study of Danish adolescents. Journal of Physical Activity and Health 9(5):617–25.
Park MH, Falconer C, Viner RM & Kinra S 2012. The impact of childhood obesity on morbidity and mortality in adulthood: a systematic review. Obesity Reviews 13(11):985–1000.
Parliament of Australia 2008. Protecting Children from Junk Food Advertising (Broadcasting Amendment) Bill 2008. Canberra: Federal Register of Legislation.
Plachta-Danielzik S, Landsberg B, Bosy-Westphal A, Johannsen M, Lange D & Müller MJ 2008. Energy gain and energy gap in normal-weight children: longitudinal data of the KOPS. Obesity 16(4):777–83.
Pont SJ, Puhl R, Cook SR & Slusser W 2017. Stigma experienced by children and adolescents with obesity. Pediatrics 140:e20173034.
PwC Australia 2015. Weighing the cost of obesity: a case for action. Australia: PwC Australia.
Reicks M, Banna J, Cluskey M, Gunther C, Hongu N, Richards R et al. 2015. Influence of parenting practices on eating behaviors of early adolescents during independent eating occasions: implications for obesity prevention. Nutrients 7(10):8783–801.
Reilly JJ & Kelly J 2011. Long-term impact of overweight and obesity in childhood and adolescence on morbidity and premature mortality in adulthood: systematic review. International Journal of Obesity 35(7):891–8.
Richmond KJ, Watson WL, Hughes C & Kelly B 2020. Children’s trips to school dominated by unhealthy food advertising in Sydney, Australia. Public Health Research and Practice 30(1):e3012005.
Roberto CA, Swinburn B, Hawkes C, Huang TTK, Costa SA & Ashe M 2015. Patchy progress on obesity prevention: emerging exemplars, entrenched barriers, and new thinking. Lancet 385(9985):2400–9.
64 References
Roberto CA, Baik J, Harris JL & Brownell KD 2010. Influence of licensed characters on children’s taste and snack preferences. Pediatrics 126(1):88–93.
Russell-Mayhew S, McVey G, Bardick A & Ireland A 2012. Mental health, wellness, and childhood overweight/obesity. Journal of Obesity 2012:281801.
Sacks G, Looi E, Cameron A, Backholer K & Strugnell C 2019. Population-level strategies to support healthy weight: an evidence check rapid review brokered by the Sax Institute (www.saxinstitute.org.au) for Queensland Health, 2019. Sydney: Sax Institute.
Sainsbury E, Colagiuri S & Magnusson R 2017. An audit of food and beverage advertising on the Sydney metropolitan train network: regulation and policy implications. BioMed Central Public Health 17(1):490.
Salmon J, Tremblay MS, Marshall SJ & Hume C 2011. Health risks, correlates, and interventions to reduce sedentary behavior in young people. American Journal of Preventive Medicine 41(2):197–206.
Sanders RH, Han A, Baker JS & Cobley S 2015a. Childhood obesity and its physical and psychological co-morbidities: a systematic review of Australian children and adolescents. European Journal of Pediatrics 174(6):715–46.
Sanders T, Feng X, Fahey PP, Lonsdale C & Astell-Burt T 2015b. Greener neighbourhoods, slimmer children? Evidence from 4423 participants aged 6 to 13 years in the Longitudinal Study of Australian Children. International Journal of Obesity 39:1224–9.
Schwimmer JB, Burwinkle TM & Varni JW 2003. Health-related quality of life of severely obese children and adolescents. JAMA 289(14):1813–9.
Scully M, Wakefield M, Niven P, Chapman K, Crawford D, Pratt IS et al. 2012. Association between food marketing exposure and adolescents’ food choices and eating behaviors. Appetite 58(1):1–5.
Senate Select Committee into the Obesity Epidemic in Australia 2018. Obesity epidemic in Australia: final report. Canberra: Department of the Senate.
Signal LN, Stanley J, Smith M, Barr MB, Chamber TJ, Zhou J et al. 2017. Children’s everyday exposure to food marketing: an objective analysis using wearable cameras. International Journal of Behavioral Nutrition and Physical Activity 14.
Simmonds M, Llewellyn A, Owen CG & Woolacott N 2016. Predicting adult obesity from childhood obesity: a systematic review and meta-analysis. Obesity Reviews 17(2):95–107.
Smithers LG, Haag DG, Agnew B, Lynch J & Sorrell M 2018. Food advertising on Australian television: frequency, duration and monthly pattern of advertising from a commercial network (four channels) for the entire 2016. Journal of Paediatrics and Child Health 54(9):962–7.
Soloff C, Lawrence D & Johnstone R 2005. The Longitudinal Study of Australian Children: LSAC technical paper no. 1—sample design.
Spence AC, Campbell KJ, Lioret S & McNaughton SA 2018. Early childhood vegetable, fruit, and discretionary food intakes do not meet dietary guidelines, but do show socioeconomic differences and tracking over time. Journal of the Academy of Nutrition and Dietetics 118(9): 1634–1643.e1.
Sutin AR, Stephan Y & Terracciano A 2015. Weight discrimination and risk of mortality. Psychological Science 26(11):1803–11.
Swinburn B, Egger G & Raza F 1999. Dissecting obesogenic environments: the development and application of a framework for identifying and prioritizing environmental interventions for obesity. Preventive Medicine 29(6):563–70.
Tan L, Hoe Ng S, Omar A & Karupaiah T 2018. What’s on YouTube? A case study on food and beverage advertising in videos targeted at children on social media. Childhood Obesity 14(5):280–90.
Tasmanian Department of Health 2013. Health promotion across all stages of wellness and disease. Tasmania: Department of Health. Viewed 17 February 2020, https://www.dhhs.tas.gov.au/wihpw/overview_of_health_promotion/health_promotion_across_all_stages_of_wellness_and_disease.
Telford RD, Telford RM & Welvaert M 2019. BMI is a misleading proxy for adiposity in longitudinal studies with adolescent males: the Australian LOOK study. Journal of Science and Medicine in Sport 22(3):307–10.
The Global BMI Mortality Collaboration 2016. Body-mass index and all-cause mortality: individual-participant-data meta-analysis of 239 prospective studies in four continents. Lancet 388(10046):776–86.
Overweight and obesity among Australian children and adolescents 65
The Obesity Collective 2019. Weighing in: Australia’s growing obesity epidemic. Sydney: The Obesity Collective.
Tsiros MD, Olds T, Buckley JD, Grimshaw P, Brennan L, Walkley J et al. 2009. Health-related quality of life in obese children and adolescents. International Journal of Obesity 33(4):387–400.
United Nations 2015. Transforming our world: the 2030 agenda for sustainable development. New York: United Nations.
Usback S, ABS LSAC processing team & ABS Household Survey Methodology team 2018. The Longitudinal Study of Australian Children: LSAC technical paper no. 20—wave 7 weighting and non-response.
Wabitsch M, Moss A & Kromeyer-Hauschild K 2014. Unexpected plateauing of childhood obesity rates in developed countries. BioMed Central Medicine 12(1):17.
Wake M, Nicholson JM, Hardy P & Smith K 2007. Preschooler obesity and parenting styles of mothers and fathers: Australian national population study. Pediatrics 120(6):e1520–7.
Waters E, Seidell J, Swinburn B & Uauy R 2010. Community-based obesity prevention: evidence, practice and policy. Oxford: Blackwell Publishing.
Whitaker KL, Jarvis MJ, Beeken RJ, Boniface D & Wardle J 2010. Comparing maternal and paternal intergenerational transmission of obesity risk in a large population-based sample. American Journal of Clinical Nutrition 91(6):1560–7.
WHO (World Health Organization) 2000. Obesity: preventing and managing the global epidemic. Report of a WHO consultation. World Health Organization Technical Report Series 894. Geneva: WHO.
WHO 2004. Global forum on chronic disease prevention and control (4th, Ottawa, Canada). Geneva: WHO.
WHO 2010. Set of recommendations on the marketing of foods and non-alcoholic beverages to children. Geneva: WHO.
WHO 2013. Global action plan for the prevention and control of noncommunicable diseases 2013–2020. Geneva: WHO.
WHO 2016a. Global non-communicable disease target: halt the rise in obesity. Geneva: WHO.
WHO 2016b. Report of the Commission on Ending Childhood Obesity. Geneva: WHO.
WHO 2018. Global action plan on physical activity 2018–2030: more active people for a healthier world. Geneva: WHO.
Wilson R & Abbott J 2018. Age, period and cohort effects on body mass index in New Zealand, 1997–2038. Australian and New Zealand Journal of Public Health 42(4):396–402.
Woo Baidal JA, Locks LM, Cheng ER, Blake-Lamb TL, Perkins ME & Taveras EM 2016. Risk factors for childhood obesity in the first 1,000 days: a systematic review. American Journal of Preventive Medicine 50(6):761–79.
Woods J, Bressan A, Laneglaan C, Mallon A & Palmermo C 2014. Australian school canteens: menu guideline adherence or avoidance? Health Promotion Journal of Australia 25(2):110–5.
World Cancer Research Fund/American Institute for Cancer Research 2018. Continuous update project expert report 2018. Diet, nutrition and physical activity: energy balance and body fatness.
Xu J, Hardy LL, Guo CZ & Garnett SP 2018. The trends and prevalence of obesity and morbid obesity among Australian school-aged children, 1985–2014. Journal of Paediatrics and Child Health 54(8):907–12.
Yoong SL, Skelton E, Jones J & Wolfenden L 2014. Do childcare services provide foods in line with the 2013 Australian dietary guidelines? A cross-sectional study. Australian and New Zealand Journal of Public Health 38(6):595–6.
Yu M & Baxter 2016. Australian children’s screen time and participation in extracurricular activities. In: Growing Up in Australia: the Longitudinal Study of Australian Children, annual statistical report 2015. Melbourne: AIFS, 99–125.
Zecevic CA, Tremblay L, Lovsin T & Michel L 2010. Parental influence on young children’s physical activity. International Journal of Pediatrics. 2010:468526.
Zheng M, Lamb KE, Grimes C, Laws R, Bolton K, Ong KK et al. 2018. Rapid weight gain during infancy and subsequent adiposity: a systematic review and meta-analysis of evidence. Obesity Reviews 19(3):321–32.
Zheng M, Rangan A, Meertens B & Wu J 2017. Changes in typical portion sizes of commonly consumed discretionary foods among Australian adults from 1995 to 2011–2012. Nutrients 9(6): E577.
66 List of tables and figures
List of tablesTable A1: Classification of overweight and obesity for children and adolescents .................................. 45
Table B1: LSAC waves, years, cohort ages, and sample counts (Waves 1 to 7) ....................................... 49
List of figuresFigure 2.1: Proportion of overweight and obese children and adolescents aged 2–17, by age group
(years) and sex, 2017–18 ............................................................................................................... 5
Figure 2.2: Proportion of overweight and obese persons aged 5 to 85 and over, by age group (years), 2017–18 ........................................................................................................................................... 6
Figure 2.3: Proportion of overweight and obese children and adolescents aged 2–17, by remoteness area, 2017–18.................................................................................................................................. 7
Figure 2.4: Proportion of overweight and obese children and adolescents aged 2–17, by socioeconomic areas, 2017–18................................................................................................ 8
Figure 2.5: Proportion of overweight and obese Indigenous children and adolescents aged 2–17, by age group (years), 2012–13 and 2018–19 ............................................................................... 9
Figure 2.6: Proportion of overweight and obese Indigenous children and adolescents aged 2–17, by age group (years) and sex, 2018–19 ........................................................................................ 9
Figure 2.7: Proportion of overweight and obese children and adolescents aged 2–17, by Indigenous status and age group (years), 2017–18 and 2018–19 ..................................... 10
Figure 2.8: Proportion of obese children and adolescents aged 2–17, by Indigenous status and age group (years), 2017–18 and 2018–19 .................................................................................. 11
Figure 2.9: Proportion of overweight and obese children and adolescents aged 5–17, 1995 to 2017–18 .......................................................................................................................................... 12
Figure 2.10: Proportion of overweight and obese children and adolescents from age 2–3 to age 16–17, 2004 to 2016 .............................................................................................................. 13
Figure 2.11: Proportion of obese children and adolescents from age 2–3 to age 16–17, 2004 to 2016 ................................................................................................................................................ 14
Figure 2.12: Proportion of overweight and obese children and adolescents from age 2–3 to age 16–17, by sex, 2004 to 2016 .................................................................................................15
Figure 2.13: Proportion of obese children and adolescents from age 2–3 to age 16–17, by sex, 2004 to 2016.................................................................................................................................. 15
Figure 2.14: Proportion of overweight and obese children and adolescents from age 2–3 to age 16–17, by socioeconomic group, 2006 to 2016 ................................................................. 16
Figure 2.15: Proportion of obese children and adolescents from age 2–3 to age 16–17, by socioeconomic group, 2006 to 2016 .......................................................................................... 17
Figure 2.16: Proportion of all children and adolescents who changed from normal or underweight to overweight or obese between waves, from age 2–3 to age 16–17, 2004 to 2016 ........... 18
Overweight and obesity among Australian children and adolescents 67
Figure 2.17: Proportion of all children and adolescents who changed from overweight or obese to normal or underweight between waves, from age 2–3 to age 16–17, 2004 to 2016 ........... 19
Figure 2.18: Prevalence of overweight and obesity, by birth cohort and age group................................. 21
Figure 2.19: Prevalence of overweight and obesity, by birth cohort, age group and sex ......................... 21
Figure 2.20: Prevalence of obesity, by birth cohort and age group ............................................................. 22
Figure 2.21: Prevalence of obesity, by birth cohort, age group and sex ..................................................... 23
Figure 3.1: Factors that influence the development of overweight and obesity in children and adolescents .................................................................................................................................... 25
Related publicationsThe following AIHW publications relating to overweight and obesity might also be of interest:
• AIHW 2020. A framework for monitoring overweight and obesity in Australia 2020. Cat. no. PHE 272. Canberra: AIHW.
• AIHW 2020. Overweight and obesity in Australia: an updated birth cohort analysis. Cat. no. PHE 268. Canberra: AIHW.
• AIHW 2019. Overweight and obesity: an interactive insight. Cat. no. PHE 251. Canberra: AIHW.
• AIHW 2017. A picture of overweight and obesity in Australia 2017. Cat. no. PHE 216. Canberra: AIHW.
• AIHW 2017. Impact of overweight and obesity as a risk factor for chronic conditions: Australian Burden of Disease Study. Australian Burden of Disease Study series no. 11. Cat. no. BOD 12. Canberra: AIHW.
Overweight and obesity affects 25% of Australian children and adolescents, and is associated with poorer health and wellbeing and higher health-care costs. Some children and adolescents are more likely to be overweight or obese, such as Indigenous children and children living in disadvantaged areas. Many factors contribute to the development of overweight and obesity, including environmental influences and individual behaviours.
Stronger evidence, better decisions, improved health and welfare
Overweight and obesity among Australian children and adolescents
Related Documents