ROCK COUNTY BOND RATING DATA: 8/13 – 12/14 ____________________________________________________________________________________________ 1 OVERVIEW Rock County’s current population of 160,104 (2014 final estimate) continues to rank among Wisconsin’s largest counties. Moderate population growth, as measured by comparative Census data, is directly attributed to the County’s close proximity to larger, metropolitan locations such as Madison, Milwaukee, Rockford and Chicago. By leveraging these geographic, industry and transportation linkages – and then capitalizing on the area’s lower cost of living - Rock County has positioned itself as a growth and investment benefactor. Although the aftermath of the 2008-2009 economic downturn had a direct impact on equalized property values throughout Wisconsin, signs of upward movements have emerged locally. As a matter of fact, Rock County is one of only eight WI Counties that have reported property valuation increases of four percent or greater (see Figures 1.1 – 1.5). These gains are not only attributed to a rebounding residential market, but also to stable-to-growing commercial and industrial segments, as well. Figure 1.1 Source: Wisconsin Taxpayers Association; Wisconsin Department of Revenue

Welcome message from author
This document is posted to help you gain knowledge. Please leave a comment to let me know what you think about it! Share it to your friends and learn new things together.
Transcript

ROCK COUNTY BOND RATING DATA: 8/13 – 12/14 ____________________________________________________________________________________________
1
OVERVIEW Rock County’s current population of 160,104 (2014 final estimate) continues to rank among Wisconsin’s largest counties. Moderate population growth, as measured by comparative Census data, is directly attributed to the County’s close proximity to larger, metropolitan locations such as Madison, Milwaukee, Rockford and Chicago. By leveraging these geographic, industry and transportation linkages – and then capitalizing on the area’s lower cost of living - Rock County has positioned itself as a growth and investment benefactor. Although the aftermath of the 2008-2009 economic downturn had a direct impact on equalized property values throughout Wisconsin, signs of upward movements have emerged locally. As a matter of fact, Rock County is one of only eight WI Counties that have reported property valuation increases of four percent or greater (see Figures 1.1 – 1.5). These gains are not only attributed to a rebounding residential market, but also to stable-to-growing commercial and industrial segments, as well.
Figure 1.1
Source: Wisconsin Taxpayers Association; Wisconsin Department of Revenue

ROCK COUNTY BOND RATING DATA: 8/13 – 12/14 ____________________________________________________________________________________________
2
Figure 1.2
Source: Wisconsin Department of Revenue
Figure 1.3
Source: Wisconsin Department of Revenue
Figure 1.4
Source: Wisconsin Department of Revenue

ROCK COUNTY BOND RATING DATA: 8/13 – 12/14 ____________________________________________________________________________________________
3
Figure 1.5
Source: Wisconsin Department of Revenue
Not surprisingly, the County’s residential activities continue to mirror national trends. That is, while (new) single-family home starts remain considerably lower than pre-Great Recession years, the number of permits issued annually is incrementally trending upward. Price-points and transaction volumes are rising, as well (see Figures 1.6 – 1.8). Coupled with a steady volume of “alteration or addition” work, the area’s residential market is holding its own (see also the Project Highlights section). When cross-referenced with monthly sales tax receipts, as well as commentary received from home improvement related businesses, there is more than ample evidence documenting these improving residential trends.
Figure 1.6
Source: McGraw-Hill Construction Information Group

ROCK COUNTY BOND RATING DATA: 8/13 – 12/14 ____________________________________________________________________________________________
4
Figure 1.7
$- $20,000 $40,000 $60,000 $80,000
$100,000 $120,000 $140,000 $160,000
Pri
ce
Po
ints
Year
Rock County Housing Sales Data
AverageSale Price
MedianSale Price
Source: Wisconsin Realtors Association & SC WI MLS Corp.
Figure 1.8
- 500
1,000 1,500 2,000 2,500 3,000 3,500 4,000 4,500 5,000
Nu
mb
er
of
Lis
tin
gs
& S
ale
s
Year
Rock County Housing Activity
# of Home Sales
# of New Listings
# of Month EndListings
Source: Wisconsin Realtors Association & SC WI MLS Corp. Despite these positive residential market gains, foreclosure rates remain a challenging proposition for homeowners, financial institutions and local governments alike. From a regional perspective, particularly with locations that share common demographics, commuting patterns and economic base characteristics, similar foreclosure patterns exist. Fortunately, foreclosure activities in the Janesville-Beloit MSA are continually moving in the right direction. These same trends are evident with regards to the area’s bankruptcy filings, as well (see Figures 1.9 - 1.10).

ROCK COUNTY BOND RATING DATA: 8/13 – 12/14 ____________________________________________________________________________________________
5
Figure 1.9
Source: CoreLogic
Figure 1.10
Source: U.S. District Court, Western Division-WI; Rock County Clerk of Courts
Overall and despite somewhat anemic economic conditions at the national and/or regional levels, signs of improvement are continually surfacing throughout Rock County. For example, the County’s Sales & Use collections - which serves as one indicator of consumer confidence - continue to gain steam. As a matter of fact, year-end collections for 2013 and 2014 established new records: $10.6 Million and $11.8 Million, respectively (see Figure 1.11 – Figure 1.13).

ROCK COUNTY BOND RATING DATA: 8/13 – 12/14 ____________________________________________________________________________________________
6
Annual Tourism Expenditure data, as reported by the Wisconsin Department of Tourism, provides another type consumer confidence lens. Although extended historical expenditure comparisons are not available due to data collection methodological changes deployed by the Department of Tourism, the YR 2010–2013 figures clearly show Rock County’s gains. For example, Rock County’s 2013 annual tourism expenditures were over $193 Million: representing a gain of slightly over four percent from the previous year’s totals (see Figures 1.12 – 1.13).
Figure 1.11
Source: Wisconsin Department of Revenue
Figure 1.12
$-
$50
$100
$150
$200
$250
2010 2011 2012 2013
Mill
ion
s o
f D
olla
rs
Year
Rock County Annual Tourism Expenditures
Source: Wisconsin Department of Tourism

ROCK COUNTY BOND RATING DATA: 8/13 – 12/14 ____________________________________________________________________________________________
7
Figure 1.13
Top 20 WI County Tourism Expenditures
2013 Rank County Total Expenditures (Millions of Dollars) % Change from 2012
1 Milwaukee $1,691.87 3.40
2 Dane $1,043.80 7.45
3 Sauk $888.48 3.65
4 Waukesha $664.85 5.37
5 Brown $557.68 1.25
6 Walworth $477.57 4.94
7 Outagamie $300.11 4.80
8 Door $299.01 3.45
9 Marathon $228.65 5.29
10 Winnebago $219.04 5.59
11 Racine $216.46 3.70
12 La Crosse $214.43 4.10
13 Vilas $203.14 3.95
14 Sheboygan $198.92 4.01
15 Oneida $196.96 5.97
16 Eau Claire $195.80 3.70
17 Rock $193.08 4.05
18 Adams $185.70 5.31
19 Kenosha $167.84 3.73
20 Marinette $138.06 2.86
Source: Wisconsin Department of Tourism
THE STATE OF THE ECONOMY Every year since the Great Recession, Rock County’s unemployment and industrial vacancy rates have declined (see Figures 1.14 - 1.17). For example, the 2014 annual average unemployment for the Janesville-Beloit MSA was 6.5%: its lowest rate in the last six years. Meanwhile, the County’s vacancy rate is experiencing near record lows at 5.5%. Overall, these rates are tracking at or below neighboring MSA locations.
Figure 1.14
Source: Wisconsin Department of Workforce Development.

ROCK COUNTY BOND RATING DATA: 8/13 – 12/14 ____________________________________________________________________________________________
8
Figure 1.15
Source: Bureau of Labor Statistics
Figure 1.16
0
2
4
6
8
10
12
14
2008 2009 2010 2011 2012 2013 2014
Pe
rce
nt
Year
Industrial Vacancy Rates: By US Region
US Northeast Midwest South West
Source: Cassidy Turley
Figure 1.17
Source: Cassidy Turley; McGuire Mears & Associates

ROCK COUNTY BOND RATING DATA: 8/13 – 12/14 ____________________________________________________________________________________________
9
Growth within the County’s industrial and warehousing sectors, as well as gains from those firms representing the professional and business services sector, are collectively driving down the area’s unemployment and vacancy rates. For example, during 2013-2014 over 620,000 SF of formerly vacant square footage has been leased and/or renovated. During this same time frame, over one million square feet of new space has been constructed (or planned) throughout the County. These projects (including those defined as in-progress, completed and/or announced) account for nearly 580 jobs and represent over $917 Million in new capital investment. A sampling of these projects is provided below. In the manufacturing sector, a number of privately held firms that supply the construction, machinery, medical, packaging and transportation segments made significant investment commitments throughout Rock County. In 2013, Miniature Precision Components and Universal Acoustic Emission Technologies committed to lease approximately 220,000 SF. Meanwhile, United Alloy broke ground on their 112,500 SF addition. Then in 2014, United Alloy announced another 40,000 SF addition. Other manufacturing firms announcing large-scale projects in 2014 included Charter NEX Films (20,000 SF), Chicago Fittings Corporation (30,000 SF) and Pratt Industries – who will construct a 350,000 SF corrugated box manufacturing production facility in Beloit’s Gateway Business Park. In terms of activity within the logistics market, Cummins (110,000 SF), Kenco (30,000 SF), Impact Confections (40,000 SF), Rock Paint (20,000 SF) and Woodman’s Market added warehousing / distribution capacities during 2013. Then in 2014, Axium Foods (110,000 SF), IPM Foods (72,590) and Woodman’s Market (31,369) boosted their Janesville-Beloit MSA logistical footprints, respectively. One of the more interesting developments during the last two years, however, has been the growth among those firms that operate within the professional and business services sector. Commitment from such firms as State Collection Service (5,000 SF) and AccuLynx (12,000 SF), as well as others, are responsible for contributing toward the area’s pacesetting Gross Domestic Product (GPD) figures. Per a recent U.S. Bureau of Economic Analysis report, Rock County’s 6% GDP jump from 2012-2013 ranked among the nation’s Top 25. Another notable project, albeit in the energy sector, involves Alliant Energy’s commitment to add a 650 megawatt combined cycle, natural gas turbine plant to its Riverside Energy Center campus. On the retail and hospitality side, a number of outlot developments (ranging from 5,000 to 15,000 SF +/-) have emerged throughout the County’s commercial corridors. Meanwhile, others such as Dick’s Sporting Goods (45,000 SF), have opted to occupy or reuse existing footprints that have been vacated by other retailers. For additional development information and aggregate data, see the following section.

ROCK COUNTY BOND RATING DATA: 8/13 – 12/14 ____________________________________________________________________________________________
10
ROCK COUNTY DEVELOPMENT PROJECT HIGHLIGHTS The data provided below highlights the commercial / industrial, residential and public works projects that have either advanced or been announced during the period of August 1, 2013 through December 31, 2014.
City / Town of Beloit
Residential permits for accessory structures, additions, alternations and/or new construction numbered nearly 1,150 and accounted for a combined value of $4.4 Million.
Commercial / industrial permits for accessory structures, additions, alternations and/or new construction numbered over 300 with an estimated combined value over $39.4 Million.
Public works and/or infrastructure projects totaled over $1 Million.
April 2014 the City of Beloit was rated A+ (S&P); the School District of Beloit was rated A1 by Moody’s (June 2014).
Village of Clinton / Village of Footville / Village of Orfordville
Residential permits for accessory structures, additions, alternations and/or new construction had an estimated combined value over $250,000.
Commercial / industrial permits for accessory structures, additions, alternations and/or new construction were valued over $1.75 Million.
Public works and/or infrastructure projects totaled nearly $250,000.
City of Edgerton
Residential permits for accessory structures, additions, alternations and/or new construction numbered 20 with an estimated combined value of $2.35 Million.
Commercial / industrial permits for accessory structures, additions, alternations and/or new construction had an estimated combined value of $331,000.
Public works and/or infrastructure projects totaled approximately $230,000.
Nov. 2012 Moody’s rated the City A1 and the School District (Jan. 2013) Aa3.

ROCK COUNTY BOND RATING DATA: 8/13 – 12/14 ____________________________________________________________________________________________
11
City of Evansville
Residential permits for accessory structures, additions, alternations and/or new construction activities were valued over $3.4 Million
Commercial / industrial permits for accessory structures, additions, alternations and/or new construction activities were valued over $3.28 Million.
Public works and/or infrastructure projects totaled approximately $200,000.
January 2013 the City was rated A+ (S&P).
City of Janesville
Residential permits for accessory structures, additions, alternations and/or new construction numbered 451 with an estimated combined value over $20.54 Million.
Commercial / industrial permits for accessory structures, additions, alternations and/or new construction numbered 250 with an estimated combined value over $72.77 Million.
Public works and/or infrastructure projects totaled over $12 Million.
August 2014 the City was rated AA (S&P).
City of Milton
Residential permits for accessory structures, additions, alternations and/or new construction activities were valued over $1.17 Million.
Commercial / industrial permits for accessory structures, additions, alternations and/or new construction activities were valued over $16.6 Million.
Public works and/or infrastructure projects totaled approximately $2.5 Million
August 2013 the City was rated A1 (Moody’s).

ROCK COUNTY BOND RATING DATA: 8/13 – 12/14 ____________________________________________________________________________________________
12
THE FORECAST Diversification, stability and incremental growth continue to represent the most accurate depiction of Rock County’s economy. While the road to recovery from the Great Recession has been a long journey, the amount of progress achieved to date by the Janesville-Beloit MSA progress has been quite remarkable. Industrial vacancies have been reduced; construction activities, across all segments, are moving in the right direction; foreclosures and bankruptcies are down; residential transactions and price points are trending upward; local cash registers are ringing really strong; and existing businesses and new investments are providing family-supporting employment opportunities, as well as tax revenues, for the local coffers (see Figure 1.18 – 1.19).
Figure 1.18
Source: Bureau of Labor Statistics
The County’s coordinated economic development repositioning / revitalization efforts, in conjunction with a host of non-local variables, are continually paying dividends. The fruits of this labor are evidenced by the quality, diversity and quantity of projects that flow throughout the Janesville-Beloit MSA. Moreover, pacesetting and demand drive K-16 workforce investments are providing additional, value-added initiatives to keep this economic momentum moving forward. As businesses continually rationalize facility needs, assess operational efficiencies and balance long-term solutions, Rock County is frequently making the proverbial “consideration list”. Supply chain / logistics considerations, an abundant workforce, a healthy supply of right-sized real estate offerings and an improved (state) business climate are increasingly positioning Rock County as a choice location. Coupled with the public sector’s consistent commitment to undertake critical infrastructure projects, the County’s physical asset base remains strong. Based upon conservative forecasts, the economic dashboard indicators suggest that the County is well positioned to experience continued and incremental economic growth.
ROCK COUNTY BOND RATING DATA: 8/13 – 12/14 ____________________________________________________________________________________________
13
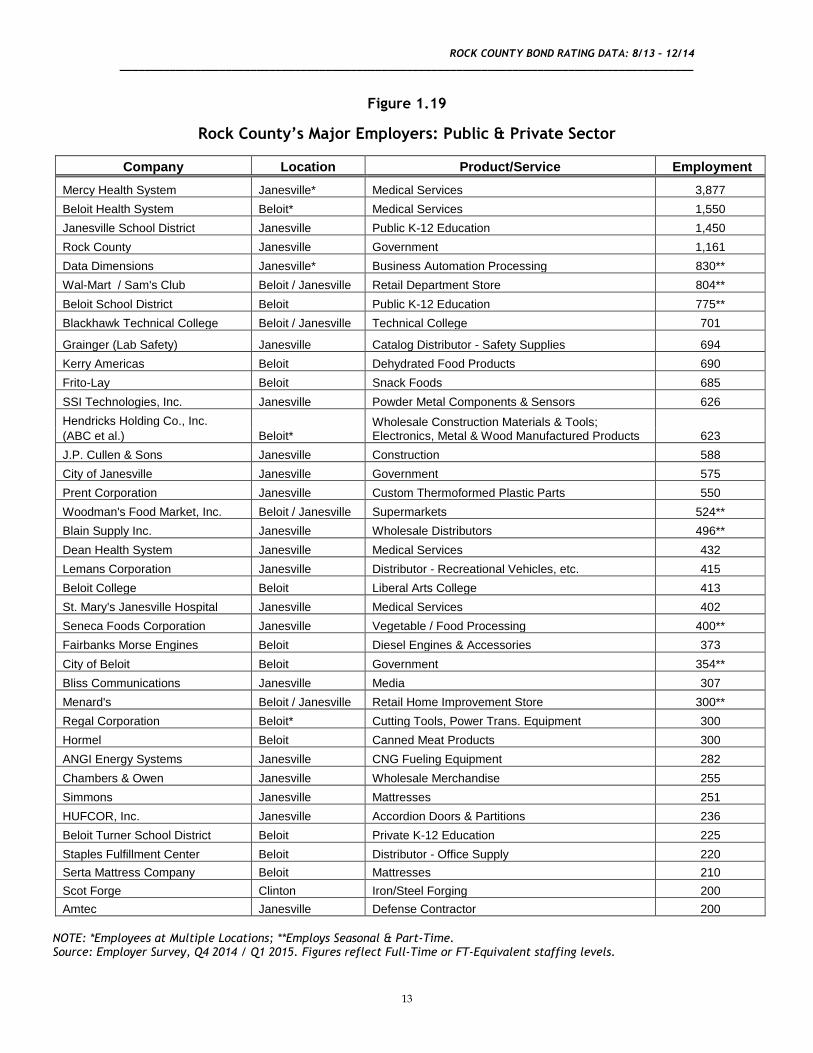
Figure 1.19
Rock County’s Major Employers: Public & Private Sector
Company Location Product/Service Employment
Mercy Health System Janesville* Medical Services 3,877
Beloit Health System Beloit* Medical Services 1,550
Janesville School District Janesville Public K-12 Education 1,450
Rock County Janesville Government 1,161
Data Dimensions Janesville* Business Automation Processing 830**
Wal-Mart / Sam's Club Beloit / Janesville Retail Department Store 804**
Beloit School District Beloit Public K-12 Education 775**
Blackhawk Technical College Beloit / Janesville Technical College 701
Grainger (Lab Safety) Janesville Catalog Distributor - Safety Supplies 694
Kerry Americas Beloit Dehydrated Food Products 690
Frito-Lay Beloit Snack Foods 685
SSI Technologies, Inc. Janesville Powder Metal Components & Sensors 626
Hendricks Holding Co., Inc.
Beloit* Wholesale Construction Materials & Tools; Electronics, Metal & Wood Manufactured Products 623 (ABC et al.)
J.P. Cullen & Sons Janesville Construction 588
City of Janesville Janesville Government 575
Prent Corporation Janesville Custom Thermoformed Plastic Parts 550
Woodman's Food Market, Inc. Beloit / Janesville Supermarkets 524**
Blain Supply Inc. Janesville Wholesale Distributors 496**
Dean Health System Janesville Medical Services 432
Lemans Corporation Janesville Distributor - Recreational Vehicles, etc. 415
Beloit College Beloit Liberal Arts College 413
St. Mary's Janesville Hospital Janesville Medical Services 402
Seneca Foods Corporation Janesville Vegetable / Food Processing 400**
Fairbanks Morse Engines Beloit Diesel Engines & Accessories 373
City of Beloit Beloit Government 354**
Bliss Communications Janesville Media 307
Menard's Beloit / Janesville Retail Home Improvement Store 300**
Regal Corporation Beloit* Cutting Tools, Power Trans. Equipment 300
Hormel Beloit Canned Meat Products 300
ANGI Energy Systems Janesville CNG Fueling Equipment 282
Chambers & Owen Janesville Wholesale Merchandise 255
Simmons Janesville Mattresses 251
HUFCOR, Inc. Janesville Accordion Doors & Partitions 236
Beloit Turner School District Beloit Private K-12 Education 225
Staples Fulfillment Center Beloit Distributor - Office Supply 220
Serta Mattress Company Beloit Mattresses 210
Scot Forge Clinton Iron/Steel Forging 200
Amtec Janesville Defense Contractor 200
NOTE: *Employees at Multiple Locations; **Employs Seasonal & Part-Time. Source: Employer Survey, Q4 2014 / Q1 2015. Figures reflect Full-Time or FT-Equivalent staffing levels.
Related Documents