University of Pennsylvania ScholarlyCommons PSC Working Paper Series Population Studies Center 8-31-2010 Out of Sync? Demographic and Other Social Science Research on Health Conditions in Developing Countries Jere R. Behrman University of Pennsylvania, [email protected] Julia A. Behrman International Food Policy Research Institute Nykia M. Perez University of Pennsylvania, [email protected] Suggested Citation: Behrman, Jere R., Behrman, Julia A., and Nykia M. Perez. 2010. "Out of Sync? Demographic and Other Social Science Research on Health Conditions in Developing Countries." PSC Working Paper Series, PSC 10-07. This paper is posted at ScholarlyCommons. http://repository.upenn.edu/psc_working_papers/22 For more information, please contact [email protected].

Welcome message from author
This document is posted to help you gain knowledge. Please leave a comment to let me know what you think about it! Share it to your friends and learn new things together.
Transcript
University of PennsylvaniaScholarlyCommons
PSC Working Paper Series Population Studies Center
8-31-2010
Out of Sync? Demographic and Other SocialScience Research on Health Conditions inDeveloping CountriesJere R. BehrmanUniversity of Pennsylvania, [email protected]
Julia A. BehrmanInternational Food Policy Research Institute
Nykia M. PerezUniversity of Pennsylvania, [email protected]
Suggested Citation:Behrman, Jere R., Behrman, Julia A., and Nykia M. Perez. 2010. "Out of Sync? Demographic and Other Social Science Research on Health Conditionsin Developing Countries." PSC Working Paper Series, PSC 10-07.
This paper is posted at ScholarlyCommons. http://repository.upenn.edu/psc_working_papers/22For more information, please contact [email protected].

1
Out of Sync?
Demographic and Other Social Science Research
on Health Conditions in Developing Countries
by
Jere R. Behrman, Julia A. Behrman and Nykia M. Perez*
August 2010
Corresponding author: Jere R. Behrman, Economics, McNeil 160, 3718 Locust Walk, University
of Pennsylvania, Philadelphia, PA 19104-6297, USA, 1 215 898 7704,
Overall word count: 7,912
Main text body word count: 6,055
Keywords: health, developing countries, HIV/AIDS, non-communicable diseases, injuries,
DALYs, research priorities
*The authors, respectively, are William R, Kenan, Jr. Professor of Economics and Research
Associate of the Population Studies Center; Senior Research Assistant International Food Policy
Research Institute; and Director of Information Services at the Population Studies Center, all at
the University of Pennsylvania.
2
Abstract: A framework is presented for consderng for what health conditions in developing
countries the marginal social benefits of demographic and social science research are likely to
be relatively high. Based on this framework, it is argued that the relative current and future
predicted prevalence of burdens of different health/disease conditions as measured by Disability-
Adjusted-Life-Years (DALYs) represent fairly well some important factors related to the relative
marginal social benefits of demographic and social science research on different health
conditions. World Health Organization (WHO) DALYs projections for 2005-30 are compared
with (a) demographic and other social science studies on health in developing countries during
1990-2005 and (b) presentations at the Population Association of America annual meetings
during the same time period. These comparisons suggest that, recent demographic and social
science research on health in developing countries has overfocused substantially relatively on
HIV/AIDS and underfocused substantially relatively on non-communicable diseases.
3
1. Introduction
Health is of considerable interest in itself because of its intrinsic value, with improved health
adding directly to people’s welfare. Improved health also may have considerable instrumental
importance if better health saves resources for other uses that otherwise would have been used to
deal with morbidity and if better health increases productivity. Recent estimates suggest that
benefit/cost ratios for a number of investments in better health and nutrition in developing
countries are considerable, and indeed probably rank very high among a wide range of
alternative investments in the developing world (e.g., Lomborg 2004, Copenhagen Consensus
2008). Further, health may be intertwined closely with a range of demographic concerns
including mortality, fertility, migration, marriage and labor force participation. For such reasons,
health in developing countries long has been of interest to demographic and other social science
researchers.
But health in developing countries is a very broad topic. And resources, both in terms of finances
and in terms of researchers’ time, for demographic and other social science research (hereafter,
“social science research) on health in developing countries are limited. Therefore the question of
how well are these resources allocated is important.
We address some important dimensions of this question in this paper. In Section 2 we provide a
framework for thinking about what is the socially optimal distribution of social science research
resources among health conditions in developing countries. In Section 3 we describe the
distribution of recent social science research on health in developing countries in terms of the
three aggregate disease/health conditions categories used by the Global Burden of Disease/World
4
Health Organization (GBD/WHO): (1) communicable, maternal, perinatal and nutritional
conditions (CMPNC), (2) non-communicable diseases (NCD), with disaggregation to separate
out HIV/AIDS, and (3) injuries. In Section 4 we describe the projected levels and changes in
health/disease categories in the developing world. In Section 5 we describe how
these/health/disease categories relate to social science research on health in developing countries.
Before turning to the analysis, to lessen possible confusion it is useful to note explicitly two
points about the emphasis in this paper versus other possible emphases. The emphasis in this
paper is on the use of resources for research in demography and other social sciences on various
health conditions in developing countries. (1) A separate and previously more-examined
question is the allocation of resources for prevention and care among various health conditions
in developing countries (e.g., Shiffman, Beer and Wu 2002; Suhrcke et al. 2005; England 2007;
Halperin 2008). The answer to the latter question need not be closely related to the answer to the
less-researched question of interest in this study. It is possible, for example, that the expected
rates of returns to basic (social science and/or biomedical) research on some health conditions
are high because so little is known about them, but the rates of return to preventative and curative
measures for these health conditions are very low until there are more advances in basic research.
(2) A second separate question from the interest of this paper is what is the best allocation of
resources for biomedical research on various health conditions in developing countries. This is
an interesting and important, but definitely separate question. It might be the case, for example,
that results from biomedical research on certain health conditions in developed countries transfer
readily to developing country conditions, but social science research does not transfer because of
the considerable differences in markets, policies, resources and culture.
5
2. Framework for Thinking about the Socially Optimal Distribution
of Social Science Research Among Health Conditions in Developing
Countries
We adopt a very simple perspective about what determines the optimal number of social science
studies on different health conditions in developing countries, additional to whatever social
science studies have already occurred.
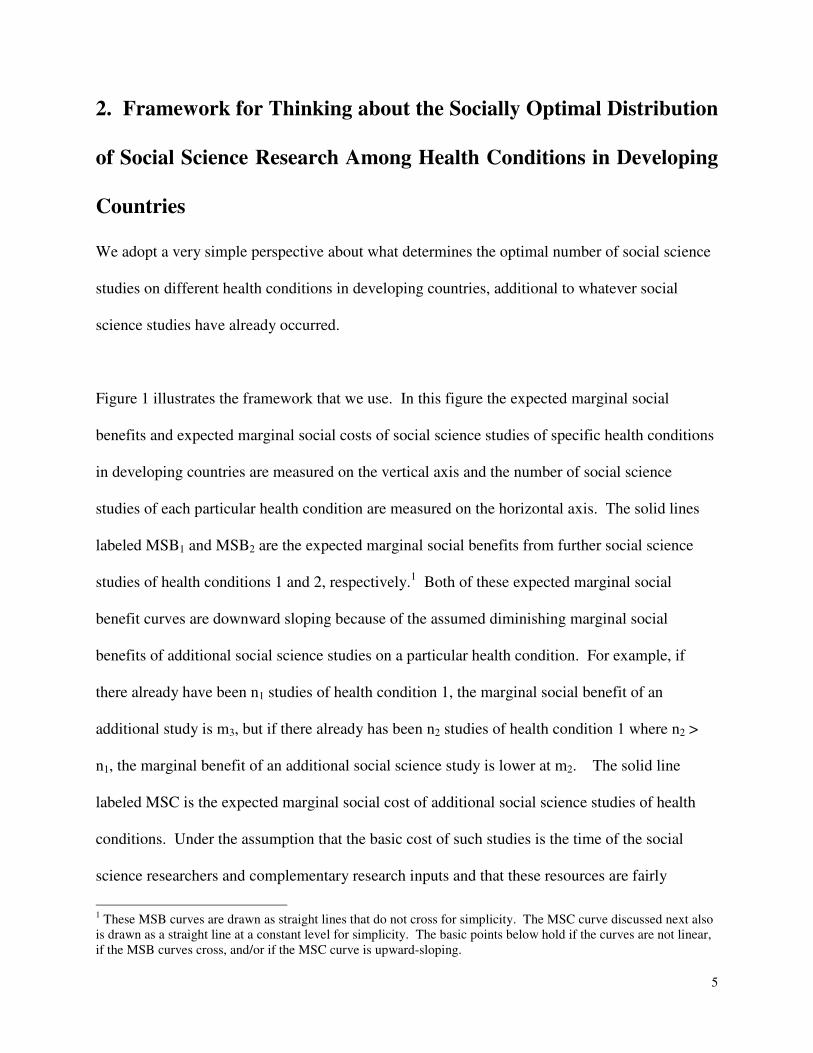
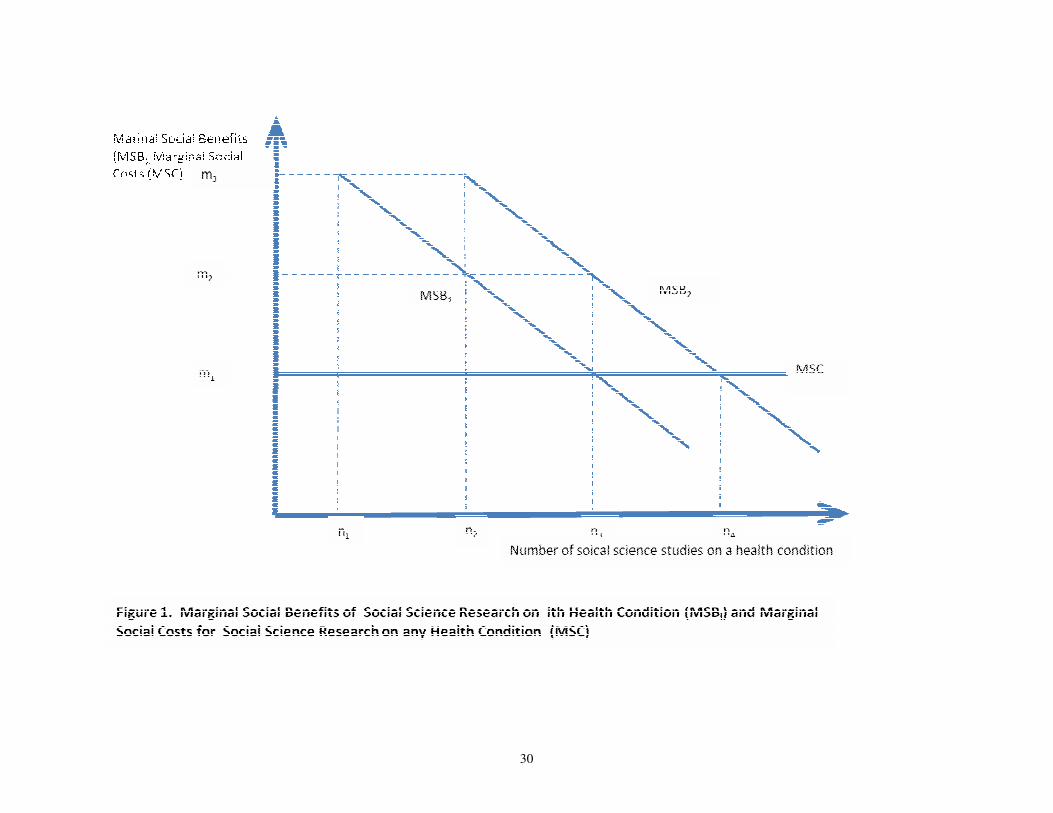
Figure 1 illustrates the framework that we use. In this figure the expected marginal social
benefits and expected marginal social costs of social science studies of specific health conditions
in developing countries are measured on the vertical axis and the number of social science
studies of each particular health condition are measured on the horizontal axis. The solid lines
labeled MSB1 and MSB2 are the expected marginal social benefits from further social science
studies of health conditions 1 and 2, respectively.1 Both of these expected marginal social
benefit curves are downward sloping because of the assumed diminishing marginal social
benefits of additional social science studies on a particular health condition. For example, if
there already have been n1 studies of health condition 1, the marginal social benefit of an
additional study is m3, but if there already has been n2 studies of health condition 1 where n2 >
n1, the marginal benefit of an additional social science study is lower at m2. The solid line
labeled MSC is the expected marginal social cost of additional social science studies of health
conditions. Under the assumption that the basic cost of such studies is the time of the social
science researchers and complementary research inputs and that these resources are fairly
1 These MSB curves are drawn as straight lines that do not cross for simplicity. The MSC curve discussed next also
is drawn as a straight line at a constant level for simplicity. The basic points below hold if the curves are not linear,
if the MSB curves cross, and/or if the MSC curve is upward-sloping.
6
fungible across studying different health conditions in developing countries and across many
other topics, the MSC curve is approximately linear at m1. Under these assumptions, the
socially optimal distribution of social science studies for any one health condition is where the
expected marginal social benefit equals the expected marginal social costs, or for n3 studies for
health condition 1 in the figure. If there are fewer than n3 studies of this health condition, say n2
studies, the expected marginal social benefits (m2) are greater than the expected marginal social
costs (m1) so more benefits than costs are obtained by increasing the number of studies until the
level n3 – and vice versa if there are more than n3 studies. Therefore in this simple case the
optimal number of social science studies across health conditions depends only on how the
expected marginal social benefits differ across health conditions, with the optimal number for
health condition 2 at n4 in the figure at a higher level than the optimal number for health
condition 1 at n3 because the expected marginal social benefits of more studies for health
condition 2 are greater than the expected marginal social benefits for more studies for health
condition 1 at any given level of studies in the figure.
The relative desirability at a point of time of further demographic social science research
can be decomposed of two factors: movements along given MSB curves and different locations
of different MSB curves. (1) Movements along a given MSB curve: We define the knowledge
gap for a given health condition to be the difference between the number of studies to date (say,
n1 for health condition 1 in Figure 1) and the optimal number of studies for that health condition
(n3), so that the knowledge gap for health condition 1 is n3 -n1. (2) Different locations of MSB
curves for different health conditions:2 The MSB for one health condition may be higher than
2 These same factors, of course, determine whether the MSB curve for any health condition movers away from or
closer to the origin over time.
7
that for another (as MSB2 is higher for MSB1 for any given number of studies in Figure 1) for a
number of reasons, some major examples of which are:
• Higher future prevalence of a health condition, ceteris paribus, means that any useful
insight from social science research on the health condition will be applicable to more
individuals than would be the case for health conditions with very limited prevalence.
The basic idea is the standard one that there are likely to be increasing returns to scale or
public goods characteristics for research. Therefore the marginal social benefits are
likely to be larger, ceteris paribus, for social science research on a widespread health
condition such as malaria than on a health condition with much smaller prevalence such
as Ebola. The relevant prevalence would seem to be forward-looking, reflecting both
current prevalence and the expected future development of prevalence.
• Greater loses due to the health condition means that the welfare gains from contributions
of social science research are likely to be greater. This may be the case because of a
combination of several factors, including the severity of the health condition, its impact
on productivities in addition to its impact on welfare, and the duration of healthy life lost
because of the health condition. The gains are likely to be greater, ceteris paribus, for
example for studies of HIV/AIDS than for the common cold because of the greater
severity, the greater impacts on productivity per infected person, and the greater potential
loss of healthy life years.
8
• Greater diversity of contexts with regard to markets, policies, culture and resources
ceteris paribus increases the value of social science research on a particular health
condition. Just because there is considerable social science research on obesity in
Manhattan, for example, may not mean and, if fact, is not likely to mean that the value of
social science research on obesity is very limited in Mexico or South Africa. This is the
case because market, policy, cultural and resource contexts are so different that the social
science research on Manhattan is not likely to transfer well (have much external validity)
for Mexico or South Africa. Note that this factor is likely to counterbalance to a degree
the first one on prevalence if wider prevalence is accompanied by wider variations in
contexts. As noted in the introduction, social science research may differ from
biomedical research in this regard. There may be contexts, say between high per capita
and low per capita income countries, across which the results of biomedical research
transfer well but not the results of social science research because of the different
institutions and resources.
• Greater relevance of social science research because of greater importance of individual
and governmental behaviors in determining susceptibility and impacts of health
condition. If there were a health condition for which one’s susceptibility and the health
condition’s impact were independent of all current and potential individual and
governmental behaviors, the marginal benefits of social science research on this health
condition would seem to be very low in terms of improving society’s capacities for
dealing with the health condition, though social science research would still be
informative about the impacts of the health conditions. But for most, arguably all, health
9
conditions there are considerable individual and governmental behaviors that affect
susceptibilities and impacts. For example, individual behaviors affect exposure to
infectious health conditions through sanitation and hygienic practices and water
preparation, probabilities of obtaining chronic health conditions through diets, physical
affectivities and exposure to carcinogens, and probabilities of injuries. Likewise
governmental policies affect the susceptibilities and impacts of infectious diseases,
chronic diseases and injuries through a range of actions from infrastructure investments
to information campaigns to regulations that may limit exposures to disease risks to
public subsidies for preventative and curative health. While undoubtedly the relative
impact of these behaviors may differ among specific health conditions, we do not have
strong priors that they differ greatly among broad health condition categories such as
communicable diseases, chronic diseases, and injuries.
Factors such as these mean that there is a gap between the optimal number of studies for health
condition 1 and health condition 2 that is equal to n4 – n3. There undoubtedly are other important
factors particularly for specific health conditions, but these four seem to be among the important
general determinants of the locations of the marginal benefit curves for social science research
on health conditions that hold across most health conditions.
Therefore the relative desirability of undertaking future social science research at a given point
of time depends on the combination of these two effects for the alternative health conditions
being considered – where we are on each MSB curve and the relative location of the MSB
curves. To compare the expected relative gains from undertaking research for health condition 1
versus health condition 2 in Figure 1, for example, depends on (1) what are the starting points on
10
the declining MSB curves because of previous research and (2) what are the relative locations of
the two curves. For example, if the starting point for condition 1 is n2 and for condition 2 also is
n2, there is an advantage of concentrating the next study on health condition 2 because MSB2 >
MSB1 for additional studies immediately beyond n2. This does not mean that it is optimal to
focus exclusively on health condition 2 with more and more studies because as there are more
studies of health condition 2 there is movement down the MSB2 curve until a point like n3 at
which the MSB2 is equal to the MSB1 at n2 and beyond which MSB2 < MSB1 so that once
studies of health condition have expanded to n3 the socially optimal allocations of the next
studies include some to health condition 1.
We note that relative private incentives for social scientists to undertake research on different
health conditions in developing countries almost surely overlap in some important respects with
the factors underlying the relative marginal social benefits for undertaking research on different
health conditions. Many social scientists, for example, may be interested in how much their
research contributes to the “social good,” and their perception of social good may be highly
correlated with factors such as discussed above with regard to current positions on the marginal
social benefit curves or relevant locations of the marginal social benefits curves for various
health conditions. But there also may be some important differences between the private and the
social incentives for research. Most social scientists perceive that their financial rewards and
reputational gains are important, and these may lead to decisions to invest their research efforts
in ways that differ from the considerations underlying the positions on and locations of the
marginal social benefits. For instance, there may be substantial financial and reputational
rewards from being among the first to investigate some new phenomenon whether or not the
11
marginal social gains are large. Also the resources for social scientists for investigating different
health conditions may differ substantially from those suggested by the social marginal benefits
because of private interests of the funders (whether private or public entities) may differ from the
global social interests of developing countries. For instance, national funders of social science
research in a high-income country may have interests in investigating health conditions in
developing countries more in cases in which the health conditions also are prominent in their
societies than other health conditions that are not common in their own countries. Or for another
example, private pharmaceutical firms may be much more interested in supporting social science
research on health conditions for which the potential drug markets are relatively large because of
a combination of disease prevalence and strong patent protection even if the marginal social
benefits are not relatively large.
3. What has been the Focus of Recent Demographic and Other
Social Science Research on Health in Developing Countries?
To characterize recent demographic and other social science research on health in developing
countries we first conducted a search using two online databases: (a) Sociological Abstracts
(http://www.csa.com/factsheets/socioabs-set-c.php) and (b) EconLit, the American Economic
Association’s electronic bibliographic database (http://www.econlit.org).3 These online
3 We selected these two databases because of the breadth of their coverage on demographic and social science
research on health in developing countries. They certainly involve some selectivity as do all alternatives, but we
perceive that their breadth, as well as their prominence in their disciplines are strong points. Alternatives are not as
satisfactory with regard to selectivity for the purpose of this paper. Pubmed, for example, includes medical as well
as social science research, does not cover a number of social science journals related to demography and in some
cases only indexes a select number of volumes. JSTOR, for another example, does not include articles published in
the last 1-5 years, depending on the agreements with particular journals. Popline, for a third example, does not index
the contents of all journals in their entirety or for the years in which we are interested, although many of the same
journals are indexed in Popline as in the two databases that we use.
12
databases abstract and index an international array of demographic, sociology and economic
journal articles, books, book reviews, collective volume articles, working papers and
dissertations, with greater emphasis on published studies and on studies conducted in English.
We conducted our search for studies written between 1990 and 2005 in order to discern if there
have been any trends over this decade and a half. We limited our search to studies on developing
countries. We conducted searches for the three aggregate disease/health conditions categories
noted in the introduction used by the Global Burden of Disease/World Health Organization
(GBD/WHO): (1) communicable, maternal, perinatal and nutritional conditions (CMPNC), (2)
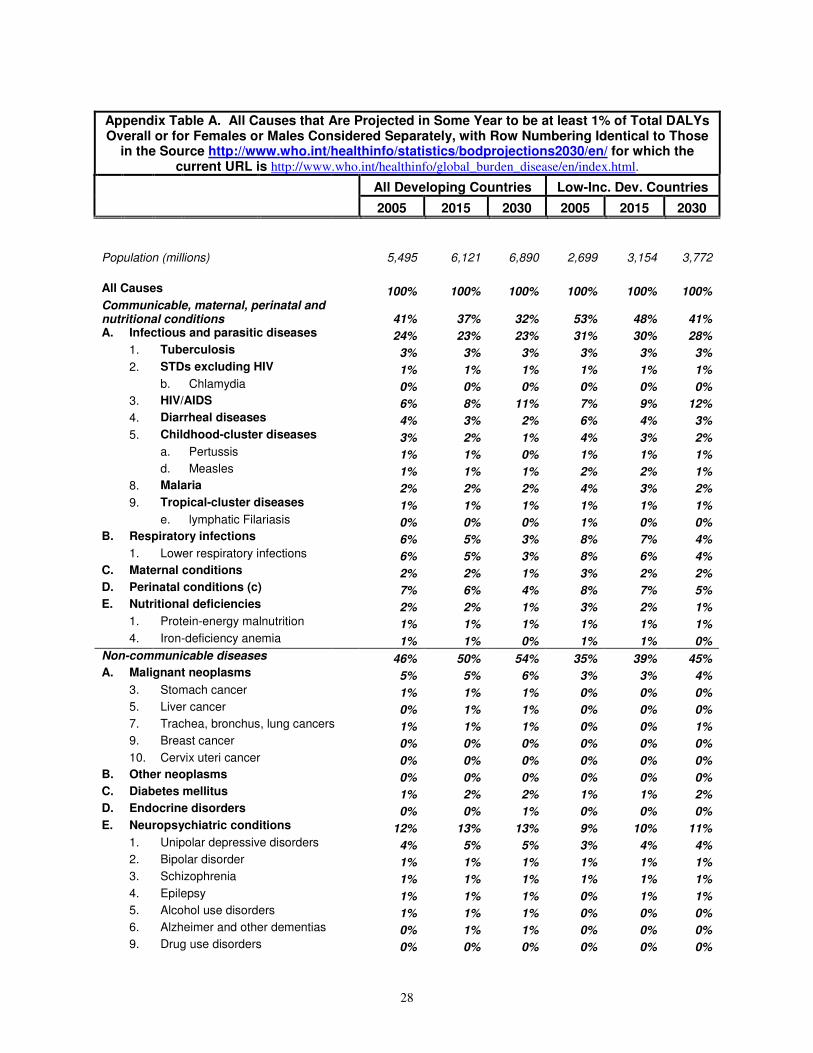
non-communicable diseases (NCD), and (3) injuries. Appendix Table A gives the major more
disaggregated disease and health conditions within each category. In our search, within each
category we listed as many descriptors as possible so that the most complete record would be
generated (i.e., for communicable diseases we listed Tuberculosis OR STDs OR HIV OR AIDS
OR Syphilis etc.). The broadest category was injuries, which includes everything from everyday
automobile accidents to large-scale ethnic violence.
Once we had completed our initial searches, we downloaded the records into a database in order
to be able to check our classification more carefully by, e.g., examining abstracts. While such a
procedure undoubtedly gives a noisy measure of the distribution of social science research on
health in developing countries in these aggregate categories for a number of reasons (e.g., some
applied research never appears in venues covered by Sociological Abstracts or EconLit), it does
cover systematically the major peer-reviewed research that often sets the tone for what research
issues are considered important in the field. In what follows we refer to the data that we
13
assembled in this process as data on demographic and other social science studies (or “social
science studies” or “studies” for short).
To provide additional complementary information, we undertook a similar search of
presentations of papers at sessions and posters at the Population Association of America (PAA)
annual meetings for the same 1990-2005 period. These arguably reflect a slightly more current
perspective (due to publication lags) on research topics of particular interest to the demographic
community that have been selected for presentation at a major demographic annual professional
meeting. In what follows we refer to the data that we assembled in this process as data on PAA
presentations, as distinguished from the data described above on social science studies.
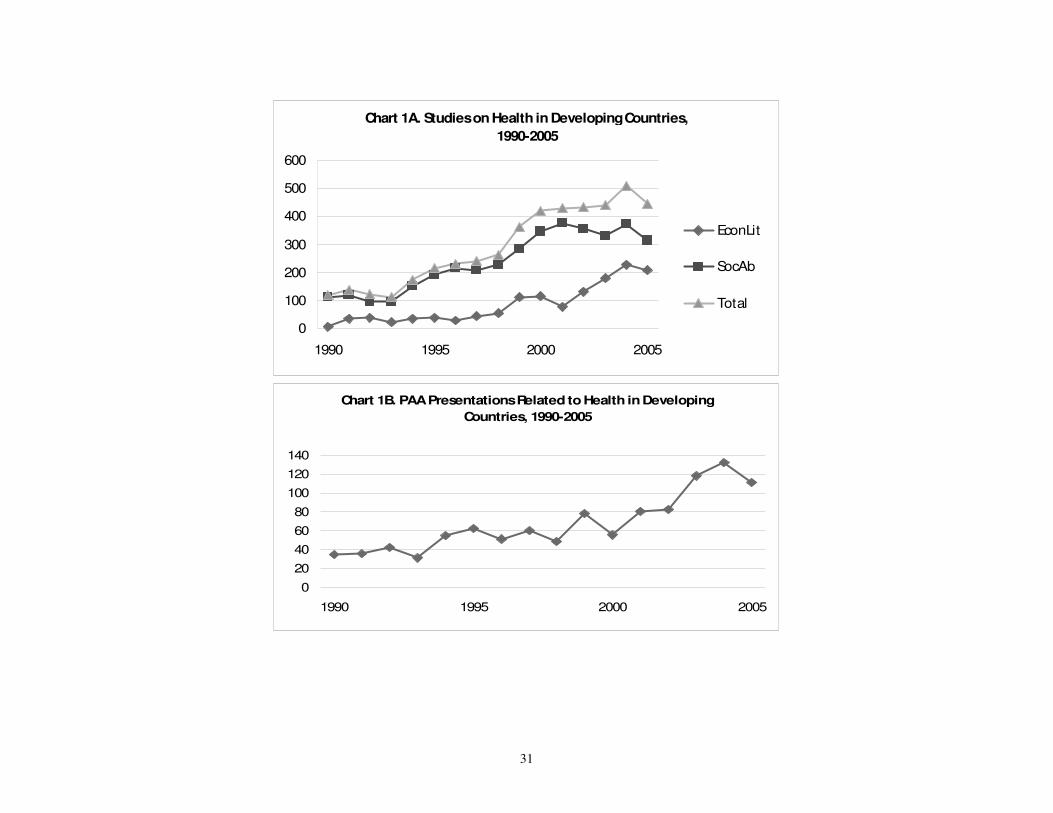
Charts 1-3 summarize various dimensions of the time patterns and cross-sectional patterns in
social science studies and in PAA presentations on the three major GBD/WHO health
conditions/disease categories in developing countries during 1990-2005. Because of year-to-
year fluctuations, we use the averages for 1990-2 and 2003-5 throughout this paper to
characterize the patterns at the start and the end of the 1990-2005 period. For 1990-2, the
average number of studies on health in developing countries recorded in EconLit and
Sociological Abstracts together was relatively small, 126 per year, as was the average number of
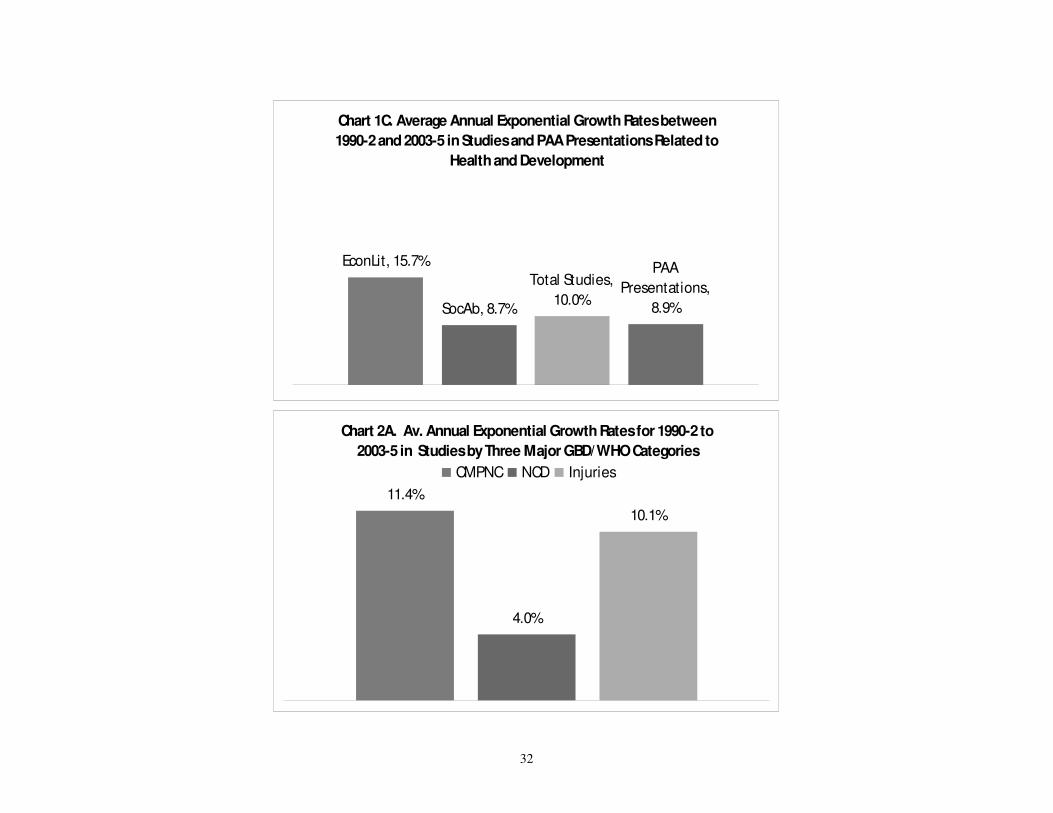
PAA presentations, 36 per year (Charts 1A and 1B). There was considerable growth between
1990-2 and 2003-5, averaging 10.0% per year for studies and 8.9% for PAA presentations (Chart
1C), so that the average number of studies was 466 per year and the average number of PAA
presentations was 120 per year for 2003-5. Sociological Abstracts accounted for the vast
majority of the studies, 81% of the total for 1990-2005. But the number of studies covered in
14
EconLit increased at almost twice the rate as those covered in Sociological Abstracts between
1990-2 and 2003-5 (Chart 1C), indicating somewhat of a disciplinary shift towards relatively
more studies in economics over this period (though still with absolutely more studies in
sociology at the end of the period).
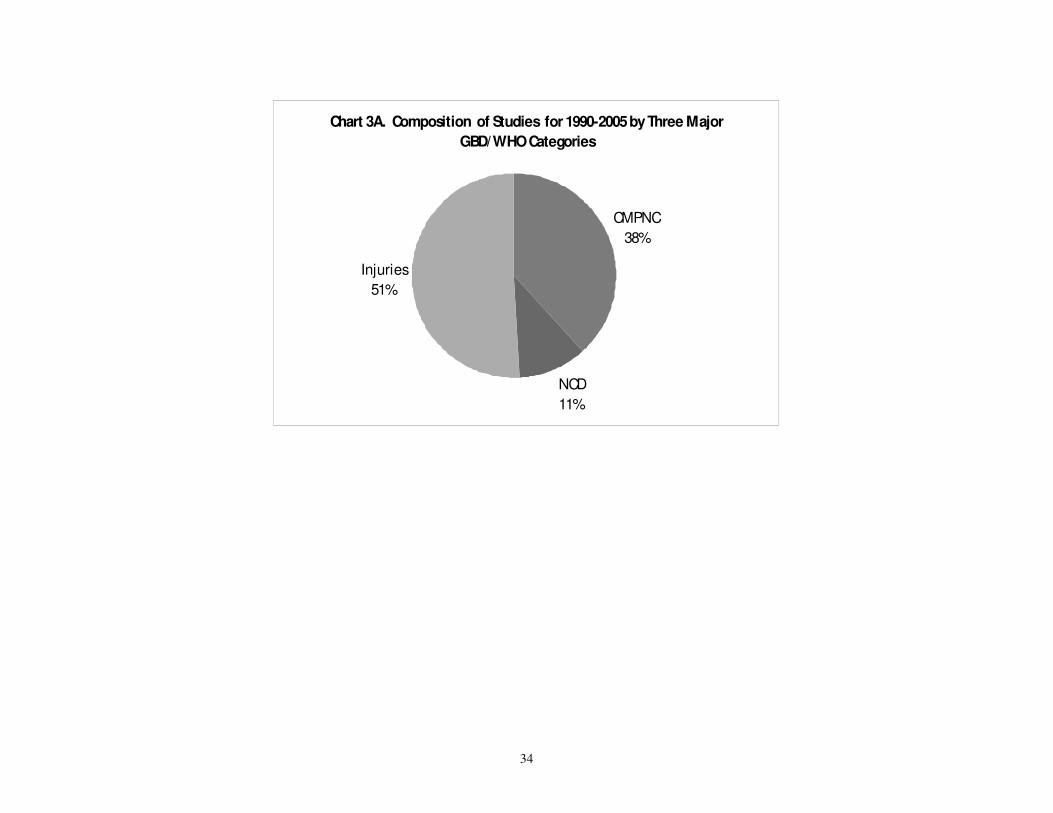
The basic GBD/WHO category with the most rapid growth in studies has been CMPNC (11.4%
per year, Chart 2A), the category that traditionally, at least prior to the initiation of the
epidemiological and nutritional transitions in the developing world, has been considered to be the
dominant locus of health/disease problems in developing countries. Close behind in terms of
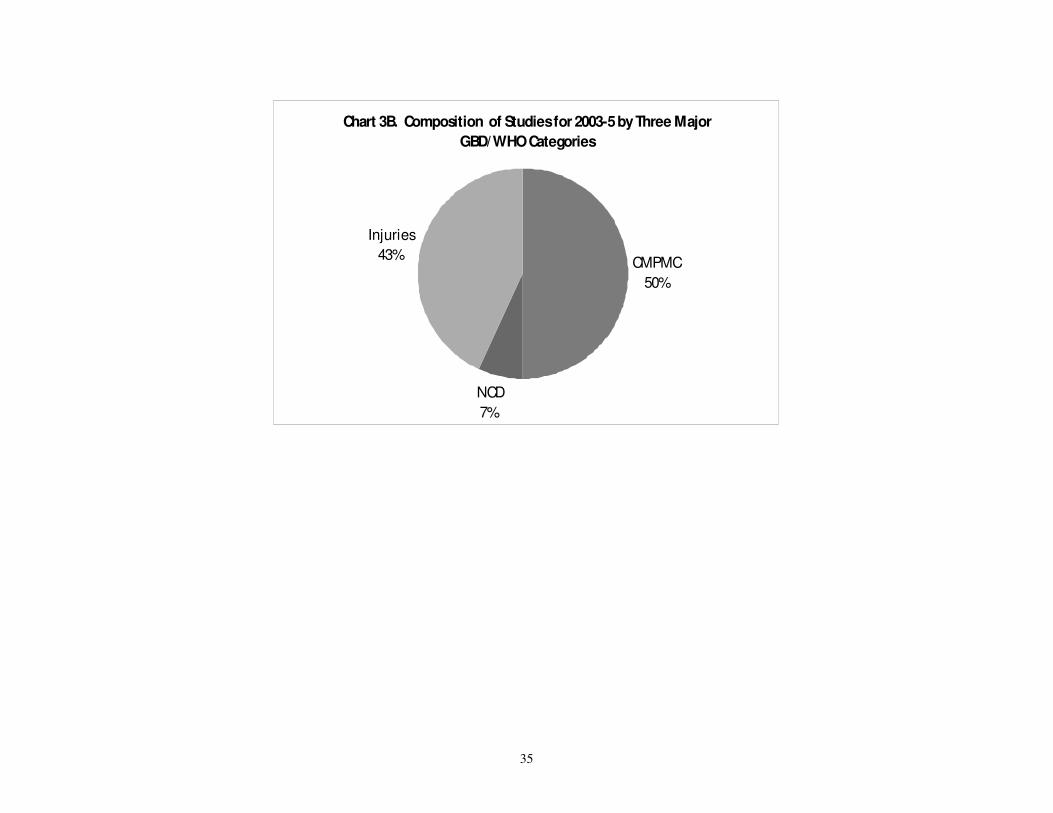
growth has been injuries (10.1% per year). Over the entire period, injuries accounted for a little
over half (51%) of the studies (Chart 3A). But by the end of the period in 2003-5 (Chart 3B), the
CMPNC category had increased to half of the studies (50%). A distant third in respect to both
the level and the growth of studies was NCD, which traditionally have been considered to be the
diseases primarily of developed countries. NCD accounted for only 11% of the studies in the
1990-2005 period, 7% of the studies for 2003-5 and had an annual growth rate in studies of only
4.0%. Thus, in what economists would characterize as “revealed preference,” demographers and
other social scientists producing these studies on health in developing countries apparently
thought that their research contributions would be greatest by focusing on CPMNC and injuries,
with some shift from injuries to CPMNC and with very little and declining relative attention to
NCD.
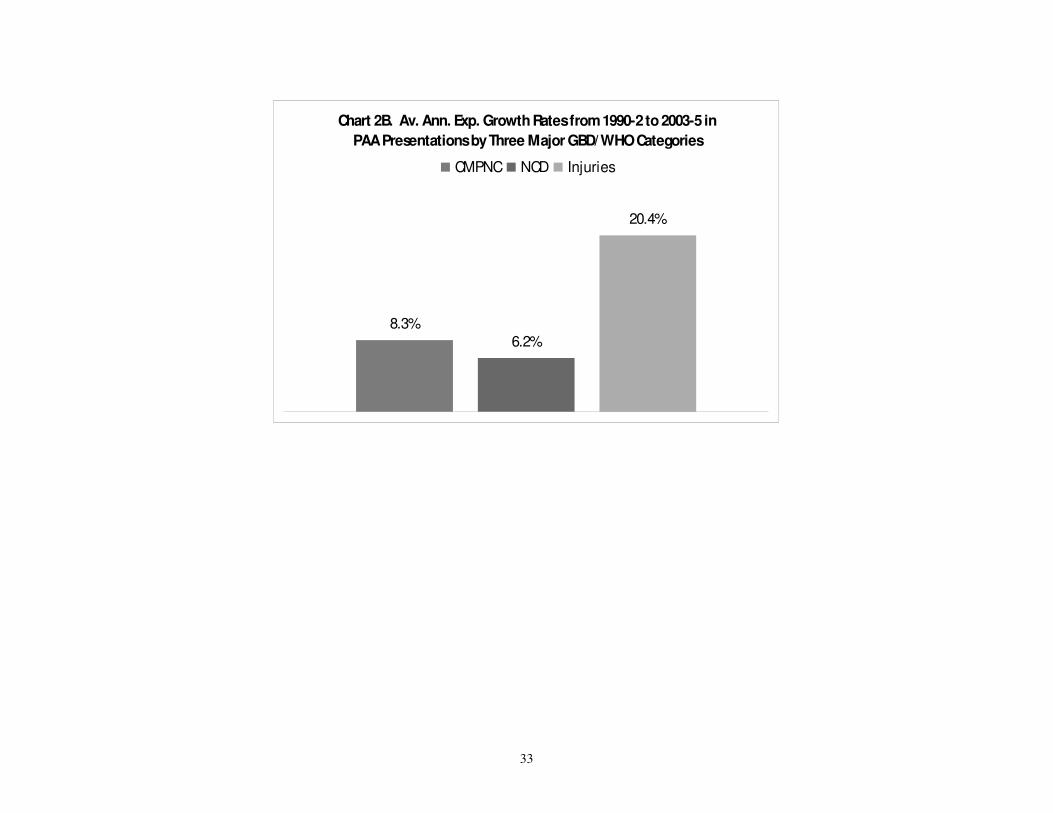
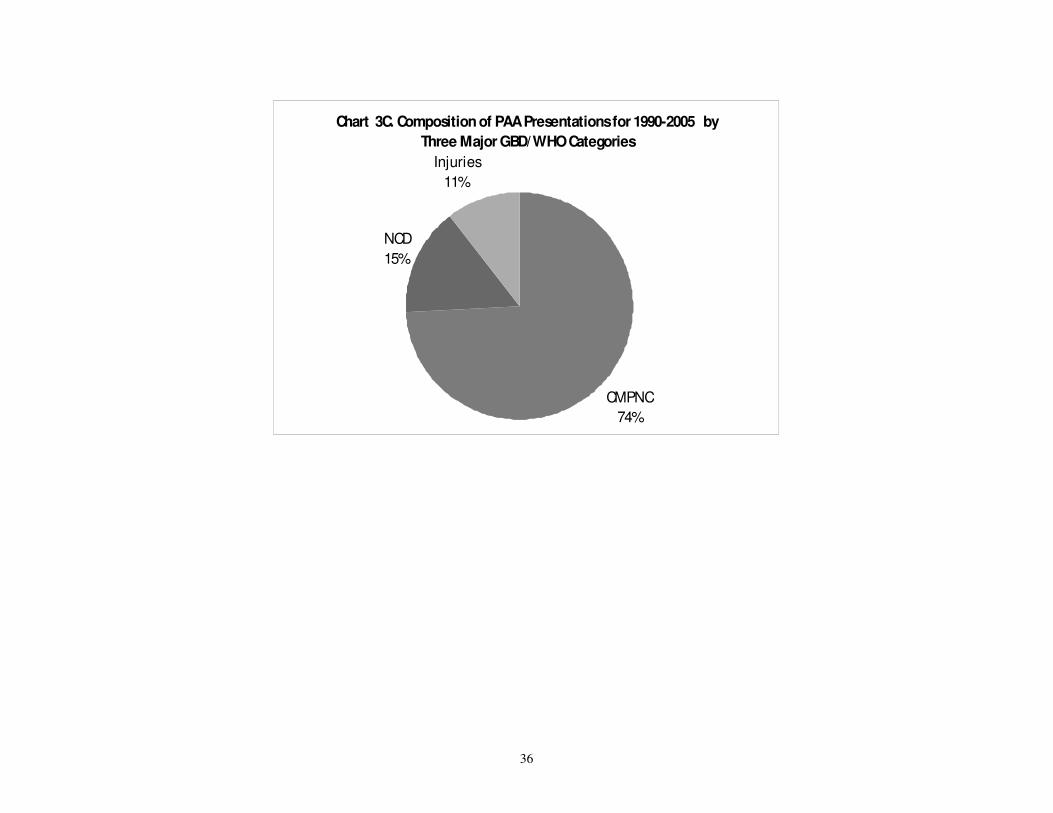
For PAA presentations, there have been related, but somewhat different patterns with regard to
the three basic GBD/WHO categories. CMPNC have dominated even more for PAA
15
presentations than for demographic and other social science studies over 1990-2005 (74%, Chart
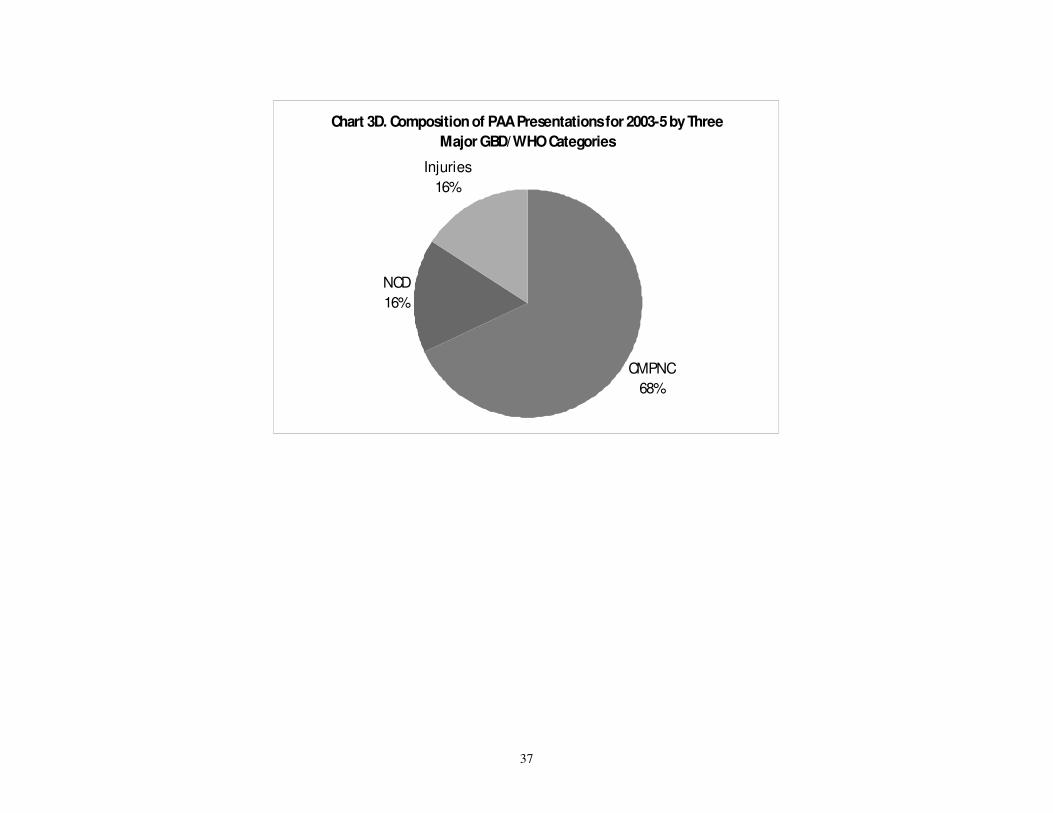
3C) and for 2003-5 (68%, Chart 3D). As for demographic and other social science studies, NCD
have had a relatively small share in PAA presentations (15% in 1990-2005, Chart 3C; 16% for
2003-5, Chart 3D) and relatively slow growth between 1990-2 and 2003-5 (6.2% per year, Chart
2B). PAA presentations, however, have focused much less on injuries than have studies
produced by social scientists (11% for 1990-2005, Chart 3C; 16% for 2003-5, Chart 3D), though
with the most rapid growth in such presentations among the three major GBD/WHO categories
(20.4% per year, Chart 2B). Thus, the “revealed preference” of those giving PAA presentations
on health in developing countries indicates that they apparently thought that at least the private
benefits to their research contributions, which might include altruistic concerns about “social
benefits,” would be greatest by focusing on CPMNC, with some shift from CPMNC to injuries
and with little attention to NCD.
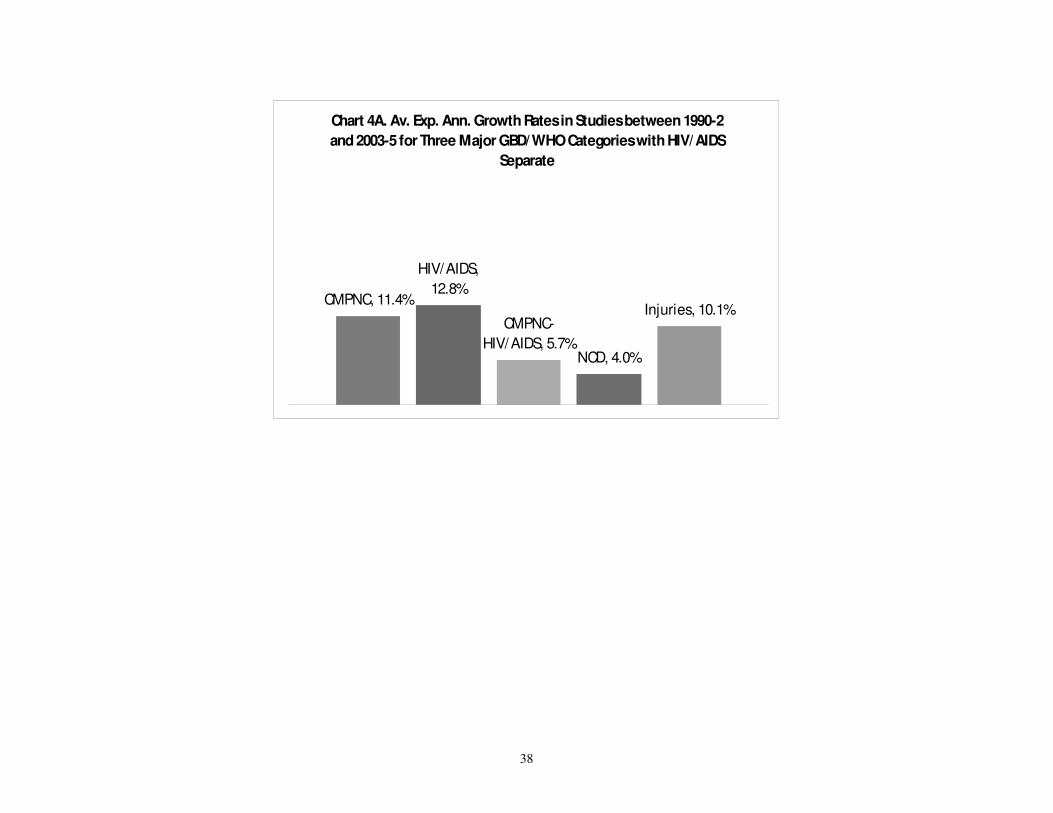
But in an important respect for this paper, the CPMNC aggregate only reveals part of the story.
A great deal and an increasing share of the social science research on health in developing
countries has been directed towards one disease that is part of the CPMNC aggregate,
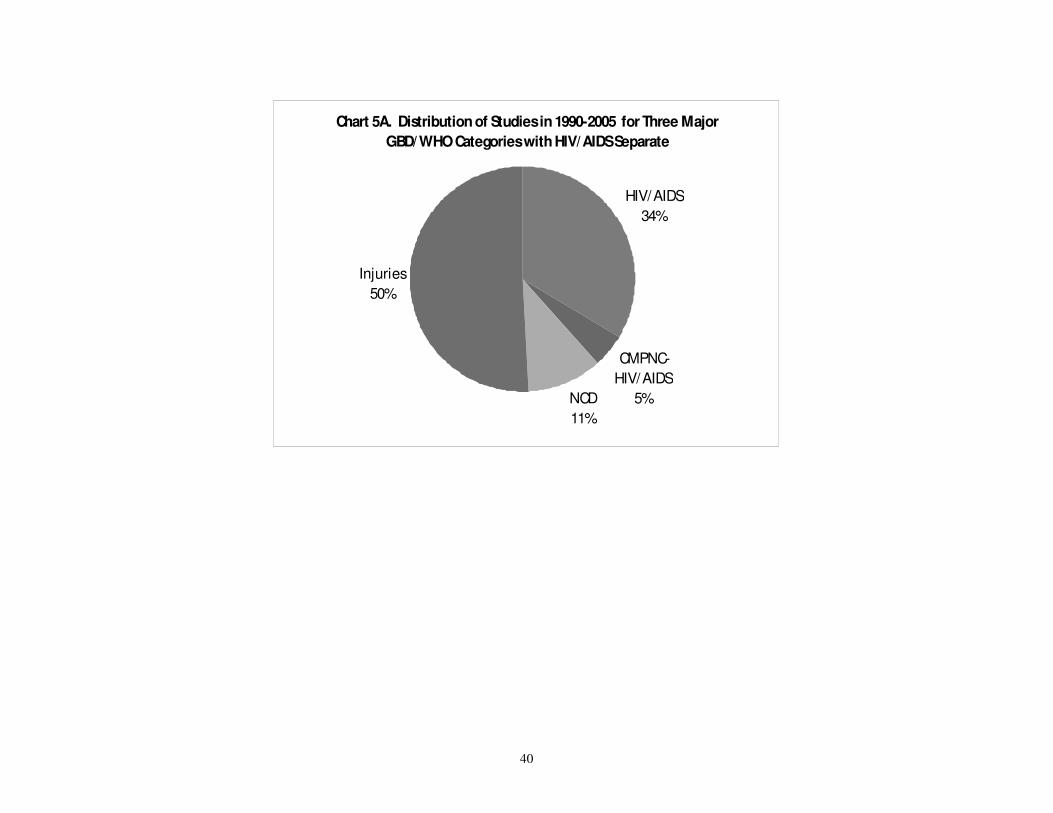
HIV/AIDS. The annual rate of growth of studies on HIV/AIDS between 1990-2 and 2003-5 was
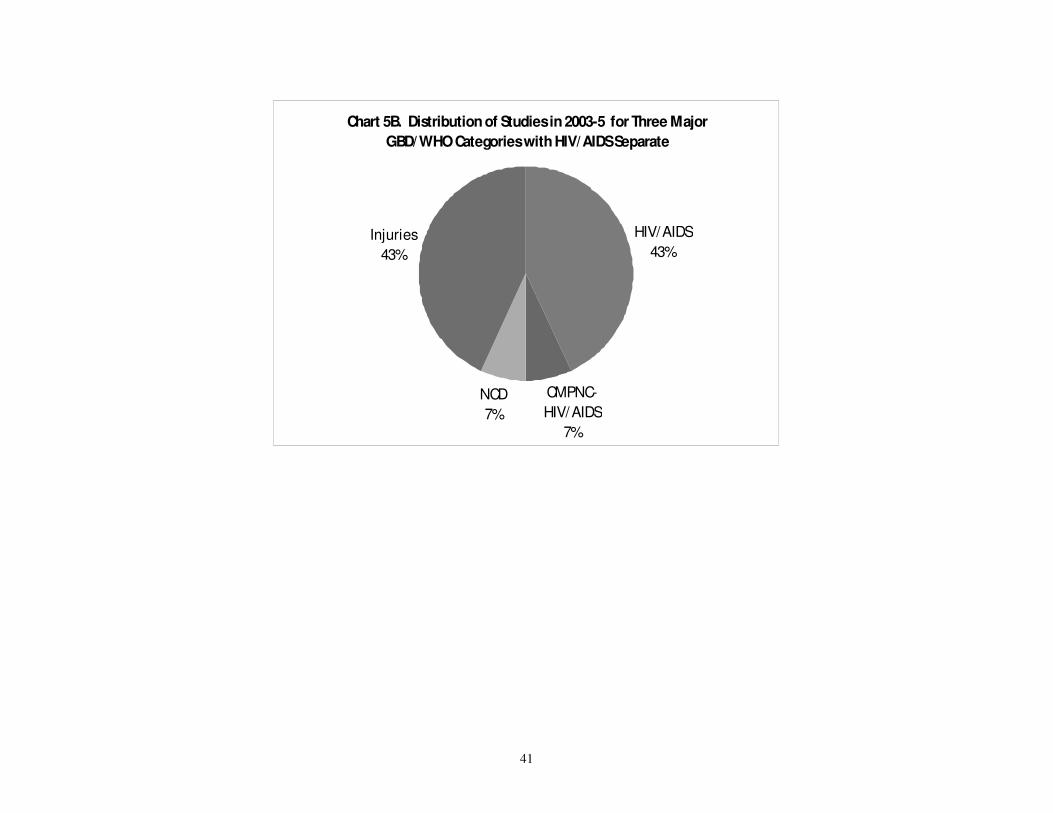
12.8% (Chart 4A) and the share of studies on HIV/AIDS of the total studies on health in
developing countries was 34% for the whole 1990-2005 period (Chart 5A) and 43% for 2003-5
(Chart 5B). The annual rate of growth of studies on injuries (10.1%) has been almost as high as
that for HIV/AIDS. But the annual growth rates in studies on NCD (4.0%) and on CPMNC
other than HIV/AIDS (hereafter CPMNC – HIV/AIDS) (5.7%) have been less that half of the
annual growth rate of studies on HIV/AIDS (Chart 4A). Thus, the sentence about revealed
16
preferences for authors of studies (two paragraphs above) probably is better rewritten to say that
in a revealed preference sense, demographic and other social science researchers working on
health in developing countries apparently have thought that the private returns to their research
contributions would be greatest by focusing on HIV/AIDS and on injuries, with increasing
emphasis on HIV/AIDS relative to injuries, but much less on NCD and CMPNC - HIV/AIDS.
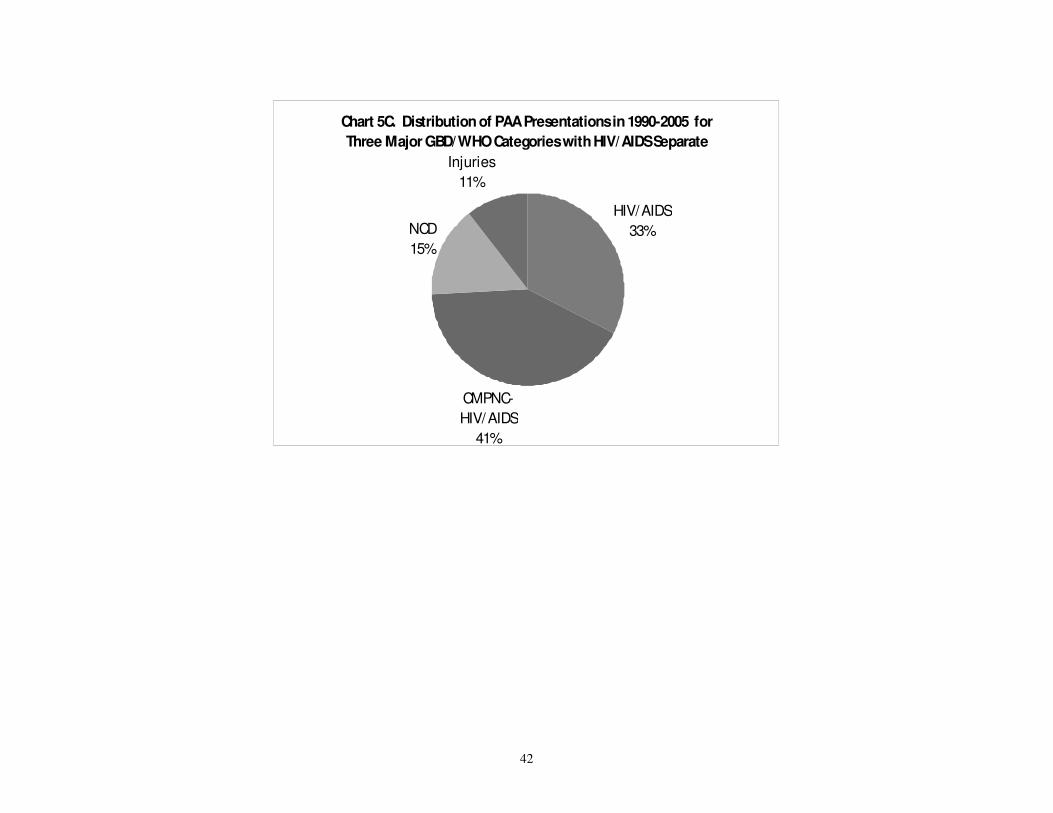
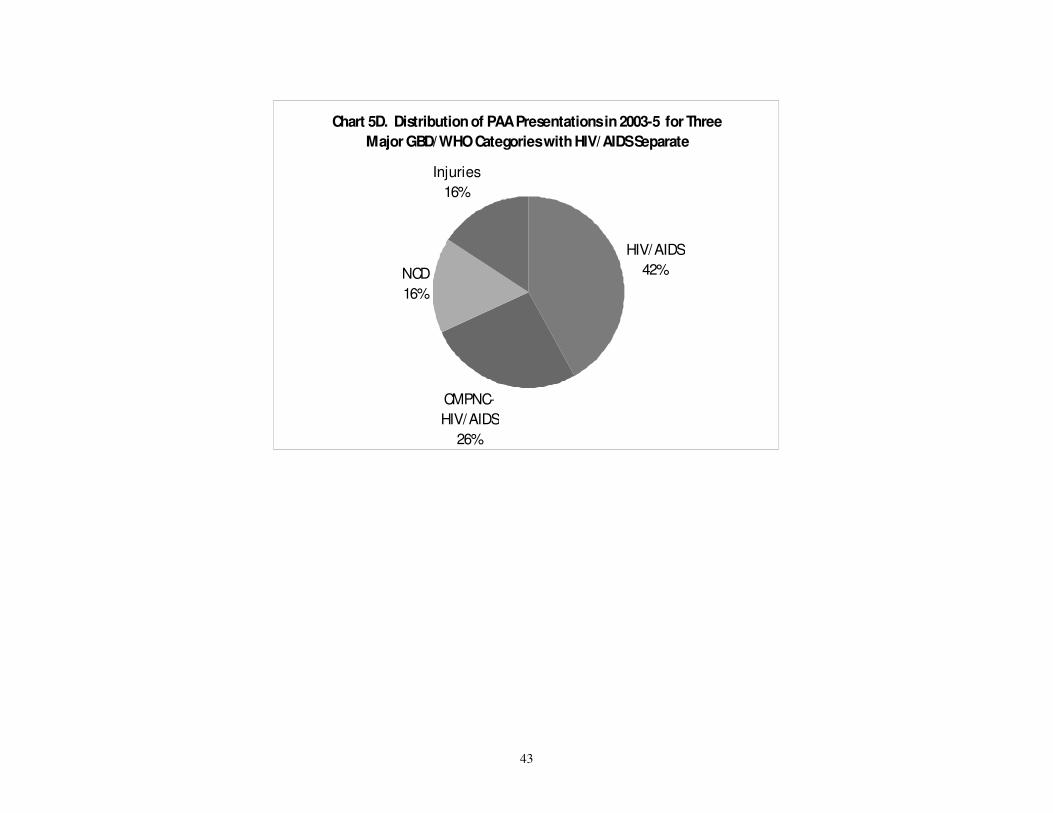
The annual rate of growth of PAA presentations on HIV/AIDS between 1990-2 and 2003-5 was
much higher at 21.7% (Chart 4B) than the 12.8% growth rate for studies on HIV/AIDS (Chart
4A). The share of PAA presentations on HIV/AIDS of the total presentations on health in
developing countries was 33% for 1990-2005 (Chart 5C) and 42% for 2003-5 (Chart 5D). The
annual rate of growth of PAA presentations on injuries noted above (20.4%) has been almost as
high as that for HIV/AIDS. In sharp contrast, the annual growth rates in PAA presentations have
been much lower for NCD (6.2%) and for CPMNC – HIV/AIDS (1.8%) (Chart 4B). Thus, the
last sentence two paragraphs above probably is better rewritten to say that in a revealed
preference sense, researchers giving PAA presentations on health in developing countries
apparently have thought that the private returns to their research contributions would be greatest
by focusing on the CMPNC category with a substantial shift within that category to HIV/AIDS,
but much less on NCD and injuries (though with a rapid growth from a low base in the latter).
4. Dominant Health Problems in Developing Countries – And How
They Are Expected To Evolve
In Section 2 we present a stylized framework for thinking about factors that underlie socially-
desirable choices of additional social science research among health conditions. These relate to
17
where on the MSB curves for various health conditions social science research is at the start of
the period of interest and what are the relevant locations of the MSB curves for different health
conditions at that time. Unfortunately we do not think that there is available much information
to directly identify various detailed aspects of the framework laid out in Section 2 for the
developing world.
But we do think that the data described in this section provide some crude indicators of some
important aspects of these factors. These data are the projected DALYs (Disability-Adjusted-
Life-Years) for 2005, 2015 and 2030 because these seem to us to be best available indicators that
are comprehensive in terms of geographical and disease/health conditions coverage and that
include future projections of at least the intrinsic value of good health. In particular, we use the
DALYs in the basic scenarios that are available in Annexes 15-26 on the World Health
Organization (WHO) website on the Global Burden of Diseases (GBD).4 These cover many
health/disease conditions that are aggregated into the same three categories used in Section 3:
CMPNC, NCD and injuries. There are substantial discussions of the limitations of DALYs,5
some of which are shared by other indicators of health conditions -- for example, indentifying a
particular disease with a health condition or mortality that is related to a number of diseases. But
despite such limitations, as noted above, these data seem to be best available indicators that are
4 These data were downloaded from (http://www.who.int/healthinfo/statistics/bodprojections2030/en/). The current
URL for these data is http://www.who.int/healthinfo/global_burden_disease/projections/en/index.html. 5 See Lopez et al. (2006) and the references therein for extensive discussion of DALYS and Mathers and Loncar
(2006) for extensive discussion of the GBD/WHO projections of DALYS. Appendix Table A for this paper gives
the percentage distribution of DALYs, with various subaggregates, in the GBD/WHO projections for 2005, 2015
and 2030 for all the categories and subcategories that account for at least 1% of the total for all developing countries
or for low-income developing countries in at least one of these three years for females, males or females and males
combined.
18
comprehensive in terms of geographical and disease/health conditions coverage and that include
future projections of at least the intrinsic value of good health.
DALYs also do attempt to measure some important aspects of the severity of disease, one of the
broad factors underlying the location of the MSB curves noted in Section 2. They are designed
to capture the severity with regard to which diseases cause a loss of healthy life years, so AIDS
is weighted much more heavily than minor diseases such as headaches. They also explicitly take
into account whether the impact of health conditions that last until death occurs earlier in the life
cycle as for AIDS or primarily at older ages such as a number of forms of cancer. Thus they
explicitly incorporate several aspects of the severity of health conditions. But they do not
incorporate all dimensions of the severity of health – for example, the DALYs that we use do not
capture productivity effects that may differ over the life cycle.
From the perspective of social science research in the 1990-2005 period covered in Section 3, the
expected relative prevalence of disease characteristics at the end of the period (2005) or in the
future (2015, 2030) ties in with at least one more factor emphasized in the discussion about the
determinations of the location of MSB curves in Section 2: The greater the prevalence of health
conditions, ceteris paribus, the higher are likely to be the MSB curves. If society is forward-
looking, then not only the prevalence within this period but that projected in the future is a
related factor determining the location of the MSB curves. And the faster future prevalence is
likely to expand and therefore the MSB curves in Figure 1 to move out over time, the more likely
it would seem that past social science research has moved society to date only to a point some
19
distance to the left of the socially optimal level of research such as point n1 rather than close to
the optimal at points n3 and n4 in Figure 1.
In summary, the prevalence over time of DALYs in developing countries has limitations in
capturing all of the major points suggested by the framework in Section 2. For example they do
not seem to provide information about differential relevance across health conditions of contexts
or of individual and governmental behaviors, two of the points affecting the locations of MSBs
that are discussed in Section 2. Nevertheless they seem to capture some important dimensions
of that framework better than available alternatives. Therefore the rest of this section describes
patterns in DALYs with regard to the three major categories of health conditions considered in
Section 3: CMPNC, NCD and injuries. Because of the importance of HIV/AIDS in the
CMPNC aggregate, we also consider HIV/AIDS and CMPNC –HIV/AIDS.
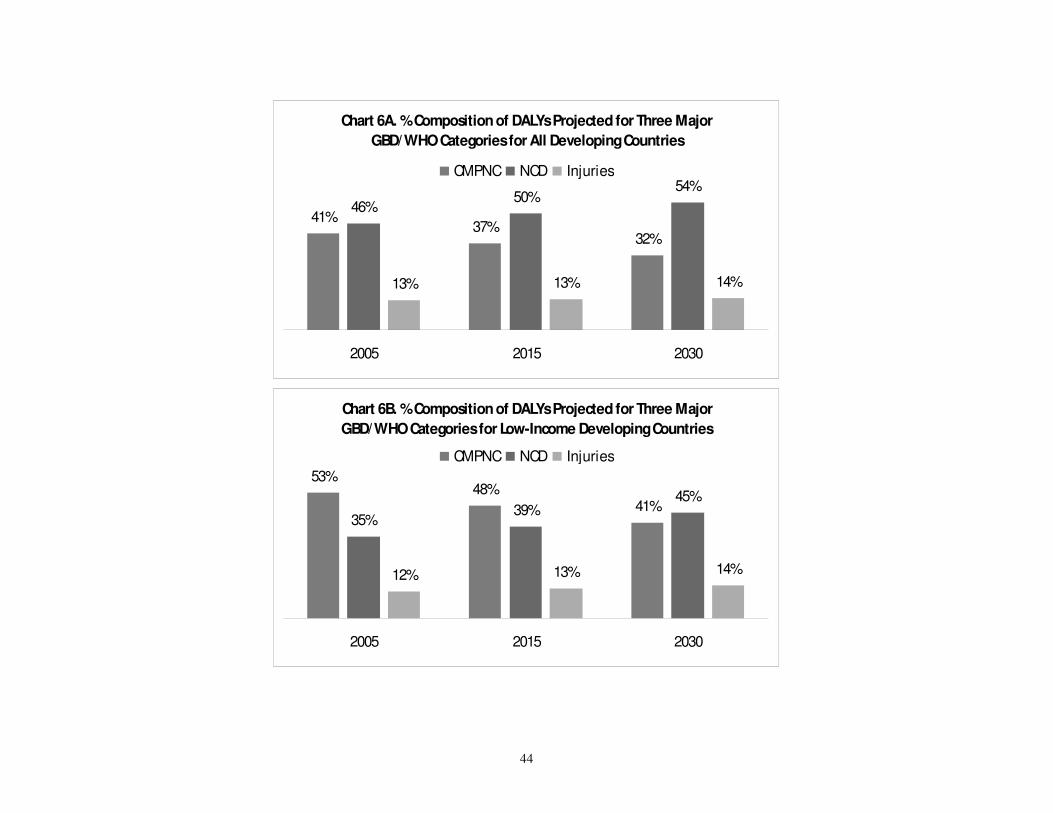
Charts 6A and 6B summarize for the three GBD/WHO aggregate categories the projected
composition of DALYs for all developing countries and for low-income developing countries.
For all developing countries the estimates for 2005 indicate that CMPNC accounted for 41%,
NCD for 46% and injuries for 13% of the DALYs (Chart 6A). The projections for all developing
countries for 2030 indicate a decrease to 32% for CMPNC, an increase to 54% for NCD and an
increase to 14% for injuries (Chart 6A). For low-income developing countries the 2005
estimates are that CMPNC accounted for 53%, NCD for 35% and injuries for 12% of the
DALYs (Chart 6B). The projections for low-income developing countries for 2030 indicate a
decrease to 41% for CMPNC, an increase to 45% for NCD, and an increase to 14% for injuries
(Chart 6B).
20
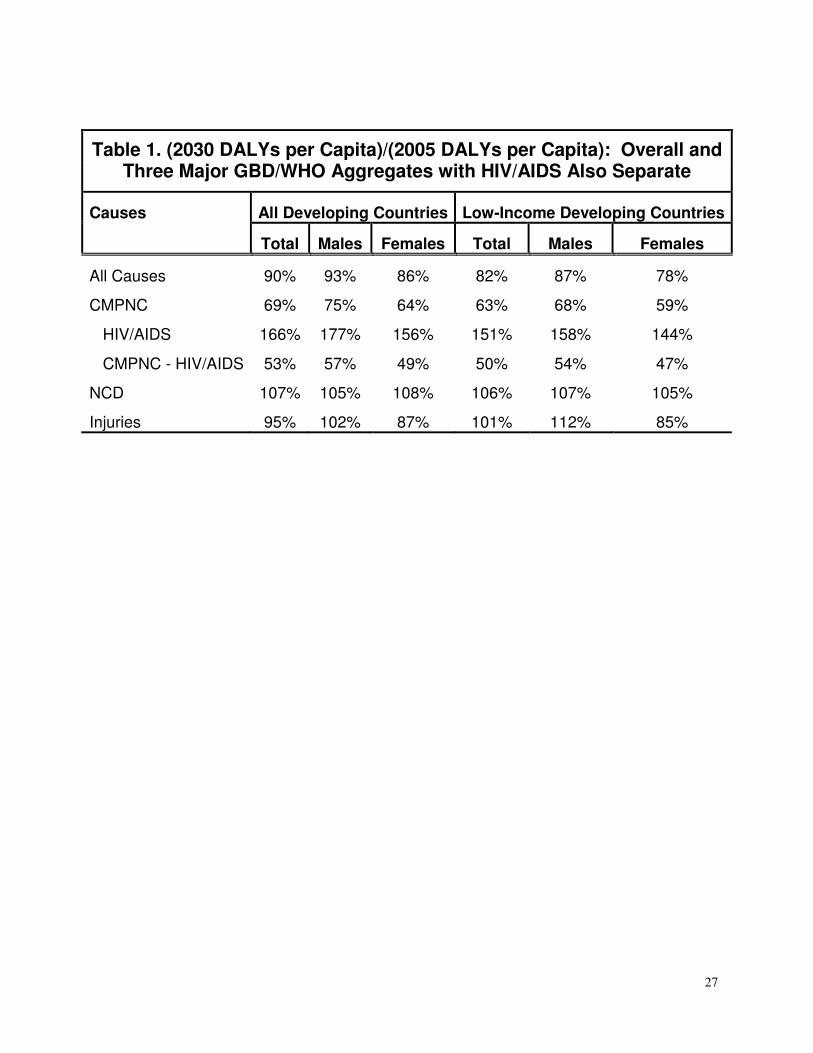
The composition of DALYs projected for different years, of course, does not indicate in itself
whether the projections indicate that health will be getting better or worse. Table 1 provides the
ratio of DALYs per capita projected for 2030 to DALYs per capita for 2005 for all developing
countries and for low-income countries and females and males combined and separate. These
ratios are given for all causes, for the three major aggregates and, because of the probable
importance of HIV/AIDS, with the CMPNC category subdivided into HIV/AIDS and CMPNC -
HIV/AIDS. These projections were made before the recent downward revisions of estimated
prevalence of HIV/AIDS (WHO 2007) so they may overstate somewhat the currently-perceived
importance of HIV/AIDS. Nevertheless, arguably they reflect better than estimates that
incorporate the recent revisions of HIV/AIDS prevalence what projections were at the time that
researchers were deciding how to allocate their research efforts among health conditions over the
period considered in this paper.
Overall health is projected to improve, with a 10% decline in per capita DALYs for all
developing countries and a larger 18% decline in per capita DALYs for low-income developing
countries. The disaggregations indicate that these projected declines are primarily due to large
declines in CMPNC - HIV/AIDS for males and more so for females (by 2030 to about half the
2005 levels) and secondarily to declines in injuries for females. The decline in CMPNC –
HIV/AIDS causes a 25% to 41% decline in CMPNC despite increases in HIV/AIDS of from
44% to 77%. For NCD for both females and males and for injuries for males, in contrast, there
are projected to be slight increases in the range of 5% to 8% and 2% to 12%, respectively.
21
5. Implications for Social Desirability of Composition of
Recent Social Science Research Among Health Conditions in
Developing Countries
Social science research and PAA presentations on health in developing countries have expanded
rapidly since 1990 (Section 3). Both the composition of such studies during 1990-2005 and the
growth in such studies have been dominated primarily by attention to HIV/AIDS and injuries,
with somewhat of a shift from injuries to HIV/AIDS over this period. The PAA presentations
also have had a relatively large component of communicable, maternal, perinatal and nutritional
conditions (CMPNC) other than HIV/AIDS, though a very low growth rate for studies of these
health conditions. Relatively little attention has been paid to non-communicable diseases (NCD).
The framework in Section 2 suggests some important criteria for selecting health conditions on
which it is socially desirable for social science research to focus. We argue that there is some
very useful information, though hardly complete or perfect information, regarding these criteria,
in the relative prevalence of the burden of different diseases/conditions as measured by DALYs
at various point in time. Examination of GBD/WHO projections for DALYs for all developing
countries and for low-income developing countries for 2005-2030, subject to qualifications about
measurement and projections, provides some useful information about the social merits of the
composition of health conditions in recent social science research.6
6 These comparisons do not provide information about whether the absolute levels of research are appropriate, that is
whether there is too little or too much research on any particular health condition as indicated by whether current
research is the right or left of points such as n3 and n4 at which the MSB equal the MSC in Figure 1. We would
22
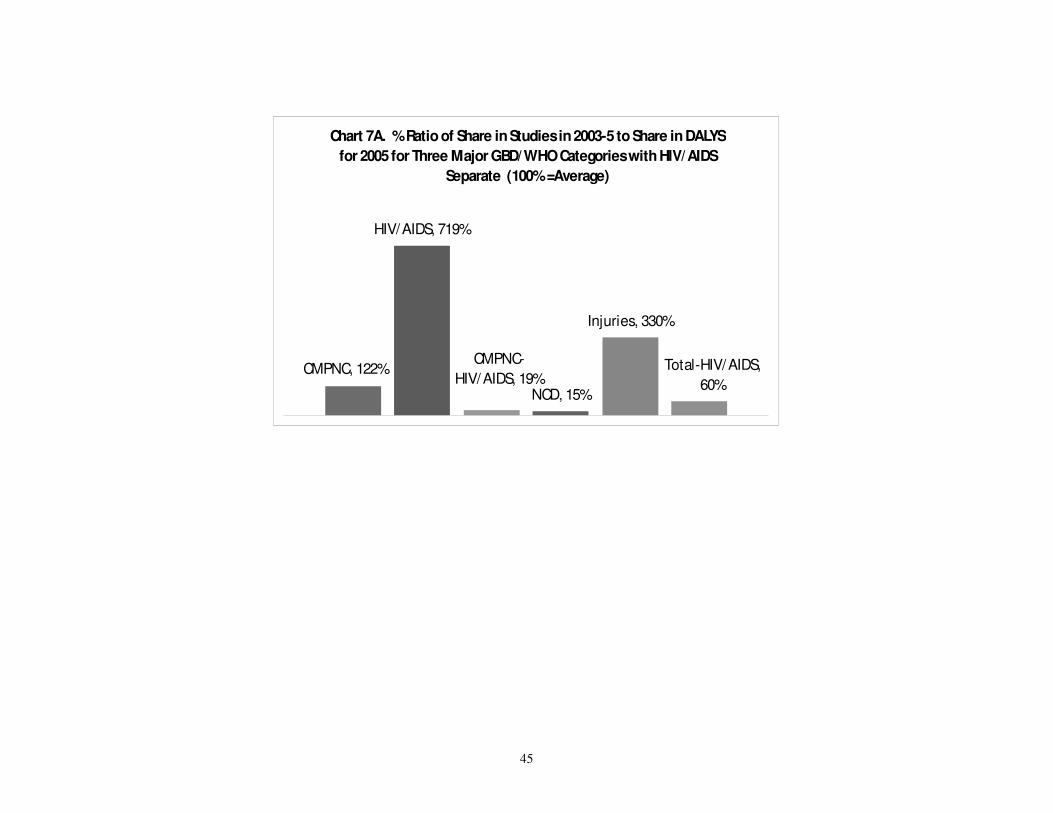
Charts 7A-D vividly illustrate the relations between the shares of social science studies and the
shares of PAA presentations across major health/disease conditions in developing countries (the
three basic GBD/WHO categories and HIV/AIDS and the total minus HIV/AIDS) relative to the
shares of DALYs across these conditions. Chart 7A presents the distribution of the shares of
studies for 2003-5 relative to the distribution of the shares of DALYs for 2005. This chart shows
that the studies per DALY on HIV/AIDS (719% of the average) and to a lesser extent on injuries
(330%) are far above average, with the result that the share of CMPNC including HIV/AIDS also
is above average (122%). In sharp contrast, the shares of NCD (15%), CMPNC-HIV/AIDS
(19%) and the total excluding HIV/AIDS (60%) are far below average. These percentages imply
that there are about 48 (=719%/15%) studies per DALY due to HIV/AIDS for every one study
per DALY due to NCDs. If the only criterion for the distribution of studies were the DALY
shares for 2005, then this pattern suggests substantial misallocation from a social perspective,
particularly towards HIV/AIDS and, to a lesser extent, injuries.
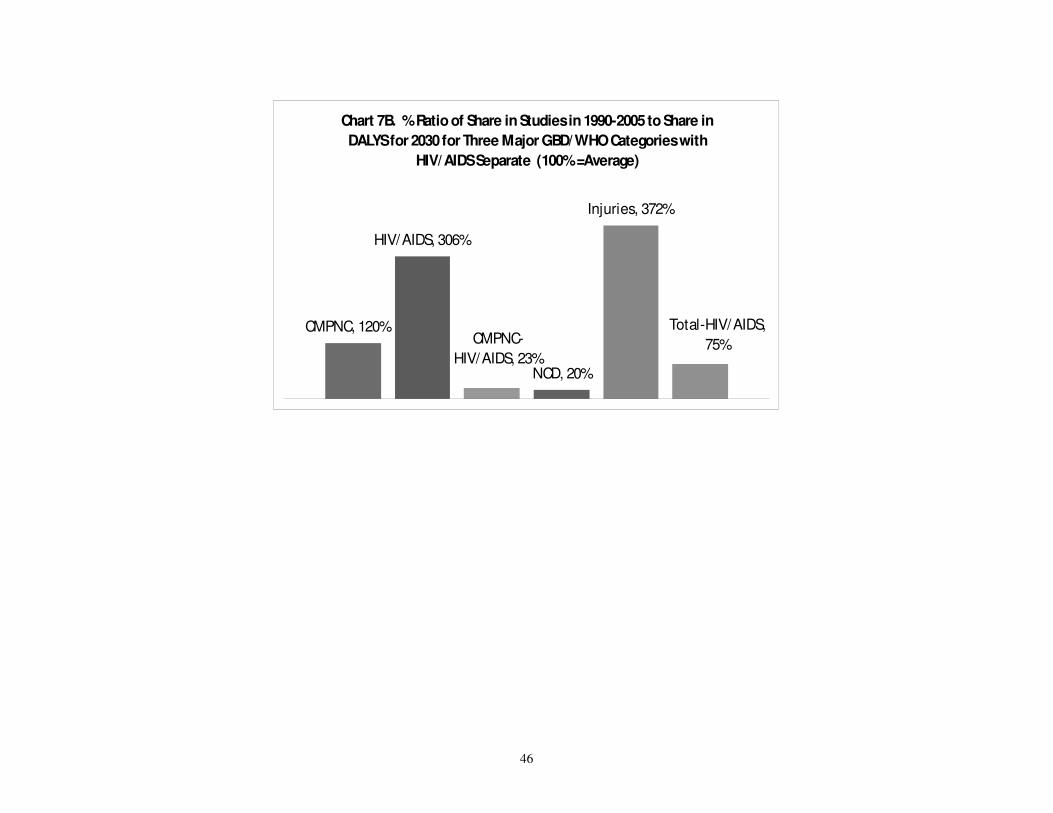
But if the social benefits of research are based on looking forward, then the shares of DALYs
projected at some future time may be more relevant because, as noted above, the greatest
potential may depend on both the shares in DALYs and for which conditions the DALYs are
expected to increase relatively rapidly, both of which can be summarized by future expected
shares in DALYs. Chart 7B presents similar estimates to those in Chart 7A, but with the
estimated 2030 DALY shares used as the reference and, assuming even further forward-looking
require much more information to address that question because it would require estimating numerical values for
MSBs and MSCs. But, independent of whether there is too much or too little social science research on health
conditions in developing countries, it is useful to know whether the composition of that research currently is socially
desirable.
23
behavior, the 1990-2005 studies for the study shares. The percentages in Chart 7B differ from
those in Chart 7A, but the general characterization is basically the same. By these criteria as
well, the studies per DALY on HIV/AIDS (306% of the average) and on injuries (372%) are far
above average, with the result that the share of CMPNC including HIV/AIDS also is above
average (120%). And, again in sharp contrast, the shares of NCD (20%) and CMPNC-
HIV/AIDS (23%) are far below average. These percentages imply that there are over 15
(=306%/20%) studies per DALY due to HIV/AIDS for every one study per DALY due to NCD.
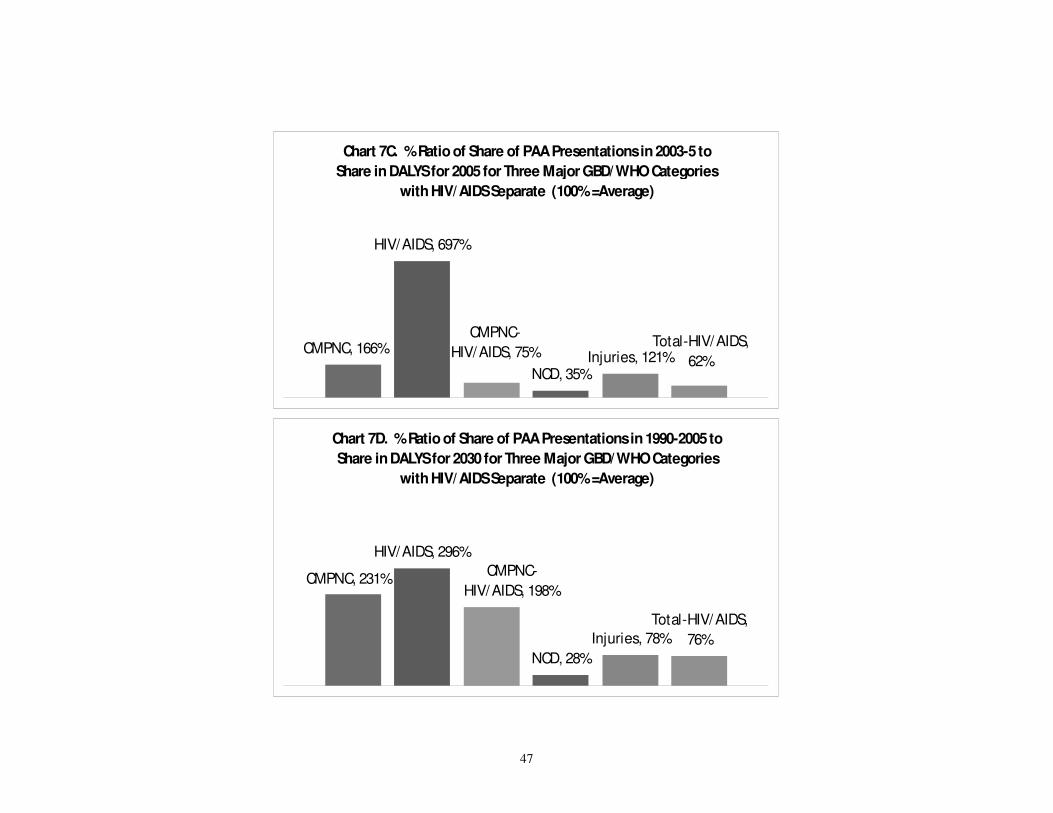
Charts 7C and 7D are parallel to Charts 7A and 7B, but refer to the percentage shares of PAA
presentations relative to the percentage shares of DALYs. In most respects the patterns are
similar to those in Charts 7A and 7B. The one noteworthy exception is that the relative roles of
injuries and CMPNC-HIV/AIDS are reversed between Charts 7B and 7D. The relatively greater
emphasis on CMPNC-HIV/AIDS in PAA presentations than in the more general social science
studies seems plausible given the centrality of fertility and related mortality in demography.
By the two criteria of current shares in DALYs or estimated future shares in DALYs, therefore,
recent demographic and other social science research on health in developing countries has
overfocused substantially relatively on HIV/AIDS and injuries and underfocused substantially on
NCD and the CMPNC category other than HIV/AIDS. Recent PAA presentations on health in
developing countries have overfocused substantially relatively on HIV/AIDS and underfocused
substantially on NCDs. Qualifications are necessary because of the crudeness of the data and the
analysis and the possibility that there are other important factors shaping socially desirable
research efforts as discussed in Section 2, but the magnitudes of the differences are so large that
24
small refinements in data or analysis are not likely to change the bottom line: The apparent
strong imbalances between demographic and other social science research efforts and
health/disease conditions in developing countries suggests that social science researchers on
health in developing countries could contribute significantly more socially by refocusing their
efforts particularly from HIV/AIDS to NCDs. They also suggest that future research on the
mechanisms that influence the choices that social science researchers make regarding the
composition of their research among health conditions in developing countries would be quite
valuable. Finally, future research that investigated whether and why current social science
research levels on health conditions in developing countries are socially too low or too high,
independent of the compositional question of focus of this paper, also would be quite valuable.
6. Acknowledgments
The authors thank Justine Postlewaite for helpful research assistance in compiling data on PAA
presentations and the Demographic Research editors and reviewers for very useful comments on
a previous version. Jere R. Behrman acknowledges partial support for his work on this paper
from NIH/Fogarty TW05604 and NIH/NIA R01 AG023774.
25
References
Copenhagen Consensus, 2008, “Copenhagen Consensus 2008 – Results,”
WWW.COPENHAGENCONSENSUS.COM.
England, Roger, 2007, “Are we spending too much on HIV?” British Medical Journal (17
February), 334-44.
Halperin, Daniel, 2008, “Putting a Plague in Perspective,” New York Times (1 January), p. A17.
Jamison, Dean T., Joel G. Breman, Anthony R. Measham, George Alleyne, Mariam Claeson,
David B. Evans, Prabhat Jha, Anne Mills and Philip Musgrove, eds., 2006, Disease
Control Priorities in Developing Countries, Second Edition, Oxford University Press.
Lomborg, Bjorn, ed., 2004, Global Crises, Global Solutions, Cambridge, UK: Cambridge
University Press.
Lopez, Alan D., Colin D. Mathers, Majid Ezzati, Dean T. Jamison and Christopher J. L. Murray,
2006, Global Burden of Disease and Risk Factors, New York: Oxford University Press
and the World Bank.
Mathers, Colin D. and Dejan Loncar, 2006, “Updated Projections of Global Mortality and
Burden of Disease, 2002-2030: Data Sources, Methods and Results,” Geneva, World
Health Organization. Evidence and Information for Policy Working Paper (August).
Suhrcke, Marc, Rachel Nugent, David Stuckler and Lorenzo Rocco, 2005, “Chronic Disease: An
Economic Perspective,” Venice, Italy: WHO European Office of Investment for Health
and Development (report prepared for Oxford Health Alliance).
Shiffman, Jeremy, Tanya Beer and Yonghong Wu, 2002, “The Emergence of Global Disease
Control Priorities,” Health Policy and Planning 17:3, 225-234.
26
World Health Organization (WHO), 2007, World Health Statistics 2007, Geneva: World Health
Organization.
27
Table 1. (2030 DALYs per Capita)/(2005 DALYs per Capita): Overall and Three Major GBD/WHO Aggregates with HIV/AIDS Also Separate
Causes All Developing Countries Low-Income Developing Countries
Total Males Females Total Males Females
All Causes 90% 93% 86% 82% 87% 78%
CMPNC 69% 75% 64% 63% 68% 59%
HIV/AIDS 166% 177% 156% 151% 158% 144%
CMPNC - HIV/AIDS 53% 57% 49% 50% 54% 47%
NCD 107% 105% 108% 106% 107% 105%
Injuries 95% 102% 87% 101% 112% 85%
28
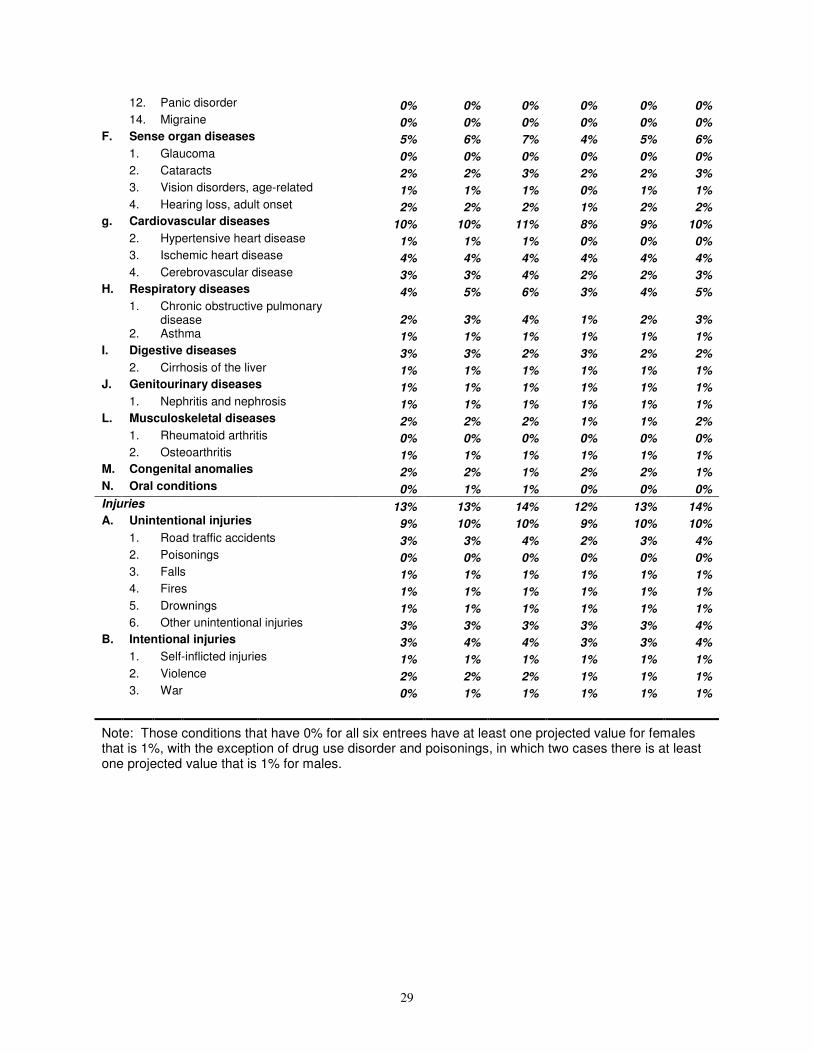
Appendix Table A. All Causes that Are Projected in Some Year to be at least 1% of Total DALYs Overall or for Females or Males Considered Separately, with Row Numbering Identical to Those
in the Source http://www.who.int/healthinfo/statistics/bodprojections2030/en/ for which the current URL is http://www.who.int/healthinfo/global_burden_disease/en/index.html.
All Developing Countries Low-Inc. Dev. Countries
2005 2015 2030 2005 2015 2030
Population (millions)
5,495
6,121
6,890
2,699
3,154
3,772
All Causes 100% 100% 100% 100% 100% 100% Communicable, maternal, perinatal and nutritional conditions 41% 37% 32% 53% 48% 41% A. Infectious and parasitic diseases 24% 23% 23% 31% 30% 28% 1. Tuberculosis 3% 3% 3% 3% 3% 3% 2. STDs excluding HIV 1% 1% 1% 1% 1% 1% b. Chlamydia 0% 0% 0% 0% 0% 0% 3. HIV/AIDS 6% 8% 11% 7% 9% 12% 4. Diarrheal diseases 4% 3% 2% 6% 4% 3% 5. Childhood-cluster diseases 3% 2% 1% 4% 3% 2% a. Pertussis 1% 1% 0% 1% 1% 1% d. Measles 1% 1% 1% 2% 2% 1% 8. Malaria 2% 2% 2% 4% 3% 2% 9. Tropical-cluster diseases 1% 1% 1% 1% 1% 1% e. lymphatic Filariasis 0% 0% 0% 1% 0% 0% B. Respiratory infections 6% 5% 3% 8% 7% 4% 1. Lower respiratory infections 6% 5% 3% 8% 6% 4% C. Maternal conditions 2% 2% 1% 3% 2% 2% D. Perinatal conditions (c) 7% 6% 4% 8% 7% 5% E. Nutritional deficiencies 2% 2% 1% 3% 2% 1% 1. Protein-energy malnutrition 1% 1% 1% 1% 1% 1% 4. Iron-deficiency anemia 1% 1% 0% 1% 1% 0%
Non-communicable diseases 46% 50% 54% 35% 39% 45% A. Malignant neoplasms 5% 5% 6% 3% 3% 4% 3. Stomach cancer 1% 1% 1% 0% 0% 0% 5. Liver cancer 0% 1% 1% 0% 0% 0% 7. Trachea, bronchus, lung cancers 1% 1% 1% 0% 0% 1% 9. Breast cancer 0% 0% 0% 0% 0% 0% 10. Cervix uteri cancer 0% 0% 0% 0% 0% 0% B. Other neoplasms 0% 0% 0% 0% 0% 0% C. Diabetes mellitus 1% 2% 2% 1% 1% 2% D. Endocrine disorders 0% 0% 1% 0% 0% 0% E. Neuropsychiatric conditions 12% 13% 13% 9% 10% 11% 1. Unipolar depressive disorders 4% 5% 5% 3% 4% 4% 2. Bipolar disorder 1% 1% 1% 1% 1% 1% 3. Schizophrenia 1% 1% 1% 1% 1% 1% 4. Epilepsy 1% 1% 1% 0% 1% 1% 5. Alcohol use disorders 1% 1% 1% 0% 0% 0% 6. Alzheimer and other dementias 0% 1% 1% 0% 0% 0% 9. Drug use disorders 0% 0% 0% 0% 0% 0%
29
12. Panic disorder 0% 0% 0% 0% 0% 0% 14. Migraine 0% 0% 0% 0% 0% 0% F. Sense organ diseases 5% 6% 7% 4% 5% 6% 1. Glaucoma 0% 0% 0% 0% 0% 0% 2. Cataracts 2% 2% 3% 2% 2% 3% 3. Vision disorders, age-related 1% 1% 1% 0% 1% 1% 4. Hearing loss, adult onset 2% 2% 2% 1% 2% 2% g. Cardiovascular diseases 10% 10% 11% 8% 9% 10% 2. Hypertensive heart disease 1% 1% 1% 0% 0% 0% 3. Ischemic heart disease 4% 4% 4% 4% 4% 4% 4. Cerebrovascular disease 3% 3% 4% 2% 2% 3% H. Respiratory diseases 4% 5% 6% 3% 4% 5% 1. Chronic obstructive pulmonary
disease 2% 3% 4% 1% 2% 3% 2. Asthma 1% 1% 1% 1% 1% 1% I. Digestive diseases 3% 3% 2% 3% 2% 2% 2. Cirrhosis of the liver 1% 1% 1% 1% 1% 1% J. Genitourinary diseases 1% 1% 1% 1% 1% 1% 1. Nephritis and nephrosis 1% 1% 1% 1% 1% 1% L. Musculoskeletal diseases 2% 2% 2% 1% 1% 2% 1. Rheumatoid arthritis 0% 0% 0% 0% 0% 0% 2. Osteoarthritis 1% 1% 1% 1% 1% 1% M. Congenital anomalies 2% 2% 1% 2% 2% 1% N. Oral conditions 0% 1% 1% 0% 0% 0%
Injuries 13% 13% 14% 12% 13% 14% A. Unintentional injuries 9% 10% 10% 9% 10% 10% 1. Road traffic accidents 3% 3% 4% 2% 3% 4% 2. Poisonings 0% 0% 0% 0% 0% 0% 3. Falls 1% 1% 1% 1% 1% 1% 4. Fires 1% 1% 1% 1% 1% 1% 5. Drownings 1% 1% 1% 1% 1% 1% 6. Other unintentional injuries 3% 3% 3% 3% 3% 4% B. Intentional injuries 3% 4% 4% 3% 3% 4% 1. Self-inflicted injuries 1% 1% 1% 1% 1% 1% 2. Violence 2% 2% 2% 1% 1% 1% 3. War 0% 1% 1% 1% 1% 1%
Note: Those conditions that have 0% for all six entrees have at least one projected value for females that is 1%, with the exception of drug use disorder and poisonings, in which two cases there is at least one projected value that is 1% for males.
30
31
Chart 1A. Studies on Health in Developing Countries,
1990-2005
0
100
200
300
400
500
600
1990 1995 2000 2005
EconLit
SocAb
Total
Chart 1B. PAA Presentations Related to Health in Developing
Countries, 1990-2005
0
20
40
60
80
100
120
140
1990 1995 2000 2005
32
Chart 1C. Average Annual Exponential Growth Rates between
1990-2 and 2003-5 in Studies and PAA Presentations Related to
Health and Development
EconLit, 15.7%
SocAb, 8.7%
Total Studies,
10.0%
PAA
Presentations,
8.9%
Chart 2A. Av. Annual Exponential Growth Rates for 1990-2 to
2003-5 in Studies by Three Major GBD/WHO Categories
11.4%
4.0%
10.1%
CMPNC NCD Injuries
33
Chart 2B. Av. Ann. Exp. Growth Rates from 1990-2 to 2003-5 in
PAA Presentations by Three Major GBD/WHO Categories
8.3%
6.2%
20.4%
CMPNC NCD Injuries
34
Chart 3A. Composition of Studies for 1990-2005 by Three Major
GBD/WHO Categories
CMPNC
38%
NCD
11%
Injuries
51%
35
Chart 3B. Composition of Studies for 2003-5 by Three Major
GBD/WHO Categories
CMPMC
50%
NCD
7%
Injuries
43%
36
Chart 3C. Composition of PAA Presentations for 1990-2005 by
Three Major GBD/WHO Categories
CMPNC
74%
NCD
15%
Injuries
11%
37
Chart 3D. Composition of PAA Presentations for 2003-5 by Three
Major GBD/WHO Categories
CMPNC
68%
NCD
16%
Injuries
16%
38
Chart 4A. Av. Exp. Ann. Growth Rates in Studies between 1990-2
and 2003-5 for Three Major GBD/WHO Categories with HIV/AIDS
Separate
CMPNC, 11.4%
HIV/AIDS,
12.8%
CMPNC-
HIV/AIDS, 5.7%NCD, 4.0%
Injuries, 10.1%

39
Chart 4B. Av. Exp. Ann. Growth Rates in PAA Presentations
between 1990-2 and 2003-5 for Three Major GBD/WHO
Categories with HIV/AIDS Separate
CMPNC, 8.3%
HIV/AIDS,
21.7%
CMPNC-
HIV/AIDS, 1.8%
NCD, 6.2%
Injuries, 20.4%
40
Chart 5A. Distribution of Studies in 1990-2005 for Three Major
GBD/WHO Categories with HIV/AIDS Separate
HIV/AIDS
34%
CMPNC-
HIV/AIDS
5%NCD
11%
Injuries
50%
41
Chart 5B. Distribution of Studies in 2003-5 for Three Major
GBD/WHO Categories with HIV/AIDS Separate
HIV/AIDS
43%
CMPNC-
HIV/AIDS
7%
NCD
7%
Injuries
43%
42
Chart 5C. Distribution of PAA Presentations in 1990-2005 for
Three Major GBD/WHO Categories with HIV/AIDS Separate
HIV/AIDS
33%
CMPNC-
HIV/AIDS
41%
NCD
15%
Injuries
11%
43
Chart 5D. Distribution of PAA Presentations in 2003-5 for Three
Major GBD/WHO Categories with HIV/AIDS Separate
HIV/AIDS
42%
CMPNC-
HIV/AIDS
26%
NCD
16%
Injuries
16%
44
Chart 6A. % Composition of DALYs Projected for Three Major
GBD/WHO Categories for All Developing Countries
41%37%
32%
46%50%
54%
13% 13% 14%
2005 2015 2030
CMPNC NCD Injuries
Chart 6B. % Composition of DALYs Projected for Three Major
GBD/WHO Categories for Low-Income Developing Countries
53%48%
41%35%
39%45%
12% 13% 14%
2005 2015 2030
CMPNC NCD Injuries
45
Chart 7A. % Ratio of Share in Studies in 2003-5 to Share in DALYS
for 2005 for Three Major GBD/WHO Categories with HIV/AIDS
Separate (100% =Average)
HIV/AIDS, 719%
NCD, 15%
Injuries, 330%
CMPNC, 122%CMPNC-
HIV/AIDS, 19%Total-HIV/AIDS,
60%
46
Chart 7B. % Ratio of Share in Studies in 1990-2005 to Share in
DALYS for 2030 for Three Major GBD/WHO Categories with
HIV/AIDS Separate (100% =Average)
HIV/AIDS, 306%
NCD, 20%
Injuries, 372%
CMPNC, 120%CMPNC-
HIV/AIDS, 23%
Total-HIV/AIDS,
75%
47
Chart 7C. % Ratio of Share of PAA Presentations in 2003-5 to
Share in DALYS for 2005 for Three Major GBD/WHO Categories
with HIV/AIDS Separate (100% =Average)
HIV/AIDS, 697%
NCD, 35%Injuries, 121%
CMPNC, 166%CMPNC-
HIV/AIDS, 75%Total-HIV/AIDS,
62%
Chart 7D. % Ratio of Share of PAA Presentations in 1990-2005 to
Share in DALYS for 2030 for Three Major GBD/WHO Categories
with HIV/AIDS Separate (100% =Average)
HIV/AIDS, 296%
NCD, 28%
Injuries, 78%
Total-HIV/AIDS,
76%
CMPNC, 231%CMPNC-
HIV/AIDS, 198%
Related Documents