12/8/2017 Cannes, France http://www.miptv.com http://mipcom.com OTT & Pay TV: Forever Together? Simon Murray Principal Analyst Digital TV Research www.digitaltvresearch.com

Welcome message from author
This document is posted to help you gain knowledge. Please leave a comment to let me know what you think about it! Share it to your friends and learn new things together.
Transcript

12/8/2017Cannes, France
http://www.miptv.com http://mipcom.com
OTT & Pay TV: Forever Together?
Simon Murray
Principal Analyst
Digital TV Research
www.digitaltvresearch.com
Best of friends….for now
Just a couple of years ago, OTT platforms and
pay TV operators were seen as enemies. Now
they are partners.
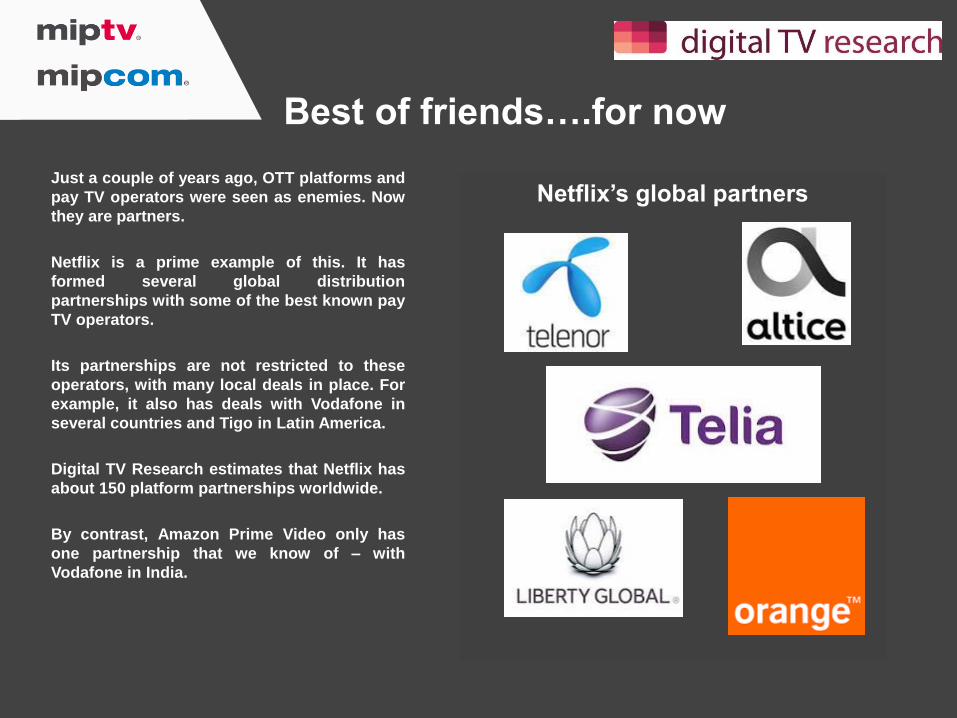
Netflix is a prime example of this. It has
formed several global distribution
partnerships with some of the best known pay
TV operators.
Its partnerships are not restricted to these
operators, with many local deals in place. For
example, it also has deals with Vodafone in
several countries and Tigo in Latin America.
Digital TV Research estimates that Netflix has
about 150 platform partnerships worldwide.
By contrast, Amazon Prime Video only has
one partnership that we know of – with
Vodafone in India.
Netflix’s global partners
Why they work together
Distribution partnerships with pay TV
operators, retailers, mobile operators and
broadband operators give SVOD platforms
immediate and intimate access to their
subscriber bases.
It also removes billing concerns.
The operators benefit from adding well-
known brands.
Furthermore, they don’t have to negotiate
their own content deals.
The number of pay TV operators launching
their own platforms has fallen considerably in
the last year as more and more partnerships
are formed with SVOD platforms.
How do SVOD platforms succeed in
international markets?
• Supply content in the local language
• Provide locally-produced content
• Produce original content
• Demonstrate subscription fee sensitivity to each
local market
• Take payments in local currency
• Deliver a means of payment other than credit
card
• Form local distribution partnerships with pay TV
operators, retailers, ISPs, telcos and/or mobile
operators.

Stormy weather ahead

Always the best solution?
There are many good reasons for pay TV operators and SVOD platforms to work together. However, sometimes
this does not work and the two parties remain rivals.
Several high profile pay TV operators have their own SVOD platforms. Many of them started before the current
trend for SVOD and pay TV operators to work together.
In many cases, pay TV operators started these SVOD platforms to counter the anticipated rise of the SVOD
platforms. Many pay TV operators also control substantial content rights, so starting their own platforms is a
good way for them further exploit their assets.
However, some pay TV operators have gone even further by bundling their SVOD platforms into their pay TV
packages. So there is no added financial value from the SVOD platforms. Pay TV operators benefit from this as it
enhanced their offer. They soak up any content licensing fees. However, it usually means that they spend less on
original SVOD content.
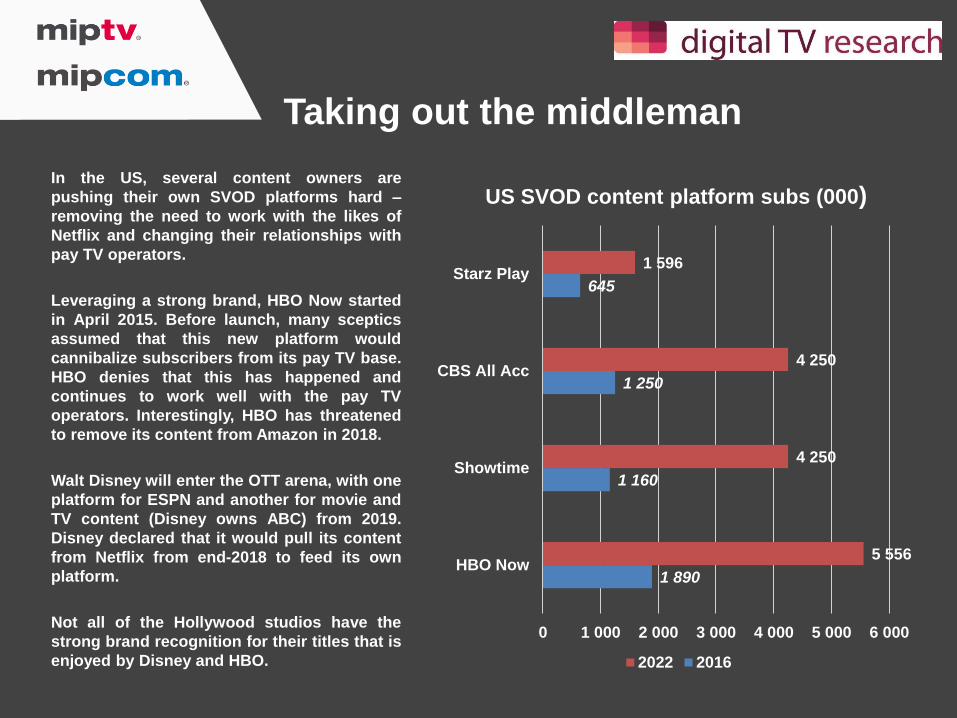
Taking out the middleman
In the US, several content owners are
pushing their own SVOD platforms hard –
removing the need to work with the likes of
Netflix and changing their relationships with
pay TV operators.
Leveraging a strong brand, HBO Now started
in April 2015. Before launch, many sceptics
assumed that this new platform would
cannibalize subscribers from its pay TV base.
HBO denies that this has happened and
continues to work well with the pay TV
operators. Interestingly, HBO has threatened
to remove its content from Amazon in 2018.
Walt Disney will enter the OTT arena, with one
platform for ESPN and another for movie and
TV content (Disney owns ABC) from 2019.
Disney declared that it would pull its content
from Netflix from end-2018 to feed its own
platform.
Not all of the Hollywood studios have the
strong brand recognition for their titles that is
enjoyed by Disney and HBO.
1 890
1 160
1 250
645
5 556
4 250
4 250
1 596
0 1 000 2 000 3 000 4 000 5 000 6 000
HBO Now
Showtime
CBS All Acc
Starz Play
US SVOD content platform subs (000)
2022 2016
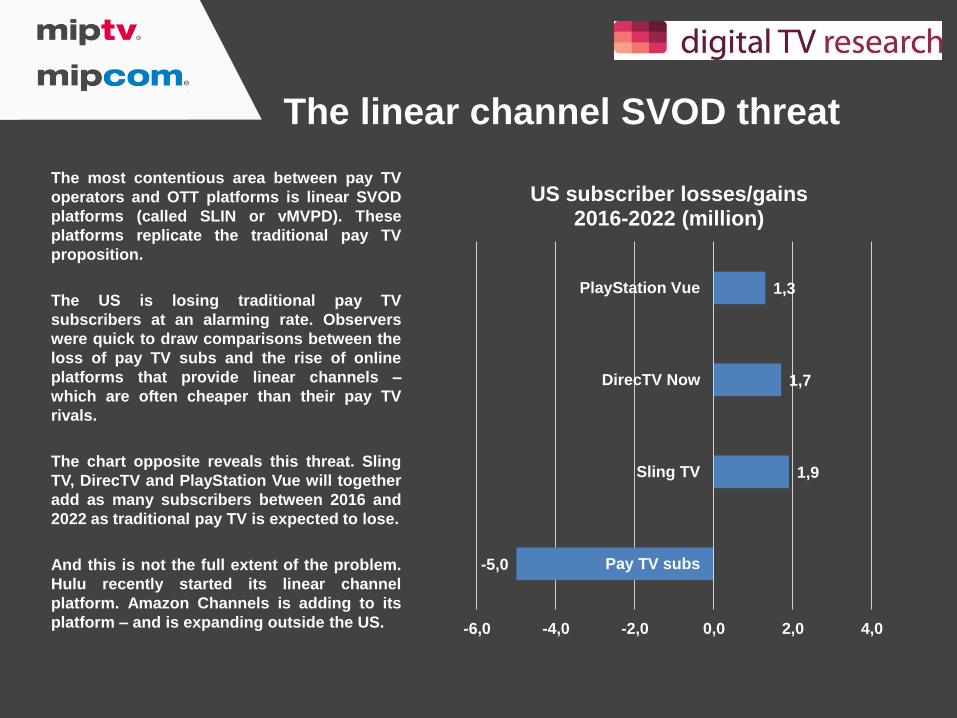
The linear channel SVOD threat
The most contentious area between pay TV
operators and OTT platforms is linear SVOD
platforms (called SLIN or vMVPD). These
platforms replicate the traditional pay TV
proposition.
The US is losing traditional pay TV
subscribers at an alarming rate. Observers
were quick to draw comparisons between the
loss of pay TV subs and the rise of online
platforms that provide linear channels –
which are often cheaper than their pay TV
rivals.
The chart opposite reveals this threat. Sling
TV, DirecTV and PlayStation Vue will together
add as many subscribers between 2016 and
2022 as traditional pay TV is expected to lose.
And this is not the full extent of the problem.
Hulu recently started its linear channel
platform. Amazon Channels is adding to its
platform – and is expanding outside the US.
-5,0
1,9
1,7
1,3
-6,0 -4,0 -2,0 0,0 2,0 4,0
Pay TV subs
Sling TV
DirecTV Now
PlayStation Vue
US subscriber losses/gains 2016-2022 (million)
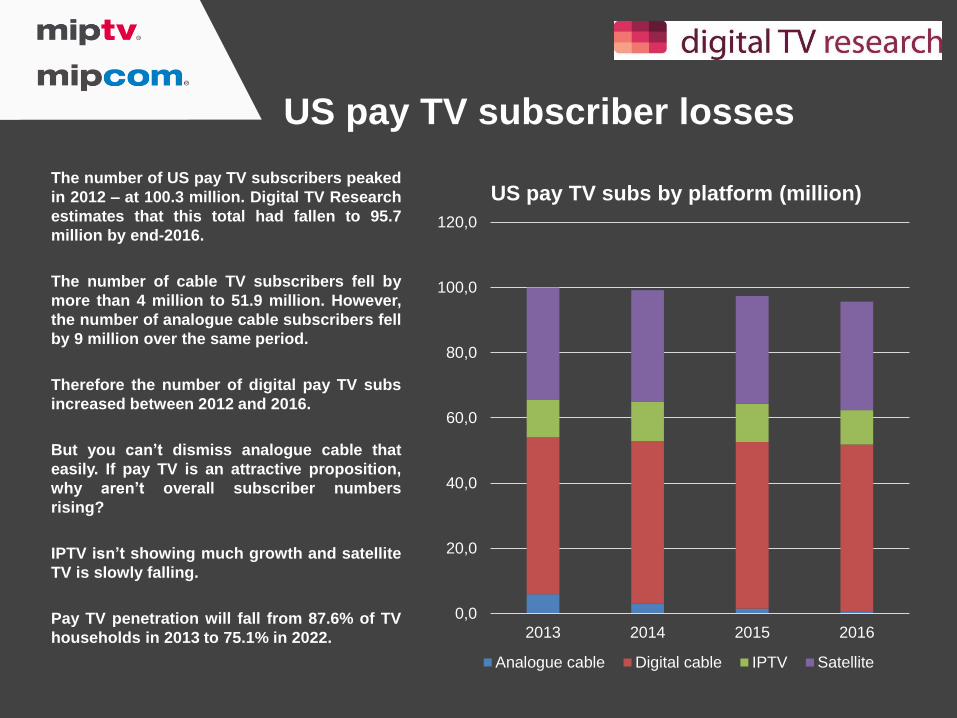
US pay TV subscriber losses
The number of US pay TV subscribers peaked
in 2012 – at 100.3 million. Digital TV Research
estimates that this total had fallen to 95.7
million by end-2016.
The number of cable TV subscribers fell by
more than 4 million to 51.9 million. However,
the number of analogue cable subscribers fell
by 9 million over the same period.
Therefore the number of digital pay TV subs
increased between 2012 and 2016.
But you can’t dismiss analogue cable that
easily. If pay TV is an attractive proposition,
why aren’t overall subscriber numbers
rising?
IPTV isn’t showing much growth and satellite
TV is slowly falling.
Pay TV penetration will fall from 87.6% of TV
households in 2013 to 75.1% in 2022.
0,0
20,0
40,0
60,0
80,0
100,0
120,0
2013 2014 2015 2016
US pay TV subs by platform (million)
Analogue cable Digital cable IPTV Satellite
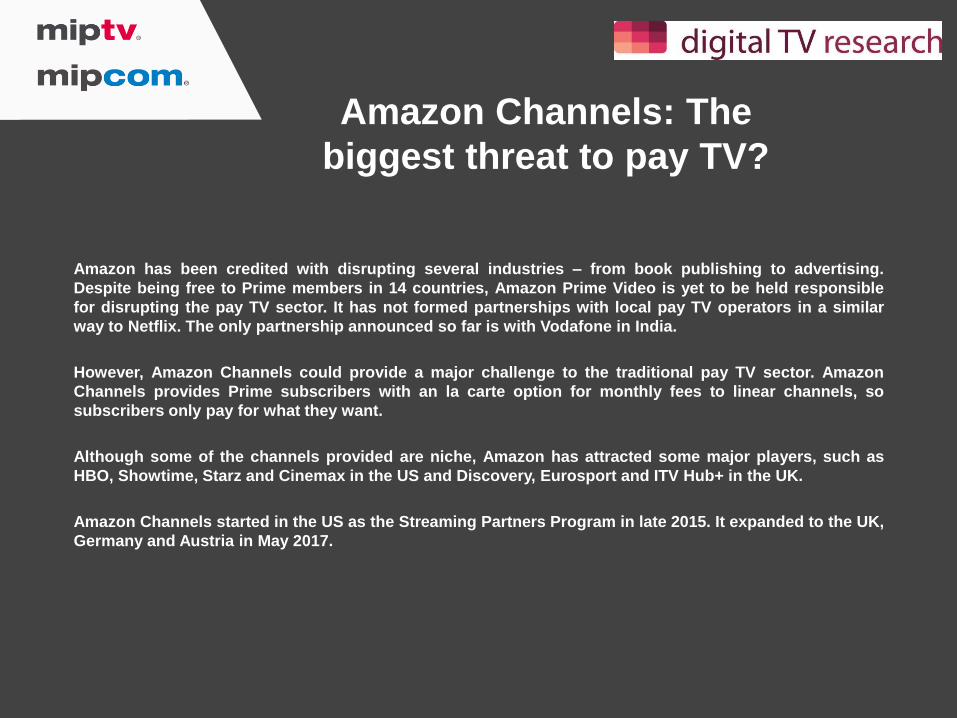
Amazon Channels: The
biggest threat to pay TV?
Amazon has been credited with disrupting several industries – from book publishing to advertising.
Despite being free to Prime members in 14 countries, Amazon Prime Video is yet to be held responsible
for disrupting the pay TV sector. It has not formed partnerships with local pay TV operators in a similar
way to Netflix. The only partnership announced so far is with Vodafone in India.
However, Amazon Channels could provide a major challenge to the traditional pay TV sector. Amazon
Channels provides Prime subscribers with an la carte option for monthly fees to linear channels, so
subscribers only pay for what they want.
Although some of the channels provided are niche, Amazon has attracted some major players, such as
HBO, Showtime, Starz and Cinemax in the US and Discovery, Eurosport and ITV Hub+ in the UK.
Amazon Channels started in the US as the Streaming Partners Program in late 2015. It expanded to the UK,
Germany and Austria in May 2017.
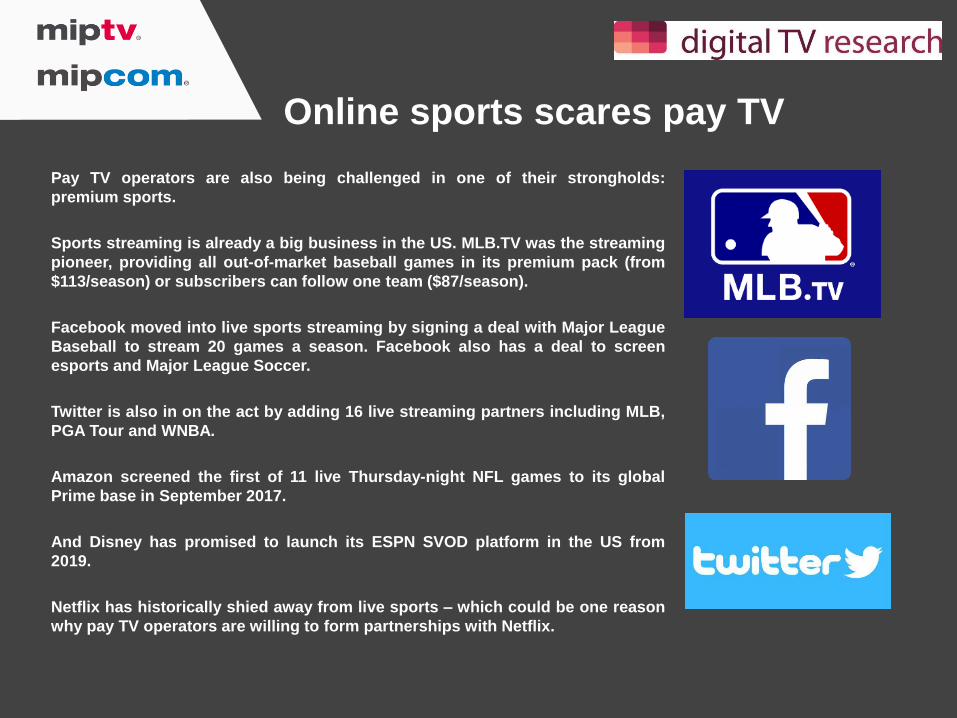
Online sports scares pay TV
Pay TV operators are also being challenged in one of their strongholds:
premium sports.
Sports streaming is already a big business in the US. MLB.TV was the streaming
pioneer, providing all out-of-market baseball games in its premium pack (from
$113/season) or subscribers can follow one team ($87/season).
Facebook moved into live sports streaming by signing a deal with Major League
Baseball to stream 20 games a season. Facebook also has a deal to screen
esports and Major League Soccer.
Twitter is also in on the act by adding 16 live streaming partners including MLB,
PGA Tour and WNBA.
Amazon screened the first of 11 live Thursday-night NFL games to its global
Prime base in September 2017.
And Disney has promised to launch its ESPN SVOD platform in the US from
2019.
Netflix has historically shied away from live sports – which could be one reason
why pay TV operators are willing to form partnerships with Netflix.

Coming up
roses
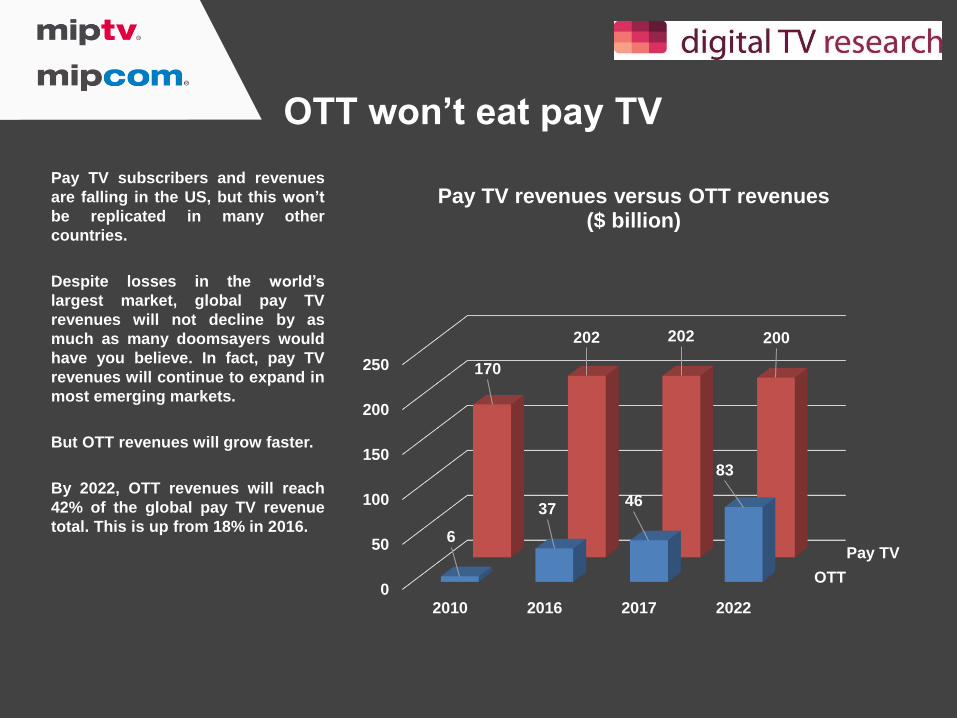
OTT won’t eat pay TV
Pay TV subscribers and revenues
are falling in the US, but this won’t
be replicated in many other
countries.
Despite losses in the world’s
largest market, global pay TV
revenues will not decline by as
much as many doomsayers would
have you believe. In fact, pay TV
revenues will continue to expand in
most emerging markets.
But OTT revenues will grow faster.
By 2022, OTT revenues will reach
42% of the global pay TV revenue
total. This is up from 18% in 2016.
OTT
Pay TV
0
50
100
150
200
250
2010 2016 2017 2022
6
3746
83
170
202 202 200
Pay TV revenues versus OTT revenues ($ billion)
SVOD: The OTT revenue winner
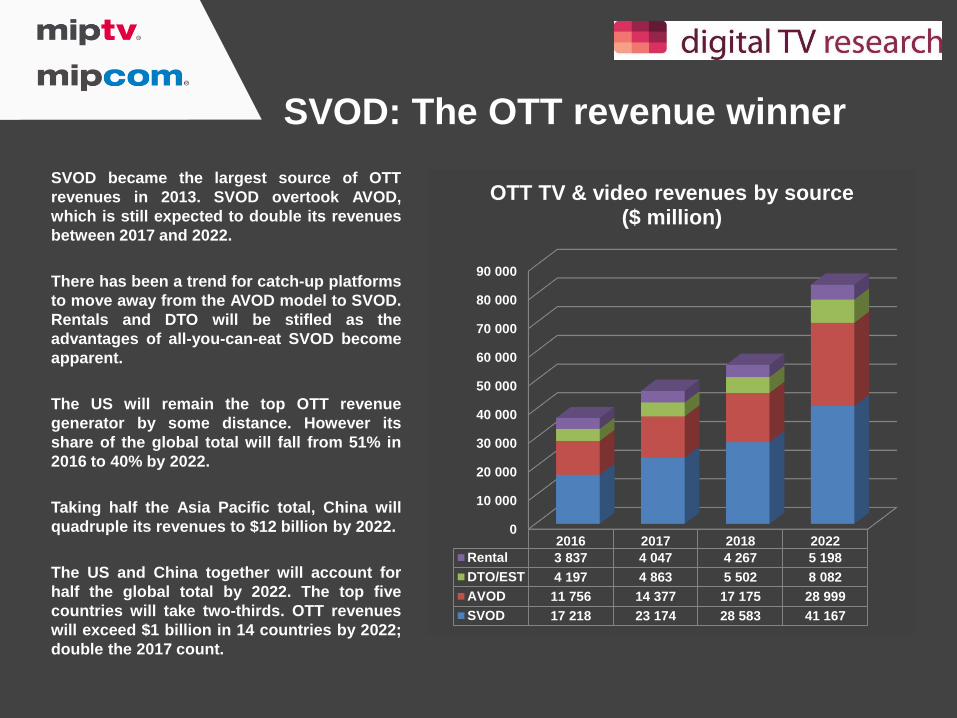
SVOD became the largest source of OTT
revenues in 2013. SVOD overtook AVOD,
which is still expected to double its revenues
between 2017 and 2022.
There has been a trend for catch-up platforms
to move away from the AVOD model to SVOD.
Rentals and DTO will be stifled as the
advantages of all-you-can-eat SVOD become
apparent.
The US will remain the top OTT revenue
generator by some distance. However its
share of the global total will fall from 51% in
2016 to 40% by 2022.
Taking half the Asia Pacific total, China will
quadruple its revenues to $12 billion by 2022.
The US and China together will account for
half the global total by 2022. The top five
countries will take two-thirds. OTT revenues
will exceed $1 billion in 14 countries by 2022;
double the 2017 count.
0
10 000
20 000
30 000
40 000
50 000
60 000
70 000
80 000
90 000
2016 2017 2018 2022
Rental 3 837 4 047 4 267 5 198
DTO/EST 4 197 4 863 5 502 8 082
AVOD 11 756 14 377 17 175 28 999
SVOD 17 218 23 174 28 583 41 167
OTT TV & video revenues by source ($ million)
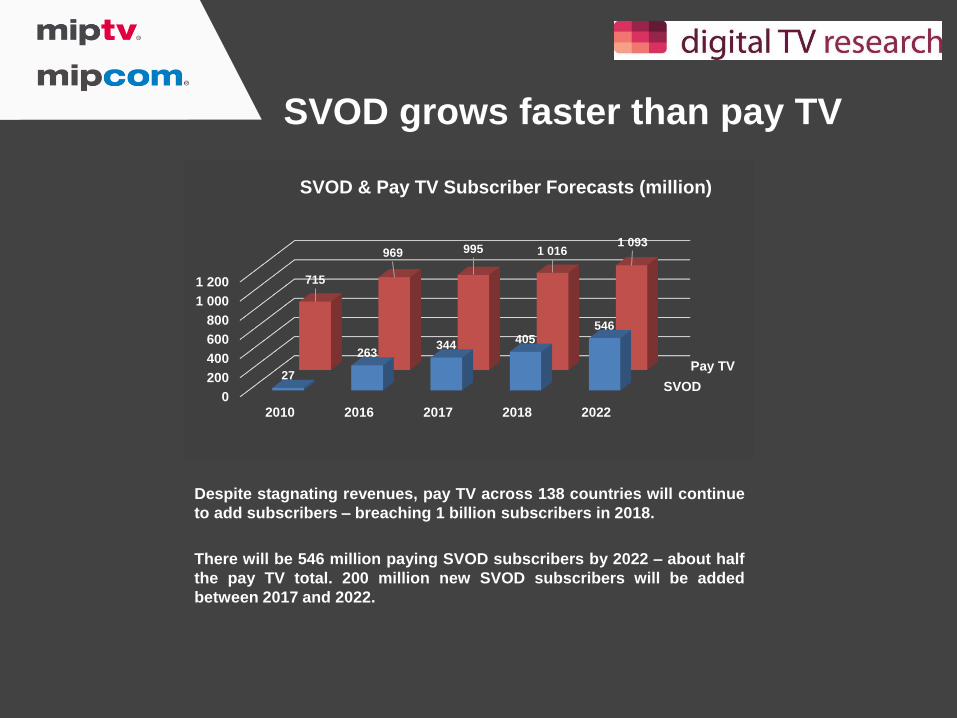
SVOD grows faster than pay TV
Despite stagnating revenues, pay TV across 138 countries will continue
to add subscribers – breaching 1 billion subscribers in 2018.
There will be 546 million paying SVOD subscribers by 2022 – about half
the pay TV total. 200 million new SVOD subscribers will be added
between 2017 and 2022.
SVOD
Pay TV
0
200
400
600
800
1 000
1 200
2010 2016 2017 2018 2022
27
263344
405546
715
969 995 1 0161 093
SVOD & Pay TV Subscriber Forecasts (million)
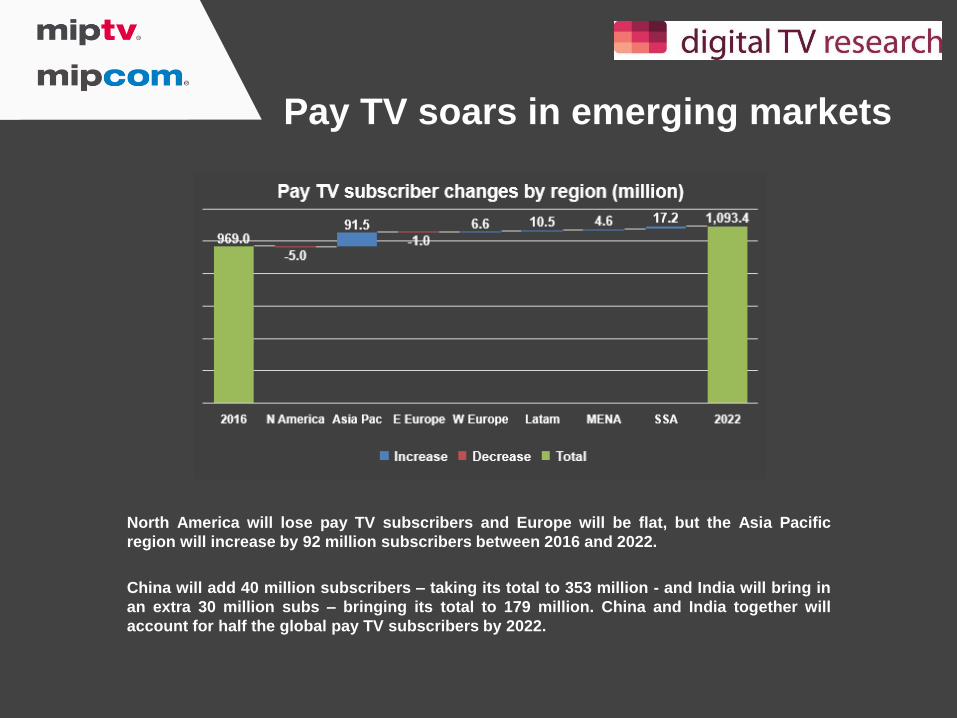
Pay TV soars in emerging markets
North America will lose pay TV subscribers and Europe will be flat, but the Asia Pacific
region will increase by 92 million subscribers between 2016 and 2022.
China will add 40 million subscribers – taking its total to 353 million - and India will bring in
an extra 30 million subs – bringing its total to 179 million. China and India together will
account for half the global pay TV subscribers by 2022.

SVOD: China to catch US soon
The US will still be SVOD subscriber market
leader by 2022, but China will be challenging
for its crown – despite the absence of Netflix
in China.
From the 203 million additions between 2017
and 2022, China will contribute 53 million, the
US 36 million and India 20 million. These
three countries will supply half the world’s
additional subscribers.
These figures are for paying SVOD
subscribers.
Some pay TV operators, especially in Latin
America, Spain and France, have bundled
their SVOD platforms in with their top pay TV
tiers, so these homes are not paying for
SVOD. 124160
86
1396
26
22
26
14
19
92
176
0
100
200
300
400
500
600
2017 2022
SVOD subs by country (million)
USA China India Japan UK Others
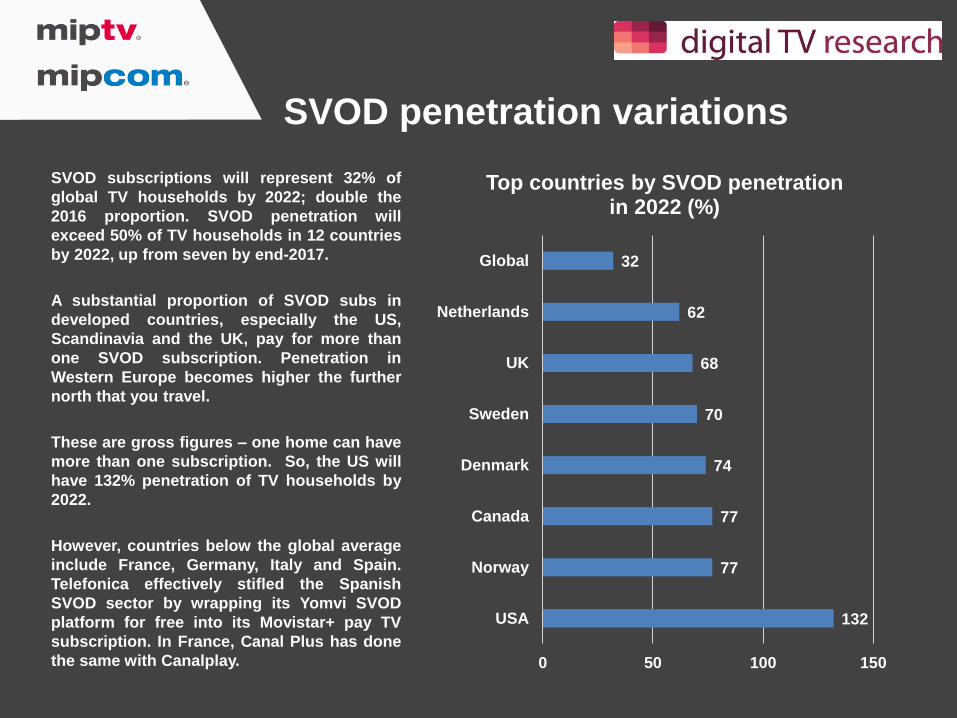
SVOD penetration variations
SVOD subscriptions will represent 32% of
global TV households by 2022; double the
2016 proportion. SVOD penetration will
exceed 50% of TV households in 12 countries
by 2022, up from seven by end-2017.
A substantial proportion of SVOD subs in
developed countries, especially the US,
Scandinavia and the UK, pay for more than
one SVOD subscription. Penetration in
Western Europe becomes higher the further
north that you travel.
These are gross figures – one home can have
more than one subscription. So, the US will
have 132% penetration of TV households by
2022.
However, countries below the global average
include France, Germany, Italy and Spain.
Telefonica effectively stifled the Spanish
SVOD sector by wrapping its Yomvi SVOD
platform for free into its Movistar+ pay TV
subscription. In France, Canal Plus has done
the same with Canalplay.
132
77
77
74
70
68
62
32
0 50 100 150
USA
Norway
Canada
Denmark
Sweden
UK
Netherlands
Global
Top countries by SVOD penetration in 2022 (%)
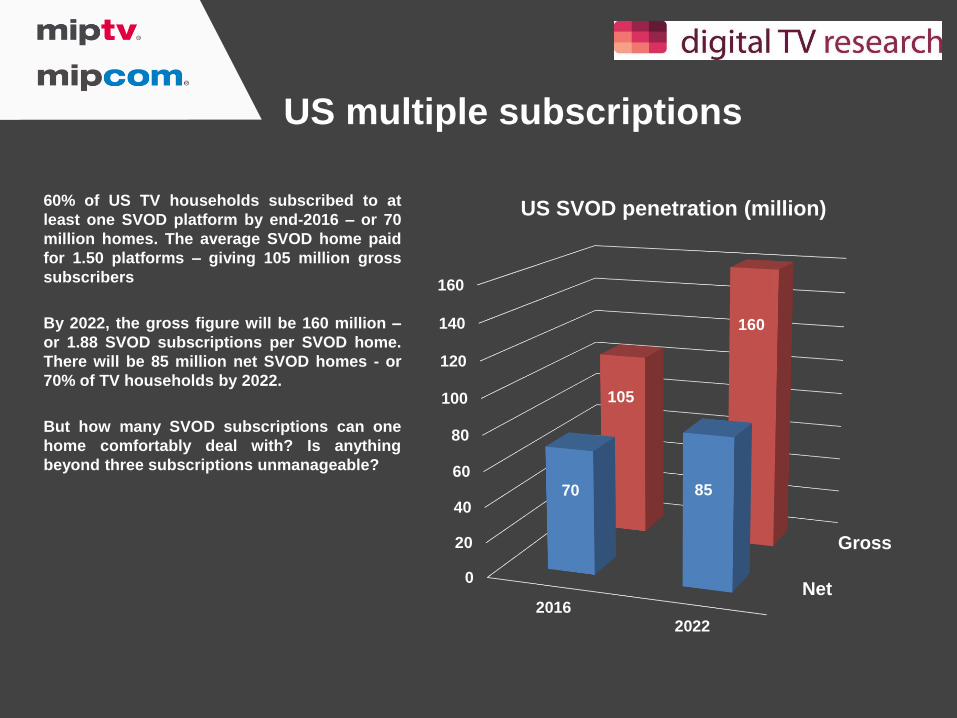
US multiple subscriptions
60% of US TV households subscribed to at
least one SVOD platform by end-2016 – or 70
million homes. The average SVOD home paid
for 1.50 platforms – giving 105 million gross
subscribers
By 2022, the gross figure will be 160 million –
or 1.88 SVOD subscriptions per SVOD home.
There will be 85 million net SVOD homes - or
70% of TV households by 2022.
But how many SVOD subscriptions can one
home comfortably deal with? Is anything
beyond three subscriptions unmanageable?
Net
Gross
0
20
40
60
80
100
120
140
160
20162022
70 85
105
160
US SVOD penetration (million)
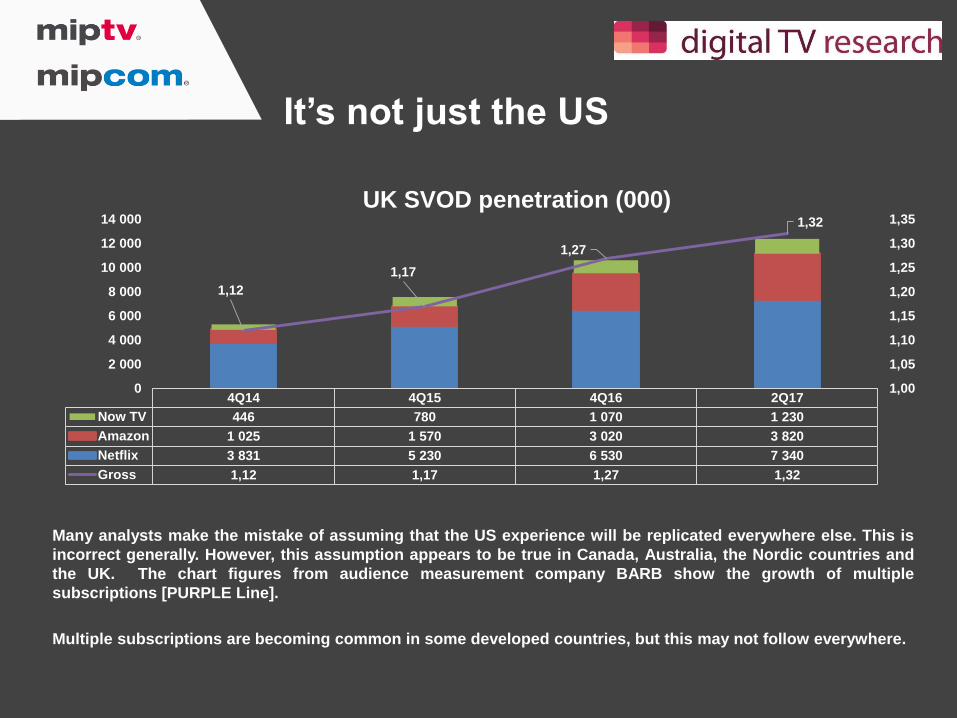
It’s not just the US
Many analysts make the mistake of assuming that the US experience will be replicated everywhere else. This is
incorrect generally. However, this assumption appears to be true in Canada, Australia, the Nordic countries and
the UK. The chart figures from audience measurement company BARB show the growth of multiple
subscriptions [PURPLE Line].
Multiple subscriptions are becoming common in some developed countries, but this may not follow everywhere.
4Q14 4Q15 4Q16 2Q17
Now TV 446 780 1 070 1 230
Amazon 1 025 1 570 3 020 3 820
Netflix 3 831 5 230 6 530 7 340
Gross 1,12 1,17 1,27 1,32
1,12
1,17
1,27
1,32
1,00
1,05
1,10
1,15
1,20
1,25
1,30
1,35
0
2 000
4 000
6 000
8 000
10 000
12 000
14 000
UK SVOD penetration (000)
About the Author
This report is brought to you by MIPTV-MIPCOM
MIPTV and MIPCOM are the world’s most important globalmarkets for the TV and digital media industry. They are thekey events for buying and selling, financing and distributingprogrammes in all genres, on all platforms.Together, every 6 months, they form the annual landmarkevents of the entertainment calendar, attracting key industryexecutives, thought-leaders and creative talent from theentire content spectrum to negotiate deals, network and gaininsight.
MIPTV and MIPCOM respectively take place every Apriland October in Cannes, France.
Our websites
http://feeds.feedburner.com/mipworld/ABNFhttp://twitter.com/mip
http://youtube.com/mipmarkets
http://facebook.com/mipmarkets http://linkd.in/mipmarkets
http://flickr.com/photos/mipmarkets
To download our MIPTV / MIPCOM app:
http://bit.ly/mymipapp
To follow us:
http://www.miptv.com http://www.mipcom.com
Simon Murray, Principal Analyst, Digital TV Research
Digital TV Research Limited was established by Simon Murray in January 2011. Simon’s
extensive international industry knowledge and contacts have been built up since he began
covering global media developments in 1988. Simon has authored in excess of 600 forecast
reports.
London-based Digital TV Research publishes more than 20 reports a year, which have been
purchased by over 350 clients. The forecasts and analysis in these reports covers more than 130
countries.
www.digitaltvresearch.com
Twitter @dtvresearch
https://www.linkedin.com/company/digital-tv-research/
Related Documents