1 Optimization of Well Stimulation Fluids in the Marcellus Shale Gas Development Using Integrated Technologies EME 580: FINAL REPORT By Olawoyin, Richard; [email protected] York, Jason; [email protected] Madu, Christian; [email protected] Li, Hang; [email protected] Ahn Chong Hyun; [email protected] Enab, Khalid; [email protected] MAY 1, 2011

Welcome message from author
This document is posted to help you gain knowledge. Please leave a comment to let me know what you think about it! Share it to your friends and learn new things together.
Transcript
1
Optimization of Well Stimulation Fluids in the Marcellus Shale Gas Development
Using Integrated Technologies
EME 580: FINAL REPORT By
Olawoyin, Richard; [email protected] York, Jason; [email protected]
Madu, Christian; [email protected] Li, Hang; [email protected]
Ahn Chong Hyun; [email protected] Enab, Khalid; [email protected]
MAY 1, 2011

2
TABLE OF CONTENT
Problem Statement … … … … … … … … … … 1
Novelty … … … … … … … … … … … 1
Executive Summary … … … … … … … … … 2
Chapter 1: Literature Review … … … … … … … … 6
1.1 Introduction … … … … … … … … … 6
1.2 Marcellus Shale … … … … … … … … 7
1.2.1 Waste Water Management in the Marcellus Shale … … … ... 8
1.2.2 Water Quality … … … … … … … … ... 9
1.2.3 Waste Water Generation … … … … … … … 9
1.2.4 Contaminants … … … … … … … … … 10
Chapter 2: Treatment Methods … … … … … … … … 12
2.1 Current Practices … … … … … … … .. 12
2.2 Projections … … …. … … … … … … … 12
Chapter 3: Drilling and Completion … … … … … … … 15
3.1 Drilling … … … … … … … … … … 15
3.1.1 Vertical Wells … … … … … … … … … 15
3.1.2 Horizontal wells … … … … … … … … … 15
3.2 Drilling Fluids … … … … … … … … … 16
3.3 Drilling Fluids Contamination … … … … … … … 16

3
3.4 Completion … … … … … … … … … … 17
3.4.1 Open Hole Completion … … … … … … … … 17
3.4.2 Conventional Perforated … … … … … … … … 17
3.4.3 Sand Exclusion Completion … … … … … … … 17
3.4.4 Permanent Completion … … … … … … … … 18
3.4.5 Multiple Zone Completion … … … … … … … … 18
Chapter 4: Stimulation … … … … … … … … … 20
4.1 Stimulation Techniques … … … … … … … … 20
4.2 Hydraulic fracturing … … … … … … … … 20
4.3 Slickwater … … … … … … … … … … 21
4.4 Flowback Water … … … … … … … … … 21
4.5 Microemulsion … … … … … … … … … 22
4.6 Proppant Transportation Modifier … … … … … … … 23
Chapter 5: Osmotic Treatment … … … … … … … … 24
5.1 Reverse Osmosis … … … … … … … … … 24
5.2 Forward osmosis … … … … … … … … … 24
5.3 Pressure Retarded Osmosis and Reverse osmosis … … … … … 25
5.4 Draw Solution … … … … … … … … … 26
5.5 Membrane Selection … … … … … … … … 27
5.6 Hybrid Method … … … … … … … … … 29

4
Chapter 6: Renewable Energy Generation … … … … … … … 31
6.1 History … … … … … … … … … … 31
6.2 Blue Energy … … … … … … … … … 34
6.3 Literature … … … … … … … … … … 35
6.4 Methods of Generating Renewable Energy … … … … … 37
6.5 Theory of Osmotic Process … … … … … … … 39
Chapter 7: Economic Analysis … … … … … … … … 41
Chapter 8: Analysis and Design … … … … … … … … 47
8.1 Reservoir Simulation … … … … … … … … 47
8.2 Hydraulic Fracturing … … … … … … … … 52
8.3 Characteristics of Post Fracture flowback water … … … … … 56
8.4 Engineering Consideration …… … … … … … … 57
8.5 Hydropneumatic Tanks … … … … … … … … 57
8.6 Concept of Forward Osmosis … … … … … … … 58
8.7 Field Applicability of the Forward Osmosis Unit … … … … … 59
8.8 Forward Osmosis and Blue Energy … … … … … … 59
8.9 Goal of the Integrated System … … … … … … … 60
8.10 System Housing Selection … … … … … … … … 61
8.11 Flowback Water Storage Selection … … … … … … 62
8.12 Draw Solution Selection … … … … … … … … 62
5
8.13 Forward Osmosis Membrane selection … … … … … … 63
8.14 Supervisory Control and Data Acquisition (SCADA) … … … … 64
8.15 System Design … … … … … … … … … 64
Chapter 9: Osmotic Energy Generation … … … … … … … 66
9.1 The Principle of Pressure Retarded Osmosis (PRO) … … … … 66
9.2 Power Density in PRO … … … … … … … … 68
9.3 Forward Osmosis … … … … … … … … … 68
9.4 Blue energy Generation From Waste Water … … … … … 69
9.5 Turbine and Power Storage Considerations … … … … … 70
9.6 Osmotic Power Generation System … … … … … … 70
Chapter 10: Associate Costs Evaluations … … … … … … … 72
10.1 Drilling and Completion Cost … … … … … … … 73
10.2 Conventional Methods and Challenges … … … … … … 75
10.3 Recycle and Reuse the Wastewater onsite… … … … … … 76
10.4 Design Economic Analysis … … … … … … … 76
10.5 Total Cost Comparison … … … … … … … … 77
Chapter 11: Environmental Impact of Forward Osmosis Technology … … … 78
Chapter 12: Regulation … … … … … … … … … 79
Chapter 13: Conclusion … … … … … … … … … 81
Chapter 14: Recommendation … … … … … … … … 82

6
LIST OF FIGURES
Figure 1: Shale Play in the US: Courtesy: EIA ... … … … … … 83
Figure 2: Stratigraphic Column Showing The Marcellus Shale … … … … 83
Figure 3: Drilling by a public water reservoir Beaver Run Reservoir, (marcellus-shale.us) 84
Figure 4: Breakdown of Produced Water Chemical Constituents … … 84
Figure 5: Vapor compression evaporation process, Pierce D.A. 2010... 85
Figure 6: Separation via filtration Pierce D.A. 2010 … … … … 85
Figure 7: Volumetric Composition of a Shale Gas Fracture Fluid (Source: J. Daniel,
Brian Bohm, and Davd Cornue, 2009) … … … … … … … 86
Firgure 8: Representation of injected fracturing fluid being trapped near the
proppant pack (Penny G.S., 2005) … … … … … … … 86
Figure 9: Fluid Recover Data for Case Studies … … … … … … 87
Figure 10: Slickwater bed load proppant transport(N. Kostenuk, 2010)… … … 87
Figure 11: Slickwater with proppant transportation modifier (N. Kostenuk, 2010) … 88
Figure 12: Comparison of Proppant Conductivity and Permeability (N. Kostenuk, 2010) 88
Figure 13: Osmotic Pressure Gradient … … … … … … … 89
Figure 14: Illustration of flow diagram for draw solution selection. 89
Figure 15: Osmotic Pressure with NH4HCO3 as Draw Solution (McGinnis, 2007) 90
Figure 16: Box Diagram of Experimental Forward Osmosis Design. (McClutcheon 2006)90
Figure 17. Shows SEM Photograms of Two Hollow Fiber Forward Osmosis Membranes
Developed by Wong et. Al. 2010 91
Figure 18. Morphology of PES FO hollow fiber substrates. (a) #A 91
cross-section at 45×, (b) #A enlarged at 200×, (c) #B cross-section at 45×,
and (d) #B enlarged at 200×.[Wong,2010]
Figure 19. Cross-section morphologies of FO membranes. (a) #A-FO 92
hollow fiber at 5000×; (b) #B-FO hollow fiber at 5000×; (c) Cartridge-type
HIT flat sheet at 300×; (d) Pouch-type HIT flat sheet at 300×.(Wong,2010)
Figure 20 - Water flux data for 0.5 M NaC1 draw solution and a variety of … … 93
NaC1 feed solutions ranging from deionized water to 0.375 M. (Gray, 2006)
Figure 21. Cross-section of the implanted DUROS® System. (Ng,2006)… 93

7
Figure 22 - Simple water mill - horizonal or Norse mill … …. …. … … …. 94
Figure 23 - Complex vertical water mills 94
Figure 24 - A cross-section of a hot box. Eighteenth- and nineteenth-century
scientists used the hot box to test how much sunheat glass-covered enclosures could trap. 95
Figure 25: The salinity-gradient energy potential makes the 30-km long Afsluitdijk in The
Netherlands comparable to the 221 m high Hoover Dam in Nevada and Arizona (USA). 95
Figure 26 - A visual demonstration of how a solar pond is used to generate electricity.
Source: www.powerfromthesun.net/Chapter6/Chapter6.htm. Author: unknown. Permission:
96www.powerfromthesun.net/Chapter6/Chapter6.htm.
Figure 27 - Schematic representation of reverse electrodialysis; C is a cation
exchange membrane and A is an anion exchange membrane. 96
Figure 28 - Generation of energy by Pressure retarded osmosis method by Statkraft’s prototype
plant 97
Figure 29 - Representation of solvent flow in FO, PRO, and RO. Membrane orientation
is indicated in each system by the thick black line representing the membrane dense layer. 97
Figure 30 - Magnitude and direction of Jw for FO, PRO, and RO and magnitude
of W for PRO is shown. Figure adapted from (K. L. Lee et al) 98
Figure 31: Net Cost Calculator (212 Resources,2009) 98
Figure 32: Number of wells drilled in the PA section of the Marcellus Shale 99
Figure 33: Slurry Volume at different stages 100
Figure 34: Facture Geometry 100
Figure 35: Fracture Profile in the Marcellus Shale Bradford County 101
Figure 36: Fracture extension in the Shale formation 102
Figure 37 (horizontal well) 103
Figure 38: (Gas rate vs. Time for horizontal well in 40 years) 103
Figure 39: (Cumulative gas vs. tome for horizontal well in 40 years) 104
Figure 40: (Pressure distribution after 40 years for one horizontal well) 104
Figure 41: (Dual horizontal well) 105
Figure 42: (Gas rate vs. Time for dual horizontal well in 40 years) 105
Figure 43: (Cumulative gas vs. tome for dual horizontal well in 40 years) 106
Figure 44: (Pressure distribution after 40 years for dual horizontal well) 106
Figure 45: (Dual horizontal well with distance) 107
8
Figure 46: (Gas rate vs. Time for dual horizontal with distance well in 40 years) 107
Figure 47: (Cumulative gas vs. tome for dual horizontal with distance well in 40 years) 108
Figure 48: (Pressure distribution after 40 years for dual horizontal wit distance well) 108
Figure 49: (Gas rate vs. Time for well 1 of two dual horizontal with distance well in 40 years)109
Figure 50: (Gas rate vs. Time for well 2 of two dual horizontal with distance well in 40 years)109
Figure 51: (Cumulative gas vs. tome for well 1 dual horizontal with distance well in 40 years)110
Figure 52: (Cumulative gas vs. tome for well 2 dual horizontal with distance well in 40 years)110
Figure 53: (Pressure distribution after 40 years for two dual horizontal wit distance well) 111
Figure 54: (Multi-lateral well) 112
Figure 55: (Gas rate vs. Time for well 2 of multi-lateral) 112
Figure 56: (Cumulative gas vs. tome for multi-lateral) 113
Figure 57: (The cumulative gas for all drilling techniques we have tried) 114
Figure 58: Fracturing activities 114
Figure 59: The percentage of friction reduction caused by adding salt-toerlant friction reducer.
Source: SPE 125987 115
Figure 60: Effctiveness of 20% active DBNPA biocide against SRB 115
Figure 61: Surface tension test 116
Figure 62: Water recovery test 116
Figure 63: CarboProp 117
Figure 64: CarboLite 117
Figure 65: Ceramic Proppant 117
Figure 66: Marcellus Shale Well flowback-load volume percent recovery vs. flowback volume118
Figure 67: Marcellus Shale Well flowback analysis-major citation trend 118
Figure 68: Marcellus Shale Well flowback analysis-major cation trend 119
Figure 69: Marcellus Shale Well flowback analysis-anion trend 119
Figure 70: Marcellus Shale Well flowback – monovalent ion trend 120
Figure 71: Marcellus Shale Well flowback – divalent cation trend 120
Figure 72: Marcellus Shale Well flowback – barium trend 121
Figure 73: Schematic diagram of hydro-pneumatic tank (tankdrawing.com) 122
Figure 74. Box Diagram Illustrating the Components and Flow Process through Novel Semi-
Portable Centralized Water Treatment Facility. 123

9
Figure 75 - The Dimensions of the Dual Insulated Dry Goods Shipping Cargo Container to House
Forward Osmosis and Blue Energy Unit. 124
Figure 76 - The Dual Insulated Dry Goods Shipping Cargo Container and Chassis 124
Figure 77 - 120 Gallon Excalibur ®intermediate bulk container (IBC) 125
Figure 78 - Control panel of the SCADA system used to maintain draw solution
concentration and temperature, and record experimental data 125
Figure 79 - Schematic Drawing -Novel Semi-Portable Centralized Forward Osmosis Water
Treatment Facility 126
Figure 80 - Generalized Footprint - Novel Semi-Portable Centralized Forward Osmosis Water
Treatment Facility. 127
Figure 81: Direction of water flux in the PRO method 127
Figure 82: Illustration of osmotic driving forces profiles across a semi-permeable membrane, and
the effects of the ICP and ECP 128
Figure 83: The forward osmosis (FO) process 128
Figure 84: Illustration of change in volume in FO 129
Figure 85: SEM micrographs of a TFC-PRO membrane: (A) cross section
with a fingerlike macrovoid structure (B) magnified view of thepolyamide active
layer surface, and (C) magnified view of the skin layer at the top of the porous support
with dense, spongelike morphology. 129
Figure 86: Plots of modeled water flux, Jw, and power density, W, (bottom) as a function of
applied hydraulic pressure, ΔP, for TFC-PRO LP#1 (left),MP#1 (center), and HP#1 (right)
membranes and their respective characteristic parameters (top): intrinsic water permeability, A;
solute permeability coefficient, B; and support layer structural parameter, S. Osmotic pressure of
synthetic seawater is 26.14 bar, as determined by OLI Stream Analyzer software, and osmotic
pressures of synthetic river water and 1,000 ppm TDS brackish water are 0.045 and 0.789 bar
respectively (Yin et al, 2011) . 130
Figure 87 Mobile FO onsite system (EMERALDSURF,2008) 131
Figure 88 - Trailer mounted FO filtration system (EMERALDSURF,2008) 131

LIST OF TABLES
Table 1: Aqueous solution osmotic pressure (πDS), concentration (CDS),
solubility, and diffusion coefficient (D). [Achilli 2010] 132
Table 2: Comparison of energy requirements of current seawater desalination
technologies to the ammonia-carbon dioxide FO process Data for MSF, MED-TVC,
and MED low temperature were taken from Morinetal. And for RO from Alvonyis et al. 132
Table 3: Summary of experimental flux data, corresponding bulk osmotic pressures (Tt),
and calculated K values for the experiments with NaC1 depicted in Figs 1, 3, and 4.
Note that"AL" refers to the membrane active layer while "SL" refers to the
membrane support layer. (Wanling 2006) 133
Table 4: Effectiveness of Forward Osmosis on Various Landfill Leachate Contaminants.
(Cath, 2007) 133
Table 5: Drilling and completion costs (J., Pletcher,2009) 134
Table 6: Seven-fracture economics for $3 and $6 per Mcf gas pricing (J., Pletcher,2009) 134
Table 7: Fracture Design Treatment Schedule. 135
Table 7b: The reservoir properties. 136
Table 7c: Fracturing fluid additives, main compounds and common uses. 136
Table 7d: Clay and mineralogy of three shale. 137
Table 7e: Final additive concentration. 138
Table 8: Marcellus shale well late stage flowback water chemical characterization 138
data
Table 9: Marcellus shale well floback analysis data for 20 days 139
Table 10: Marcellus flowback water sample-low dissolved solids, hydro fracture. 140
Table 11: Marcellus flowback water sample-moderate dissolved solids, hydro fracture. 140
Table 12: Marcellus flowback water sample-high dissolved solids, hydro fracture. 140
Table 13: Least cost for the Countries in 2010 140
References 141

1
PROBLEM STATEMENT
It is important to increase the economic attractiveness of the unconventional gas sources to the
private sector by;
decreasing risks,
increasing reliability,
help operators substantially lower operational costs
meet increasingly stringent environmental regulations,
recycle water to reduce demand on local supplies.
A solution that lessens the environmental impact of gas drilling and reduces the current treatment
cost to service providers.
Our Integrated Planning Approach reveals synergies that;
reduced life-cycle costs of infrastructure,
reduced greenhouse gas emissions,
reduced energy usage from conventional sources,
enhance other environmental benefits,
reduced environmental impact without sacrificing performance.
NOVELTY
1. New waste water treatment integrated technology
2. Drilling fluid and fracturing fluids optimum design to facilitate higher load recovery
3. Energy generation from flow back fluid treatment
4. Innovative membrane selection for forward osmosis
5. Pioneering economic analysis of the integrated system

Executive Summary This integrative design project placed an enormous emphasis on the unconventional gas
development in the Marcellus Shale, which the Bradford County as the center focus. The need
for an effective control of flow back waters, which are derived as byproducts of well stimulation
in an attempt to improve the economic viability of a tight gas well, was deemed necessary in
curtailing the challenges of pollution and negative image/perception in which operators are
viewed. A complete assessment of the shale origin, deposition, constituent, mineralogy,
stratigraphy, paleo-environmental significance, and economical potential was carried out to aid
in understanding the composition of the rocks found along the route of exploration and
production. The Bradford county is a prolific area with vast gas production potentials, which also
signals challenges such as the operational fluid management. A typical well was designed in the
Springfield township of Bradford using CMG software to analyze the production potential in the
area over 40 years, and a fracture design was done using the FracPro software. The simulation
demonstrates that hydraulic fracture can appreciably increase cumulative production and
production rate in the well. An estimated amount of water needed to fracture open the formation
for the free flow of gas was 3.6 Million gallons per day (approximately 85, 714 barrels) and due
to the efficient well design and stimulation design, a load recovery of approximately 86% of the
injected fluid is achievable which amount to 73,714 barrels of waste water to be treated.
The system capacity of the Forward Osmosis process, operating on a hydraulic fracturing flow-
back water will treat; 14, 400 Barrels = 604, 800 gallons per day with an “average” chemical
composition of; 4,300 mg/l barium, 21,850 mg/l calcium, 14,000 mg/l magnesium, and 3,400
mg/l strontium. These would produce, at 40% solids sludge cake, 67,000 lb of barium sludge and
281,815 lb of calcium/strontium/magnesium sludge per day. Exclusive of the incoming hydraulic
fracture flowback water and treated water storage tanks, we have estimated that a 604, 800 gpd
FO process system would require a hydro-pneumatic tank and a vessel for the FO system.
The novel design takes into consideration the flowback recovery per hour in our system, which is
600bbl/hr for the centralized system, but 150bbl/hr for a single well pad. The tank size required
would be a 25,000 gallon tank, covering approximately 1,202 square feet and cost $52,255. In

3
other to prevent corrosion, an epoxy lining was installed which increased the cost to $64,610
with a design working pressure of 125# ASME.
The system components composed of the following in summary;
• 4 inch by 4 inch, 17 bbl/min centrifugal transfer pump to pump water from wells into
• A elevated 25,000 gallon hydro pneumatic tank
• A 40ft x 8ft x 8ft dual insulated dry goods shipping container will be used to house our
Forward Osmosis Unit
• A low pressure recirculation vessel will house the 120 1m2 Spiral Wound TFC MP
Membrane Modules and Ammonium Bicarbonate Draw Solution
• The dissolved solids will be removed from into120 gal Excalibur ®intermediate bulk
container (IBC)
• The dilute draw solution flows through a 1.2 kW turbine generating the power for our
system. Energy will be stored in a minimum 1.2 kW capacitor.
• The dilute draw solution then flows into a single vacuum distillation column and reboiler
for separation of reclaim water from ammonium and carbon dioxide gases.
• Reclaim passes into a storage container to be reused for future well fracturing
The draw solution composition and control system;
• The 36% NH4CO3 draw solution is pumped into the low pressure recirculation vessel,
using a ½ to ¾ horsepower, 1.8 bbl/min centrifugal transfer pump.
• Ammonium Bicarbonate used because of its effective high osmotic efficiency and easy
separation from water at low temperatures (68⁰F)
• SCADA monitoring will allow the system to generate the ideal concentration of
Ammonium Bicarbonate to achieve our optimal flow rate of 10bbls/min. This will be
achieved be controlling the amount of Ammonium Bicarbonate dissolved in water in
main Draw Solution Storage tank.
The forward osmosis system uses a a membrane system which separates the solutes from the
water effectively. The choice of membrane was made with efficiency and power generation in
mind, the TFC membrane was selected. The membrane parameters are as follows;
• Water permeability coefficient (A) = 5.81L/m2hbar
• Salt or solute permeability coefficient (B) = 0.61L/m2h
4
• Structural parameter (S) = 370µm
• Power density (W) = 10W/m2
• Water flux (Jw ) = 30 L/m2h
• Osmotic pressure differential (Δπ) = 25bars
• Hydraulic pressure differential (ΔP) = 12.5bars
Using the forward osmosis filtration to recycle waste water into a high quality fluid for use in
fracturing jobs, on each well, over 80% of the waste water can be recycled to provide
approximately 25% of the water required for hydraulic fracturing. The capital cost of each
system is about $100,000. The annual operating cost of the FO system would be about
$0.60/kgal of produced water. This relatively high cost results from the low value assumed for
flux across the membrane. If guarantee a constant driving force across the membrane, the FO
flux may increase 70%, the unit water costs will drop by 36% to about only $0.38/kgal. A cost
estimate savings of over one million dollars ($1,000,000) is expected if the integrated forward
osmosis sytem is implemented. Aside cost savings, there is zero to none emission generated from
the system which makes it considerably environmentally friendly compared to other types of
treatments.
Other benefits include;
• Save about three-quarters of a billion gallons of fresh water per year.
• Eliminates 66,600 bbls of waste water per horizontal well of trucking related road
damages and emission, leading to reduction in the carbon footprint of the industry.
• Approximately 175 truck loads can be eliminated per fracture job
• 4,375 gallons of diesel emissions eliminated per 66,600 bbls of waste water reclaimed.
• Save approximately 6.2 million gallons of diesel use each year.
Considering the fact that there are many more known shale basins in the United States
and around the world where the forward osmosis technology alongside the power generation can
be employed. On the other hand, the forward osmosis technology is not restricted to shale
development in unconventional reservoirs, but is applicable in conventional oil and gas plays
also.
5
The naturally low permeability shale must be fractured to guarantee higher productivity and the
fracturing process involves the use of millions of gallons of water that must be recovered as flow
back or produced waste water. Public and regulatory pressure is demanding that operators in the
oil and gas industry improve water management practices.
Exploring several results of laboratory and field testing from early commercial jobs indicate that,
flexible, portable and scalable Forward Osmosis units are applicable to resourcefully and
efficiently reclaim water-based waste for valuable reuse as a high quality completion fluid.
It is recommended that future design and development of the forward osmosis blue energy
integrated system (FOBES) for waste water treatment should consider improved material use and
better energy generation methodologies from the chemical potential energy between waste water
and an improved draw solution.
Additional improvement on the selected membrane would be helpful in enhancing the efficiency
of the integrated process. Investments into the development of forward osmosis membranes with
higher solute rejection and higher water flux are highly recommended.
6
CHAPTER 1: LITERATURE REVIEW
1.1. Introduction Due to the enormous natural gas deposits discovered in the Marcellus Shale formation, there has
been an increase in gas extraction activities in the Marcellus area. A huge investment is being
made in developing extraction technologies to adequately recover natural gas from formations of
very low permeability, which necessitated the use of the horizontal drilling and hydraulic
fracturing techniques. These methods are very helpful in reaching the pay zone and also creating
fractures or connecting natural fractures in the formation, after which the gas can be extractable
and optimum recovery attainable. The use of hydraulic fracturing method in the stimulation
of reservoirs of tight formations in the Marcellus area is gaining more momentum as
energy demand across the region, and/or over the world increases. Recent advances in
directional drilling made shale formations, very accessible and more prolific. It has been
estimated by The United States Geological Survey (USGS) that there is a technical
possibility of recovering up to 200 TCF (trillion cubic feet) of natural gas from shale gas
formations. Towards this end, there has been a huge capital intense investment in the
Marcellus Shale by some International Energy firms in developing productive fields,
providing advanced technology and in the exploration of the natural resource of interest
(Gas).
These events are new to many towns that never experienced drilling and production
activities and are intensified in regions that previously experienced little petroleum
development activities. Inasmuch as the production of natural gas for the purpose of
meeting current energy consumption requirement is quintessential to the prosperity of the
human population at large, it may also damage the environment if not with careful
operations. There has been a growing concern over the stimulation of the Marcellus
Shale, ranging from contamination of drinkable well water, to excessive water
withdrawal from the watersheds and other related environmental/ psycho-social effects
of both drilling operations and the disposal of flow back fracture fluids. Wastewater is
usually produced alongside the gas and they contain total dissolved solids in high
concentrations and the chemical additives added to the hydraulic fracturing fluid. Data
provided by the Pennsylvania Department of Environmental Protections (DEP) confirm

7
the various violations by the operators in the Marcellus Shale area. It is evident that in
some areas of the commonwealth, these fluids (wastewater and undiluted fracturing
chemicals) were either accidentally spilled to the waters of the commonwealth or in some
cases, were discharged into water bodies due to the unavailability of proxy treatment
plants.
The goal of the research is to provide an effective waste water management in the Marcellus
Shale area (Figure 1) and their impacts on the gas exploration and production industry as a
means of providing responsiveness to environmental risks, highlighting the need for the
industry’s sustainability when controllable risk are mitigated or minimized. Statistical facts are
presented to show the different interactions of risk factors and how they trend in response to
environmental concerns, also pollution prevention methods. The sources of pollution of high
interest in industrial operations are hazardous air pollutants, waste water, spills and operational
waste materials. Fortunately, technological advancements have led to improvements in
reducing the effects of these pollutants to the environment, such as the integrated forward
osmosis system design which is the focus of this study. Technology improvement positively
impacts cost savings in the oil and gas industry, such as implementing innovative technology for
exploration, production, processing, transportation and storage operations, leading to a better
scenario of environmental protection and compliance.
1.2 MARCELLUS SHALE
In 1836, Henry Darwin Rogers classified the Marcellus as "Cadent Lower Black Slate" in the
first Pennsylvania Geological Survey, while in 1839 Professor James Hall established the term
"Marcellus Shale" in his 1839 report (New York State Geological Survey) titled "Marcellus
Shale due to distinctive outcropping near the village of Marcellus, New York, just to the west of
Syracuse in Seneca County. The Marcellus Shale was deposited as marine sedimentary rock in
mid-Devonian (400 mil years ago) (Figure 2), due to sea level variation and at depth devoid of
oxygen. It extends across much of the Appalachian basin and contains largely untapped natural
gas reserves making it attractive for energy development in the United States.
The gas in the Marcellus Shale is a result of its contained organic contents; the more organic
material contained in the rock the greater its ability to yield gas. John Harper of the PA

8
Geological Survey suggests that the areas with the greatest production potential might be where
the net thickness of organic-rich shale within the Marcellus Formation is greatest.
Maximum thickness of the Marcellus ranges from 890 ft in New Jersey,(White, Ron W.;
Monteverde, Donald H. 2006) to 40 ft in Canada (Singer, S.N. et al 2003). In West Virginia, the
Marcellus Formation is as much as 200 ft thick (Boughton, Carol J.; McCoy, Kurt J. (2006). In
extreme eastern Pennsylvania, it is 790 ft thick, (White, I.C.; Chance, H.M. (1882) thinning to
the west, becoming only 49 ft thick along the Ohio River and only a few feet in Licking County,
Ohio (Mayhood, Kevin 2008).
Stratigraphic convergence or thinning from east to west is caused by decrease in grain size of the
clastic deposits, which entered the basin from the east (Dennison, J.M.; Hasson, K.O. (1976).
Northeastern PA is where the thick organic-rich shale intervals are located.
The latest data estimates gas reserves in the Marcellus Shale to be up to 500 Tcf (Engelder &
Lash,2008) compared to the yearly average of total natural gas consumption in the United States
which is roughly 23 Tcf (Soeder & Kappel, 2009).
1.2.1 Waste Water Management in The Marcellus Shale Play
The management of water resources poses considerable challenges to the Pennsylvania Gas
extraction Industry as it begins to expand the development of the Marcellus Shale. Currently, the
drilling, completion, and stimulation of each horizontal shale well consumes up to 10 million
gallons (gal) of fresh water, roughly equal to daily indoor water usage of 125,000 people (U.S.
Department of the Interior March 2010)
Many of the logistical problems associated with the development of shale gas stem from the
large amounts of water associated with the completion and operation of shale gas wells that must
be transported, stored and disposed of in a manner that is protective of human health and the
environment.
The challenge ahead for Marcellus Shale gas developers is to identify techniques to deliver the
water required for drilling and completion and to develop methods for the disposal of brines
represented by flowback and produced water that comply with applicable environmental
regulations.

9
This rapid decline in operational brine water treatment plants affected nearby Marcellus Shale
gas drilling activity immensely (Litvak, 2008) (Figure 3). Some drillers found it necessary to cut
down to operating one rig a day instead of two (Litvak, 2008).
The Appalachian Shale Water Conservation Management Committee (ASWCMC) recently
conducted a survey; The survey forecasts a growth in rig activity from 64 rigs drilling 857 wells
in 2009 to 171 rigs drilling 2,243 wells in 2013. The daily water consumption associated with
drilling and completions activity is projected to increase from 6.1 mil gpd to 18.7 mi gpd over
the same period. Multi-stage hydraulic fracturing was identified as the main consumptive use
activity accounting for nearly 95% of all water used in drilling and completions operations.
Surface waters are identified as the main source of waters planned for this purpose comprising
60-70% of the total water demand with groundwater serving as a very minor source for well
completions (less than 4% of the total water demand) (ASWCMC,2008). The remaining
portions of source water are municipal supplied and forecasted recycling efforts.
1.2.2 Water Quality
The composition of the fluid varies widely depending on the type of operation, location, and
geology. The combination of these makes almost every situation unique. While existing
technologies offer a wide selection of treatment options, cost remains the determining factor.
Two of the major water quality concerns with the concept of reusing reserve pit water as base
fluid for hydraulic fracturing are the high concentration of total suspended solids and the high
concentration of undesirable solutes such as calcium, barium, and heavy metals. Rieb, Allen, and
Hogan March 2009; Geehan, July 2009.
1.2.3 Wastewater generation:
The most common sources of wastewater in E&P operations were identified as shown below.
A. Drilling
1. Spent mud or water from mud dewatering
2. Rig runoff
3. Rainwater catch

10
4. Rig wash
5. Grey water and black water from the drilling camp
B. Completion
1. Diluted completion and drill-in fluids
2. Acidizing and chemical stimulation waste fluids
3. Frac flowback – In hydraulic fracturing operations,
C. Production solids are solids that float on the surface, are suspended as a colloid, or are
suspended due to the motion of the water (not in solution).
1. Produced water (Produced Water Facts; citation - Produced Water Society)
1.2.4 Contaminants
Organics category includes liquids, solids, and semisolids insoluble in water (hydrophobic) or
partially insoluble in water: This category includes volatile organic compounds (VOCs), which
are legally defined in the various laws and are regulated in the US by the U.S. EPA in the air,
water and land (Veil, Puder, Elcock, & Redveik, January 2004).
1.2.4.1 Suspended Dissolved solids
Dissolved Solids are inorganic and organic substances molecularly dispersed in water; they are
reported as Total Dissolved Solids (TDS).
1.2.4.2 Bio-contaminants
Bio-contaminants are essentially microorganisms present in water – including algae, fungi, and
bacteria (sulfur reducing bacteria, acid producing bacteria, and aerobic bacteria). Bio-
contaminants can cause microbial influenced corrosion (MIC), create toxic substances such as
hydrogen sulfide gas, plug the pores of the hydrocarbon-bearing formation, and damage or
render equipment ineffective.
1.2.4.3 NATURALLY OCCURRING RADIOACTIVE MATERIALS (NORM)

11
These include materials such as Strontium, Radium (Radium 226, Radium 228), and Uranium.
The sources of most of the radioactivity are isotopes of uranium-238 (U-238) and thorium-232
(Th-232), which are naturally present in subsurface formations from which oil and gas are
produced. NORM is regulated by U.S. states regarding admissible levels, licensing, equipment
contamination, worker protection, and waste disposal (Arthur, Bohm, Coughlin, & Layne, 2008).
1.2.4.4 Chemistry of Produced water
The general nature of produced water production, composition, environmental issues and current
practices associated with the management of produced water streams associated with
conventional gas production are covered in several recent reviews (Veil, et al., 2004; Boysen, et
al., 2002; Doran and Leong, 2000).
The soluble salt content (TDS) levels in flowback water can range from a few thousand mg/l to
over 200,000 mg/l (>20% salt content) in the Marcellus Shale. The wide range of salt
concentrations in flowback water may be due to; natural variation of formation conditions, the
tendency of flowback water to increase in salt content as it flows from the well after fracturing
(Figure 4).
12
Chapter Two: Treatment Methods
Physical and chemical treatment can provide “Engineered Water” for all levels of operations.
2.1 Current Practice
The primary conventional method for disposing of gas field waste water is through pre-treatment
facilities which use clarification and filtration processes coupled with direct discharge to surface
waters or sewage treatment plants.
There are 8 permitted disposal wells in the state of Pennsylvania. The average injection rate of
these wells is less than 1,000 bpd. The US Environmental Protection Agency (EPA) administers
the permitting and operating of disposal wells in Pennsylvania.
2.2 Projections
For any given shale gas play, this category of brine generation will increase over a finite time
period, will plateau over a finite period and will decline as well completions in that play are
diminished in number each year.
The nature of the brine water disposal challenge is temporal in nature and is closely related to the
annual rate of well completions in the shale gas fields.
Pre-Treatment Process under National Pollutant Discharge Elimination System (NPDES)
permits:
Deep well injection:
Brines from gas operations can be disposed of using Class II wells, a category of well disposal
reserved for the oil and gas industry.
Demineralization Systems:
Consist of pretreatment often involving filtration, followed by a demineralization step to
concentrate the salts into a small volume of brine, followed by disposal of the concentrated
brines, usually by deepwell injection.
Thermal Evaporation/Condensation
Several commercial designs rely on mechanical vapor compression. The challenge in applying
thermal systems to brine demineralization includes heat exchanger fouling with organic
deposits.
13
Natural Evaporation
The Appalachian Region does not have the land area or the climate (i.e. temperature/ humidity)
conditions necessary to support the rapid evaporation of flowback waters (Figure 5).
Crystallization
A process of precipitating salts in a water stream has been combined with falling film
evaporators and mechanical vapor recompression (MVR) technology to achieve a further
concentration of brines beyond the capability of conventional thermal evaporators, thereby
allowing the recovery of near-solid salts or highly concentrated brine suspensions that can be
recycled for other uses. But the challenge is large sizes of equipment required for the handling
of modest flows which limit the ability to modularize this technology to the extent of making it
mobile.
Filtration
An essential pretreatment for nearly any demineralization step will include filtration. These
filtration processes will remove suspended solids, oils and grease but will not achieve
concentration of soluble salts as is achieved in demineralization (Figure 6).
Ozone
The addition of ozone has been proposed to enhance the removal of soluble organics, oils,
greases, and heavy metals when coupled with the above-mentioned filtration. One factor that
may determine the economic feasibility of this approach is the cost of ozone delivered to the
process.
Freeze Thaw
Freeze thaw evaporation (FTE) technology is a water treatment process in which water is
sprayed under freezing conditions onto a freezing pad to create an ice pile. Freeze thaw
evaporation has been commercially introduced at sites where conventional produced waters are
treated for brine reduction (Boysen, et al., 2002). Limitation of this technology; must be
deployed in the areas with sufficient days of freezing weather, also requires very large land area.
Membrane distillation is arguably a future valid and efficient way of obtaining clean water out of
wastewater. (Walton, Lu, Turner, Solis, & Hein, 2004) (Bolto, Tran, & Hoang, 2007). Warm
wastewater and cooler pure water are circulated one side and the other of a hydrophobic
membrane which will permit only vapors of water to pass through the nano-sized pores from the
contaminated side to the clean side under vapor pressure influence.

14
Reverse Osmosis (hyper-filtration)
This process is capable of demineralizing brines. RO uses high pressure (600-900 psig) to force
brine through a membrane that retains salts on one side and allows demineralized water to flow
through to the other side. As of 1997, there were approximately 2,000 RO plants in the world
treating a total of 800 million gallons of water per day (MGD).
Most of these plants treat brackish water and seawater to supplement water supplies for
municipalities and industry. many operational problems involving membrane fouling have
surfaced in the initial attempts in the field to deploy the technology (Lawrence, et al., 1995;
Doran and Leong,2000).
These operational problems arise from the complex composition of the produced water & the
effects of certain constituents on the membrane material. These fouling problems are largely
responsible for the lack of deployment success of RO in the oil and gas industry.
Forward osmosis is nature’s way of transporting fluid through membranes; the “draw” solution a
solute creates a big enough osmotic pressure gradient to trigger the transfer of water. The solute
needs to be either usable with the water, such as the NaCl, which produces clear brine; or it has
to be relatively easily removable, such as the NH3 and CO2 gas mixture (Bruno, 2009;
McCutcheon, McGinnis., & Elimelech, 2005).
The suspended and dissolved solute rejection efficacy of the FO membranes used in the unit has
been well established in several scientific literatures. The FO membranes have been proven to
reject 100% of bacteria, viruses, and colloidal solids in addition to removing over 97-99% of the
heavy metals and salt .
[Cath, Childress, & Elimelech September 2006; Mi & Elimelech, July 2008; Mi & Elimelech,
February 2010; Cornelissen, Harmsen, de Korte, Ruiken, Qin, Oo, & Wessels July 2008].
15
3.0 Drilling and Completion
Drilling and completion Is a very important step in producing gas and oil so that we have to
focus on the drilling and completion to increase the recovery.
3.1 Drilling
There are three drilling techniques has been used in the petroleum and natural gas industry. The
first technique is the vertical wells. The second technique is the horizontal wells. The Third one
is the multilateral wells but this has not been used in the Marcellus yet.
3.1.1 Vertical wells
Vertical wells technique is the first technique has been used in the petroleum engineering
industry. The vertical well starts from the surface by 90 degree angle with the surface going all
the way through the formation. Vertical wells are much cheaper than the horizontal wells but it
gave much more recovery. Also the vertical wells use much more surface area than the
horizontal wells.
3.1.2 Horizontal wells
Horizontal wells start as a vertical well then at the kick off point starts to go horizontal which can
be 2000 – 6000 ft. long. Horizontal wells recover much more than the vertical well because it
drains more area of the reservoir. The horizontal wells Provide greater access with a smaller
footprint as from one hole on the surface we can have up to 6 horizontal wells comparing to 12 -
14 vertical wells each well needs a separate hole.
Choosing the technique which will be used depend on many issues like the reservoir geology,
fractures and the permeability. According to our objective which is decreasing the environmental
impact we prefer to go with the horizontal wells to decrease the environmental impact and
increase the recovery.

16
3.2 Drilling fluids
Drilling fluids been used during the drilling process to Remove cuttings from well, Suspend and
release cuttings, Control formation pressures, Seal permeable formations, Maintain wellbore
stability, Minimizing formation damage, Cool, lubricate, and support the bit and drilling
assembly and Transmit hydraulic energy to tools and bit Ensure adequate formation evaluation.
There are some additives to the drilling fluid to make it more efficient and functional like
Viscosifiers, Filtration Control Materials, Rheology Control Materials, Alkalinity and pH
Control Materials, Lost Circulation Control Materials, Lubricating Materials and Shale
Stabilizing Materials. These materials gave the drilling fluid the needed properties to make the
drilling process much easier.
R. James, ConocoPhillips Norge present the drilling fluids types in “Occupational Exposure
Hazards Related to the Use of Drilling Fluids Presented with Remedial Risk Management
Guidelines”. Drilling fluids divided to two groups, water based fluid (WBF) and Non-aqueous
fluids. The water based fluid (WBF) consisted of 76% of brine/water, 14% of Barite, 6% of
Clay/polymer and 4% of other. Non-aqueous fluids consisted of 46% of non-aqueous, 33% fluid
Barite, 18% Brine, 2% Emulsifiers and 1% Gellants /other.
Non-aqueous fluids can be split into three groups based on their aromatic hydrocarbon content
high-aromatic content fluids, medium-aromatic content, and low/negligible aromatic. As we can
see the drilling fluid has a lot of water and our main goal is to decrease the waste water so that
we will focus on the treatment of the drilling fluid.
3.3 Drilling Fluids Contamination
Hydrocarbon-based contaminants can be found because the formations drilled through to the
reservoir contain hydrocarbons. Gases from formations are primarily composed of methane.
Non-hydrocarbon gases can be founded because the formations can contain hydrogen sulphide
(H2S) gases and H2S-containing water samples. Other gases like Carbon monoxide can be
present particularly when coal beds are drilled but this occurrence is extremely rare.

17
3.4 Completion
Well completion commonly refers to the process of finishing a well so that it is ready to produce
oil or natural gas. There are a number of types of completions like Open Hole Completion,
Conventional Perforated Completion, Sand Exclusion Completion, Permanent Completion,
Multiple Zone Completion and Drain-hole Completion.
3.4.1 Open-hole Completion
Open-hole completions are the most basic type and are used in formations that are unlikely to
cave in. An open-hole completion consists of simply running the casing directly down into the
formation, leaving the end of the piping open without any other protective filter. Very often, this
type of completion is used on formations that have been ‘acidized’ or ‘fractured.’
3.4.2 Conventional Perforated Completion
Conventional perforated completions consist of production casing being run through the
formation. The sides of this casing are perforated, with tiny holes along the sides facing the
formation, which allows for the flow of hydrocarbons into the well hole, but still provides a
suitable amount of support and protection for the well hole. The process of perforating the casing
involves the use of specialized equipment designed to make tiny holes through the casing,
cementing, and any other barrier between the formation and the open well. In the past, 'bullet
perforators' were used, which were essentially small guns lowered into the well. The guns, when
fired from the surface, sent off small bullets that penetrated the casing and cement. Today, 'jet
perforating' is preferred. This consists of small, electrically-ignited charges, lowered into the
well. When ignited, these charges poke tiny holes through to the formation, in the same manner
as bullet perforating.
3.4.3 Sand Exclusion Completion
Sand exclusion completions are designed for production in an area that contains a large amount
of loose sand. These completions are designed to allow for the flow of natural gas and oil into
the well, but at the same time prevent sand from entering the well. Sand inside the well hole can
cause many complications, including erosion of casing and other equipment. The most common

18
methods of keeping sand out of the well hole are screening or filtering systems. These include
analyzing the sand experienced in the formation and installing a screen or filter to keep sand
particles out. The filter may be either a type of screen hung inside the casing, or a layer of
specially-sized gravel outside the casing to filter out the sand. Both types of sand barriers can be
used in open holes and perforated completions.
3.4.4 Permanent Completion
Permanent completions are those in which the components are assembled and installed only
once. Installing the casing, cementing, perforating, and other completion work is done with small
diameter tools to ensure the permanent nature of the completion. Completing a well in this
manner can lead to significant cost savings compared to other types.
3.4.5 Multiple Zone Completion
Multiple zone completion is the practice of completing a well so that hydrocarbons from two or
more formations may be produced simultaneously, yet separately. For example, a well may be
drilled that passes through a number of formations as it descends; alternately, it may be more
effective in a horizontal well to add multiple completions to drain the formation efficiently.
Although it is common to separate multiple completions so that the fluids from the different
formations do not intermingle, the complexity of achieving complete separation can present a
barrier. In some instances, the different formations being drilled are close enough to allow fluids
to intermingle in the well hole. When it is necessary to prevent this intermingling, hard rubber
'packing' instruments are used to maintain separation among different completions.
3.4.6 Drain-hole Completion
Drainhole completions are a form of horizontal or slant drilling. This type of completion consists
of drilling out horizontally into the formation from a vertical well, providing a 'drain' for the
hydrocarbons to empty into the well. In certain formations, drilling a drainhole completion may
allow for more efficient, and balanced extraction of the targeted hydrocarbons. Drainhole
completions are more commonly associated with oil wells than with natural gas wells.
In the Marcellus shale we use Conventional Perforated Completion and Drainhole Completion.

19
3.5 Casing
Conductor casing is usually no more than 20 to 50 feet long. It is installed to prevent the top of
the well from caving in and to help in the process of circulating the drilling fluid up from the
bottom of the well. The conductor casing is cemented into place before drilling begins.
Surface Casing is usually few hundred to 2,000 feet long, and is smaller in diameter than the
conductor casing. The primary purpose of surface casing is to protect fresh water deposits near
the surface of the well from being contaminated by leaking hydrocarbons or salt water from
deeper underground. The Surface Casing is cemented into place too.
Intermediate Casing Used for deeper wells that penetrate over-pressured formations, lost
circulation zones, unstable shale sections or salt sections
Production Casing is the casing that provides a conduit from the surface of the well to the
petroleum-producing formation.
Cementing
Well cementing is the process of mixing and placing cement slurry in the annular space between
casing and the open hole.

20
Chapter 4: Well Stimulation
4.1 Stimulation techniques
Stimulation techniques have evolved with the exploitation of unconventional gas reservoirs since
the economic viability of unconventional-gas developments relies on effective stimulation of
extremely low permeability rock, typically 10 to 100 nanodarcies (Cipolla L. Craig). As shale
gas has grown to be one of the largest resource potential, stimulation process has shown
continual innovation throughout the days. However, the most common method of well
stimulation hydraulic fracturing is at the heart of controversy since it wastes huge amount of
chemically treated water resource underground. Therefore, reducing the use of water resource
and improving recovery rate of injected fluid while improving economic production is critical
issue in developing unconventional gas reservoir.
4.2 The Hydraulic Fracturing
Hydraulic Fracturing involves the injection of pressurized water or has into the well, which
creates new fractures in the shale and enlarges existing ones. The primary purpose of hydraulic
fractured shale reservoirs is the extension of the drainage radius via creation of a long fracture
sand pack that interconnects with natural fractures thereby establishing a flow channel network
to the wellbore (J. Paktinat et al, 2007). This creates additional permeability so that improves
production of gas. Fractures are created by pumping fracture fluid into the reservoir and
slickwater and carbon dioxide are most well known fracture fluids. Among these fracture fluids,
slickwater works best in low-permeability reservoirs, and have been the primary instrument in
opening up unconventional plays if there is competitive water availability (T. Palisch et al,
2008). In the Appalachian area with its precipitation of approximately 43 inches receives 10
inches more per year than the average for the continental United Sates (Administration, National
Oceanic and Atsompheric, 2005). In addition, there are many accessible consumptive water
resources including lakes, rivers, private water sources, and municipal water near Marcellus
shale thus slickwater hydraulic fracture treatment can be considered as the best fracture fluid in
Marcellus shale reservoir.

21
4.3 Slickwater
Slickwater combines water with a friction-reducing additive allowing the water to be pumped
faster into the formation. In addition to the cost advantage, slickwater treatments require less
clueanup, provide longer fractures, and carry proppant further into the fracture network (J.
Daniel, Brian Bohm, and Davd Cornue, 2009). Water is the primary component of slickwater
fracture fluid. Generally, more than 90 percent of the fracture fluid is water. Figure 1 graphically
demonstrates the relative amounts of the components in a fracture fluid used recently in the
Fayettevill Shale; this fluid is 99.5 percent water with less than 0.5 percent other compounds (J.
Daniel, Brian Bohm, and Davd Cornue, 2009). During the hydraulic fracturing process, after slug
of slickwater with a friction-reducing chemical additive is pumped, the operator begins the
fracturing process by pumping a large volume of slickwater with fine sand at low volume.
Subsquent steps include the application of slickwater volumes with coarser sand proppant which
keeps fractures closer to the wellbore open and a flush to remove proppant from equipment and
wellbore (J. Daniel, Brian Bohm, and Davd Cornue, 2009). In those stages of slickwater process,
a typical horizontal shale gas well is estimated to require between 3,000,000 and 4,000,000
gallons of water (J. Daniel, Brian Bohm, and Davd Cornue, 2009). Figure 7 shows volumetric
composition of typical fracture fluid slickwater. The process of developing Marcellus shale gas
wells typically requires larger volumes of water than is necessary for conventional gas wells.
Therefore, reducing required amount of water for fracturing treatment would provide great
economical benefit.
4.4 Flowback Water
After a hydraulic fracture treatment, when the pumping pressure has been relieved from the well,
the water-based fracturing fluids begin to flow back through the well casing to the wellhead (J.
Daniel, Brian Bohm, and Davd Cornue, 2009). This water is referred to as flowback water and
consists of spent fracturing fluids and, in some cases, dissolved constituents from the formation
itself (minerals present in the shale as well as brine waters that may be present within any natural
pore space contained in the shale). In various basins and shale gas plays, extent of this volume of
flowback water may account for less than 30 percent to more than 70 percent of the original
fracture fluid volume (J. Daniel, Brian Bohm, and David Cornue, 2009). In the most of

22
Marcellus sites, this flowback rate is estimated at 35 percent so that it draws major economical
loss by re-supplying volume of fresh water for subsequent fracturing stages (A.W. Gaudlip and
L.O. Paugh, 2008). Unrecovered fracture fluid which remains underground with hazardous
chemical treatment also brings environmental challenges because it could flow into drinking
water source. If we can improve flowback rate, this recovered fluid can be treated further for
recycling. Therefore, enlarging recovery rate during flowback would increase positive impact
while reducing negative effect.
4.5 Microemulsion (ME)
The primary purpose of surfactants used in stimulating sandstone reservoirs is to reduce surface
tension of the fracturing fluid, decrease interfacial tension between injected fluid and reservoir
rock and increase post-fracturing fluid recovery. The interfacial tension balance can be
characterized as capillary pressure, which defined as
The term σ is the injected fluid/gas interfacial tension of the treating fluid in dynes/cm, or
surface tension. θ is the contact angle of the fluid at the rock/fluid/gas interface and r is the
pore throat radius (Penny, G. and J.T. Pursely, 2005). However, conventional surfactants when
injected at high pressures adsorb rapidly into the sandstone formation, reducing their
effectiveness in recovery of flowback water. Due to this problem, surfactants alone do not
provide adequate water recovery properties for the reservoir in the Appalachian Basin which has
low temperature, pressure and permeability (J. Paktinat et al, 2005). In addition, as illustrated in
figure 8, it is possible that large quantities of injected fracturing fluid could be trapped in the area
near the fractured proppant pack (Penny, G. and J.T. Pursely, 2005). This condition provides
negative impact on gas production since it lowers relative permeability. However, when a
microemulsion system is applied within fracturing fluids it minimizes the interfacial tension
between the injected fluid and reservoir rock, overcoming the capillary forces that have trapped
gas into the formation because microemulsion structures are carried to the interface faster and
deeper into the proppant pack than a common surfactant (J. Paktinat et al, 2005). It in fact
pentrates and disrupts the water structure on the rock surface. According to G. Penny, it has been
(1)

23
observed that the contact angle is on the order of 60 degree or more (Penny, G. and J.T. Pursely,
2005). Since capillary pressure is a cosineθ function, the cosine of 60 degrees is 0.5. The benefit
of this is that capillary pressure is reduced by 50% over any reduction associated with surface
tension reduction. This means the injected fluid can be mobilized at half of the pressure. Figure 9
illustrates the fluid recovery data for the wells tested during case studies done at Appalachian
Basin wells with the application of microemulsion technology (J. Paktinat et al, 2005). Recent
field results also show that fluid recovery without microemulsion is from 15 to 30 percent while
using the microemulsion resulted in 50 to 100 percent increase in load recovery in the Barnett
shale (Penny, G. and J.T. Pursely, 2005). With this increased recovery rate, the micro emulsion
treatments enables to use previous stage flowback fluids thereby reducing costs associated with
transporting unnecessary fluids to job sites and the amount of polluted water remaining
underground.
4.6 Proppant Transportation Modifier (PTM)
Another innovative technology beside microemulsion is proopant transportation modifier (PTM).
Slickwater shale fracturing uses proppant transportation that depends on turbulent flow, sand
banking and/or bed transport. Theses result in the majority of the proppant being deposited on
the bottom of the created fracture, close to the wellbore, leaving a large portion of the created
fracture length unpropped (N. Kostenuk, 2010). As seen in figure 10 and 11, this bed load
transportation has very little proppant distribution outside the main fracture and leave large
portion of the created fracture geometry remain unpropped (Cipolla C. et al, 2009). Since the
majority of the reservoir’s productivity comes from the propped portions of the created fracture,
those unpropped portion remains to be potential loss. However, the use of a proppant
transportation modifier (PTM) additive to the slickwater fluid has great performance in proppant
distribution. As illustrated in figure 12 the PTM changes the proppant to an airphilic state, which
creates a layer of micro-bubbles around each proppant grain and change the buoyancy of the
proppant, allowing it to be transported in slick water without the use of viscosity or turbulent
flow (N. Kostenuk, 2010). Since sand settling is drastically reduced by PTM, less proppant is
required for the process thereby required amount of fluid which carries proppant can also be
reduced. Also faster fracture fluid (lower completion cost) and increased production are achieved
because PTM results in increase of conductivity and permeability as shown in Figure 12 (N.
Kostenuk, 2010).

24
Chapter 5: Osmotic Treatment
5.1 Reverse Osmosis
Reverse Osmosis is one of the most widely used water treatment and wastewater reclamation
methods used in the industry. Reverse Osmosis is an engineered osmotic process, which uses
hydraulic pressure to drive the transfer of water across a semi-permeable membrane. [Cath]
Some of the limitations of Reverse Osmosis, that are the driving forces for research and
development of Forward Osmosis processes, are the increasing costs associated with the energy
needed to apply the hydraulic pressure and cost of membrane replacement due to fouling.
5.2 Forward Osmosis
The need to find a viable and economical water treatment and wastewater reclamation method,
has led to the intensified research and development of Forward Osmosis. The majority of the
literature focuses upon the utilization of Forward Osmosis to produce potable water from
seawater. The focus of this literature review is to study the research and development
advancements in Forward Osmosis to find a viable and efficient means for treating flow-back
fracturing water from lateral gas wells from the Marcellus Shale in Bradford County PA.
Forward Osmosis has garnered much recent research and development since the high costs of
energy is making Reverse Osmosis increasingly less economical. The main driving force of
Reverse Osmosis is the use of hydraulic pressure to increase the osmotic pressure and thus
increase the mass transfer of water across a semi-permeable membrane. [Cath] This hydraulic
pressure is driven by pumps that draw a significant amount of energy. The membranes used in
Reverse Osmosis have to be designed to withstand the applied pressure yet, this design also
makes the membranes more susceptible to membrane fouling. Membrane fouling reduces the
life-span of the membrane, replacing the membrane before its life-span also adds to the increases
costs associated with Reverse Osmosis.
Forward Osmosis is an appealing alternative for water treatment and wastewater reclamation.
Chung et al. define why Forward Osmosis is appealing: Forward Osmosis is one of the unique
and emerging technologies that can produce both clean energy and water drive by the osmotic
pressure difference across a semi-permeable membrane.” Forward Osmosis operates with no
applied hydraulic pressures, it has a high rejection rate of contaminates, and it has a lower

25
propensity for membrane fouling, in comparison to applied pressure driven osmotic processes.
[Cath, Bamaga2011] Forward Osmosis is a engineered osmotic process that transports water
across a semi-permeable membrane. Forward Osmosis uses an osmotic pressure gradient to
induce the mass transfer of water across the membrane. The pressure gradient is generated by
using a draw solution of one side of the membrane to create a higher osmotic pressure than the
impacted water feed stream on the other side of the membrane. [McGinnis 2007] The osmotic
energy intensity, P, which is the rate of energy responsible for establishing water flow can be
expressed as:
P = q∆π (1)
where q is the water flux through a membrane and ∆π is the pressure difference across the
membrane [Bamaga 2011] Bamagea et al. [2011] define how to determine the pressure
difference, ∆π across a Forward Osmosis membrane as:
∆π = πDS − πfeed (2)
where πDS is the osmosis pressure of the draw solution in Pa and πfeed is the osmosis pressure
of the feed water in Pa. “The general equation for explain water transport in osmotic processes is
defined as:
Jw = A(σ∆π − ∆P) (3)
where Jw is water flux, A the water permeability constant of the membrane, is the reflection
coefficient, and ∆P is the applied pressure.” [Lee 1981] Figure 13 which was adapted from Lee
et al. by Cath et al.[ Cath] showing the flux directions and driving forces of three osmotic
processes: forward Osmosis, reserve osmosis and the pressure retarded osmosis.
5.3 Pressure-retarded osmosis and Reverse Osmosis.
Direction and magnitude of water flux as a function of applied pressure in FO, PRO, and RO. FO
takes place when the hydraulic pressure difference is zero. The PRO zone is where the applied
pressure difference is between zero and the flux reversal point, and the RO zone is where the
applied pressure difference is greater than the osmotic pressure difference. Figure adapted from
[Lee 1981]

26
5.4 Draw Solution
The driving forces for Forward Osmosis is the concentrated draw solution on the permeate side
of the membrane. [Cath] Early draw solutions and membranes used for draw solutions have
been varied from salt water, to sugars to dissolved gases and salts. Kravath and Davis
[McCutcheon 2007] used glucose as draw solutions for Forward Osmosis. Stache [McCutcheon
2007] experimented with draw solutions sucrose. Those who designed experimental Forward
Osmosis experiments during the late 1990s and early 2000s utilized draw solutions involving
salt solutions (NaCl and MgCl2)[ McCutcheon 2007] Glew [McCutcheon 2007] and McGinnis
[McCutcheon 2007] experimented with draw solutions by mixing gas SO2 with alcohols and
potassium, respectively. Elimelech et al. [McCutcheon 2007] designed a draw solution utilizing
the water-soluble mixture of ammonium bicarbonate. Ng et al.[ McCutcheon 2007] also
experimented with the ammonium bicarbonate draw solution. Yen et all [2006] experimented
with organic compounds as draw solutions. Achilli et all. [2010] studied inorganic based draw
solutions for possible use in Forward Osmosis applications. [McCutcheon 2007] shows some of
the historical researches regarding the experimental design of Forward Osmosis processes.
Table 1 [Achilli 2010] shows some of the more widely used draw solutions and the costs of those
draw solutions. Figure 14 [Achilli 2010] depicts a schematic flow chart of how to select an
inorganic compound for use as a draw solution that is suitable for Forward Osmosis application.
This flow chart could be reworked to help someone select a draw solution applicable for a
specific Forward Osmosis application, since this flow chart contains selection biases based upon
all of the desirable characteristics for a Forward Osmosis application. McCluthceon et all.
[McGinnis 2007] and McGinnis [McGinnis 2007] outlined the necessary characteristics of a
draw solution to be used in a Forward Osmosis application. The draw solution must have high
osmotic efficiency, must have a low molecular weight in order to generate high osmotic pressure,
zero-liquid discharge, non-toxic, chemically compatible with the membrane, must be easily
separated from potable water, and must be recyclable to be used over again. Ammonium
bicarbonate is a novel draw solution for Forward Osmosis process for treatment of brackish
water. [McGinnis 2007] Ammonia (NH3) and carbon dioxide (CO2) are two highly soluble
gases that meet the criteria for an idea draw solution. This draw solution is also easily and
economically separated from potable water using moderate heating distillation [McGinnis 2007]
McClutcheon et al. [McGinnis 2007] Figure shows the results reported by with the recovery rates
27
and generated osmotic pressure obtained by using ammonia- bicarbonate as a draw solution. An
overview of researchers on the forward osmosis process with different recovery methods by
using cellulose acetate type membranes is presented in Figure 15[McCutcheon 2007]
McGinnis [2007] explained the draw solute recovery method used by McCluthcehon et.
al.[2006] in their novel ammonia-bicarbonate draw solution in Forward Osmosis along with
other methods that could be used to recovery draw solutions. Table 2 allows for a comparison of
energy requirements of current seawater desalination technologies to the ammonia-carbon
dioxide forward osmosis process, also a quick overview of potential recovery methods and the
costs associated with each method were analyzed.
5.5 Membrane Selection
One of the most limiting features of Forward Osmosis is that of the membrane. The majority of
membranes used in Forward Osmosis applications and experimental designs were originally
designed for Reverse Osmosis applications. [Wong 2010] Membranes designed for Reverse
Osmosis applications are designed with a thin selective active layer which is supported by thick
layers made of polymers and fabric [Wong 2010]. Currently there are only two companies that
manufacture membranes specifically for Forward Osmosis operations - Hydration Technologies
Inc. (HTI) [Wong 2010] and Catalyx Inc. [Wong 2010]. The HTI membrane is composed of
cellulose triacetate supported by embedded polyester screens. [Wong 2010] SEM images of the
HTI Forward Osmosis Membrane. Experimental research has shown lower Forward Osmosis
flux than expected and this is due to concentration polarization (internal(ICP) and external(ECP))
Some of the key factors for designing an effective Forward Osmosis membrane are: producing a
membrane that minimizes internal concentration polarization [Wong 2010], the chemistry and
structural of the membrane [ Bamga 2011],and membrane configuration, with respect to feed
and draw streams [ Bamga 2011] When Forward Osmosis tests were conducted using a HTI
membrane, flux performance significantly greater than that of conventional Reverse Osmosis
membranes [4,38,39,40] The increase in flux is due to the reduction of internal concentration
polarization (ICP) since the thick fabric layers that are seen in Reverse Osmosis membranes are
not present in the HTI membrane. Even with this increased flux with the RTI membrane, there
still needs to be further advancements in Forward Osmosis membrane design. The desired

28
attributes for a membrane to be used in Forward Osmosis processes are: dense ultra-thin active
layer with high water permeability and low solute permeability , a thin and porous support layer
to reduce internal concentration polarization, reduce the chance of membrane fouling by
designing the membrane to be hydrophilic and to increase the lifetime of the membrane, ensure
that the membrane has high mechanical strength [Wong 2010] Current literature shows two
experimental design Forward Osmosis membranes [Wong 2010 ] Both of these membranes are
designed hollow fiber membranes. Wong et al. [2010] have designed two hollow fiber thin film
composite membranes for use in Forward Osmosis processes. Figure 17 shows SEM
photographs of their two membranes. Wong et al. [2010] data have show that their #B-FO
membrane achieves high water flux of 32.2 L/m2, according to open literature this membrane is
the best Forward Osmosis membrane design. Wang et al. [2010] have also designed a hollow
fiber membrane that utilizes Polybenzimidazole(PBI) nanofiltration for Forward Osmosis
applications. Figure 18 shows the PBI nanofiltration hollow fiber membrane. Wang et al.
[2010] data have shown that this membrane has high water flux and salt selectivity, and thus
another promising candidate for effective Forward Osmosis commercially manufactured
membranes. Figure 19 illustrates SEM photographs of various FO Membranes.
Research by Gray et. Al. has shown the importance of membrane orientation for decreasing
internal concentration polarization, increasing water flux, and thus increasing the efficiency of
Forward Osmosis membranes. Figure 20 shows how the flux varies with the same membrane,
but having the draw solution fixed on different portions of the membrane. Membrane orientation
is show to have significant impact upon the performance of the membrane. [Wang 2010] Table
3 [Gray 2006] shows the results of different draw solutions and different membrane orientation,
which leads to the conclusion that the membrane orientation should be dependent upon the
Forward Osmosis application [ Gray 2006] Another important consideration to Forward Osmosis
design is that which Membrane Module to utilize. There are three current designs to consider:
Plate and Frame which is the simplest device for packing and sizing flat sheet membranes for
forward osmosis applications; Spiral-wound, mainly seen in Reverse Osmosis operations where
only one stream is flowing tangential to the membrane; and Tubular, which is the most desirable
membrane module for three reasons. Tubular membranes are the most desirable membrane
module for Forward Osmosis applications since the process will be run continuously, the tubular

29
membranes are self-supporting and finally because it allows liquids to flow freely upon both
sides of the membrane ( a necessary flow pattern for Forward Osmosis)
The focus of this design is to apply Forward Osmosis to waste fracture water reclamation. It is
important to analyze the current Forward Osmosis applications so that a system can be designed
and executed. There are limited commercial applications of Forward Osmosis, but those
applications are across diverse fields of study. Forward Osmosis has been used in industrial
wastewater treatment. The goal of Forward Osmosis was to provide a low energy means of
removing heavy metals from potable water [Cath 2007] One of the drawbacks of this
application, is the use of Reverse Osmosis membranes in this Forward Osmosis design. Forward
Osmosis is used to treat the brackish landfill leachate. Forward Osmosis has shown an affinity to
capture a wide variety of materials from the leachate [Cath 2007] Table 4 show the general
contaminates found in landfill leachate and how effective was the Forward Osmosis process.
NASA is studying the feasibility of a FO/RO process for long-term human space missions.
Since the astronauts have a limited amount of potable water, it is important to have an economic
and effective means of wastewater treatment. [Cath 2007] The food industry uses Forward
Osmosis for the concentration of liquid beverages [Cath 2007]. The pharmaceutical industry uses
forward osmosis in osmotic pumps as a means of delivering medications when the oral route is
not effective. [ Cath 2007] Figure 21 shows a osmotic pump used in the pharmaceutical
industry [Cath 2007]
A polyurethane membrane covers one end of the reservoir. The osmotic engine (i.e., the draw
solution) occupies a portion of the cylinder behind the membrane. An elastomeric piston
separates the draw solution from the drug formulation in the drug reservoir. Upon diffusion of
water into the osmotic engine, the piston is pushed and the drug is released through the drug
outlet orifice
5.6 Hybrid method: Forward Osmosis/Reverse Osmosis.
Since membrane technology for Forward Osmosis is limited and the increasing costs of Reverse
Osmosis, has led to feasibility studies of the potential of using a hybrid FO/RO process for the
treatment of seawater and wastewater. The goal of this process is to reduce the amount of cost
associated with reverse osmosis, by using Forward Osmosis to concentration the feed stream

30
prior to Reverse Osmosis. [Bamga 2011] This process would reduce the costs associated with
the pressure required by Reverse Osmosis, because the pretreatment with Forward Osmosis
requires no applied hydraulic power [ Bamga 2011] show schematic drawing for experimental
FO/RO designs [Bamga 2011] Advances in Forward Osmosis membrane technology will not
only increase the effectiveness of Forward Osmosis process but also the FO/RO processes. The
FO/RO hybrid process is aimed at reducing the costs of desalination for seawater, and by NASA
for wastewater treatment for long space missions.
31
Chapter 6: Renewable Energy Generation
Renewable energy refers to energy that is inexhaustible and can be replenished naturally over a
relatively short period of time. Renewable energy can be generated from a large variety of
sources and the major sources for renewable energy include the wind, rain, tides, waste (water),
sunlight, geothermal heat, and biomass.
6.1 History
Looking as far back as the early age of the human race, it is quite evident that renewable energy
resources were already in use. Besides generating and controlling the use of fire, early humans
clearly utilized the abundance of natural energy resources: water, wind, sun, and even
geothermal heat. A lot has been documented over the past years on various events that clearly
indicated the use of these natural resources to generate energy. The use of sunlight for making
fire is indicated in the writings of Lucian of Samosa in the 2nd century AD. He wrote that
Archimedes resisted the Roman attack with a burning-glass during the Seige of Syracuse (3rd
century BC). Even solar architecture has been in used as far as 2500 years ago by most early
civilizations. These ancient civilizations made use of solar, wind and water energy to condition
their living areas, making them more conducive for living, especially during adverse weather
conditions. The ancient Greeks developed techniques that utilized solar energy to stay warm
during the winter season, reducing their dependence on firewood, and to cool their homes in hot
summers respectively. One of the most ancient and sophisticated examples of ancient solar
architecture can be found at the Pueblo Indian city of Acoma in North America. Wind has been
used for centuries for propelling ships and to operate windmills. Rivers have turned water wheels
for millennia-the Romans even used geothermal energy for water heating- and water energy has
also been used for water-mills. Two basic kinds of water mills were known in medieval Europe;
one was simple and portable but inefficient (Figure 22) while the other was complex, not
portable, and far more efficient. The complex (vertical) mill (Figure 23) was more common
England, northern France and Germany, and by Domesday Book in 1086, it had completely
replaced the simple (horizontal) mills.

32
6.1.1 Renewable Energy Today
Modern renewable energy technology dates from the second half of the 19th century, although
some early research breakthroughs in the 18th century greatly set a foundation for present day
technologies. Horace de Saussure, a noted Swiss naturalist, observed in the 1760s, "It is a known
fact, and a fact that has probably been known for a long time, that a room, a carriage, or any
other place is hotter when the rays of the sun pass through glass. To determine the effectiveness
of trapping heat with glass covers, de Saussure built a rectangular box out of half-inch pine,
insulated the inside, and had the top covered with glass, and had two smaller boxes placed inside.
When exposed to the sun, the bottom box heated to 228 degrees F (109 degrees C) or 16 degrees
F (9 degrees C) above the boiling point of water (Figure 24).
de Saussure was unable to explain how this heat was generated. Today this technology is better
explained, whereby sun rays that penetrated the glass covers got absorbed by the black inner
lining and converted it into heat. Clear glass allows sun rays to easily penetrate through it, but
prevents heat from doing same, as such the trapped sunlight in the box heated up. And today,
indeed, the hot box has become the prototype for the solar collectors that have provided sun-
heated water to millions since 1892.
With the present high demand for energy all over the world, new technologies have focused on
techniques to capture and store dispersed renewable energy potential into more concentrated and
efficient forms. A lot of breakthrough has been made in almost all sources of renewable energy.
Sophisticated technologies have made it possible for engineers to generate large amounts of
energy (geothermal energy) from the very c enter of the earth. Wastes have also been used to
generate large amounts of energy; in California today the three primary sources of biomass
energy are agricultural wastes, forestry wastes, and municipal wastes. In the August issue of the
Journal of Energy Engineering, it was published according to University of Toronto research,
that the energy stored in Toronto’s municipal wastewater could be harnessed to run water
treatment facilities and contribute power to the city grid. In Pennsylvania, the Susquehanna River
and several smaller river basins offer considerable hydropower resources and the Appalachian
and Allegheny mountain ranges are areas of high wind power potential.
To solve our present energy needs, big energy companies as well as government agencies have
directed a percentage of their resources towards developing the renewable energy sector. KGRA
Energy Corporation has received a $750,000.00 grant from the State of Pennsylvania’s

33
Department of Environmental Protection towards the construction of waste heat-to-power
project. The new cogeneration facility will be located in Bradford County, Pa. and will harvest
the heat from reciprocating engines at a natural gas compression station currently under
construction by a major US natural gas company. It will produce approximately 1.26MW of
clean renewable electricity from a generator linked to an organic Rankine cycle power system.
At least 83 countries have some type of policy to promote renewable power generation. The most
common policy is the feed-in tariff, which has been enacted in many new countries and regions
in recent years. By early 2010, at least 50 countries and 25 states/provinces had feed-in tariffs,
more than half of these adopted only since 2005. Strong momentum for feed-in tariffs continues
around the world as countries continue to establish or revise policies. States and provinces have
been adopting feed-in tariffs in increasing numbers as well. Renewable energy has an important
role in providing modern energy access to the billions of people in developing countries that
continue to depend on more traditional sources of energy, both for households and small
industries. The number of rural households served by renewable energy is difficult to estimate,
but runs into the tens of millions considering all forms of renewables. Micro-hydro configured
into village-scale or county-scale mini-grids serves many of these. More than 30 million
households get lighting and cooking from biogas made in household-scale digesters. An
estimated 3 million households get power from small solar PV systems. Biomass cookstoves are
used by 40 percent of the world’s population.
In the US in 2008, renewable energy sources accounted for about 7% of all energy consumed,
and this accounted for about 9% of the country’s total electric power production. In this same
year the consumption of renewable energy in the US could be broken down as follows:
• Hydropower 34% • Biomass Wood 28% • Biomass Waste 6% • Biomass Biofuels 19% • Wind 7% • Others 6%
From this analysis we can clearly see that hydropower is the most exploited renewable energy
resource in the US. Globally, the use of hydroelectricity and other grid-connected renewable
energy sources should gradually increase over the years, at a rate of 3.0% per year until 2030,
according to the EIA (Energy Information Administration).
34
Looking at all the renewable energy resources, it is quite evident that these resources have been
exploited over the years-even in the early age- for one major reason; to meet our energy
demands. But unlike in the early age, in present times, exploiting renewable energy resources has
become almost imperative, considering the deadly human and environmental impacts present day
activities on non-renewable energy generation has caused to the earth. The earth now
experiences harsh climates as well as a disastrous rate of pollution, which has greatly disrupted
the ecosystem, and even destroyed the ozone layer. Climate change concerns, coupled with
high oil prices, peak oil, and increasing government support, are driving increasing
renewable energy legislation, incentives and commercialization. New government spending,
regulation and policies helped the industry weather the global financial crisis better than
many other sectors.
The traditional design elements for maintaining comfort in hot and humid climate such as
screens, water sprinklers, ventilators, skylights, chowks, verandas and windows that could aid
night radiation, cooling and control thermal mass have been discarded with the availability of
cheap fossil fuels that could provide artificial control of the built environment. A return to a
more natural lifestyle is the need of the hour.
Until the middle of the 18th century and the discovery of fossil fuels, renewable sources were the
only sources of energy available to man.
Excessive use of fossil fuels has caused global climate change which has became obvious in the
last few decades and has forced people and governments throughout the world to seriously
reconsider the replacement of fossil fuels with renewable energy sources.
6.2 Blue Energy
Blue energy is a term used for describing the energy or electricity generated from the chemical
processes that occur when both fresh and salt water converge. Due to the chemical processes
involved, blue energy is also referred to as osmotic energy or salinity gradient energy. The term
salinity-gradient energy indicates the theoretical non-expansion work that can be produced from
mixing two salt solutions with different concentrations. The term osmotic energy is derived from
the osmosis process. Osmosis means passage of water from a region of low solute concentration
(high water concentration) to a region of high solute concentration (low water concentration)
through a semi-permeable membrane. This semi-permeable membrane only lets water molecules

35
pass, while salt molecules, sand, silt and other contaminants are prevented to do so. Several
physiological processes use this osmotic effect. For instance, our body uses it to bring water back
from the kidneys, and plants use osmosis to keep the water pressure inside the plant at a fixed
level. Blue energy is a type of water energy which capitalizes on osmotic processes or salinity-
gradient effects. It is also referred to as ocean energy since it can be extracted through a variety
of ocean supported activities such as tidal power, current power, wave power, and even wind
power associated with the body of water.
6.3 Literature
The need for new and more efficient energy sources has led to a number of alternatives. In order
to tackle the harmful effects of energy generation and utilization, energy supply research and
advancements have been made based on the following perspectives; a renewable energy source
and an environmental-friendly non-combustion energy conversion. With this primary goal, blue
energy emerged, since it completely fulfils this objective.
Salinity-gradient energy is a renewable energy source that only dates back to the first half of the
20th century. It was mentioned that besides the gravitational potential, the natural runoff in
coastal areas possess an excessive physical-chemical potential. This excessive potential was a
result of salinity-gradient between the mainly-fresh runoff waters (at river mouths) and the
receiving mainly-saline reservoirs such as seas and oceans. This natural occurrence is
irreversible and no work is attained. From this process, if some reversibility is partly
implemented, work can be obtained from the mixing process, hence producing energy. In
literature, it was assumed that from each cubic meter of river water 2.3 MJ of work could be
extracted. In 1954 Pattle suggested the use of the osmotic pressure differential between river
water and sea water to generate power and actually constructed an apparatus that produced
power. According to Norman: “The tremendous energy flux available in the natural salination of
fresh water is graphically illustrated, if one imagines that every stream and river in the world is
terminated at its mouth by a waterfall 225 m high”. As an example, keeping in mind the words of
Norman, Westus researchers ,at the Westus Dutch research institute, believe the 30-km long
Afsluitdijk that dams up the river mouth of the river IJssel (a distributary of river Rhine)
becomes comparable to a huge power dam of over 200 m high (Figure 25). The 1,100-km2 Lake
IJssel (the artificial estuarine reservoir of river IJssel) becomes comparable to an enormous

36
energy reservoir with over a billion cubic meter storage capacity (assuming a level difference of
only 1 m) (J.W. Post 2009).
From available literature, relatively minimal research has been done on this very promising
source of energy. The present constraints in membrane technologies, and the excessive cost in
building a blue energy plant, have greatly discouraged investors. Cost-effectiveness has also
been a major concern to Hans de Wit, professor of electrochemistry at the Delft University of
Technology. In 2007, De Wit and other scientists wrote an energy report for the Royal Dutch
Academy of Science entitled "Sustainability Lasts Longest." The report was critical of blue
energy. "An enormous effort is required to get [blue energy] to work effectively," the authors
stated. "Such a huge effort for such a small contribution simply makes no sense." One major
factor why blue energy still stands strong as the future of clean energy is the that globally
available power in form of salinity gradients has been estimated in the 1970s (on the basis of
average ocean salinity and annual global river discharges) to be between 1.4 and 2.6 TW . 1.4
TW (12,279 TWh/y) should be able to satisfy over 80% of the current global electricity demand
(which is over 15,746 TWh/y)( Isaacs, J.D. and W.R. Schmitt 1980)
But over the years some optimistic researchers kept up their work in making blue energy a
reality. Jan Willem Post greatly did some breakthrough research in his 2009 PhD thesis work;
‘Blue Energy: electricity production from salinity gradients by reverse electrodialysis’. From his
work, Post clearly visualizes the promising prospects in blue energy, especially for Netherlands
where salinity gradients could can become a significant source of energy, lead to a strong
recommendation to policy makers, captains of industry, and principal scientists to proceed with
research and development of reverse electrodialysis. Post and his colleagues prospect that within
a decade or so, they hope blue energy will produce a significant share of the Netherlands'
electricity. Theoretically, the amount of energy available from mixing 1 cubic meter of sea
water (comparable to 0.5 mol/L NaCl) and 1 cubic meter of river water (comparable to 0.01
mol/L NaCl) both at a temperature of 293 K, is 1.4 MJ (J.W. Post 2009).
With the breakthrough in research, such as that of Post, De Wit sees potentials in blue energy. "It
presents real opportunities," he says. "My only point is, let's not make it more than it is. I see
very interesting, small-scale applications, primarily in areas where there are no power plants
nearby." On that, De Wit and Post agree. "Our motto is, 'Use it where you can,'" Post says. "If
blue energy can be used with existing infrastructure, or if the necessary infrastructure can be

37
relatively easily built, it's a great supplement to other sustainable energy sources." Many other
big companies as well as governments have already commenced large scale developments of
blue energy. In Ostend, in Belgium, a cooperative agreement was signed by the University of
Ghent and six Flemish enterprises, signalling the start of the FlanSea project – a so-called “blue
energy” project that, in the future, is meant to ensure the sustainable and reliable production of
electrical power based on wave energy. In support of its endeavours, the FlanSea research project
has received a subsidy from the IWT in the amount of EUR 2.4 million.
6.4 Methods of Blue Energy generation
There are three major methods to generate blue energy and these methods are:
• The Salinity Gradient Solar Pond Method (SGSP) • The Reverse Electrodialysis Method (RED) • The Pressure Retarded Osmosis Method (PRO)
6.4.1 The Salinity Gradient Solar Pond Method (SGSP)
This is a technology, whereby a man-made pond collects and stores thermal energy due to
density differences between the three layers that make up the pond (as illustrated in the figure 26.
The upper convection zone is the uppermost zone, followed by the stable gradient zone, then the
bottom thermal zone. The stable gradient zone is the most important. Water in this layer cannot
rise to the higher zone because the water above has lower salinity and is therefore lighter and it
cannot sink to the lower level because this water is denser. This middle zone, the stable gradient
zone, becomes an insulator for the bottom layer. Sunlight is absorbed by the salty water and
lining, heating the lower layers of the pond. This water from the lower layer, the storage zone, is
pumped out and the heat is used to produce energy, usually by turbine. This method has already
been implemented commercially in the Eddy Potash Mine in New Mexico that utilizes this
technology to provide the energy needed by the mine.
The technology behind this method is not very complex and makes it very easy to build. When it
comes to the disadvantage, one major limitation is the viability of this method in just very hot
areas such as deserts. This factor makes this method very selective considering the fact that water
-which is the major requirement for blue energy generation- is usually not available in very hot
areas. Another major consideration of this method is the possibility of salt water leaching into
fresh ground water. For this reason, solar ponds should not be built above moving ground water

38
that is close to the surface. In many cases, a liner is necessary to contain the brine. These
disadvantages make this method unfavorable for our system since our location (the Bradford
County) is not in a desert or very hot region and the possibility of salt water leaching becomes
very realistic due to the presence of a lot of fresh ground water.
6.4.2 The Reverse Electrodialysis Method (RED)
This method is centered on the theory of electrodialysis whereby salt ions are transported from
one solution through ion-exchange membranes to another solution under the influence of an
applied electric potential difference. The ion exchange membranes are of two types; the cation
exchange membrane (CEM) and the anion exchange membrane (AEM), and these membranes
are the most important component of this technology. A salt solution and fresh water are let
through a stack of alternating cathode and anode exchange membranes. Salt water separated
from fresh water between two such membranes will lose both positive ions and negative ions.
This is shown in the figure 27.
This charge separation produces a potential difference and as a result, electrons can be
transferred from anode to cathode via an external electric circuit. This electrical current and the
potential difference over the electrodes can be used to generate electrical power, when an
external load or energy consumer (e.g., a light bulb) is included in the circuit. The driving force
for the migration of ion is a difference in free energy between the concentrated and the diluted
solution side and the voltage obtained depends directly on the number of membranes in the stack.
This is the method being investigated in the Netherlands, and Westus-a Dutch water technology
research institute- has been working on harnessing blue energy by means of RED.
Over the years, very little breakthrough has been done on this method. This method design is
very complex, and its high dependence on the number of membrane (Joost Veerman, 2010)
creates a major size constraint, considering the little power that can be generated from a 1 cubic
meter of membrane. Another major concern of this method to our design is the salinity
concentration of the waste water. There is a limit on applicable salt concentrations in the
concentrated brines, which is in accordance with the observation that the power density has a
non-linear response to increasing electrochemical potential (which is the result of a decreasing
permselectivity with increasing salt concentrations)(Post et al, 2007). As such the very high salt
concentrations of the waste water will not be favorable for this method.

39
6.4.3 Pressure Retarded Osmosis (PRO)
This method unlike the others, centers on the pressurization of water. Two solutions of different
salinity are brought into contact by a semi-permeable membrane. This membrane allows the
solvent (i.e., water) to permeate and retains the solute (i.e., dissolved salts). The chemical
potential difference between the solutions causes transport of water from the diluted salt solution
to the more concentrated salt solution (Figure 28). If hydrostatic pressure is applied to the
concentrated solution, the water transport will be partly retarded. The transport of water from the
low-pressure diluted solution to the high-pressure concentrated solution results in a
pressurization of the volume of transported water which can be used to generate electrical power
in a turbine. The figure below illustrates this technology.
Norway (State-owned utility Statkraft's prototype plant) opened on Tuesday the 24th of
November 2009, the world's first osmotic power plant, which produces emissions-free electricity
by mixing fresh water and sea water through a special membrane.
Just like the other methods, the principal driving force in this method is salinity gradient. This is
a very practical method and the design is very much less complex when compared to the other
methods. The comparatively vast implementation of this technology (especially in the desalinity
industry) is an indication of its relative viability. The major concern of this method is the
membrane technology. Our water treatment section of this design focuses on the osmosis theory
and osmosis membrane technology and as such makes the PRO method very viable for our
design.
6.5 The theory of the Osmotic process
Osmosis is the transport of water across a semipermeable membrane from a solution of higher
water concentration (lower osmotic pressure) to a solution of lower water concentration (higher
osmotic pressure). This movement across this membrane is driven by a difference in solute molar
concentrations across a membrane that allows passage of water, but rejects most solute
molecules and ions. There are 3 major osmotic processes and they are Forward Osmosis (FO),
Reverse Osmosis (RO) and PRO –which we are implementing in our blue energy system.
The osmotic pressure differential (Δπ) is the pressure which, if applied as a hydraulic pressure
(ΔP) to the more concentrated solution, would prevent net transport of water across the

40
membrane. FO uses the Δπ across the membrane, rather than a ΔP (as in RO), as the driving
force for transport of water through the membrane. The FO process results in concentration of a
feed stream (which in the case of our system is the less salty water) and dilution of a highly
concentrated stream usually referred to as the draw solution (which in the case of our blue energy
system is the waste water). Flux in FO is in the opposite direction of RO. PRO can be viewed as
an intermediate process between FO and RO, whereby hydraulic pressure is applied to the draw
solution but the net water flux is still in the direction of the concentrated draw solution. The
general equation describing water transport in forward osmosis (FO), reverse osmosis (RO), and
PRO is:
Jw = AJw(Δπ −ΔP) (1)
(where Jw is the water flux and A is the water permeability coefficient of the membrane)
For FO, ΔP is zero; for RO, ΔP>Δπ; and for PRO, ΔP<Δπ.
The flux directions of the permeating water in FO, PRO, and RO are illustrated in the figure 29.
The orientation of an asymmetric membrane is also indicated; in FO, the dense layer of the
membrane faces the feed solution and in RO and PRO, the dense layer faces the draw solution.
In PRO, the power that can be generated per unit membrane area (i.e., the power density) is
equal to the product of the water flux and the hydraulic pressure differential across the
membrane: W = Jw ΔP= A(Δπ − ΔP)ΔP (2)
By differentiating Eq. (2) with respect to ΔP, it can be shown that W reaches a maximum when
ΔP=Δπ/2. Substituting this value for ΔP in Eq. (2) yields:
Wmax = A Δπ2 (3)
4
Jw as a function of ΔP is illustrated in the figure below for both real and ideal conditions. The FO
point (at ΔP= 0), the PRO zone (where ΔP<Δπ), and the RO zone (where ΔP>Δπ) are indicated.
The flux reversal point occurs where ΔP=Δπ. W and Wmax in the PRO zone are also illustrated in
Figure 30.

41
7.0 ECONOMIC ANALYSIS
According to estimates generated by Deutsche Bank, the range of internal rate of return (IRR) for
the Marcellus Shale is 72–100%. IRR is a capital budgeting metric used by firms to decide
whether they should make investments. It is an indicator of the efficiency or quality of an
investment, as opposed to net present value (NPV), which indicates value or magnitude. The IRR
is greater for the Marcellus than for other US shales, they concluded, because of premium natural
gas pricing due to location and relatively low royalties in Appalachia. In addition, the Marcellus
is estimated to have the lowest break-even price ($3.17) when compared to the Haynesville,
Barnett, Fayetteville and Woodford Shales. The next-closest break-even price was $4.73 in the
Haynesville. These break-even prices come from the NYMEX natural gas prices required to
drive the individual plays’ returns down to a 10% weighted average cost of capital. Notably, this
study states that the five plays analyzed represent the “best of breed” among US shale plays, and
one would not expect most other shale and tight gas plays to compare to these strong metrics.
Woodford, Fayetteville and Haynesville gas production is currently increasing greatly while the
Marcellus Shale is not predicted to really take off until about 2011. The slower transition in the
Marcellus is due to the difficult terrain, uncertain regulatory environment and lack of
infrastructure and proper equipment. The problem with typical Marcellus Shale wells is the lack
of gathered information and information that is commercially available to the public ( Rohan
Belvalkar,2009).
A study was conducted using a reservoir modeling software package to investigate the gas
production from the Marcellus Shale. The objective was to compare and contrast the gas
production in vertical and horizontal wells with varying fracture half-lengths and horizontal
lateral lengths. The reservoir modeling and simulation were conducted using Marcellus Shale
properties to calculate gas production rates to determine economic feasibility. Once all of the
production data was simulated, an economic analysis was conducted to determine the optimal
designs for the parameters studied. A cash flow model was constructed for all of the simulated
runs. Once the cash flow charts were constructed, NPVs were calculated along with IRRs. These
two values were used to analyze the economic feasibility of the design parameters considered.
The main parameters needed were capital and operating expenses, interest rate and gas price. The
results of the economic analysis for all $3/Mcf wells showed 18 of the 74 cases studied to be
economic designs. The final results showed that no single-fracture-treated horizontal or vertical

42
wells were economic. Only the 1,000-ft fracture half-length with three fracture stages was
economic regardless of lateral length or spacing. The same was true with five fracture stages,
except that, in those cases, 750-ft and 1,000-ft half-lengths were economic regardless of lateral
length and spacing. As for seven and nine fractures, 500-, 750- and 1,000-ft half-lengths were
economic regardless of lateral lengths. Wells with larger numbers of fracture stages had higher
IRRs. In addition, well designs with the same number of fracture stages had higher IRRs with
longer fracture half-lengths; yet, when the different lateral lengths were considered, the shorter
lateral lengths actually had higher IRRs with the same number of fracture stages. The results for
all $6/Mcf cases differ quite a bit from the $3 gas pricing results (A. Agrawal,2010).Due to the
price change, 24 more of the original well and fracture designs became economical. Now vertical
wells become economical with 750- and 1,000-ft fracture half-lengths regardless of the number
of stages. Also, three- and five-stage fracture treatments now become economical in all fracture
half-lengths except 250 ft. Once again, the well designs with larger numbers of fracture stages
had higher IRRs. Also, for well designs with the same number of fractures, higher IRRs were
found with longer fracture half-lengths. Yet, when analyzing the different lateral lengths, the
shorter lateral lengths actually had higher IRRs. When the number of fracture treatments
increases, and for each number of fracture treatments, the half-length increases from left to right.
It can easily be seen that the larger the number of fracture stages and the greater the fracture half-
length, the larger the profit and the more economical the well. The red bars indicate wells studied
at the $3/Mcf gas price, and the blue bars indicate $6/Mcf. For wells with seven fracture stages,
the only economical results were with half-lengths of either 500, 750 or 1,000 ft regardless of
length of the wellbore for $3 gas pricing. All of the wells with seven fracture treatments were
economical at $6/Mcf. As the number of fractures and half-length increase, the IRR increases as
well. As for the difference in lateral lengths, it is very small, but it actually doesn’t pay to drill
the extra 1,000 ft of wellbore if you are not going to add additional fracture stages. This actually
made the shorter wellbores more cost-efficient over the time period studied. Horizontal wells
were found to be more economic when compared to vertical wells. Vertical wells were found to
be economic in the higher gas pricing scenario. In general, the optimal designs had a fractured
half-length of 1,000 ft and the maximum number of fracture stages .As far as the lateral length
was concerned, it was not cost-efficient to drill longer laterals if the number of fracture stages
was not going to be increased, but it was cost-efficient if more fracture stages were added
43
(TABLE 5). As expected, much higher IRRs were found with the higher gas pricing. Higher gas
prices allow more exploration in vertical wells or smaller-scale horizontal wells due to the lower
initial cost. There was no direct trend, but some IRRs increased dramatically due to the gas price
change (R. Schweitzer,2009). Ultimately, in the Marcellus Shale, the more money spent up front
with larger fracture jobs, the more economic the results appear to be (TABLE 6).
After acquiring approvals from SRBC, we can submit the drilling permit application, which was
discussed in the literature review. This application has also a fee associated with it. Prior to
February 2009 it was only $100 per well regardless of the specification of the well, however
since then it has changed and now it is calculated based on the depth and length of the well. In
this project with D=6000 ft and L= 4000 ft the application fee was calculated to be $2150
(Armstrong Agbaji, 2009).
In Bradford County, the depth is 5,500 ~ 6,500 feet with 4000 ft‐long lateral length. The
average cost for making a horizontal well is 3.5 million ~ 4.0 million. This single well cost
includes rigs leasing cost which is around $22,000 per day. Also, this cost includes pad
construction, water truck traffic, infrastructure building, gas pipelines and local hiring. It should
be noted at this point that this cost does not contain the cost of leasing land in Susquehanna
County. Completing a well is a very expensive process. This cost is different from one company
to another. Generally, a vertical well in Marcellus costs around $810,000, whereas a horizontal
one costs approximately 3‐5 million dollars. One can estimate the cost range of completing
wells in Marcellus Shale. There is a report from Range Resources who has performed a lot of
drilling operation in PA. The average cost of making horizontal wells in 10 years in Bradford
County is $4.0 million (Byungtark Lee,2009).
The supply of high pressure pumping services (for well stimulation and hydraulic fracturing)
account for 30% to 35% of the costs of a typical unconventional gas well. There have been many
failures and uneconomic wells stimulated and completed in each of the gas shale play, but as
technology improves and we gain more experience, the success ratio and quality of the well
completions continues to improve. Failures can include anything from losing a wellbore to
ending up with a sub-economical well. This objective of this work has been to review the
literature to determine the best practices for completing and stimulating well in our case. While

44
existing technologies offer a wide selection of treatment options, cost remains the determining
factor. Ultimately, all treatment methods must compete with the cost of disposal. Then what are
the most economically viable treatment methods to obtain the quality desired? The answer to this
dilemma seems to be the use of an array of methods, in a customizable, interchangeable setup
that would fit better with the needs of the Operator.
During the process of fracturing, large quantities of water are pumped into the Marcellus
formation 5,000 to 8,000 feet below, which makes the management of freshwater and wastewater
produced is an equally important issue. On one hand, in certain locations within the Marcellus
Play and in other shale gas development regions in Appalachia, the delivery of water supplies to
the wellhead may encounter the constraints of long distances from suitable surface water sources
or inadequate aquifers to support a useful water delivery flow of 50 gpm or more. Because of the
logistical likelihood of these problems, it is necessary to find acceptable alternative water
sources; Municipal water suppliers, for instance, are an expedient source of fresh water. The cost
associated with municipal supplied water can vary greatly from one municipality to another. The
current rates quoted in Pennsylvania range from $1 to $14 per 1000 gal. In the case that the water
is hauled the total cost of municipal supplied water per well can be considered negligible in
comparison to the cost of trucking. (A.W. Gaudlip and L.O. Paugh,2008)
The used fracture water that is a by-product of the operation was once thought to be a major rail
commodity. Since the entire state of Pennsylvania has a total of seven disposal wells, compared
to more than 50,000 found in Texas (Saltwater Distposal Wells FAQ, 2010). The geology of this
area cannot accommodate the amounts of wastewater necessary for the industry. For lack of local
disposal options, operators often find themselves hauling wastewater as far as Ohio and West
Virginia to be injected into disposal wells. The cost per barrel of water trucked in this manner
can be as high as $15, without taking in consideration the wear and tear on road infrastructure
(Clark & Veil, 2009). After realizing the fact that hauling both fresh and by-product water by
truck is an expensive matter, this project is aiming economical ways to recycle the wastewater
water.

45
Drillers are taking their fracwater to municipal wastewater treatment plants; however because of
the high level of dissolved solids (heavy metals and salt) those plants cannot treat the wastewater
properly, since they do not have the adequate industrial wastewater treatment facilities. After a
test, resulted higher‐than‐expected level of total dissolved solid in the Monongahela, the DEP
warned municipal sewage plants to get state approval before accepting gas well wastewater.
Basically, fracwater needs to be treated at specialized wastewater treatment plants, which can
take heavy metal and salt out of fracwater. Unfortunately not many (less than 10) of these plants
exist in the Pennsylvania. This shortage in wastewater facility treatment plant has created a big
challenge to drillers and authorities. Some drillers have started to recycle and reuse the fracwater
onsite and send it for treatment after multiple usages. In addition, the SRBC is working with
industry personnel to determine best management practices for hydrofracing water reuse. Also
with a contact, made with DEP office in Harrisburg, we were told that there is a very significant
interest in building these treatment plants, due to this wave( Hemant Kumar,2009).
Lease cost involves the expense, incurred by a company to use land for exploration, drilling and
production involved in oil and gas operations. As the land records date back to 1700s, the leasing
process becomes complicated and may take three to six months. Land‐owner, Mineral
right‐owner and coal mining right‐owner can be three different people. In addition to Mineral
right, permission is required from other two owners. It involves a complicated process of getting
approval from the surface land owners to set up the equipment, needed and also the permission
to drill through the coal seam. The latter is easier because it is impossible for a person with the
coal mining rights to stop a company from drilling through it. Securing the lease and starting the
planned activities usually take anywhere between 3 to 6 months in Pennsylvania. Usually, Lease
cost is stated per acre per year. However, this is a mutual consent between the surface land
owner and the lessee. For example, when a company leases 100 acres at $750 for 5 years it
means that the lease owner will get $75000 one time and the company can use its land for
operation for 5 years. Lease cost for a specific location varies with the price of natural gas.
Before the potential of the Marcellus as an economic play was fully understood, lease prices
were at a premium of $500. When gas prices touched 15$/MMBTU, the lease cost increased to
as high as $3000.Lease cost also varies from county to county, depending mainly on the gas in
place and other factors. The lease cost basically reflects the profit making of a certain area. As

46
stated earlier lease cost mainly goes up with time. So the earlier a company gets into a play the
more money it makes. Lease agreements are generally renewed at the ongoing price at that
particular time. Big players have a team of lawyers and real‐estate specialists to deal with
leasing terms and conditions. Lease costs for each counties are easily available (Michael
Godec,2009).
Royalty paid by the company to the lease owner is about 1/8th the total revenue the company
earns from gas production. This is almost the same for any location in Pennsylvania. This is
often the major source of revenue for a lease owner. Also along with this, some land owners ask
for a tap from the pipelines on their land without paying for the gas, they use from this source.
They are also paid for the pipelines that pass through their land. This cost is in addition to the
lease cost and the royalty, paid to the lease owner. Sometimes companies give signing on
bonuses, given as royalty starting only when production begins (Armstrong Agbaji,2009).
In summary, the best technology or service delivery does little good if it does not compete
financially. Through performing the literature review, we found some solution competes
favorably with the costs of the marketplace and the performance, standard-based unit fee (per
barrel) requires no customer capital expense. Possible recovery of natural gas condensate,
methanol, and 10# brine, plus reduction in trucking, disposal and many other factors yields a
more than competitive net value benefit.
In some cases, experience indicates that the complete cost of water management is elusive
without a comprehensive and detailed view of costs often buried in a variety of company
operating categories. Companies have spent significant effort, in concert with major operating
companies and drilling management experts, to create an interactive model to enable our
prospective customers to accurately evaluate their current costs in light of services fee to
determine whether or not a true benefit exists. In our project, Net Value Calculator (NVC)(Fig
31) costing model will be used to better understand real costs through comparison (212
Resources,2009).

47
Chapter 8: Analysis and Project Design
8.0 Background:
The enormous Marcellus black shale deposit, located at the northern Appalachia, which holds an
estimated 168 trillion cubic feet of natural gas is found at extensive depth and very compact. The
formation is developed using the horizontal drilling and the hydraulic fracturing of the formation
for eeconomic gas production. The Bradford County is the area of study and it has over 286 wells
drilled till date (Figure 32).
Up to 3.6 million gallons of hydraulic fracture water, mixed with various additives, is needed to
completely fracture each horizontal deep well in the Marcellus Shale play. The spent water is
usually highly contaminated and must be removed from the well, this research work achieved a
recovery of about 70 to 86%, and this is normally referred to as “flowback” water. Table 7 shows
the fracture schedule design and Figure 33 illustrates the slurry volume per fracturing stages. The
fracture geometry is shown in Figure 34-36.
8.1 Reservoir Simulation
Well simulation
According to the government regulation on the Marcellus shale drilling area the company are not
allowed to drill more than one will on every 640 acre feet unless the company shows that It need
more than one well to drain the whole area. Most of the companies have one well at every 16
acre feet which mean 40 wells on every 640 acre feet. According to our goal which decreasing
the environmental impact on the Marcellus shale drilling area we have studied implementing the
multi-lateral wells in drilling the Marcellus shale to increase the recovery and decrease the
environmental impact. Our goal was to have just one well on every 640 acre feet. We have used
CMG to help us to find the best drilling technique to give us the highest recovery with the
minimum environmental impact.
The reservoir properties
Our reservoir is at the Bradford County and we can the properties of the reservoir at Table 7b.
Our reservoir is 8620 feet depth and the reservoir thickness is about 180 feet. As we have
mentioned that our goal is to draining 640 acre feet so that our reservoir is going 5280 feet in I

48
axes and 5280 in J axes which is 640 acre feet. As we have mentioned that the permeability is
very low at the marcels shale so that we can find that our vertical permeability is 0.001 md and
the horizontal permeability is 0.01 md.
We had many drilling techniques ideas to drain the 640 acre feet .We will show the results for
this techniques which include the horizontal well, dual horizontal well at the same distance from
the top, dual horizontal well with a distance between them, two dual horizontal wells with
distance and multilateral well.
Horizontal well
We have tried one horizontal well which is going 8710 feet vertically from the surface (90 feet
vertically in the reservoir) and 1440 feet horizontally. We run CMG for 40 years and the well
recovery starts at (3.5*106) ft3/day and the cumulative gas come up to (6.2 * 109ft3) As we can
see in Figure 37 and figure 38. When we see the pressure distribution Figure 38 after the 40
years we can find that one well is not enough to drain the whole 640 acre feet.
As we can see on the figure 39 that on horizontal well cannot drain the whole 640 acre feet so
that To drain the 640 acre feet we will need more than one well so that we have tried the dual
horizontal well.
Dual horizontal well at the same depth
On the dual horizontal well as shown below the well will be drilled 8710 feet vertically from the
surface (90 ft. vertically in the reservoir) and will go 1440 feet horizontally in both directions
which mean 2880 feet total in horizontally. As we can see at figure (40) that the gas rate for the
dual horizontal well is (5.1*106 ft3/day) which is much more than one horizontal well but it is not
the best. The cumulative gas is 9.7*109 ft3 as we can see in figure (41). Also if we look at figure
(42) which presents the pressure distribution after 40 year we can see that dual horizontal gave
much better results than the one horizontal well but it still need more wells to drain the aimed
area.
Dual horizontal with distance
The difference between the dual horizontal and the dual horizontal with distance is the distance
between the two horizontal wells as at the dual horizontal we have the two wells at the same
49
distance from the surface. As we can see in figure (43) the dual horizontal with distance we have
the well is drilled 8670 feet vertically then at the depth of 50 feet in the reservoir we drill the first
horizontal branch which extends to 1440 feet. After drilling the first branch we continue drilling
the vertical part 80 feet more before we drill the second horizontal branch to the other direction
and this branch is extended to 1440 feet too. As we can see in the figure (44) the gas rate starts at
(6*106 ft3/day) which is higher than the dual horizontal. Also the cumulative gas rate is higher
than the dual horizontal as it is 9.9*109 ft3 as we can see in figure (45). The difference in the total
recovery and the drained area between the dual horizontal well and the dual horizontal well with
distance is not big as we could see but this because the thickness of the reservoir but if we are
has a thicker reservoir it would give much better results.
Two dual horizontal wells in the 640 acre ft
As we can see in the figure (46) that the dual distance is the best technique over the previous
ones but if we look at the pressure distribution we can find that this well can drain half of the
area so that we tried to put two dual horizontal wells with distance in the 640 acre ft. As we can
see in the figures (47), (48) below the gas rate for the first well and the second well is (9.3*106
ft3/day). As we can see in figure (49),(50) the cumulative gas for the first and the second well is
1.92*1010 ft3. As we can see in figure (51) the pressure distribution after 40 years two dual
horizontal almost drain the whole area and gave better results.
Multilateral well
On the multilateral well we used the dual horizontal with 80 feet distance and added to lateral to
each horizontal branch. As we can see in the figure (52) that the will is drilled 2670 feet
horizontally then at the depth of 50 feet in the reservoir we drill the first horizontal branch which
extends to 1440 feet and two laterals extended from the main horizontal branch for 2037 feet and
the same on the second horizontal branch. This technique gave us the best recovery as we can see
in figure (53) the gas rate starts at (1.18*107 ft3/day) comparing to all the techniques we have
presented before. Also this technique gives the best cumulative which is 2.6*1010 ft3 as in figure
(54).And this technique gave us very good results because it drain the whole 640 acre feet which
achieve our goal in decreasing the wells number and drain the same area as we can see in in
figure (55) the pressure distribution for the multi-lateral well.
50
As we can see in the figure (56) that the multilateral well give the best recover over all the other
techniques and as we can see the difference in cumulative gas between the regular horizontal
well and the multilateral is almost 1.98*1010ft3. We can also see that we have tried to put two
dual horizontals in the 640 acre feet but as we can see the one multilateral still give best results
as the difference in cumulative gas is 6.8*109ft3.
But according to our forward osmosis design for water treatment we will use on horizontal well
because it is the simplest technique which we can apply our project and then as a future work we
have to determine how we can use the multilateral efficiently with the forward osmosis system.
Drilling fluid
We decided to use a water based mud in our drilling. Water based mud does not give as good
results as oil based mud or synthetic. We decided to use the silicate based drilling mud in our
system because it gave the best results in drilling.
The silicate drilling fluid advantages:
• Optimum inhibition characteristics. • High penetration rates. • Reduced trouble time and superior wellbore integrity. • Optimum solids removal performance. • Minimal environment impact.
There are three factors which making the silicate drilling mud giving optimum inhibition. The
first factor is the chemical bonding of silica oligomers on the cutting and formation surface. The
second factor is the precipitation of the silicate with divalent ions. The third factor is the
inorganic polymer which forms a protective layer on the surface.
The formation of the silicate based mud:
Potassium carbonate (40 kg/m3), sodium chloride, sodium silicate liquid (8% ), xanthan gum
(YP 25 lb./100ft2), poly anionic cellulose (8 kg/m3), starch ( API-FL < 5ml/30 min), biocide
(1kg/m3), calcium carbonate fine (25 kg/m3) and calcium carbonate med (25 kg/m3).
Tomislav (2004), have studied this formation in drilling 450 wells and approved that this
formation gave the best results in inhibition the formation, solid removal and the environmental
impact. They mentioned also that this formation gave better results than the oil based mud.

51
Casing
In our design we will have a conductor casing which will be 50 feet long (24 inches) which is
used in preventing the top of the will from caving and help in the process circulating the drilling
fluid up from the bottom of the well. Then we will have a 500 feet long (20 inches) connecting
the conductor casing and this part is to protect and isolate the near surface ground water. Then
we will connect a surface casing to the conductor casing which will be 2000 feet (14inches)
which protect the fresh water deposits near the surface of the well from the contamination which
can happen by leaking of hydrocarbon or salt water. As long as our reservoir is 8620 feet depths
so we will use an intermediate casing which will be 5070 feet long (6inches) to connect the
production casing with the surface. In the pay zone we will have the production casing.
Cementing
We decide to use the bentonite cementing. The addition of the bentonite to the cement lowers the
slurry density because it has a lower specific gravity. Bentonite concentrations are as high as 25
% of the cement. There are two ways to mix the bentonite with the cement. The first one is
mixing the cement with the bentonite before mixing it with the water. The second is using
prehydrated in the mixing water. In our design we will use the first mixing which is the dry way
because it decreases the water content. The ratio of the dry bentonite and the prehydrated is
about 3.6:1 for comparable slurry properties. Using the bentonite does not just decrease the
slurry cost it also causing reduction in the cement strength and thickening time.
Conclusion
According to the government regulation which is having just one well in every 649 acre feet and
to satisfy our goal which is draining the whole 640 acre feet we have found that the best drilling
technique is to drill the multilateral well in the middle of the 640 acre feet. As the results show
that the whole 640 acre feet has been depleted in the 40 years which we used as our project life
time. By using the multilateral drilling technique the results showed that we were able to recover
up to 2.6*1010 ft3.
As we can see in the figure (57) that the multilateral well give the best recover over all the other
techniques and as we can see the difference in cumulative gas between the regular horizontal

52
well and the multilateral is almost 1.98*1010ft3. We can also see that we have tried to put two
dual horizontals in the 640 acre feet but as we can see the one multilateral still give best results
as the difference in cumulative gas is 6.8*109ft3. But according to our forward design for water
treatment we will use on horizontal well because it is the simplest technique which we can apply
our project and then as a future work we have to determine how we can use the multilateral
efficiently with the forward osmosis system.
silicate drilling fluid gave a very good results as a water based drilling mud which encourages us
to use it in our project because it give Optimum inhibition characteristics, High penetration rates,
Reduced trouble time and superior wellbore integrity, Optimum solids removal performance,
Minimal environment impact.
Bentonite cement is gave a good results in the Marcellus shale as Using the bentonite does not
just decrease the slurry cost it also causing reduction in the cement strength and thickening time.
8.2 Hydraulic Fracturing
8.2.1 Introduction
Due to environmental concerns and fresh water availability, recovering as much as flowback
water has become one of the greatest concerns for hydraulic fracturing. Hydraulic fracturing is a
formation stimulation technique used to create additional permeability in a producing formation.
By creating additional permeability, hydraulic fracturing facilitates the migration of fluids to the
wellbore for purpose of production (Veach, et al, 1986). The purpose of this part of work is to
examine water treatment techniques and critically design fracturing fluid that are employed in
slickwater fractures of shale reservoirs at the Bradford Field and enhance fluid recovery used for
fracturing.
8.2.2 Fracture Design
Since we are focusing mainly on fracturing fluid, mechanical design of fracturing will follow
typical method commonly used for Marcellus shale. In this way, it is possible to save tremendous
of time and cost which would occur from applying risky techniques to the formation. Comments
will be made on the topic of proppant selection. Figure 58 show typical fracturing process of
shale gas.

53
8.2.3 Fluid Design
Slickwater fracturing has increased over the past decade with the advent of shale gas plays.
Horizontal wells are now the standard with up to 1 million gallons of water in as many as 6 to 9
frac stages per well. With fracture treatments requiring tens of thousands of barrels of water per
stage to stimulate fractures, massive amount of fracture fluid loss occurs due to the water based
fluid creating interfacial tension between the injected fluid and the reservoir rock. Therefore, the
goal of this fluid design is to achieve facture fluid which could increase flowback water
recovery. Commonly used additives for frac-fluid is shown at Table 7c. However, in this design
innovative microemulsion type surfactant would be added as a flowback enhancer. Proppant
transportation modifier (PTM) would not be added since PTM costs significant amount of money
and not yet applicable to commercial reservoir.
8.2.3.1 Additive Selection
(1) Thickening agent – Hydrozypropylguar gels (HPG) without breaker
The typical HPG gel treatment uses a 40-pund crosslinked gel containing gel breaker. However,
reservoir temperature at the Bradford site is relatively low around 70-100F such that HPG
without breaker is suitable for our target site. Furthermore, porosity (0.005), thickness (200ft),
permeability (0.0001~0.01md) and pressure (3,000~4,000psi) of targeted site also allows HPG as
best thickening agent.
(2) Friction Reducer – salt tolerant (up to 12% NaCl) Anionic Polycrylamide
Polyacrylamide is a polymer of acrylamide subunits that can be readily cross-linked. Considering
relatively low reservoir temperature and PH of 6 to 8, anionic polyacrylamide is an economic
choice for the Bradford site. However, high concentration of salt which can decrease the
capability of friction reducer is found over the Marcellus Shale including out site. Therefore, the
most effective friction reducer exhibits in the Marcellus shale is anionic polycrylamide with up
to 12% salt tolerance. Figure 59 shows a comparison effect of this friction reducer (Houston et
al, 2009) .
(3) Biocide - 20% active dibrominated nitrilopropionamide (DBNPA)

54
DBNPA is a common pesticide used as an algicide, bactericide and fungicide (slime forming
algae, bacteria and fungi; preservative (additive); fungicide (mold and mildew) (Houston et al,
2009). Since target field located at Bradford County contains high level of sulfate-reducing
bacteria (SRB), the liquid 20% active DBNPA is highly effective, easy to apply and considered
one of the safest biocides for the environment. Figure 60 illustrated the capability of DBNPA to
reduce the level of SRB (Houston et al, 2009).
(4) Iron Control – Iron control agent (ICA)
Iron-reducing and chelating agents consist of acidic chemicals such as citric acid, acetic acid,
and ethylenediaminetrataacetic acid (EDTA) leeps the iron in formation in a soluble or reduced
form. If iron is not controlled it could cause polymer degradation which could lead to damage of
the formation.
(5) Clay Stabilizer – 2% Potassium chloride + 2gpt clay stabilizing agent (CS)
An analysis of the shale in the Marcellus in Table 7d clearly shows clay abundance (P. Kauman
and G.S. Penny, 2008). Thus, without clay stabilizers would cause permeability decrease of the
formation. Higher concentration of KCL show better performance but cost then becomes issue.
Therefore, 2% KCL + 2gpt CS is our choice of clay stabilizer.
(6) Scale ingibitor – anionic phosponates
Calcium sulfate, calcium carbonate and barium sulfate can cause scale problems if the
concentration is high enough. Most common scale inhibitor is anionic phosponates. This is
known to be compatible with chosen friction reducer and clay stabilizer.
(7) Corrosion inhibitor – N,n,dimethyl formamide
Corrosion inhibitor is used to hinder the corrosion of steel tubing, well casing, tools and tanks (J.
Daniel, Brian Bohm, and Bobbi Jo Coughlin, 2009). Considering the temperature of our site
relatively small amount of this additive is sufficient.
(8) Breaker – peroxydisulfate
The temperature of our site does not lead thermal breaking of the polymer gel. However, a
breaker is added to the fracture fluid in later stages of the process to break down the viscosity of

55
the gelling agent to aid in releasing the proppant and enhance the volume of flowback water after
completion (J. Daniel, Brian Bohm, and Bobbi Jo Coughlin, 2009).
(9) Sulfactant – nonionic microemulsion containing linier and branched alcohol ethoxylates +
2% ethoxylated alcohol fluorosurfactant
The major use of surfactant in shale treatment is to lower interfacial tension. Flowback recovery
rate can be drastically enhanced with the application of ME + 2% FS system. Figure 61 and 62
shows laboratory experiments done by using chosen surfactant. Field study performed at the
Bradford formation which has almost identical reservoir property also shows post-fracture
recovery rate of 70%-86% with the application of microemulsion technology (P. Kauman and
G.S. Penny, 2008).
(10) Proppant Transportation modifier (PTM) – not in use.
Tiorco Chemical Co. and Stephan Chemical Co. both went under research of PTM or buoyancy
changing proppant transportation. However, according to senior research Mr. Yang at Tiorco
company “currently developed technology regarding PTM is not applicable anywhere due to
extremely high price of PTM.” Since there is no massive production facility of the surfactant
used for PTM, PTM itself costs very high which make impossible to keep payzone. He also
recommended use of ceramic proppant whose technology has been developed for decades now
becoming popular for new developing shale reservoir.
Table 7e shows final additives concentration designed for this project.
8.2.3.2 Proppant selection
Widely used proppant these days around Marcellus shale is CarboProp (40/70). It is frequently
selected for moderate depth oil and gas wells and has excellent crush resistance in a broad range
of applications. Effective at closure stresses to 14,000 psi. In order to enhance proppant
distribution, the use of lightweight CarboLite (20/40) with CarboProp is our choice of proppant.
Figure 63 and 64 show typical property of CarboProp and CarboLite. Once ceramic proppant
was expensive to use for fracturing huge shale reservoir but constant development and extension
of ceramic industry recently provides cost effective high performance proppants. Figure 65
illustrates benefits of ceramic proppants (CARBO ceramics, 2010).

56
8.3 Characterization of Post-Fracture Flow-back water
Conversion factor
1 Barrel = 42 Gallons
1 Gallon = 0.023809523809523808 Barrels
3,600,000 Gallons of hydraulic fracture fluids used for a single horizontal well fracture job =
85714.28571428571, approximately 85, 714 barrels
A load recovery of approximately 86 % of the injected fluid is achievable due to the fracture
design (fluid type, fluid viscosity, proppant type and pump volume) which amount to 73,714 bbl
(Fig. 66)
It is important to note that;
1. The amount of dissolved components increased as flowback advanced (Fig. 67). Both
sodium and calcium exhibit analogous trends in the developed wells.
2. Sodium and calcium are the most common cations (Fig. 68).
3. Alkalinity and pH decreased as flowback progressed, potentially explaining the rise of
calcium levels.
4. This is prone to sulfate scaling as the amount of calcium rises while sulfate is drops (Figs.
68 and 69).
5. A mono-valent ion trend is illustrated in Fig. 70 while Fig. 71 shows a divalent cation
trend.
6. Fig. 72 shows a sharp increase in barium levels in the latter stages of flow back (at about
30% load recovery) suggests possible barium sulfate scale development as the flow back
progresses. The solubility of barium sulfate is very low and it can be a very aggressive
scale.
7. Iron content in the flowback increased as flowback progressed (Table 8).
8. Chemical composition of these waters can be classified as highly saline.
9. With cations such as Magnesium, Strontium, and Barium, chemical signatures of the waters
are consistent with carbonate-rich and evaporite sources.
Table 9 presents analytical data from the Marcellus Shale Well in Bradford county flowback
waters taken over a period of 20 days. Barium is significantly high, reaching a maximum value
of 3100 mg/L. Strontium levels reached a maximum value of 4,310 mg/L on the twentieth day.
It was observed that Sr values are as high as 15,000 mg/L in flowback waters from other

57
Appalachian Basin Marcellus wells at later times. Potassium levels are more to the other of
496mg/L at 20 days. Also present are less common metal ions, including boron, cobalt and
lithium. Magnesium and manganese are often found to correlate well with calcium levels.
As the chemical composition of Marcellus flowback water varies (Table 10) dependent upon the
well location and elapsed time since the fracture was completed, the following test results are
typical of the results obtained (Table 11 and 12).
8.4 Engineering Considerations:
Waste water treatment and water reclamation processes implemented for treating hydraulic
fracture flowback must take into consideration the disposal of the large amount of sludge solids
produced by the process. The Forward Osmosis process, operating on a hydraulic fracturing
flow-back water to treat 14, 400 Barrels = 604, 800 gpd with an “average” chemical composition
of barium 4,300 mg/l, 21,850 mg/l calcium, 1,300 mg/l, magnesium, and 3,400 mg/l strontium,
would produce, at 40% solids sludge cake, 67,000 lb of barium sludge and 281,815 lb of
calcium/strontium/magnesium sludge per day. Pennsylvania Department of Environmental
Protection residual waste permitting requirements and the cost of moving large quantities of
flowback water, hydraulic fracture makeup water, and produced sludge solids shows the need for
a number of dedicated FO flowback treatment systems sited across the area under laid by
Marcellus shale formation.
Exclusive of the incoming hydraulic fracture flowback water and treated water storage tanks, we
have estimated that a 604, 800 gpd FO process system would require a hydro-pneumatic tank and
a vessel for the FO system Figure 73.
8.5 Hydropneumatic Tanks
Vessels that contain both water and air under pressure can be called a hydropneumatic tank. The
captive compressed air acts as a cushion which can exert or absorb pressure as required.
Our design takes into consideration the flowback recovery per hour in our system, which is
600bbl/hr for the centralized system, but 150bbl/hr for a single well pad. The tank size required
would be a 25,000 gallon tank, covering approximately 1,202 square feet and cost $52,255. In

58
other to prevent corrosion, we would install an epoxy lining which wpould increase the cost to
$64.610 and it would have a design working pressure of 125# ASME.
8.6 Concept of Forward Osmosis
FO is a membrane-based separation method that utilizes the energy from an osmotic gradient
across the membrane to pul l or ‘draw’ the water through the selectively permeable
membrane. This is in contrast to reverse osmosis (RO) which utilizes mechanical energy to
force the water through the membrane. The draw solution used to pull the water in the forward
osmosis system is typically a highly concentrated, homogenous salt or sugar solution, and the
resulting produced water is therefore a diluted version of the draw solution. The undesirable
solids and solutes are denied access through the FO membrane, resulting in a concentrated waste
stream on the waste water side of the membrane and also we have a nano-pure diluted draw
solution on the effluent side of the membrane which is later separated simply by heating. The
draw solution for our design is the ammonia carbonate solution, and the issue of membrane
fouling is reduced using the forward osmosis since there is no pressure applied on the membrane
by the osmosis process. The salt concentration provide the chemical energy that operates the
system, in the forward osmosis system, there is no need for pre treatment and also there is no
substantial electrical or power consumption within the system thus making the carbon footprint
of the process very small. Forward osmosis has the smallest carbon footprint of the available
water reclamation processes.
The forward osmosis reclamation process satisfies the following conditions for practical and
cost-effective waste reclamation process:
the amount or volume of ‘new’ freshwater required for completion fluid is greatly reduced,
no new waste streams are created, the volume of drilling waste to be disposed of is reduced, an otherwise wasted chemical energy source is utilized to reclaim the reserve pit
waste water, and the system is operated on the well location without disrupting normal operational
practices, which reduces the operator’s overall logistical concerns and environmental exposure.
The FO units design are flexible, scalable and portable to facilitate the waste water to be treated
on location, thereby doing away with the trucking costs and environmental exposure associated

59
with hauling the wastewater to disposal sites. The complete unit would be mounted on a 53-foot
trailer pulled by 10-wheel Class 8 tractors. The reclaimed water from the forward osmosis unit
would be stored in fracture water tanks located on the well sites which are reused for other
fracturing jobs or the the reclaimed water could be stored in lined pits.
8.7 Field Applicability of the Forward Osmosis Unit:
The forward osmosis unit design, for the approximately 10 bbl/min unit would consist of a large
TFC membrane 16 inch by 40 inch spiral-wound elements in one low pressure recirculation
vessel. The FO unit design can effectively reclaim in excess of 90% of the water from typical
flow back water tanks. The total suspended and total dissolved solute rejection effectiveness of
the forward osmosis membranes used in the unit has been well established in the scientific
literature. The FO membranes have been proven to reject 100% of bacteria, viruses, and
colloidal solids in addition to removing over 97-99% of the heavy metals and salts
A 4 inch by 4 inch, 17 bbl/min centrifugal transfer pump would be used to recirculate the water
from the tanks into the unit for processing. 36% NH4CO3 draw solution is pumped into the unit
using a ½ to ¾ horsepower, 1.8 bbl/min centrifugal transfer pump. The entire system which
consists of pumps and ancillary equipment (lights, trailer house, etc) would be powered by a 25
kilowatt diesel generator, but in our case, we would generate this needed power from the system.
It is important to note that the pumps do not push the water through the membranes but only
supply source water to the unit, the osmotic gradient ‘pulls’ the water all the way through the
membrane. The 10 bbl/min FO unit can be effectively operated by a single person, or for
efficiency, two operators (each taking a 12 hour shift) will be on location.
8.8 Forward Osmosis and Blue Energy Combination System
Initial designs proposed had utilizing the Forward Osmosis and Blue Energy aspects of our IPA
as separate entities. These initial designs aimed at increasing the efficiency of the independent
systems and then the efficiency of the overall design. After intensive review of the engineering
attributes of these previous designs, combining the two systems to work simultaneously
together proved to be a more efficient and cost effective system design. The goal of the Blue
Energy in this system is to provide the energy required to pump flow back water from the drilled
well and to power the Supervisory Control and Data Acquisition (SCADA) system. The
60
osmotic gradient generated by the TFC-MP membrane and Ammonium Bicarbonate draw
solution theoretically allows for sufficient energy generation for our system needs. This
integrated system will decrease the energy costs, increase the effectiveness of our system, and
decrease environmental concerns.
System Overview
The proposed design is a novel semi-portable centralized flow back water treatment facility.
This system will be semi-portable to reduce the costs and environment impacts associated with
current methods of flow back water treatment for gas wells in Bradford county Pennsylvania.
This system will be scaled to treat 604,800gpd (gallons per day) A Supervisory Control and Data
Acquisition (SCADA) system will be utilized to maintain the optimal flow rate of 10bbl/min of
treated water. The solids separated from the reclaim water will be contained in a separate tank
that can be transported for storage until it is to be sold. The treated water will be housed in a
separate area. This treated water then can be used in future well fracture operations, sold or can
be returned to the environment since it will meet/exceed standards enacted by the Environmental
Protection Agency (EPA). Figure 74 shows a general overview of the most important features
of the system. Forward Osmosis is the most effective flow back water treatment method since,
there is no need for pre treatment of the flow back water and also there is no substantial electrical
or power consumption within the system thus making the carbon footprint of the process very
small. Forward osmosis has the smallest carbon footprint of the available flow back water
reclamation processes that were considered for our flow back water treatment facility.
8.9 Goal of the Integrated System
The proposed design aims to provide a portable and effective flow back water treatment
system that additionally generates the power necessary to run the system. A portable shipping
container will be modified to house both the Forward Osmosis and Blue Energy portions of the
system. An elevated tanker trailer will be used to house the flow back water that will be
introduced into the treatment system. This system will be designed to effectively treat 604,800
gallons of flow back water per day. The reclaimed water from the forward osmosis unit would
be stored in fracture water tanks located on the well sites which are reused for other fracturing
jobs or the reclaimed water could be stored in lined pits. The goal of this system is to provide a

61
portable and effective flow back water treatment system that eliminates the limitations of
currently used techniques.
8.10 System Housing Selection
A steel portable shipping container will be used to house the Forward Osmosis Unit, Blue
Energy generation components and Supervisory Control and Data Acquisition (SCADA)
systems. This proposed design will utilize a 40 foot Dual Insulated Dry Goods Shipping Cargo
Container with the dimensions 40ft L x 8ft H x 8ft W. A Dual Insulated Dry Goods Shipping
Cargo Container was the ideal housing unit since modified containers are readily available. The
estimated price for the 40ft shipping container Figure 75 and chassis Figure 76 is $7,000 USD
including modifications. The Forward Osmosis and Blue Energy systems would be housed
within 30-36ft of the available 40ft of the Dual Insulated Dry Goods Shipping Cargo Container.
The reaming 4-10ft of available length will be used to house the main components of the
Supervisory Control and Data Acquisition (SCADA) system and other miscellaneous
components. The container will need separate insulation considerations for the Forward Osmosis
process and for Supervisory Control and Data Acquisition (SCADA) system. The Forward
Osmosis system section of the container must be insulated to prevent the liquids in the system
from freezing and to reduce the costs associated with heating required for the separation of the
draw solute from the treated water. The Supervisory Control and Data Acquisition (SCADA)
section of the container must be insulated and vented to prevent the computer components from
overheating in the warmer periods of operation. During the cooler periods, the computer
components will generate enough heat to prevent failure. Anti-Slip mats will be installed
within the Dual Insulated Dry Goods Shipping Cargo Container to reduce the likelihood that any
human operator would slip due to liquids on the floor. Shatterproof fluorescent lights will be
installed in both the Forward Osmosis section and Supervisory Control and Data Acquisition
(SCADA) section of the container. The lights will be installed mainly for maintenance
operations. This container will be housed upon a trailer designed to house and haul shipping
containers by Semi Trucks. This elevation also allows for housing a container to collect and
house the dissolved solutes separated out of the flow back water by the forward osmosis
membrane. This collection method will be directly connected to the system to prevent spillage
of the dissolved components into the environment. An Excalibur ®intermediate bulk container

62
(IBC) Figure 77 manufactured by Snyder will be used. A plastic intermediate bulk container
(IBC) be used since it is lightweight, durable and resists corrosion better than an steel
intermediate bulk container (IBC) .
8.11 Flow Back Water Storage Selection.
In order to better control the flow of flow back water entering the Forward Osmosis system a
liquid storage tank will be used. This liquid storage tank will also be elevated off of the ground.
It is necessary to increase the pressure of the flow back water entering the forward osmosis
system. By elevating the flow back water storage tank above the level of the forward osmosis
system, gravity can be used to increase the pressure of the flow back water entering the system.
This tank would additionally be outfitted with a trailer chassis to make it portable.
8.12 Draw Solution Selection
The draw solution is the driving force for movement of water out of the flow back water through
the semi-permeable membrane. An ideal draw solution must have a high a high osmotic
efficiency, low molecular weight, zero-liquid discharge, non-toxic, chemical compatibility to the
membrane, easy separation from water and recyclable. [McGinnis 2007] The proposed
forward osmosis design uses Ammonia bicarbonate (NH4HCO3). Ammonia bicarbonate meets
all of the desired characteristics of an ideal draw solution for forward osmosis. Experimental
design has show separation of water from wastewater will low concentrations of Ammonia
bicarbonate. This is an additional reason why Ammonia bicarbonate has been selected as a draw
solution. Since the concentration of the flow back water varies at different stages of well
fracturing, a draw solution that can separate water at low concentrations is desirable. The draw
solution can also increase the concentration to help increase the osmotic efficiency to increase
the effectiveness of Blue Energy generation. 36% Ammonia Bicarbonate draw solution is
pumped into the system using centrifugal transfer pump. Since the one of the goals of the
forward osmosis is to treat flow back water economically, Ammonia bicarbonate can be easily
separated from water, by increasing the temperature of the mixture to moderate temperature of
60 degrees Fahrenheit.
63
8.13 Forward Osmosis Membrane Selection.
The membrane is the main limiting factor of the forward osmosis system. The membrane must
have a low concentration polarization both internal(ICP) and external concentration
polarization(ECP), chemically compatible to draw solution, reduce the propensity for fouling,
membrane configuration and strength, membrane capacity, increase flux and increase osmotic
pressure. By incorporating Blue Energy into the flow back water treatment system, increased
osmotic pressure; increased flux and membrane capacity carry even more weight than normal
forward osmotic applications. The Thin-Film Composite Medium Performance membrane
developed by Yin Yip at Yale University (Yip, 2011) will be used for this proposed design.
Analytical grade Polysulfone beads, N,N-dimethylformamide, 1,3-phenylenedianmine and 1,3,5-
benzenetricarbonyl trichloride to construct the membrane. The backing support layer for the
Plysulfone Beads is a thin (40 μm) open-structure polyester nonwoven fabric. This membrane
has show sustainable power generation from salinity gradients, the driving force for Blue
Energy. This membrane also satisfies the necessary attributes for a forward osmosis membrane.
This membrane consists of a thin active layer supported by a polymer layer that is highly
permeable to water and has a high propensity to reject dissolved solutes. The thickness of the
active layer and support layer are 125 micrometers. Due to the polyamide chemistry this
membrane will be stable up to a pH of 11. The membrane has an intrinsic water permeability is
5.81 (L m-2h-1bar-1); solute permeability coefficient of 0.61 (L m-2 h-1) ; a structural parameter of
370(μm); has a peak power density of 10 (W/m2. ); water flux of 30 (L/m2h) and can create a
osmotic pressure differential of 25bars. (Yip, 2011) This membrane was soaked in a 1.5 M
ammonia bicarbonate solution for seven days and showed no visual changes and the flux
remained constant. Since the pH concentration will fall within the acceptable range, we do not
predict a high propensity for membrane fouling, thus reducing the costs since the membrane will
not need to be continually changed. Thus, under normal operating conditions an estimated life
span of five years should be achieved. The TFC membrane would be housed in several spiral -
wound membrane modules. The use of several simultaneous spiral-wound membrane modules
will be used to increase efficiency of the flow back water treatment and reach our optimum
reclaim water flow rate of 10bbls/min.

64
8.14 Supervisory Control and Data Acquisition (SCADA)
A SCADA system was developed and utilized to control draw solution concentration and
temperature in the forward osmosis system. Also, the SCADA receives signals from
conductivity, pH, temperature, and pressure sensors, as well as readings from an analytical
balance were acquired and recorded by the SCADA system in an attempt to maintain a constant
draw solution concentration, the forward osmosis system.
The SCADA system monitors and controls the concentration of salt in the draw solution by
adjusting the pressure gradient of the system; it monitors the concentration of the draw
solution and corrects the conductivity by sporadically operating a peristaltic pump that
distributes concentrated salt solution into the draw solution tank several times per minute as
needed. A screen capture of the SCADA system is presented in Figure 78.
8.15 System Design
A 4 inch by 4 inch, 17 bbl/min centrifugal transfer pump, powered by a 25 kilowatt diesel
generator, will be used to pump the flow back water from the wells into the 25,000 gallon
hydropneumatic tank. A. A SCADA monitoring sensor would be placed here to control the flow
rate of flow back water into the Forward Osmosis Unit. The flow back storage tank is connected
to the Forward Osmosis unit through a 10ft long 3in pipe at a 45-degree angle. The flow back
water flows from the entrance into the system to the low pressure recirculation vessel via two
feet of 2in pipe at zero angle. A SCADA monitoring sensor will be placed in this area of pipe to
measure pH and concentration used to determine the concentration of the ammonium bicarbonate
necessary to achieve proper separation. In the low pressure recirculation vessel the TFC
membrane in housed in a spiral-wound membrane module that will house a 1 meter TFC
membrane. The unit will consist of multiple spiral-wound membrane modules so that the
optimum membrane surface area can be achieved. The flow back water and draw solution run
tangential in a cross flow mode this allows the liquids to flow freely on both sides and for the
dissolved solids to drop out . The 36% NH4CO3 draw solution is pumped into the low pressure
recirculation vessel, using a ½ to ¾ horsepower, 1.8 bbl/min centrifugal transfer pump. A
SCADA monitoring sensor and valve will be placed at the inlet to the recirculation vessel from
the draw solution storage tank to control the amount and concentration of the draw solution

65
released. The dissolved solutes drop from the surface of the membrane element to pass through
the container into a 120 gallon plastic Excalibur IBC via a 4” to 6” piping.
The osmotic pressure gradient created by the ammonium bicarbonate draw solution draws the
reclaimed water through the membrane and through the turbine (generating the energy necessary
to power our system) via a 1” one foot long pipe. The water flux capacity for the system will be
3600 L/m2h. The Power density of the system will be 1200 W/m2The dilute draw solution and
reclaim water then are introduced into a single vacuum distillation column at the top of the
column and moves downward in a counter-current flow. The heat from the rising vapor (approx
60 degrees Celsius) from the fired reboiler to the falling liquid causes the separation of the more
volatile ammonia and carbon dioxide from the reclaim water. The volatile ammonia and carbon
dioxide gases pass from the single vacuum distillation column back into the draw solution
storage tank. The water that passes through the bottom of the single vacuum distillation column
is then passed thought the fired reboiler (which causes the water vapor necessary to separate the
draw solution from the reclaim water) to the fracture water tanks located on the well sites which
are reused for other fracturing jobs or the reclaimed water could be stored in lined pits through a
2” pipe of various lengths depending on where the reclaim water will be housed. A SCADA
monitoring sensor will be placed here to monitor the flow rate and report to other monitor to
adjust their settings or to remain the same. Figure 79 shows a schematic drawing of our Novel
Semi-Portable Centralized Forward Osmosis Water Treatment Facility. Figure 80 illustrates a
generalized footprint of our Novel Semi-Portable Centralized Forward Osmosis Water Treatment
Facility. It is important to note that since this will be set up at either a single well or as a
centralized system. The pipe lengths to the hydropneumatic tank will vary. It will also be
important to incorporate a feed-back loop system that can be directly monitored by our SCADA
system to monitor pressure through these pipes. This is important in detecting a leak and rapidly
implementing our Spill Containment procedures. The Forward Osmosis and hydropneumatic
tank need to be placed upon a lined gravel pad. This will prevent potential spill liquids from
entering the ground. Calculations need to be performed onsite to determine the distance that the
berm should be to prevent liquid from the hydropneumatic tank if punctured or knocked over
from exceeding the lined gravel pad.

66
Chapter 9: Osmotic Energy Generation (Blue Energy) System Design
9.1 The Principle Of Pressure Retarded Osmosis (Pro)
The two major methods of osmotic power generation are the Reverse Electrodialysis (RED) and
Pressure Retarded Osmosis (PRO) methods (Post, et al., 2007). This system adopts the PRO
method, and this section will explain how power is generated by this means and how this method
can be incorporated in our blue energy system. This method is a viable source of renewable
energy, and its theory is embedded in the osmosis theory where water from a solution of lower
salinity – also known as feed solution- passes through a semi-permeable membrane into a
solution of higher salinity – also known as draw solution. But the major difference in this process
from a traditional osmosis process is the application of pressure on the side of the draw solution,
which assists in pressurizing it and when this pressurized solution flows through a water turbine,
power is generated (Leob, 1976).
The major factors that affect the PRO method are the osmotic pressure differential (Δπ), the
hydraulic pressure differential (ΔP), and the semi-permeable membrane parameters. The general
water transport equation is given by:
𝑱𝒘 = 𝑨(Δπ- ΔP) (L/m2h) (1)
Where Jw is the water flux and A is the water permeability coefficient of the membrane (also
referred to as the intrinsic permeability)
The direction of the water flux is shown in figure 81.
The salt permeability coefficient (B) is another important factor, and this coefficient is a measure
of a semi-permeable membrane to allow small amounts of salt diffusion across the membrane
from the draw solution to the feed solution as a result of concentration gradients. This effect will
reduce the osmotic pressure differential hence is not healthy for the system. The B coefficient is
inversely proportional to the efficiency of the system, as such the smaller the better. The
equation is given by:
𝑩 = 𝑨(𝟏−𝑹)(𝜟𝑷−𝜟𝝅)𝑹
(L/m2h) (2)
Where R is the salt rejection
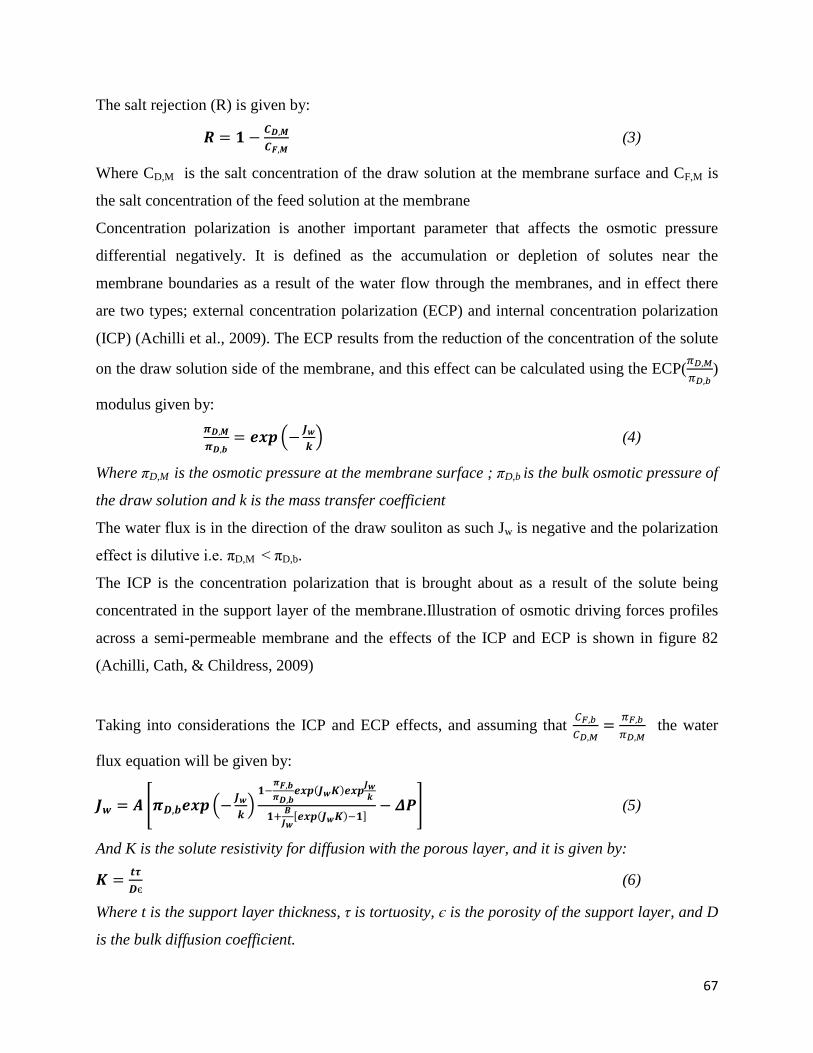
67
The salt rejection (R) is given by:
𝑹 = 𝟏 − 𝑪𝑫,𝑴𝑪𝑭,𝑴
(3)
Where CD,M is the salt concentration of the draw solution at the membrane surface and CF,M is
the salt concentration of the feed solution at the membrane
Concentration polarization is another important parameter that affects the osmotic pressure
differential negatively. It is defined as the accumulation or depletion of solutes near the
membrane boundaries as a result of the water flow through the membranes, and in effect there
are two types; external concentration polarization (ECP) and internal concentration polarization
(ICP) (Achilli et al., 2009). The ECP results from the reduction of the concentration of the solute
on the draw solution side of the membrane, and this effect can be calculated using the ECP(𝜋𝐷,𝑀𝜋𝐷,𝑏
)
modulus given by: 𝝅𝑫,𝑴𝝅𝑫,𝒃
= 𝒆𝒙𝒑�− 𝑱𝒘𝒌� (4)
Where πD,M is the osmotic pressure at the membrane surface ; πD,b is the bulk osmotic pressure of
the draw solution and k is the mass transfer coefficient
The water flux is in the direction of the draw souliton as such Jw is negative and the polarization
effect is dilutive i.e. πD,M < πD,b.
The ICP is the concentration polarization that is brought about as a result of the solute being
concentrated in the support layer of the membrane.Illustration of osmotic driving forces profiles
across a semi-permeable membrane and the effects of the ICP and ECP is shown in figure 82
(Achilli, Cath, & Childress, 2009)
Taking into considerations the ICP and ECP effects, and assuming that 𝐶𝐹,𝑏𝐶𝐷,𝑀
= 𝜋𝐹,𝑏𝜋𝐷,𝑀
the water
flux equation will be given by:
𝑱𝒘 = 𝑨 �𝝅𝑫,𝒃𝒆𝒙𝒑�−𝑱𝒘𝒌�𝟏−
𝝅𝑭,𝒃𝝅𝑫,𝒃
𝒆𝒙𝒑(𝑱𝒘𝑲)𝒆𝒙𝒑𝑱𝒘𝒌
𝟏+ 𝑩𝑱𝒘
[𝒆𝒙𝒑(𝑱𝒘𝑲)−𝟏]− 𝜟𝑷� (5)
And K is the solute resistivity for diffusion with the porous layer, and it is given by:
𝑲 = 𝒕𝝉𝑫є
(6)
Where t is the support layer thickness, τ is tortuosity, є is the porosity of the support layer, and D
is the bulk diffusion coefficient.

68
The K term is also a very important parameter, and its magnitude affects the membrane
performance indirectly; the smaller the K term, the more effective the membrane (Leob, 2002).
The membrane structural parameter (S) is another very important parameter and is given by:
S = KD = 𝒕𝝉є
(µm) (7)
9.2 Power Density In PRO
Water flux through the membrane and the hydraulic pressure differential across the membrane
are the major variables for power density (W) calculation. The power density equation is given
by:
W = Jw ΔP (W/m2) (8)
Substituting the equation (1) into equation (7) will give us a power density equation of:
W = A(Δπ- ΔP) ΔP (9)
Differentiating equation (8) with respect to ΔP, it can be shown that the maximum power density
(Wmax) is obtained when ΔP=𝛥𝜋2
and the governing power density equation will now be given by:
𝑾𝒎𝒂𝒙 = 𝑨𝜟𝝅𝟐
𝟒 (10)
9.3 Forward Osmosis (FO)
The term forward osmosis is used to refer to normal osmotic processes, so as not confuse it with
PRO or reverse osmosis (RO). Forward osmosis is illustrated in figure 83.
The Forward osmosis process is a process that will occur on its own, without any form of
external pressure or push. Our system adapts the FO theory and the advantages include:
• Elimination of external pressure • Reduce cost by eliminating large pressure pumps and pressure exchanger systems • Pressure generated in draw solution can be utilized in place of external pressure • Supports the objective of small-scale power generation • Availability of FO membranes that can be used to develop PRO situations
In an FO system, as the water flows towards the draw solution, through the semi-permeable membrane,
the hydraulic pressure obviously increases on the side of the draw solution (hypertonic solution) due to
the increase in volume as shown in Figure 84.

69
9.4 Blue Energy Generation from the Waste Water Using Forward Osmosis
In designing a blue energy system, one of the major difficulties over the year has been the choice
of membrane since most of the available membranes are not commercially efficient and usually
require large surface areas to be able to generate any reasonable amount of energy. Our system
incorporates a thin-film composite membrane (TFC) and the TFC-PRO membrane (Yip, et al.,
2011) is the type of TFC membrane used for our system. This is an assymetric membrane and the
micrograph is shown in Figure 85.
There are three major TFC-PRO membranes; the Low permeability (LP), medium permeability
(MP), and high permeability (HP) TFC-PRO membranes. Their properties are shown in Figure
86:
From the plots it can be observed that the highest power density is obtained from the MP TFC-
PRO membrane, and the B term is comparatively low too. This is the most favorable for our
system.
The feed solution and draw solution also equally affect tremendously the performance of the FO
system. In our system the feed solution is the waste water and the draw solution is Ammonium
bicarbonate (NH4HCO3). The concentrations of the draw and feed solutions both affect the
osmotic pressure differential of the system and will therefore affect the power density of the
system as shown in the equations above.
The experimental values of the membrane parameters are:
Water permeability coefficient (A) = 5.81L/m2hbar
Salt or solute permeability coefficient (B) = 0.61L/m2h
Structural parameter (S) = 370µm
Power density (W) = 10W/m2
Water flux (Jw ) = 30 L/m2h
Osmotic pressure differential (Δπ) = 25bars
Hydraulic pressure differential (ΔP) = 12.5bars
Our membranes are arranged in a cylindrical pack which maximizes space, allowing better
portability. The membrane system is designed to occupy a space of 4m by 1.91m by 1.6m
(length by width by height) and as such can accommodate 120 membrane units of a 1m2 TFC-

70
PRO membrane. Therefore the total expected water flux capacity and power density will be
3,600 L/m2h and 1,200W/m2 respectively. Taking into considerations the effects of osmotic
pressure on the water flux, and since this a controllable parameter, our system is designed to
attain a water flux capacity of over 17,000 L/m2h (approximately 150bbl/h) by increasing the
osmotic pressure of the system.
9.5 Turbine and Power Storage Considerations
As earlier mentioned the power capacity of the system is only when the water from the
pressurized draw solution side of the membrane flows though a water turbine, which in turn
generates power. Taking into consideration the expected power density of our system, a
comparatively small, high efficiency turbine of minimum capacity of 1.2kW is incorporated in
our system. This turbine is going to depend mainly on the flow of the pressurized thermolytic
mixture (mixture of the draw solution and water) and not on depth.
Our storage system adapts a capacitor system, with the ability to store power for years. This
storage system is connected to a step-up transformer, when required, to raise the power supplied
to system equipments. The power storage system also has a minimum power capacity of 1.2 kW.
9.6 Osmotic Power Generation System Design Assumptions and Contingency Plan
A lot of assumptions were made in the design of this system and these assumptions include:
Concentrations of feed solution and draw solution are maintained at considerably stable values.
The ICP and ECP effects are negligible.
Osmotic pressures remain the same during the desalination and power generation processes.
The SCADA takes care of any unwanted changes in solution properties.
• The system is 100% efficient. • The experimental parameters are suitable for the entire system. • The draw solution can attain the required hydraulic pressure for maximum power
generation. • The design also adapts the following contingency plan: • The membranes are arranged in a way that they are easily replaceable in the event of any
malfunctioning whatsoever. • The osmotic concentration of the system is maintained by the control of the concentration
of the draw solution.

71
In order to meet other power demands that might exceed the expected supply, a step-up
transformer can be installed.
Unused capacitors are available at the site, to take care of any excess power produced.
In the case of unwanted rise in temperature in the container, a ventilation system is provided to
maintain the temperature in the container.
All the components of this system are maintained on a regular basis to ensure that they are all
functioning at their expected capacities.
72
Chapter 10: Associated Costs Evaluation
The total costs of this project associated with above mentioned activities are obtained. Some of
these data have not been published in any literature work. They have been obtained by personal
interview of company representatives.
Exploration Cost
The initial phase in petroleum operations that includes generation of a prospect or play or both,
and drilling of an exploration well is called ‘Exploration’. Cost belonging to these activities
comes under exploration cost. There are several kinds of Exploration, namely, Geochemical,
Geophysical and Seismic. This cost has been taken as $20% of total expenses for this study.
Administration Cost
Expense incurred in controlling and directing an organization, but not directly identifiable with
financing, marketing, or production operations. Salaries (Accountants, Engineers, and Laymen)
and costs of general services fall under this heading. Administrative costs are related to the
organization as a whole. This was considered as 10% of total expenses for this study. (Byungtark
Lee,2009)
Royalty
A payment made for the use of property, especially natural resource. The amount is usually a
percentage of revenues obtained through its use. This amount is calculated as certain percentage
of revenue (before tax) generated from the production sale. It was considered as 12.5% for this
project.
Lease Cost
Lease cost involves the expense, incurred by a company to use land for exploration, drilling and
production involved in oil and gas operations. As the land records date back to 1700s, the leasing
process becomes complicated and may take three to six months. In addition to Mineral right,
permission is required from other two owners. It involves a complicated process of getting
approval from the surface land owners to set up the equipment, needed and also the permission
to drill through the coal seam. The latter is easier because it is impossible for a person with the
coal mining rights to stop a company from drilling through it. Securing the lease and starting the
planned activities usually take anywhere between 3 to 6 months in Pennsylvania ( Rohan
Belvalkar,2009). Usually, Lease cost is stated per acre per year. However, this is a mutual
73
consent between the surface land owner and the lessee. Lease cost for a specific location varies
with the price of natural gas. Before the potential of the Marcellus as an economic play was fully
understood, lease prices were at a premium of $500. When gas prices touched 15$/MMBTU, the
lease cost increased to as high as $3000 (Rogers, 2008). Lease cost also varies from county to
county, depending mainly on the gas in place and other factors. The lease cost basically reflects
the profit making of a certain area. As stated earlier lease cost mainly goes up with time. So the
earlier a company gets into a play the more money it makes. Lease agreements are generally
renewed at the ongoing price at that particular time. Big players have a team of lawyers and
real‐estate specialists to deal with leasing terms and conditions. Lease costs for each county are
easily available. In Bradford country, this cost varies ($500‐$2500/acre) with market price of the
gas. It was taken as $1500/acre Table 13.
Infrastructure Cost
This cost is associated with the money spent on facilities viz. Offices, Site, Roads, Gathering
station, Processing Plant, and Pipelines. In an interview, this cost was reported in $/Mcf by Rex
Energy. It was not possible to get the further break‐up of cost related with each component. This
was $1/Mcf.
10.1 Drilling and Completion Cost
10.1.1 Drilling Permit Fee
There are more than 350,000 drilled wells since 1859 in PA. Oil and gas laws (all or in part)
have regulated exploration and drilling for oil and gas. They are ‘The Clean Streams Law’, ‘The
Dam Safety’ and ‘Encroachments Act’ etc. There are several agencies like Pennsylvania Fish
and Boat Commission, Susquehanna and Delaware River basin commissions that oversee the
quality of water and aquatic life in Pennsylvania. Oil and Gas Act of 1984 requires oil and gas
companies to acquire a drilling permit, through an extensive permit application process. The
application fee has changed from the flat rate of $100 to at least $250. It increases with depth and
type of drilling. This permit is submitted to Pennsylvania Department of Environment Protection
(DEP), who enforces the regulations.( Hemant Kumar,2009)

74
Prior to February 2009 it was only $100 per well regardless of the specification of the well,
however since then it has changed and now it is calculated based on the depth and length of the
well. In this project with D=6000 ft and L= 4000 ft the application fee was calculated to be
$2150 for a single well.( Armstrong Agbaji,2009)
Vertical Drilling:
Horizontal Drilling:
10.1.2 Drilling and Completion cost
A horizontal well can better exploit the shale in case of the presence of a vertical natural fracture
system. The Marcellus Shale is heavily jointed by cross cutting vertical natural fractures. So, a
vertical drilling would be expected to intersect not more than two fractures at a given location.
The average cost for making a horizontal well is 3.5 million ~ 4.0 million. This single well cost
includes fracturing services, rigs leasing cost which is around $22,000 per day. Also, this cost
includes pad construction, gas pipelines and local hiring. It should be noted at this point that this

75
cost does not contain the cost of leasing land in Bradford County Table 13.( Davidson,
John.2009)
Completing a well is a very expensive process. This cost is different from one company to
another. Generally, a vertical well in Marcellus costs around $810,000, whereas a horizontal one
costs approximately 1.8 million dollars.
According to Range Resources, who has performed a lot of drilling operation in PA. The average
cost of making horizontal wells in 10 years in Bradford County is $4.0 million Table 14.
Water management cost
Fresh Water source
SRBC limits water withdrawal from surface water, groundwater, or a combination of the two to
100,000 gpd/30‐day average (3,000,000 gallons). Any further water withdrawal beyond this limit
requires permission from SRBC. Each application has a fee associated with it. It can be derived
from the Fee Resolution 98‐19 from SRBC website and is to be submitted at the application
submission time. This fee must be paid in advance and is a non‐refundable fee (John A.
Veil,2010).To avoid such expense and to insure adequate and dependable supply of water to
support well drilling and well stimulation activities, we consider municipal water supply as the
fresh water source, the cost can vary greatly from one municipality to another. The current rates
quoted in Bradford county range from $5 to $14 per 1000 gallons, but it can be considered
negligible in comparison to the cost of trucking. On the other hand, our self-designed mobile
forward osmosis filtration system is able to recycle waste water into a high quality completion
fluid for use in fracture jobs. On each well, over 80% of the waste water can be recycled to
provide approximately 25% of the water required for hydraulic fracturing. As a result, the fresh
water consumption cost, on each well, can be reduced from $35,000 to $26000.
10.1.3 Wastewater Treatment
10.2 Conventional methods and challenges
Drillers are taking their wastewater to municipal wastewater treatment plants; however because
of the high level of dissolved solids (heavy metals and salt) those plants cannot treat the
wastewater properly, since they do not have the adequate industrial wastewater treatment
facilities. After a test, resulted higher‐than‐expected level of total dissolved solid in the

76
Monongahela, the DEP warned municipal sewage plants to get state approval before accepting
gas well wastewater. Basically, wastewater needs to be treated at specialized wastewater
treatment plants, which can take heavy metal and salt out of wastewater. Unfortunately not many
(less than 10) of these plants exist in the Pennsylvania. This shortage in wastewater facility
treatment plant has created a big challenge to drillers and authorities. On the other hand, the high
cost of trucking and treatment also bring out another problem, usually the trucking cost ranges
from $1 up to $10 per barrel and the average disposal cost quoted from four treatment plants is
around $0.05 per gallon( Table 15).
10.3 Recycle and reuse the wastewater onsite
Based on the problems and limits mentioned above, this project is interested in finding water to
use in fracture jobs and in managing the subsequent flowback and produced water from those
wells in ways that minimize costs and environmental impacts. Our suggested method to
accomplish this goal is to establishing a mobile onsite wastewater filtration system, using
forward osmosis (FO) technology (Figure 87). Using FO system to recycle drilling waste into
completion fluid not only reduces a significant portion of the need for additional fresh water, but
also greatly reduces the amount of heavy truck traffic required to move the waste and source
water in and out of the well-site, respectively. This portable system is able to provide highest
water quality: rejects 100% of virus, bacteria, solids, >90% of undesirable solutes including iron,
calcium, metals, barium. Furthermore, the system is energy-saving, driven by alternative energy
– osmotic gradient, to reduce the electricity usage. Commercial scale units are trailer mounted
systems capable of recycling up to 4 barrels per minute; 168 gallons per minute - 242,000
gallons per day. (McGraw-Hill, 2010)
10.4 Design Economic Analysis
10.4.1 The Cost of design and operating FO system
An initial cost estimate for this application was developed to provide the most meaningful
estimate, using the Water Treatment Estimation Routine (WaTER) developed by the United
States Department of the Interior, Bureau of Reclamation. (EPA-600/2-09-1626, 2009.)

77
As mentioned above, Commercial scale units are trailer mounted systems capable of recycling up
to 4 barrels per minute; 168 gallons per minute - 242,000 gallons per day. The portable FO
system only contains 280 cylinder shaped membrane elements placed in 6 pressure vessels at a
capital cost of about $50,000.which reduces physical space requirements but maintains large
membrane surface area up to 4000m2.(Figure 88)
The annual operating cost of the FO system would be about $0.60/kgal of produced water. This
relatively high cost results from the low value assumed for flux across the membrane. If
guarantee a constant driving force across the membrane, the FO flux may increase 70%, the unit
water costs will drop by 36% to about only $0.38/kgal. It is, therefore, economically attractive
comparing to the cost of trucking and disposal that discussed previously.
10.5 Total Cost Comparison
The final step of the cost evaluation for this study is to integrate the cost of every aspect, in order
to get a total cost estimate. The final calculation includes the cost of exploration, administration,
royalty, lease, infrastructure, drilling, completion, hydraulic fracture services, pad construction,
gas pipelines and local hiring. It shows that, using the forward osmosis technology, the self
designed mobile wastewater reclamation system can significantly reduce the cost of water
management up to $1 million. Therefore the total cost is reduced to around $5.33 million for a
single well per year, instead of $ 6.41 million traditionally. (EMERALDSURF,2008)

78
Chapter 11: Environmental Impact of Forward Osmosis Technology
The extensive use of the forward osmosis technology to reclaim drilling and fracturing waste
water would have some environmental impact as well. But this is minimal and less impacting
than other known methods, considering the fact that the energy required to run the system is
produced by the system. If the reserve waste water tank contains 74,000 bbls (3.1 mmbbls), and
the forward osmosis unit reclaims 90% of the waste water, then 66,600 bbls of waste water will
be reclaimed and 8,000 bbls will be left for recirculation. To reclaim this 66,600 bbls of waste
water, the forward osmosis system will use approximately 6000 bbls of 36% NH4CO3, resulting
in a final produced volume of approximately 72,600 bbls.
Widespread usage of forward osmosis technology to reclaim drilling and fracturing waste water
in the Marcellus Shale would save about three-quarters of a billion gallons of fresh water per
year. Aside this benefit, the forward osmosis model also eliminates 66,600 bbls of waste water
per horizontal well of trucking related road damage and emissions due to reserve pit waste water
haul off represents a significant reduction in the carbon footprint of the industry. Approximately
175 truck loads can be eliminate per reserve pit from conventional practice. An average of 4
mpg for a typical 18-wheeler and a 100 mile average load distance per truck represents
approximately 25 gallons of fuel emissions eliminated per load, or 4,375 gallons of diesel
emissions eliminated per 66,600 bbls of waste water reclaimed. Based on the assumptions
above, widespread usage of FO technology to reclaim drilling and fracturing waste could save
approximately 6.2 million gallons of diesel emissions each year. Considering the fact that there
are about 25 known shale basins in the United States where the forward osmosis technology
alongside the power generation can be employed. Conversely, the forward osmosis technology is
not limited to shale development but is applicable in conventional oil and gas plays also.

79
Chapter 12 Regulations:
12.1 The Pennsylvania’s Oil and Gas Act, 1984 (Act 223), Title 58. Sec. 601.101
This tates the authority of the Department of Environmental Resources in protecting land
owners, regulate the drilling and operation of oil and gas wells, for gas storage reservoirs, for
various reporting requirements, including certain requirements as it pertains to the operation of
coal mines, for well permits, for well registration, for distance requirements, for well casing
requirements, for safety device requirements, for storage reservoir obligations, for well bonding
requirements, for a Well Plugging Restricted Revenue Account to enforce oil and gas well
plugging requirements, for the creation of an Oil and Gas Technical Advisory Board, for oil and
gas well inspections, for enforcement and for penalties. While Sec. 601.102 clearly states the
following;
Permit the optimal development of the oil and gas resources of Pennsylvania consistent with the protection of the health, safety, environment and property of the citizens of the Commonwealth.
Protect the safety of personnel and facilities employed in the exploration, development, storage and production of natural gas or oil or the mining of coal.
Protect the safety and property rights of persons residing in areas where such exploration, development, storage or production occurs.
Protect the natural resources, environmental rights and values secured by the Pennsylvania Constitution.
12.2 The Clean Streams Law P.L 1987, Act 394 of 1937, as amended:
The purpose of the aforementioned Act is to “conserve and improve the purity of the waters of
the Commonwealth for the protection of public health, animal and aquatic life, and for industrial
consumption, and recreation; empowering and directing the creation of indebtedness or the
issuing of non-debt revenue bonds by political subdivisions to provide works to abate pollution;
providing protection of water supply and water quality; providing for the jurisdiction of courts in
the enforcement thereof; providing additional remedies for abating pollution of waters; imposing
certain penalties; repealing certain acts; regulating discharges of sewage and industrial wastes;
regulating the operation of mines and regulating the impact of mining upon water quality, supply
and quantity; placing responsibilities upon landowners and land occupiers and to maintain
primary jurisdiction over surface coal mining in Pennsylvania”.
Section 4 emphasized on the Declaration of Policy, which are as follows;

80
Clean, unpolluted streams are absolutely essential if Pennsylvania is to attract new manufacturing industries and to develop Pennsylvania's full share of the tourist industry;
Clean, unpolluted water is absolutely essential if Pennsylvanians are to have adequate out of door recreational facilities in the decades ahead;
It is the objective of the Clean Streams Law not only to prevent further pollution of the waters of the Commonwealth, but also to reclaim and restore to a clean, unpolluted condition every stream in Pennsylvania that is presently polluted;
The prevention and elimination of water pollution is recognized as being directly related to the economic future of the Commonwealth; and
The achievement of the objective herein set forth requires a comprehensive program of watershed management and control.

81
Chapter 13: Conclusion
The advent of shale gas development in the quest of meeting the world’s energy
demands, did not come only with benefits but also some challenges. The natural low
permeability shale must be fractured to guarantee higher productivity and the fracturing
process involves the use of millions of gallons of water that must be recovered as flow back or
produced waste water. Public and regulatory pressure is demanding that operators in the oil and
gas industry improve water management practices. Exploring several results of laboratory and
field testing from early commercial jobs indicate that, flexible, portable and scalable Forward
Osmosis units are applicable to resourcefully and efficiently reclaim water-based waste for
valuable reuse as a high quality completion fluid. In addition to reducing the required quantity
of fresh water drawdown and reducing the amount of waste water generated in the
development process, the results confirms that forward osmosis can significantly lessen the
carbon footprint of exploration and production in the oil and gas industry. Waste water
reclamation represents one piece of the overall water management puzzle. Additional
technologies and applications can further enhance the oil and gas industry’s overall impact on
fresh water resource conservation.

82
Chapter 14 RECOMMENDATIONS
Forward osmosis is a simple and spontaneous process that was recently engineered and
adapted to various water treatment applications mostly in industrial water management. For the
purpose of this design project, it was successfully established that forward osmosis can be
coupled with power generation processes to simultaneously recover purified water from a
broad range of impaired waters, and to provide power from the waste water- draw solution
contact, which lowers the energy required for the total project economics.
Future work should include proper flow modeling, testing the process at a larger scale with
the aim of generating energy from other sources besides waste water such as sea water, run off
and industrial waste. The system designed in this project can be easily used for several kinds of
water reclamation and energy production.
It is recommended that future design and development of the forward osmosis blue energy
integrated system for waste water treatment should consider improved material use and better
energy generation methodologies from the chemical potential energy between waste water and
an improved draw solution. Additional improvement on the selected membrane would be
helpful in enhancing the efficiency of the integrated process. Investments into the development
of forward osmosis membranes with higher solute rejection and higher water flux are highly
recommended.
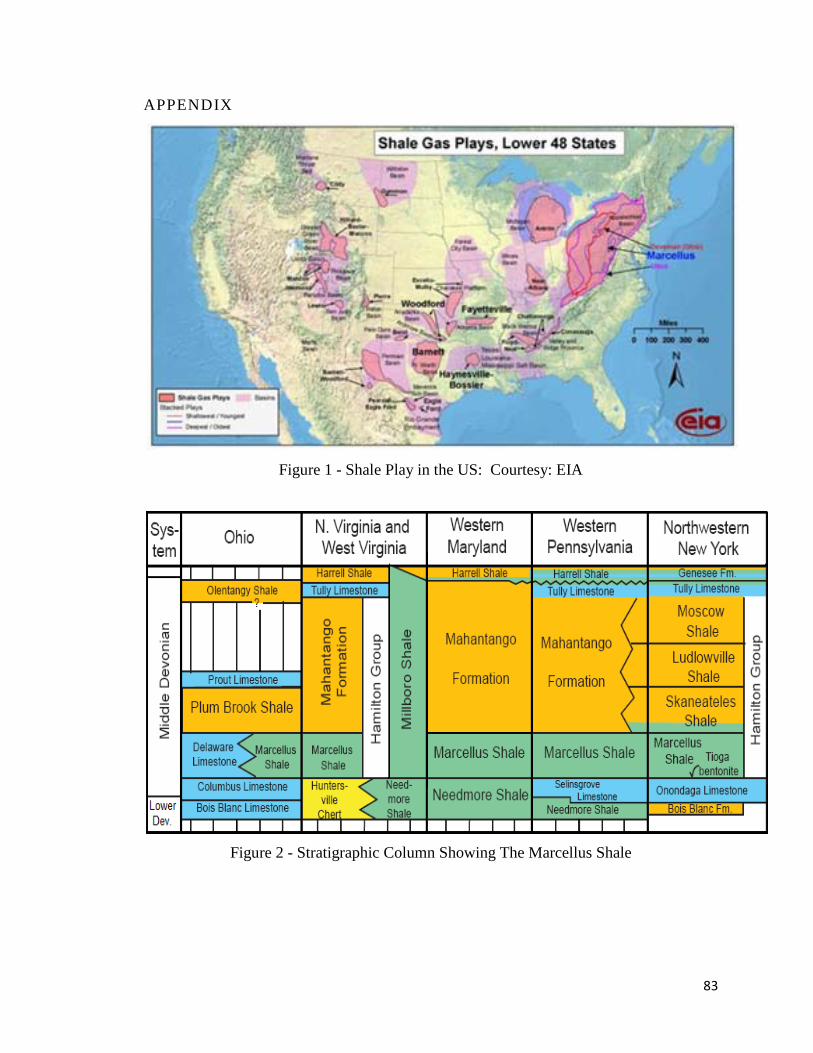
83
APPENDIX
Figure 1 - Shale Play in the US: Courtesy: EIA
Figure 2 - Stratigraphic Column Showing The Marcellus Shale

84
Figure 3 - Drilling by a public water reservoir Beaver Run Reservoir, (marcellus-shale.us)
Figure 4 - Breakdown of Produced Water Chemical Constituents.
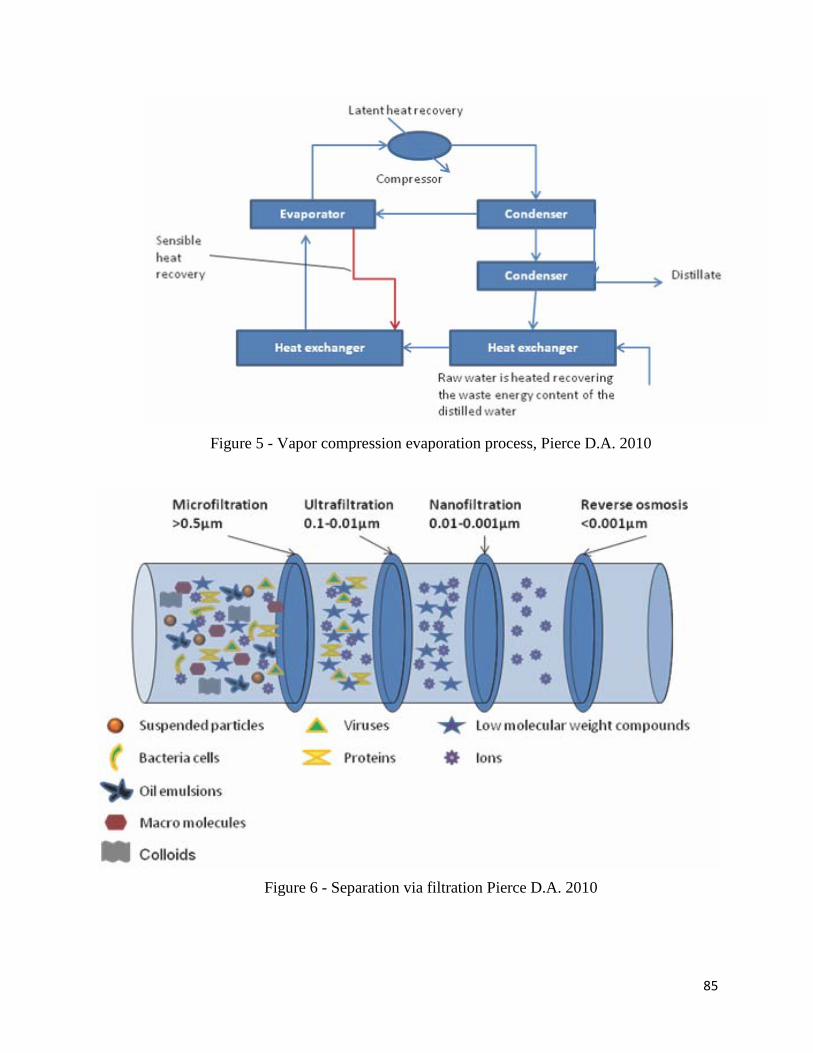
85
Figure 5 - Vapor compression evaporation process, Pierce D.A. 2010
Figure 6 - Separation via filtration Pierce D.A. 2010

86
Figure 7: Volumetric Composition of a Shale Gas Fracture Fluid (Source: J. Daniel, Brian Bohm,
and Davd Cornue, 2009)
Firgure 8. Representation of injected fracturing fluid being trapped near the proppant pack (Penny G.S., 2005)

87
Figure 9. Fluid Recover Data for Case Studies
Figure 10. Slickwater bed load proppant transport(N. Kostenuk, 2010)

88
Figure 11. Slickwater with proppant transportation modifier (N. Kostenuk, 2010).
Figure 12. Comparison of Proppant Conductivity and Permeability (N. Kostenuk, 2010).
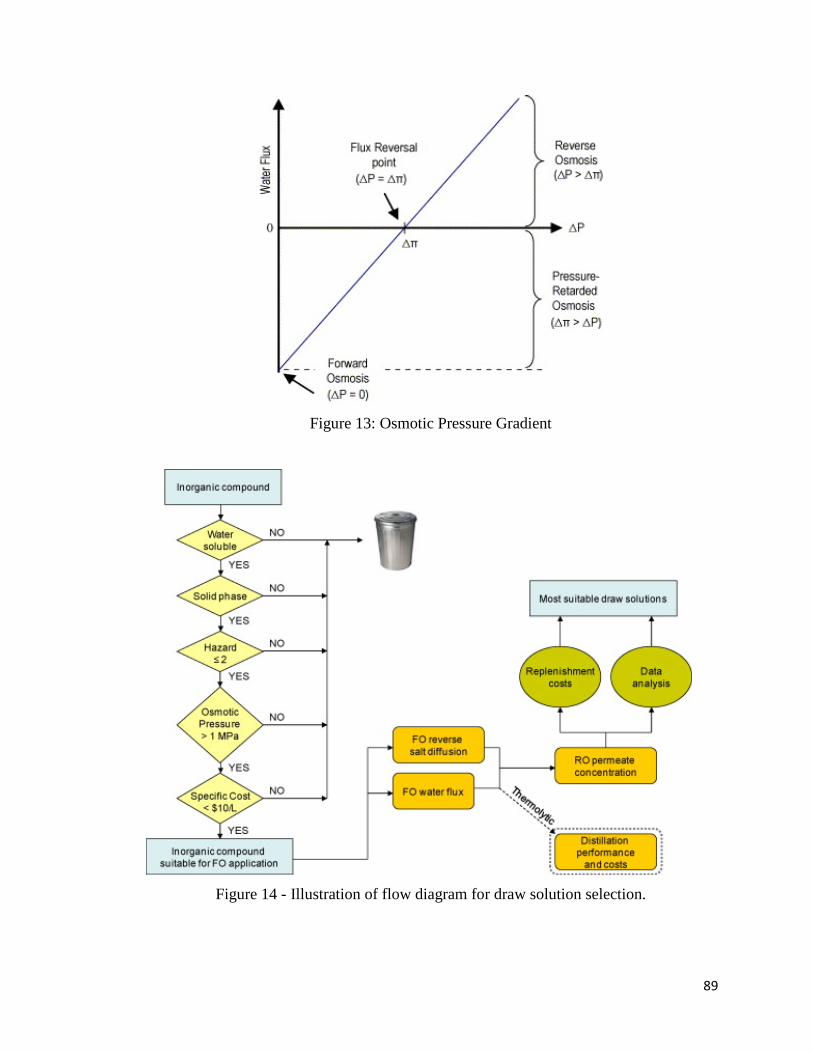
89
Figure 13: Osmotic Pressure Gradient
Figure 14 - Illustration of flow diagram for draw solution selection.

90
Figure 15 - Osmotic Pressure with NH4HCO3 as Draw Solution (McGinnis, 2007)
Figure 16 - Box Diagram of Experimental Forward Osmosis Design. (McClutcheon 2006)

91
Figure 17. Shows SEM Photograms of Two Hollow Fiber Forward Osmosis Membranes Developed by Wong et. Al. 2010
Figure 18. Morphology of PES FO hollow fiber substrates. (a) #A cross-section at 45×, (b) #A
enlarged at 200×, (c) #B cross-section at 45×, and (d) #B enlarged at 200×.[Wong,2010]

92
Figure 19. Cross-section morphologies of FO membranes. (a) #A-FO hollow fiber at 5000×; (b) #B-FO hollow fiber at 5000×; (c) Cartridge-type HIT flat sheet at 300×; (d) Pouch-type HIT flat sheet at 300×.(Wong,2010)

93
Figure 21. Cross-section of the implanted DUROS® System. (Ng,2006)
Figure 20 - Water flux data for 0.5 M NaC1 draw solution and a variety of NaC1 feed
solutions ranging from deionized water to 0.375 M. (Gray, 2006)

94
Norse mill was widely used in
Scandanavian, Irish and Scottish settlements
far from feudal centers of power, and also in
the Mediterranean. This was simple, low-tech,
small and not very efficient mill running at
approximately 1/2 hp. But the technology was
decentralized, easy to build and maintain, and
not useful for collecting grain as a taxes, and
therefore preferred by family groups and
small farmers.
Figure 22 - Simple water mill - horizonal or Norse mill
High-tech, efficient,
expensive, complex
vertical mills had a
centralizing tendency,
and were the type used
to collect “soke” taxes
for feudal lords. This
vertical is an
"overshot" mill , and
would have developed
about 3 hp.
There were over 6,000 in England at the time of Domesday survey 1088,
while at the same time, virtually no Norse mills .
Figure 23 - Complex vertical water mills

95
Figure 24 - A cross-section of a hot box. Eighteenth- and nineteenth-century scientists used the
hot box to test how much sunheat glass-covered enclosures could trap.
Figure 25: The salinity-gradient energy potential makes the 30-km long Afsluitdijk in The
Netherlands comparable to the 221 m high Hoover Dam in Nevada and Arizona (USA).

96
Figure 26 - A visual demonstration of how a solar pond is used to generate electricity
Source: www.powerfromthesun.net/Chapter6/Chapter6.htm. Author: unknown. Permission:
www.powerfromthesun.net/Chapter6/Chapter6.htm.
Figure 27 - Schematic representation of reverse electrodialysis; C is a cation exchange
membrane and A is an anion exchange membrane.

97
Figure 28 - Generation of energy by Pressure retarded osmosis method by Statkraft’s prototype
plant
Figure 29 - Representation of solvent flow in FO, PRO, and RO. Membrane orientation is indicated in each system by the thick black line representing the membrane dense layer.
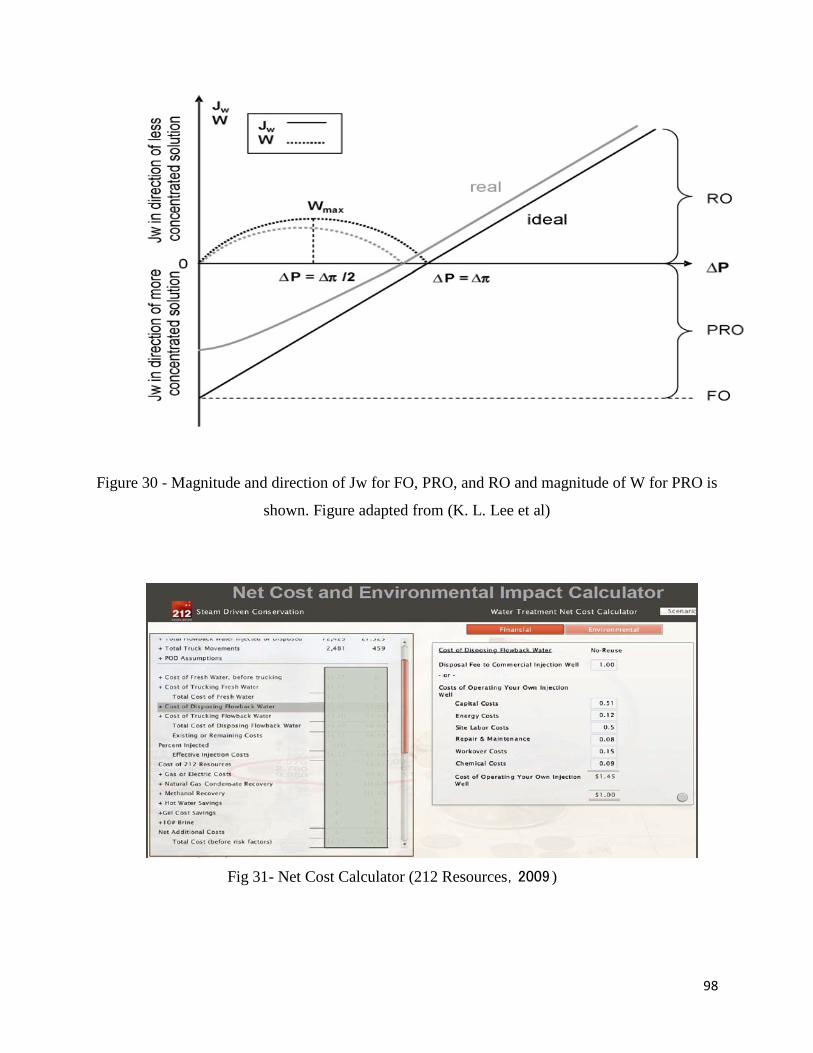
98
Figure 30 - Magnitude and direction of Jw for FO, PRO, and RO and magnitude of W for PRO is
shown. Figure adapted from (K. L. Lee et al)
Fig 31- Net Cost Calculator (212 Resources,2009 )

99
Figure 32- Number of wells drilled in the PA section of the Marcellus Shale

100
Figure 33: Slurry Volume at different stages
Figure 34: Facture Geometry
Slurry VolumeDesign Slurry Volume
Stage #
Slur
ry V
olum
e (g
al)
0
50000
100000
150000
200000
250000
300000
350000
400000
450000
500000
550000
600000
650000
700000
750000
800000
1 2 3 4 5 6 7
20000.0
101828.8 108826.7
555167.1
736060.6
20000.00.0
Current Stage 7Stage Type Shut-inDesign Rate and Fluid 0 bpm Shut-inDesign Conc and Proppant 0.00 ppg Stage Slurry Volume Pumped 1100557.3 gal Remaining 0.0 gal
No DataTotal Slurry Volume Pumped 1541061.4 gal Remaining 821.8 gal

101
Figure 35: Fracture Profile in the Marcellus Shale Bradford County
SubtitleTitle
Fracture Profile with Logs and Layers Date
8550
8600
8650
8700
8750
8800
LogsRock... Stres... Mod... Perm...
Layer Properties
Sandst...Sandst...
onond...onond...
upper ...upper ...
lower ...lower ...
8600
8650
8700
8750
8800
25 50 75 100 125 150
Concentration of Proppant in Fracture (lb/ft²)
TVD(ft)TVD(ft)
0 0.20 0.40 0.60 0.80 1.0
Proppant Concentration (lb/ft²)
8600
8650
8700
8750
8800
0
Width Profile (in)
TVD(ft)TVD(ft)

102
Figure 36: Fracture extension in the Shale formation
From the simulation of the fracture propagation and orientation, the total number of water
needed to achieve a half length of 69ft into the shale and increase the permeability by more than
100mD is 85,000 lbs.

103
Figure 37 (horizontal well)
\
Figure 38 (Gas rate vs. Time for horizontal well in 40 years)

104
Figure 39 (Cumulative gas vs. tome for horizontal well in 40 years)
Figure 40 (Pressure distribution after 40 years for one horizontal well)

105
Figure 41 (Dual horizontal well)
Figure 42 (Gas rate vs. Time for dual horizontal well in 40 years)

106
Figure 43 (Cumulative gas vs. tome for dual horizontal well in 40 years)
Figure 44 (Pressure distribution after 40 years for dual horizontal well)

107
Figure 45 (Dual horizontal well with distance)
Figure 46 (Gas rate vs. Time for dual horizontal with distance well in 40 years)

108
Figure 47 (Cumulative gas vs. tome for dual horizontal with distance well in 40 years)
Figure 48 (Pressure distribution after 40 years for dual horizontal wit distance well)
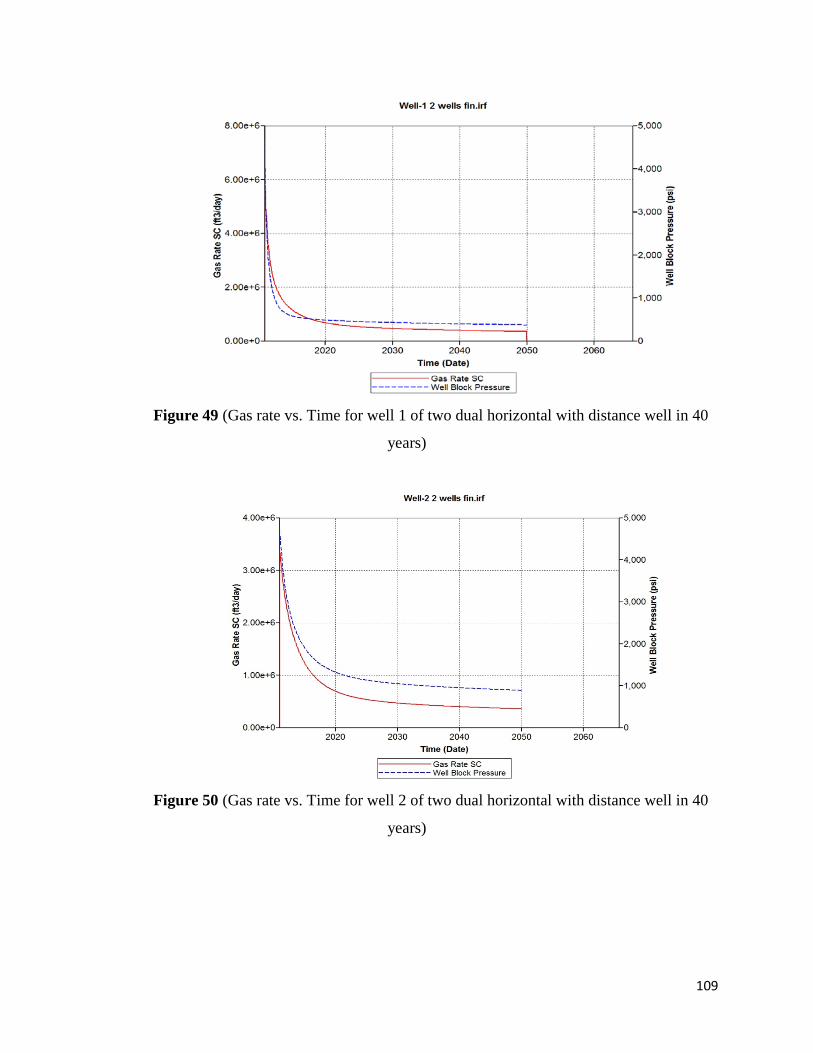
109
Figure 49 (Gas rate vs. Time for well 1 of two dual horizontal with distance well in 40
years)
Figure 50 (Gas rate vs. Time for well 2 of two dual horizontal with distance well in 40
years)

110
Figure 51 (Cumulative gas vs. tome for well 1 dual horizontal with distance well in 40 years)
Figure 52 (Cumulative gas vs. tome for well 2 dual horizontal with distance well in 40 years)

111
Figure 53 (Pressure distribution after 40 years for two dual horizontal wit distance well)
Top look for the multi-lateral well

112
Figure 54 (Multi-lateral well)
Figure 55 (Gas rate vs. Time for well 2 of multi-lateral)
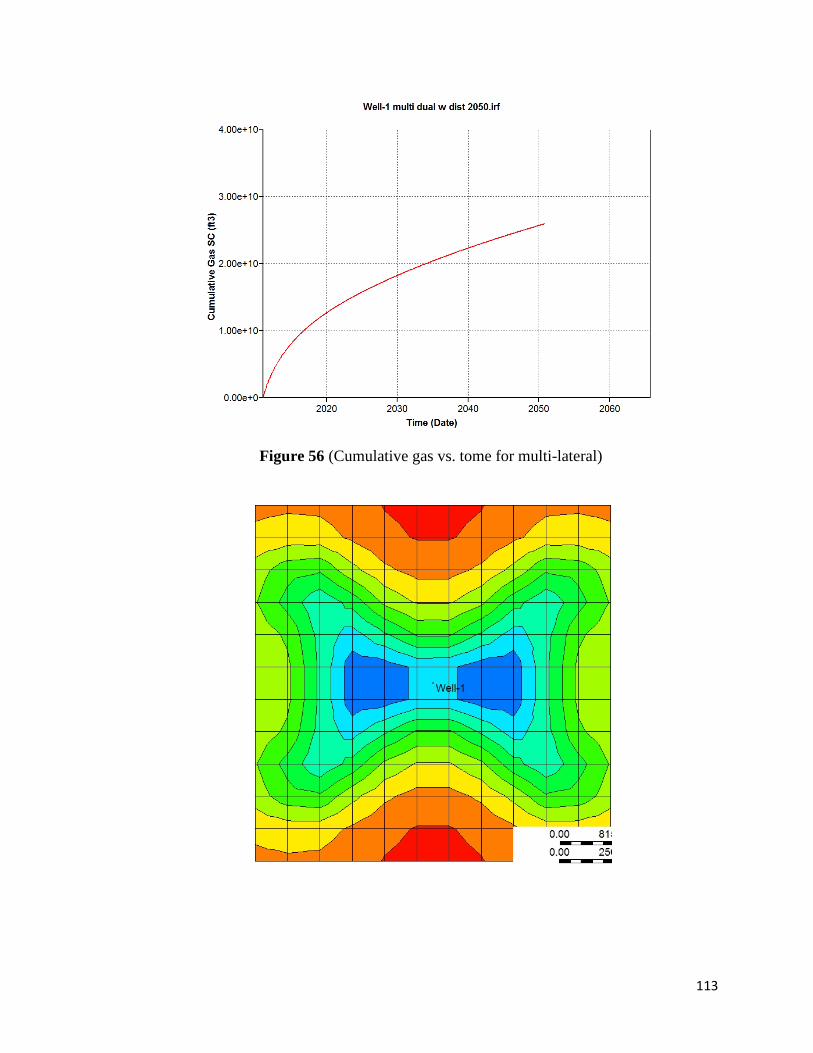
113
Figure 56 (Cumulative gas vs. tome for multi-lateral)

114
Figure 57 (The cumulative gas for all drilling techniques we have tried)
Figure 58.Fracturing activities
0
5E+09
1E+10
1.5E+10
2E+10
2.5E+10
3E+10
2005 2010 2015 2020 2025 2030 2035 2040 2045 20

115
Figure 59. The percentage of friction reduction caused by adding salt-toerlant friction reducer.
Source: SPE 125987
Figure 60. Effctiveness of 20% active DBNPA biocide against SRB

116
Figure 61. surface tension test
Figure 62. Water recovery test

117
Figure 63. CarboProp
Firgure 64. CarboLite
Figure 65. Ceramic Proppant

118
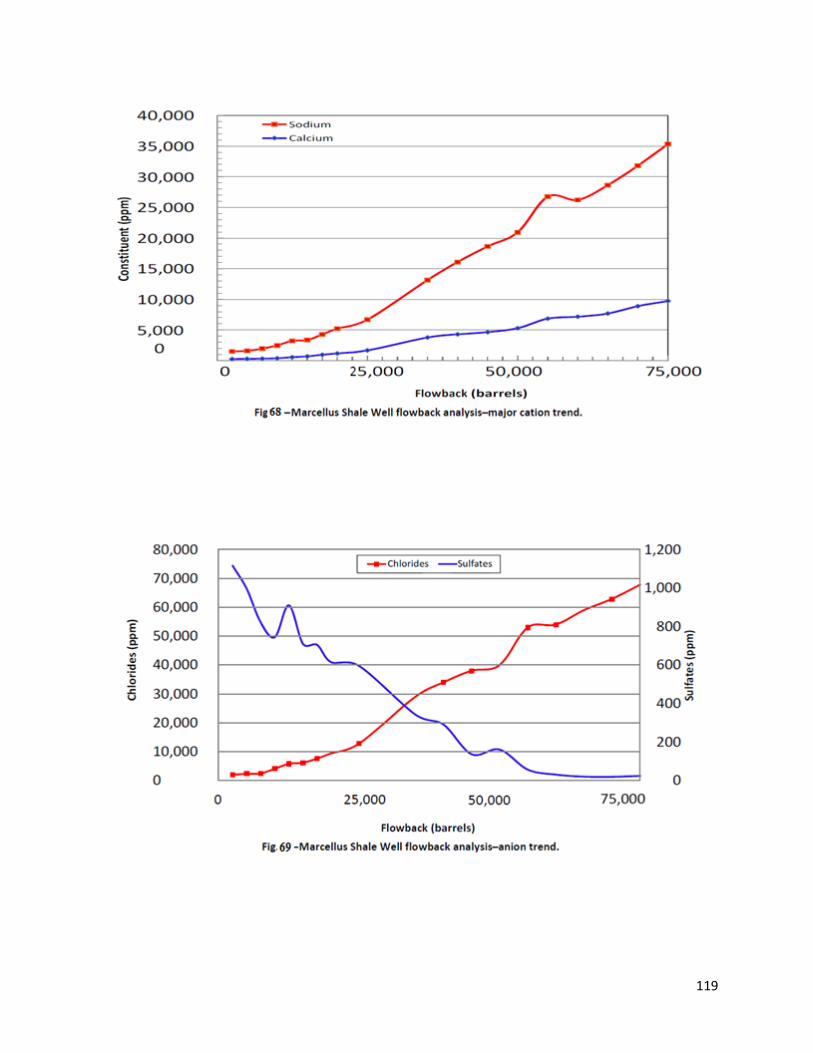
119

120

121

122
Figure 73: Schematic diagram of hydro-pneumatic tank (tankdrawing.com)
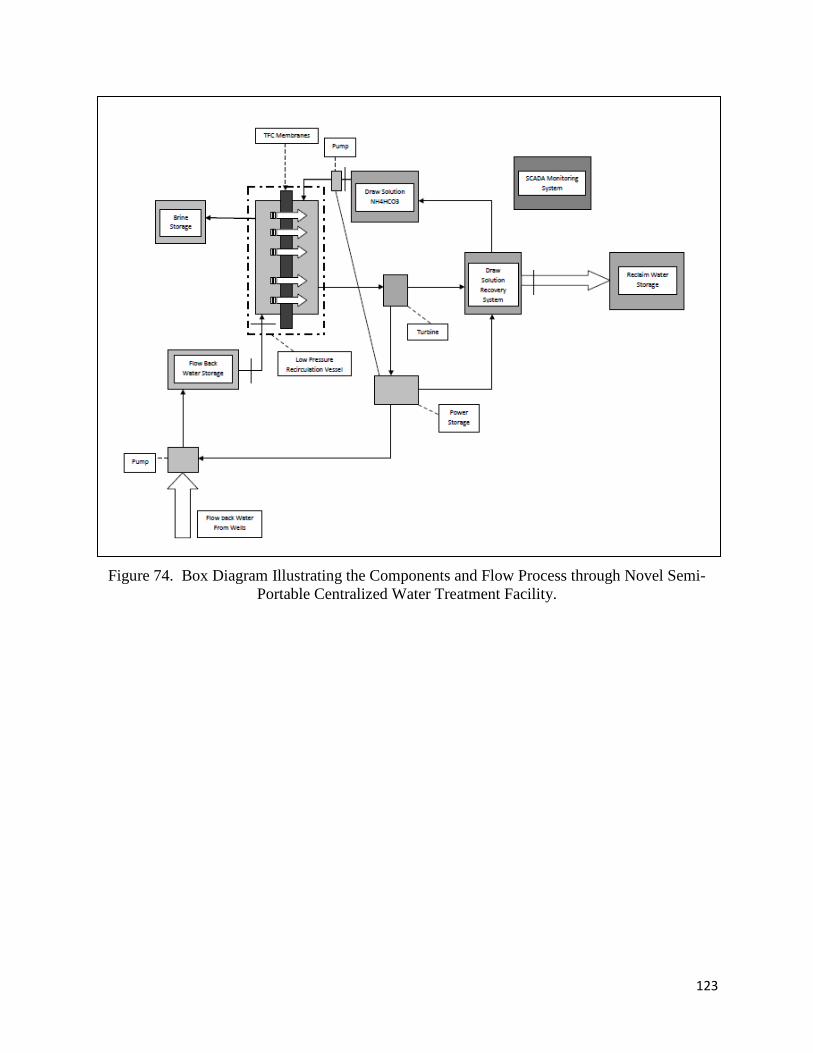
123
Figure 74. Box Diagram Illustrating the Components and Flow Process through Novel Semi-
Portable Centralized Water Treatment Facility.
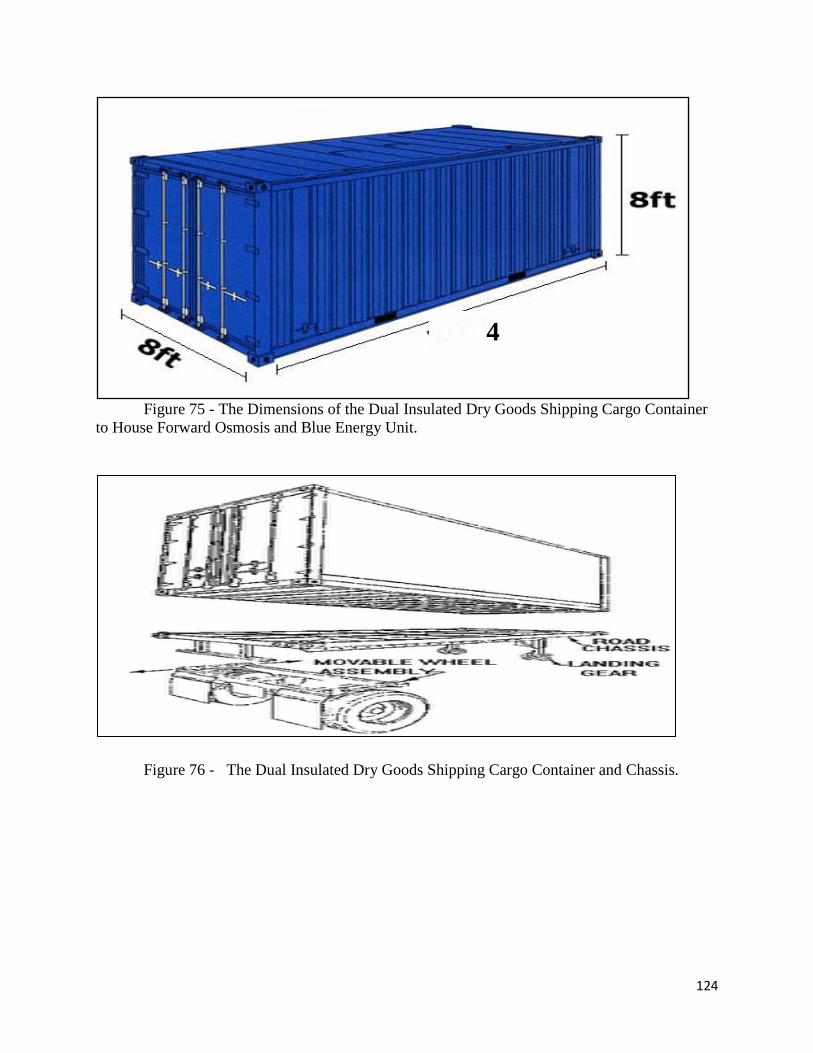
124
Figure 75 - The Dimensions of the Dual Insulated Dry Goods Shipping Cargo Container to House Forward Osmosis and Blue Energy Unit.
Figure 76 - The Dual Insulated Dry Goods Shipping Cargo Container and Chassis.
4

125
Figure 77 - 120 Gallon Excalibur ®intermediate bulk container (IBC)
Figure 78 - Control panel of the SCADA system used to maintain draw solution concentration and temperature, and record experimental data

126
Figure 79 - Schematic Drawing -Novel Semi-Portable Centralized Forward Osmosis Water Treatment Facility
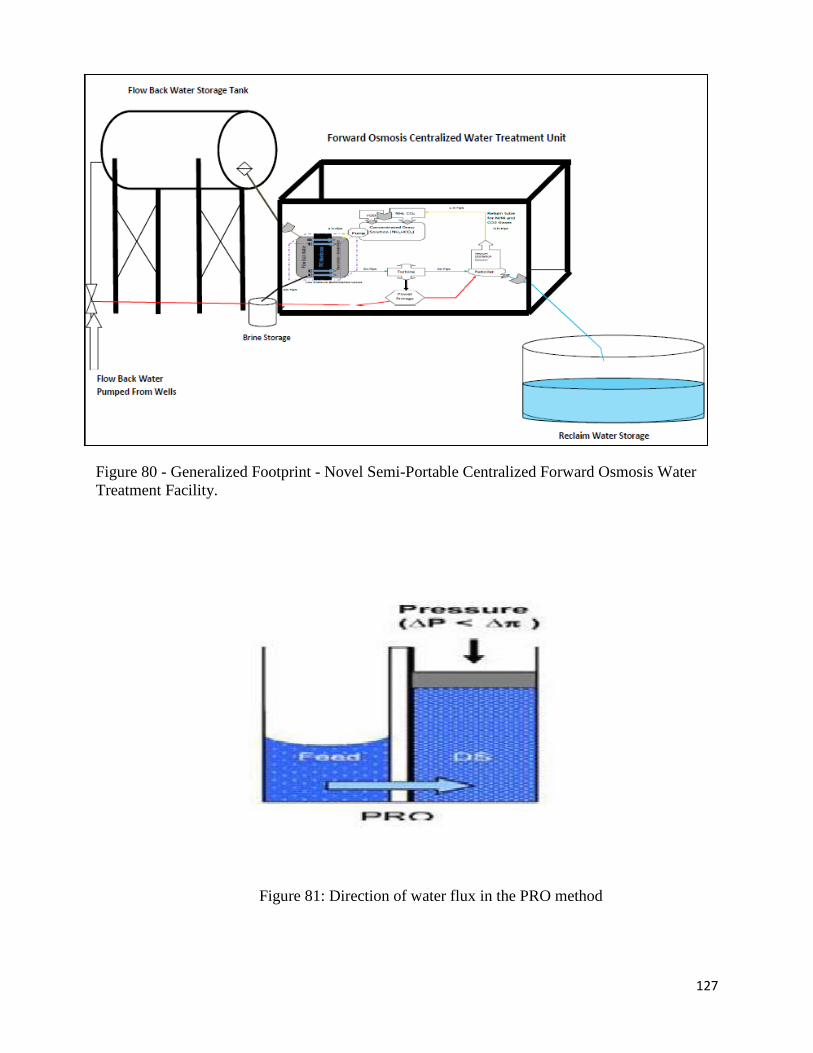
127
Figure 80 - Generalized Footprint - Novel Semi-Portable Centralized Forward Osmosis Water Treatment Facility.
Figure 81: Direction of water flux in the PRO method

128
Figure 82: Illustration of osmotic driving forces profiles across a semi-permeable membrane, and
the effects of the ICP and ECP
Figure 83: The forward osmosis (FO) process

129
Figure 84: Illustration of change in volume in FO
Figure 85: SEM micrographs of a TFC-PRO membrane: (A) cross section with a fingerlike macrovoid structure (B) magnified view of thepolyamide active layer surface, and (C) magnified view of the skin layer at the top of the porous support with dense, spongelike morphology.
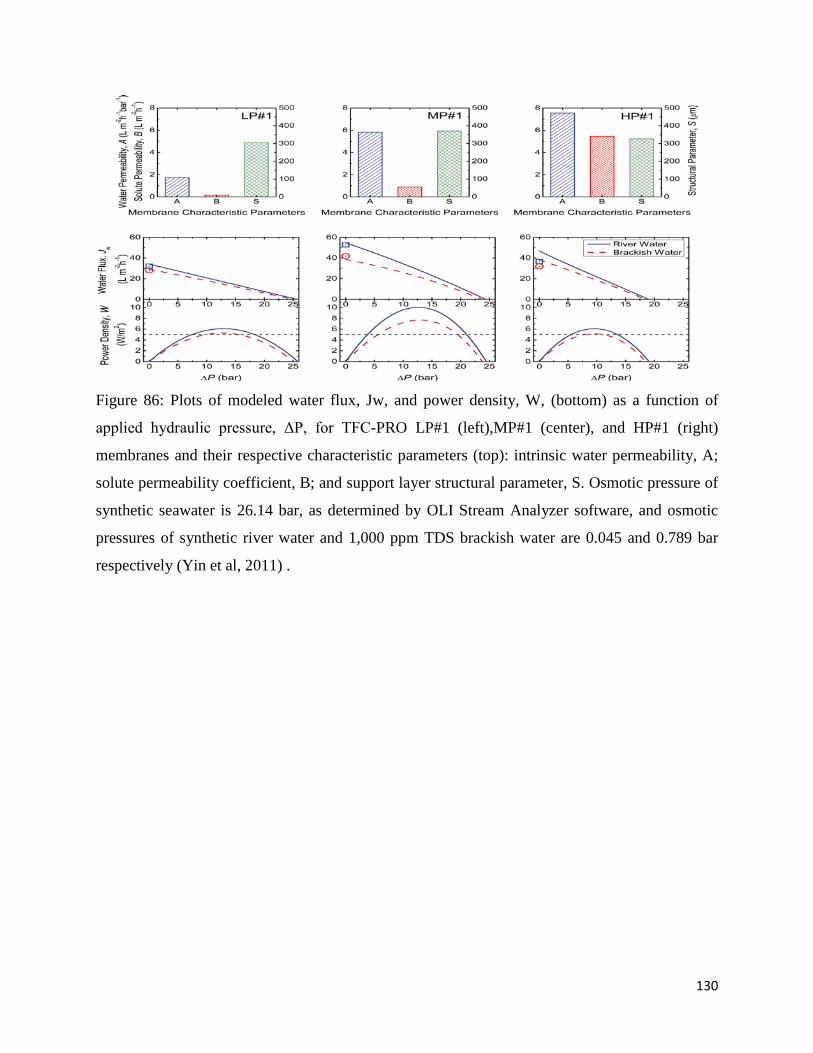
130
Figure 86: Plots of modeled water flux, Jw, and power density, W, (bottom) as a function of
applied hydraulic pressure, ΔP, for TFC-PRO LP#1 (left),MP#1 (center), and HP#1 (right)
membranes and their respective characteristic parameters (top): intrinsic water permeability, A;
solute permeability coefficient, B; and support layer structural parameter, S. Osmotic pressure of
synthetic seawater is 26.14 bar, as determined by OLI Stream Analyzer software, and osmotic
pressures of synthetic river water and 1,000 ppm TDS brackish water are 0.045 and 0.789 bar
respectively (Yin et al, 2011) .

131
Figure - 87 Mobile FO onsite system (EMERALDSURF,2008)
Figure 88 - Trailer mounted FO filtration system (EMERALDSURF,2008)

132
Table 1 - Aqueous solution osmotic pressure (πDS), concentration (CDS), solubility, and
diffusion coefficient (D). [Achilli 2010]
Table 3. Summary of experimental flux data, corresponding bulk osmotic pressures (Tt), and calculated K values for the experiments with NaC1 depicted in Figs 1, 3, and 4. Note that"AL" refers to the membrane active layer while "SL" refers to the membrane support layer. (Wanling 2006)

133
Table 4. Effectiveness of Forward Osmosis on Various Landfill Leachate Contaminants. (Cath,
2007)

134
Table 5. Drilling and completion costs (J., Pletcher,2009)
Table 6: Seven-fracture economics for $3 and $6 per Mcf gas pricing (J., Pletcher,2009)

135
Table 7: Fracture Design Treatment Schedule
Design clean volume (bbls) 33095.2 Design proppant pumped (klbs) 3450.0
Design slurry volume (bbls) 36711.5

136
Table 7b (The reservoir properties)
DEPTH 8620 Ft
Thickness 180 Ft
I 5280 Ft
J 5280 Ft
Permeability (horizontal) .01 md
Permeability(vertical) .001
Porosity 5 %
Temperature 210 F
Initial Pressure 4000 psi
Rock compressibility .000001
Table 7c. Fracturing fluid additives, main compounds and common uses
Additive Type Main Compound Common Usue of Main Compund
Acid Hydrochloric acid or muriatic
acid Swimming pool chemical and cleaner
Biocide Glutaraldehyde Cold sterilant in health care industry
Breaker Sodium Chloride Food preservative
Corrosion
inhibitor N,n‐dimethyl formamide
Used as a crystallization medium in
Pharmaceutical Industry
Friction
Reducer Petroleum distillate
Cosmetics including hair, make‐up, nail
and skin
products
Gel Guar gum or hydroxyethyl
cellulose
Thickener used in cosmetics, sauces and
salad
dressings.

137
Table 7d. Clay and mineralogy of three shales

138
Table 7e. Final additive concentration
Type Concentration (%) HPG 0.05
Friction reducers 0.06 Surfactant 0.085
Breaker 0.009 Clay stabilizers 0.005 Scale inhibitor 0.013 Iron Controller 0.005
Biocides 0.03 Corrosion Inhibitors 0.001

139

140
County Name Lease Cost
($/acre)
Bradford
Fayette
Susquehanna
Greene
Clearfield
1500
1150
2500
3000
2500
Table.13 Lease cost for the counties in 2010
141
REFERENCES
Achilli, A., Cath, T. Y., & Childress, A. E. (2009). Power generation with pressure retarded
osmosis: An experimental and theoretical investigation, 343 (2009) 42–52. Journal of Membrane
Science , 343, 42-52.
Achilli, A.; Childress, A. E. Pressure retarded osmosis: From the vision of Sidney Loeb to the
first prototype installation—Review Desalination 2010, 261 (3) 205– 211
Adam T bourgoyne. Martin E. chenveret and Keith K. millheim, Applied Drilling Engineering.
Adham S., Oppenheimer J., Liu L., Kumar M. Dewatering reverse osmosis concentrate from
water reuse using forward osmosis, Water Reuse Foundation Research Report, Product No. 05-
009-01, 2007, pp. 1–52.
Administration, National Oceanic and Atmospheric. Annual Summary. 2005.
Agrawal,: “A Technical and Economic Study of Completion Techniques in Five Emerging US
Gas Shales” paper SPE 135396-MS, 2010
Andrea Achilli, Tzahi Y. Cath, Amy E. Childress, Selection of inorganic-based draw solutions
for forward osmosis applications, Journal of Membrane Science, Volume 364, Issues 1-2, 15
November 2010, Pages 233-241
Ang, W. S.; Elimelech, M.Protein (BSA) fouling of reverse osmosis membranes: Implications
for wastewater reclamation J. Membr. Sci. 2007, 296 ( 1–2) 83– 92
Appalachian Shale Water Conservation and Management Committee. 2008. Spreadsheet Survey
of 13 ASWCMC Companies, August 2009.
Arnold, K., Stewart, M. Surface Production Operations: Design of Gas Handling Systems and
Facilities 2 ed, Vol 2. s.l. : Gulf Publishing Compagny, 1999.
Arthur, J. Daniel, Bohm, Brian and Layne, Mark. Hydraulic Fracturing Considerations for
Natural Gas Wells of the Marcellus Shale. Cincinnati : ALL Consulting, 2008.
Arthur, J. Daniel, et al. Evaluating the Environemtal Implications of Hydraulic Fracturing in
Shale Gas Reservoirs. s.l. : ALL Consulting , 2008.
Arthur, J. Daniel. West Virginia Surface Owners' Rights Organization. [Online] Sep. 21th,2008.
http://www.wvgs.wvnet.edu/www/datastat/GWPC_092008_Marcellus_Frac_Arthur_et_al.pdf.
Baker, R. W. Membrane Technology and Applications, 2nd ed.; J. Wiley: New York, 2004; p x,
538

142
Bamaga O.A., Yokochi A., Zabara B., Babaqi A.S. Hybrid FO/RO desalination system:
Preliminary assessment of osmotic energy recovery and designs of new FO membrane module
configurations, Desalination, Volume 268, Issues 1-3, 1 March 2011, Pages 163-169.
Barnes, Dustin. North East Mud Services Company L.L.C. [Online] 2009.
http://www.nemud.com/.
Baoxia Mi, Menachem Elimelech, Chemical and physical aspects of organic fouling of forward
osmosis membranes, Journal of Membrane Science, Volume 320, Issues 1-2, 15 July 2008,
Pages 292-302
Bill Grieser and Jim Bray, Halliburton “Identification of Production Potential in Unconventional
Reservoirs “SPE 106623-MS 2007
Boysen, J.E., Boysen, D., Larson, T., and J. Sorenson, “Topical Report: Field Application of the
Freeze/Thaw Evaporation (FTE) Process for the Treatment of natural Gas Produced Water in
Wyoming,” Available from the Gas Research Institute, Des Plaines, IL GRI Report Number
GRI-02/0221 (2002).
Bullin, Keith. Processing Possibilities for Shale Gas Plays. s.l. : Bryan Research and
Engineering, 2008.
Cabot Oil & Gas. [Online] Cabot Oil & Gas Corporation, Dec. 8th, 2008.
http://phx.corporateir.net/phoenix.zhtml?c=116492&p=irol‐newsArticle&ID=123
3344&highlight
CARBO Ceramics. 2010. “Why ceramic proppant?” http://www.carboceramics.com/
Cardona, E.; Piacentino, A.; Marchese, F.; Energy saving in two-stage reverse osmosis systems
coupled with ultrafiltration processes, Desalination, Volume 184, Issues 1-3, Desalination and
the Environment, 1 November 2005, Pages 125-137
Cath, T. Y.; Childress, A. E.; Elimelech, M.Forward osmosis: Principles, applications, and recent
developments J. Membr. Sci. 2006, 281 ( 1–2) 70– 87
Cipolla, C., Warpinski, N., Mayerhofer, M., Lolan, E. and Vincent, M. “The relationship
Between Fracture Comlexity, Reservoir Properties, and Fracture Treatment Design,” SPE
115769, 2009.
Charpentier, R.R. Estimates of Unconventional Natural Gas Resources Resources of the
Devonian Shales of the Appalachian Basin. s.l. : US GEOLOGICAL SURVEY BULLETIN
1909 , 1993.

143
Chung T.S., et al., Forward osmosis processes: Yesterday, today and tomorrow, Desalination
(2010), doi:10.1016/j.desal.2010.12.019
Cipolla, L. Craig. “Modeling Production and Evaluating Fracture Performance in
Unconventional Gas Reservoir,” SPE 118536
Claudel and Boulamri L., A new model of gas solid kinetics — the case of ammonium carbamate
formation and decomposition. Thermochimica Acta 126 (1988), pp. 129–148.
CONSOL Energy. [Online] CNX Gas Corporation, 2008.
http://www.consolenergy.com/AboutUs/QuickFacts.aspx.
Dale, A. Pierce,: “Water Recycling Helps with Sustainability” paper SPE 134137-MS, 2010
Daniel J., Bohm Brian, and Cornue Davd Cornue. “Enviromental Considerations of Modern
Shale Gas Development,” SPE 122931, 2009.
Daniel J., Bohm Brian, and Bobbi Jo Coughlin. “Evaluating Implications of Hydraulic Fracturing
in Shale Gas Reservoirs.” SPE 121038, 2009.
Davidson, John. keystoneedge. [Online] Cabot Oil & Gas Corporation, Dec. 11th, 2008.
http://www.keystoneedge.com/innovationnews/cabotoilgas1211.aspx.
Developments”. Journal of Membrane Science, Volume 281, Issues 1-2, Pages 70-87
Doran, G. and Leong, L.Y.C., "Developing a Cost Effective Solution for Produced Water and
Creating a 'New' Water Resource," DOE Report DOE/MT/95008-4 (2000).
Durham, L.S. "Appalachian Basin’s Marcellus – the new target". s.l. : American Association of
Petroleum Geologists, March, 2008.
“Emission Facts - Average Carbon Dioxide Emissions Resulting from Gasoline and Diesel
Fuel”. (February 2005), U.S. Environmental
Eric Maidla, Marc Haci, and Daniel Wright, Slider LLC “Case History Summary: Horizontal
Drilling Performance Improvement Due to Torque Rocking on 800 Horizontal Land Wells
Drilled for Unconventional Gas Resources “SPE 133647-MS 2010
Evans, A.; Strezov, V.; Evans, T. J.Assessment of sustainability indicators for renewable energy
technologies Renewable Sustainable Energy Rev. 2009, 13 ( 5) 1082–1088
Fresh Water / Salt Water‖ by Geotechnical, Rock, Water Resource Library.
http://www.grow.arizona.edu/water/freshsaltwater.shtml
Gaudlip A.W. and Paugh L.O. “Marcellus Shale Water Management Challenges in
Pennsylvania,” SPE 119898, 2008.

144
Geehan, T. (July 2009). “Water Treatment Processes Make Strides”. E&P.
Geise, G. M.; Park, H. B.; Sagle, A. C.; Freeman, B. D.; McGrath, B. E.Water Permeability and
Water/Salt Selectivity Tradeoff in Polymers for Desalination J. Membr. Sci. 2011, 369,130– 138
Ghosh, A. K.; Hoek, E. M. V.Impacts of support membrane structure and chemistry on
polyamide–polysulfone interfacial composite membranes J. Membr. Sci. 2009, 336 ( 1–2)140–
148
Glater, J.; Zachariah, M. R.; A Mechanistic study of halogen interaction with polyamide reverse-
osmosis membranes ACS Symp. Ser. 1985, 281, 345– 358
Glater, J.; Zachariah, M. R.; Mccray, S. B.; Mccutchan, J. W.Reverse-osmosis membrane
sensitivity to ozone and halogen disinfectants Desalination 1983, 48 ( 1) 1– 16
Glew D.N., Process for liquid recovery and solution concentration, US Patent 3,216,930 (1965).
Gordon T. Gray, Jeffrey R. McCutcheon, Menachem Elimelech, Internal concentration
polarization in forward osmosis: role of membrane orientation, Desalination, Volume 197, Issues
1-3, 2 October 2006, Pages 1-8
Gray G.T., McCutcheon J.R. and Elimelech M., Internal concentration polarization in forward
osmosis: role of membrane orientation, Desalination 197 (2006), pp. 1–8
Hale A.H. and Mody F.K., * Shell Development Co” Mechanism for Wellbore Stabilization
With Lime-Based Muds” SPEIIADC 25706
Hayes, T. and A. Arthur. 2004. “Overview of Emerging Produced Water Treatment
Technologies.” Proceedings of the 11th Annual International Petroleum Environmental
Conference. October 12-15.
“Haynesville Shale Overview”. (1 March 2010). Louisiana Department of Natural Resources.
Hemant Kumar. Sustainable Development and Design of Marcellus Shale Play in Susquehanna,
PA, 2009.
Herron J.R., Beaudry E.G., Jochums C.E., Medina L.E., Apparatus for direct osmotic
concentration of fruit juices, US Patent 5,281,430 (1994). New Product Developments. Filtration
Industry Analyst, 2008 (2008) 14.
Holdich, R., Kosvintsev, S., Cumming, I., & Zhdanov, S. (2006). Pore Design and Engineering
for Filters and Membranes. Philosophical Transactions: Mathematical, Physical and Engineering
Sciences , 364 (1838), 161-174.
145
Houston, Nathan, Matt Blauch, and Dalton Weaver. “Fracture-Stimulation in the Marcellus
Shale-Lessons Learned in Fluid Selection and Execution,”
http://www.naturalgas.org/naturalgas/well_completion.asp#completion
Isaacs, I. J., & Seymour, R. (1973). The ocean as a power resource. International of
Environmental Studies , 4 (1), 201-205.
Isaacs, J. D., & Schmitt, W. R. (1980). Ocean Energy: Forms and Prospects. Science , 207
(4428), 265-273.
James R., ConocoPhillips Norge; A. Nistov, Statoil; C. Smulders, Shell Intl.; K. Walker, M-I
Swaco; T. Schei, ConocoPhillips Norway; N. LeBlond, Total Fluides; M. Sopko, Nexen; and T.
Fonneland, Norsk Hydro “Occupational Exposure Hazards Related To The Use Of Drilling
Fluids Presented With Remedial Risk Management Guidelines” SPE 108514-MS 2007 .
James R., SPE, P. Navestad, and T. Schei, Phillips Petroleum Co. Norway, T. Geddes, G.
Nelson, SPE, and D. Webster, Carless Refining & Marketing Ltd “Improving the Working
Environment and Drilling Economics Through Better Understanding of Oil Based Drilling Fluid
Chemistry” SPE/IADC 57551.
Kai Yu Wang, Tai-Shung Chung, Jian-Jun Qin, Polybenzimidazole (PBI) nanofiltration hollow
fiber membranes applied in forward osmosis process, Journal of Membrane Science, Volume
300, Issues 1-2, 15 August 2007, Pages 6-12
Kauman P. and Penny G.S. “Critical Evaluations of Additives Used in Shale Slickwater Fracs,”
SPE 119900, 2008.
Kawaguchi, T.; Tamura, H.Chlorine-resistant membrane for reverse-osmosis. 1. Correlation
between chemical structures and chlorine resistance of polyamides J. Appl. Polym.
Sci.1984, 29 ( 11) 3359– 3367
Kostenuk N. and Browne D.J. “Improved Proppant Transport System for Slickwater Shale
Fracturing,” CSUG/SPE 137818, 2010.
Kravath R.E. and Davis J.A. Desalination of seawater by direct osmosis, Desalination 16 (1975),
pp. 151–155.
Kwon, Y. N.; Leckie, J. O.Hypochlorite degradation of crosslinked polyamide membranes—II.
Changes in hydrogen bonding behavior and performance J. Membr. Sci. 2006, 282 ( 1–2)456–
464

146
Lee, Dae Sung., Herman, Jonathan D, Elsworth, Derek “A Critical Evaluation of Unconventional
Gas Recovery from the Marcellus Shale, Northeastern United States”
Lee, K., Baker, R., & Lonsdale, H. (1981). Membrane for power generation by pressure retarded
osmosis. Journal of Membrane Science , 8, 141-171.
Lind, M. L.; Ghosh, A. K.; Jawor, A.; Huang, X. F.; Hou, W.; Yang, Y.; Hoek, E. M.
V.Influence of zeolite crystal size on zeolite–polyamide thin film nanocomposite
membranes Langmuir 2009, 25 ( 17) 10139– 10145
Leob, S. (2002). Large-scale power production by pressure-retarded osmosis, using river water
and sea water passing through spiral modules. Desalination , 143 (2), 115-122.
Leob, S. (1976). Production of energy from concentrated brines by pressure retarded osmosis.
Journal of Membrane Science , 1 (1), 49-63.
Leob, S., & Norman, R. S. (1975). Osmotic Power Plants. Science , 189 (4203), 654-655.
Leob, S.; Titelman, L.; Korngold, E.; Freiman, J.Effect of porous support fabric on osmosis
through a Loeb–Sourirajan type asymmetric membrane J. Membr. Sci. 1997, 129 ( 2) 243–249
Lynn W B. Drilling companies looking for natural gas in county. [Online] 2008.
http://www.theprogressnews.com/default.asp?read=12052.
Marcellusshales. [Online] Equitable Resources, 2008.
http://www.marcellusshales.com/marcellusshalecompanies.html.
McCutcheon, Jeffrey R. & Elimelech Menachem (2006). Influence of concentrative and dilutive
internal concentration polarization on flux behavior in forward osmosis. Journal of Membrane
Science, 284(1-2), 237-247.
McCutcheon, Jeffrey R. & Elimelech Menachem (2007). Modeling water flux in forward
osmosis: implications for improved membrane design. AICHE J., 53, 1736.
McCutcheon, Jeffrey R., McGinnis R.L. & Elimelech M. (2006). Desalination by ammonia–
carbon dioxide forward osmosis: Influence of draw and feed solution concentrations on process
performance. Journal of Membrane Science, 278, 114–123.
McCutcheon, Jeffrey R.; McGinnis, R. L.; Elimelech, M.A novel ammonia–carbon dioxide
forward (direct) osmosis desalination process Desalination 2005, 174 ( 1) 1– 11
McGinnis, R. L.; McCutcheon, J. R.; Elimelech, M.A novel ammonia–carbon dioxide osmotic
heat engine for power generation J. Membr. Sci. 2007, 305 ( 1–2) 13– 19
147
McGinnis R.L. Osmotic desalination process, US Patent 6,391,205 B1 (2002).
McKelvey, S. A.; Koros, W. J.Phase separation, vitrification, and the manifestation of
macrovoids in polymeric asymmetric membranes J. Membr. Sci. 1996, 112 ( 1) 29–39
Mehta, A.; Zydney, A. L.Permeability and selectivity analysis for ultrafiltration membranesJ.
Membr. Sci. 2005, 249 ( 1–2) 245– 249
Mehta, G. D.; Loeb, S.Internal polarization in the porous substructure of a semipermeable
membrane under pressure-retarded osmosis J. Membr. Sci. 1978, 4 ( 2) 261–265
Mi, Baoxia, Elimelech, Menachem. (15 July 2008). “Chemical and Physical Aspects of Organic
Fouling of Forward Osmosis Membranes”. Journal of Membrane Science, Volume 320, Issues 1-
2, Pages 292-302.
Mi, Baoxia, Elimelech, Menachem. (15 February 2010). “Organic Fouling of Forward Osmosis
Membranes: Fouling Reversibility and Cleaning
Michael, Brownell. Gas Well Drilling and Development Marcellus Shale. New York:
Susquehanna River Basin Commission, 2008
Michael Godec,: “Economics of Unconventional Gas” OGJ Unconventional Gas Article #5,
2009
Modern Shale Gas Development in the United States: A Primer”. (April 2009). U.S. Department
of Energy, Office of Fossil Energy, National Energy Technology
Mulder, M. Basic Principles of Membrane Technology, 2nd ed.; Kluwer
Academic:Dordrecht, 1996; p 564.
Mulder, M. H. V.; Hendrikman, J. O.; Wijmans, J. G.; Smolders, C. A. ARationale for the
preparation of asymmetric pervaporation membranes J. Appl. Polym. Sci. 1985, 30 ( 7)2805–
2820
Nemeth E. Julia, Innovative system designs to optimize performance of ultra-low pressure
reverse osmosis membranes, Desalination, Volume 118, Issues 1-3, Conference Membranes in
Drinking and Industrial Water Production, 20 September 1998, Pages 63-71.
Ng H.Y., Tang W. and Wong W.S., Performance of forward (direct) osmosis process; membrane
structure and transport phenomenon, Environ. Sci. Technol. 40 (2006), pp. 2408–2413.
Niemi, H., & Palosaari, S. (1993). Calculation of permeate flux and rejection in simulation of
ultrafiltration and reverse osmosis processes. Journal of Membrane Science , 84 (1-2), 123-137.
148
Paktinat J., Pinkgouse J.A., and Fontaine J. “Investigation of Methods To Improve Utica Shale
Hydraulic Fracturing in the Appalachian Basin,” SPE 111063, 2007.
Paktinat J., Pinkgouse J.A., Stoner W.P., Williams C., and Carder G.A. “Case Histories: Post-
Frac Fluid Recovery Improvements of Appalachian Basin Gas Reservoirs,” SPE 97365, 2005.
Palisch T., Vincent M., and Handren P., “Sliwater Fracturing - Food for Thought,” SPE 115766,
2008.
Penny, G. and J.T. Pursely. “The Application of Microemulsion Additives in Drilling and
Stimulation Result in Enhanced Gas Production” SPE 94274, 2005.
Percival, Pamela. (May, 2009). “Oil and Gas Wastewater Recycling Continues to Increase, But is
Affected by Current Economy”. Fort Worth Basin Oil & GasMagazine.
Petersen, R. J.Composite reverse-osmosis and nanofiltration membranes J. Membr.
Sci.1993, 83 ( 1) 81– 150
Phillip, W. A.; Yong, J. S.; Elimelech, M.Reverse draw solute permeation in forward osmosis:
Modeling and experiments Environ. Sci. Technol. 2010, 44 ( 13) 5170– 5176
Pletcher, J. Drillers access mile‐deep gas deposits in what may be new 'gold rush'. s.l. : Herald
Standard, May 19, 2008.
Post, J. W. (2009). Blue Energy: Electricity production from salinity gradients by reverse
electrodialysis. Wageningen University, Socio-Economic and Natural Sciences of the
Environment.
Post, J. W., Veerman, J., Hamelers, H., Euverink, G., Metz, S., Nymeijer, D., et al. (2007).
Salinity-gradient power: Evaluation of pressure-retarded osmosis and reverse electrodialysis.
Journal of Membrane Science , 288, 218-230.
Piquepaile, Roland. ZDNet. [Online] Jan. 20th,
2008.http://blogs.zdnet.com/emergingtech/?p=809.
Performance of Forward Osmosis Membranes on Activated Sludge”. Journal of Membrane
Science, Volume 319, Issues 1-2, Pages 158-168.
Protection Agency, Office of Transportation and Air Quality, Publication EPA420-F-05-001,
Page 2
R.S., N. (1974). Water salination - source of energy. Science , 186 (4161), 350-352.
149
Robert L. McGinnis, Jeffrey R. McCutcheon, Menachem Elimelech, A novel ammonia-carbon
dioxide osmotic heat engine for power generation, Journal of Membrane Science, Volume 305,
Issues 1-2, 15 November 2007, Pages 13-19
Robeson, L.M. Correlation of separation factor versus permeability for polymeric membranes J.
Membr. Sci. 1991, 62 ( 2) 165– 185
Rong Wang, Lei Shi, Chuyang Y. Tang, Shuren Chou, Changquan Qiu, Anthony G. Fane,
Characterization of novel forward osmosis hollow fiber membranes, Journal of Membrane
Science, Volume 355, Issues 1-2, 15 June 2010, Pages 158-167
Russell T. Ewy and E. Keith Morton, Chevron Energy Technology Company “Wellbore Stability
Performance of Water Base Mud Additives” SPE 116139-MS 2008.
Rieb, B., Allen, S., and Hogan, J. (March 2009). “The Benefits of Recycle-Produced Water for
Fracs”. E & P.
Sada, D. Joshi. Horizontal Well Technology. 1991.
Sairam M., et al., Method for the preparation of cellulose acetate flat sheet composite membranes
for forward osmosis—Desalination using MgSO4 draw solution, Desalination (2011).
Sandra RodrÃguez, ECOPETROL, and Ricardo Arenas, Humberto Sierra, Carlos Montoya, and
Mario Serrano, SPE, Halliburton “Breaking Old Paradigms With the Use of High-Performance
Water-Based Mud Systems “SPE 138809-MS 2010.
Schweitzer, R.: “The Role of Economics on Well and Fracture Design Completions of Marcellus
Shale Wells” paper SPE 125975-MS, 2009
Shuren Chou, Lei Shi, Rong Wang, Chuyang Y. Tang, Changquan Qiu, Anthony G. Fane,
Characteristics and potential applications of a novel forward osmosis hollow fiber membrane,
Desalination, Volume 261, Issue 3, Special Issue in memory of Sidney Loeb (1917-2008), 31
October 2010, Pages 365-372
Skilhagen, S. E.Osmotic power—A new, renewable energy source Desalination Water
Treat. 2010, 15 ( 1–3) 271– 278
Smolders, C. A.; Reuvers, A. J.; Boom, R. M.; Wienk, I. M.Microstructures in phase-inversion
membranes. 1. Formation of macrovoids J. Membr. Sci. 1992, 73 ( 2–3) 259–275
Stache K., Apparatus for transforming seawater, brackish water, polluted water or the like into a
nutrious drink by means of osmosis, US Patent 4,879,030 (1989).

150
State, EMV. Pennsylvania. Driver and Vehicle Services. Pennsylvania Department of
Transportation. [Online] 02 2009.
http://www.dmv.state.pa.us/pdotforms/stats/Pennsylvania%20Motor%20Vehicle
%20Registrat ions.pdf.
Stutts, K. J.; Ferritto, M. S.; Mickols, W. E.Treatment of composite polyamide membrane to
improve performance. Patent 5876602, 1999.
Tang C.Y., kwon Y.N. and Leckie J.O., Probing the nano- and micro-scales of reverse osmosis
membranes—a comprehensive characterization of physiochemical properties of uncoated and
coated membranes by XPS, TEM, ATR-FTIR, and streaming potential measurements, J. Membr.
Sci. 287 (2007), p. 146
Thorsen, T.; Holt, T. The potential for power production from salinity gradients by pressure
retarded osmosis J. Membr. Sci. 2009, 335 ( 1–2) 103– 110
Tiraferri, A.; Yip, N. Y.; Phillip, W. A.; Schiffman, J. D.; Elimelech, M.Relating performance of
thin-film composite forward osmosis membranes to support layer formation and structure J.
Membr. Sci. 2011, 367 ( 1–2) 340– 352
Tomislav Soric, INA Naftaplin and Pavel Marinescu, Silicate-Based Drilling Fluids Deliver
Optimum Shale Inhibition and Wellbore Stability, IADC/SPE 87133. MARCH 2004.
Trypuc M. and Kiełkowska U., Solubility in the NH4HCO3 + NaHCO3 + H2O system, J. Chem.
Eng. Data 43 (1998), p. 210-204.
Tzahi Y. Cath, Childress A.E. and Elimelech M., Forward osmosis: principles, applications, and
recent developments, J. Membr. Sci. 281 (2006), p. 70.
Tzahi Y. Cath, Sherwin Gormly, Edward G. Beaudry, Michael T. Flynn, V. Dean Adams, Amy
E. Childress, Membrane contactor processes for wastewater reclamation in space: Part I. Direct
osmotic concentration as pretreatment for reverse osmosis, Journal of Membrane Science,
Volume 257, Issues 1-2, Membrane Contactors, 15 July 2005, Pages 85-98
U.S. Department of the Interior | U.S. Geological Survey. (29 March 2010).
Van de Witte, P.; Dijkstra, P. J.; van den Berg, J. W. A.; Feijen, J.Phase separation processes in
polymer solutions in relation to membrane formation J. Membr. Sci. 1996,117 ( 1–2) 1– 31
Veerman, J. (2010). Reverse Electrodialysis design and optimization, modeling and
experimentation.

151
Veil, J.A., Puder, M.G., Elcock, D., and Redweik, R.J., "A White Paper Describing Produced
Water from Production of Crude Oil, Natural Gas, and Coal Bed Methane," ANL Report under
DOE (NETL) Contract W-31-109-Eng-38 (2004).
Vos, K. D.; Burris, F. O.; Riley, R. L.Kinetic study of hydrolysis of cellulose acetate in pH range
of 2–10 J. Appl. Polym. Sci. 1966, 10 ( 5) 825– 832
Wanling Tang, How Yong Ng, Concentration of brine by forward osmosis: Performance and
influence of membrane structure, Desalination, Volume 224, Issues 1-3, Issues 1 and 2: 11th
Aachener Membran Kolloquium, 28-29 March 2007, Aachen, Germany - Issue 3: Aqua 2006,
2nd International Conference on Water Science and Ttechnology - Integrated Management of
Water Resources, November 2006, Athens, Greece, 15 April 2008, Pages 143-153
Wick, G., & Schmitt, W. (1977). Prospects for renewable energy from sea. Marine Technology
Society Journal , 11 (5-6), 16-21.
Wijmans, J. G.; Kant, J.; Mulder, M. H. V.; Smolders, C. A.Phase-separation phenomena in
solutions of polysulfone in mixtures of a solvent and a nonsolvent—Relationship with membrane
formation Polymer 1985, 26 ( 10) 1539– 1545
Without Chemical Reagents”. Journal of Membrane Science, Volume 348, Issues 1-2, Pages
337-345.
Yanagishita, H.; Nakane, T.; Yoshitome, H.Selection criteria for solvent and gelation medium in
the phase inversion process J. Membr. Sci. 1994, 89 ( 3) 215– 221
Yip, N. Y., Tiraferri, A., Phillip, W. A., Schiffman, J. D., & Elimelech, M. (2010, April 21).
High Performance Thin-Film Composite Forward Osmosis Membrane. 44 (10), pp. 3812-3818.
Yip, N. Y., Tiraferri, A., Phillip, W. A., Schiffman, J. D., Hoover, L. A., Kim, Y. C., et al. (2011,
April 14). Thin-Film Composite Pressure Retarded Osmosis Membranes for Sustainable Power
Generation from Salinity Gradients. Environmental Science & technology , A-J.
Yanagishita, H.; Nakane, T.; Yoshitome, H. Selection criteria for solvent and gelation medium in
the phase inversion process J. Membr. Sci. 1994, 89 ( 3) 215– 221
Xu Y., Peng X., Tang C.Y., Fu Q.S. and Nie S., Effect of draw solution concentration and
operating conditions on forward osmosis and pressure retarded osmosis performance in a spiral
wound module, J. Membr. Sci. 348 (2010), pp. 298–309.
Related Documents