Optimization of process parameters for enzymatic hydrolysis of tuna red meat protein with emphasis on specific applications Thesis submitted to Cochin University of Science and Technology In partial fulfillment for the degree of DOCTOR OF PHILOSOPHY in MARINE SCIENCES Faculty of Marine Sciences Cochin University of Science and Technology Cochin- 682 022 by Parvathy U. Reg. No. 5023 ICAR-Central Institute of Fisheries Technology Matsyapuri P.O, Cochin-682029 May, 2019

Welcome message from author
This document is posted to help you gain knowledge. Please leave a comment to let me know what you think about it! Share it to your friends and learn new things together.
Transcript
Optimization of process parameters for enzymatic
hydrolysis of tuna red meat protein with emphasis on
specific applicationsThesis submitted to
Cochin University of Science and Technology
In partial fulfillment for the degree of
DOCTOR OF PHILOSOPHY
in
MARINE SCIENCES
Faculty of Marine Sciences
Cochin University of Science and Technology
Cochin- 682 022
byParvathy U.Reg. No. 5023
ICAR-Central Institute of Fisheries Technology Matsyapuri P.O, Cochin-682029
May, 2019

This is to certify that the thesis entitled “Proteoglycans from deep sea
shark cartilage: Characterization and role in apoptosis triggered anti-cancer
activity and alleviation of osteoarthritic progression” embodies the original
work done by Ajeeshkumar K. K, under my guidance and supervision. He has
incorporated all the relevant corrections and modifications suggested by the
audience during the pre-synopsis seminar and by the doctoral committee. I further
certify that no part of this thesis has previously been formed the basis of award of
any degree, diploma, associateship, fellowship or any other similar titles of this or
in any other university or Institution.
Cochin, Dr. Asha K. KJanuary - 2018 Principal Scientist
Biochemistry & Nutrition Division
This is to certify that the research work presented in the PhD thesis entitled
“Optimization of process parameters for enzymatic hydrolysis of tuna red
meat protein with emphasis on specific applications” is a bona fide record of
research carried out by Mrs. Parvathy U. (Reg. No. 5023), under my guidance and
supervision and that no part therefore has been formed the basis of award of any
degree, diploma, associateship, fellowship or other similar titles or recognitions
of this or any other Universities. It is also certified that all the relevant corrections
and modifications suggested by the audience during the pre-synopsis seminar and
recommended by the Doctoral committee of the candidate has been incorporated in
the thesis.
Kochi Dr. George NinanMay, 2019 Supervising Guide

This is to certify that the thesis entitled “Proteoglycans from deep sea
shark cartilage: Characterization and role in apoptosis triggered anti-cancer
activity and alleviation of osteoarthritic progression” embodies the original
work done by Ajeeshkumar K. K, under my guidance and supervision. He has
incorporated all the relevant corrections and modifications suggested by the
audience during the pre-synopsis seminar and by the doctoral committee. I further
certify that no part of this thesis has previously been formed the basis of award of
any degree, diploma, associateship, fellowship or any other similar titles of this or
in any other university or Institution.
Cochin, Dr. Asha K. KJanuary - 2018 Principal Scientist
Biochemistry & Nutrition Division
This is to certify that the research work presented in the PhD thesis entitled
“Optimization of process parameters for enzymatic hydrolysis of tuna red
meat protein with emphasis on specific applications” is a bona fide record of
research carried out by Mrs. Parvathy U. (Reg. No. 5023), under my co-guidance
and supervision and that no part therefore has been formed the basis of award of
any degree, diploma, associateship, fellowship or other similar titles or recognitions
of this or any other Universities. It is also certified that all the relevant corrections
and modifications suggested by the audience during the pre-synopsis seminar and
recommended by the Doctoral committee of the candidate has been incorporated in
the thesis.
Kochi Dr. A. A. ZynudheenMay, 2019 Co-guide

DECLARATION
I, Parvathy U. (Reg. No. 5023), Ph.D candidate registered under the
Faculty of Marine Sciences, CUSAT hereby declare that, my PhD thesis entitled
“Optimization of process parameters for enzymatic hydrolysis of tuna red
meat protein with emphasis on specific applications” is a genuine record of
research carried out by me under the guidance of Dr. George Ninan, Principal
Scientist, Fish Processing Division, ICAR-CIFT, Kochi and the co-guidance of Dr.
A.A. Zynudheen, Head of Division (i/c) and Principal Scientist, Quality Assurance
and Management Division, ICAR-CIFT, Kochi. No part of this work has previously
formed the award of any degree, associateship, fellowship or any other title or
recognition of any other University or Society.
Kochi Parvathy U.May, 2019

Dedicated to
My Family and Friends
With
Love and Gratitude

AcknowledgementI wish to express my deepest regards and profound sense of gratitude to my major
advisor Dr. George Ninan, Principal Scientist, Fish Processing Division, ICAR-CIFT for his
inspiring guidance and constant encouragement which helped in the timely completion of my
research work. His keen attention and advice helped me a lot in preparation of the thesis and
submitting it in the present form.
I am grateful and indebted to Dr. A. A. Zynudheen, Co-guide and HOD (i/c), Quality
Assurance and Management Division, ICAR-CIFT, for his valuable help and support during
the course of my study and the constructive suggestions given for the successful completion of
thesis.
I place on record my sincere gratitude to Dr. C. N. Ravishankar, Director, ICAR-CIFT
for all his encouragement and incredible support given and providing necessary facilities for the
successful conduct of the research work.
I express my gratitude to Dr. K. Ashok Kumar, HOD, Fish Processing Division for his
support and encouragement for the successful completion of my research work.
I owe a great deal to Dr. Binsi P. K. in being a great support during the course of my
research work. Her helpful advice and constructive suggestions given during the course of the
experiment and preparation of the thesis is commendable and I sincerely thank her for all the
ideas and contributions made for preparing the thesis in the current structure.
My sincere gratitude to Dr. T.K. Srinivasa Gopal, Former Director, ICAR-CIFT for
his valuable and constructive suggestions given during the study. I also place on record my
deepest regards to Dr. Sajan George, my MFSc research guide, whose aptitude and dedication
towards work has always inspired me to work hard.
I wish to place on record my sincere thanks to all staffs of Mumbai Research Centre,
where major part of my research work was carried out. Thanks to Dr. L. N. Murthy, for his
support and providing the facilities to carry out my work. I deeply acknowledge Dr. A. Jeyakumari
for her constant encouragement, incredible support and contributions. I also sincerely thank
Dr. S. Visnuvinayagam for his support and contributions. All technical, supporting and
administrative staffs are also greatly acknowledged: Smt. Sangeeta, Smt. Priyanka, Smt.
Triveni, Smt. Girija, Smt. Hema, Shri Waghmare, Shri Vinod, Shri Avinash and all other staffs.
My sincere thanks are also due to Dr. Joshy C. G. for the help in statistical analysis of
the experiment, results and also for his cordial and timely help.
I place on record my sincere gratitude to my senior colleagues of Fish Processing Division,
Dr. J. Bindu, Dr. C. O. Mohan and all my colleagues, Sreelakshmi, Sarika, Sreejith, Mandakini,
Elavarasan and Satheesh for the help extended by them during course of my work. All the staffs
of fish processing division are also greatly acknowledged for their direct and indirect support
and assistance. Special thanks to Shri. Noby, Smt. Susmitha and Smt. Priyanka for the timely
and cordial help in case of immediate assistance. I place on record my gratitude to all Heads of
the Division, ICAR-CIFT and all staffs of ICAR-CIFT who have directly or indirectly helped
and supported me in completion of this study.
I would like to wholeheartedly thank my CIFT colleagues Anupama, Laly, Renuka,
Jesmi, Rehana, Priya and all other colleagues who have directly or indirectly helped me during
my research work. Special thanks to my colleague, Manju for her moral support which has
helped me a great in the successful completion of my research work.
Cooperation from Smt. Silaja and all the library staff of ICAR-CIFT, Kochi has helped
me to a great extent in successful compilation of my PhD thesis. I express my heartfelt thanks to
them. I also place on record my gratitude to ICAR and CUSAT for the permission and facilities
given in carrying out this research work successfully.
Most often words fail to express the feelings. The support and care given by my family
is incredible and can never be acknowledged through words. They have been a great deal of
support to me throughout my study. I express my sincere gratitude to my family for all the
encouragement and continuous support for the successful completion of my work.
My homage to the Almighty for what I am today and for all the blessings in my life.
Parvathy U.
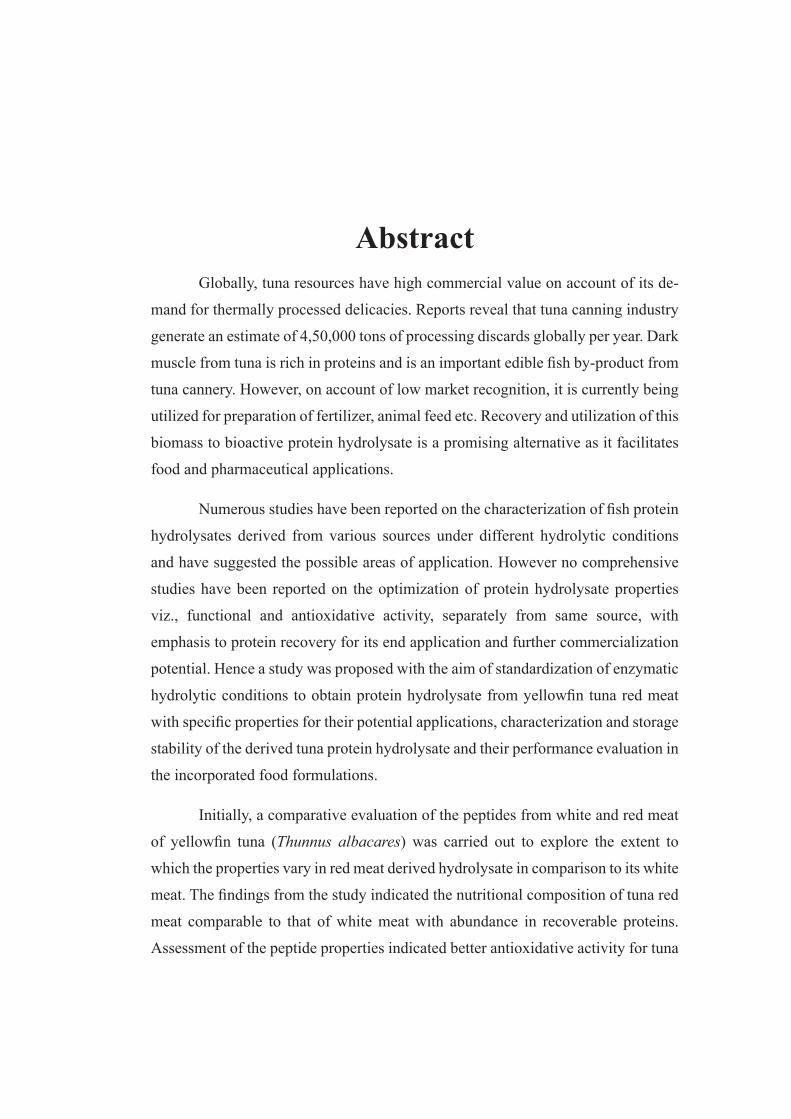
Abstract Globally, tuna resources have high commercial value on account of its de-
mand for thermally processed delicacies. Reports reveal that tuna canning industry
generate an estimate of 4,50,000 tons of processing discards globally per year. Dark
muscle from tuna is rich in proteins and is an important edible fish by-product from
tuna cannery. However, on account of low market recognition, it is currently being
utilized for preparation of fertilizer, animal feed etc. Recovery and utilization of this
biomass to bioactive protein hydrolysate is a promising alternative as it facilitates
food and pharmaceutical applications.
Numerous studies have been reported on the characterization of fish protein
hydrolysates derived from various sources under different hydrolytic conditions
and have suggested the possible areas of application. However no comprehensive
studies have been reported on the optimization of protein hydrolysate properties
viz., functional and antioxidative activity, separately from same source, with
emphasis to protein recovery for its end application and further commercialization
potential. Hence a study was proposed with the aim of standardization of enzymatic
hydrolytic conditions to obtain protein hydrolysate from yellowfin tuna red meat
with specific properties for their potential applications, characterization and storage
stability of the derived tuna protein hydrolysate and their performance evaluation in
the incorporated food formulations.
Initially, a comparative evaluation of the peptides from white and red meat
of yellowfin tuna (Thunnus albacares) was carried out to explore the extent to
which the properties vary in red meat derived hydrolysate in comparison to its white
meat. The findings from the study indicated the nutritional composition of tuna red
meat comparable to that of white meat with abundance in recoverable proteins.
Assessment of the peptide properties indicated better antioxidative activity for tuna
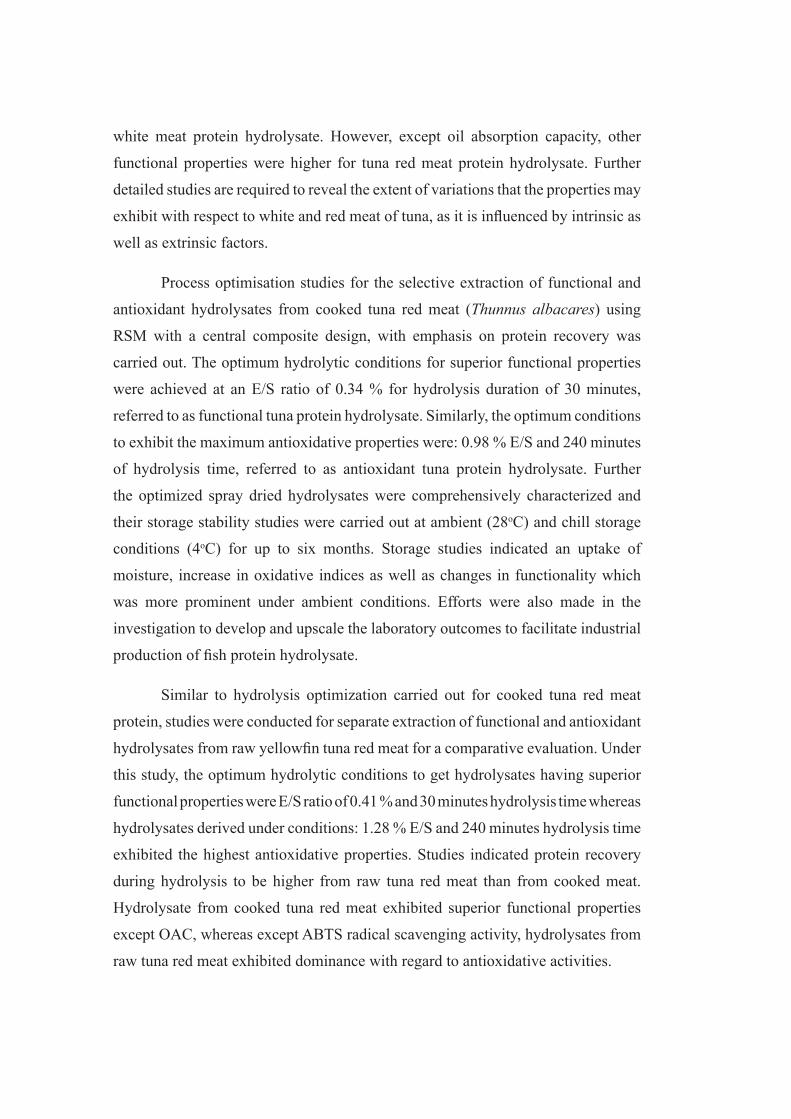
white meat protein hydrolysate. However, except oil absorption capacity, other
functional properties were higher for tuna red meat protein hydrolysate. Further
detailed studies are required to reveal the extent of variations that the properties may
exhibit with respect to white and red meat of tuna, as it is influenced by intrinsic as
well as extrinsic factors.
Process optimisation studies for the selective extraction of functional and
antioxidant hydrolysates from cooked tuna red meat (Thunnus albacares) using
RSM with a central composite design, with emphasis on protein recovery was
carried out. The optimum hydrolytic conditions for superior functional properties
were achieved at an E/S ratio of 0.34 % for hydrolysis duration of 30 minutes,
referred to as functional tuna protein hydrolysate. Similarly, the optimum conditions
to exhibit the maximum antioxidative properties were: 0.98 % E/S and 240 minutes
of hydrolysis time, referred to as antioxidant tuna protein hydrolysate. Further
the optimized spray dried hydrolysates were comprehensively characterized and
their storage stability studies were carried out at ambient (28oC) and chill storage
conditions (4oC) for up to six months. Storage studies indicated an uptake of
moisture, increase in oxidative indices as well as changes in functionality which
was more prominent under ambient conditions. Efforts were also made in the
investigation to develop and upscale the laboratory outcomes to facilitate industrial
production of fish protein hydrolysate.
Similar to hydrolysis optimization carried out for cooked tuna red meat
protein, studies were conducted for separate extraction of functional and antioxidant
hydrolysates from raw yellowfin tuna red meat for a comparative evaluation. Under
this study, the optimum hydrolytic conditions to get hydrolysates having superior
functional properties were E/S ratio of 0.41 % and 30 minutes hydrolysis time whereas
hydrolysates derived under conditions: 1.28 % E/S and 240 minutes hydrolysis time
exhibited the highest antioxidative properties. Studies indicated protein recovery
during hydrolysis to be higher from raw tuna red meat than from cooked meat.
Hydrolysate from cooked tuna red meat exhibited superior functional properties
except OAC, whereas except ABTS radical scavenging activity, hydrolysates from
raw tuna red meat exhibited dominance with regard to antioxidative activities.
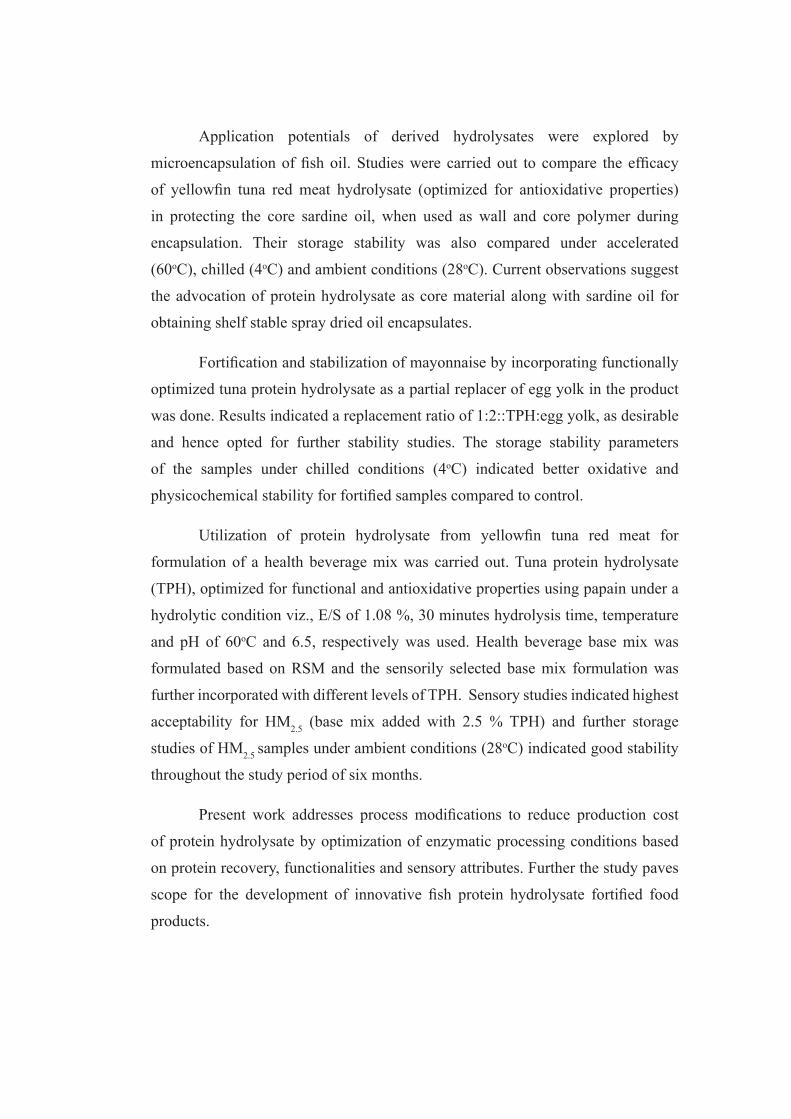
Application potentials of derived hydrolysates were explored by
microencapsulation of fish oil. Studies were carried out to compare the efficacy
of yellowfin tuna red meat hydrolysate (optimized for antioxidative properties)
in protecting the core sardine oil, when used as wall and core polymer during
encapsulation. Their storage stability was also compared under accelerated
(60oC), chilled (4oC) and ambient conditions (28oC). Current observations suggest
the advocation of protein hydrolysate as core material along with sardine oil for
obtaining shelf stable spray dried oil encapsulates.
Fortification and stabilization of mayonnaise by incorporating functionally
optimized tuna protein hydrolysate as a partial replacer of egg yolk in the product
was done. Results indicated a replacement ratio of 1:2::TPH:egg yolk, as desirable
and hence opted for further stability studies. The storage stability parameters
of the samples under chilled conditions (4oC) indicated better oxidative and
physicochemical stability for fortified samples compared to control.
Utilization of protein hydrolysate from yellowfin tuna red meat for
formulation of a health beverage mix was carried out. Tuna protein hydrolysate
(TPH), optimized for functional and antioxidative properties using papain under a
hydrolytic condition viz., E/S of 1.08 %, 30 minutes hydrolysis time, temperature
and pH of 60oC and 6.5, respectively was used. Health beverage base mix was
formulated based on RSM and the sensorily selected base mix formulation was
further incorporated with different levels of TPH. Sensory studies indicated highest
acceptability for HM2.5 (base mix added with 2.5 % TPH) and further storage
studies of HM2.5 samples under ambient conditions (28oC) indicated good stability
throughout the study period of six months.
Present work addresses process modifications to reduce production cost
of protein hydrolysate by optimization of enzymatic processing conditions based
on protein recovery, functionalities and sensory attributes. Further the study paves
scope for the development of innovative fish protein hydrolysate fortified food
products.

ABBREVIATIONSAAN : Alpha amino nitrogenABTS : 2,20 -azinobis-(3-ethylbenzothiazoline-6-sulfonic acid)ANOVA : Analysis of varianceAOAC : Association of official analytical chemistsAR : Analytical grade reagentAU : Activity unitBHA : Butylated hydroxy anisoleBHT : Butylated hydroxy tolueneCCD Central composite designDa : DaltonDH : Degree of hydrolysisDPPH : 2,2-diphenyl-1-picryl hydrazylDSC : Differential scanning calorimetryEAA : Essential amino acidEAI : Emulsifying activity indexEE : Encapsulation efficiencyESI : Emulsion stability indexE / S : Enzyme to substrate ratioFAO : Food and agriculture organizationFC : Foaming capacityFFA : Free fatty acidFMOC : 9-fluorenylmethyl-chloroformateFPH : Fish protein hydrolysateFRAP : Ferric reducing antioxidant powerFS : Foam stabilityFT-IR : Fourier transform infra red analysisg : Gramh : HourHPLC : High performance liquid chromatographyICP-OES : Inductivity coupled plasma-optical emission spectrometerIC50 : Half maximal (50 %) inhibitory concentrationkCal : KilocaloriekDa : Kilodaltonkg : KilogramkV : KilovoltmEq : Milliequivalents

mg : Milligrammin : Minutesml : Millilitremmol : MillimoleMSE : Mean square errorMW : Molecular weightNEAA : Non essential amino acidnm : NanometerNPN : Non-protein nitrogenOAC : Oil absorption capacityOPA : O-phthalaldehydePA : Proteolytic activityPG : Propyl gallatePR : Protein recoveryPV : Peroxide valueRDA : Recommended daily intakeRP : Reducing powerrpm : Rotations per minuteRSM : Response surface methodologySDS : Sodium dodecyl sulphatesec : SecondsSEM : Scanning electron microscopeSGF : Simulated gastric fluidSIF : Simulated intestinal fluidTCA : Trichloroacetic acidTMA : Tri-methyl amineTPH : Tuna protein hydrolysateTRPH : Tuna red meat protein hydrolysateTVBN : Total volatile base nitrogenTWPH : Tuna white meat protein hydrolysateUV : Ultravioletv/v : Volume by volumew/v : Weight by volumeα : Alphaμl : Microlitreμm : MicrometerμM : Micromole

ContentsChapter 1 Introduction ................................................................................1
Chapter 2 Review of Literature .....................................................................92.1 Tuna red meat as a source of protein .......................................................... 92.2 Fish protein hydrolysate ........................................................................102.3 Enzymatic hydrolysis ............................................................................112.4 Factors influencing enzymatic hydrolysis ....................................................132.5 Proximate composition of fish protein hydrolysates ........................................182.6 Amino acid composition of fish protein hydrolysates ......................................202.7 Functional properties of fish protein hydrolysates .........................................212.7.1 Solubility ........................................................................................222.7.2 Fat absorption capacity ......................................................................232.7.3 Emulsifying properties ........................................................................242.7.4 Foaming properties ............................................................................262.7.5 Sensory properties.............................................................................262.8 Antioxidative activity of fish protein hydrolysates ..........................................292.9 Applications of fish protein hydrolysates .....................................................35
Chapter 3 Quality assessment of peptides from white and red meat ofyellowfintuna ....................................................................... 39
3.1 Introduction .......................................................................................393.2 Materials and methods ..........................................................................413.2.1 Fish, enzyme and chemicals .................................................................413.2.2 Preparation of tuna protein hydrolysate ...................................................413.2.3 Protein content and protein recovery ......................................................423.2.4 Yield ............................................................................................433.2.5 Degree of hydrolysis and proteolytic activity .............................................433.2.6 Colour and browning intensity...............................................................443.2.7 Ultraviolet absorption spectra ..............................................................453.2.8 Functional properties .........................................................................453.2.8.1 Protein solubility ............................................................................453.2.8.2 Foaming properties .........................................................................453.2.8.3 Emulsifying properties .....................................................................463.2.8.4 Oil absorption capacity ....................................................................463.2.8.5 Sensory properties ..........................................................................473.2.9 Antioxidative properties ......................................................................473.2.9.1 DPPH radical scavenging activity .........................................................473.2.9.2 Reducing power .............................................................................473.2.9.3 Ferric reducing antioxidant power ......................................................483.2.9.4 Metal chelating activity ....................................................................483.2.9.5 ABTS radical scavenging activity ..........................................................533.2.10 Statistical interpretation ...................................................................493.3 Results and discussion ...........................................................................503.3.1 Protein content and protein recovery ......................................................503.3.2 Yield .............................................................................................523.3.3 Degree of hydrolysis and proteolytic activity .............................................533.3.4 Colour and browning intensity...............................................................543.3.5 UV absorption spectra ........................................................................553.3.6 Functional properties .........................................................................573.3.6.1 Protein solubility ............................................................................573.3.6.2 Foaming properties .........................................................................583.3.6.3 Emulsifying properties .....................................................................593.3.6.4 Oil absorption capacity ....................................................................603.3.6.5 Sensory properties ..........................................................................613.3.7 Antioxidative properties ......................................................................623.3.7.1 DPPH radical scavenging activity .........................................................623.3.7.2 Reducing power and Ferric reducing antioxidant power (FRAP) .....................643.3.7.3 Metal chelating ability .....................................................................653.3.7.4 ABTS radical scavenging activity ..........................................................663.4 Conclusion.........................................................................................68
Chapter 4 Process optimisation for the selective extraction of functional and antioxidative hydrolysates from cooked tuna red meat .................. 69
4.1 Introduction .......................................................................................694.2 Materials and methods ..........................................................................724.2.1 Raw material and chemicals .................................................................724.2.2 Preparation of protein hydrolysate ........................................................724.2.3 Experimental design ..........................................................................734.2.4 Determination of proximate composition .................................................744.2.5 Determination of degree of hydrolysis and proteolytic activity .......................754.2.6 Determination of protein recovery .........................................................754.2.7 Determination of functional and antioxidative properties ..............................754.2.8 Statistical model development ..............................................................764.3 Results and discussion ...........................................................................784.3.1 Proximate composition of raw material mince ...........................................784.3.2 Optimization of hydrolysis parameters.....................................................784.3.3 RSM based optimisation of process variables .............................................794.3.4 Variations in degree of hydrolysis ...........................................................824.3.5 Variations in protein recovery ...............................................................844.3.6 Variations in functional properties .........................................................864.3.6.1 Foaming properties .........................................................................864.3.6.2 Emulsifying properties .....................................................................894.3.6.3 Oil absorption capacity ....................................................................934.3.6.4 Sensory property ............................................................................954.3.7 Variations in antioxidative properties ......................................................974.3.7.1 DPPH radical scavenging activity .........................................................974.3.7.2 Ferric reducing antioxidant power ......................................................994.3.7.3 Metal chelating activity .................................................................. 1014.3.7.4 ABTS radical scavenging activity ........................................................ 1034.4 Conclusion....................................................................................... 107
Chapter5 Functionalandantioxidantproteinhydrolysatesfromyellowfintunaraw red meat: Optimization by RSM .................................................... 109
5.1 Introduction ..................................................................................... 1095.2 Materials and methods ........................................................................ 1105.2.1 Raw material, enzyme and chemicals .................................................... 1105.2.2 Process optimization for protein hydrolysis ............................................. 1105.2.3 Determination of proximate composition ............................................... 1115.2.4 Determination of degree of hydrolysis and protein recovery ........................ 1115.2.5 Determination of functional and antioxidative properties ............................ 1135.2.6 Statistical model development ............................................................ 1135.3 Results and discussion ......................................................................... 1145.3.1 Proximate composition ..................................................................... 1145.3.2 Optimization of process conditions ....................................................... 1155.3.3 Protein recovery ............................................................................. 1175.3.4 Functional properties ....................................................................... 1195.3.4.1 Foaming properties ....................................................................... 1195.3.4.2 Emulsifying properties ................................................................... 1225.3.4.3 Oil absorption capacity .................................................................. 1255.3.4.4 Sensory properties ........................................................................ 1275.3.5 Antioxidative properties .................................................................... 1295.3.5.1 DPPH radical scavenging activity ....................................................... 1295.3.5.2 Ferric reducing antioxidant power .................................................... 1315.3.5.3 Reducing power ........................................................................... 1335.3.5.4 ABTS radical scavenging activity ........................................................ 1355.4 Conclusion....................................................................................... 139
Chapter 6 Characterization and storage stability of the optimized functional and antioxidant tuna protein hydrolysates ...................................... 141
6.1 Introduction ..................................................................................... 1416.2 Materials and methods ........................................................................ 1426.2.1 Raw materials and chemicals .............................................................. 1426.2.2 Characterization studies ................................................................... 1426.2.2.1 Degree of hydrolysis and proteolytic activity ........................................ 1426.2.2.2 Protein recovery and yield .............................................................. 1426.2.2.3 Determination of molecular weight ................................................... 143
6.2.2.4 Nutritional profiling ....................................................................... 1436.2.2.4.1 Proximate composition ................................................................ 1436.2.2.4.2 Amino acid profile ...................................................................... 1446.2.2.4.3 Mineral profile ........................................................................... 1446.2.2.5 Morphological and thermal characteristics ........................................... 1466.2.2.5.1 Scanning electron microscopy ....................................................... 1466.2.2.5.2 Differential scanning colorimetry ................................................... 1476.2.2.5.3 Fourier-transform infrared spectroscopic analysis ............................... 1476.2.2.6 Physico-chemical characteristics ....................................................... 1476.2.2.6.1 Hygroscopicity........................................................................... 1476.2.2.6.2 Bulk density and tapped density ..................................................... 1486.2.2.6.3 Colour and browning intensity ........................................................ 1486.2.2.7 Functional and bioactive characteristics .............................................. 1496.2.2.7.1 Foaming properties ..................................................................... 1496.2.2.7.2 Emulsifying properties ................................................................. 1496.2.2.7.3 Antioxidative properties: pH and thermal stability studies ...................... 1506.2.3 Storage stability studies .................................................................... 1516.2.3.1 Moisture .................................................................................... 1516.2.3.2 pH ........................................................................................... 1516.2.3.3 Colour ...................................................................................... 1516.2.3.4 Solubility ................................................................................... 1526.2.3.5 Thio-barbituric Acid Reactive Substances ............................................. 1526.2.3.6 Tri-methylamine nitrogen ............................................................... 1526.2.3.7 Sensory analysis .......................................................................... 1536.2.3.8 Microbiological analysis .................................................................. 1536.2.4 Economic feasibility analysis .............................................................. 1536.2.5 Statistical analysis ........................................................................... 1546.3 Results and discussion ......................................................................... 1556.3.1 Characteristics of optimized tuna protein hydrolysates ............................... 1556.3.1.1 Degree of hydrolysis and proteolytic activity ......................................... 1556.3.1.2 Protein recovery and yield .............................................................. 1556.3.1.3 Molecular weight .......................................................................... 1566.3.1.4 Nutritional profile ......................................................................... 1586.3.1.4.1 Proximate composition ................................................................ 1586.3.1.4.2 Amino acid profile ..................................................................... 1596.3.1.4.3 Mineral profile ........................................................................... 1636.3.1.5 Morphological and thermal characteristics ........................................... 1656.3.1.5.1 Scanning electron microscopy ........................................................ 1656.3.1.5.2 Differential scanning colorimetry .................................................... 1666.3.1.5.3 Fourier-transform infrared spectroscopic analysis ............................... 1686.3.1.6 Physico-chemical properties ............................................................ 1706.3.1.6.1 Hygroscopicity........................................................................... 1706.3.1.6.2 Bulk density and tapped density ..................................................... 1706.3.1.6.3 Colour and browning intensity ........................................................ 1716.3.1.7 Functional and bioactive characteristics .............................................. 1746.3.1.7.1 pH stability of functional hydrolysate ............................................... 1746.3.1.7.2 pH stability of antioxidant hydrolysate ............................................. 1766.3.1.7.3 Thermal stability of antioxidant hydrolysate ....................................... 1786.3.1.7.4 Effect of concentration on functional properties ................................. 1806.3.1.7.5 Effect of concentration on antioxidative properties .............................. 1826.3.2 Storage stability studies .................................................................... 1846.3.2.1 Moisture .................................................................................... 1846.3.2.2 pH ........................................................................................... 1856.3.2.3 Colour ....................................................................................... 1876.3.2.4 Solubility ................................................................................... 1906.3.2.5 TBARS ....................................................................................... 1926.3.2.6 TMA-N ....................................................................................... 1946.3.2.7 Sensory indices ............................................................................ 1956.3.2.8 Total plate count .......................................................................... 1966.3.3 Economic feasibility analysis .............................................................. 2036.4 Conclusion....................................................................................... 207
Chapter 7 Tuna protein hydrolysate as fortifying and stabilizing agent in mayonnaise ................................................... 209
7.1 Introduction ..................................................................................... 2097.2 Materials and methods ........................................................................ 211
7.2.1 Raw Materials and Chemicals .............................................................. 2117.2.2 Preparation of mayonnaise ................................................................ 2117.2.3 Preliminary product acceptability study ................................................. 2117.2.4 Characterization of mayonnaise .......................................................... 2137.2.4.1 Proximate composition ................................................................... 2137.2.4.2 Emulsion microstructure ................................................................ 2137.2.4.3 Particle size analysis ...................................................................... 2147.2.4.4 Rheological properties ................................................................... 2147.2.5 Storage stability studies .................................................................... 2157.2.6 Statistical analysis ........................................................................... 2177.3 Results and discussion ......................................................................... 2187.3.1 Preliminary product acceptability study ................................................. 2187.3.2 Characterization of selected mayonnaise formulation ................................ 2207.3.2.1 Proximate composition ................................................................... 2207.3.2.2 Emulsion microstructure ................................................................ 2217.3.2.3 Particle size analysis ...................................................................... 2227.3.2.4 Rheological properties ................................................................... 2247.3.2.4.1 Frequency sweep ....................................................................... 2247.3.2.4.2 Strain sweep ............................................................................. 2267.3.2.4.3 Flow profile .............................................................................. 2287.3.3. Storage stability analysis .................................................................. 2327.3.3.1 pH ........................................................................................... 2327.3.3.2 Emulsion stability index .................................................................. 2337.3.3.3 Viscosity .................................................................................... 2347.3.3.4 Free fatty acid ............................................................................. 2357.3.3.5 Peroxide value ............................................................................. 2367.3.3.6 Sensory evaluation ........................................................................ 2377.3.3.7 Microbiological studies ................................................................... 2377.4 Conclusion....................................................................................... 239
Chapter8 UtilizationofTunaredmeathydrolysateforfishoilencapsulationand encapsulate acceptability studies in selected food products ................ 241
8.1 Introduction ..................................................................................... 2418.2 Materials and methods ........................................................................ 2438.2.1 Raw materials, enzymes and chemicals ................................................. 2438.2.2 Fatty acid profiling .......................................................................... 2438.2.3 Preparation of emulsion and spray drying ............................................... 2458.2.4 Characterization of emulsion .............................................................. 2468.2.4.1 Emulsion stability index ................................................................ 2468.2.5 Characterization of microencapsulates ................................................. 2468.2.5.1 Scanning electron microscopy .......................................................... 2468.2.5.2 Differential scanning colorimetry ...................................................... 2478.2.5.3 Fourier-transform infrared spectroscopic analysis .................................. 2478.2.5.4 Encapsulation efficiency................................................................ 2488.2.6 Physical properties of microencapsulates ............................................... 2498.2.6.1 Moisture content and hygroscopicity .................................................. 2498.2.6.2 Bulk density and tapped density ....................................................... 2498.2.6.3 Colour ..................................................................................... 2498.2.7 In vitro oil release kinetics ................................................................ 2508.2.8 Storage stability of sardine oil encapsulates ............................................ 2518.2.9 Product acceptability studies .............................................................. 2528.2.10 Statistical analysis ......................................................................... 2528.3 Results and discussion ........................................................................ 2538.3.1 Fatty acid profiling ......................................................................... 2538.3.2 Characterization of emulsion .............................................................. 2558.3.2.1 Emulsion stability index .................................................................. 2558.3.3 Characterization of microencapsulates .................................................. 2558.3.3.1 Scanning electron microscopy .......................................................... 2558.3.3.2 Differential scanning colorimetry ...................................................... 2578.3.3.3 Fourier-transform infrared spectroscopic analysis .................................. 2598.3.3.4 Encapsulation efficiency ................................................................ 2618.3.4 Physical properties of microencapsulates ............................................... 2628.3.4.1 Moisture content ......................................................................... 2628.3.4.2 Hygroscopicity ............................................................................ 2628.3.4.3 Bulk density and tapped density ....................................................... 2638.3.5 In vitro oil release kinetics ................................................................. 265
8.3.6 Storage stability of oil and encapsulates ............................................... 2668.3.6.1 Changes in peroxide value ............................................................... 2668.3.6.2 Changes in TBARS ........................................................................ 2698.3.6.3 Changes in colour parameters .......................................................... 2718.3.7 Product acceptability study ................................................................ 2778.4 Conclusion ...................................................................................... 281
Chapter9 Utilizationofyellowfintunaproteinhydrolysatein health beverage formulation ....................................................... 283
9.1 Introduction ..................................................................................... 2839.2 Materials and methods ........................................................................ 2869.2.1 Raw material, enzymes and chemicals ................................................... 2869.2.2 Hydrolysis - Optimization studies ......................................................... 2869.2.3 Formulation of base mix.................................................................... 2879.2.4 Preliminary product acceptability study ................................................. 2889.2.5 Characterization of health mix ........................................................... 2899.2.5.1 Nutritional profiling ....................................................................... 2899.2.5.1.1 Fatty acid ............................................................................... 2899.2.5.1.2 Amino acid .............................................................................. 2909.2.5.1.3 Mineral .................................................................................. 2909.2.5.2 Physical properties ....................................................................... 2909.2.5.2.1 Particle density ........................................................................ 2909.2.5.2.2 Bulk and tapped densities ............................................................. 2909.2.5.2.3 Porosity ................................................................................... 2919.2.5.2.4 Flowability and cohesiveness ......................................................... 2919.2.5.2.5 Wettability ............................................................................... 2919.2.5.2.6 Dispersibility ............................................................................ 2929.2.6 Antioxidant stability during in vitro gastrointestinal (GI) digestion ................ 2929.2.7 Storage stability studies .................................................................... 2939.2.8 Statistical analysis ........................................................................... 2939.3 Results and discussion ......................................................................... 2949.3.1 Formulation of base health mix ........................................................... 2949.3.2 Preliminary product acceptability study ................................................. 2949.3.3 Characterization of health mix ........................................................... 3039.3.3.1 Nutritional profile ......................................................................... 3039.3.3.1.1 Fatty acid ................................................................................ 3039.3.3.1.2 Amino acid ............................................................................... 3059.3.3.1.3 Mineral ................................................................................... 3079.3.3.2 Physical properties ........................................................................ 3089.3.3.2.1 Particle density ........................................................................3089.3.3.2.2 Bulk, tapped densities and porosity ................................................. 3099.3.3.2.3 Flowability and cohesiveness ......................................................... 3109.3.3.2.4 Wettability and dispersibility ......................................................... 3109.3.4 In vitro digestibility and stability ......................................................... 3129.3.5 Storage stability studies .................................................................... 3139.3.5.1 Moisture ................................................................................... 3139.3.5.2 pH ........................................................................................... 3149.3.5.3 PV and FFA ................................................................................. 3159.3.5.4 TMA-N and TVBN .......................................................................... 3179.3.5.5 Sensory analysis ........................................................................... 3199.3.5.6 Microbiological analysis .................................................................. 3209.4 Conclusion....................................................................................... 323
Chapter 10 Summary ................................................................................ 325
References ............................................................................. 329
Annexure 1 ............................................................................. 373
Annexure 2 ............................................................................. 375
Annexure 3 ............................................................................. 377
Annexure 4 ............................................................................. 379
Publications and Award .............................................................. 381

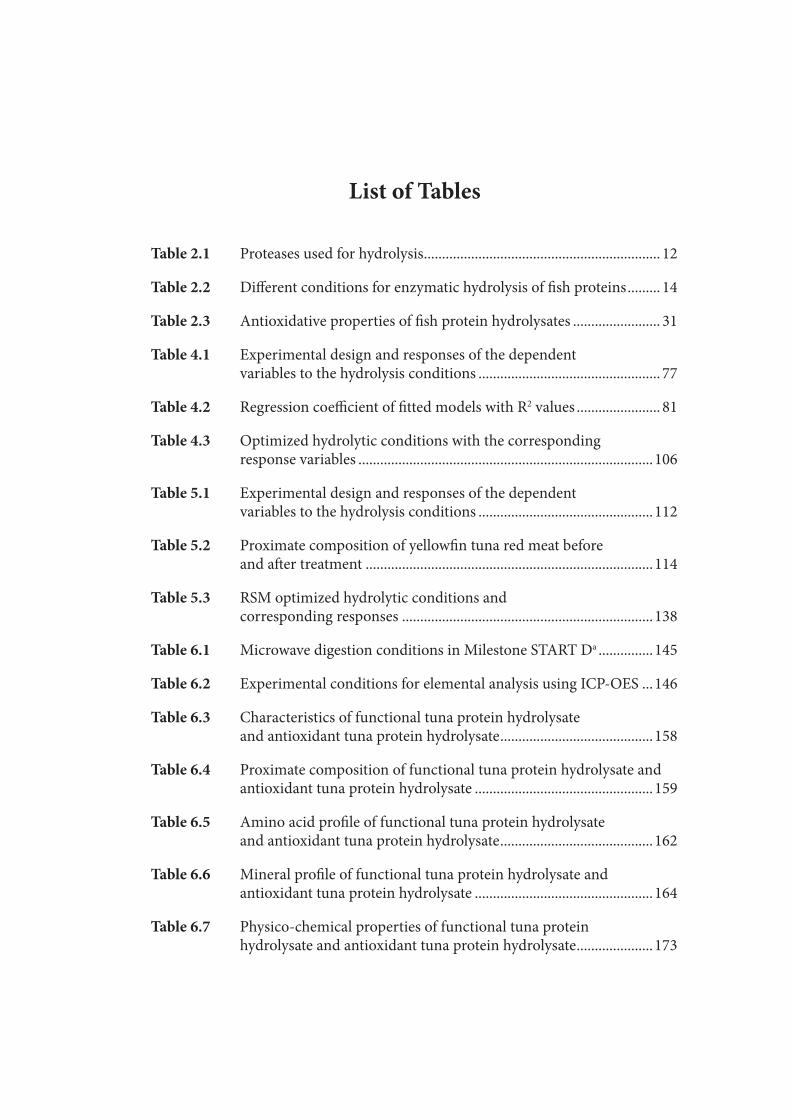
List of Tables
Table 2.1 Proteases used for hydrolysis ................................................................. 12
Table 2.2 Different conditions for enzymatic hydrolysis of fish proteins ......... 14
Table 2.3 Antioxidative properties of fish protein hydrolysates ........................ 31
Table 4.1 Experimental design and responses of the dependent variables to the hydrolysis conditions .................................................. 77
Table 4.2 Regression coefficient of fitted models with R2 values ....................... 81
Table 4.3 Optimized hydrolytic conditions with the corresponding response variables .................................................................................106
Table 5.1 Experimental design and responses of the dependent variables to the hydrolysis conditions ................................................112
Table 5.2 Proximate composition of yellowfin tuna red meat before and after treatment ...............................................................................114
Table 5.3 RSM optimized hydrolytic conditions and corresponding responses .....................................................................138
Table 6.1 Microwave digestion conditions in Milestone START Da ...............145
Table 6.2 Experimental conditions for elemental analysis using ICP-OES ...146
Table 6.3 Characteristics of functional tuna protein hydrolysate and antioxidant tuna protein hydrolysate ..........................................158
Table 6.4 Proximate composition of functional tuna protein hydrolysate and antioxidant tuna protein hydrolysate .................................................159
Table 6.5 Amino acid profile of functional tuna protein hydrolysate and antioxidant tuna protein hydrolysate ..........................................162
Table 6.6 Mineral profile of functional tuna protein hydrolysate and antioxidant tuna protein hydrolysate .................................................164
Table 6.7 Physico-chemical properties of functional tuna protein hydrolysate and antioxidant tuna protein hydrolysate .....................173

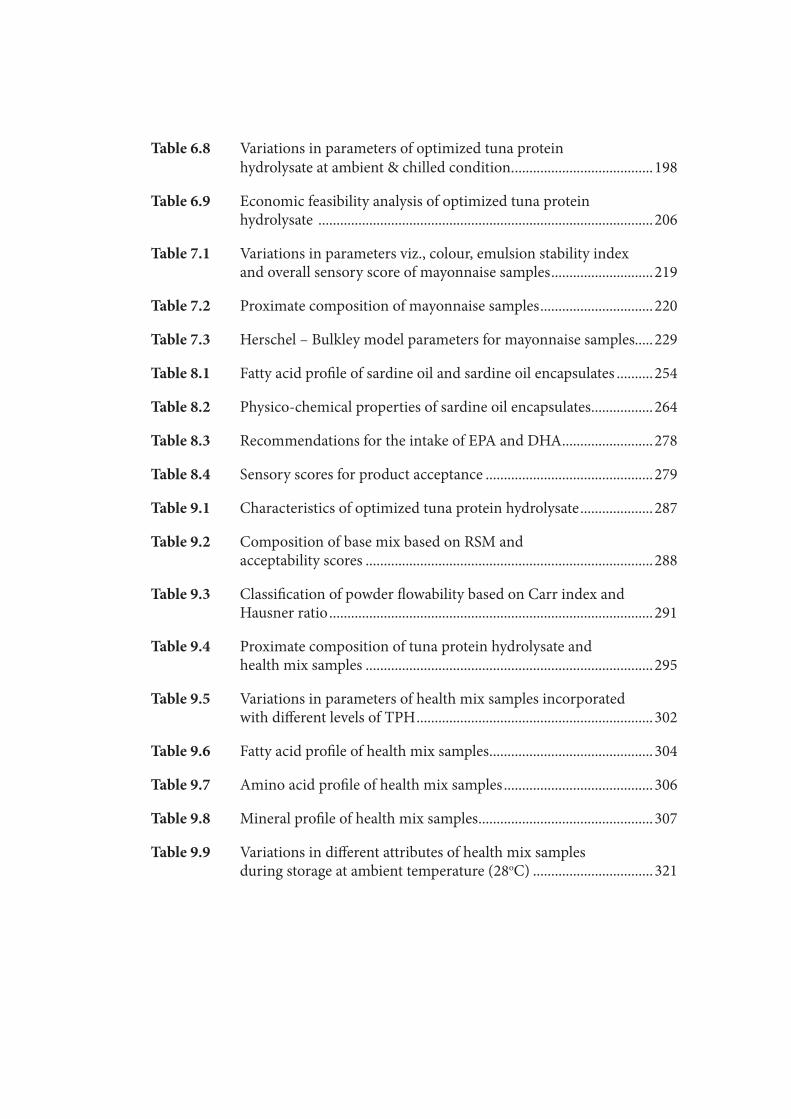
Table 6.8 Variations in parameters of optimized tuna protein hydrolysate at ambient & chilled condition. ......................................198
Table 6.9 Economic feasibility analysis of optimized tuna protein hydrolysate ............................................................................................206
Table 7.1 Variations in parameters viz., colour, emulsion stability index and overall sensory score of mayonnaise samples ............................219
Table 7.2 Proximate composition of mayonnaise samples ...............................220
Table 7.3 Herschel – Bulkley model parameters for mayonnaise samples.....229
Table 8.1 Fatty acid profile of sardine oil and sardine oil encapsulates ..........254
Table 8.2 Physico-chemical properties of sardine oil encapsulates .................264
Table 8.3 Recommendations for the intake of EPA and DHA .........................278
Table 8.4 Sensory scores for product acceptance ..............................................279
Table 9.1 Characteristics of optimized tuna protein hydrolysate ....................287
Table 9.2 Composition of base mix based on RSM and acceptability scores ...............................................................................288
Table 9.3 Classification of powder flowability based on Carr index and Hausner ratio .........................................................................................291
Table 9.4 Proximate composition of tuna protein hydrolysate and health mix samples ...............................................................................295
Table 9.5 Variations in parameters of health mix samples incorporated with different levels of TPH .................................................................302
Table 9.6 Fatty acid profile of health mix samples .............................................304
Table 9.7 Amino acid profile of health mix samples .........................................306
Table 9.8 Mineral profile of health mix samples ................................................307
Table 9.9 Variations in different attributes of health mix samples during storage at ambient temperature (28oC) .................................321

List of Figures
Fig. 3.1 Yellowfin tuna (Thunnus albacares) .......................................................... 41
Fig. 3.2 Red and white meat of yellowfin tuna ...................................................... 41
Fig. 3.3 Tuna white meat and red meat protein hydrolysate solution ................ 42
Fig. 3.4 Protein content of white meat and red meat of yellowfin tuna and their respective hydrolysates .............................................................. 51
Fig. 3.5 Protein recovery and yield of white meat and red meat hydrolysates from yellowfin tuna ..................................................................................... 53
Fig. 3.6 Colour characteristics of white meat and red meat of yellowfin tuna............................................................................................... 55
Fig. 3.7 Colour characteristics of white meat and red meat hydrolysates from ... yellowfin tuna............................................................................................... 55
Fig. 3.8 Ultraviolet absorption spectra of protein hydrolysate from white and red meat of yellowfin tuna .......................................................................... 56
Fig. 3.9 Protein solubility of white meat and red meat hydrolysates from yellowfin tuna ..................................................................................... 58
Fig. 3.10 Foaming properties of white meat and red meat hydrolysates from yellowfin tuna............................................................................................... 59
Fig. 3.11 Emulsifying properties of white meat and red meat hydrolysates from yellowfin tuna ..................................................................................... 60
Fig. 3.12 Oil absorption capacity of white meat and red meat hydrolysates from yellowfin tuna ..................................................................................... 61
Fig. 3.13 Sensory properties of white meat and red meat hydrolysates from yellowfin tuna ..................................................................................... 62
Fig. 3.14 DPPH radical scavenging activity of white meat and red meat hydrolysates from yellowfin tuna..................................................... 64
Fig. 3.15 Reducing power of white meat and red meat hydrolysates
from yellowfin tuna ..................................................................................... 65
Fig. 3.16 FRAP of white meat and red meat hydrolysates from yellowfin tuna............................................................................................... 65
Fig. 3.17 Metal chelating ability of white meat and red meat hydrolysates from yellowfin tuna .............................................................. 66
Fig. 3.18 ABTS radical scavenging activity of white meat and red meat hydrolysates from yellowfin tuna .............................................................. 67
Fig. 4.1 Tuna red meat .............................................................................................. 72
Fig. 4.2 Tuna protein hydrolysate solutions ........................................................... 73
Fig. 4.3 Temperature optimization with a. degree of hydrolysis b. protein recovery and c. proteolytic activity as response variables .... 80
Fig. 4.4 Variations in degree of hydrolysis with a. E/S ratio and b. hydrolysis time ............................................................................................. 83
Fig. 4.5 Variations in protein recovery (%) a. in response to enzyme-substrate ratio and hydrolysis time; b. in relation to DH....... 85
Fig. 4.6 Variations in foaming capacity (%) a. in response to enzyme-substrate ratio and hydrolysis time; b. in relation to DH ...................................... 87
Fig. 4.7 Variations in foam stability (%) a. in response to enzyme-substrate ratio and hydrolysis time; b. in relation to DH ...................................... 88
Fig. 4.8 Variations in emulsifying activity index (m2/g) a. in response to enzyme-substrate ratio and hydrolysis time; b. in relation to DH....... 91
Fig. 4.9 Variations in emulsion stability index (min) a. in response to enzyme-substrate ratio and hydrolysis time; b. in relation to DH....... 92
Fig. 4.10 Variations in oil absorption capacity (g/g) a. in response to enzyme substrate ratio and hydrolysis time; b. in relation to DH ....... 94
Fig. 4.11 Variations in bitterness a. in response to enzyme-substrate ratio and hydrolysis time; b. in relation to DH ................................................ 96
Fig. 4.12 Variations in DPPH radical scavenging activity (%) a. in response to enzyme-substrate ratio and hydrolysis time; b. in relation to DH....... 98
Fig. 4.13 Variations in FRAP (mM AA/g) a. in response to enzyme-substrate ratio and hydrolysis time; b. in relation to DH ..................................................................................100
Fig. 4.14 Variations in metal chelating ability (mg EDTA/g)a. in response to enzyme-substrate ratio and hydrolysis time; b. in relation to DH.....102
Fig. 4.15 Variations in ABTS radical scavenging activity (%) a. in response to enzyme-substrate ratio and hydrolysis time; b. in relation to DH ..................................................................................104
Fig. 5.1 Variations in degree of hydrolysis with a. E/S ratio and b. hydrolysis time .............................................................................................................116
Fig. 5.2 Variations in protein recovery (%) a. in response to enzyme-substrate ratio and hydrolysis time; b. in relation to DH. ...................................118
Fig. 5.3 Variations in foaming capacity (%) a. in response to enzyme- substrate ratio and hydrolysis time; b. in relation to DH. ...................120
Fig. 5.4 Variations in foam stability (%) a. in response to enzyme-substrate ratio and hydrolysis time; b. in relation to DH ....................................121
Fig. 5.5 Variations in emulsifying activity index (m2/g) a. in response to enzyme-substrate ratio and hydrolysis time; b. in relation to DH.....123
Fig. 5.6 Variations in emulsion stability index (min) a. in response to enzyme-substrate ratio and hydrolysis time; b. in relation to DH.....124
Fig. 5.7 Variations in oil absorption capacity (g/g) a. in response to enzyme-substrate ratio and hydrolysis time; b. in relation to DH.....126
Fig. 5.8 Variations in bitterness a. in response to enzyme-substrate ratio and hydrolysis time; b. in relation to DH ..............................................128
Fig. 5.9 Variations in DPPH radical scavenging activity (%) a. in response to enzyme-substrate ratio and hydrolysis time; b. in relation to DH.....130
Fig. 5.10 Variations in FRAP (mM AA/g) a. in response to enzyme-substrate ratio and hydrolysis time; b. in relation to DH ....................................132
Fig. 5.11 Variations in reducing power a. in response to enzyme-substrate ratio and hydrolysis time; b. in relation to DH ....................................134
Fig. 5.12 Variations in ABTS radical scavenging activity (%) a. in response to enzyme-substrate ratio and hydrolysis time; b. in relation to DH.....136
Fig. 6.1 Molecular weight cut-off devices ............................................................143
Fig. 6.2 Amino acid analyser .................................................................................144
Fig. 6.3 Inductivity Coupled Plasma–Optical Emission Spectrometer............146
Fig. 6.4 SEM image of tuna protein hydrolysates ................................................165
Fig. 6.5 DSC curve of tuna protein hydrolysates .................................................167
Fig. 6.6 FTIR spectra of tuna protein hydrolysates .............................................169
Fig. 6.7 Colour of tuna protein hydrolysates .......................................................172
Fig. 6.8 Variations in foaming properties of functional tuna protein hydrolysate .................................................................................................174
Fig. 6.9 Variations in emulsifying properties of functional tuna protein hydrolysate .................................................................................................175
Fig. 6.10 Variations in DPPH radical scavenging activity of antioxidant tuna protein hydrolysate at different pH .........................................................177
Fig. 6.11 Variations in ABTS radical scavenging activity of antioxidant tuna protein hydrolysate at different pH .........................................................177
Fig. 6.12 Variations in DPPH radical scavenging activity of antioxidant tuna protein hydrolysate at different temperature .........................................179
Fig. 6.13 Variations in ABTS radical scavenging activity of antioxidant tuna protein hydrolysate at different temperature .........................................179
Fig. 6.14 Variations in foaming properties of functional tuna protein hydrolysate at different concentration ....................................................181
Fig. 6.15 Variations in emulsifying properties of functional tuna protein hydrolysate at different concentration ....................................................181
Fig. 6.16 Variations in DPPH radical scavenging activity of antioxidant tuna protein hydrolysate at different concentration .............................183
Fig. 6.17 Variations in ABTS radical scavenging activity of antioxidant tuna protein hydrolysate at different concentration .............................183
Fig. 6.18 Variations in moisture content of optimized tuna protein hydrolysates a. FTPH; b. ATPH at ambient (28oC) and chilled conditions (4oC) ...........................................................................185
Fig. 6.19 Variations in pH of optimized tuna protein hydrolysates a. FTPH; b. ATPH at ambient (28oC) and chilled conditions (4oC) ...186
Fig. 6.20 Variations in lightness of optimized tuna protein hydrolysates a. FTPH; b. ATPH at ambient (28oC) and chilled conditions (4oC) ..188
Fig. 6.21 Variations in redness/greenness of optimized tuna protein hydrolysates a. FTPH; b. ATPH at ambient (28oC) and chilled conditions (4oC) ..189
Fig. 6.22 Variations in yellowness of optimized tuna protein hydrolysates a. FTPH; b. ATPH at ambient (28oC) and chilled conditions (4oC) ..190
Fig. 6.23 Variations in protein solubility of optimized tuna protein hydrolysates a. FTPH; b. ATPH at ambient (28oC) and chilled conditions (4oC) ..191
Fig. 6.24 Variations in TBARS of optimized tuna protein hydrolysates a. FTPH; b. ATPH at ambient (28oC) and chilled conditions (4oC) ..193
Fig. 6.25 Variations in TMA-N of optimized tuna protein hydrolysates a. FTPH; b. ATPH at ambient (28oC) and chilled conditions (4oC) ..195
Fig. 6.26 Variations in sensory indices of optimized tuna protein hydrolysates a. FTPH; b. ATPH at ambient (28oC) and chilled conditions (4oC) ..196
Fig. 6.27 Variations in total plate count of optimized tuna protein hydrolysates a. FTPH; b. ATPH at ambient (28oC) and chilled conditions (4oC) ..197
Fig. 6.28 Typical flow diagram for enzymatic hydrolysis of fish protein ...........203
Fig. 6.29 Pilot scale production of optimized tuna protein hydrolysate ............204
Fig. 7.1 Mayonnaise samples .................................................................................212
Fig. 7.2 Inverted microscope .................................................................................213
Fig. 7.3 Particle size analyser .................................................................................214
Fig. 7.4 Controlled-Stress Rheometer ..................................................................215
Fig. 7.5 Viscometer .................................................................................................216
Fig. 7.6 Inverted microscopic image of a. Control mayonnaise b. Fortified mayonnaise.................................................................................................221
Fig. 7.7 Particle size distribution of a. Control mayonnaise b. Fortified mayonnaise.................................................................................................223
Fig. 7.8 Frequency sweep curve of mayonnaise samples ...................................225
Fig. 7.9 Strain sweep curve of mayonnaise samples ...........................................226
Fig. 7.10 Damping factor curve of mayonnaise samples ......................................227
Fig. 7.11 Flow properties of mayonnaise samples .................................................228
Fig. 7.12 Shear stress-rate curve of mayonnaise samples .....................................230
Fig. 7.13 Temperature sweep of mayonnaise samples ..........................................231
Fig. 7.14 Variations in pH of mayonnaise samples during storage at 4oC .........232
Fig. 7.15 Variations in emulsion stability index of mayonnaise samples during storage at 4oC .............................................................................................233
Fig. 7.16 Variations in viscosity of mayonnaise samples during storage at 4oC .................................................................................234
Fig. 7.17 Variations in free fatty acid of mayonnaise samples during storage at 4oC .................................................................................235
Fig. 7.18 Variations in peroxide value of mayonnaise samples during storage at 4oC .................................................................................236
Fig. 7.19 Variations in sensory score of mayonnaise samples during storage at 4oC .................................................................................237
Fig. 7.20 Variations in microbiological indices of mayonnaise samples during storage at 4oC .............................................................................................238
Fig. 8.1 Gas chromatograph ...................................................................................245
Fig. 8.2 Scanning electron microscope .................................................................247
Fig. 8.3 Differential scanning colorimeter ...........................................................247
Fig. 8.4 Fourier-transform infrared spectroscope ..............................................248
Fig. 8.5 Hunterlab colorimeter ..............................................................................249
Fig. 8.6 SEM images of sardine oil encapsulates .................................................256
Fig. 8.7 Thermal characteristics of sardine oil and sardine oil encapsulates ..258
Fig. 8.8 Infra-red spectral characteristics of sardine oil encapsulates .............261
Fig. 8.9 Cumulative oil release pattern of fish oil encapsulates in simulated gastro-intestinal conditions ...................................................266
Fig. 8.10 Variations in peroxide value of sardine oil and sardine oil encapsulates at a.accelerated, b.ambient and c.chilled storage conditions ...............268
Fig. 8.11 Variations in TBARS of sardine oil and sardine oilencapsulates at a. accelerated, b. ambient and c. chilled storage conditions ................270
Fig. 8.12 Variations in colour indices of sardine oil during a. accelerated (60oC), b. ambient (28 oC) and c. chilled storage (4oC) .....................................273
Fig. 8.13 Variations in colour indices viz., a. lightness; b. redness; c. yellowness of sardine oil encapsulates during accelerated storage (60oC) ............274
Fig. 8.14 Variations in colour indices viz., a. lightness; b. redness; c. yellowness of sardine oil encapsulates during ambient storage (28 oC) .................275
Fig. 8.15 Variations in colour indices viz., a. lightness; b. redness; c. yellowness of sardine oil encapsulates during chilled storage (4oC) ......................276
Fig. 8.16 Product acceptability score studies .........................................................280
Fig. 9.1 Different formulations of base mix .........................................................287
Fig. 9.2 Health mix samples ...................................................................................289
Fig. 9.3 Variations in colour attributes viz., a. lightness; b. redness; c.yellowness of health mix samples incorporated with different levels of TPH ......296
Fig. 9.4 Variations in foaming properties of health mix samples incorporated with different levels of TPH .....................................................................297
Fig. 9.5 Variations in emulsifying properties of health mix samples incorporated with different levels of TPH .............................................298
Fig. 9.6 Variations in oil absorption capacity of health mix samples incorporated with different levels of TPH .............................................298
Fig. 9.7 Variations in DPPH radical scavenging activity of health mix samples incorporated with different levels of TPH .............................................299
Fig. 9.8 Variations in FRAP of health mix samples incorporated with different levels of TPH ..............................................................................................300
Fig. 9.9 Variations in sensory attributes of health mix samples incorporated with different levels of TPH .....................................................................301
Fig. 9.10 Bulk, tapped and particle densities of health mix samples ..................308
Fig. 9.11 Porosity of health mix samples ................................................................309
Fig. 9.12 Flowability and cohesiveness of health mix samples ............................310
Fig. 9.13 Wettability of health mix samples ...........................................................311
Fig. 9.14 Dispersibility of health mix samples .......................................................312
Fig. 9.15 In vitro digestibility and stability of health mix samples .....................313
Fig. 9.16 Variations in moisture content of health mix samples during storage at ambient temperature ..................................................314
Fig. 9.17 Variations in pH of health mix samples during storage at ambient temperature .................................................315
Fig. 9.18 Variations in peroxide value of health mix samples during storage at ambient temperature ..................................................316
Fig. 9.19 Variations in free fatty acid of health mix samples during storage at ambient temperature ..................................................317
Fig. 9.20 Variations in TMA-N of health mix samples during storage at ambient temperature ..................................................318
Fig. 9.21 Variations in TVBN of health mix samples during storage at ambient temperature ..................................................318
Fig. 9.22 Variations in sensory attributes of health mix samples during storage at ambient temperature ..................................................319
Fig. 9.23 Variations in microbiological attributes of health mix samples during storage at ambient temperature ..................................................320
1Optimization of process parameters for enzymatic hydrolysis of tuna red meat protein
Introduction
Chapter 1 Introduction
Nutritional insecurity is a major problem faced by the modern society and in
this context marine resource is considered as a safe source of nutrition that
provides rich amounts of protein having good pattern of essential amino acids. A
major share of the marine biomass is being discarded as byproduct with low market
realization. Awareness about the potential recovery of nutrients from fish waste
has created increased interest in exploiting these resources. Tuna resources, which
includes tuna (Thunnus spp.) as well as tuna-like species are significant sources of
food and hence play a vital role in the economy of many countries. More than about
48 species of tuna are widely distributed in the Atlantic, Indian, Pacific oceans and
the Mediterranean sea. The two major products that drive tuna production are the
traditional thermally processed delicacies and sashimi/sushi. These commodities
exhibit relevant differences with regard to the species utilized, quality requirements
as well as production systems. Canning industry preferably demands light meat
species like skipjack and yellowfin, while in the sushi and sashimi market, the fatty
ones like bluefin and other red meat species like bigeye are preferred.This widespread
economic significance of tuna and their contribution to international trade has made
tuna waste of particular interest to upgrade. Tuna market mainly utilizes the white
meat during canning operations thus resulting in the under utilization of protein rich
by-products viz., red meat, head, skin, trimmings, viscera etc. that are discarded
without recovery attempts and accounts for about 50–70 % of biomass (Guerard et
2 Optimization of process parameters for enzymatic hydrolysis of tuna red meat protein
Chapter 1
al., 2002; Chalamaiah et al., 2012; Saidi et al., 2014). Reports by Sutanbawa and
Aknes (2006), revealed an estimate of 4,50,000 tons per year of processing discards
globally from the tuna canning industry. Of these, 10-12 % is the dark or red meat
portion which has nutrients especially proteins, of high quality comparable to that
of the white meat (Nishioka et al., 2007). Currently, the red meat generated during
tuna canning operations is usually discarded as waste or is converted to low value
by-products like animal feed, fertilizers etc with negligible market value (Herpandi
et al., 2011). Hence utilization of these dark meat proteins is a serious matter to
be addressed on account of the limited food resources, for meeting the nutritional
security and increasing environmental pollution issues.
Seafood proteins, on account of its structural diversification as well as
nutritional, functional, and biological properties, can be effectively exploited for
their recovery to different forms viz., concentrates, isolates, hydrolysates, protein
fractions like collagen, gelatin etc. In this regard, these protein rich fish processing
discards could be enzymatically converted into its hydrolysates, facilitating its
effective utilization. Protein hydrolysates are the breakdown products of proteins
viz., smaller peptide chains with 2-20 amino acids obtained by hydrolysis either
chemically or enzymatically. This process facilitates recovery of essential
nutrients viz.,amino acids as well as has immense scope in food, nutraceutical and
pharmaceutical industry on account of the excellent physicochemical, functional
as well as bioactive properties they possess (He et al., 2013; Halim et al., 2016).
Based on the extent of hydrolysis that the parent protein undergoes, the properties
exhibited by the hydrolysates vary considerably.
One of the major characteristics of protein hydrolysates is the functional
properties, which are those physicochemical properties that affect the behaviour of
proteins in food systems during storage, processing, preparation and consumption
3Optimization of process parameters for enzymatic hydrolysis of tuna red meat protein
Introduction
(Kinsella, 1982; Hall and Ahmad, 1992; Phillips et al., 1994). These characteristics
influence the quality and organoleptic attributes in food and hence are important
particularly if they are used as ingredients in food products. Functional properties
are related to protein structure viz., the sequence and composition of amino acids,
molecular weights, conformation and the net charge distributed on the molecule
(Damodaran, 1996; Casarin et al., 2008). Hydrolysis of proteins generates a
mixture of free amino acids, di-, tri- and oligopeptides, increasing the number of
polar groups and hydrolysate solubilities thereby modifying the functionalities
and bioavailability (Adler-Nissen, 1986; Kristinsson and Rasco, 2000). Functional
properties are important when the fish protein hydrolysates interact with other
components of food such as oil and water. Reports suggest that fish protein
hydrolysates (FPH) showed enhanced functional properties, in comparison with the
parent protein, or other commercial food-grade products having the same function
(Elavarasan, 2014). The important functional properties of FPH include solubility,
emulsifying properties, foaming properties and fat absorption capacity (Motoki and
Kumazawa, 2000).
Lipid oxidation is of great concern to the food industry and consumers,
as it leads to the development of undesirable off-flavors, off-odors, dark colors,
taste deterioration and formation of potentially toxic reaction products (Noguchi
and Niki, 1999; Lin and Liang, 2002; Niki, 2010; Lin et al., 2010). Furthermore
diseases like cancer, coronary heart problems and Alzheimer’s are also reported to
be caused partially by oxidation or free radical reactions in the body (Diaz et al.,
1997; Bougatef et al., 2010; Ngo et al., 2010). Lipid oxidation in food products can
be controlled by reducing metal ions and minimizing exposure to light and oxygen
using appropriate packaging methods as well as by incorporation of antioxidants.
Antioxidants are substances used to prolong the shelf life and maintain the nutritional
4 Optimization of process parameters for enzymatic hydrolysis of tuna red meat protein
Chapter 1
quality of lipid-containing foods (Rajaram and Nazeer, 2010). They also assist to
modulate the consequences of oxidative damage in the human body (Munoz et al.,
2010). Many synthetic antioxidants such as BHT, BHA, TBHQ and propyl gallate
(PG) are used in the food and pharmaceutical industries to retard lipid oxidation
(Bernardini et al., 2016). However the use of synthetic antioxidants result in
potential health issues (Byun et al., 2009; Bougatef et al., 2010) and hence there is
growing interest to identify alternative natural and safe sources of food antioxidants
for replacing these synthetic ones (Sarmadi and Ismail, 2010; Bernardini et al.,
2016). Fish protein hydrolysate is well established for its antioxidant properties on
account for the bioactive peptides they possess. They usually vary from 2-20 amino
acid residues with the molecular mass of less than 6000 Da (Jun et al., 2004; Wang
et al., 2008; Bougatef et al., 2010). These peptides are inactive within the sequence
of parent protein and are released upon enzymatic cleavage.
Fish protein hydrolysates have potential application as functional ingredients
in different foods on account of the numerous important and unique properties
that they possess viz., functional as well as bioactive properties (Chalamaiah et
al., 2010). They are also a source of specific amino acids for dietic formulations
(Sumaya-Martinez et al., 2005) which are easily absorbed and utilized for various
metabolic activities (Nesse et al., 2011). They have been successfully tested as
emulsifiers, foaming agents, dispersants, antioxidants etc. for incorporation into
different food systems such as cereal products, fish and meat products, desserts and
crackers for providing desirable characteristics to the product as well as to improve
their storage stability (Yu and Tan, 1990; Kristinsson and Rasco, 2000; Pacheco-
Aguilar et al., 2008; Zhang et al., 2013). Hence with increasing knowledge of these
advantages of fish protein hydrolysates, more researches are being focused on the
development of fish-derived functional and nutraceutical foods.
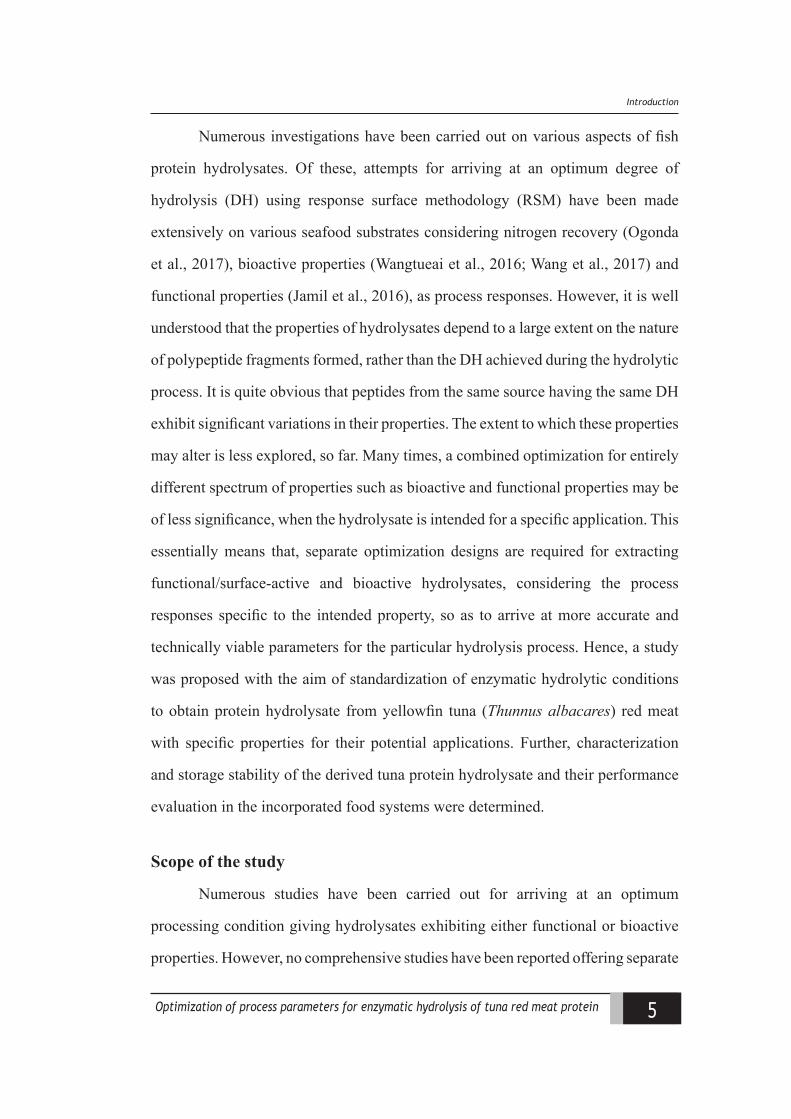
5Optimization of process parameters for enzymatic hydrolysis of tuna red meat protein
Introduction
Numerous investigations have been carried out on various aspects of fish
protein hydrolysates. Of these, attempts for arriving at an optimum degree of
hydrolysis (DH) using response surface methodology (RSM) have been made
extensively on various seafood substrates considering nitrogen recovery (Ogonda
et al., 2017), bioactive properties (Wangtueai et al., 2016; Wang et al., 2017) and
functional properties (Jamil et al., 2016), as process responses. However, it is well
understood that the properties of hydrolysates depend to a large extent on the nature
of polypeptide fragments formed, rather than the DH achieved during the hydrolytic
process. It is quite obvious that peptides from the same source having the same DH
exhibit significant variations in their properties. The extent to which these properties
may alter is less explored, so far. Many times, a combined optimization for entirely
different spectrum of properties such as bioactive and functional properties may be
of less significance, when the hydrolysate is intended for a specific application. This
essentially means that, separate optimization designs are required for extracting
functional/surface-active and bioactive hydrolysates, considering the process
responses specific to the intended property, so as to arrive at more accurate and
technically viable parameters for the particular hydrolysis process. Hence, a study
was proposed with the aim of standardization of enzymatic hydrolytic conditions
to obtain protein hydrolysate from yellowfin tuna (Thunnus albacares) red meat
with specific properties for their potential applications. Further, characterization
and storage stability of the derived tuna protein hydrolysate and their performance
evaluation in the incorporated food systems were determined.
Scope of the study
Numerous studies have been carried out for arriving at an optimum
processing condition giving hydrolysates exhibiting either functional or bioactive
properties. However, no comprehensive studies have been reported offering separate
6 Optimization of process parameters for enzymatic hydrolysis of tuna red meat protein
Chapter 1
sets of optimised process parameters for the same substrate yielding hydrolysates
with either functional or antioxidative properties. Hence, the current investigation
was intended towards optimizing the effect of hydrolysis variables viz.,enzyme-
substrate ratio (E/S) and hydrolysis duration, using appropriate statistical tools, for
separate extraction of functional/surface-active and antioxidant rich hydrolysates
from the cannery waste; cooked meat of yellowfin tuna red meat with thrust to
maximum protein recovery. Moreover, a variability range of degree of hydrolysis
values with respect to individual properties exhibited by hydrolysates under each
hydrolytic condition was derived by statistical means. Further, these derived
peptides were comprehensively characterized, assessed for its storage stability,
economic feasibility and their performance evaluation in different selected food
systems were determined.
7Optimization of process parameters for enzymatic hydrolysis of tuna red meat protein
Introduction
Objectives
Optimization of enzymatic hydrolytic conditions of fish protein for their
functional applications and nutraceutical applications using appropriate
statistical tool.
Characterization of the optimized fish protein hydrolysates for its functional
and bioactive properties.
Evaluation of storage stability and economic feasibility of the optimized
fish protein hydrolysates.
Assessment of the optimized fish protein hydrolysate incorporated food
systems for their functional performance and bioactive properties.

8 Optimization of process parameters for enzymatic hydrolysis of tuna red meat protein
Chapter 1
9Optimization of process parameters for enzymatic hydrolysis of tuna red meat protein
Review of Literature
Chapter 2 Review of Literature
2.1 Tuna red meat as a source of protein
Over the past few years, utilization of fish wastes has been of increasing
interest on account of the superior quality as well as safety aspects. This biomass
provides proteins with high nutritional properties and a good pattern of essential
amino acids. Tuna and tuna products are extensively utilized in many parts of the
world on account of their delicacy as well as nutritional properties viz., richness in
proteins. Moreover, the tuna waste constitutes a biomass of particular interest to
upgrade because of their global economic importance and their international trade
for canning. As only the white meat of tuna is used in canning or sashimi, the
tuna industry generates a large amount of waste or by-products. The solid wastes
generated from the processing industry constitute as much as 70 % of the original
material of which dark tuna muscle accounts for about 12 % of raw tuna butchered
for canning (Guerard et al., 2002; Chalamaiah et al., 2012; Saidi et al., 2014).
Fish processing discards including tuna wastes are commonly considered as
low-value resources with negligible market value (Arvanitoyannis and Kassaveti,
2008) and are currently used to produce fish oil, fishmeal, fertilizer, pet food, and fish
silage (Kim and Mendis, 2006; Herpandi et al., 2011). However, the recognition of
limited biological resources and increasing environmental pollution has emphasized
the need for better utilization of these by-products.
10 Optimization of process parameters for enzymatic hydrolysis of tuna red meat protein
Chapter 2
Several authors (Plascencia et al., 2002; Kim and Mendis, 2006; Nishioka
et al., 2007) have reported that similar to fish meat, their wastes are also valuable
sources of compounds such as proteins, lipids, minerals etc. Characterization of the
chemical composition of the discarded waste from many fish species showed that the
protein content is generally over 50 % on dry weight basis (Bechtel, 2003; Sathivel et
al., 2003). Kim and Mendis (2006) reported a number of bioactive compounds from
fish by-product proteins. These by-products are very important bio-resources that
can be utilized for applications in food, health-care products, and pharmaceuticals
or as specialty feeds for fish and other animals. Proper utilization of these protein
rich fish processing discards could be achieved by enzymatic conversion of these
sources into protein hydrolysates which has immense application scope in food and
pharmaceutical areas (Chalamaiah et al., 2012; He et al., 2013).
2.2 Fish protein hydrolysate
The benefits of hydrolyzing food proteins to make functional protein
ingredients and nutritional supplements are a more recent technology, with the first
commercially available protein hydrolysates appearing only around the late 1940s.
Protein hydrolysate is defined as proteins that are broken down into peptides of
various sizes either chemically (using acids or bases) or biologically (using enzymes)
(Rustad, 2003; Pasupuleti and Braun, 2010). Fish protein hydrolysates (FPH)
possess many desirable properties such as health promoting bioactivities, making
them eligible ingredients in nutraceuticals and functional foods (Kristinsson, 2007;
Harnedy and FitzGerald, 2012).Use of different fish species/ substrate, proteolytic
enzymes and adequate control of the process parameters such as temperature,
pH, time and enzyme-substrate ratio facilitate the optimized production of FPH
with desirable molecular structures and bioactive properties with therapeutic or
nutritional interest (Guerard et al., 2002; Chabeaud et al., 2009).
11Optimization of process parameters for enzymatic hydrolysis of tuna red meat protein
Review of Literature
2.3 Enzymatic hydrolysis
Enzymatic hydrolysis is the most promising one compared to other processes
as it results in products with high functionality and organoleptic characteristics of
the food in relation to its nutritive value and intestinal absorption characteristics
(Kristinsson and Rasco, 2000; Yoshie-Stark et al., 2006; Pasupuleti and Braun,
2010; Wisuthiphaet et al., 2015). This method also requires relatively small amount
of enzymes that can be easily deactivated and mild conditions of hydrolysis.
Moreover, the use of enzymes does not destroy amino acids and resulting mixtures
of peptides can be purified easily (Herpandi et al., 2011). An added benefit of the
use of enzymes particularly proteolytic enzymes is their ability to increase protein
recovery and also aid in deriving bioactive compounds from complex raw materials
(Rubio-Rodriguez et al., 2010). The enzymatic hydrolysis of fish muscle proteins
is characterized by an initial rapid phase, during which a large number of peptide
bonds are hydrolysed, and further the rate of enzymatic hydrolysis decreases and
reaches a stationary phase where no apparent hydrolysis takes place (Shahidi et al.,
1995; Ren et al., 2008a). This rate change is associated with enzyme inactivation,
hydrolysis product inhibition, low Km value of soluble peptides that act as effective
substrate competitors to the unhydrolysed fish protein, and possibly auto digestion
of the enzyme.
Several proteolytic enzymes can be used for the hydrolysis of fish processing
waste (Simpson et al.,1989). A wide variety of proteolytic enzymes are commercially
available from animal, plant and microbial sources. The most commonly used
enzymes for protein hydrolysates from animal sources are pancreatin, trypsin and
pepsin; plant sources are papain and bromelain and from fermentation sources are
bacterial and fungal proteases (Pasupuleti and Braun, 2010; Hou et al., 2017). The
general application criterion for these enzymes is that they should be of food grade
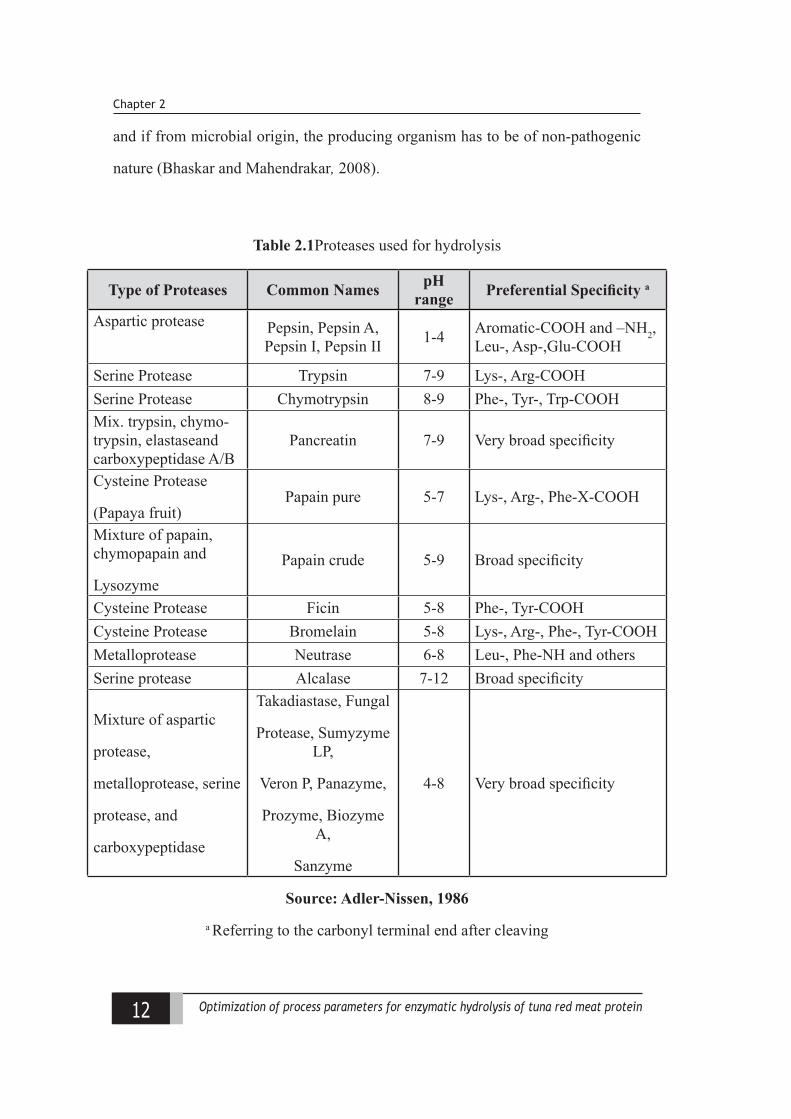
12 Optimization of process parameters for enzymatic hydrolysis of tuna red meat protein
Chapter 2
and if from microbial origin, the producing organism has to be of non-pathogenic
nature (Bhaskar and Mahendrakar, 2008).
Table 2.1Proteases used for hydrolysis
Type of Proteases Common Names pH range Preferential Specificity a
Aspartic protease Pepsin, Pepsin A, Pepsin I, Pepsin II 1-4 Aromatic-COOH and –NH2,
Leu-, Asp-,Glu-COOH
Serine Protease Trypsin 7-9 Lys-, Arg-COOHSerine Protease Chymotrypsin 8-9 Phe-, Tyr-, Trp-COOHMix. trypsin, chymo-trypsin, elastaseand carboxypeptidase A/B
Pancreatin 7-9 Very broad specificity
Cysteine Protease
(Papaya fruit)Papain pure 5-7 Lys-, Arg-, Phe-X-COOH
Mixture of papain, chymopapain and
LysozymePapain crude 5-9 Broad specificity
Cysteine Protease Ficin 5-8 Phe-, Tyr-COOHCysteine Protease Bromelain 5-8 Lys-, Arg-, Phe-, Tyr-COOHMetalloprotease Neutrase 6-8 Leu-, Phe-NH and othersSerine protease Alcalase 7-12 Broad specificity
Mixture of aspartic
protease,
metalloprotease, serine
protease, and
carboxypeptidase
Takadiastase, Fungal
Protease, Sumyzyme LP,
Veron P, Panazyme,
Prozyme, Biozyme A,
Sanzyme
4-8 Very broad specificity
Source: Adler-Nissen, 1986
a Referring to the carbonyl terminal end after cleaving
13Optimization of process parameters for enzymatic hydrolysis of tuna red meat protein
Review of Literature
Among the different proteases, papain is one of the most common enzymes of
choice (Hoyle and Merritt, 1994; Shahidi et al., 1995; Wisuthiphaet et al., 2015) due
to its low cost, easy availability, optimum activity at near neutral pH and outstanding
value for liberating several B-vitamins from their bound forms. Papain is a cysteine
protease extracted from latex of papaya (Carica papaya). It is an endoprotease with
a single polypeptide of 212 amino acids with a molecular weight of 23,350 Daltons
(Kristinsson, 2006). It comprises of three disulfide bond and is heat stable at neutral
pH (Konno et al., 2004). The optimum pH for papain (including crude papain) is
5.0-9.0 and is stable up to 80 °C in presence of substrates. The use of papain is more
extensive in the brewing industry (75 % of the papain production) followed by meat
(10 %), fish (5 %) and others (11 %) (Kim et al., 2004).
2.4 Factors influencing enzymatic hydrolysis
Enzymatic hydrolysis of proteins is influenced by various factors such
as the protein source, the type of enzyme used, the physicochemical conditions
of the reaction media including enzyme / substrate ratio, time, temperature,
and pH (Ren et al., 2008a; Benjakul et al., 2010; He et al., 2012). Generally the
substrate preferred as protein source for hydrolysate preparation should be of lean
variety with minimum fat content. Use of fatty fishes for FPH calls for additional
treatments to remove excess fat (Ritchie and Mackie, 1982) and hence increases
the cost of production. The type of enzyme used in enzymatic protein hydrolysis
is very important because it dictates the cleavage patterns of the peptide bonds
(Shahidi and Zhong, 2008). Proteases from different sources viz., animal, plant,
and microbial are commonly used to obtain a more selective hydrolysis as they
are specific for peptide bonds adjacent to certain amino acid residues (Korhonen
and Pihlanto, 2003). The physicochemical condition of the reaction determines the
degree of hydrolysis as well as the molecular weight of the peptides which are
contributors to the bioactive property exhibited by the peptides (Ren et al., 2008b)
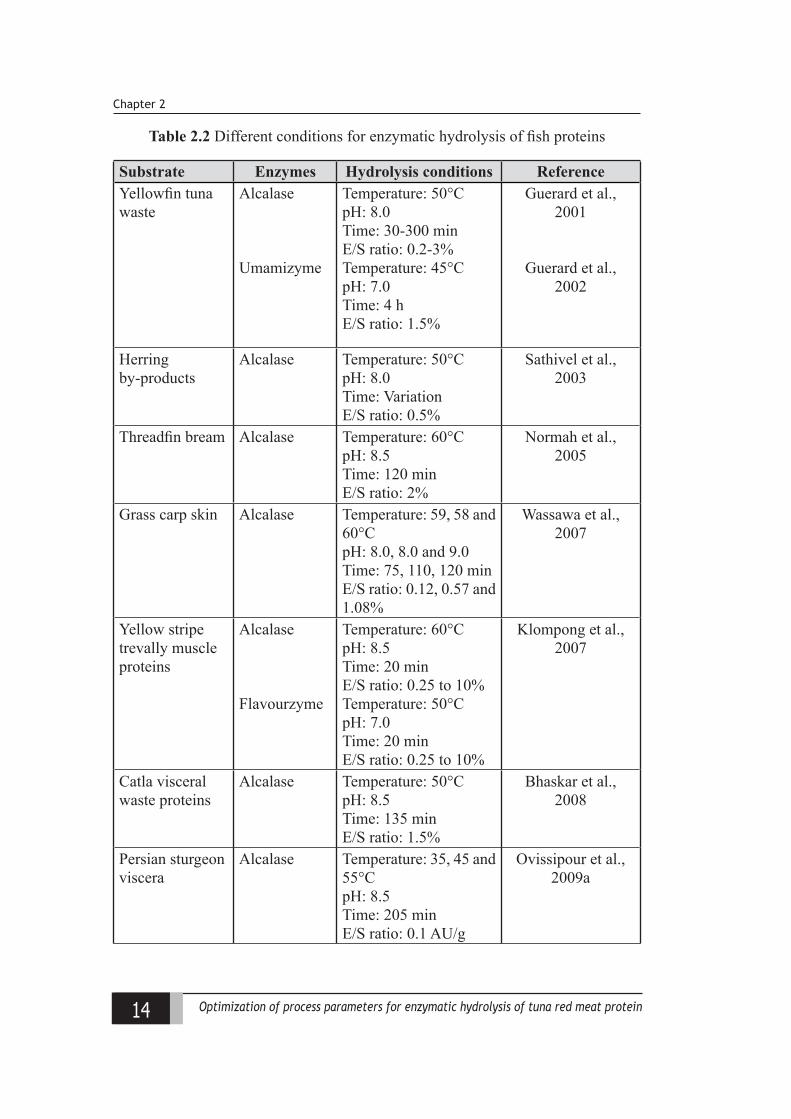
14 Optimization of process parameters for enzymatic hydrolysis of tuna red meat protein
Chapter 2
Table 2.2 Different conditions for enzymatic hydrolysis of fish proteins
Substrate Enzymes Hydrolysis conditions ReferenceYellowfin tuna waste
Alcalase
Umamizyme
Temperature: 50°CpH: 8.0Time: 30-300 minE/S ratio: 0.2-3%Temperature: 45°CpH: 7.0Time: 4 hE/S ratio: 1.5%
Guerard et al., 2001
Guerard et al., 2002
Herring by-products
Alcalase Temperature: 50°CpH: 8.0Time: VariationE/S ratio: 0.5%
Sathivel et al., 2003
Threadfin bream Alcalase Temperature: 60°CpH: 8.5Time: 120 minE/S ratio: 2%
Normah et al., 2005
Grass carp skin Alcalase Temperature: 59, 58 and 60°CpH: 8.0, 8.0 and 9.0Time: 75, 110, 120 minE/S ratio: 0.12, 0.57 and 1.08%
Wassawa et al., 2007
Yellow stripe trevally muscle proteins
Alcalase
Flavourzyme
Temperature: 60°CpH: 8.5Time: 20 minE/S ratio: 0.25 to 10%Temperature: 50°CpH: 7.0Time: 20 minE/S ratio: 0.25 to 10%
Klompong et al., 2007
Catla visceral waste proteins
Alcalase Temperature: 50°CpH: 8.5Time: 135 minE/S ratio: 1.5%
Bhaskar et al., 2008
Persian sturgeon viscera
Alcalase Temperature: 35, 45 and 55°CpH: 8.5Time: 205 minE/S ratio: 0.1 AU/g
Ovissipour et al., 2009a
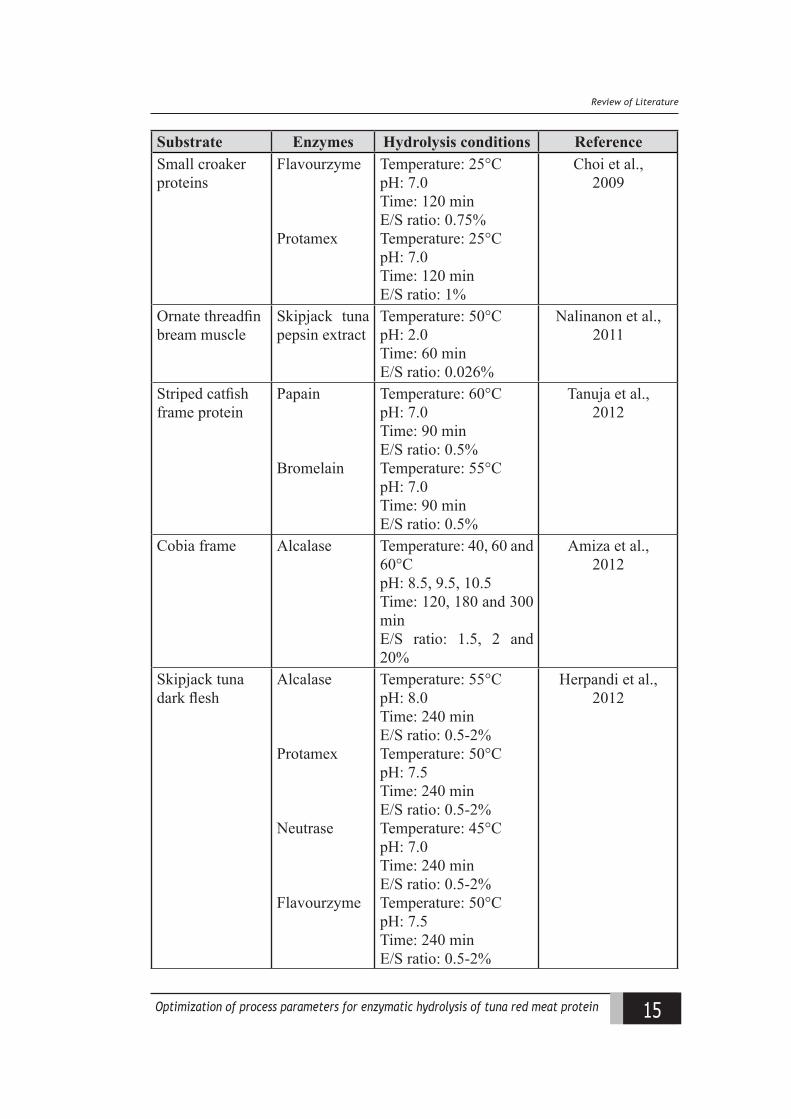
15Optimization of process parameters for enzymatic hydrolysis of tuna red meat protein
Review of Literature
Substrate Enzymes Hydrolysis conditions ReferenceSmall croaker proteins
Flavourzyme
Protamex
Temperature: 25°CpH: 7.0Time: 120 minE/S ratio: 0.75%Temperature: 25°CpH: 7.0Time: 120 minE/S ratio: 1%
Choi et al., 2009
Ornate threadfin bream muscle
Skipjack tuna pepsin extract
Temperature: 50°CpH: 2.0Time: 60 minE/S ratio: 0.026%
Nalinanon et al., 2011
Striped catfish frame protein
Papain
Bromelain
Temperature: 60°CpH: 7.0Time: 90 minE/S ratio: 0.5%Temperature: 55°CpH: 7.0Time: 90 minE/S ratio: 0.5%
Tanuja et al., 2012
Cobia frame Alcalase Temperature: 40, 60 and 60°CpH: 8.5, 9.5, 10.5Time: 120, 180 and 300 minE/S ratio: 1.5, 2 and 20%
Amiza et al., 2012
Skipjack tuna dark flesh
Alcalase
Protamex
Neutrase
Flavourzyme
Temperature: 55°CpH: 8.0Time: 240 minE/S ratio: 0.5-2%Temperature: 50°CpH: 7.5Time: 240 minE/S ratio: 0.5-2%Temperature: 45°CpH: 7.0Time: 240 minE/S ratio: 0.5-2%Temperature: 50°CpH: 7.5Time: 240 minE/S ratio: 0.5-2%
Herpandi et al., 2012
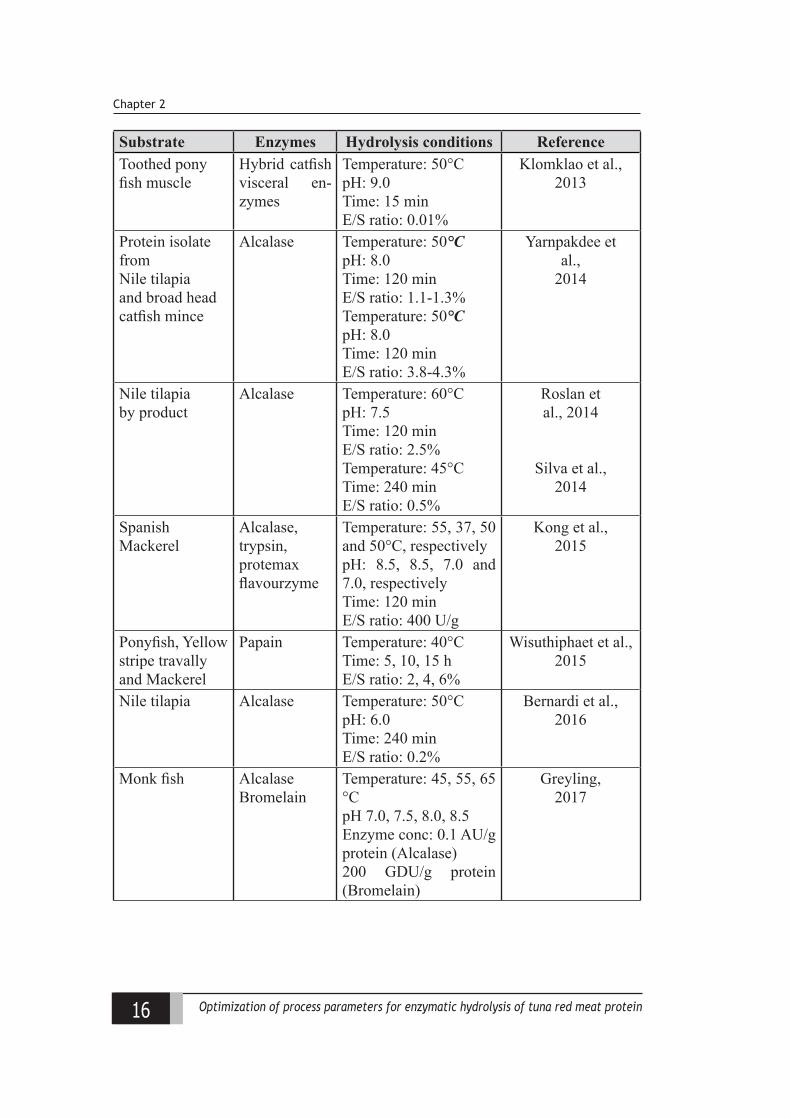
16 Optimization of process parameters for enzymatic hydrolysis of tuna red meat protein
Chapter 2
Substrate Enzymes Hydrolysis conditions ReferenceToothed pony fish muscle
Hybrid catfish visceral en-zymes
Temperature: 50°CpH: 9.0Time: 15 minE/S ratio: 0.01%
Klomklao et al., 2013
Protein isolate fromNile tilapiaand broad head catfish mince
Alcalase Temperature: 50°CpH: 8.0Time: 120 minE/S ratio: 1.1-1.3%Temperature: 50°CpH: 8.0Time: 120 minE/S ratio: 3.8-4.3%
Yarnpakdee etal.,
2014
Nile tilapia by product
Alcalase Temperature: 60°CpH: 7.5Time: 120 minE/S ratio: 2.5%Temperature: 45°CTime: 240 minE/S ratio: 0.5%
Roslan etal., 2014
Silva et al., 2014
Spanish Mackerel
Alcalase,trypsin, protemax flavourzyme
Temperature: 55, 37, 50 and 50°C, respectivelypH: 8.5, 8.5, 7.0 and 7.0, respectivelyTime: 120 minE/S ratio: 400 U/g
Kong et al., 2015
Ponyfish, Yellow stripe travallyand Mackerel
Papain Temperature: 40°CTime: 5, 10, 15 hE/S ratio: 2, 4, 6%
Wisuthiphaet et al., 2015
Nile tilapia Alcalase Temperature: 50°CpH: 6.0Time: 240 minE/S ratio: 0.2%
Bernardi et al., 2016
Monk fish AlcalaseBromelain
Temperature: 45, 55, 65 °CpH 7.0, 7.5, 8.0, 8.5Enzyme conc: 0.1 AU/g protein (Alcalase)200 GDU/g protein (Bromelain)
Greyling, 2017
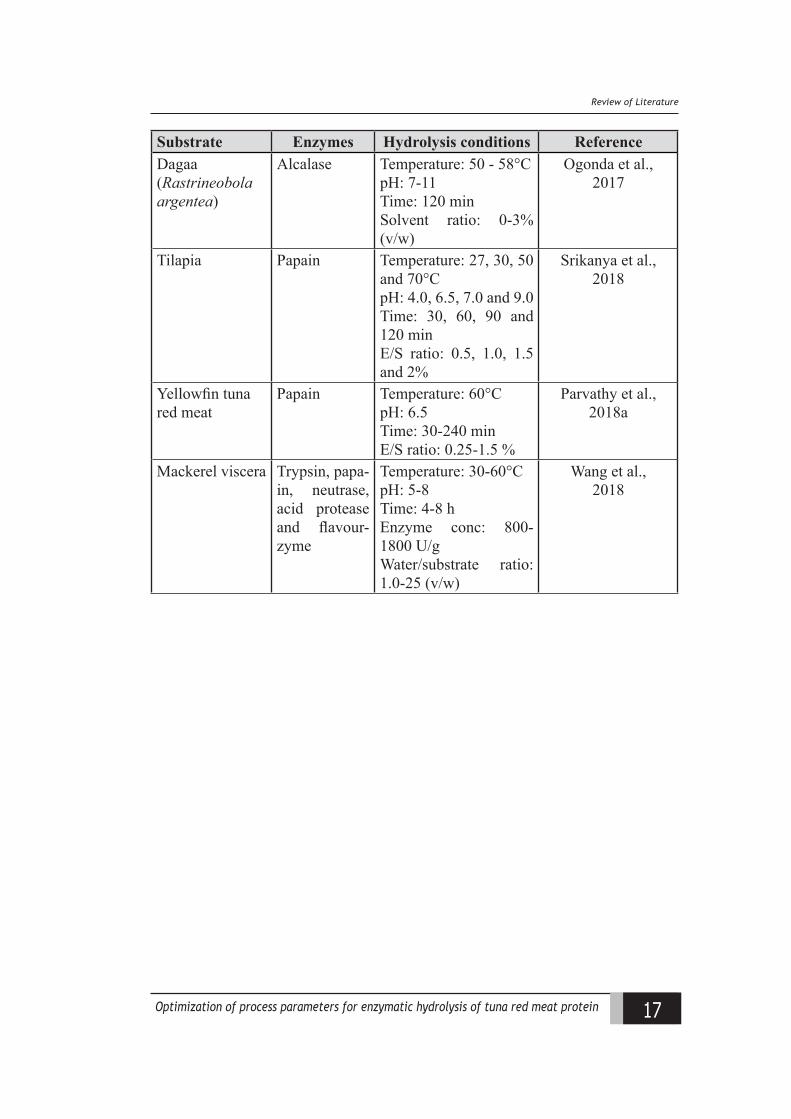
17Optimization of process parameters for enzymatic hydrolysis of tuna red meat protein
Review of Literature
Substrate Enzymes Hydrolysis conditions ReferenceDagaa (Rastrineobola argentea)
Alcalase Temperature: 50 - 58°CpH: 7-11Time: 120 minSolvent ratio: 0-3% (v/w)
Ogonda et al., 2017
Tilapia Papain Temperature: 27, 30, 50 and 70°C pH: 4.0, 6.5, 7.0 and 9.0Time: 30, 60, 90 and 120 minE/S ratio: 0.5, 1.0, 1.5 and 2%
Srikanya et al., 2018
Yellowfin tuna red meat
Papain Temperature: 60°CpH: 6.5Time: 30-240 minE/S ratio: 0.25-1.5 %
Parvathy et al., 2018a
Mackerel viscera Trypsin, papa-in, neutrase, acid protease and flavour-zyme
Temperature: 30-60°CpH: 5-8Time: 4-8 hEnzyme conc: 800-1800 U/gWater/substrate ratio: 1.0-25 (v/w)
Wang et al., 2018
18 Optimization of process parameters for enzymatic hydrolysis of tuna red meat protein
Chapter 2
2.5 Proximate composition of fish protein hydrolysates
Chemical composition of fish protein hydrolysates is important in nutrition
perspective of human health. Protein is the major component of interest in fish
protein hydrolysate and many researchers reported protein content of fish protein
hydrolysates between 60 % to 90 % of total composition (Choi et al., 2009;
Khantaphant et al., 2011; Parvathy et al., 2016). The high protein content for
fish protein hydrolysates was due to solubilization of proteins during hydrolysis
and removal of insoluble solid matter by centrifugation (Liceaga-Gesualdo and
Li-Chan, 1999; Chalamaiah et al., 2010). High protein content of fish protein
hydrolysates demonstrated its potential use as protein supplements for human
nutrition. Majority of the studies reported a fat content of below 5 % for different
fish protein hydrolysates (Abdul-Hamid et al., 2002; Thiansilakul et al., 2007a;
Wasswa et al., 2007; Bhaskar et al., 2008; Ovissipour et al., 2009a). The low fat
content of fish protein hydrolysates was because of removal of lipids with insoluble
protein fractions by centrifugation. Most of the studies demonstrated that protein
hydrolysates from various fish proteins contained moisture below 10 % (Gbogouri et
al., 2004; Chalamaiah et al., 2010; Foh et al., 2011; Parvathy et al., 2016; Bhingarde,
2017). The low moisture content of protein hydrolysates was related to the type of
sample and to the higher temperatures employed during the process of evaporation
and spray drying. Low moisture content facilitated better handling as well as storage
stability to the hydrolysates. The ash content of fish protein hydrolysates reported
in many studies ranged between 0.45 % to 27 % of total composition (Choi et
al., 2009; Yin et al., 2010; Mazorra-Manzano et al., 2012). Several authors have
reported that the usage of added acid or base for pH adjustment of medium leads
to high ash content of fish protein hydrolysates (Gbogouri et al., 2004; Dong et al.,
2005; Choi et al., 2009).
19Optimization of process parameters for enzymatic hydrolysis of tuna red meat protein
Review of Literature
Several studies have been reported on the proximate composition of protein
hydrolysate from different species viz., herring (Clupea harengus) (Liceaga-Gesu-
aldo and Li-Chan, 1999; Sathivel et al., 2003); Atlantic salmon (Salmo salar) (Kris-
tinsson and Rasco, 2000); black tilapia (Oreochromis mossambicus) (Abdul-Hamid
et al., 2002); salmon (Salmo salar) (Gbogouri et al., 2004); slender lizard fish (Sau-
rida elongate) (Dong et al., 2005); tuna (Nilsang, 2005); red salmon (Oncorhyn-
chus nerka) (Sathivel et al., 2005); sardinelle (Sardinella aurita) (Souissi et al.,
2007); round scad (Decapterus maruadsi) (Thiansilakul et al., 2007a); grass carp
(Ctenopharyngodon idella) (Wasswa et al., 2007); catla (Catla catla) (Bhas-
kar et al., 2008); Pacific whiting (Merluccius productus) (Pacheco-Aguilar et al.,
2008; Mazorra-Manzano et al., 2011); croaker (Pennahia argentata) (Choi et al.,
2009); Persian sturgeon (Acipenser persicus) (Ovissipour et al., 2009a); channel
catfish (Ictalurus punctatus) (Yin et al., 2010); brownstripe red snapper (Lutjanus
vita) (Khantaphant et al., 2011); king fish (Scomberomorus commersonii) (Ab-
dulazeez et al., 2013); tilapia (Oreochromis niloticus) (Roslan et al., 2014; Silva
et al., 2014); pony fish (Eubleekeria splendens), yellow stripe travally (Selaroides
leptolipis), mackerel (Decapterus maruadsi) (Wisuthiphaet et al., 2015), pony fish
(Leiognathus bindus) (Johnrose et al., 2016); tuna (Thunnus albacares) (Parvathy
et al., 2016); cuttle fish (Sepia pharaonis) (Raftani Amiri et al., 2016), silver catfish
(Arius thalassinus) (Abraha et al., 2017), Malabar sole fish (Cynoglossus macrosto-
mus) (Bhingarde, 2017); monkfish (Lophius vomerinus) (Greyling, 2017); rainbow
trout (Oncorhynchus mykiss) (Rajabzadeh et al., 2017); mackerel tuna (Euthynnus
affinis) (Parvathy et al., 2018b); tilapia fish (Oreochromis niloticus) (Srikanya et al.,
2018) etc.
20 Optimization of process parameters for enzymatic hydrolysis of tuna red meat protein
Chapter 2
2.6 Amino acid composition of fish protein hydrolysates
Hydrolysis of protein results in hydrolysates composed of a mixture of free
amino acids and short chain peptides exhibiting many advantages as nutraceuticals
or functional foods because of their amino acid profile. Santos et al. (2011) opined
that amino acid composition of fish protein hydrolysates is important because of
the nutritional value and the influence on the functional properties. Several authors
have described the amino acid composition of protein hydrolysates produced from
processing waste proteins of different fish species. Among different body parts of
fish, muscle protein is the most extensively studied and reported source (Klompong
et al., 2009a; Nakajima et al., 2009; Ghassem et al., 2011).
Fish protein hydrolysates have been reported to exhibit variation in their
amino acid composition which is mainly due to factors such as raw material,
enzyme source, and hydrolysis conditions (Klompong et al., 2009a; Chalamaiah et
al., 2012). Among all the amino acids, aspartic acid and glutamic acid were found
to be higher in most of the reported fish protein hydrolysates (Klompong et al.,
2009a; Yin et al., 2010; Ghassem et al., 2011; Parvathy et al., 2016; Wisuthiphaet et
al., 2016). Similar to fish muscle hydrolysates, other body parts like head, skin and
visceral hydrolysates were reported to contain all the essential and non-essential
amino acids (Sathivel et al., 2005; Bhaskar et al., 2008; Gimenez et al., 2009;
Ovissipour et al., 2009a; Yin et al., 2010).
Studies on the amino acid composition of various fish species reported
include those from herring (Clupea harengus) (Liceaga-Gesualdo and Li-Chan,
1999; Sathivel et al., 2003); Icelandic scallop (Chlamys islandica) (Mukhin et al.,
2001); black tilapia (Oreochromis mossambicus) (Abdul-Hamid et al., 2002);
salmon (Salmo salar) (Gbogouri et al., 2004); slender lizard fish (Saurida elongate)
(Dong et al., 2005); tuna (Nilsang et al., 2005); red salmon (Oncorhynchus nerka)
21Optimization of process parameters for enzymatic hydrolysis of tuna red meat protein
Review of Literature
(Sathivel et al., 2005a); round scad (Decapterus maruadsi) (Thiansilakul et al.,
2007a); grass carp (Ctenopharyngodon idella) (Wasswa et al., 2007); silver carp
(Hypophthalmichthys molitrix) (Dong et al., 2008); catla (Catla catla) (Bhaskar et
al., 2008); sole and squid (Gimenez et al., 2009); yellow stripe trevally (Selaroides
leptolepis) (Klompong et al., 2009a); Atlantic salmon, coho salmon, Alaska pollack
and southern blue whiting (Nakajima et al., 2009); Persian sturgeon (Acipenser
persicus) (Ovissipour et al., 2009a); cat fish (Ictalurus punctatus) (Yin et al., 2010);
bluewing searobin (Prionotus punctatus) (Santos et al., 2011); loach (Misgurnus
anguilliacaudatus) (You et al., 2011); tilapia (Oreochromis niloticus) (Roslan et
al., 2014; Silva et al., 2014; Yarnpakdee et al., 2015); skip jack tuna (Katsuwonus
pelamis) (Liu et al., 2015); cod (Godinho et al., 2016); pony fish (Leiognathus
bindus) (Johnrose et al., 2016); tuna (Thunnus albacares) (Parvathy et al., 2016);
cuttle fish (Sepia pharaonis) (Raftani Amiri et al., 2016); grey triggerfish (Balistes
capriscus) (Siala et al., 2016); monk fish (Lophius vomerinus) (Greyling, 2017);
rainbow trout (Oncorhynchus mykiss) (Rajabzadeh et al., 2018); tilapia (Tejpal et
al., 2017); salmon (Idowu et al., 2019) etc.
2.7 Functional properties of fish protein hydrolysates
Functional properties are those physicochemical properties, which affect the
behaviour of proteins in food systems during storage, processing, preparation and
consumption (Kinsella, 1982; Hall and Ahmad, 1992; Phillips et al., 1994). It is
these characteristics, which influence the ‘quality’ and organoleptic attributes in
food. Hence these attributes are important particularly if they are used as ingredients
in food products. Functional properties are related to protein structure viz., the
sequence and composition of amino acids, molecular weights, conformation and
the net charge distributed on the molecule (Damodaran, 1996; Casarin et al., 2008).
Enzymatic hydrolysis generates a mixture of free amino acids, di-, tri- and
22 Optimization of process parameters for enzymatic hydrolysis of tuna red meat protein
Chapter 2
oligopeptides, increases the number of polar groups and hydrolysate solubilities
thereby modifying the functionalities and bioavailability (Adler-Nissen, 1986;
Kristinsson and Rasco, 2000). Functional properties are important when the fish
protein hydrolysates interact with other components of food such as oil and water.
Reports suggested the functional properties of peptides to be linked to the
concentration in the diet and to the protein source (Elaziz et al., 2017). Studies have
indicated fish-derived bioactive peptides to have superior functional properties in
comparison to other sources (Taheri et al., 2013). There are extensive studies on
the functional properties of fish protein hydrolysates from different fish species
where in they exhibited enhanced properties, when compared with un-hydrolysed
fish protein, or other commercial food-grade products having the same function (Liu
et al., 2015; Parvathy et al., 2018a; Sripokar et al., 2019). The important functional
properties of FPH include solubility, emulsifying properties, foaming properties
and fat absorption capacity (Motoki and Kumazawa, 2000).Hydrolytic conditions
like E/S ratio, nature of enzymes, time, pH influenced the functional properties of
fish protein hydrolysates (Tanuja et al., 2012; Naqash and Nazeer, 2012). Previous
studies (Klompong et al., 2007) have reported decreased interfacial activities and
increased solubility with increasing DH in fish protein hydrolysates. Similarly
Nalinanon et al. (2011) also reported that functional properties like emulsion and
foaming properties are governed by their DH and hydrolysate concentrations.
2.7.1 Solubility
Solubility is the amount of protein that goes into the solution under
specified conditions. It is regarded as the most important functional property as
many of the other functional properties like emulsifying and foaming properties
are influenced by this parameter (Wilding et al., 1984). Hence, solubility can be
considered as an excellent indicator of protein functionalities and its potential
23Optimization of process parameters for enzymatic hydrolysis of tuna red meat protein
Review of Literature
applications (Mahmoud, 1994). Intact fish myofibrillar proteins have the problem
of the lack of solubility in water over a wide range of pH and enzymatic hydrolysis
is very important in increasing the solubility of these proteins (Spinelli et al.,
1972; Venugopal and Shahidi, 1994). Hydrophobic and ionic interactions are the
major factors that influence the solubility characteristics of proteins. Hydrophobic
interactions promote protein-protein interactions and result in decreased solubility
whereas ionic interactions promote protein-water interactions and result in increased
solubility (Adler-Nissen, 1986). Geirsdottir et al. (2011) opined that the soluble
nature of FPH in a wide range of ionic strengths and pH values makes it possible
to use them effectively in seafood products for improved functional properties like
water-binding capacity. Longer processing times for FPH production leads to a
high degree of hydrolysis which results in protein solutions with smaller molecular
weights having higher solubility (Shahidi et al.,1995). It was hypothesized that
there is an increase in hydrophilic polar groups leading to an increase in their water-
solubility (Kristinsson and Rasco, 2000).
Solubility of protein hydrolysates from different species were studied.
Species viz., salmon (Gbogouri et al., 2004); blue whiting (Geirsdottir et al., 2011);
skip jack tuna (Liu et al., 2015); common carp (Saputra and Nurhayati, 2016);
Alaska Pollock (Liu et al., 2018); yellowfin tuna (Parvathy et al., 2018a); mackerel
tuna (Parvathy et al., 2018b); etc. are a few among them.
2.7.2 Fat absorption capacity
The capacity of hydrolysate to absorb fat / oil is an important attribute
that influences the taste of the product. It is an important functional characteristic
required especially for the meat and confectionery industry. Fat absorption capacity
correlates with surface hydrophobicity and protein hydrolysates develops this
hydrophobicity on account of the hydrolysis which cleaves the protein chain
24 Optimization of process parameters for enzymatic hydrolysis of tuna red meat protein
Chapter 2
resulting in the exposure of more internal hydrophobic groups (Kristinsson and
Rasco, 2000). The mechanism of fat absorption was attributed mostly to physical
entrapment of the oil and thus, the higher bulk density of the protein more is the fat
absorption. Generally, hydrolysates are mixed with a specified amount of excess
fat for a particular time and then centrifuged at a low centrifugal force and the fat
absorption is expressed as g of fat absorbed / g of protein (Shahidi et al., 1995).
A few among the studies reported on the fat absorption capacity of
hydrolysate from different fish species include those from red salmon (Sathivel et
al., 2005a); cod (Slizyte et al., 2005); grass carp (Wasswa et al., 2007); tilapia (Foh
et al., 2011; 2012); blue whiting (Geirsdottir et al., 2011); yellowtail king fish (He
et al., 2015); tuna (Parvathy et al. 2016); cuttle fish (Raftani Amiri et al., 2016);
Alaska pollock (Liu et al., 2018) etc.
2.7.3 Emulsifying properties
An emulsion is a system containing two immiscible liquid phases, one
of which is dispersed in the other as droplets varying between 0.1 and 50 μm in
diameter. The phase present in the form of droplets is called the dispersed phase
while the matrix in which the droplets are dispersed is called the continuous phase
(Nawar, 1985). Emulsions are thermodynamically unstable systems as a result of
the large positive energy at the interface of the two liquids (Comas et al., 2006).
Emulsifiers are able to form a protective coating around the oil droplets leading
to prevention of coalescence phenomenon (Kasapis et al., 2009). The emulsifying
properties of FPH are directly connected to their surface properties. Fish protein
hydrolysates are good emulsifiers due to their improved amphiphilic nature, as they
expose more hydrophilic and hydrophobic groups that enable orientation at the oil–
water interface for more effective adsorption (Klompong et al., 2007). Kristinsson
and Rasco (2000) reported that protein hydrolysates should consist of at least 20
25Optimization of process parameters for enzymatic hydrolysis of tuna red meat protein
Review of Literature
residues to possess good emulsifying capacity. Desirable surface active proteins and
protein hydrolysates have three major attributes such as ability to rapidly adsorb to
an interface, ability to rapidly unfold and reorient at an interface and ability to
interact with the neighbouring molecules at interface and form a strong cohesive,
viscoelastic film that can withstand thermal and mechanical motions (Philips,
1981; Damodaran, 1996). However, the extent of hydrolysis has to be carefully
controlled, as excessive hydrolysis can decrease the emulsifying capacity of protein
hydrolysates (Kristinsson and Rasco, 2000; Gbogouri et al., 2004; Klompong et al.,
2007).
Emulsifying properties of proteins are measured as emulsion activity index
(EAI) and emulsion stability index (ESI). EAI measures the area of oil-water
interface stabilized by a unit weight of protein and ESI measures an emulsion’s
ability to resist breakdown (Wu et al., 1998). Mutilangi et al. (1996) reported that
higher content of larger molecular weight peptides or more hydrophobic peptides
contribute to the stability of the emulsion. Small peptides and amino acids were
less efficient in reducing the interfacial tension due to the lack of unfolding and
reorientation at the interface as the large peptides do (Gbogouri et al., 2004).
Extensive studies were reported on emulsifying properties from various
seafood sources like cod (Slizyte et al., 2005); yellow stripe trevally (Klompong
et al., 2007); Pacific whiting (Pacheco-Aguilar et al., 2008); tilapia (Foh et al.,
2012); skip jack tuna (Liu et al., 2015); sardine and small-spotted catshark (Garcia-
Moreno et al., 2016); pony fish (Johnrose et al., 2016); cuttle fish (Raftani Amiri et
al., 2016); tilapia (Tejpal et al., 2017); starry triggerfish (Sripokar et al., 2019) etc.
26 Optimization of process parameters for enzymatic hydrolysis of tuna red meat protein
Chapter 2
2.7.4 Foaming properties
Food foams consist of air droplets dispersed in and enveloped by a continuous
liquid containing a soluble surfactant lowering the surface and interfacial tension
of the liquid (Kinsella and Melachouris, 1976). Similar to emulsifying properties,
foaming properties also rely on the surface properties of protein. Townsend and
Nakai (1983) showed that total hydrophobicity, or the hydrophobicity of exposed
or unfolded protein, have a significant correlation to foaming formation.Similar to
other functional properties, foaming properties of protein hydrolysate was related
to the degree of hydrolysis (Kuehler and Stine, 1974).
Foaming properties are usually expressed as foam formation / foaming
capacity and foam stability. Foaming capacity is referred to as the ability of protein
to form foams is described as overrun. Overrun is the percentage of excess volume
produced by whipping a protein containing liquid compared with the initial volume
of the liquid (Phillips et al., 1987). Foam stability is measured by whipping the
protein solution and measuring the decrease in the volume in a specific period.
Previous literature reported foaming properties from different fish species
viz., herring (Liceaga-Gesualdo and Li-Chan, 1999); yellow stripe trevally
(Klompong et al., 2007); rainbow trout (Taheri et al., 2013); pony fish (Johnrose
et al., 2016); tuna (Parvathy et al., 2016); cuttle fish (Raftani Amiri et al., 2016);
Alaska Pollock (Liu et al., 2018); starry triggerfish (Sripokar et al., 2019) etc.
indicating their application potential in various food systems.
2.7.5 Sensory properties
Sensory evaluation is a scientific discipline used to evoke, measure, analyze,
and interpret reactions to those characteristics of foods and materials as they are
perceived by the senses of sight, smell, taste, touch, and hearing (Stone et al., 2012).
27Optimization of process parameters for enzymatic hydrolysis of tuna red meat protein
Review of Literature
Sensory properties of a product are extremely important for the successful adaptation
and acceptance by the food industry and the consumer (Kristinnson and Rasco,
2000). Although enzymatic hydrolysis of proteins develops desirable functional
properties, it has the disadvantage of generating bitterness which is identified as
a major hindrance regarding utilization and commercialization of bioactive FPH
(Dauksas et al., 2004; Kim and Wijesekara, 2010). The mechanism of bitterness is
not very clear, but it has been documented to be associated with the presence of bitter
peptides mainly comprising hydrophobic amino acids. In addition to hydrophobicity
of peptides, peptide length, amino acid sequence and spatial structure also influences
the perception of bitter taste (Kim and Li-Chan, 2006).Hydrolysis of protein results
in exposing buried hydrophobic peptides, which readily interact with the taste
buds resulting in detection of bitter taste. Two functional groups are necessary to
produce bitterness, such as a pair of hydrophobic groups or a hydrophobic or a basic
group (Tamura et al., 1990). An extensive hydrolysis to free amino acids, however,
decreases the bitterness of these bitter peptides because hydrophobic peptides are far
more bitter compared with a mixture of free amino acids.
The sensory properties of protein hydrolysate from species like cod (Liaset
et al., 2000); salmon (Kouakou et al., 2014); Nile tilapia (Yarnpakdee et al., 2015);
Atlantic salmon (Aspevik et al., 2016); yellowfin tuna (Parvathy et al., 2018a);
mackerel tuna (Parvathy et al., 2018b) have been previously reported.
Many techniques have been suggested to reduce or mask bitterness in
hydrolysates, but few of them was applied to FPH (Adler-Nissen, 1986; Saha
and Hayashi, 2001; Leksrisompong et al., 2012).Strict control of any hydrolysis
experiment and termination at low degree of hydrolysis isa common and desirable
method to prevent the development of a bitter taste and the retention of functional
properties (Hou et al., 2011). As enzymes have different preferences for amino
28 Optimization of process parameters for enzymatic hydrolysis of tuna red meat protein
Chapter 2
acids, choosing the most appropriate enzyme is the most widespread methodology
for reducing bitterness (Kristinsson, 2006). Enzymes with a high preference for
hydrophobic amino acids such as alcalase are often preferred and frequently yield
products of low bitterness (Adler-Nissen, 1986). The use of exopeptidases, as
opposed to endoproteinases, is the most frequent and economic method adopted in
overcoming the bitterness in fish protein hydrolysates, particularly exopeptidases
that split off hydrophobic amino acids from bitter peptides (Nilsang et al., 2005;
Cheung et al., 2015; Fu et al., 2019). Many studies have shown that proteolytic
preparations containing exopeptidases and endoproteinases produce less bitter
peptides than single proteases (Vegarud and Langsrud, 1989; Moll, 1990). It was
suggested that oxidation products play a part in the development of bitter taste
(Liu et al., 2000). A few suggested methods for bitterness reduction include
treating hydrolysates with activated carbon that partly removes bitter peptides with
absorption (Shahidi et al., 1995; Suh et al., 2000; Bansal and Goyal, 2005; Aspevik,
2016), extracting bitter peptides with solvents (Lalasidis, 1978; Dauksas et al.,
2004) and by plastein reaction which is the formation of a gel-like proteinaceous
substance from a concentrated protein hydrolysate (Gong et al., 2015). Masking can
be performed by adding additives or molecules, e.g. cyclodextrin, to the hydrolysate
to mask the bitter taste (Tamura et al., 1990; Aspevik et al., 2016). Masking additives
promotes conformational alterations of the peptides and introduction of sweet tastes
that cover the bitterness (Linde et al., 2009).
Bitterness evaluation in protein hydrolysates can be carried out by traditional
sensory analysis by trained sensory panel. Though sensory evaluation by trained
panellists is the most direct way, it is quite time-consuming due to extensive training
required to obtain reliable results (Newman et al., 2014). Other modifications
in the method include taste dilution analysis (Seo et al., 2008), category scaling
29Optimization of process parameters for enzymatic hydrolysis of tuna red meat protein
Review of Literature
(Lovsin-Kukman et al., 1996), line scaling (Aaslyng and Frøst, 2010) and caffeine
equivalency (Kodera et al., 2006). Limitations in sensory analysis have created
an increasing interest for alternative methods like objective evaluation. Of these,
application of electronic tongue, has great potential for addressing the challenges
associated with sensory evaluation. Electronic tongue is a device equipped with
numerous sensors connected to the central chemometric processing unit that can
measure and compare diverse tastes (Newman et al., 2014).The sensors serve as
taste receptors similar to human tongue and the obtained data are subsequently
analysed using chemometrics or artificial intelligence to identify taste (Podrazka et
al., 2018; Fu et al., 2019). A number of investigations have been carried out recently
employing electronic tongue to evaluate bitterness of protein hydrolysates (Cheung
and Li-Chan, 2014; Newman et al., 2014).
2.8 Antioxidative activity of fish protein hydrolysates
Lipid oxidation is of great concern to the food industry and consumers
because it leads to the development of undesirable off-flavors, off-odors, dark colors,
taste deterioration and formation of potentially toxic reaction products (Noguchi
and Niki, 1999; Lin and Liang, 2002; Niki, 2010; Lin et al., 2010). Furthermore
diseases like cancer, coronary heart problems and Alzheimer’s were also reported
to be caused partially by oxidation or free radical reactions in the body (Diaz et al.,
1997; Bougatef et al., 2010; Ngo et al., 2010). Lipid oxidation in food products can
be controlled by reducing metal ions and minimizing exposure to light and oxygen
using packaging as well as by incorporation of antioxidants. Antioxidants are
substances used to prolong the shelf life and maintain the nutritional quality of lipid-
containing foods (Rajaram and Nazeer, 2010) and to modulate the consequences
of oxidative damage in the human body (Munoz et al., 2010). Halliwell and
Gutteridge (2007) defined an antioxidant as any substance that when present at low
concentration compared with those of an oxidizable substrate significantly delays
30 Optimization of process parameters for enzymatic hydrolysis of tuna red meat protein
Chapter 2
or prevents oxidation of that substrate. Many synthetic antioxidants such as BHT,
BHA, TBHQ and propyl gallate (PG) were used in the food and pharmaceutical
industries to retard lipid oxidation (Bernardini et al., 2016). The use of synthetic
antioxidants result in potential health issues (Byun et al., 2009; Bougatef et al.,
2010) and hence there is growing interest to identify alternative natural and safe
sources of food antioxidants for replacing these synthetic ones (Bernardini et al.,
2016). These identified antioxidative activities have a potential to develop safe and
nonhazardous natural antioxidants for the complications arose from oxidation of
biomolecules.
Fish protein hydrolysate is well established for its antioxidant properties
on account for the bioactive peptides they possess. The antioxidant activity of
peptides has been attributed to their chain length and hydrophobicity as well as
to certain amino acids. They usually vary from 2-20 amino acid residues with the
molecular mass of less than 6000 Da (Jun et al., 2004; Wang et al., 2008; Bougatef
et al., 2010). These peptides are inactive within the sequence of parent protein and
released upon enzymatic cleavage. The first known scientific study reported on the
antioxidant activity of fish protein hydrolysates was in 1995 by Shahidi et al. Since
then a number of studies reported the antioxidative activities of various fish protein
hydrolysates (Klompong et al., 2007; Thiansilakul et al., 2007b; Yang et al., 2008;
Phanturat et al., 2010; Zhong et al., 2011; Elavarasan et al., 2014; Dey and Dora,
2014). Davalos et al. (2004) in their studies, reported that several amino acids, such
as Trp, Tyr, and Met, followed by Cys, His, and Phe showed highest antioxidant
activity. It is well known that aromatic amino acid residues can easily donate protons
to electron-deficient radicals and participate directly in radical scavenging activity.
Further, the antioxidant activity of histidine-containing peptides has been reported
and attributed to the hydrogen donating, lipid peroxyl radical trapping, and/or metal
ion-chelating ability (Rajapakse et al., 2005).
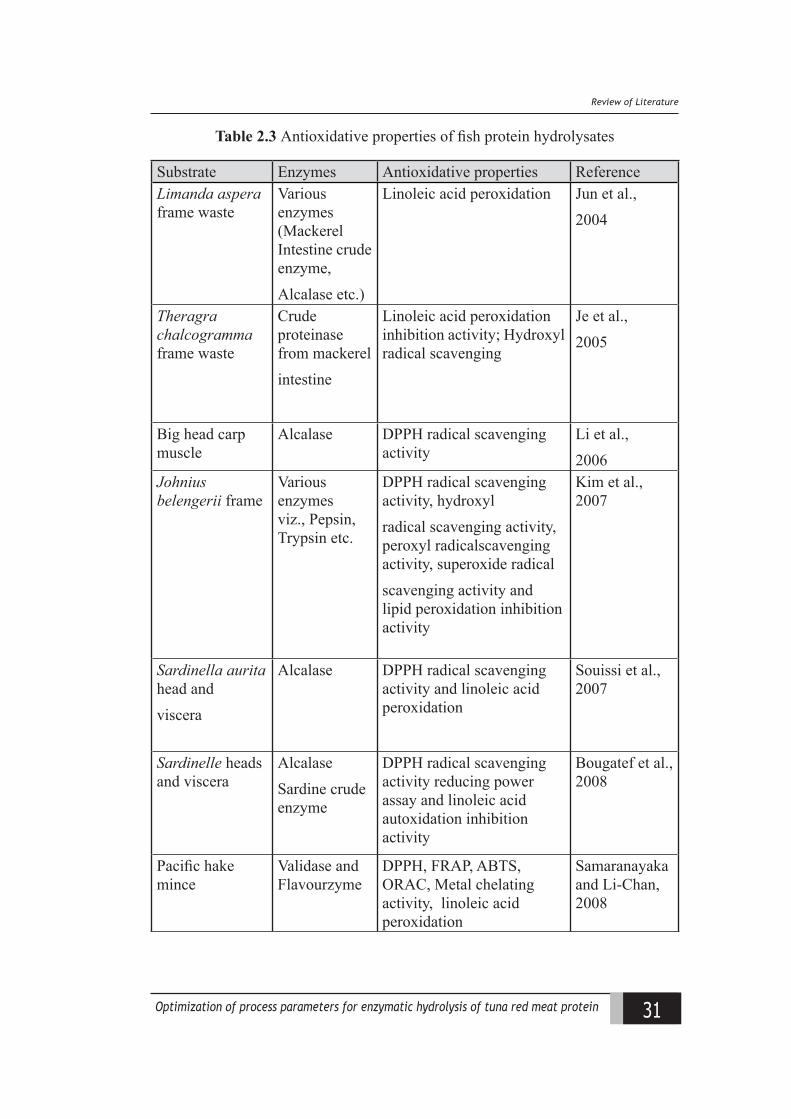
31Optimization of process parameters for enzymatic hydrolysis of tuna red meat protein
Review of Literature
Table 2.3 Antioxidative properties of fish protein hydrolysates
Substrate Enzymes Antioxidative properties ReferenceLimanda aspera frame waste
Various enzymes (Mackerel Intestine crude enzyme,Alcalase etc.)
Linoleic acid peroxidation Jun et al., 2004
Theragra chalcogramma frame waste
Crude proteinase from mackerelintestine
Linoleic acid peroxidation inhibition activity; Hydroxyl radical scavenging
Je et al., 2005
Big head carp muscle
Alcalase DPPH radical scavenging activity
Li et al., 2006
Johnius belengerii frame
Various enzymes viz., Pepsin, Trypsin etc.
DPPH radical scavenging activity, hydroxylradical scavenging activity, peroxyl radicalscavenging activity, superoxide radicalscavenging activity and lipid peroxidation inhibition activity
Kim et al., 2007
Sardinella aurita head andviscera
Alcalase DPPH radical scavenging activity and linoleic acid peroxidation
Souissi et al., 2007
Sardinelle heads and viscera
Alcalase Sardine crude enzyme
DPPH radical scavenging activity reducing power assay and linoleic acid autoxidation inhibition activity
Bougatef et al., 2008
Pacific hake mince
Validase and Flavourzyme
DPPH, FRAP, ABTS, ORAC, Metal chelating activity, linoleic acid peroxidation
Samaranayaka and Li-Chan, 2008
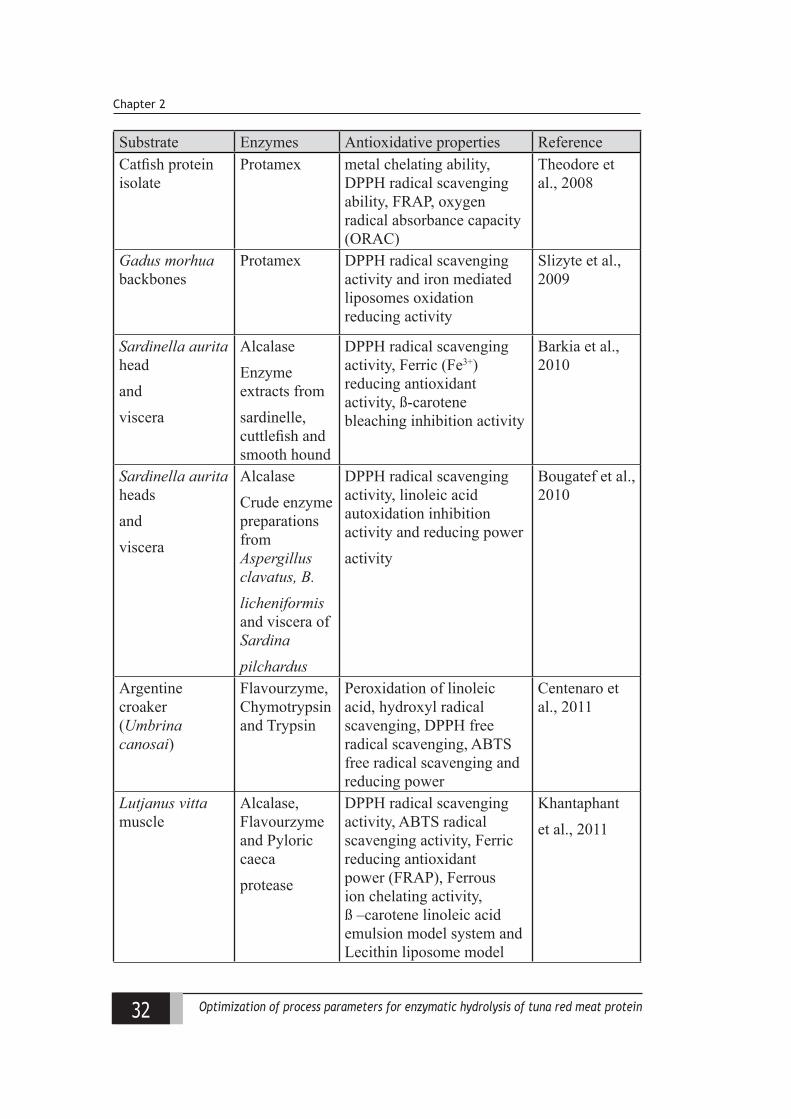
32 Optimization of process parameters for enzymatic hydrolysis of tuna red meat protein
Chapter 2
Substrate Enzymes Antioxidative properties ReferenceCatfish protein isolate
Protamex metal chelating ability, DPPH radical scavenging ability, FRAP, oxygen radical absorbance capacity (ORAC)
Theodore et al., 2008
Gadus morhua backbones
Protamex DPPH radical scavenging activity and iron mediated liposomes oxidation reducing activity
Slizyte et al., 2009
Sardinella aurita headandviscera
Alcalase Enzyme extracts fromsardinelle, cuttlefish and smooth hound
DPPH radical scavenging activity, Ferric (Fe3+) reducing antioxidant activity, ß-carotene bleaching inhibition activity
Barkia et al., 2010
Sardinella aurita headsandviscera
AlcalaseCrude enzyme preparations from Aspergillus clavatus, B.licheniformis and viscera of Sardinapilchardus
DPPH radical scavenging activity, linoleic acid autoxidation inhibition activity and reducing poweractivity
Bougatef et al., 2010
Argentine croaker (Umbrina canosai)
Flavourzyme, Chymotrypsin and Trypsin
Peroxidation of linoleic acid, hydroxyl radical scavenging, DPPH free radical scavenging, ABTS free radical scavenging and reducing power
Centenaro et al., 2011
Lutjanus vitta muscle
Alcalase, Flavourzyme and Pyloric caecaprotease
DPPH radical scavenging activity, ABTS radical scavenging activity, Ferric reducing antioxidant power (FRAP), Ferrous ion chelating activity, ß –carotene linoleic acid emulsion model system and Lecithin liposome model
Khantaphantet al., 2011
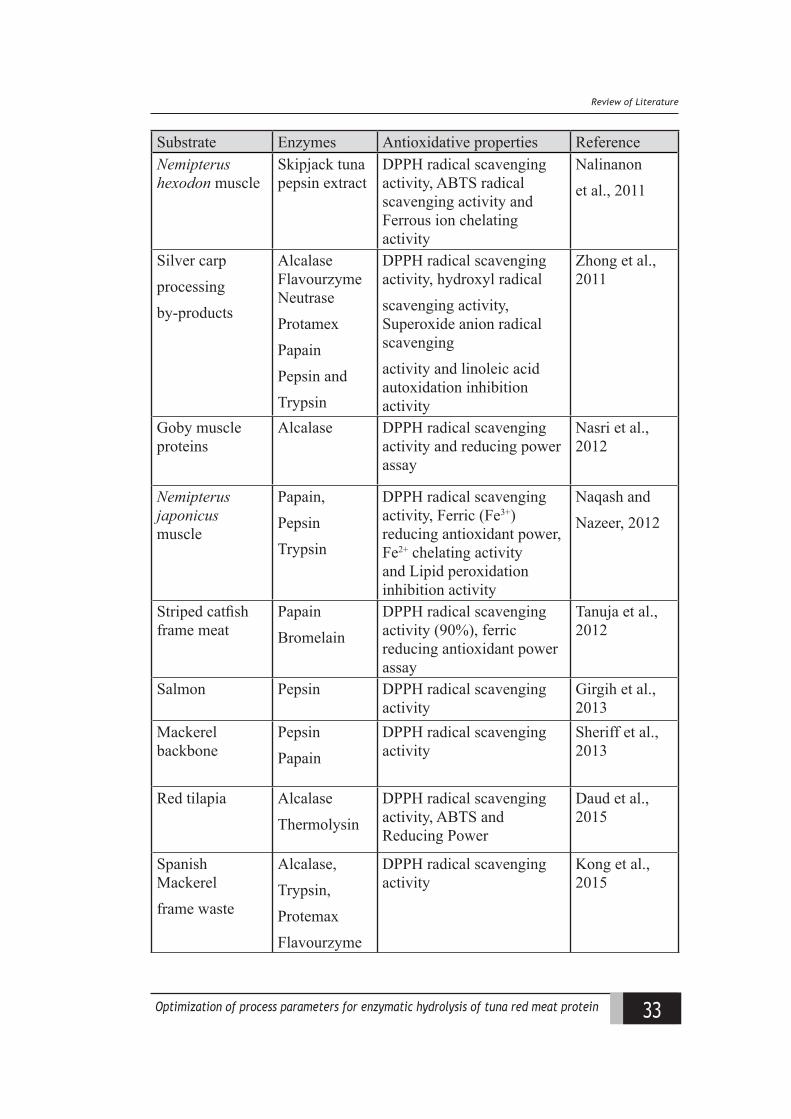
33Optimization of process parameters for enzymatic hydrolysis of tuna red meat protein
Review of Literature
Substrate Enzymes Antioxidative properties ReferenceNemipterus hexodon muscle
Skipjack tuna pepsin extract
DPPH radical scavenging activity, ABTS radical scavenging activity and Ferrous ion chelating activity
Nalinanonet al., 2011
Silver carpprocessingby-products
Alcalase Flavourzyme NeutraseProtamexPapainPepsin and Trypsin
DPPH radical scavenging activity, hydroxyl radicalscavenging activity, Superoxide anion radical scavengingactivity and linoleic acid autoxidation inhibition activity
Zhong et al., 2011
Goby muscle proteins
Alcalase DPPH radical scavenging activity and reducing power assay
Nasri et al., 2012
Nemipterus japonicus muscle
Papain, Pepsin Trypsin
DPPH radical scavenging activity, Ferric (Fe3+) reducing antioxidant power, Fe2+ chelating activity and Lipid peroxidation inhibition activity
Naqash andNazeer, 2012
Striped catfish frame meat
PapainBromelain
DPPH radical scavenging activity (90%), ferric reducing antioxidant power assay
Tanuja et al., 2012
Salmon Pepsin DPPH radical scavenging activity
Girgih et al., 2013
Mackerel backbone
PepsinPapain
DPPH radical scavenging activity
Sheriff et al., 2013
Red tilapia AlcalaseThermolysin
DPPH radical scavenging activity, ABTS and Reducing Power
Daud et al., 2015
Spanish Mackerelframe waste
Alcalase,Trypsin, Protemax Flavourzyme
DPPH radical scavenging activity
Kong et al., 2015
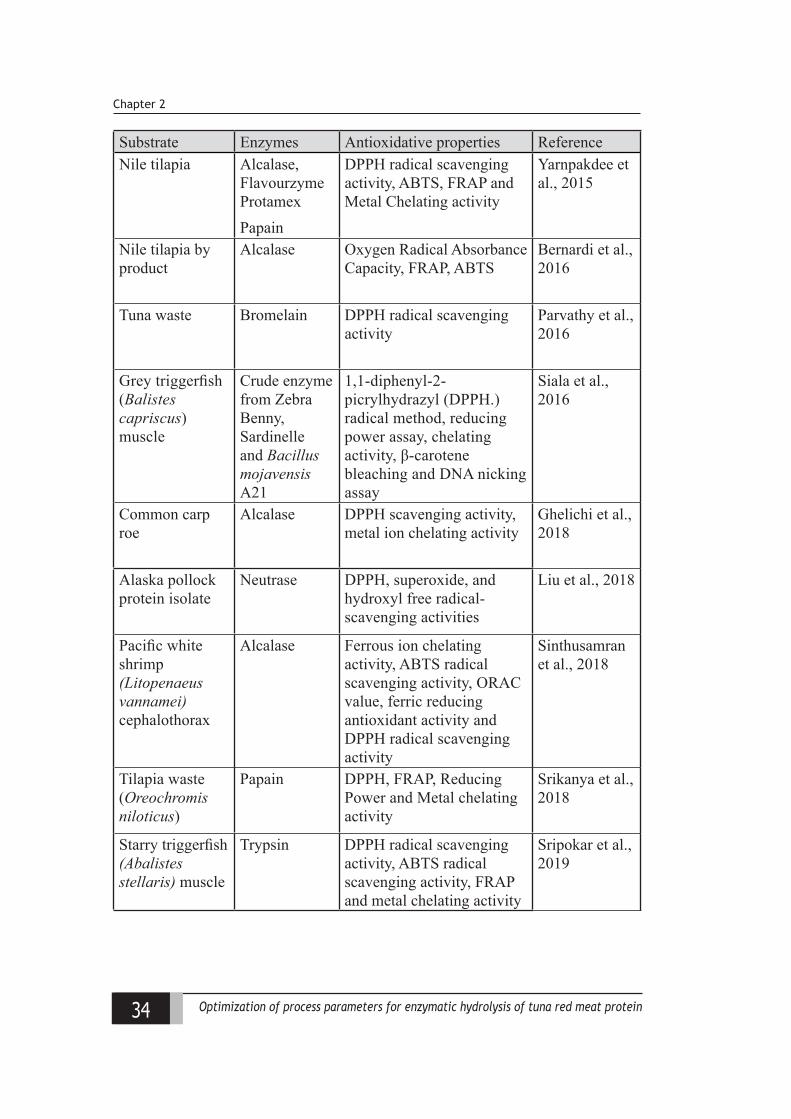
34 Optimization of process parameters for enzymatic hydrolysis of tuna red meat protein
Chapter 2
Substrate Enzymes Antioxidative properties ReferenceNile tilapia Alcalase,
Flavourzyme ProtamexPapain
DPPH radical scavenging activity, ABTS, FRAP and Metal Chelating activity
Yarnpakdee et al., 2015
Nile tilapia by product
Alcalase Oxygen Radical Absorbance Capacity, FRAP, ABTS
Bernardi et al., 2016
Tuna waste Bromelain DPPH radical scavenging activity
Parvathy et al., 2016
Grey triggerfish (Balistes capriscus) muscle
Crude enzyme from Zebra Benny, Sardinelle and Bacillus mojavensis A21
1,1-diphenyl-2-picrylhydrazyl (DPPH.) radical method, reducing power assay, chelating activity, β-carotene bleaching and DNA nicking assay
Siala et al., 2016
Common carp roe
Alcalase DPPH scavenging activity, metal ion chelating activity
Ghelichi et al., 2018
Alaska pollock protein isolate
Neutrase DPPH, superoxide, and hydroxyl free radical-scavenging activities
Liu et al., 2018
Pacific white shrimp (Litopenaeus vannamei)cephalothorax
Alcalase Ferrous ion chelating activity, ABTS radical scavenging activity, ORAC value, ferric reducing antioxidant activity and DPPH radical scavenging activity
Sinthusamran et al., 2018
Tilapia waste (Oreochromis niloticus)
Papain DPPH, FRAP, Reducing Power and Metal chelating activity
Srikanya et al., 2018
Starry triggerfish (Abalistes stellaris) muscle
Trypsin DPPH radical scavenging activity, ABTS radical scavenging activity, FRAP and metal chelating activity
Sripokar et al., 2019
35Optimization of process parameters for enzymatic hydrolysis of tuna red meat protein
Review of Literature
2.9 Applications of fish protein hydrolysates
In addition to the nutritional properties of food proteins, their role as a
valuable source of peptides with multifunctional activities is well demonstrated
(Dhaval et al., 2016). This nutritional richness of proteins and their hydrolysates
is essentially associated with their essential amino acids content while the nature
of bioactive peptides determines the biofunctionalities as well as bioactivities
(Saadi et al., 2015). Compared to the parent protein, their biopeptides offer a lot of
advantages viz., relatively superior bioactivity and a wide spectrum of therapeutic
action. Further they are considered to be milder and safer for the consumers with
protein hydrolysates and peptides of low molecular weights to be less allergenic
than their parent proteins.
Fish protein hydrolysates have potential application as functional
ingredients in different foods on account of the numerous important and unique
properties that they possess viz., water holding capacity, oil absorption capacity,
protein solubility, gelling activity, foaming capacity and emulsification ability
(Chalamaiah et al., 2010). Food application of fish protein hydrolysate accounts
for nutritional enrichment as well as functional stabilization and studies have been
reported in food systems like beverages and snack products (Sinha et al., 2007;
Pacheco-Aguilar et al., 2008; Leksrisompong et al., 2012; Ismail and Sahibon,
2018). The water binding capability of hydrolysate results in hydrogen binding with
food components facilitating water entrapment and finds suitability in foods like
meat, sausages, breads, cakes, boiled foods etc (Ibarra et al., 2013). Incorporation
of protein hydrolysate in soups and gravies on account of their viscous behaviour
have been reported by Zhang et al. (2013). Similarly the emulsifying property of
protein hydrolysate facilitates formation and stabilization of fat emulsions in various
products viz., sausages, bologna, soups, cakes, protein spreads and mayonnaise
(Sathivel et al., 2005; Cavalheiro et al., 2014; Intarasirisawat et al., 2014).
36 Optimization of process parameters for enzymatic hydrolysis of tuna red meat protein
Chapter 2
Incorporation of hydrolysate in various products viz., meats, sausages, doughnuts,
spreads, crackers, deep fried products exploring their fat absorption property were
reported (Yu and Tan, 1990; He et al., 2015a). The antioxidant property of fish
protein hydrolysate has also been well demonstrated in various products viz., fish
muscle (Dekkers et al., 2011); fish fillets (Sathivel et al., 2008; Dey and Dora,
2014); fish sausage (Intarasirisawat et al., 2014); hamburgers (Bernardi et al.,
2016); fish oil (Morales-Medina et al., 2016); dressed fish (Parvathy et al., 2018c)
etc. A study conducted by Cheung et al. (2009) on protein hydrolysates from Pacific
hake (Merluccius productus) provided strong evidence to support development of
FPH as a new generation cryoprotectant to maintain quality of frozen fish. Similar
studies were reported by Kittiphattanabawon (2012) in fishery product to reduce
protein denaturation. Studies by Yarnpakdee et al. (2012a) have confirmed pre-
treatment of raw material to be effective in reducing the total lipid content and
hence lipid oxidation and fishy odour and taste. This further facilitated in successful
fortification of milk with fish protein hydrolysate at 0.2 % level.
They are also a source of specific amino acids for dietic formulations
(Sumaya-Martinez et al., 2005) which are easily absorbed and utilized for various
metabolic activities (Nesse et al., 2011). They are used for maintaining the nutritional
status of individuals with nutritional or physiological needs that are not provided by
conventional foods (Clemente, 2000). Protein hydrolysates are also used in sport
nutrition as high-energy supplement to maximize muscle protein anabolism in
healthy athletes (Manninen, 2009).
Fish protein hydrolysates (FPHs) have been used in aquaculture feeds
in order to enhance the growth performance and immunological status of fish
and shell fish (Refstie et al., 2004; Hevroy et al., 2005; Kotzamanis et al.,2007;
Hermannsdottir et al., 2009; Nguyen et al., 2012; Silva et al., 2017).FPHs have also
37Optimization of process parameters for enzymatic hydrolysis of tuna red meat protein
Review of Literature
found application as an excellent source of nitrogen for maintaining the growth of
different microorganisms (Klompong et al., 2009b; Hsu, 2010). Ghorbel et al. (2005)
used various fish protein hydrolysates (FPHs) from sardinelle (Sardinella aurita) as
nitrogen sources for the production of extracellular lipase by the filamentous fungus
Rhizopus oryzae. In another study by Safari et al. (2012) the hydrolysates generated
from yellowfin tuna (Thunnus albacares) head waste was shown to be effective
in promoting the growth of lactic acid bacteria better than the commercial MRS
media. Studies have also been reported on the antimicrobial property of protein
hydrolysate from various seafood sources (Di Bernardini et al., 2011; Ghelichi et
al., 2018). Studies have also been reported on the role of fish protein hydrolysates
to alter the lipid metabolism in experimental animals revealing their suitability as a
cardioprotective nutrient (Wergedahl et al., 2004; Khaled et al., 2012).

38 Optimization of process parameters for enzymatic hydrolysis of tuna red meat protein
Chapter 2
39Optimization of process parameters for enzymatic hydrolysis of tuna red meat protein
Quality assessment of peptides from white and red meat of yellowfn tuna (hunnus allaaaress
Chapter 3Quality assessment
of peptides from white and redmeatofyellowfintuna
(Thunnus albacares)3.1 Introduction
Seafood and seafood products are one of the mainly used protein sources for
human consumption. This marine biomass is considered to be safe as well as superior
food commodity with regard to their nutritional properties especially protein with
desirable essential amino acid pattern. However, a major share of this source is not
utilized to its best and goes for the production of low-priced by-products such as
fish flour, fish oil, animal feed etc. or remains unutilized as waste. This scenario
calls for an urgent requirement for efficient solutions for their effective utilization
to counter for human nutritional requirement as well as increasing environmental
pollution issues (Petrova et al., 2018).
Tuna and tuna products have a widespread consumer demand globally
on account of their delicacy and richness in protein and are widely used for the
production of thermally processed products. Hence tuna waste constitutes a biomass
of particular interest to upgrade on account of this global economic importance
and their role in international trade for canning. Tuna processing produces 30 to
35 % products, 20 to 35 % solid waste and 20 to 35 % liquid wastes (Wongsakul
et al., 2003). Globally, tuna canning industry is reported to generate to the tune of
40 Optimization of process parameters for enzymatic hydrolysis of tuna red meat protein
Chapter 3
around 4,50,000 t of byproducts per annum (Sultanbawa and Aksnes, 2006) which
constitutes as much as 70 % of the original material. Of this, tuna red meat accounts
for about 12 % of raw tuna used (Guerard et al., 2002). Fish processing discards
including tuna wastes are commonly considered as low-value resources with
insignificant market demand and are currently used to produce fish oil, fishmeal,
fertilizer, pet food and fish silage (Kim and Mendis, 2006). Reports suggested
that seafood by products are also valuable sources of compounds such as proteins,
lipids, minerals etc and a number of bioactive compounds have been identified from
them (Kim and Mendis, 2006).Enzymatic conversion of these sources into protein
hydrolysates is an effective utilization method, which has immense application
scope in food and pharmaceutical areas (Chalamaiah et al., 2012; He et al., 2013).
Protein hydrolysates are bioactive peptides obtained by the breakdown of
proteins by hydrolysis either chemically or enzymatically. This process facilitates
recovery of essential nutrients viz., amino acids as well as has immense scope
in food, nutraceutical and pharmaceutical industry on account of the excellent
physicochemical, functional as well as bioactive properties they possess (He et al.,
2013; Halim et al., 2016). Previous studies have indicated variations with respect to
the properties in red and white meat of tuna hydrolysate which may be on account
of species, seasonal variations etc (Sanchez-Zapata et al., 2011; Parvathy et al.,
2018b). The present study was focused on comparative evaluation of the properties
of hydrolysates derived from white and red meat of yellowfin tuna (Thunnus
albacares), a high demand species in the domestic as well as international market.
Protein hydrolysate was prepared under similar hydrolytic conditions viz., 60 min
hydrolysis time at 60oC and physiological pH (6.5), employing 1 % (w/w) papain to
obtain spray dried tuna white meat (TWPH) and tuna red meat protein hydrolysates
(TRPH) which were further evaluated for nutritional, functional and antioxidant
properties for further suitable food and pharmaceutical applications.
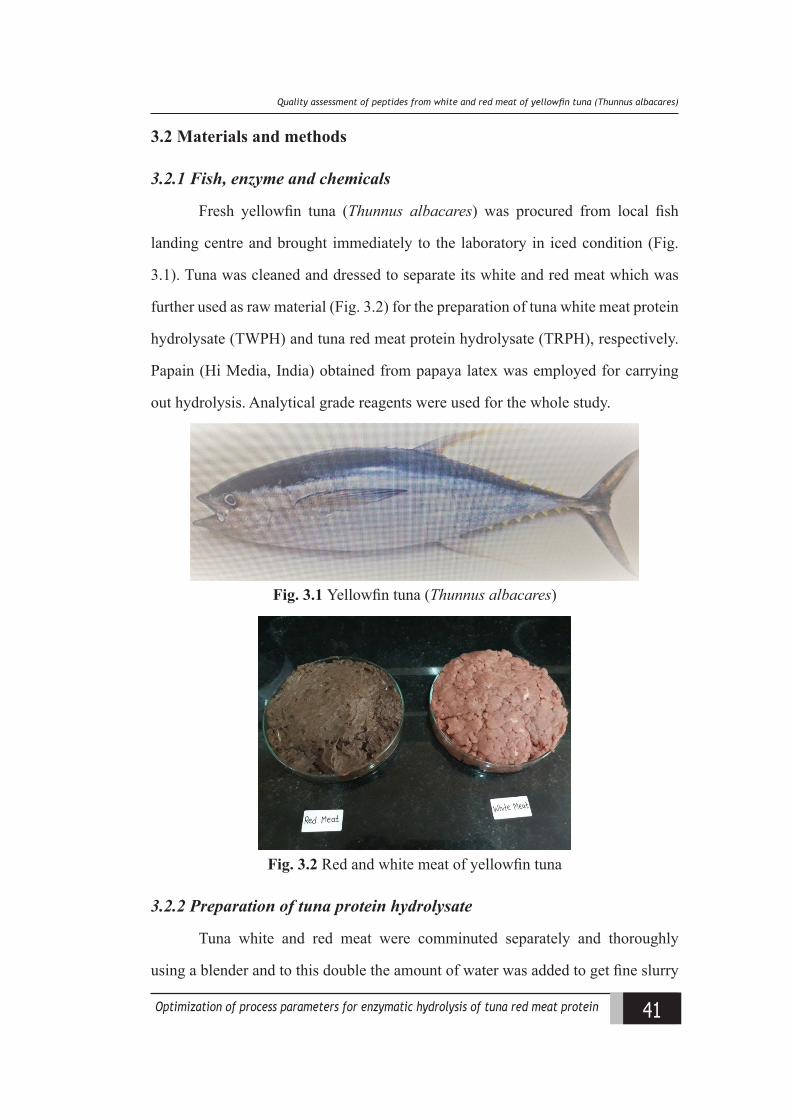
41Optimization of process parameters for enzymatic hydrolysis of tuna red meat protein
Quality assessment of peptides from white and red meat of yellowfn tuna (hunnus allaaaress
3.2 Materials and methods
3.2.1 Fish, enzyme and chemicals
Fresh yellowfin tuna (Thunnus albacares) was procured from local fish
landing centre and brought immediately to the laboratory in iced condition (Fig.
3.1). Tuna was cleaned and dressed to separate its white and red meat which was
further used as raw material (Fig. 3.2) for the preparation of tuna white meat protein
hydrolysate (TWPH) and tuna red meat protein hydrolysate (TRPH), respectively.
Papain (Hi Media, India) obtained from papaya latex was employed for carrying
out hydrolysis. Analytical grade reagents were used for the whole study.
Fig. 3.1 Yellowfin tuna (Thunnus albacares)
Fig. 3.2 Red and white meat of yellowfin tuna
3.2.2 Preparation of tuna protein hydrolysate
Tuna white and red meat were comminuted separately and thoroughly
using a blender and to this double the amount of water was added to get fine slurry
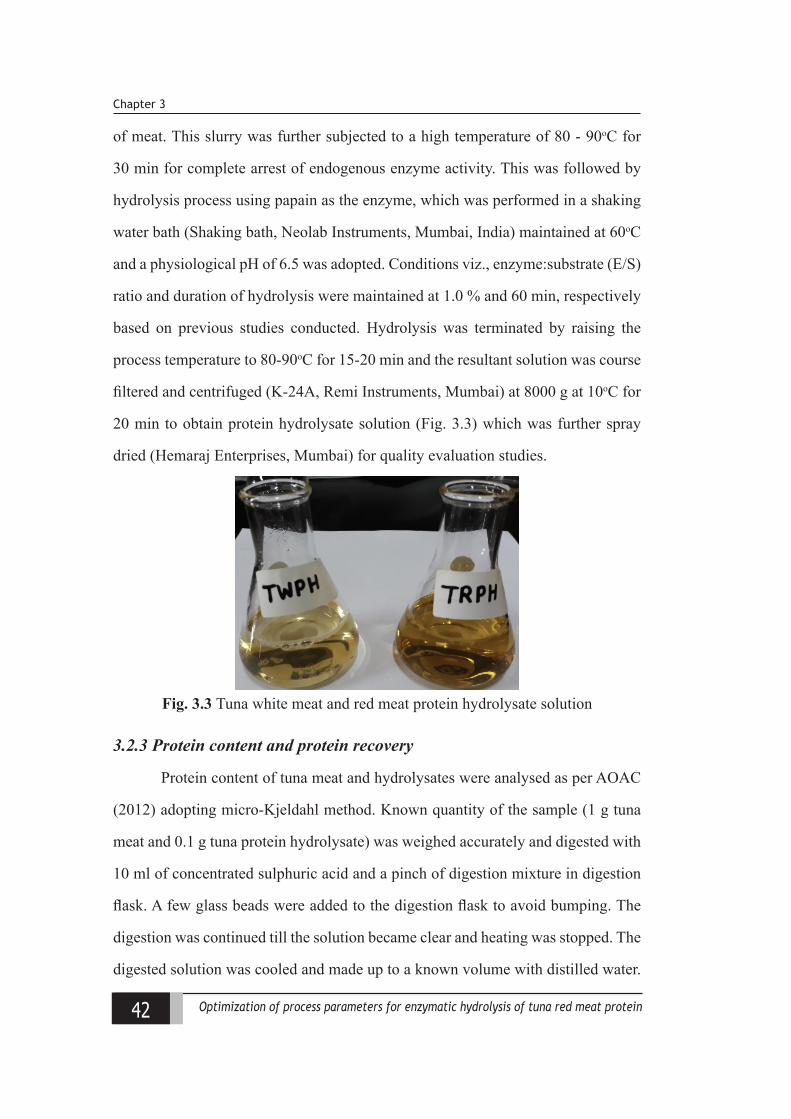
42 Optimization of process parameters for enzymatic hydrolysis of tuna red meat protein
Chapter 3
of meat. This slurry was further subjected to a high temperature of 80 - 90oC for
30 min for complete arrest of endogenous enzyme activity. This was followed by
hydrolysis process using papain as the enzyme, which was performed in a shaking
water bath (Shaking bath, Neolab Instruments, Mumbai, India) maintained at 60oC
and a physiological pH of 6.5 was adopted. Conditions viz., enzyme:substrate (E/S)
ratio and duration of hydrolysis were maintained at 1.0 % and 60 min, respectively
based on previous studies conducted. Hydrolysis was terminated by raising the
process temperature to 80-90oC for 15-20 min and the resultant solution was course
filtered and centrifuged (K-24A, Remi Instruments, Mumbai) at 8000 g at 10oC for
20 min to obtain protein hydrolysate solution (Fig. 3.3) which was further spray
dried (Hemaraj Enterprises, Mumbai) for quality evaluation studies.
Fig. 3.3 Tuna white meat and red meat protein hydrolysate solution
3.2.3 Protein content and protein recovery
Protein content of tuna meat and hydrolysates were analysed as per AOAC
(2012) adopting micro-Kjeldahl method. Known quantity of the sample (1 g tuna
meat and 0.1 g tuna protein hydrolysate) was weighed accurately and digested with
10 ml of concentrated sulphuric acid and a pinch of digestion mixture in digestion
flask. A few glass beads were added to the digestion flask to avoid bumping. The
digestion was continued till the solution became clear and heating was stopped. The
digested solution was cooled and made up to a known volume with distilled water.
43Optimization of process parameters for enzymatic hydrolysis of tuna red meat protein
Quality assessment of peptides from white and red meat of yellowfn tuna (hunnus allaaaress
An aliquot of 2 ml was transferred to Kjeldahl distillation unit with 10 ml of 40 %
sodium hydroxide. 10 ml of 2 % boric acid with 2-3 drops of mixed indicator was
taken in a conical flask in which liberated ammonia was absorbed. The absorption of
ammonia was indicated by change in colour of boric acid with indicator from pink
to green. Back washing was followed for two times after distillation of each sample.
The boric acid was titrated against N / 50 H2SO4 till the pink color was developed.
Crude protein (%) of samples was calculated by multiplying the nitrogen value
obtained by a factor of 6.25.
The percentage of protein recovery from the fish was defined as the ratio
of protein yield obtained from the extraction process to the amount of total protein
estimated by Kjeldahl and was calculated as follows:
Recovered protein (%) = Protein in hydrolysate sample x volume of hydrolysate x100 Weight of raw material taken x protein in raw material
3.2.4 Yield
Yield of fish protein hydrolysate was calculated as the quantity of hydrolysate
powder obtained after spray drying from the amount of raw material used for
hydrolysis and was expressed as:Yield (%) = Amount of hydrolysate powder obtained x 100 Total amount of raw material used
3.2.5 Degree of hydrolysis and proteolytic activity
Formal titration method as described by Taylor (1957) was used to
determine the α-amino nitrogen content of tuna protein hydrolysate. Aliquot of
protein hydrolysate solution (2 ml) was mixed with equi-volume of formaldehyde
solution (30 %) and double distilled water. To this mixture, two to three drops of
phenolphthalein indicator was added. This solution was titrated using standard
sodium hydroxide solution (0.1 N) till the pink color appeared. The alpha amino
nitrogen content was calculated as:
44 Optimization of process parameters for enzymatic hydrolysis of tuna red meat protein
Chapter 3
α - amino nitrogen = 14 (TVs–TVb) x N x TV SV
where, 14- atomic weight of nitrogen; TVs- Volume of NaOH used for titration in
sample; TVb- Volume of NaOH used for titration in blank; N-Normality of NaOH
used; TV-Total volume used for titration; SV-Volume of hydrolysate sample taken
for titration.
Degree of hydrolysis was determined (Cao et al., 2008) as the percentage of
α - amino nitrogen in hydrolysate, to the total nitrogen content in the raw material
(AOAC, 2012) as follows:
DH (%) = AAN x TWH x 100
TN x TWM
Where, AAN is α-amino nitrogen (mg/ml of hydrolysates); TWH: total amount of
hydrolysates obtained (ml); TN: total nitrogen content in raw material (mg/g of
protein); TWM: total amount of raw material taken.
Proteolytic activity of the sample was projected from the tyrosine content
of the protein hydrolysate which measured the extent of hydrolysis under given
conditions. Absorbance of a known measure of diluted liquid hydrolysate solution
(≈ 50 µl made upto 3 ml with double distilled water) was measured at 280 nm
(Lambda 25 UV/Vis, Perkin Elmer Life and Analytical Sciences, Singapore).
Standard curve of L-tyrosine in 0.2 M HCl was used to determine the tyrosine
content of sample using a concentration ranging from 0.025 mg / ml to 0.2 mg / ml
of tyrosine. The analysis was carried out in triplicate and average value was used
for plotting. Tyrosine content of unknown sample obtained from standard graph
was expressed in µ mole of tyrosine liberated/mg of protein (Gajanan, 2014).
3.2.6 Colour and browning intensity
Hydrolysate solution (1.0 %) was analysed for its colour characteristics
viz., L* (the degree of lightness), a* (redness (+)/greenness (-)) and b* (yellowness
45Optimization of process parameters for enzymatic hydrolysis of tuna red meat protein
Quality assessment of peptides from white and red meat of yellowfn tuna (hunnus allaaaress
(+) or blueness (-)) using Hunter Lab colorimeter (Colorflex EZ 45/0, Hunter
Associates Lab inc., Reston, Virginia, USA).
The browning intensity of hydrolysate samples were determined by measuring
the absorbance of filtered samples (80 mg/ml) using UV-VIS spectrophotometer
(Lambda 25 UV/Vis, Perkin Elmer Life and Analytical Sciences, Singapore) at 420
nm (Elavarasan and Shamasundar, 2016).
3.2.7 Ultraviolet absorption spectra
UV absorption spectra of the diluted hydrolysate samples (2 mg/ml) were
determined as per the methodology reported by Elavarasan and Shamasundar
(2016). UV-VIS spectrophotometer (Lambda 25 UV/Vis, Perkin Elmer Life and
Analytical Sciences, Singapore) under the conditions viz., wavelength range of
200-330 nm and scan speed of 2 nm/sec was employed for the spectra.
3.2.8 Functional properties
3.2.8.1 Protein solubility
Protein solubility of the samples was calculated as per the methodology
of Morr et al. (1985). Protein hydrolysate samples (10 mg/ml, 20 ml) were well
dispersed in distilled water at ambient temperature for 30 min. This was followed
by centrifuging at 7500 g for 15 min (K-24A, Remi Instruments, Mumbai) to collect
the supernatant solution. Protein solubility was calculated as percentage of total
protein in supernatant to the total protein in sample.
Protein Solubility (%) =Total Protein content in Supernatant x 100 Total Protein content in Sample
3.2.8.2 Foaming properties
The methodology of Sathe and Salunkhe (1981) was adopted for determining
the foaming properties of protein solution. A known volume of protein solution (1.0
%) was homogenized (230 VAC T-25 digital Ultra-turrax, IKA, India) at 16,000
46 Optimization of process parameters for enzymatic hydrolysis of tuna red meat protein
Chapter 3
rpm for 2 min at ambient temperature and the whipped sample was immediately
transferred to a measuring cylinder and the volume read immediately and after three
minutes to calculate the properties as:
Foaming capacity/stability % = (A-B) x100 B
where A is the volume after whipping to determine foaming capacity; volume after
standing (foam stability), B is the volume before whipping.
3.2.8.3 Emulsifying properties
Evaluation of emulsifying properties was done as per the methodology of
Pearce and Kinsella (1978). 10 ml vegetable oil and 30 ml of 1 % protein hydrolysate
solution were thoroughly homogenized (230 VAC T- 25 digital Ultra-turrax, IKA,
India) for 1 min @ 20,000 rpm. An aliquot of the emulsion (50 μl) pipetted from
the bottom of the container at 0 and 10 min were mixed with 0.1 % sodium dodecyl
sulphate solution (5 ml) to read the absorbance at 500 nm (Lambda 25 UV/Vis,
Perkin Elmer Life and Analytical Sciences, Singapore) immediately (A0) and 10
min (A10) after emulsion formations:
EAI( Emulsion Activity Index) (m2/g) = 2 x 2.303 x A0
0.25 x wt of protein
ESI (Emulsion Stability Index) (min) = A10 x Δt
ΔA
3.2.8.4 Oil absorption capacity
Oil absorption capacity (OAC) of protein samples was determined following
the methodology of Shahidi et al. (1995). Hydrolysate sample and sunflower oil, in
the ratio of 1: 20 (w/v) was taken in a pre-weighed centrifuge tube and vortexed (Expo
Hitech, India) for 30 sec followed by centrifugation (K-24A, Remi Instruments,
Mumbai) at 2800 g for 25 min and the supernatant/free oil was decanted. OAC was
47Optimization of process parameters for enzymatic hydrolysis of tuna red meat protein
Quality assessment of peptides from white and red meat of yellowfn tuna (hunnus allaaaress
denoted as the weight of oil held per gram of the sample (g oil/g sample).
3.2.8.5 Sensory properties
The sample acceptability was assessed as per the methodology by Normah
et al. (2013). Rawa porridge, used as carrier for the study, was mixed with 1 % (5:1
(w/v)) hydrolysate solutions and evaluated for attributes viz., color, odour, taste
and overall acceptability using nine point hedonic scale (Annexure 1). The sample
bitterness was scored using 10 point scale designed with 01 as ‘no bitterness’ to 10
indicating ‘extreme bitterness’ (Nilsang et al., 2005). The scale of bitterness was
anchored using standard caffeine solution as the reference (Annexure 2).
3.2.9 Antioxidative properties
3.2.9.1 DPPH radical scavenging activity
DPPH radical scavenging activity was determined as proposed by Shimada
et al.(1992). A known concentration of protein hydrolysate solution (2.0 mg protein/
ml) was mixed with equal volume of 0.1 mM DPPH dissolved in 95% ethanol.
The mixture was further incubated in dark for 30 min. The absorbance of the
resultant solution was recorded at 517 nm (Lambda 25 UV/Vis, Perkin Elmer Life
and Analytical Sciences, Singapore). Sample solution and ethanol (1:1 v/v) was
considered as sample blank and DPPH with distilled water (1:1v/v) was used as
control:
DPPH (%) = (Abs control – (Abs sample – Abs sample blank) x 100 Abs control
3.2.9.2 Reducing power
Reducing power (RP) of sample was assessed following the methodology of
Oyaiza (1986). About 0.5 ml of 1 % protein solution mixed with 0.2 M phosphate
buffer (pH 6.6) and 1 % potassium ferricyanide (2.5 ml each) was incubated at 50oC
for 20 min. Further an aliquot (2.5 ml) of 10 % trichoroacetic acid was added to the
48 Optimization of process parameters for enzymatic hydrolysis of tuna red meat protein
Chapter 3
mixture, centrifuged at 3000 rpm (K-24A, Remi Instruments, Mumbai) for 10 min
and 2.5 ml of supernatant was mixed with equal volume of distilled water and 0.1
% ferric chloride and absorbance read at 700 nm (Lambda 25 UV/Vis, Perkin Elmer
Life and Analytical Sciences, Singapore) (Oyaiza, 1986). Increased absorbance of
the reaction mixture indicates increasing reducing power.
3.2.9.3 Ferric reducing antioxidant power
FRAP was assayed according to the method described by Benzie and Strain
(1996). FRAP solution was prepared freshly by incubating a premix containing
300 mM acetate buffer (pH 3.6) (25 ml), 10 mM TPTZ (2,4,6-tripyridyl-s-triazine)
solution (2.5 ml) in 40 mM HCl and 2.5 ml of 20 mM FeCl3. 6H2O solution at 37
°C for 30 min. 2850 μl of this FRAP solution and 150 μl of 10 mg/ml sample was
mixed and incubated in dark for 30 min to form ferrous tripyridyl triazine complex
which was measured for the absorbance at 593 nm (Lambda 25 UV/Vis, Perkin
Elmer Life and Analytical Sciences, Singapore). Ascorbic Acid standard curve for
FRAP was derived to measure the FRAP activity in terms of mM Ascorbic acid
equivalents.
3.2.9.4 Metal chelating activity
The chelating activity on Fe2+ was determined, using the method of Decker
and Welch (1990). One ml of known concentration of sample solution was mixed
with 3.7 ml of distilled water. To this diluted solution, 2 mM FeCl2 (0.1 ml) and
5 mM 3-(2-pyridyl)-5,6- bis(4-phenyl-sulfonic acid)-1,2,4-triazine (ferrozine) (0.2
ml) was added, incubated at ambient conditions for 20 min and the absorbance
read at 562 nm (Lambda 25 UV/Vis, Perkin Elmer Life and Analytical Sciences,
Singapore). Control was prepared in the same manner with distilled water instead
of sample. Metal chelating activity was calculated as:
MC (%) = 1 – (Absorbance of sample) x 100 (Absorbance of control)
49Optimization of process parameters for enzymatic hydrolysis of tuna red meat protein
Quality assessment of peptides from white and red meat of yellowfn tuna (hunnus allaaaress
3.2.9.5 ABTS radical (2,20 -azinobis-(3-ethylbenzothiazoline-6-sulfonic
acid)) scavenging activity
The modified method of Re et al. (1999) was followed to determine ABTS
radical scavenging activity of the sample. The stock solution of ABTS radical
stock solution consisting of 7 mM ABTS in 2.45 mM potassium persulfate, was
pre-incubated in dark for 16 h at ambient temperature. The working solution of
ABTS radical with absorbance of 0.70 ± 0.02 at 734 nm was prepared and mixed
with 20 µl of sample (10 mg/ml) or distilled water (in control) and the reduction
in absorbance was noted (Lambda 25 UV/Vis, Perkin Elmer Life and Analytical
Sciences, Singapore) after incubation at 37oC for 10 min in dark.
ABTS radical scavenging activity = (1 – Abs sample ) x 100 Abs control
3.2.10 Statistical interpretation
All analysis done in triplicate was subjected to analysis of variance (ANOVA)
and the differences between means were evaluated by Duncan’s multiple range test.
SPSS statistic programme (SPSS 16.0 for Windows, SPSS Inc., Chicago, IL,) was
used for data interpretation.
50 Optimization of process parameters for enzymatic hydrolysis of tuna red meat protein
Chapter 3
3.3 Results and discussion
3.3.1 Protein content and protein recovery
Assessment regarding the nutrient intake from food consumption requires
reliable data on the food composition. Knowledge regarding the fundamentals
of food-based dietary guidelines containing the essential information on food
sources for different nutrients is essential for healthy nutrition. Furthermore, food
composition tables can provide information on chemical forms of nutrients and the
presence and amounts of interacting components, and thus provide information on
their bioavailability. Further knowledge regarding the nutritional status of food helps
in streamlining the processing possibilities as well as for exploring their utility for
various applications in food and pharmaceutical sectors. Fish by-products like tuna
red meat have nutritional composition comparable to that of the main product viz.,
white meat which facilitates its diversion to high value end products with enormous
application potentials (Herpandi et al., 2011). Tuna is known for its richness in
protein and is regarded as one of the richest source of seafood protein. The protein
content in tuna white meat and red meat of yellowfin tuna revealed a value of 25.99
± 0.24 % and 24.03±0.11 %, respectively which got concentrated to 84.4 ± 2.35
% and 85.87 ± 0.91 %, on conversion to their respective protein hydrolysates viz.,
TWPH and TRPH (Fig. 3.4). Results indicated comparable protein content between
white and red meat of yellowfin tuna. Sanchez-Zapata et al. (2011) in their studies
reported a protein content of 26.92 ± 0.27 % for yellowfin tuna dark meat. During
enzymatic hydrolysis, parent protein is subjected to breakage, facilitating their
selective extraction by proper solubilization to yield higher protein content in the
derived hydrolysate. Various studies on hydrolysate derived from different seafood
substrates, revealed a protein content ranging from 60 - 90 % of total composition
(Choi et al., 2009; Khantaphant et al., 2011). The high protein content in fish protein
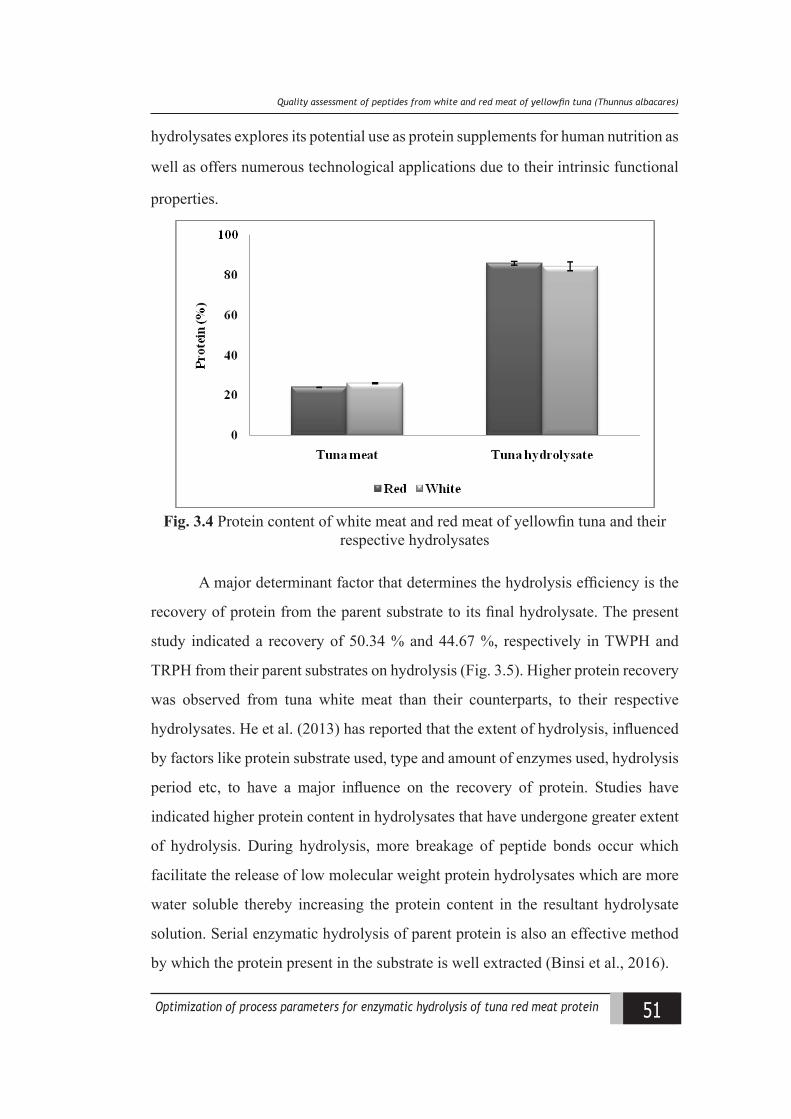
51Optimization of process parameters for enzymatic hydrolysis of tuna red meat protein
Quality assessment of peptides from white and red meat of yellowfn tuna (hunnus allaaaress
hydrolysates explores its potential use as protein supplements for human nutrition as
well as offers numerous technological applications due to their intrinsic functional
properties.
Fig. 3.4 Protein content of white meat and red meat of yellowfin tuna and their respective hydrolysates
A major determinant factor that determines the hydrolysis efficiency is the
recovery of protein from the parent substrate to its final hydrolysate. The present
study indicated a recovery of 50.34 % and 44.67 %, respectively in TWPH and
TRPH from their parent substrates on hydrolysis (Fig. 3.5). Higher protein recovery
was observed from tuna white meat than their counterparts, to their respective
hydrolysates. He et al. (2013) has reported that the extent of hydrolysis, influenced
by factors like protein substrate used, type and amount of enzymes used, hydrolysis
period etc, to have a major influence on the recovery of protein. Studies have
indicated higher protein content in hydrolysates that have undergone greater extent
of hydrolysis. During hydrolysis, more breakage of peptide bonds occur which
facilitate the release of low molecular weight protein hydrolysates which are more
water soluble thereby increasing the protein content in the resultant hydrolysate
solution. Serial enzymatic hydrolysis of parent protein is also an effective method
by which the protein present in the substrate is well extracted (Binsi et al., 2016).
52 Optimization of process parameters for enzymatic hydrolysis of tuna red meat protein
Chapter 3
3.3.2 Yield
The sustainability as well as economic viability of a process is determined by
the product yield obtained during the process. Several factors influence this variable
which includes degree of hydrolysis, drying method adopted etc. The present study
revealed a comparable yield of 6.1 and 6.0 %, for spray dried TWPH and TRPH,
respectively from their solution (Fig. 3.5). However the values indicated a lower
yield which matches with the general yield reports for spray-dried hydrolysates.
This is due to the fact that only the soluble fractions were dried and also on account
of the solid losses that occured in the apparatus during drying operation. Drying
operations carried out under batch mode generally offer a lower yield while higher
operations on continuous mode are reported to give better yield. The current drying
operation was also done on a small scale batch mode, which must have resulted in
lower yield. Reports have indicated a yield of about 6.6 % for freeze dried herring
fish protein hydrolysate (Liceaga‐Gesualdo and Li‐Chan, 1999). Gajanan et al.
(2016) reported a hydrolysate yield ranging from 4.6 to 9.7 % from threadfin bream
frame waste for degree of hydrolysis ranging from 5 -15 %. In general, reports
suggested a yield ranging between 10-15 % based on the substrate used as well
as hydrolytic conditions and further drying methods adopted (Quaglia and Orban,
1990).
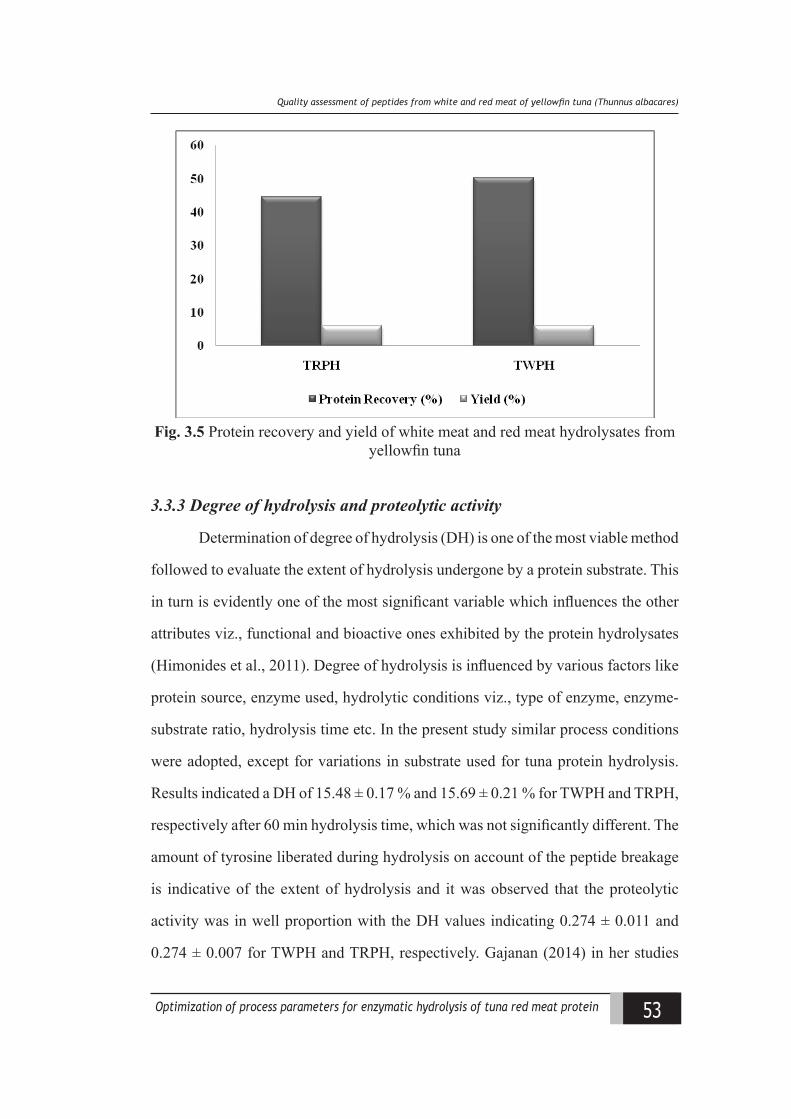
53Optimization of process parameters for enzymatic hydrolysis of tuna red meat protein
Quality assessment of peptides from white and red meat of yellowfn tuna (hunnus allaaaress
Fig. 3.5 Protein recovery and yield of white meat and red meat hydrolysates from yellowfin tuna
3.3.3 Degree of hydrolysis and proteolytic activity
Determination of degree of hydrolysis (DH) is one of the most viable method
followed to evaluate the extent of hydrolysis undergone by a protein substrate. This
in turn is evidently one of the most significant variable which influences the other
attributes viz., functional and bioactive ones exhibited by the protein hydrolysates
(Himonides et al., 2011). Degree of hydrolysis is influenced by various factors like
protein source, enzyme used, hydrolytic conditions viz., type of enzyme, enzyme-
substrate ratio, hydrolysis time etc. In the present study similar process conditions
were adopted, except for variations in substrate used for tuna protein hydrolysis.
Results indicated a DH of 15.48 ± 0.17 % and 15.69 ± 0.21 % for TWPH and TRPH,
respectively after 60 min hydrolysis time, which was not significantly different. The
amount of tyrosine liberated during hydrolysis on account of the peptide breakage
is indicative of the extent of hydrolysis and it was observed that the proteolytic
activity was in well proportion with the DH values indicating 0.274 ± 0.011 and
0.274 ± 0.007 for TWPH and TRPH, respectively. Gajanan (2014) in her studies
54 Optimization of process parameters for enzymatic hydrolysis of tuna red meat protein
Chapter 3
reported the proteolyic activity to be increasing with hydrolysis in threadfin bream
frame waste hydrolysate. Similar observations were made by Elavarasan (2014) in
catla protein hydrolysate where a progressive increase in the tyrosine liberated was
observed with increase in time of hydrolysis.
3.3.4 Colour and browning intensity
Among the sensory attributes, colour and appearance of a product seems to
be the preliminary aesthetic attributes which have an influencial role in determining
the consumer acceptability. These variables are in turn influenced by other factors
including substrate type, hydrolysis conditions and the drying methods adopted etc.
The L*, a*, b* value of tuna white meat were 37.54 ± 0.11, 9.71 ± 0.16, 16.85 ± 0.37
and for red meat 22.46 ± 0.25, 10.37 ± 0.05, 14.82 ± 0.09, respectively (Fig. 3.6)
indicating significant difference (p < 0.05). The current work indicated that TRPH
was darker in comparison to their counterpart which was mainly on account of the
raw material compositional variations. These variations (p < 0.05) were noticeable
in the derived hydrolysate solutions too with L, a*, b* values of 2.58 ± 0.05, -0.1
± 0.04, -0.03 ± 0.01, respectively for TWPH (20 ml). Similarly TRPH indicated
a value of 2.69 ± 0.06, 0.83 ± 0.03 and 2.14 ± 0.15, respectively on instrumental
analysis (Fig. 3.7). Parvathy et al. (2016) reported these colour variations in
hydrolysate being due to the compositional variation of the raw material used.
Similar to the colour values which indicated a higher redness and yellowness in
TRPH solutions, browning intensity values also substantiated a higher value of 0.35
± 0.12 for hydrolysate derived from tuna red meat (p < 0.05) than their counterpart
which exhibited a value of 0.115 ± 0.001. As recommended by Jemil et al. (2014),
the presence of pigments like myoglobin and melanin in the red meat in comparison
to white meat and their oxidation must have resulted in this variation in the derived
hydrolysates.
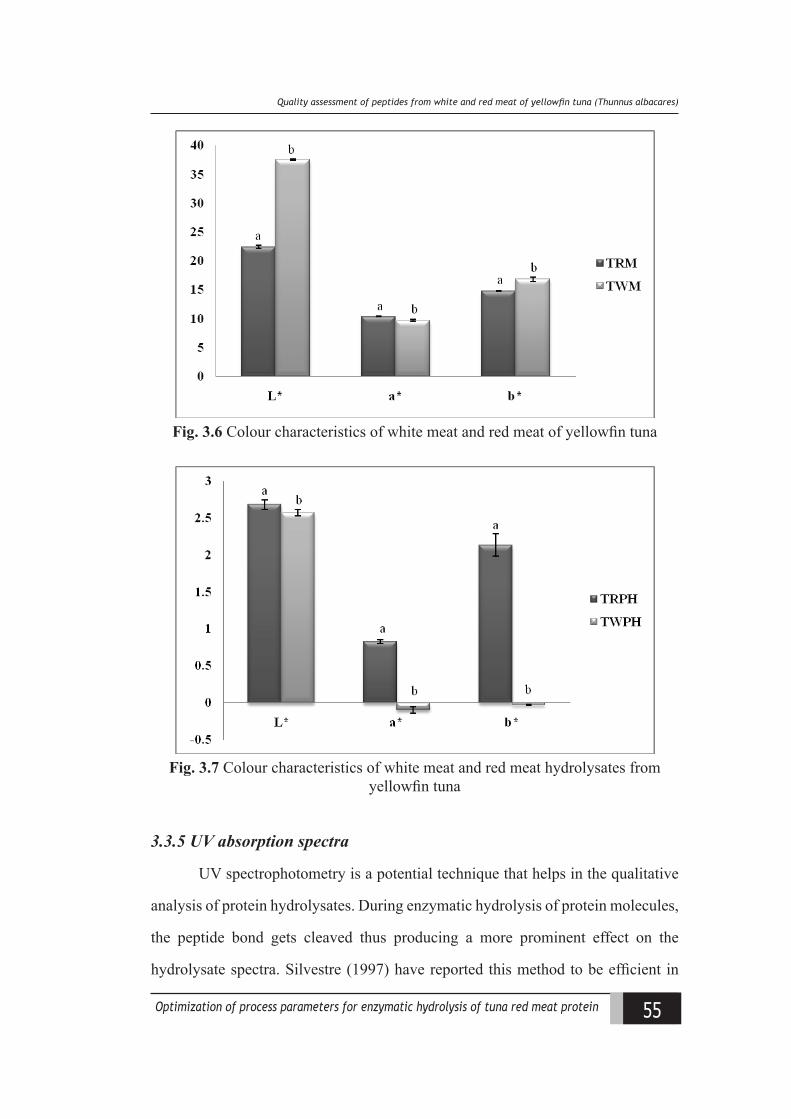
55Optimization of process parameters for enzymatic hydrolysis of tuna red meat protein
Quality assessment of peptides from white and red meat of yellowfn tuna (hunnus allaaaress
Fig. 3.6 Colour characteristics of white meat and red meat of yellowfin tuna
Fig. 3.7 Colour characteristics of white meat and red meat hydrolysates from yellowfin tuna
3.3.5 UV absorption spectra
UV spectrophotometry is a potential technique that helps in the qualitative
analysis of protein hydrolysates. During enzymatic hydrolysis of protein molecules,
the peptide bond gets cleaved thus producing a more prominent effect on the
hydrolysate spectra. Silvestre (1997) have reported this method to be efficient in
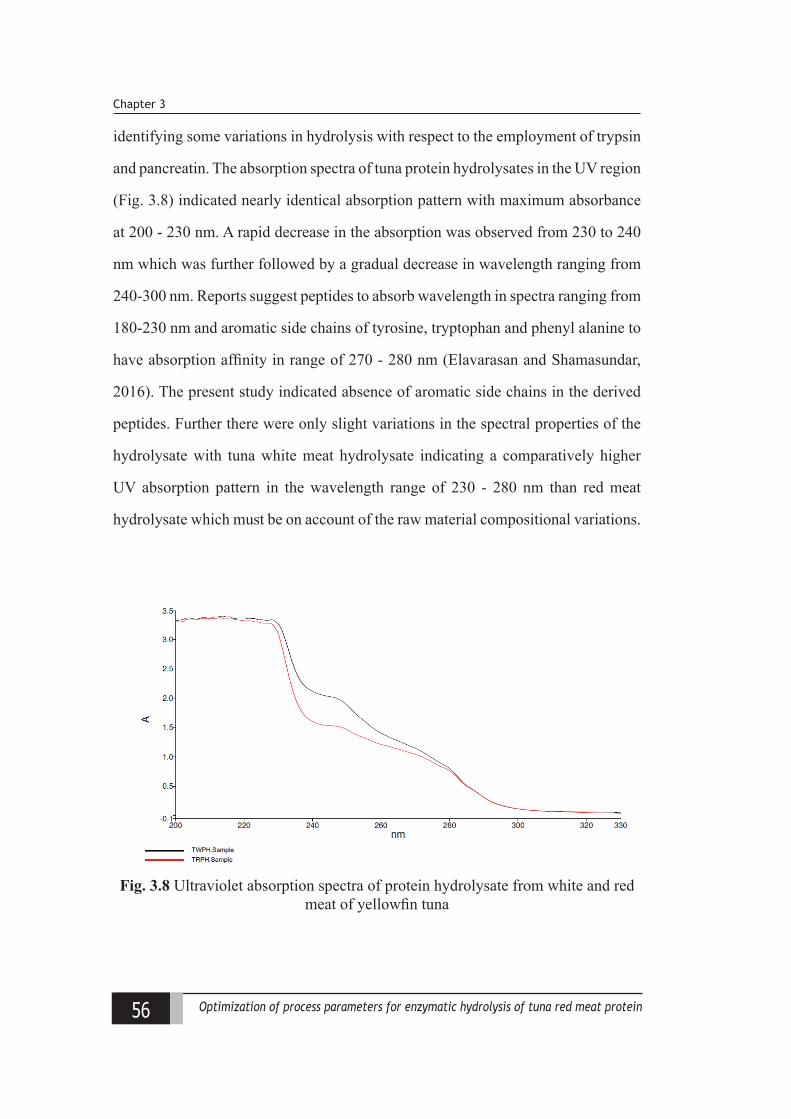
56 Optimization of process parameters for enzymatic hydrolysis of tuna red meat protein
Chapter 3
identifying some variations in hydrolysis with respect to the employment of trypsin
and pancreatin. The absorption spectra of tuna protein hydrolysates in the UV region
(Fig. 3.8) indicated nearly identical absorption pattern with maximum absorbance
at 200 - 230 nm. A rapid decrease in the absorption was observed from 230 to 240
nm which was further followed by a gradual decrease in wavelength ranging from
240-300 nm. Reports suggest peptides to absorb wavelength in spectra ranging from
180-230 nm and aromatic side chains of tyrosine, tryptophan and phenyl alanine to
have absorption affinity in range of 270 - 280 nm (Elavarasan and Shamasundar,
2016). The present study indicated absence of aromatic side chains in the derived
peptides. Further there were only slight variations in the spectral properties of the
hydrolysate with tuna white meat hydrolysate indicating a comparatively higher
UV absorption pattern in the wavelength range of 230 - 280 nm than red meat
hydrolysate which must be on account of the raw material compositional variations.
Fig. 3.8 Ultraviolet absorption spectra of protein hydrolysate from white and red meat of yellowfin tuna
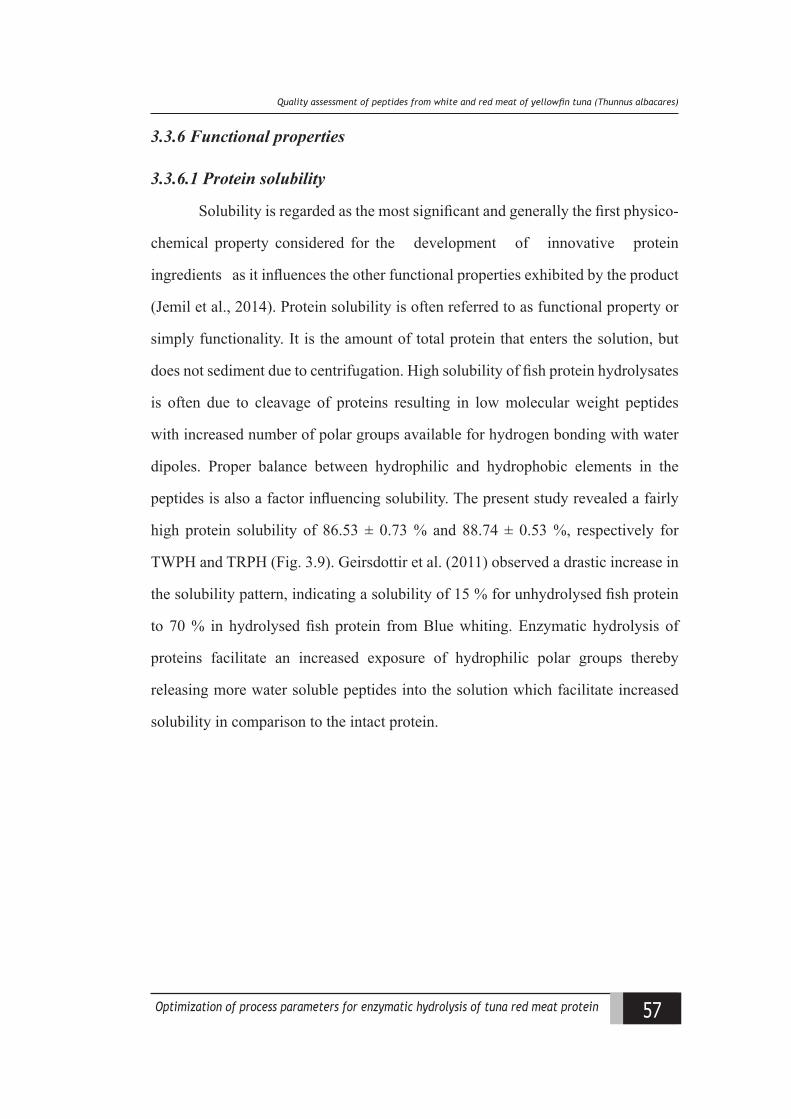
57Optimization of process parameters for enzymatic hydrolysis of tuna red meat protein
Quality assessment of peptides from white and red meat of yellowfn tuna (hunnus allaaaress
3.3.6 Functional properties
3.3.6.1 Protein solubility
Solubility is regarded as the most significant and generally the first physico-
chemical property considered for the development of innovative protein
ingredients as it influences the other functional properties exhibited by the product
(Jemil et al., 2014). Protein solubility is often referred to as functional property or
simply functionality. It is the amount of total protein that enters the solution, but
does not sediment due to centrifugation. High solubility of fish protein hydrolysates
is often due to cleavage of proteins resulting in low molecular weight peptides
with increased number of polar groups available for hydrogen bonding with water
dipoles. Proper balance between hydrophilic and hydrophobic elements in the
peptides is also a factor influencing solubility. The present study revealed a fairly
high protein solubility of 86.53 ± 0.73 % and 88.74 ± 0.53 %, respectively for
TWPH and TRPH (Fig. 3.9). Geirsdottir et al. (2011) observed a drastic increase in
the solubility pattern, indicating a solubility of 15 % for unhydrolysed fish protein
to 70 % in hydrolysed fish protein from Blue whiting. Enzymatic hydrolysis of
proteins facilitate an increased exposure of hydrophilic polar groups thereby
releasing more water soluble peptides into the solution which facilitate increased
solubility in comparison to the intact protein.
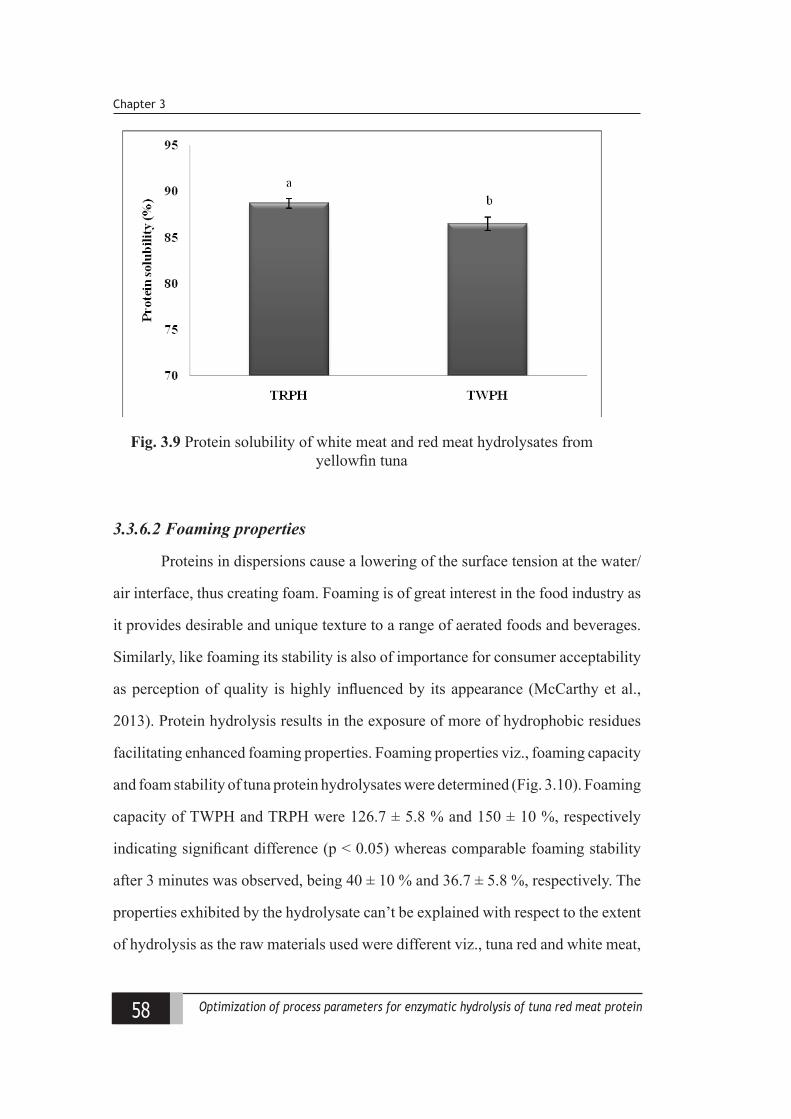
58 Optimization of process parameters for enzymatic hydrolysis of tuna red meat protein
Chapter 3
Fig. 3.9 Protein solubility of white meat and red meat hydrolysates from yellowfin tuna
3.3.6.2 Foaming properties
Proteins in dispersions cause a lowering of the surface tension at the water/
air interface, thus creating foam. Foaming is of great interest in the food industry as
it provides desirable and unique texture to a range of aerated foods and beverages.
Similarly, like foaming its stability is also of importance for consumer acceptability
as perception of quality is highly influenced by its appearance (McCarthy et al.,
2013). Protein hydrolysis results in the exposure of more of hydrophobic residues
facilitating enhanced foaming properties. Foaming properties viz., foaming capacity
and foam stability of tuna protein hydrolysates were determined (Fig. 3.10). Foaming
capacity of TWPH and TRPH were 126.7 ± 5.8 % and 150 ± 10 %, respectively
indicating significant difference (p < 0.05) whereas comparable foaming stability
after 3 minutes was observed, being 40 ± 10 % and 36.7 ± 5.8 %, respectively. The
properties exhibited by the hydrolysate can’t be explained with respect to the extent
of hydrolysis as the raw materials used were different viz., tuna red and white meat,
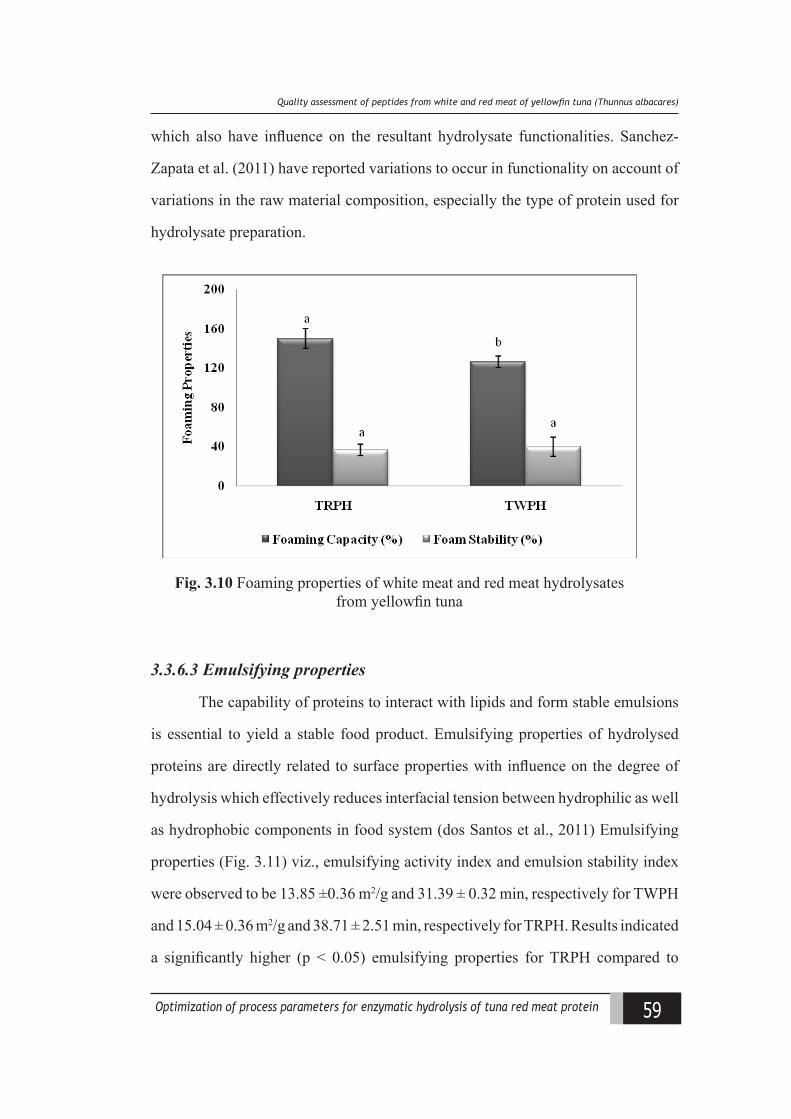
59Optimization of process parameters for enzymatic hydrolysis of tuna red meat protein
Quality assessment of peptides from white and red meat of yellowfn tuna (hunnus allaaaress
which also have influence on the resultant hydrolysate functionalities. Sanchez-
Zapata et al. (2011) have reported variations to occur in functionality on account of
variations in the raw material composition, especially the type of protein used for
hydrolysate preparation.
Fig. 3.10 Foaming properties of white meat and red meat hydrolysates from yellowfin tuna
3.3.6.3 Emulsifying properties
The capability of proteins to interact with lipids and form stable emulsions
is essential to yield a stable food product. Emulsifying properties of hydrolysed
proteins are directly related to surface properties with influence on the degree of
hydrolysis which effectively reduces interfacial tension between hydrophilic as well
as hydrophobic components in food system (dos Santos et al., 2011) Emulsifying
properties (Fig. 3.11) viz., emulsifying activity index and emulsion stability index
were observed to be 13.85 ±0.36 m2/g and 31.39 ± 0.32 min, respectively for TWPH
and 15.04 ± 0.36 m2/g and 38.71 ± 2.51 min, respectively for TRPH. Results indicated
a significantly higher (p < 0.05) emulsifying properties for TRPH compared to
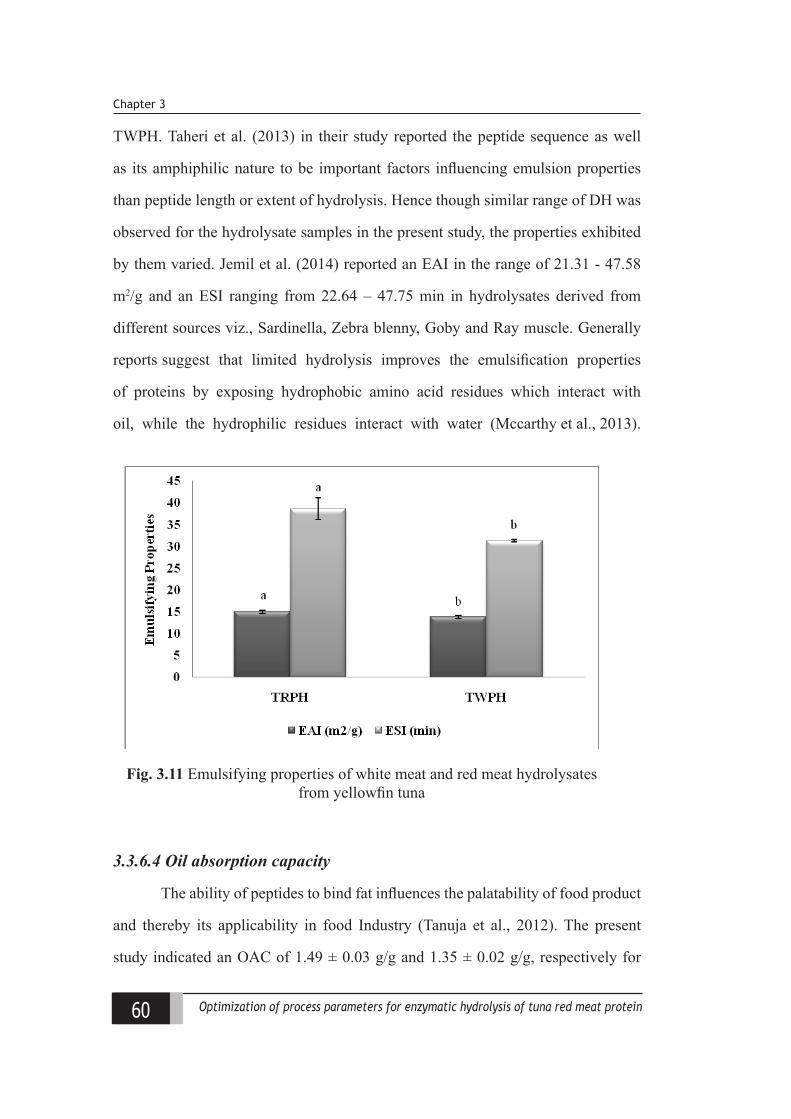
60 Optimization of process parameters for enzymatic hydrolysis of tuna red meat protein
Chapter 3
TWPH. Taheri et al. (2013) in their study reported the peptide sequence as well
as its amphiphilic nature to be important factors influencing emulsion properties
than peptide length or extent of hydrolysis. Hence though similar range of DH was
observed for the hydrolysate samples in the present study, the properties exhibited
by them varied. Jemil et al. (2014) reported an EAI in the range of 21.31 - 47.58
m2/g and an ESI ranging from 22.64 – 47.75 min in hydrolysates derived from
different sources viz., Sardinella, Zebra blenny, Goby and Ray muscle. Generally
reports suggest that limited hydrolysis improves the emulsification properties
of proteins by exposing hydrophobic amino acid residues which interact with
oil, while the hydrophilic residues interact with water (Mccarthy et al., 2013).
Fig. 3.11 Emulsifying properties of white meat and red meat hydrolysates from yellowfin tuna
3.3.6.4 Oil absorption capacity
The ability of peptides to bind fat influences the palatability of food product
and thereby its applicability in food Industry (Tanuja et al., 2012). The present
study indicated an OAC of 1.49 ± 0.03 g/g and 1.35 ± 0.02 g/g, respectively for
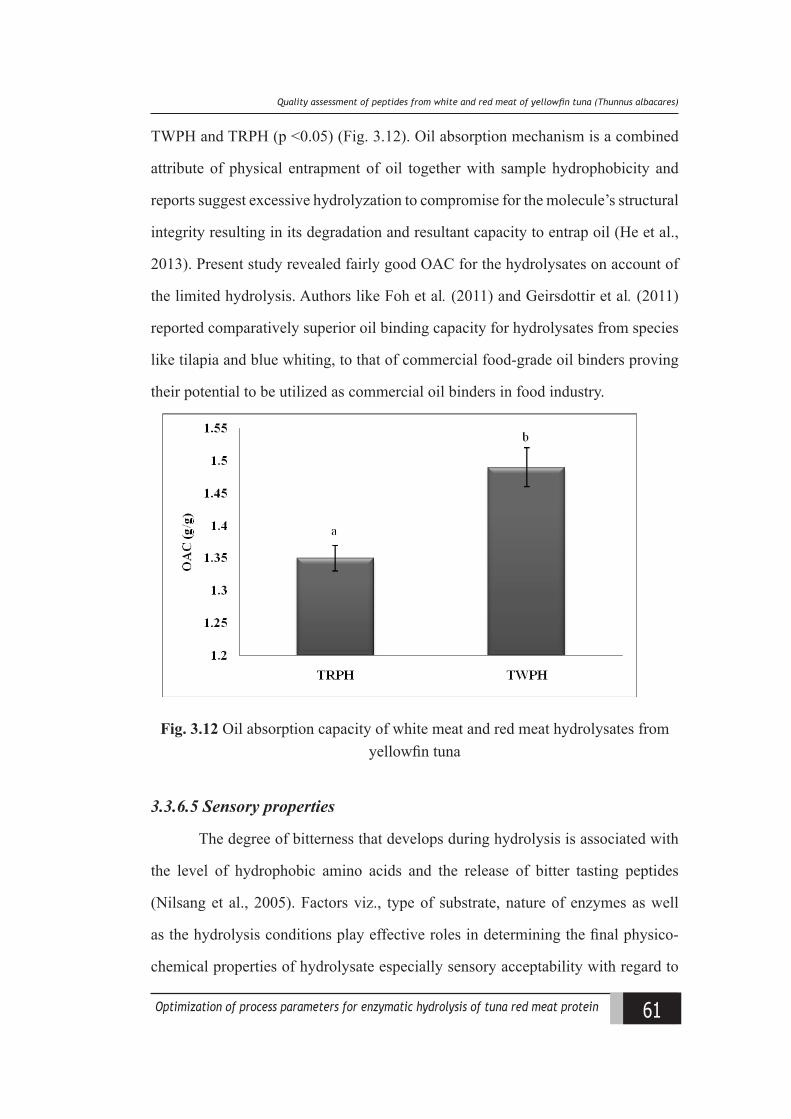
61Optimization of process parameters for enzymatic hydrolysis of tuna red meat protein
Quality assessment of peptides from white and red meat of yellowfn tuna (hunnus allaaaress
TWPH and TRPH (p <0.05) (Fig. 3.12). Oil absorption mechanism is a combined
attribute of physical entrapment of oil together with sample hydrophobicity and
reports suggest excessive hydrolyzation to compromise for the molecule’s structural
integrity resulting in its degradation and resultant capacity to entrap oil (He et al.,
2013). Present study revealed fairly good OAC for the hydrolysates on account of
the limited hydrolysis. Authors like Foh et al. (2011) and Geirsdottir et al. (2011)
reported comparatively superior oil binding capacity for hydrolysates from species
like tilapia and blue whiting, to that of commercial food-grade oil binders proving
their potential to be utilized as commercial oil binders in food industry.
Fig. 3.12 Oil absorption capacity of white meat and red meat hydrolysates from yellowfin tuna
3.3.6.5 Sensory properties
The degree of bitterness that develops during hydrolysis is associated with
the level of hydrophobic amino acids and the release of bitter tasting peptides
(Nilsang et al., 2005). Factors viz., type of substrate, nature of enzymes as well
as the hydrolysis conditions play effective roles in determining the final physico-
chemical properties of hydrolysate especially sensory acceptability with regard to
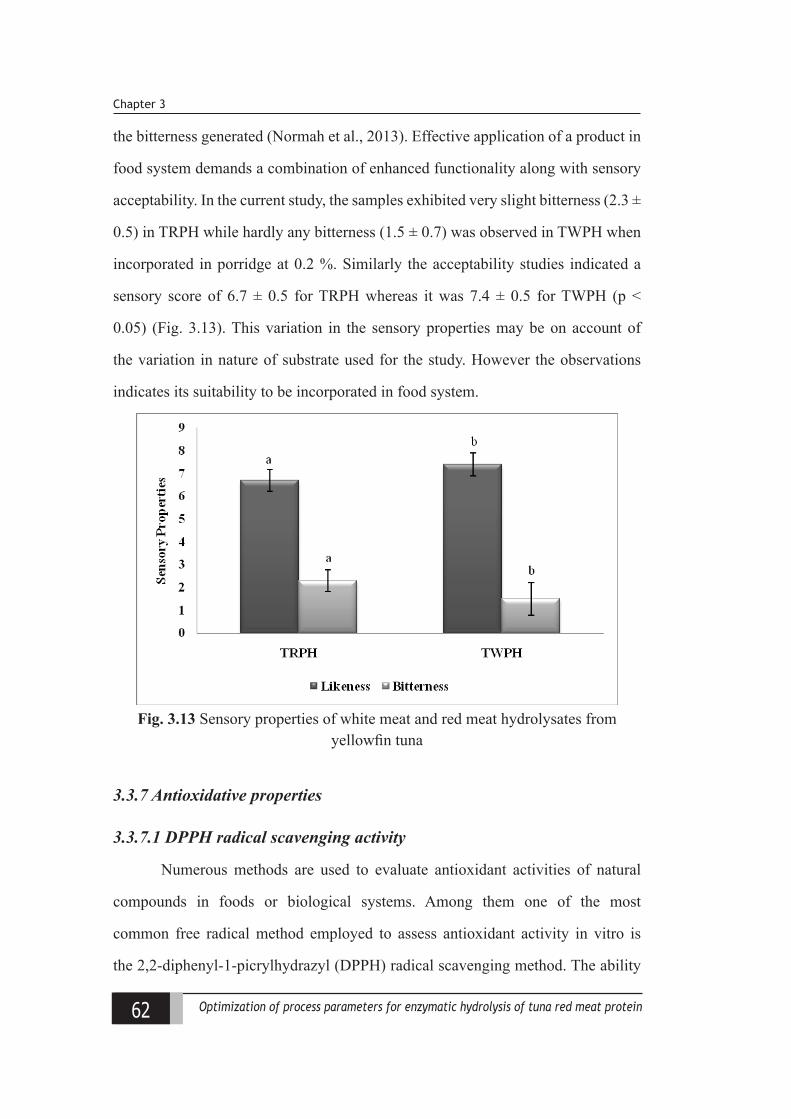
62 Optimization of process parameters for enzymatic hydrolysis of tuna red meat protein
Chapter 3
the bitterness generated (Normah et al., 2013). Effective application of a product in
food system demands a combination of enhanced functionality along with sensory
acceptability. In the current study, the samples exhibited very slight bitterness (2.3 ±
0.5) in TRPH while hardly any bitterness (1.5 ± 0.7) was observed in TWPH when
incorporated in porridge at 0.2 %. Similarly the acceptability studies indicated a
sensory score of 6.7 ± 0.5 for TRPH whereas it was 7.4 ± 0.5 for TWPH (p <
0.05) (Fig. 3.13). This variation in the sensory properties may be on account of
the variation in nature of substrate used for the study. However the observations
indicates its suitability to be incorporated in food system.
Fig. 3.13 Sensory properties of white meat and red meat hydrolysates from yellowfin tuna
3.3.7 Antioxidative properties
3.3.7.1 DPPH radical scavenging activity
Numerous methods are used to evaluate antioxidant activities of natural
compounds in foods or biological systems. Among them one of the most
common free radical method employed to assess antioxidant activity in vitro is
the 2,2-diphenyl-1-picrylhydrazyl (DPPH) radical scavenging method. The ability

63Optimization of process parameters for enzymatic hydrolysis of tuna red meat protein
Quality assessment of peptides from white and red meat of yellowfn tuna (hunnus allaaaress
of fish peptides in exerting potent antioxidative activities in different oxidative
systems is well reported (Rajapakse et al., 2005). Hydrolysis of protein results in its
structure unfolding to facilitate the exposure of more of hydrophobic amino acids
which in turn leads to improved antioxidative activity compared to the intact protein
(Sarmadi and Ismail, 2010). Depending on the assay system, an antioxidant may
exhibit variations in their potential based on the antioxidative mechanism being
measured as well as the reaction conditions used in the various assays (Najafian and
Babji, 2012). Hence in the present study different antioxidant assays were carried out
to comparatively analyse the properties exhibited by the tuna hydrolysates. DPPH
radical-scavenging activity determines the hydrogen-donating ability of protein
hydrolysates which assists in breaking of the radical chain reaction (Yarnpakdee
et al., 2015). The comparison of this antioxidant assay in 0.2% solutions of TWPH
and TRPH indicated a significant difference (p < 0.05) revealing higher potential
for TWPH than TRPH (Fig. 3.14). Yarnpakdee et al. (2015) observed differences
in the DPPH radical scavenging activity in Nile tilapia hydrolysate to be associated
with the extent of hydrolysis with an increase upto 30 % beyond which it decreased.
However the better antioxidant potential of TWPH in comparison to TRPH in the
present study can’t be related to the extent of hydrolysis undergone by the sample.
Similar reports were suggested by Slizyte et al. (2016) mentioning that degree of
hydrolysis and size of produced peptides can not alone predict the DPPH scavenging
ability.
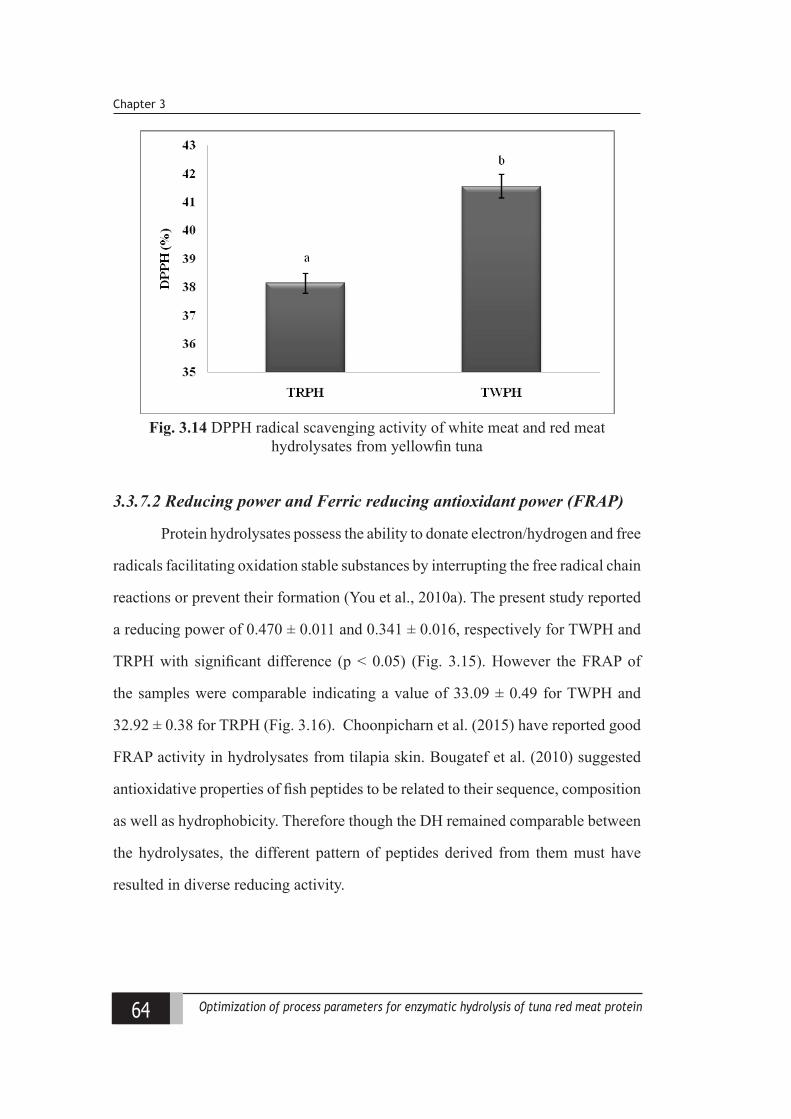
64 Optimization of process parameters for enzymatic hydrolysis of tuna red meat protein
Chapter 3
Fig. 3.14 DPPH radical scavenging activity of white meat and red meat hydrolysates from yellowfin tuna
3.3.7.2 Reducing power and Ferric reducing antioxidant power (FRAP)
Protein hydrolysates possess the ability to donate electron/hydrogen and free
radicals facilitating oxidation stable substances by interrupting the free radical chain
reactions or prevent their formation (You et al., 2010a). The present study reported
a reducing power of 0.470 ± 0.011 and 0.341 ± 0.016, respectively for TWPH and
TRPH with significant difference (p < 0.05) (Fig. 3.15). However the FRAP of
the samples were comparable indicating a value of 33.09 ± 0.49 for TWPH and
32.92 ± 0.38 for TRPH (Fig. 3.16). Choonpicharn et al. (2015) have reported good
FRAP activity in hydrolysates from tilapia skin. Bougatef et al. (2010) suggested
antioxidative properties of fish peptides to be related to their sequence, composition
as well as hydrophobicity. Therefore though the DH remained comparable between
the hydrolysates, the different pattern of peptides derived from them must have
resulted in diverse reducing activity.
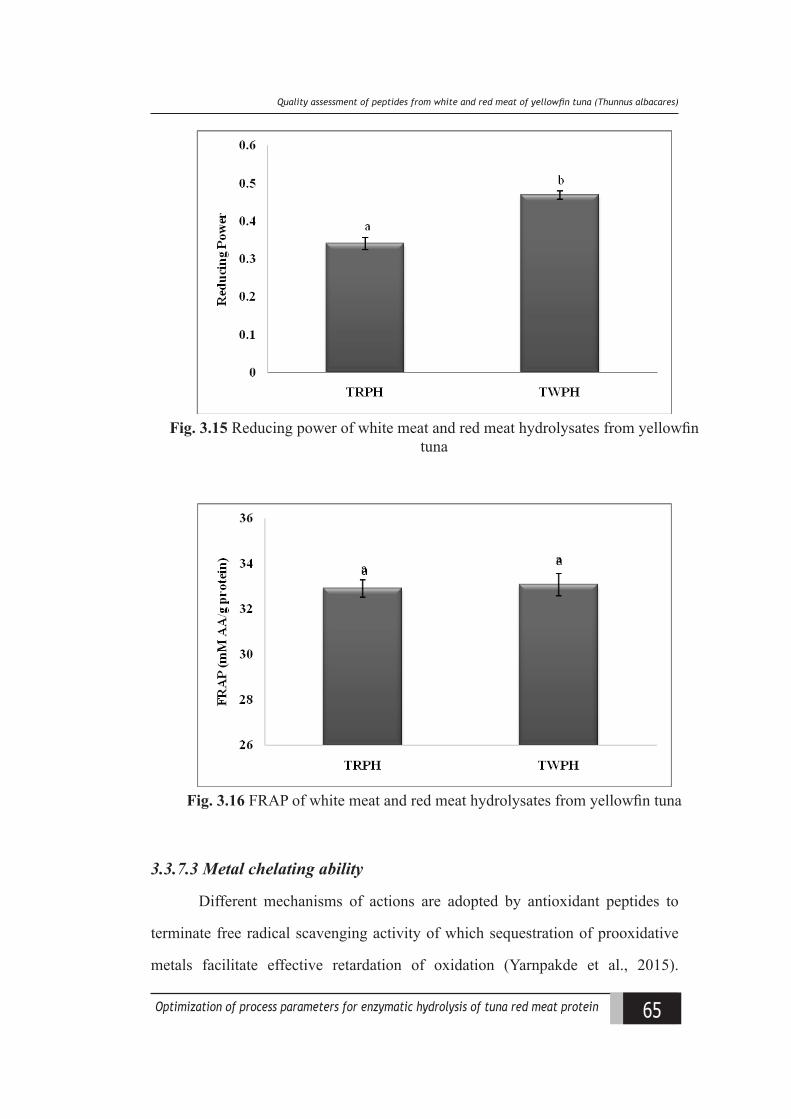
65Optimization of process parameters for enzymatic hydrolysis of tuna red meat protein
Quality assessment of peptides from white and red meat of yellowfn tuna (hunnus allaaaress
Fig. 3.15 Reducing power of white meat and red meat hydrolysates from yellowfin tuna
Fig. 3.16 FRAP of white meat and red meat hydrolysates from yellowfin tuna
3.3.7.3 Metal chelating ability
Different mechanisms of actions are adopted by antioxidant peptides to
terminate free radical scavenging activity of which sequestration of prooxidative
metals facilitate effective retardation of oxidation (Yarnpakde et al., 2015).
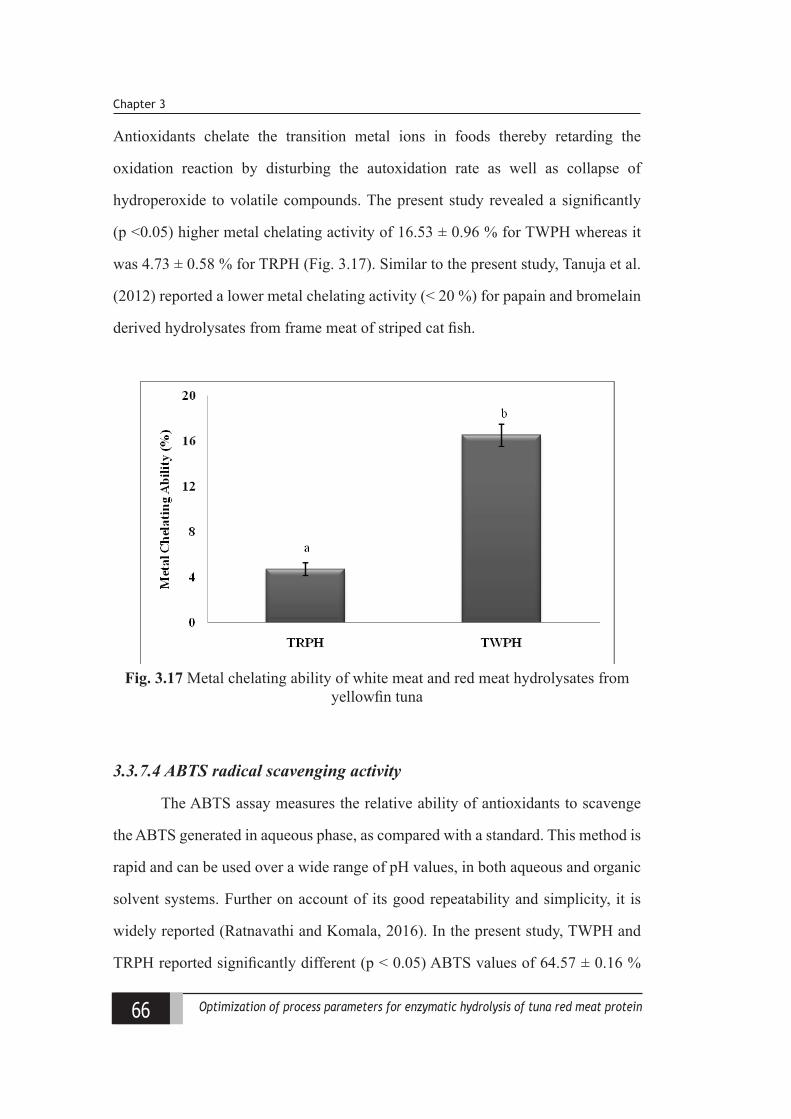
66 Optimization of process parameters for enzymatic hydrolysis of tuna red meat protein
Chapter 3
Antioxidants chelate the transition metal ions in foods thereby retarding the
oxidation reaction by disturbing the autoxidation rate as well as collapse of
hydroperoxide to volatile compounds. The present study revealed a significantly
(p <0.05) higher metal chelating activity of 16.53 ± 0.96 % for TWPH whereas it
was 4.73 ± 0.58 % for TRPH (Fig. 3.17). Similar to the present study, Tanuja et al.
(2012) reported a lower metal chelating activity (< 20 %) for papain and bromelain
derived hydrolysates from frame meat of striped cat fish.
Fig. 3.17 Metal chelating ability of white meat and red meat hydrolysates from yellowfin tuna
3.3.7.4 ABTS radical scavenging activity
The ABTS assay measures the relative ability of antioxidants to scavenge
the ABTS generated in aqueous phase, as compared with a standard. This method is
rapid and can be used over a wide range of pH values, in both aqueous and organic
solvent systems. Further on account of its good repeatability and simplicity, it is
widely reported (Ratnavathi and Komala, 2016). In the present study, TWPH and
TRPH reported significantly different (p < 0.05) ABTS values of 64.57 ± 0.16 %

67Optimization of process parameters for enzymatic hydrolysis of tuna red meat protein
Quality assessment of peptides from white and red meat of yellowfn tuna (hunnus allaaaress
and 56.83 ± 0.35 %, respectively (Fig. 3.18). Earlier studies conducted by Bernardi
et al. (2016) in hydrolysates from Nile tilapia by-products also indicated superior
ABTS activity. The amino acid constituents and the sequence of the peptides are
determinant factors for their antioxidant activity which are dependent on substrate
type, selection of appropriate proteolytic enzymes, the physico-chemical conditions
of hydrolysis etc (Samaranayaka and Li-chan, 2011). Enzymes like papain exhibits
specific substrate preferences, primarily for bulky hydrophobic or aromatic residues
which must have resulted in variations in the nature of peptides formed as well as
resultant properties (Tavano, 2013).
Fig. 3.18 ABTS radical scavenging activity of white meat and red meat hydrolysates from yellowfin tuna
68 Optimization of process parameters for enzymatic hydrolysis of tuna red meat protein
Chapter 3
3.4 Conclusion
Tuna red meat, generally discarded as a by-product in canning industry is
potential source of high quality proteins which can be effectively utilized for the
conversion to economically demanding hydrolysate which has immense application
potential in food and pharmaceutical industry. The present study revealed its
application potential by comparison of the hydrolysates from red meat with a
reference source like tuna white meat. The extent of hydrolysis undergone was
similar but the functional and bioactive properties indicated variations as they were
dependent mainly on the nature of peptides formed during hydrolysis rather than
the peptide chain length. The current investigation paves possibilities for further
exploration of this protein rich substrate for its application.
69Optimization of process parameters for enzymatic hydrolysis of tuna red meat protein
Process optimisation for the selective extraction of functional and antioxidative hydrolysates from cooked tuna red meat
Chapter 4Process optimisation for the
selective extraction of functional and antioxidative hydrolysates from
cooked tuna red meat(Thunnus albacares) using RSM
4.1 Introduction
Tuna resources, which includes tuna (Thunnus spp.) as well as tuna-like
species are significant sources of food and hence play a vital role in the economy of
many countries. More than 48 species are distributed globally in the Atlantic, Indian,
Pacific Oceans as well as the Mediterranean Sea. The annual global production of
tuna has undergone a marked increase from less than 0.6 million metric tons in 1950
to nearly 5 million metric tons of major commercial tuna catch by 2016. Globally,
tuna resources have high commercial value on account of its demand for thermally
processed delicacies. Canned as well as other shelf-stable tuna products provide
ample and inexpensive protein to markets around the world, while smaller amounts
of high-quality tuna steaks and sashimi make their way to well off markets in Asia,
Europe, and North America. As previously mentioned, during tuna canning process,
only about one-third of the whole fish is used and the process discards generated
during these operations including the red meat is enormous and accounts to about
50 to 70 % of whole fish (Saidi et al., 2014).
70 Optimization of process parameters for enzymatic hydrolysis of tuna red meat protein
Chapter 4
Recovery and conversion of these proteinaceous discards to functional and
bioactive hydrolysates is a promisive option for the industry. These hydrolysates
containing peptides with distinct range of molecular weight, exhibit superior
functional and bioactive properties compared to that of parent protein (He et al.,
2013; Binsi et al., 2016). Based on the extent of hydrolysis that the parent protein
undergoes, the properties exhibited by the hydrolysates vary considerably.
Response Surface Methodology (RSM) is regarded as a constructive
statistical method widely adopted for the investigation of complex processes. It
helps to define effect of the independent variables, alone or in combinations, on
the process to generate an accurate mathematical model that explains the overall
process adopting a significant estimation (Shankar et al., 2010). Reports by Wu et al.
(2007) also suggested this statistical technique to be significantly advantageous in
reducing the number of experiments required to assess multiple variables and their
interactions; thus being less laborious and time-consuming than other approaches.
Numerous optimization studies have been carried out globally by researchers
in hydrolysates from different sources for maximizing the protein recovery (Awuor
et al., 2017) antioxidative activity (Guerard et al., 2007; Wangtueai et al., 2016;
Wang et al., 2017) and functional properties simultaneously with yield (Jamil et al.,
2016) as process responses using RSM. In these protocols, antioxidant or functional
attributes were considered as response variables to generate process conditions for
deriving hydrolysates optimized for antioxidant or functional properties alone.
However, it is well understood that the properties of hydrolysates depend to a
large extent on the nature of polypeptide fragments formed, rather than the DH
achieved during the hydrolytic process. It is quite obvious that peptides from the
same source having the same DH exhibit significant variations in their properties.
The extent to which these properties may alter is less explored, so far. Many a
times, a combined optimisation for entirely different spectrum of properties such
71Optimization of process parameters for enzymatic hydrolysis of tuna red meat protein
Process optimisation for the selective extraction of functional and antioxidative hydrolysates from cooked tuna red meat
as bioactive, surface-active and functional properties may be of less significance,
when the hydrolysate is intended for a specific application. This essentially means
that, separate optimisation designs are required for extracting surface-active and
bioactive hydrolysates, considering the process responses specific to the intended
property, so as to arrive at more accurate and technically viable parameters for the
particular hydrolysis process.
At present, the red meat generated during tuna canning operations is mainly
converted to low value by-products like animal feed, fertilizers etc. As mentioned
earlier, numerous studies have been carried out for arriving at an optimum processing
condition giving hydrolysates exhibiting either functional or bioactive properties.
However no comprehensive studies have been reported offering separate sets of
optimised process parameters for the same substrate yielding hydrolysates with
either functional or antioxidant properties. Hence, novelty of the current analysis lies
in offering separate sets of process conditions to derive hydrolysates with functional
or antioxidant properties from tuna red meat, a tuna cannery by-product with
emphasis to maximum protein recovery. Hence, the objective was to optimize the
effect of hydrolysis variables viz., E/S and hydrolysis duration, using an RSM based
central composite design, for separate extraction of surface-active and antioxidant
rich hydrolysates from the cannery waste; cooked meat of yellowfin tuna red meat
with thrust to maximum protein recovery. As food application demands sensory
acceptability, for optimization of peptides with functional properties, minimization
of bitterness was also emphasized. Moreover, a variability range of DH values with
respect to individual properties exhibited by hydrolysates under each hydrolytic
conditions was derived by statistical means.
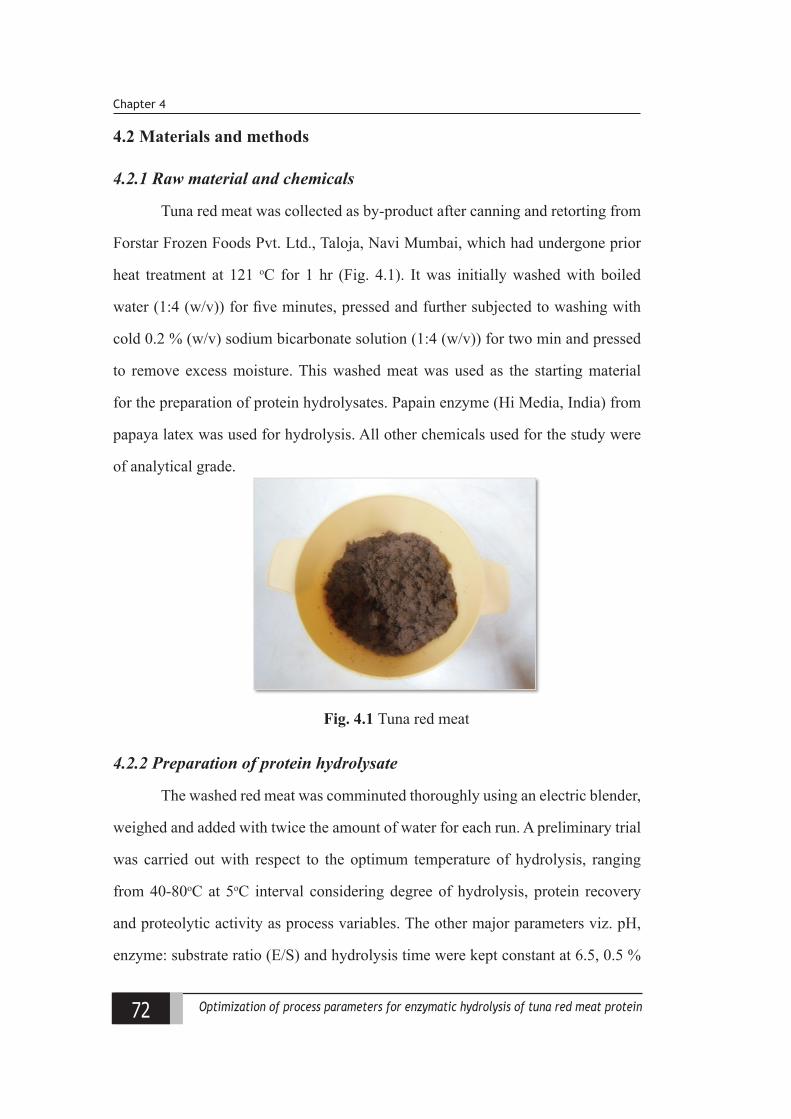
72 Optimization of process parameters for enzymatic hydrolysis of tuna red meat protein
Chapter 4
4.2 Materials and methods
4.2.1 Raw material and chemicals
Tuna red meat was collected as by-product after canning and retorting from
Forstar Frozen Foods Pvt. Ltd., Taloja, Navi Mumbai, which had undergone prior
heat treatment at 121 oC for 1 hr (Fig. 4.1). It was initially washed with boiled
water (1:4 (w/v)) for five minutes, pressed and further subjected to washing with
cold 0.2 % (w/v) sodium bicarbonate solution (1:4 (w/v)) for two min and pressed
to remove excess moisture. This washed meat was used as the starting material
for the preparation of protein hydrolysates. Papain enzyme (Hi Media, India) from
papaya latex was used for hydrolysis. All other chemicals used for the study were
of analytical grade.
Fig. 4.1 Tuna red meat
4.2.2 Preparation of protein hydrolysate
The washed red meat was comminuted thoroughly using an electric blender,
weighed and added with twice the amount of water for each run. A preliminary trial
was carried out with respect to the optimum temperature of hydrolysis, ranging
from 40-80oC at 5oC interval considering degree of hydrolysis, protein recovery
and proteolytic activity as process variables. The other major parameters viz. pH,
enzyme: substrate ratio (E/S) and hydrolysis time were kept constant at 6.5, 0.5 %
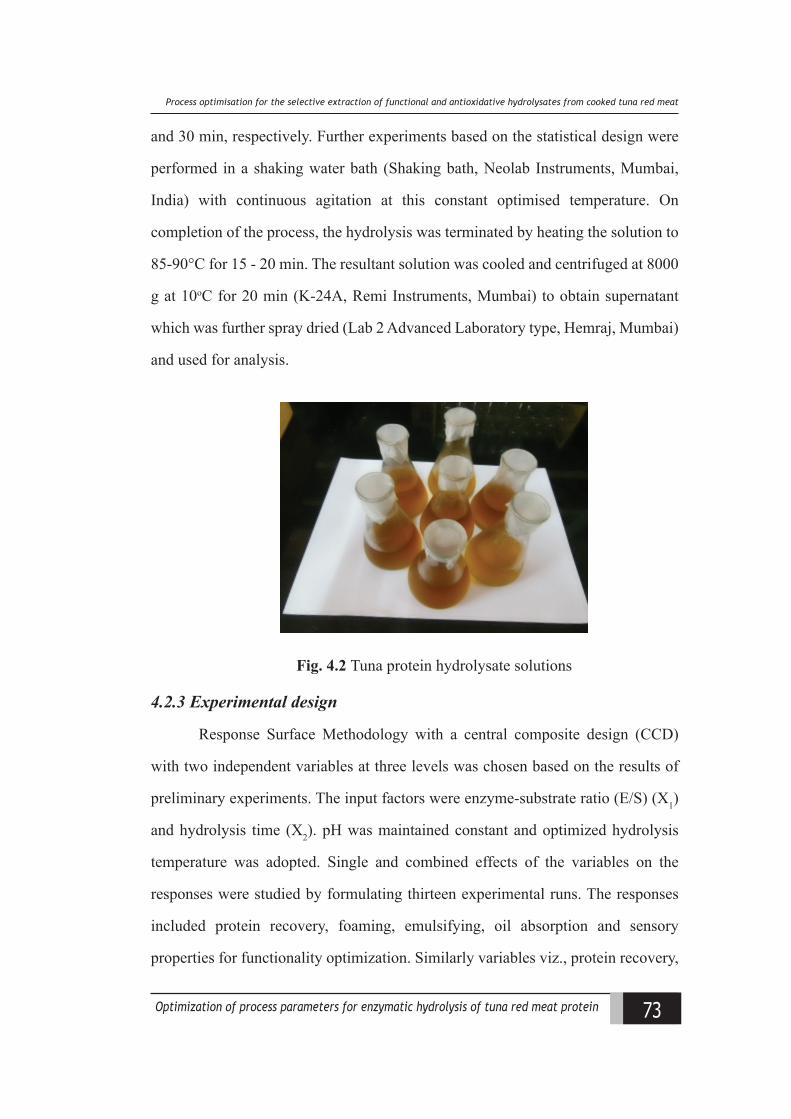
73Optimization of process parameters for enzymatic hydrolysis of tuna red meat protein
Process optimisation for the selective extraction of functional and antioxidative hydrolysates from cooked tuna red meat
and 30 min, respectively. Further experiments based on the statistical design were
performed in a shaking water bath (Shaking bath, Neolab Instruments, Mumbai,
India) with continuous agitation at this constant optimised temperature. On
completion of the process, the hydrolysis was terminated by heating the solution to
85-90°C for 15 - 20 min. The resultant solution was cooled and centrifuged at 8000
g at 10oC for 20 min (K-24A, Remi Instruments, Mumbai) to obtain supernatant
which was further spray dried (Lab 2 Advanced Laboratory type, Hemraj, Mumbai)
and used for analysis.
Fig. 4.2 Tuna protein hydrolysate solutions
4.2.3 Experimental design
Response Surface Methodology with a central composite design (CCD)
with two independent variables at three levels was chosen based on the results of
preliminary experiments. The input factors were enzyme-substrate ratio (E/S) (X1)
and hydrolysis time (X2). pH was maintained constant and optimized hydrolysis
temperature was adopted. Single and combined effects of the variables on the
responses were studied by formulating thirteen experimental runs. The responses
included protein recovery, foaming, emulsifying, oil absorption and sensory
properties for functionality optimization. Similarly variables viz., protein recovery,
74 Optimization of process parameters for enzymatic hydrolysis of tuna red meat protein
Chapter 4
DPPH radical scavenging activity, FRAP, metal chelating activity and ABTS radical
scavenging activity were considered for optimization of antioxidative properties.
Contour plots and response surface graphs were generated by the predictive model
to envisage the critical points and the effectiveness of each factor. Desirability
score was computed for multi response optimization of response variables for
functionality of hydrolysate and antioxidative properties with emphasis to protein
recovery and the optimum combination of enzyme substrate ratio and hydrolysis
time was selected.
4.2.4 Determination of proximate composition
Proximate composition of tuna red meat before and after treatment was
estimated as per AOAC (2012). The moisture was determined by oven drying
method. The percentage weight loss of food on account of evaporation of water
from them by drying was made use. A known quantity of sample was placed in
thermostatically controlled hot air oven and the reduction in weight was checked by
repeated weighing and cooling of the sample in desiccator till the weight become
constant.
The estimation of crude fat content was done by adopting soxhlet extraction
method using petroleum ether as the extraction solvent. Known quantity of
moisture free sample was accurately weighed into an extraction thimble and was
placed in an extractor which was connected to a pre-weighed dry receiving flask
and water condenser. The solvent in the receiving flask was evaporated completely
and weighed for the fat content. The result was expressed as amount of crude fat
per 100 g sample.
The ash content was determined using muffle furnace by incineration
method. Known quantity of moisture free sample was taken in a pre-weighed clean
dry silica crucible and charred at low heat, followed by incineration in a muffle
75Optimization of process parameters for enzymatic hydrolysis of tuna red meat protein
Process optimisation for the selective extraction of functional and antioxidative hydrolysates from cooked tuna red meat
furnace at 550o C to get white ash. Silica crucibles were finally cooled in desiccator
and weighed and ash content was expressed as amount of ash per 100 g sample.
Protein content of tuna red meat and hydrolysates were estimated by
kjelhdahl method (detailed in chapter 3; section 3.2.3).
4.2.5 Determination of degree of hydrolysis and proteolytic activity
Degree of hydrolysis was estimated as per the methodology described by
Hoyle and Merritt (1994). To the supernatant, one volume of 20 % trichloroacetic
acid (TCA) was added, followed by centrifugation at 2560 g at for 15 min to collect
the 10 % TCA-soluble materials. Briefly, degree of hydrolysis was computed as
% DH = 10 % TCA soluble N2 in the sample x 100 Total N2 in the sample
Proteolytic activity of the sample was projected from the tyrosine content
of the protein hydrolysate which measured the extent of hydrolysis under given
conditions (detailed in chapter 3; section 3.2.5).
4.2.6 Determination of protein recovery
Protein recovery in hydrolysate was defined as the ratio of protein yield
obtained from the extraction process to the amount of total protein estimated by
Kjeldahl and was calculated as follows:
Recovered protein (%) = Protein in hydrolysate sample x volume of hydrolysate x100 Weight of raw material taken x percentage of protein in raw material
4.2.7 Determination of functional and antioxidative properties
Functional properties of the hydrolysates viz., foaming properties (Sathe
and Salunkhe, 1981); emulsifying properties (Pearce and Kinsella, 1978); oil
absorption capacity (Shahidi et al.,1995) of the hydrolysates were determined. Ten
trained panellists were assigned for the sensory analysis for bitterness adopting
the methodology of Nilsang et al. (2005) with modifications. Antioxidative
76 Optimization of process parameters for enzymatic hydrolysis of tuna red meat protein
Chapter 4
properties determined included DPPH radical-scavenging activity (Shimada et al.,
1992); ferric reducing antioxidant power (FRAP) (Benzie and Strain, 1996); metal
chelating ability (Decker and Welch, 1990) and ABTS radical (2,20 -azinobis-(3-
ethylbenzothiazoline-6-sulfonic acid)) scavenging activity (Re et al., 1999) (detailed
in chapter 3; section 3.2.8 and 3.2.9).
4.2.8 Statistical model development
The CCD in the experimental design consisted of 13 experimental points
conducted in random order (5 factorial points, 5 axial points and 3 center points)
(Table 4.1). Second order/ quadratic and third order/cubic regression models were
fitted to the response variables as a function of input variables using the polynomial
equation:
Second order regression: Y = β0 + βiXi + βijXiXj + βiiXi2, i ≠j=1,2
Third order regression: Y = β0 + βiXi + βijXiXj + βiiXi2 + βiijXi
2Xj, i ≠ j = 1,2
Y being the response; β0:the offset term; βi, βij, βii and βiijbeing the regression
coefficients and Xi and Xj, the levels of the independent variables. The performance
of the fitted model was assessed by Coefficient of determination (R2) and mean
square error (MSE). Significance of the regression coefficients was determined at
5% level of significance (p<0.05). A software Design expert 7.0 was used to fit the
models.
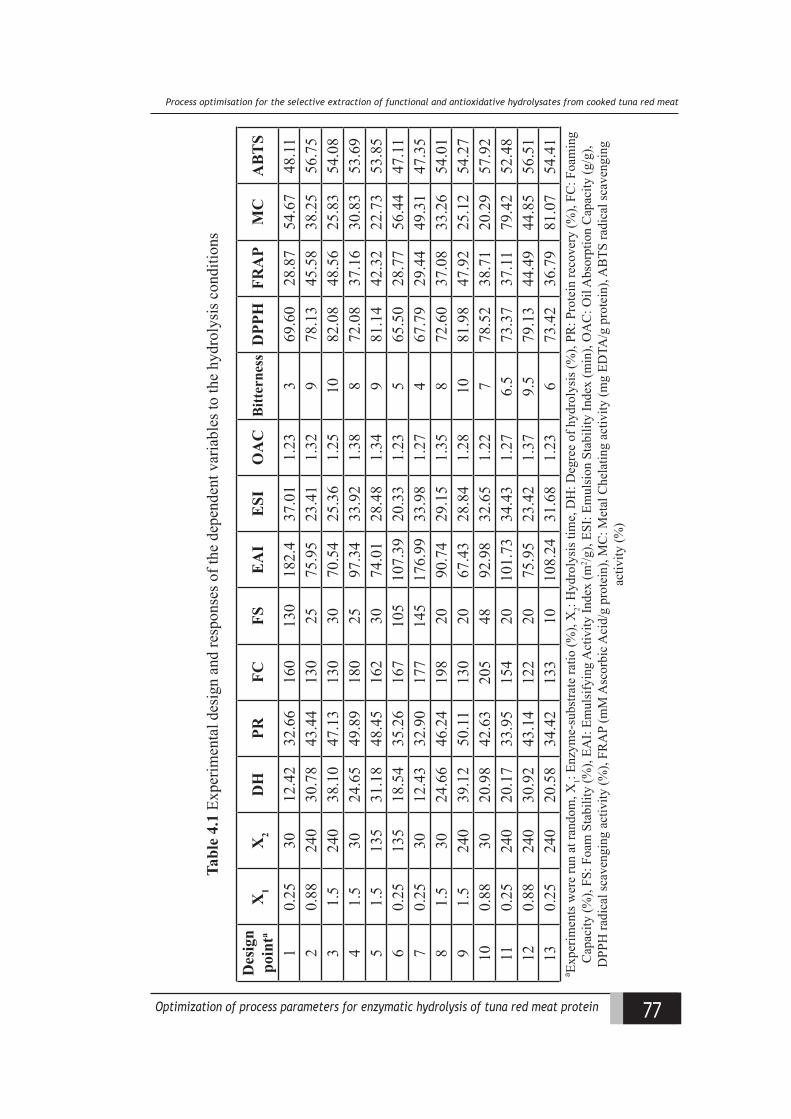
77Optimization of process parameters for enzymatic hydrolysis of tuna red meat protein
Process optimisation for the selective extraction of functional and antioxidative hydrolysates from cooked tuna red meat
Tabl
e 4.
1 Ex
perim
enta
l des
ign
and
resp
onse
s of t
he d
epen
dent
var
iabl
es to
the
hydr
olys
is c
ondi
tions
Des
ign
poin
taX
1X
2D
HPR
FCFS
EA
IE
SIO
AC
Bitt
erne
ssD
PPH
FRA
PM
CA
BT
S
10.
2530
12.4
232
.66
160
130
182.
437
.01
1.23
369
.60
28.8
754
.67
48.1
12
0.88
240
30.7
843
.44
130
2575
.95
23.4
11.
329
78.1
345
.58
38.2
556
.75
31.
524
038
.10
47.1
313
030
70.5
425
.36
1.25
1082
.08
48.5
625
.83
54.0
84
1.5
3024
.65
49.8
918
025
97.3
433
.92
1.38
872
.08
37.1
630
.83
53.6
95
1.5
135
31.1
848
.45
162
3074
.01
28.4
81.
349
81.1
442
.32
22.7
353
.85
60.
2513
518
.54
35.2
616
710
510
7.39
20.3
31.
235
65.5
028
.77
56.4
447
.11
70.
2530
12.4
332
.90
177
145
176.
9933
.98
1.27
467
.79
29.4
449
.31
47.3
58
1.5
3024
.66
46.2
419
820
90.7
429
.15
1.35
872
.60
37.0
833
.26
54.0
19
1.5
240
39.1
250
.11
130
2067
.43
28.8
41.
2810
81.9
847
.92
25.1
254
.27
100.
8830
20.9
842
.63
205
4892
.98
32.6
51.
227
78.5
238
.71
20.2
957
.92
110.
2524
020
.17
33.9
515
420
101.
7334
.43
1.27
6.5
73.3
737
.11
79.4
252
.48
120.
8824
030
.92
43.1
412
220
75.9
523
.42
1.37
9.5
79.1
344
.49
44.8
556
.51
130.
2524
020
.58
34.4
213
310
108.
2431
.68
1.23
673
.42
36.7
981
.07
54.4
1a Ex
perim
ents
wer
e ru
n at
rand
om, X
1: En
zym
e-su
bstra
te ra
tio (%
), X
2: H
ydro
lysi
s tim
e, D
H: D
egre
e of
hyd
roly
sis (
%),
PR: P
rote
in re
cove
ry (%
), FC
: Foa
min
g C
apac
ity (%
), FS
: Foa
m S
tabi
lity
(%),
EAI:
Emul
sify
ing
Act
ivity
Inde
x (m
2 /g),
ESI:
Emul
sion
Sta
bilit
y In
dex
(min
), O
AC
: Oil
Abs
orpt
ion
Cap
acity
(g/g
), D
PPH
radi
cal s
cave
ngin
g ac
tivity
(%),
FRA
P (m
M A
scor
bic A
cid/
g pr
otei
n), M
C: M
etal
Che
latin
g ac
tivity
(mg
EDTA
/g p
rote
in),
AB
TS ra
dica
l sca
veng
ing
activ
ity (%
)
78 Optimization of process parameters for enzymatic hydrolysis of tuna red meat protein
Chapter 4
4.3 Results and discussion
4.3.1 Proximate composition of raw material mince
The proximate composition of tuna red meat mince before and after water
washing was assessed. Tuna red meat was initially washed with boiled water and
subsequently with 0.2 % cold sodium bicarbonate solution to remove excess of fat
and pigments. Previously, Bhaskar et al. (2008) suggested a prior hot water washing
(85o C for 20 min) for catla visceral waste followed by centrifugation to increase
the stability of the hydrolysates towards lipid oxidation. Elavarasan (2014) has
reported water washing process to be ideal as it facilitates the removal of unwanted
components from the raw material. The washing process increased the moisture
content of mince by 3.38 % (67.11 ± 0.02 to 70.49 ± 0.48 %), with a proportional
decrease in the protein content from 28.19 ± 0.62 to 24.98 ± 0.24 %. This was also
accompanied by a significant (p < 0.05) reduction in the fat (2.22 ± 0.02 % to 1.4
± 0.17 %) and ash content (1.43 ± 0.06 to 0.64 ± 0.01 %) of the mince to almost
half of its initial value. The higher moisture content observed in the washed mince
might be either due to the hydration of myofibrillar proteins or may be a relative
increase associated with the loss of water soluble proteins, fat and mineral during
the leaching process.
4.3.2 Optimization of hydrolysis parameters
The optimisation of hydrolytic parameters was carried out in two steps.
Initially, the temperature for the hydrolysis was optimised keeping E/S, pH and time
as constant, followed by the optimisation of E/S (X1) and hydrolysis time (X2) under
optimum conditions of temperature and pH. The response variables considered for
optimising the process temperature were degree of hydrolysis, protein recovery and
proteolytic activity (Fig. 4.3). All the variables were found to be increasing upto
60oC, and thereafter showed a decreasing trend. Hence, the subsequent hydrolysis
79Optimization of process parameters for enzymatic hydrolysis of tuna red meat protein
Process optimisation for the selective extraction of functional and antioxidative hydrolysates from cooked tuna red meat
experiment was carried out at a single temperature of 60oC. Similarly, the pH opted
for the hydrolysis process was the initial pH of the substrate (washed mince), ie pH
6.5, since it falls within the optimal pH range of papain enzyme as indicated by the
manufacturer (pH 6-7).
4.3.3 RSM based optimisation of process variables
The influence of E/S (X1) and hydrolysis time (X2) under optimum
conditions of temperature and pH by papain on cooked tuna red meat protein was
determined using central composite design. The response variables considered for
optimising the derivation of surface-active hydrolysis were foaming, emulsifying
and oil absorption properties together with sensory property. Similarly, DPPH free
radical scavenging, FRAP, metal chelating and ABTS radical scavenging activities
were considered as response variables for optimising the conditions for extracting
antioxidant hydrolysates. For both the optimizations, protein recovery was also
given special emphasis. A multiple regression analysis technique was performed to
determine all the coefficients of linear (X1, X2), quadratic (X12, X2
2) and interaction
(X1X2) terms to fit a full response surface model for the responses (Table 4.2).
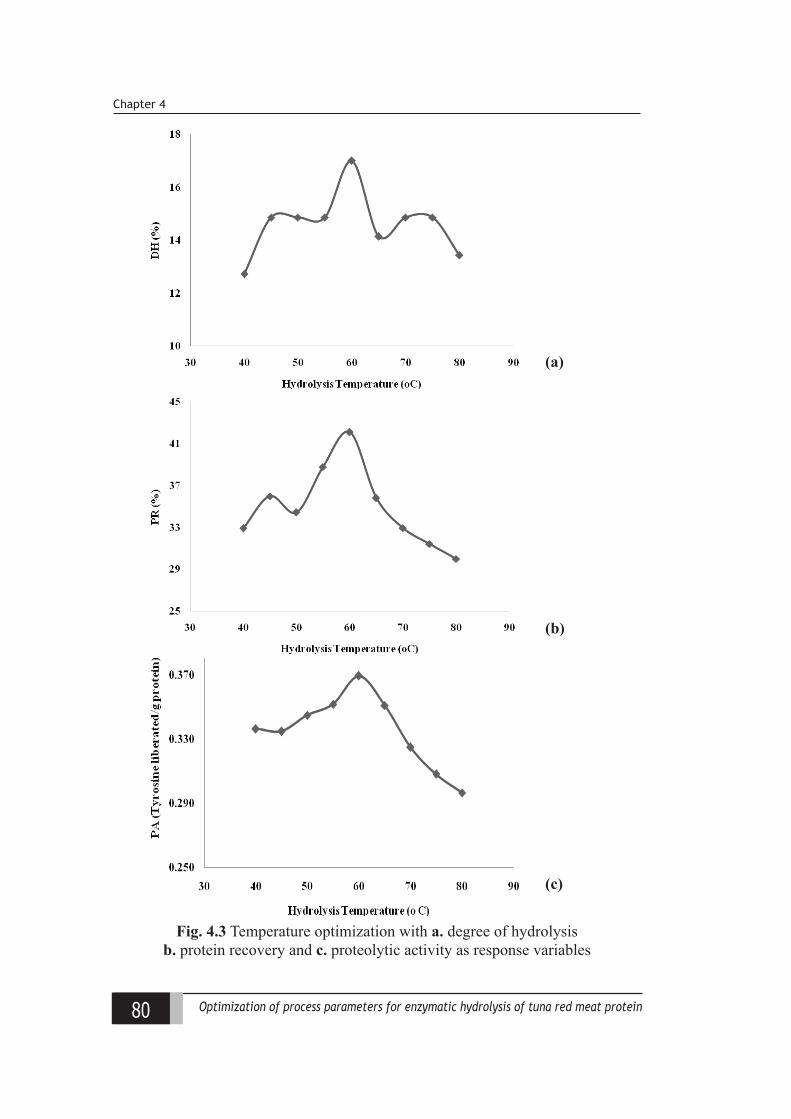
80 Optimization of process parameters for enzymatic hydrolysis of tuna red meat protein
Chapter 4
Fig. 4.3 Temperature optimization with a. degree of hydrolysis b. protein recovery and c. proteolytic activity as response variables
(a)
(b)
(c)
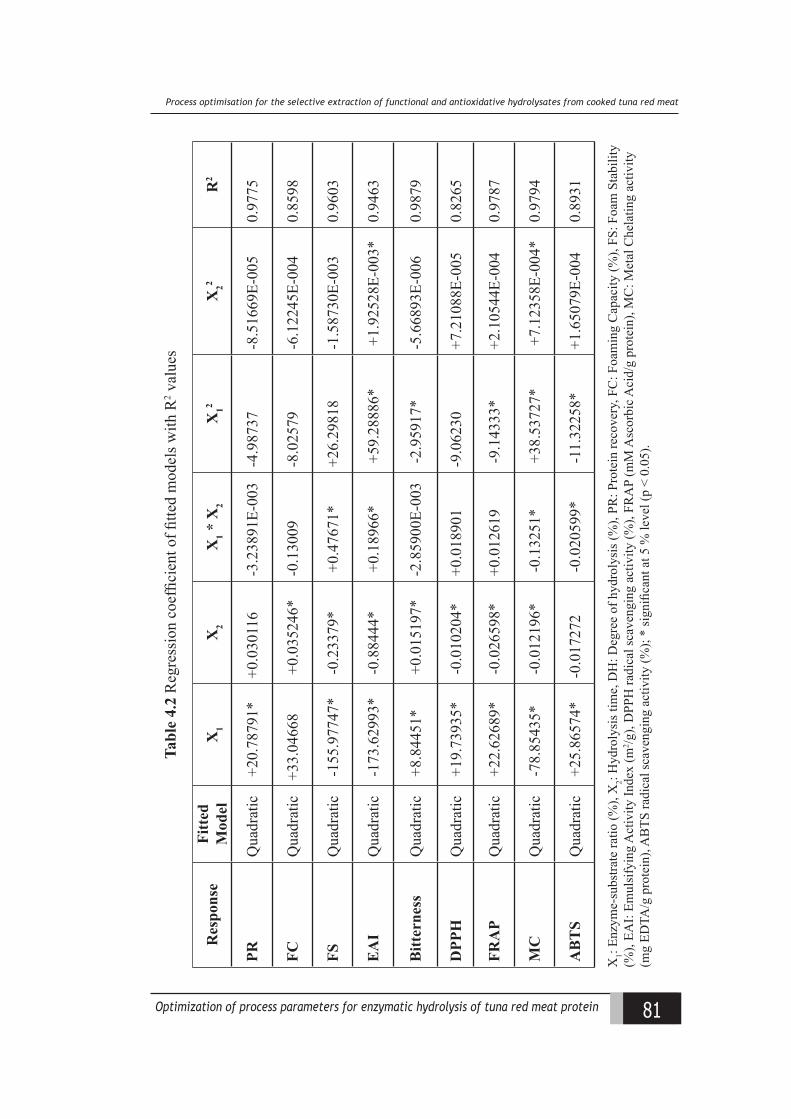
81Optimization of process parameters for enzymatic hydrolysis of tuna red meat protein
Process optimisation for the selective extraction of functional and antioxidative hydrolysates from cooked tuna red meat
Res
pons
eFi
tted
M
odel
X1
X2
X1 *
X2
X12
X22
R2
PRQ
uadr
atic
+20
.787
91*
+0.0
3011
6-3
.238
91E-
003
-4.9
8737
-8.5
1669
E-00
50.
9775
FCQ
uadr
atic
+33.
0466
8 +
0.03
5246
*-0
.130
09-8
.025
79-6
.122
45E-
004
0.85
98
FSQ
uadr
atic
-155
.977
47*
-0.2
3379
* +
0.47
671*
+26.
2981
8-1
.587
30E-
003
0.96
03
EA
IQ
uadr
atic
-173
.629
93*
-0.8
8444
* +
0.18
966*
+59
.288
86*
+1.
9252
8E-0
03*
0.94
63
Bitt
erne
ssQ
uadr
atic
+8.
8445
1* +
0.01
5197
*-2
.859
00E-
003
-2.9
5917
*-5
.668
93E-
006
0.98
79
DPP
HQ
uadr
atic
+19
.739
35*
-0.0
1020
4*+0
.018
901
-9.0
6230
+7.2
1088
E-00
50.
8265
FRA
PQ
uadr
atic
+22
.626
89*
-0.0
2659
8*+0
.012
619
-9.1
4333
*+2
.105
44E-
004
0.97
87
MC
Qua
drat
ic -7
8.85
435*
-0.0
1219
6* -0
.132
51*
+38
.537
27*
+7.
1235
8E-0
04*
0.97
94
AB
TS
Qua
drat
ic +
25.8
6574
*-0
.017
272
-0.0
2059
9* -1
1.32
258*
+1.6
5079
E-00
40.
8931
Tabl
e 4.
2 R
egre
ssio
n co
effic
ient
of fi
tted
mod
els w
ith R
2 val
ues
X1:
Enzy
me-
subs
trate
ratio
(%),
X2:
Hyd
roly
sis t
ime,
DH
: Deg
ree
of h
ydro
lysi
s (%
), PR
: Pro
tein
reco
very
, FC
: Foa
min
g C
apac
ity (%
), FS
: Foa
m S
tabi
lity
(%),
EAI:
Emul
sify
ing
Act
ivity
Inde
x (m
2 /g),
DPP
H ra
dica
l sca
veng
ing
activ
ity (%
), FR
AP
(mM
Asc
orbi
c Aci
d/g
prot
ein)
, MC
: Met
al C
hela
ting
activ
ity
(mg
EDTA
/g p
rote
in),
AB
TS ra
dica
l sca
veng
ing
activ
ity (%
); *
sign
ifica
nt a
t 5 %
leve
l (p
< 0.
05).
82 Optimization of process parameters for enzymatic hydrolysis of tuna red meat protein
Chapter 4
4.3.4 Variations in degree of hydrolysis
Previously, several authors have suggested degree of hydrolysis as the major
contributor to the specific properties exhibited by the peptides (Ren et al., 2008a;
Taheri et al., 2013). However, peptides derived from the same source having similar
DH values quite often vary in their properties. Amarowicz (2008) suggested that
the presence of specific peptides liberated from protein as well as and the amount
of free amino acids to be important in determination of bioactive properties of
protein hydrolysate. Hence, in the present study, DH was not included in the RSM
analysis matrix. However the DH values were independently determined for each
hydrolytic conditions mentioned in the matrix. Further, the changes in the individual
properties were discussed in relation to the changes in DH values. The DH varied
in direct proportion with the variations in the independent variables viz., X1 and X2
as indicated by the correlation coefficients of 0.936 and 0.998, respectively (Fig.
4.4a and b). Similar observations were reported by Ovissipour et al. (2012) during
enzymatic hydrolysis of proteins from yellow fin tuna head where DH increased
with increasing hydrolysis time. However, a gradual reduction in the rate of increase
was observed above E/S ratio of 0.88 (Fig.4.4a), which might be on account of
the unavailability of substrate for the hydrolysis. The changes in DH indicated no
evidence of feedback inhibition within the range of 30 -240 min as indicated by a
constant rate of increase in DH values as the hydrolysis progressed (Fig. 4.4b).
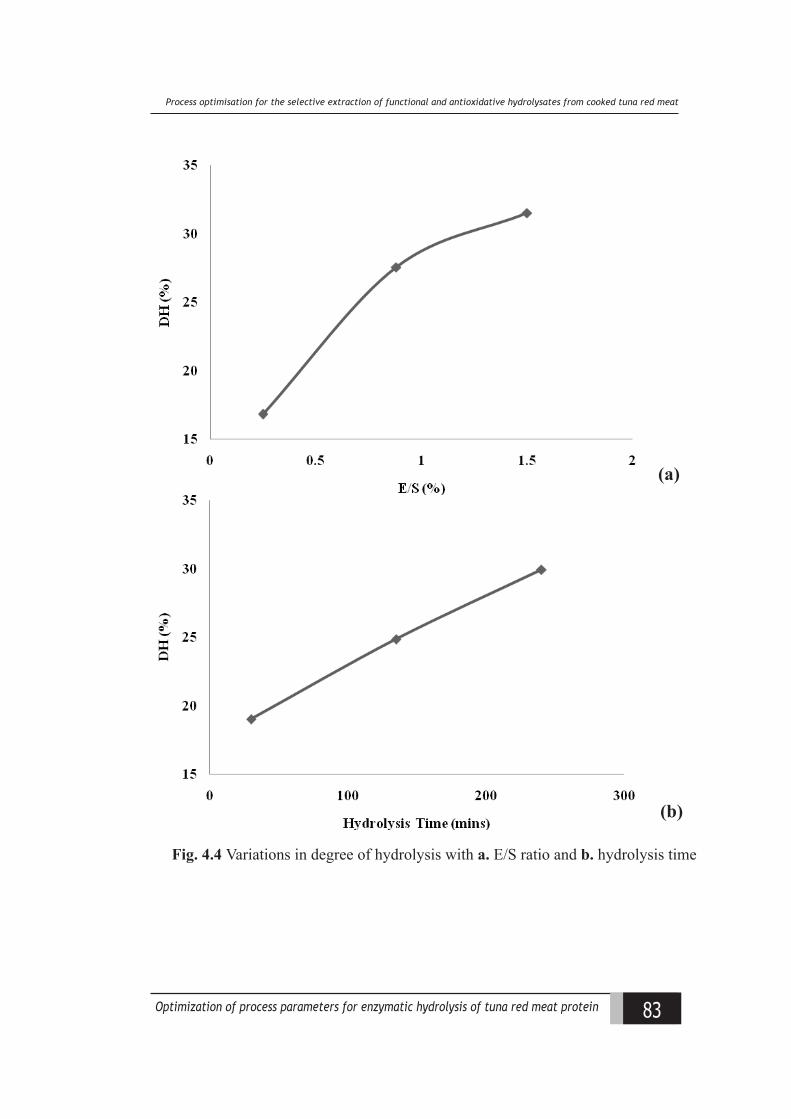
83Optimization of process parameters for enzymatic hydrolysis of tuna red meat protein
Process optimisation for the selective extraction of functional and antioxidative hydrolysates from cooked tuna red meat
Fig. 4.4 Variations in degree of hydrolysis with a. E/S ratio and b. hydrolysis time
(a)
(b)
84 Optimization of process parameters for enzymatic hydrolysis of tuna red meat protein
Chapter 4
4.3.5 Variations in protein recovery
The protein recovery is considered as a response variable for both the
optimisation designs, as it adds to the economics of the hydrolysis operation.
The variations in this response during the hydrolytic process was best explained
by second order response surface model (p < 0.05) (Table 4.2; Fig. 4.5a) with an
R2 value of 0.98 and MSE of 1.78. The adjusted R2 of the fitted model was 0.96
and analysis of lack of fit was found to be insignificant (p > 0.05) indicating the
suitability of the model. The precision measures of S/N (signal to noise ratio) was
greater than 4 (17.797) indicating adequate model discrimination (Myers et al.,
2009). The linear effect of X1 on nitrogen recovery was found to have a statistically
significant effect (p < 0.05) with high regression coefficient value of 20.79, whereas
that of X2 was marginal. The quadratic effects of both the variables showed negative
values indicating that the protein recovery reached a threshold level at certain
value of E/S and time, thereafter showing a reduction in the rate of increase. It
is generally agreed that the high E/S ratio and longer hydrolysis period favours
higher protein recovery (Mendonca Diniz and Martin, 1998; Liaset et al., 2002).
In the present study, protein recovery varied directly with the degree of hydrolysis
(R2 = 0.67) of up to 25 % and thereafter showed a slightly decreasing or more or
less similar values (Fig. 4.5b). However for similar DH, variations were observed
in this response ranging on an average from 5 – 9 %. It was also noticed that as
indicated in quadratic equation, E/S had more influence than time with higher E/S
giving more recovery of protein from substrate than the period of hydrolysis. From
the regression coefficients of statically fitted models observed in the present study,
it may be inferred that increasing the concentration of enzyme is more beneficial in
getting higher protein recovery than increasing the duration of hydrolysis beyond a
DH value of 25 %.
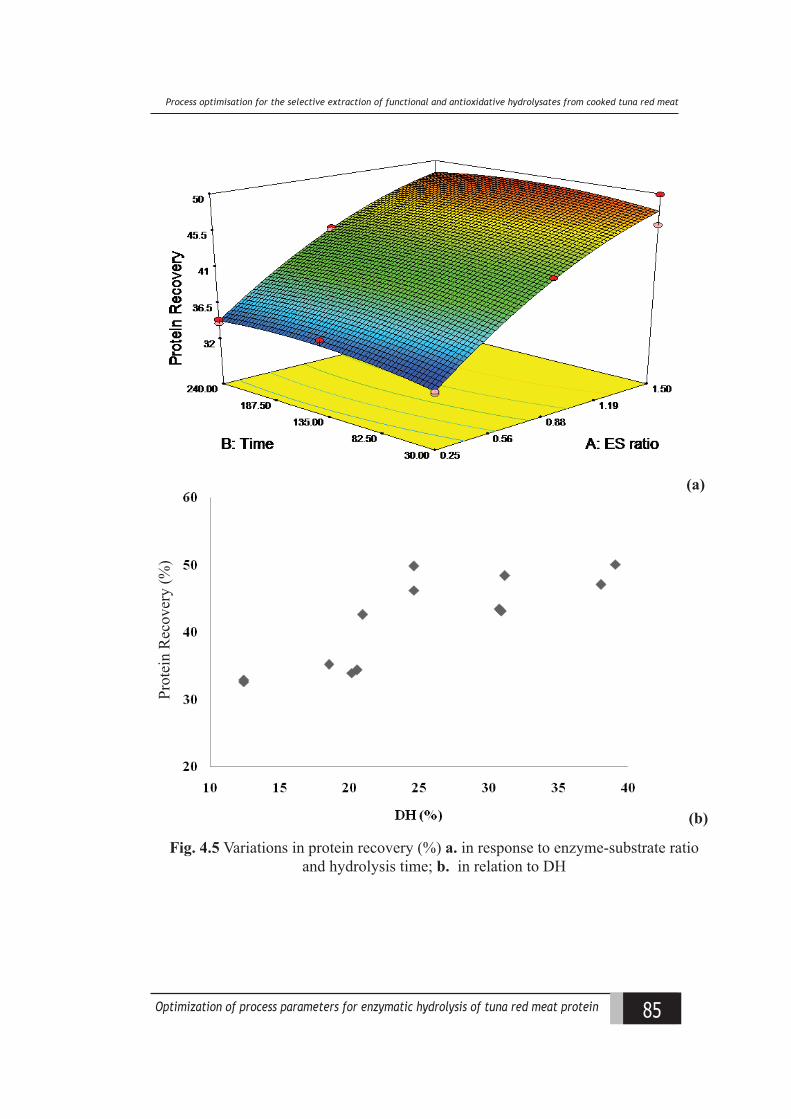
85Optimization of process parameters for enzymatic hydrolysis of tuna red meat protein
Process optimisation for the selective extraction of functional and antioxidative hydrolysates from cooked tuna red meat
(a)
(b)
Fig. 4.5 Variations in protein recovery (%) a. in response to enzyme-substrate ratio and hydrolysis time; b. in relation to DH
Prot
ein
Rec
over
y (%
)
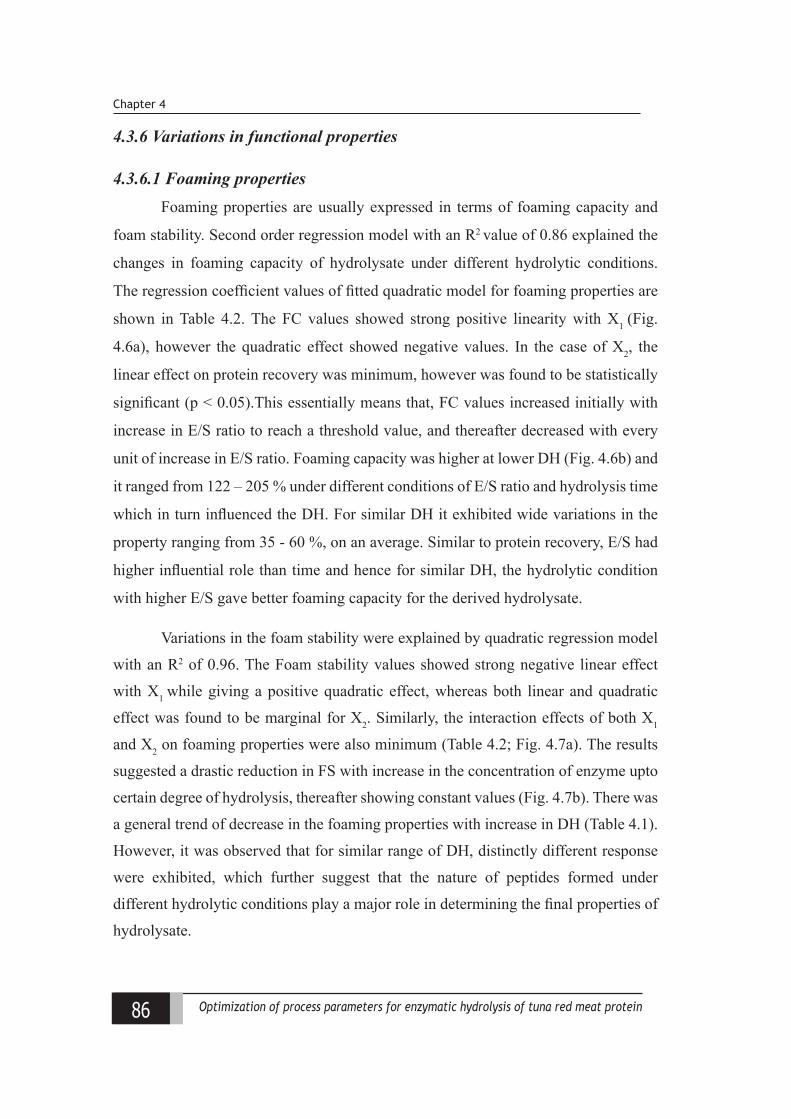
86 Optimization of process parameters for enzymatic hydrolysis of tuna red meat protein
Chapter 4
4.3.6 Variations in functional properties
4.3.6.1 Foaming propertiesFoaming properties are usually expressed in terms of foaming capacity and
foam stability. Second order regression model with an R2 value of 0.86 explained the
changes in foaming capacity of hydrolysate under different hydrolytic conditions.
The regression coefficient values of fitted quadratic model for foaming properties are
shown in Table 4.2. The FC values showed strong positive linearity with X1 (Fig.
4.6a), however the quadratic effect showed negative values. In the case of X2, the
linear effect on protein recovery was minimum, however was found to be statistically
significant (p < 0.05).This essentially means that, FC values increased initially with
increase in E/S ratio to reach a threshold value, and thereafter decreased with every
unit of increase in E/S ratio. Foaming capacity was higher at lower DH (Fig. 4.6b) and
it ranged from 122 – 205 % under different conditions of E/S ratio and hydrolysis time
which in turn influenced the DH. For similar DH it exhibited wide variations in the
property ranging from 35 - 60 %, on an average. Similar to protein recovery, E/S had
higher influential role than time and hence for similar DH, the hydrolytic condition
with higher E/S gave better foaming capacity for the derived hydrolysate.
Variations in the foam stability were explained by quadratic regression model
with an R2 of 0.96. The Foam stability values showed strong negative linear effect
with X1 while giving a positive quadratic effect, whereas both linear and quadratic
effect was found to be marginal for X2. Similarly, the interaction effects of both X1
and X2 on foaming properties were also minimum (Table 4.2; Fig. 4.7a). The results
suggested a drastic reduction in FS with increase in the concentration of enzyme upto
certain degree of hydrolysis, thereafter showing constant values (Fig. 4.7b). There was
a general trend of decrease in the foaming properties with increase in DH (Table 4.1).
However, it was observed that for similar range of DH, distinctly different response
were exhibited, which further suggest that the nature of peptides formed under
different hydrolytic conditions play a major role in determining the final properties of
hydrolysate.
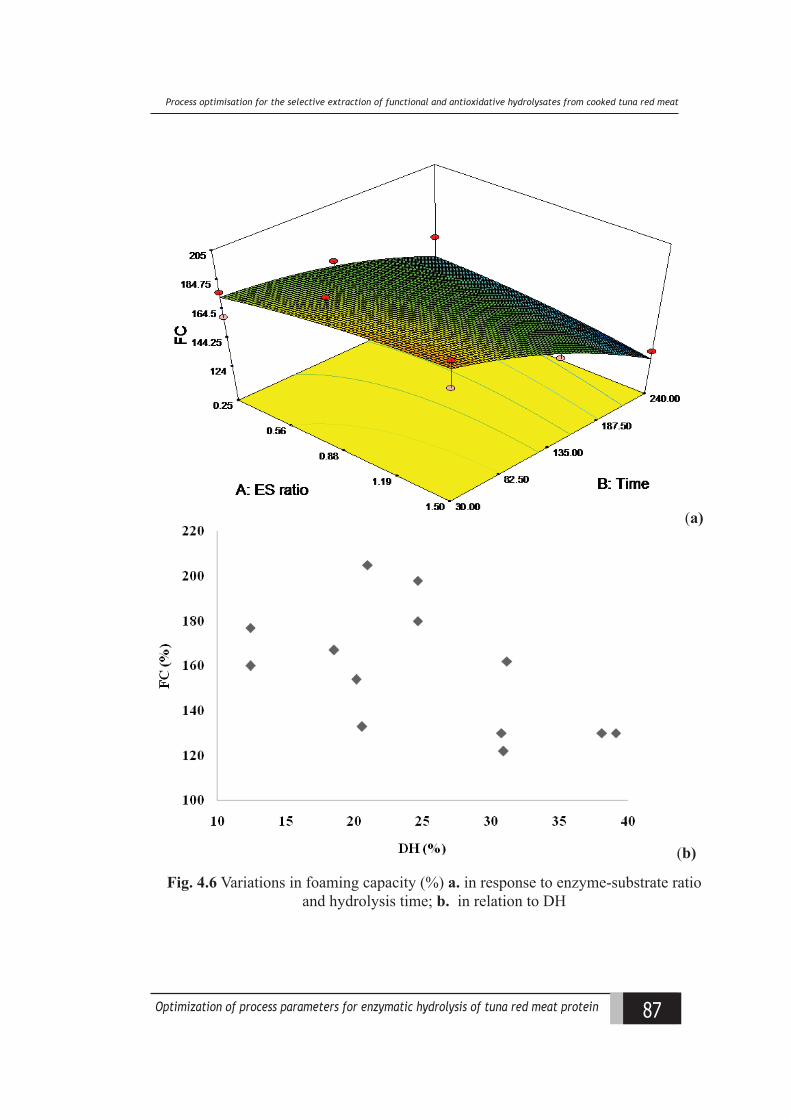
87Optimization of process parameters for enzymatic hydrolysis of tuna red meat protein
Process optimisation for the selective extraction of functional and antioxidative hydrolysates from cooked tuna red meat
(a)
(b)
Fig. 4.6 Variations in foaming capacity (%) a. in response to enzyme-substrate ratio and hydrolysis time; b. in relation to DH
88 Optimization of process parameters for enzymatic hydrolysis of tuna red meat protein
Chapter 4
(a)
(b)
Fig. 4.7 Variations in foam stability (%) a. in response to enzyme-substrate ratio and hydrolysis time; b. in relation to DH
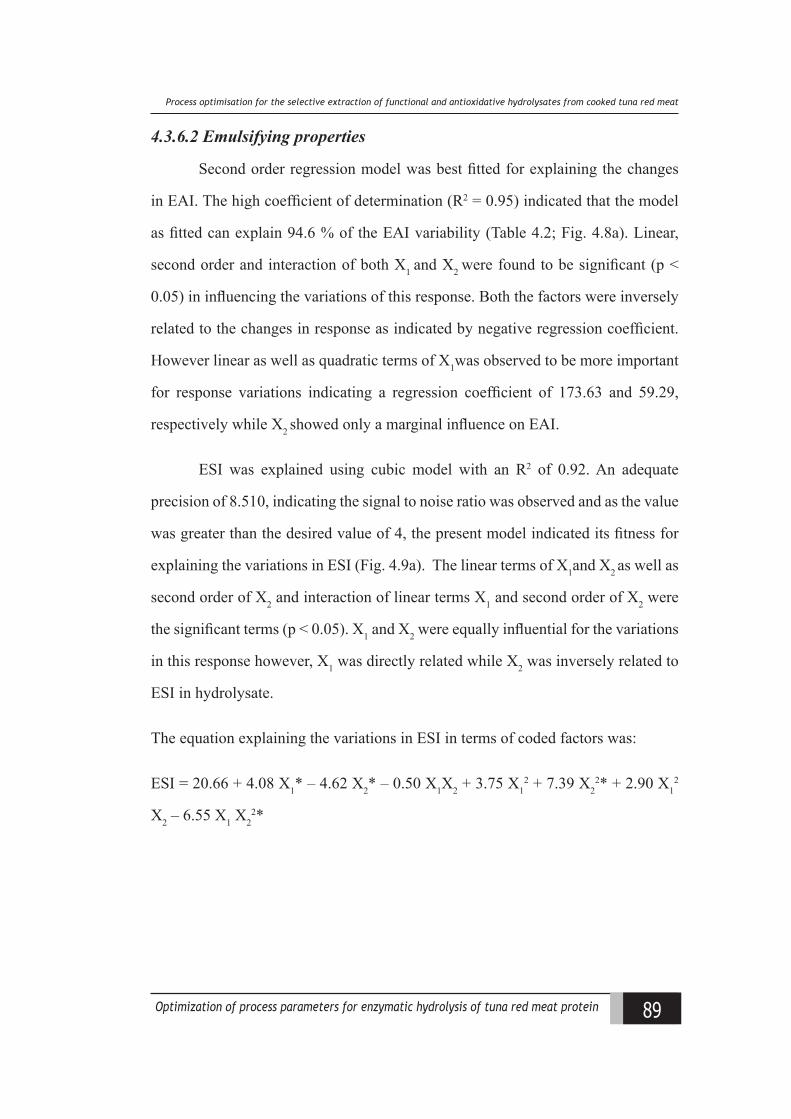
89Optimization of process parameters for enzymatic hydrolysis of tuna red meat protein
Process optimisation for the selective extraction of functional and antioxidative hydrolysates from cooked tuna red meat
4.3.6.2 Emulsifying properties
Second order regression model was best fitted for explaining the changes
in EAI. The high coefficient of determination (R2 = 0.95) indicated that the model
as fitted can explain 94.6 % of the EAI variability (Table 4.2; Fig. 4.8a). Linear,
second order and interaction of both X1 and X2 were found to be significant (p <
0.05) in influencing the variations of this response. Both the factors were inversely
related to the changes in response as indicated by negative regression coefficient.
However linear as well as quadratic terms of X1was observed to be more important
for response variations indicating a regression coefficient of 173.63 and 59.29,
respectively while X2 showed only a marginal influence on EAI.
ESI was explained using cubic model with an R2 of 0.92. An adequate
precision of 8.510, indicating the signal to noise ratio was observed and as the value
was greater than the desired value of 4, the present model indicated its fitness for
explaining the variations in ESI (Fig. 4.9a). The linear terms of X1and X2 as well as
second order of X2 and interaction of linear terms X1 and second order of X2 were
the significant terms (p < 0.05). X1 and X2 were equally influential for the variations
in this response however, X1 was directly related while X2 was inversely related to
ESI in hydrolysate.
The equation explaining the variations in ESI in terms of coded factors was:
ESI = 20.66 + 4.08 X1* – 4.62 X2* – 0.50 X1X2 + 3.75 X12 + 7.39 X2
2* + 2.90 X12
X2 – 6.55 X1 X22*
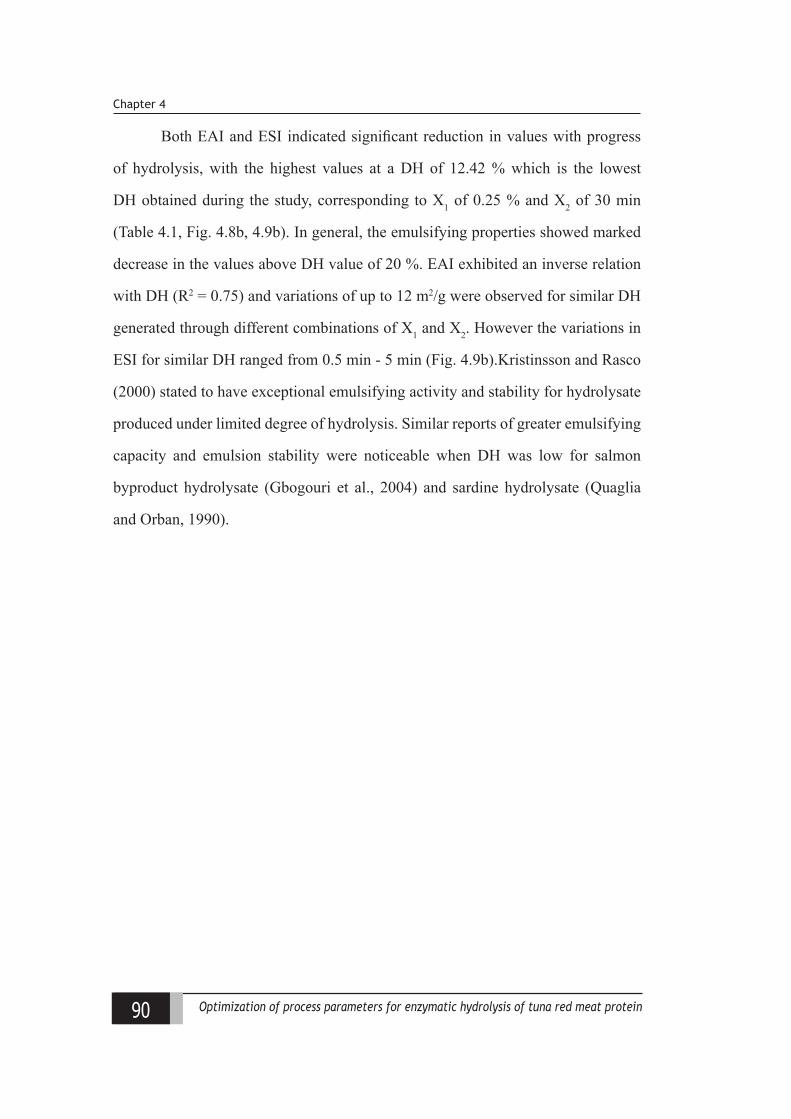
90 Optimization of process parameters for enzymatic hydrolysis of tuna red meat protein
Chapter 4
Both EAI and ESI indicated significant reduction in values with progress
of hydrolysis, with the highest values at a DH of 12.42 % which is the lowest
DH obtained during the study, corresponding to X1 of 0.25 % and X2 of 30 min
(Table 4.1, Fig. 4.8b, 4.9b). In general, the emulsifying properties showed marked
decrease in the values above DH value of 20 %. EAI exhibited an inverse relation
with DH (R2 = 0.75) and variations of up to 12 m2/g were observed for similar DH
generated through different combinations of X1 and X2. However the variations in
ESI for similar DH ranged from 0.5 min - 5 min (Fig. 4.9b).Kristinsson and Rasco
(2000) stated to have exceptional emulsifying activity and stability for hydrolysate
produced under limited degree of hydrolysis. Similar reports of greater emulsifying
capacity and emulsion stability were noticeable when DH was low for salmon
byproduct hydrolysate (Gbogouri et al., 2004) and sardine hydrolysate (Quaglia
and Orban, 1990).
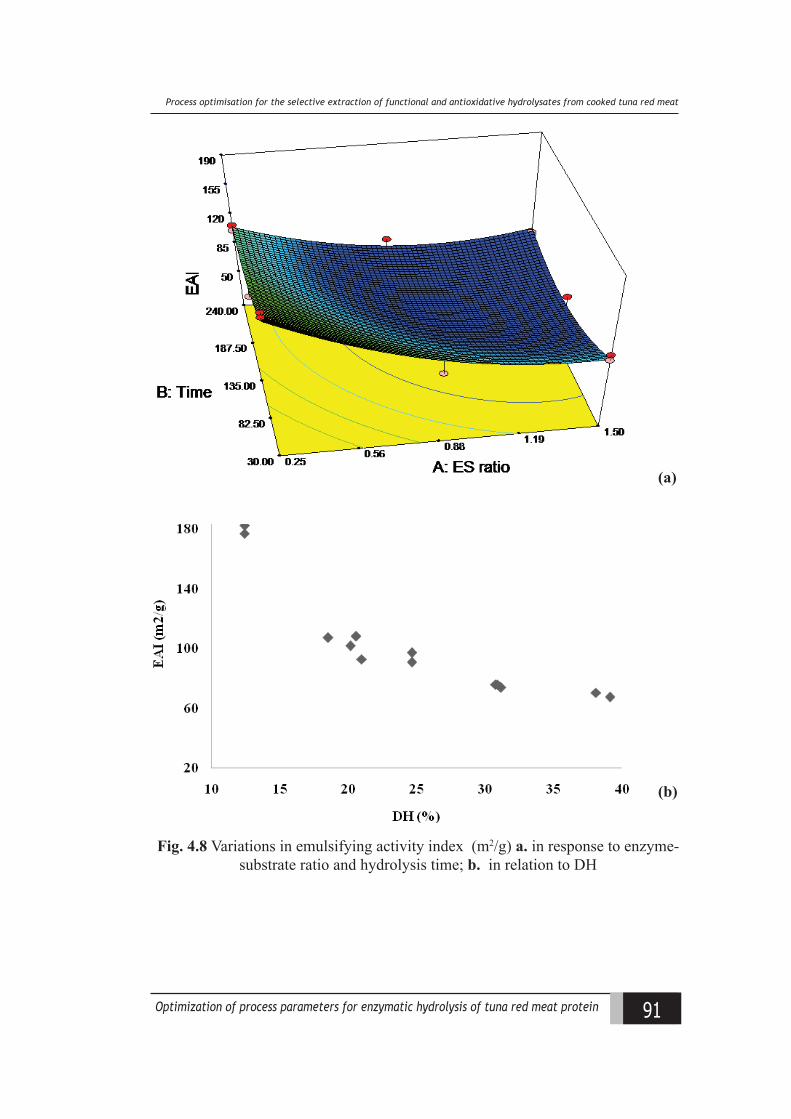
91Optimization of process parameters for enzymatic hydrolysis of tuna red meat protein
Process optimisation for the selective extraction of functional and antioxidative hydrolysates from cooked tuna red meat
Fig. 4.8 Variations in emulsifying activity index (m2/g) a. in response to enzyme-substrate ratio and hydrolysis time; b. in relation to DH
(a)
(b)
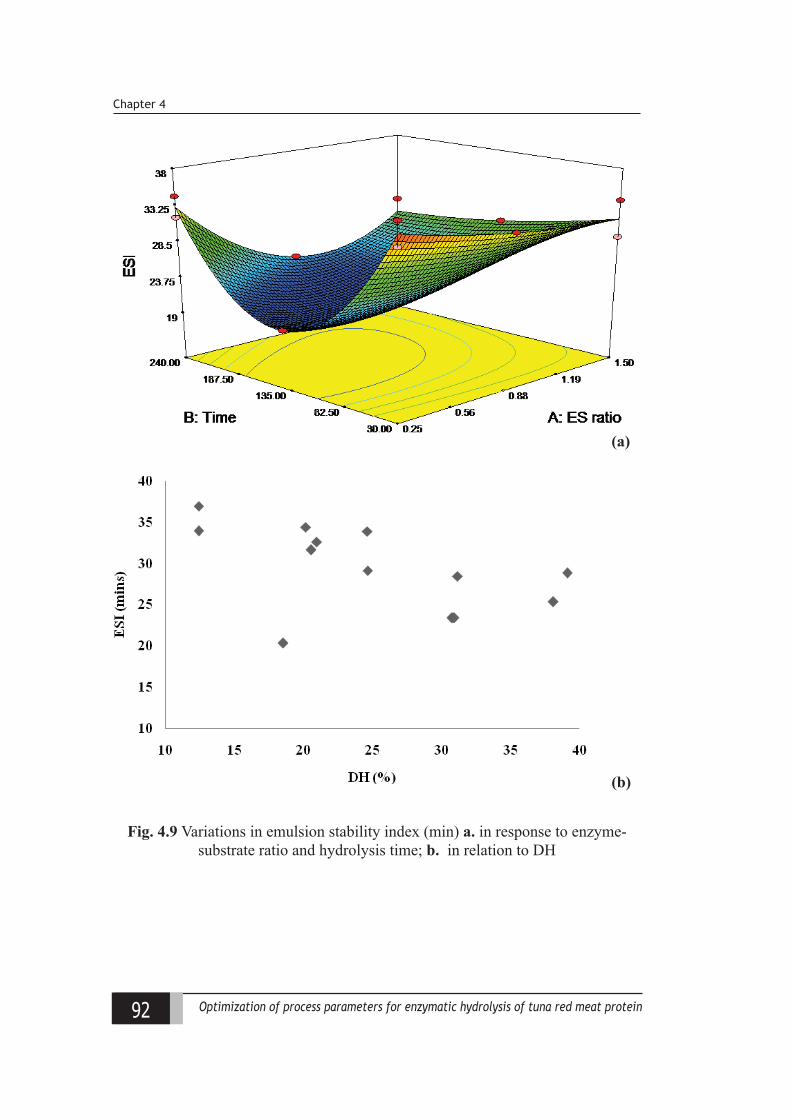
92 Optimization of process parameters for enzymatic hydrolysis of tuna red meat protein
Chapter 4
Fig. 4.9 Variations in emulsion stability index (min) a. in response to enzyme-substrate ratio and hydrolysis time; b. in relation to DH
(a)
(b)
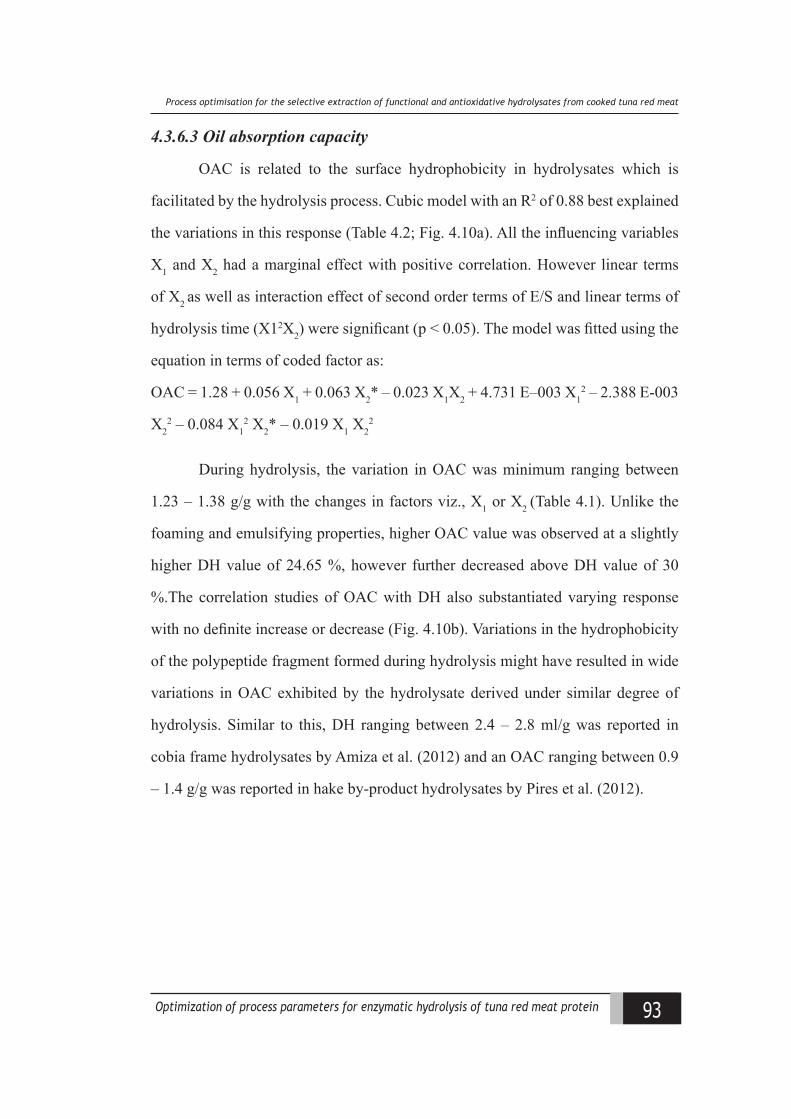
93Optimization of process parameters for enzymatic hydrolysis of tuna red meat protein
Process optimisation for the selective extraction of functional and antioxidative hydrolysates from cooked tuna red meat
4.3.6.3 Oil absorption capacity
OAC is related to the surface hydrophobicity in hydrolysates which is
facilitated by the hydrolysis process. Cubic model with an R2 of 0.88 best explained
the variations in this response (Table 4.2; Fig. 4.10a). All the influencing variables
X1 and X2 had a marginal effect with positive correlation. However linear terms
of X2 as well as interaction effect of second order terms of E/S and linear terms of
hydrolysis time (X12X2) were significant (p < 0.05). The model was fitted using the
equation in terms of coded factor as:
OAC = 1.28 + 0.056 X1 + 0.063 X2* – 0.023 X1X2 + 4.731 E–003 X12 – 2.388 E-003
X22 – 0.084 X1
2 X2* – 0.019 X1 X22
During hydrolysis, the variation in OAC was minimum ranging between
1.23 – 1.38 g/g with the changes in factors viz., X1 or X2 (Table 4.1). Unlike the
foaming and emulsifying properties, higher OAC value was observed at a slightly
higher DH value of 24.65 %, however further decreased above DH value of 30
%.The correlation studies of OAC with DH also substantiated varying response
with no definite increase or decrease (Fig. 4.10b). Variations in the hydrophobicity
of the polypeptide fragment formed during hydrolysis might have resulted in wide
variations in OAC exhibited by the hydrolysate derived under similar degree of
hydrolysis. Similar to this, DH ranging between 2.4 – 2.8 ml/g was reported in
cobia frame hydrolysates by Amiza et al. (2012) and an OAC ranging between 0.9
– 1.4 g/g was reported in hake by-product hydrolysates by Pires et al. (2012).
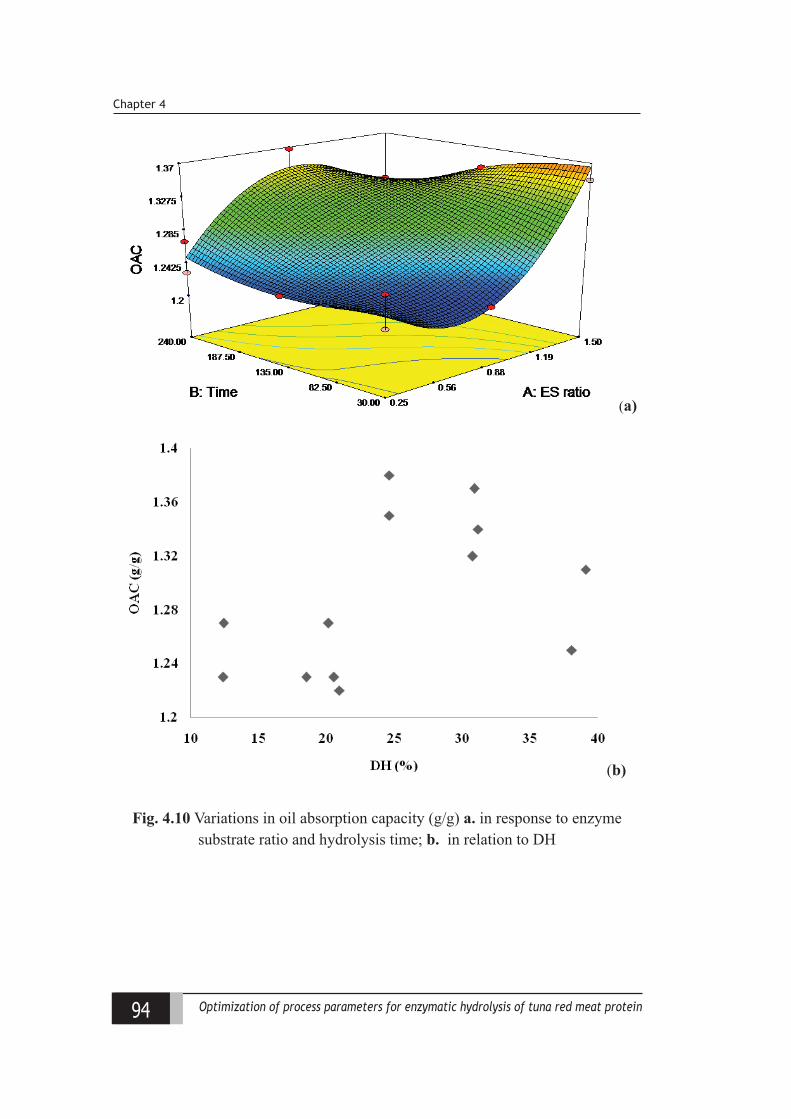
94 Optimization of process parameters for enzymatic hydrolysis of tuna red meat protein
Chapter 4
(a)
(b)
Fig. 4.10 Variations in oil absorption capacity (g/g) a. in response to enzyme substrate ratio and hydrolysis time; b. in relation to DH
95Optimization of process parameters for enzymatic hydrolysis of tuna red meat protein
Process optimisation for the selective extraction of functional and antioxidative hydrolysates from cooked tuna red meat
4.3.6.4 Sensory property
Although enzymatic hydrolysis of protein develops desirable functional
properties, it has the disadvantage of generating bitterness which is identified as
a major hindrance in theutilization and commercialization of bioactive FPH (Kim
and Wijesekara, 2010). The mechanism of bitterness is not very clear, but it is
widely accepted that hydrophobic amino acids are one of the major contributors. Of
the many techniques suggested to reduce or mask bitterness in hydrolysates, strict
control of any hydrolysis experiment and termination at low degree of hydrolysis
is desirable to prevent the development of a bitter taste and retention of functional
properties(Adler-Nissen, 1986; Saha and Hayashi, 2001).Quadratic regression
model (p < 0.05) with a high determination coefficient (R2 = 0.99) and an MSE of 0.11
was fitted to predict the trends of bitterness of hydrolysate generated with various
combinations of X1 and X2. The adjusted R2 value of 0.98 and predicted R2 value
of 0.96 which were in reasonable agreement, further confirms the high significance
of the fitted model. Linear terms of both X1 and X2 as well as second order term of
X1 were significant terms (p < 0.05) with X1 being more influential in determining
the variations of bitterness while hydrolysis time (X2) had a marginal influence for
the same extent of hydrolysis (Table 4.2). However beyond an extended limit, X1
had minimum influence in bitterness generation in the hydrolysates as indicated
by a negative coefficient for quadratic regression terms. Response surface graphs
generated by the predictive model clearly indicated the trends in the bitterness with
X1 and X2 (Fig. 4.11a).The observed trend was well in agreement with the changes
in DH, as indicated by the R2 (0.915) value of correlation graph where bitterness
increased almost linearly with DH up to a value of 30 % and thereafter showed a
stagnating trend (Fig. 4.11b). The variations between the samples having same DH
obtained through different combinations of X1 and X2 were minimum with a slightly
higher influence for E/S in the generation of bitterness than period of hydrolysis
which was substantiated from regression equation for this response.
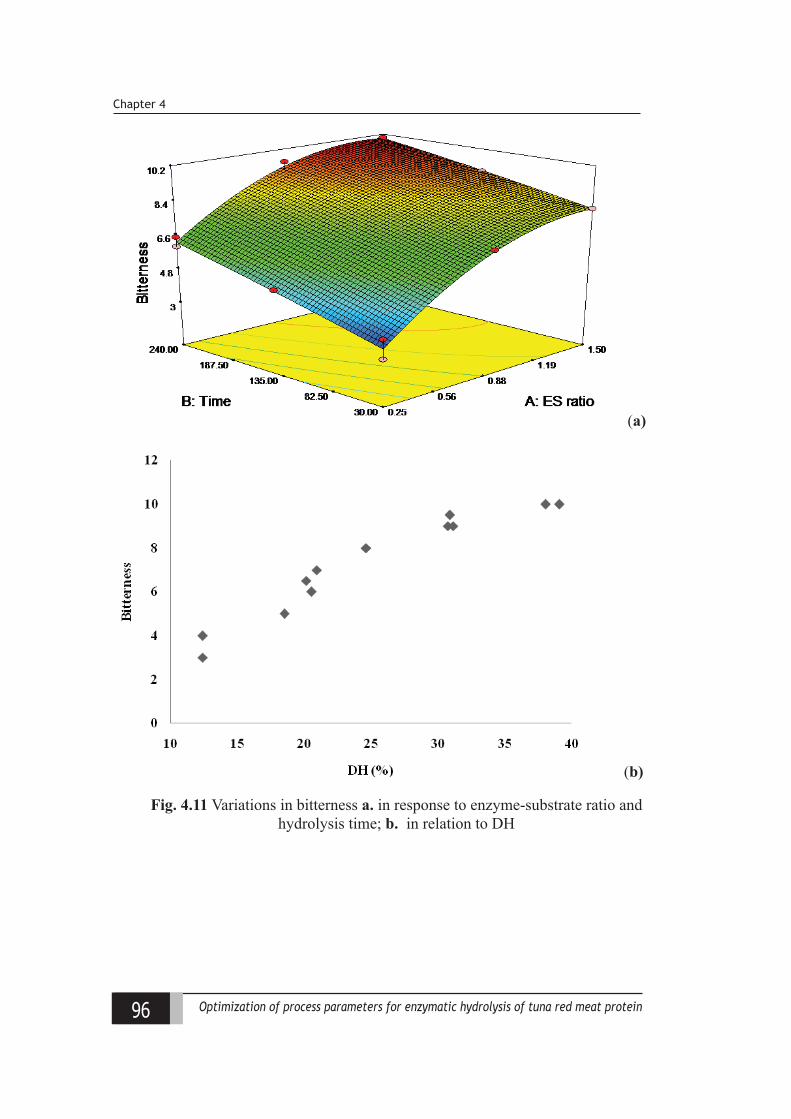
96 Optimization of process parameters for enzymatic hydrolysis of tuna red meat protein
Chapter 4
(a)
(b)
Fig. 4.11 Variations in bitterness a. in response to enzyme-substrate ratio and hydrolysis time; b. in relation to DH
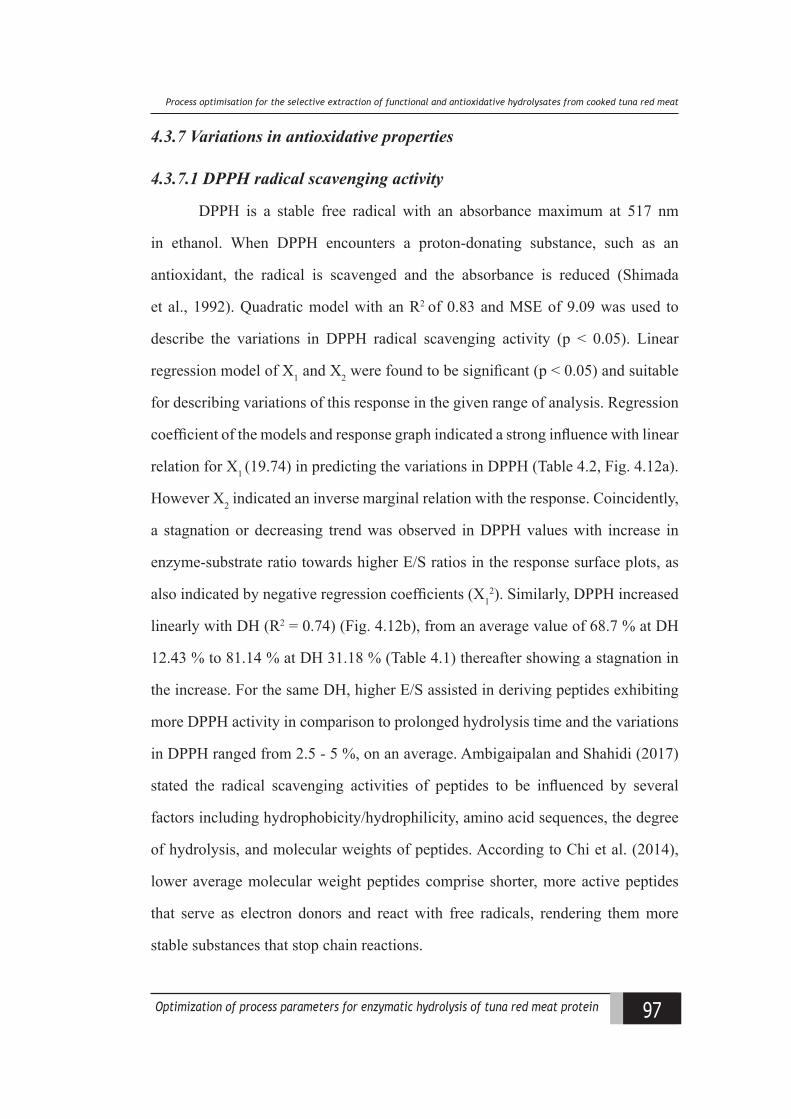
97Optimization of process parameters for enzymatic hydrolysis of tuna red meat protein
Process optimisation for the selective extraction of functional and antioxidative hydrolysates from cooked tuna red meat
4.3.7 Variations in antioxidative properties
4.3.7.1 DPPH radical scavenging activity
DPPH is a stable free radical with an absorbance maximum at 517 nm
in ethanol. When DPPH encounters a proton-donating substance, such as an
antioxidant, the radical is scavenged and the absorbance is reduced (Shimada
et al., 1992). Quadratic model with an R2 of 0.83 and MSE of 9.09 was used to
describe the variations in DPPH radical scavenging activity (p < 0.05). Linear
regression model of X1 and X2 were found to be significant (p < 0.05) and suitable
for describing variations of this response in the given range of analysis. Regression
coefficient of the models and response graph indicated a strong influence with linear
relation for X1 (19.74) in predicting the variations in DPPH (Table 4.2, Fig. 4.12a).
However X2 indicated an inverse marginal relation with the response. Coincidently,
a stagnation or decreasing trend was observed in DPPH values with increase in
enzyme-substrate ratio towards higher E/S ratios in the response surface plots, as
also indicated by negative regression coefficients (X12). Similarly, DPPH increased
linearly with DH (R2 = 0.74) (Fig. 4.12b), from an average value of 68.7 % at DH
12.43 % to 81.14 % at DH 31.18 % (Table 4.1) thereafter showing a stagnation in
the increase. For the same DH, higher E/S assisted in deriving peptides exhibiting
more DPPH activity in comparison to prolonged hydrolysis time and the variations
in DPPH ranged from 2.5 - 5 %, on an average. Ambigaipalan and Shahidi (2017)
stated the radical scavenging activities of peptides to be influenced by several
factors including hydrophobicity/hydrophilicity, amino acid sequences, the degree
of hydrolysis, and molecular weights of peptides. According to Chi et al. (2014),
lower average molecular weight peptides comprise shorter, more active peptides
that serve as electron donors and react with free radicals, rendering them more
stable substances that stop chain reactions.
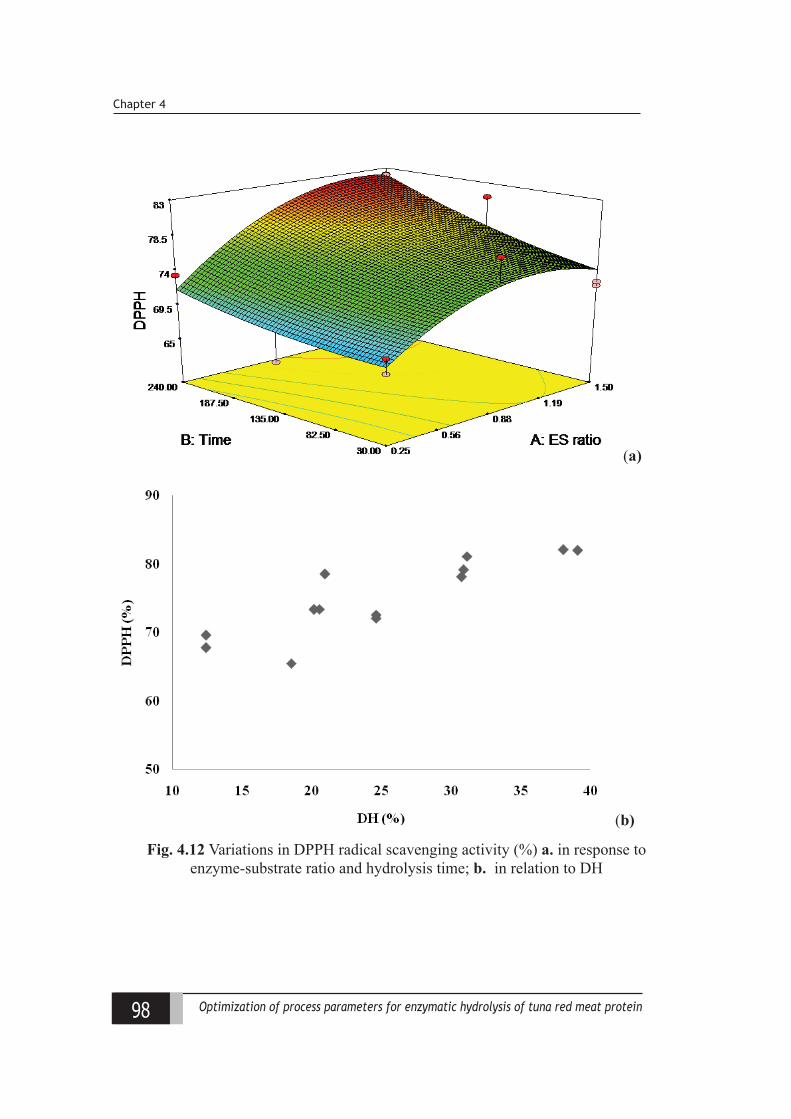
98 Optimization of process parameters for enzymatic hydrolysis of tuna red meat protein
Chapter 4
(a)
(b)
Fig. 4.12 Variations in DPPH radical scavenging activity (%) a. in response to enzyme-substrate ratio and hydrolysis time; b. in relation to DH
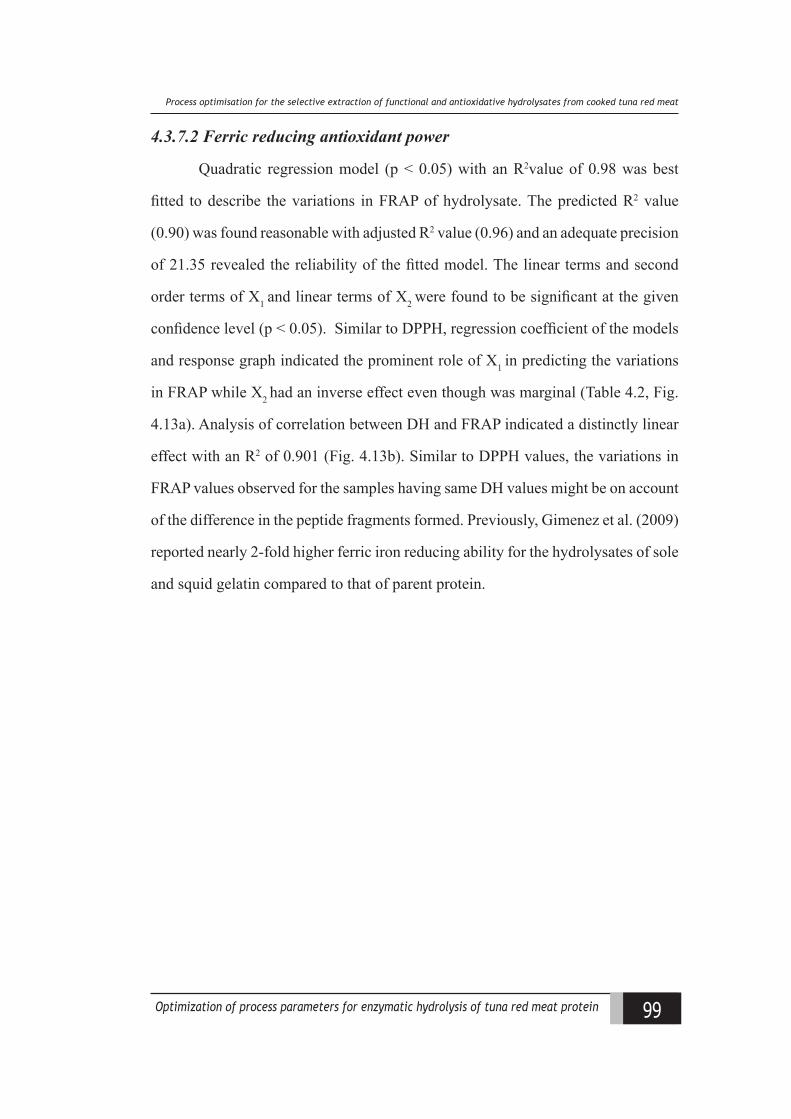
99Optimization of process parameters for enzymatic hydrolysis of tuna red meat protein
Process optimisation for the selective extraction of functional and antioxidative hydrolysates from cooked tuna red meat
4.3.7.2 Ferric reducing antioxidant power
Quadratic regression model (p < 0.05) with an R2value of 0.98 was best
fitted to describe the variations in FRAP of hydrolysate. The predicted R2 value
(0.90) was found reasonable with adjusted R2 value (0.96) and an adequate precision
of 21.35 revealed the reliability of the fitted model. The linear terms and second
order terms of X1 and linear terms of X2 were found to be significant at the given
confidence level (p < 0.05). Similar to DPPH, regression coefficient of the models
and response graph indicated the prominent role of X1 in predicting the variations
in FRAP while X2 had an inverse effect even though was marginal (Table 4.2, Fig.
4.13a). Analysis of correlation between DH and FRAP indicated a distinctly linear
effect with an R2 of 0.901 (Fig. 4.13b). Similar to DPPH values, the variations in
FRAP values observed for the samples having same DH values might be on account
of the difference in the peptide fragments formed. Previously, Gimenez et al. (2009)
reported nearly 2-fold higher ferric iron reducing ability for the hydrolysates of sole
and squid gelatin compared to that of parent protein.
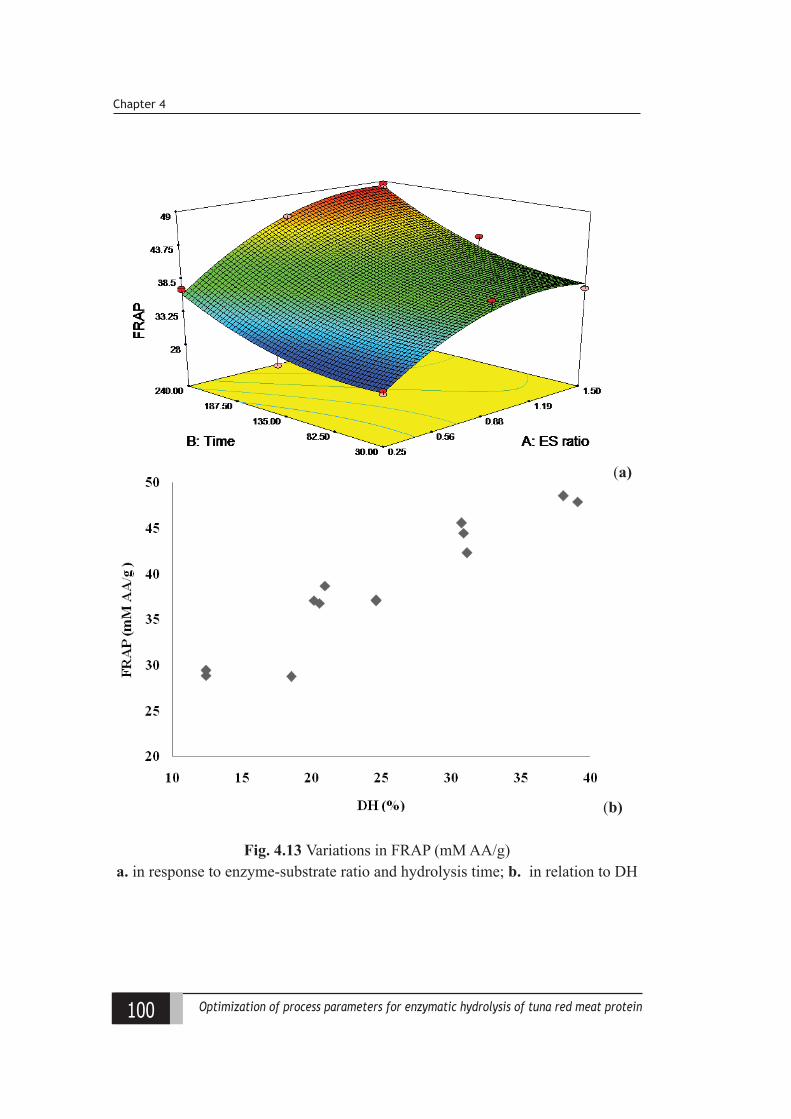
100 Optimization of process parameters for enzymatic hydrolysis of tuna red meat protein
Chapter 4
(a)
(b)
Fig. 4.13 Variations in FRAP (mM AA/g) a. in response to enzyme-substrate ratio and hydrolysis time; b. in relation to DH
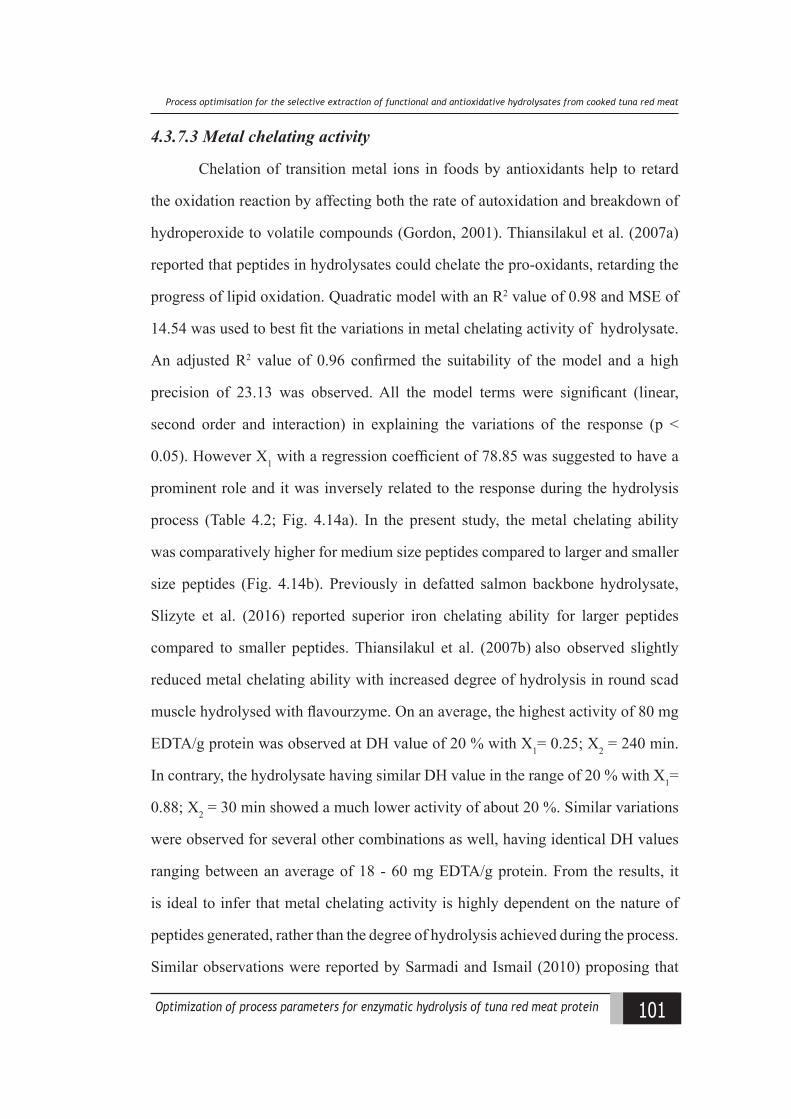
101Optimization of process parameters for enzymatic hydrolysis of tuna red meat protein
Process optimisation for the selective extraction of functional and antioxidative hydrolysates from cooked tuna red meat
4.3.7.3 Metal chelating activity
Chelation of transition metal ions in foods by antioxidants help to retard
the oxidation reaction by affecting both the rate of autoxidation and breakdown of
hydroperoxide to volatile compounds (Gordon, 2001). Thiansilakul et al. (2007a)
reported that peptides in hydrolysates could chelate the pro-oxidants, retarding the
progress of lipid oxidation. Quadratic model with an R2 value of 0.98 and MSE of
14.54 was used to best fit the variations in metal chelating activity of hydrolysate.
An adjusted R2 value of 0.96 confirmed the suitability of the model and a high
precision of 23.13 was observed. All the model terms were significant (linear,
second order and interaction) in explaining the variations of the response (p <
0.05). However X1 with a regression coefficient of 78.85 was suggested to have a
prominent role and it was inversely related to the response during the hydrolysis
process (Table 4.2; Fig. 4.14a). In the present study, the metal chelating ability
was comparatively higher for medium size peptides compared to larger and smaller
size peptides (Fig. 4.14b). Previously in defatted salmon backbone hydrolysate,
Slizyte et al. (2016) reported superior iron chelating ability for larger peptides
compared to smaller peptides. Thiansilakul et al. (2007b) also observed slightly
reduced metal chelating ability with increased degree of hydrolysis in round scad
muscle hydrolysed with flavourzyme. On an average, the highest activity of 80 mg
EDTA/g protein was observed at DH value of 20 % with X1= 0.25; X2 = 240 min.
In contrary, the hydrolysate having similar DH value in the range of 20 % with X1=
0.88; X2 = 30 min showed a much lower activity of about 20 %. Similar variations
were observed for several other combinations as well, having identical DH values
ranging between an average of 18 - 60 mg EDTA/g protein. From the results, it
is ideal to infer that metal chelating activity is highly dependent on the nature of
peptides generated, rather than the degree of hydrolysis achieved during the process.
Similar observations were reported by Sarmadi and Ismail (2010) proposing that
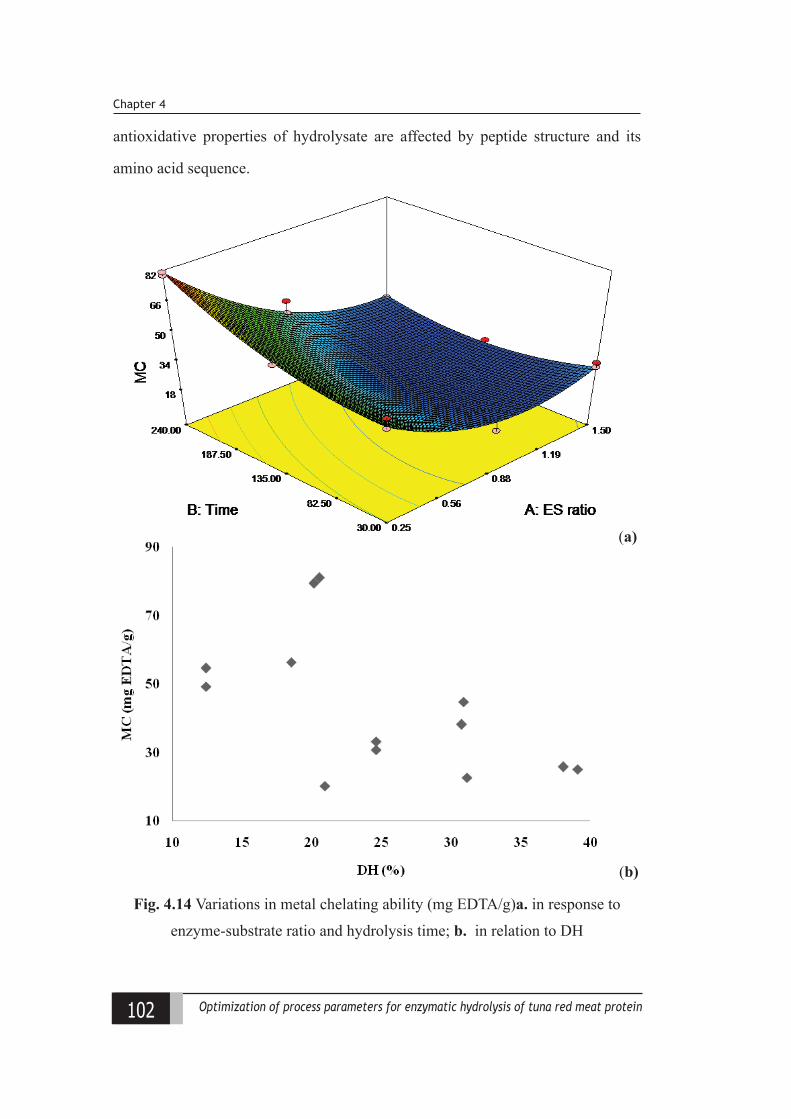
102 Optimization of process parameters for enzymatic hydrolysis of tuna red meat protein
Chapter 4
antioxidative properties of hydrolysate are affected by peptide structure and its
amino acid sequence.
(a)
(b)
Fig. 4.14 Variations in metal chelating ability (mg EDTA/g)a. in response to
enzyme-substrate ratio and hydrolysis time; b. in relation to DH
103Optimization of process parameters for enzymatic hydrolysis of tuna red meat protein
Process optimisation for the selective extraction of functional and antioxidative hydrolysates from cooked tuna red meat
4.3.7.4 ABTS radical scavenging activity
ABTS assay is an excellent tool for determining the antioxidant activity
of hydrogen-donating compounds (aqueous phase radical scavenger) and chain-
breaking antioxidants (lipid peroxyl radical scavenger) (Binsan et al., 2008).
Variations in ABTS radical scavenging activity was best fitted using quadratic model
(p < 0.05) with an R2 value of 0.89 (Table 4.2) and MSE of 2.26. A higher regression
coefficient of 25.87 for X1 (p < 0.05) indicated the strong and direct influence of
enzyme concentration in explaining the variations in ABTS (Fig. 4.15a). Quadratic
regression of X1 as well as interaction of X1 X2 were the other significant factors
(p < 0.05) influencing this response variable. However, hydrolysis time indicated
very minor and insignificant effect on the ABTS values of the hydrolysates.
Variations in ABTS during hydrolytic study ranged from about 47 - 58 % (Table
4.1) with maximum value at DH of 20.98 % (Fig. 4.15b), thereafter showed almost
a stagnating trend with slightly lower values. However, similar to other properties
described, variations in ABTS values were observed for samples having similar DH
values ranging from 2.8-4.5 %. Similar to the observations in the present study, You
et al. (2009) also reported an initial increase in ABTS radical scavenging activity
followed by a decrease, with increasing DH values in loach protein hydrolysate.
This essentially means that limited hydrolysis resulted in better antioxidant ability
than extensive hydrolysis. Similar trend was observed in the present study also with
comparatively higher ABTS activity for smaller peptides with limited hydrolysis
(Table 4.1) as substantiated with a negative regression coefficient for second order
terms of X1.
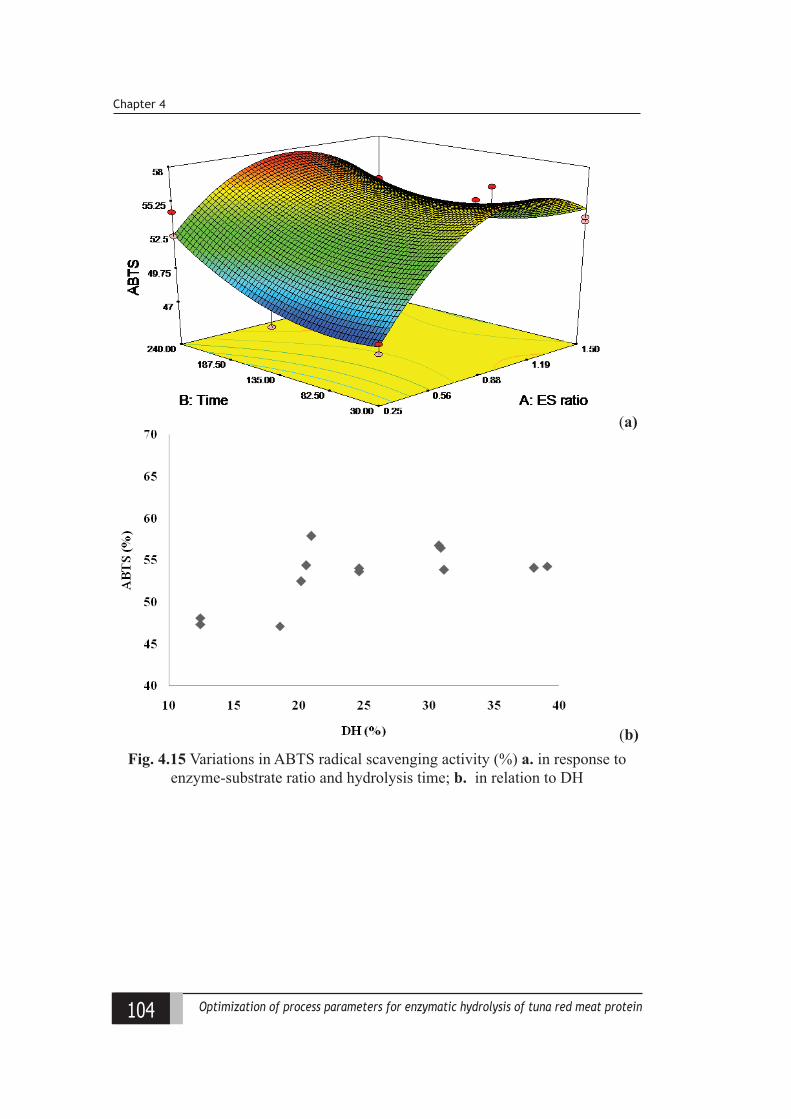
104 Optimization of process parameters for enzymatic hydrolysis of tuna red meat protein
Chapter 4
(a)
(b)Fig. 4.15 Variations in ABTS radical scavenging activity (%) a. in response to
enzyme-substrate ratio and hydrolysis time; b. in relation to DH
105Optimization of process parameters for enzymatic hydrolysis of tuna red meat protein
Process optimisation for the selective extraction of functional and antioxidative hydrolysates from cooked tuna red meat
From above observations, it may be inferred that optimum conditions for
extracting surface-active peptides were; E/S of 0.34 % for a duration of 30 min
at 600C and pH 6.5 (Table 4.3). The maximum desirability score obtained for this
condition was 0.49, when protein recovery was included as response variable, and
0.70 without protein recovery. On the other hand, for optimized antioxidant activity,
a desirability of 0.71 was observed for the hydrolytic condition viz., 0.98 % E/S for
240 min at 60oC and 6.5 pH, with protein recovery and without including protein
recovery the desirability was 0.74. This further implies that, one may opt for a serial
hydrolysis process for selectively extracting larger surface-active peptides in the
first step, followed by extensive hydrolysis to extract shorter peptides having higher
antioxidant capacity in the subsequent steps. Further, all the response variables
of the final products were validated. The experimental and predicted values were
within the range, thus confirming the reliability of the optimised condition.
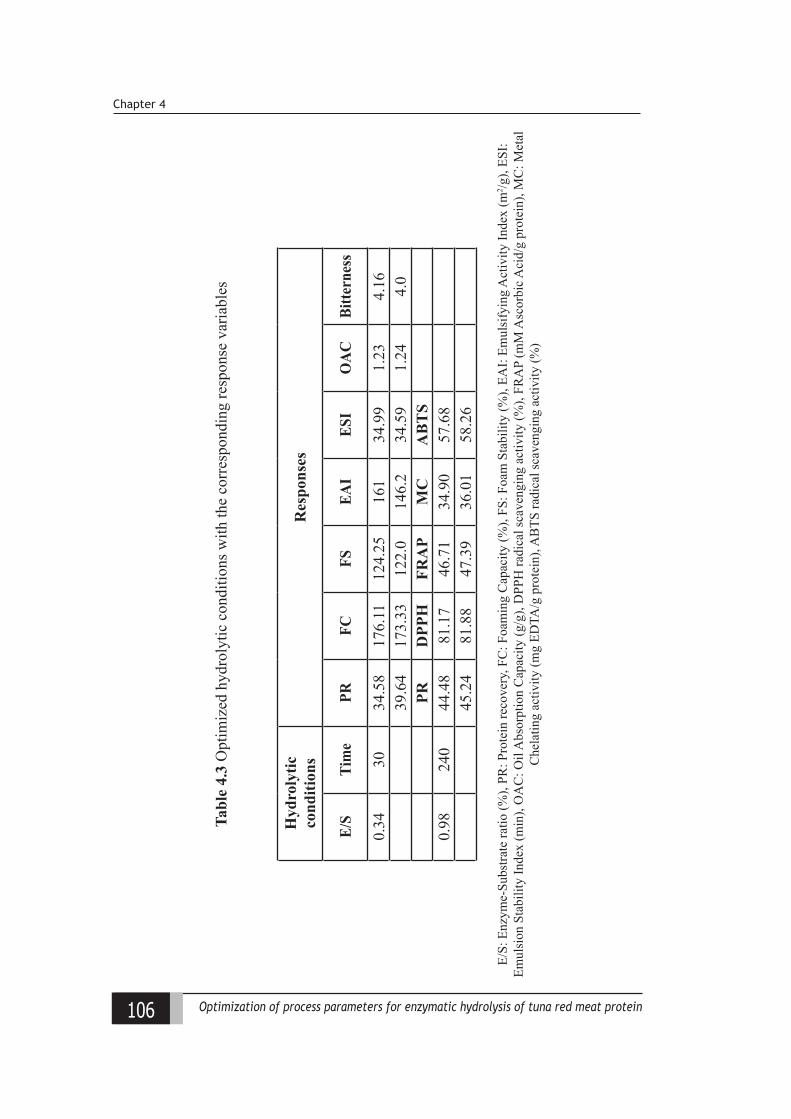
106 Optimization of process parameters for enzymatic hydrolysis of tuna red meat protein
Chapter 4
Tabl
e 4.
3 O
ptim
ized
hyd
roly
tic c
ondi
tions
with
the
corr
espo
ndin
g re
spon
se v
aria
bles
Hyd
roly
tic
cond
ition
sR
espo
nses
E/S
Tim
ePR
FCFS
EAI
ESI
OA
CBi
ttern
ess
0.34
3034
.58
176.
1112
4.25
161
34.9
91.
234.
1639
.64
173.
3312
2.0
146.
234
.59
1.24
4.0
PRD
PPH
FRA
PM
CA
BT
S0.
9824
044
.48
81.1
746
.71
34.9
057
.68
45.2
481
.88
47.3
936
.01
58.2
6
E/S:
Enz
yme-
Subs
trate
ratio
(%),
PR: P
rote
in re
cove
ry, F
C: F
oam
ing
Cap
acity
(%),
FS: F
oam
Sta
bilit
y (%
), EA
I: Em
ulsi
fyin
g A
ctiv
ity In
dex
(m2 /g
), ES
I: Em
ulsi
on S
tabi
lity
Inde
x (m
in),
OA
C: O
il A
bsor
ptio
n C
apac
ity (g
/g),
DPP
H ra
dica
l sca
veng
ing
activ
ity (%
), FR
AP
(mM
Asc
orbi
c Aci
d/g
prot
ein)
, MC
: Met
al
Che
latin
g ac
tivity
(mg
EDTA
/g p
rote
in),
AB
TS ra
dica
l sca
veng
ing
activ
ity (%
)
107Optimization of process parameters for enzymatic hydrolysis of tuna red meat protein
Process optimisation for the selective extraction of functional and antioxidative hydrolysates from cooked tuna red meat
4.4 Conclusion
The objective of the study was to identify the optimised process conditions
for deriving tuna protein hydrolysate having desirable range of functional and
antioxidative properties separately by suitable statistical models. Moreover,
emphasis was given to assess the dependency of these properties on degree of
hydrolysis by comparing the values of hydrolysates obtained through different
hydrolytic conditions, but having similar DH values. It was clear from the results
that, for the parameters analysed, enzyme-substrate ratio (X1) was more influential
in explaining the response variations than hydrolysis time. Correlation studies
between the degree of hydrolysis and responses recommended that though a general
trend can be suggested, peptide properties can’t be entirely explained based on the
degree of hydrolysis but rather on the nature of polypeptide fragment formed under
different hydrolytic conditions.

108 Optimization of process parameters for enzymatic hydrolysis of tuna red meat protein
Chapter 3
109Optimization of process parameters for enzymatic hydrolysis of tuna red meat protein
Funational and antioxidant protein hydrolysates from yellowfn tuna raw red meatt ptimiiation ly RS
Chapter 5Functional and antioxidant protein hydrolysates from
yellowfintunarawredmeat:Optimization by RSM
5.1 Introduction
Marine resources are considered as the cheapest and one of the richest
sources of nutrients, especially protein with balanced amino acid pattern. However
a major share of the marine biomass is being discarded as byproduct with low
market realization. Awareness among consumers regarding the potential recovery
of nutrients from fish waste has created increased interest in exploiting these
sources. Among the seafood, tuna is considered as the richest source of protein. This
nutritional significance together with its widespread economic impact on account of
their contribution to international trade has made tuna waste of particular interest to
upgrade. Tuna flesh consists of both white and red meat of which red meat is usually
discarded as waste in seafood industry with negligible market value (Herpandi et
al., 2011). Hence upgradation of the same in the form of protein hydrolysate, having
immense properties can add more value as well as diversify its application potential.
110 Optimization of process parameters for enzymatic hydrolysis of tuna red meat protein
Chapter 5
As mentioned in Chapter 4, no comprehensive studies have been reported on
the optimization of process conditions for the selective extraction of both functional
and antioxidative peptides, separately from the same source. Hence, the present
study focused on optimizing the key processing variables viz., enzyme-substrate
ratio and hydrolysis time at pre-optimized temperature and pH, through RSM with
a central composite design, to obtain process parameters for separately deriving the
antioxidant and functional hydrolysates from yellow fin tuna raw red meat. Further,
the variations in properties with respect to the extent of hydrolysis were statistically
correlated. This study intended to have a comparative evaluation with respect to the
extent of variations in properties exhibited by the derived hydrolysates with respect
to the change in raw material used viz., raw tuna red meat instead of cooked tuna
red meat which was used in the initial optimization study described in chapter 4.
5.2 Materials and methods
5.2.1 Raw material, enzyme and chemicals
Raw tuna red meat was used as the raw material and loins were collected as
by-product from Moon Fishery Pvt. Ltd., Kochi, India and brought to the laboratory
in iced condition. It was kept at -20oC till further use. The tuna raw red meat was
minced, treated with boiled water (1:4 (w/v)) for five min, cooled, treated with
0.2 % (w/v) sodium bicarbonate (1:4 (w/v)) for two min and pressed to original
moisture content. This treated meat was used as the starting material for further
optimization studies. Hydrolysis was carried out using papain enzyme (Hi Media)
from papaya latex. All other chemicals used for the experiment were of analytical
grade.
5.2.2 Process optimization for protein hydrolysis
Treated red meat mince was mixed well with twice the amount of water
(w/v) to slurry form and was subjected to hydrolysis under optimized temperature
111Optimization of process parameters for enzymatic hydrolysis of tuna red meat protein
Funational and antioxidant protein hydrolysates from yellowfn tuna raw red meatt ptimiiation ly RS
and pH. Optimization studies carried out (previously described in chapter 4,
section 4.2.2) indicated a temperature of 60oC to be suitable (described in chapter
4, section 4.3.2). A physiological pH of 6.5 was adopted which was the initial pH
of the substrate (treated meat and water slurry) without any added salt. RSM based
hydrolysis using papain was initiated as per central composite design with the input
factors viz., enzyme : substrate (E/S) concentration (X1) and hydrolysis time (X2) in
the range of 0.25-1.5 % and 30-240 mins, respectively (Table 5.1). Hydrolysis was
performed in a shaking water bath (Shaking bath, Neolab Instruments, Mumbai,
India) with constant agitation. After each sampling, hydrolysis was terminated by
heating the solution to 85-90°C for 15 - 20 min to assure enzyme inactivation. The
resultant solution was cooled, coarse filtered and centrifuged at 8000 g at 10oC
for 20 min (K-24A, Remi Instruments, Mumbai) to obtain supernatant containing
protein hydrolysate solution which was spray dried (Lab 2 Advanced Laboratory
type, Hemraj, Mumbai) and further used for analysis.
5.2.3 Determination of proximate composition
Proximate composition of raw tuna red meat and treated red meat was
estimated as per AOAC (2012). Protein content of tuna red meat and hydrolysates
were estimated by kjeldahl method (detailed in chapter 3; section 3.2.3 and chapter
4; section 4.2.4).
5.2.4 Determination of degree of hydrolysis and protein recovery
DH was evaluated as percentage of α-amino nitrogen in the hydrolysates
with respect to the total nitrogen content in raw material. Total nitrogen content
was determined by Kjeldahl method (AOAC, 2012) (detailed in chapter 3; section
3.2.3) and α-amino nitrogen was determined by formol titration method (Taylor,
1957) (detailed in chapter 3; section 3.2.5). PR in hydrolysate was defined as the
percentage of protein obtained during the extraction process in hydrolysate to the
total amount of protein in raw material.
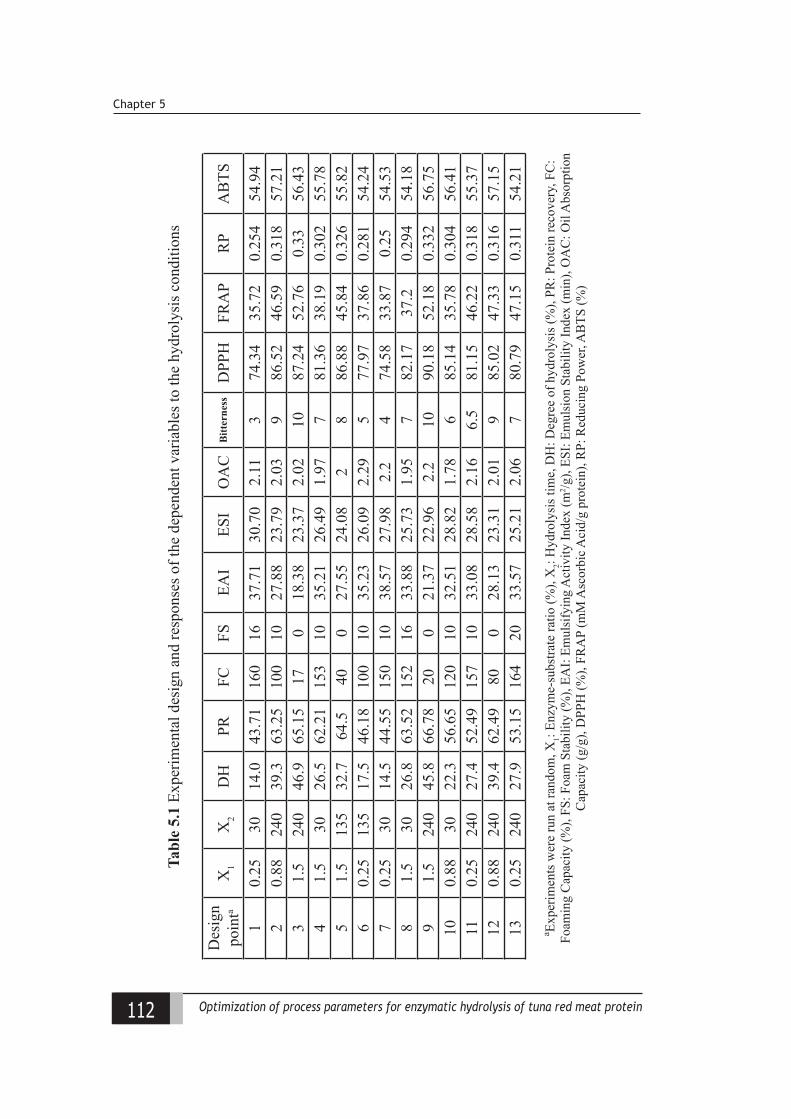
112 Optimization of process parameters for enzymatic hydrolysis of tuna red meat protein
Chapter 5
Des
ign
poin
taX
1X
2D
HPR
FCFS
EAI
ESI
OA
CB
itter
ness
DPP
HFR
AP
RP
AB
TS
10.
2530
14.0
43.7
116
016
37.7
130
.70
2.11
374
.34
35.7
20.
254
54.9
42
0.88
240
39.3
63.2
510
010
27.8
823
.79
2.03
986
.52
46.5
90.
318
57.2
13
1.5
240
46.9
65.1
517
018
.38
23.3
72.
0210
87.2
452
.76
0.33
56.4
34
1.5
3026
.562
.21
153
1035
.21
26.4
91.
977
81.3
638
.19
0.30
255
.78
51.
513
532
.764
.540
027
.55
24.0
82
886
.88
45.8
40.
326
55.8
26
0.25
135
17.5
46.1
810
010
35.2
326
.09
2.29
577
.97
37.8
60.
281
54.2
47
0.25
3014
.544
.55
150
1038
.57
27.9
82.
24
74.5
833
.87
0.25
54.5
38
1.5
3026
.863
.52
152
1633
.88
25.7
31.
957
82.1
737
.20.
294
54.1
89
1.5
240
45.8
66.7
820
021
.37
22.9
62.
210
90.1
852
.18
0.33
256
.75
100.
8830
22.3
56.6
512
010
32.5
128
.82
1.78
685
.14
35.7
80.
304
56.4
111
0.25
240
27.4
52.4
915
710
33.0
828
.58
2.16
6.5
81.1
546
.22
0.31
855
.37
120.
8824
039
.462
.49
800
28.1
323
.31
2.01
985
.02
47.3
30.
316
57.1
513
0.25
240
27.9
53.1
516
420
33.5
725
.21
2.06
780
.79
47.1
50.
311
54.2
1
Tabl
e 5.
1 Ex
perim
enta
l des
ign
and
resp
onse
s of t
he d
epen
dent
var
iabl
es to
the
hydr
olys
is c
ondi
tions
a Expe
rimen
ts w
ere
run
at ra
ndom
, X1:
Enzy
me-
subs
trate
ratio
(%),
X2:
Hyd
roly
sis t
ime,
DH
: Deg
ree
of h
ydro
lysi
s (%
), PR
: Pro
tein
reco
very
, FC
: Fo
amin
g C
apac
ity (%
), FS
: Foa
m S
tabi
lity
(%),
EAI:
Emul
sify
ing
Act
ivity
Inde
x (m
2 /g),
ESI:
Emul
sion
Sta
bilit
y In
dex
(min
), O
AC
: Oil
Abs
orpt
ion
Cap
acity
(g/g
), D
PPH
(%),
FRA
P (m
M A
scor
bic A
cid/
g pr
otei
n), R
P: R
educ
ing
Pow
er, A
BTS
(%)
113Optimization of process parameters for enzymatic hydrolysis of tuna red meat protein
Funational and antioxidant protein hydrolysates from yellowfn tuna raw red meatt ptimiiation ly RS
5.2.5 Determination of functional and antioxidative properties
Functional properties of the hydrolysates viz., foaming properties (Sathe
and Salunkhe, 1981); emulsifying properties(Pearce and Kinsella, 1978); oil
absorption capacity (Shahidi et al.,1995) of the hydrolysates were determined. Ten
trained panelists were assigned for the sensory analysis for bitterness adopting the
methodology of Nilsang et al. (2005) with modifications. Antioxidative properties
determined included DPPH radical-scavenging activity (Shimada et al., 1992);
ferric reducing antioxidant power (FRAP)(Benzie and Strain, 1996); reducing
power(Oyaiza, 1986) and ABTS radical (2,20 -azinobis-(3-ethylbenzothiazoline-6-
sulfonic acid)) scavenging activity (Re et al., 1999) (detailed in chapter 3; section
3.2.8 and 3.2.9).
5.2.6 Statistical model development
RSM with central composite design consisted of 13 experimental points
conducted in random order (Table 5.1). Second order regression models were fitted
to the response variables as a function of input variables. The data from the CCD
were explained by multiple regressions to fit the following second-order polynomial
equation:
Second order regression: Y = β0 + βiXi + βijXiXj + βiiXi2, i ≠ j = 1,2
where Y is the response; β0 is the offset term; βi, βijandβii are regression coefficients;
and Xi and Xj are levels of the independent variables. Experimental data were
fitted to generate tri-dimensional and contour plots from the regression and these
response surfaces and contour plots were used to visualize the relationship between
the response and experimental levels of each factor, and determine the optimum
conditions. The models were fitted using software Design expert 7.0.
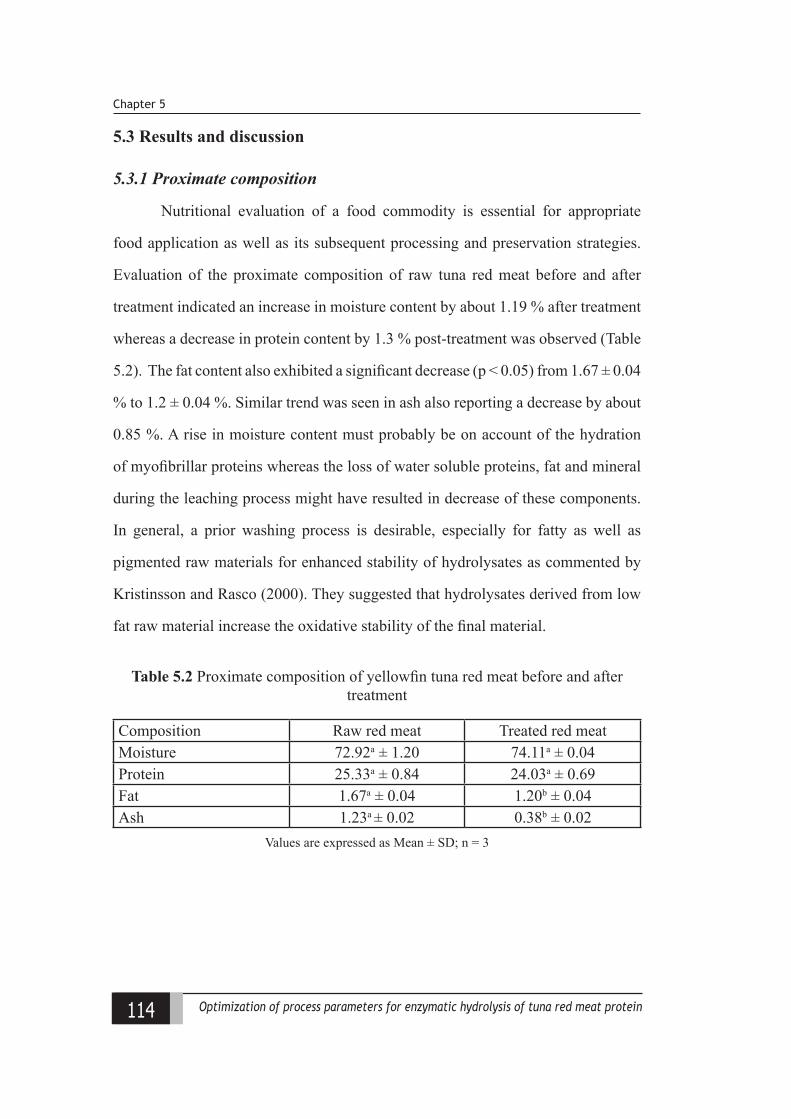
114 Optimization of process parameters for enzymatic hydrolysis of tuna red meat protein
Chapter 5
5.3 Results and discussion
5.3.1 Proximate composition
Nutritional evaluation of a food commodity is essential for appropriate
food application as well as its subsequent processing and preservation strategies.
Evaluation of the proximate composition of raw tuna red meat before and after
treatment indicated an increase in moisture content by about 1.19 % after treatment
whereas a decrease in protein content by 1.3 % post-treatment was observed (Table
5.2). The fat content also exhibited a significant decrease (p < 0.05) from 1.67 ± 0.04
% to 1.2 ± 0.04 %. Similar trend was seen in ash also reporting a decrease by about
0.85 %. A rise in moisture content must probably be on account of the hydration
of myofibrillar proteins whereas the loss of water soluble proteins, fat and mineral
during the leaching process might have resulted in decrease of these components.
In general, a prior washing process is desirable, especially for fatty as well as
pigmented raw materials for enhanced stability of hydrolysates as commented by
Kristinsson and Rasco (2000). They suggested that hydrolysates derived from low
fat raw material increase the oxidative stability of the final material.
Table 5.2 Proximate composition of yellowfin tuna red meat before and after treatment
Composition Raw red meat Treated red meatMoisture 72.92a ± 1.20 74.11a ± 0.04Protein 25.33a ± 0.84 24.03a ± 0.69Fat 1.67a ± 0.04 1.20b ± 0.04Ash 1.23a ± 0.02 0.38b ± 0.02
Values are expressed as Mean ± SD; n = 3
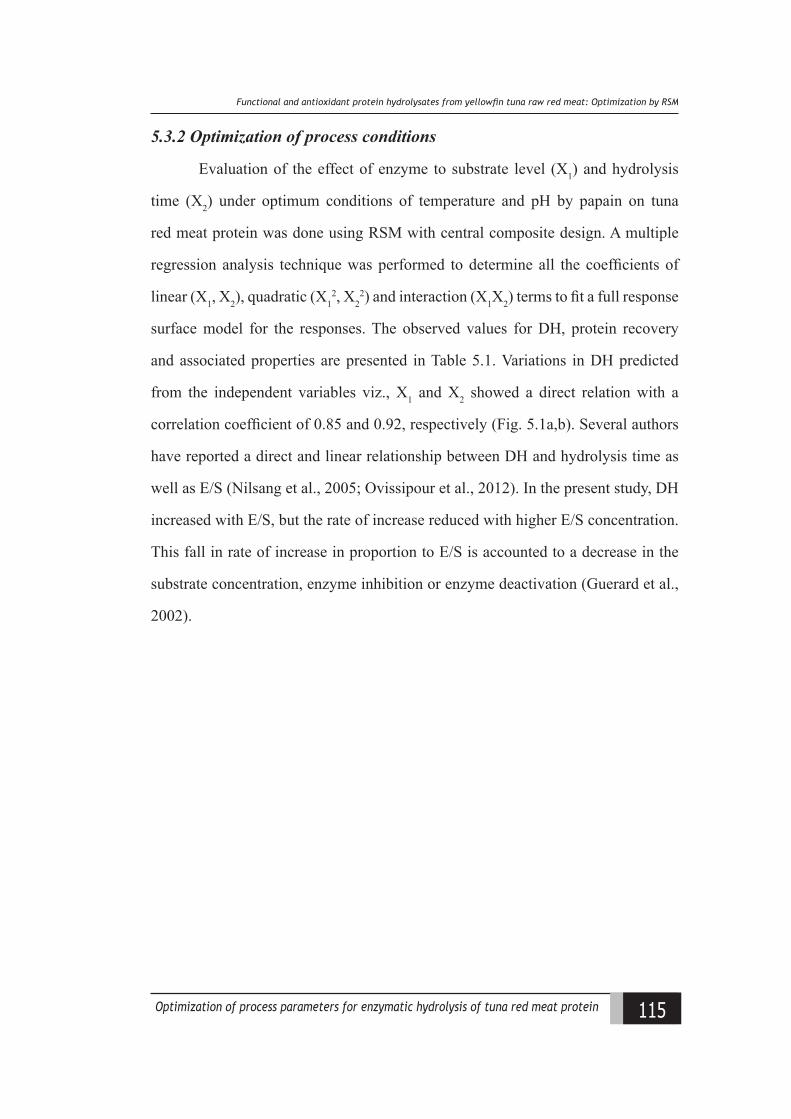
115Optimization of process parameters for enzymatic hydrolysis of tuna red meat protein
Funational and antioxidant protein hydrolysates from yellowfn tuna raw red meatt ptimiiation ly RS
5.3.2 Optimization of process conditions
Evaluation of the effect of enzyme to substrate level (X1) and hydrolysis
time (X2) under optimum conditions of temperature and pH by papain on tuna
red meat protein was done using RSM with central composite design. A multiple
regression analysis technique was performed to determine all the coefficients of
linear (X1, X2), quadratic (X12, X2
2) and interaction (X1X2) terms to fit a full response
surface model for the responses. The observed values for DH, protein recovery
and associated properties are presented in Table 5.1. Variations in DH predicted
from the independent variables viz., X1 and X2 showed a direct relation with a
correlation coefficient of 0.85 and 0.92, respectively (Fig. 5.1a,b). Several authors
have reported a direct and linear relationship between DH and hydrolysis time as
well as E/S (Nilsang et al., 2005; Ovissipour et al., 2012). In the present study, DH
increased with E/S, but the rate of increase reduced with higher E/S concentration.
This fall in rate of increase in proportion to E/S is accounted to a decrease in the
substrate concentration, enzyme inhibition or enzyme deactivation (Guerard et al.,
2002).
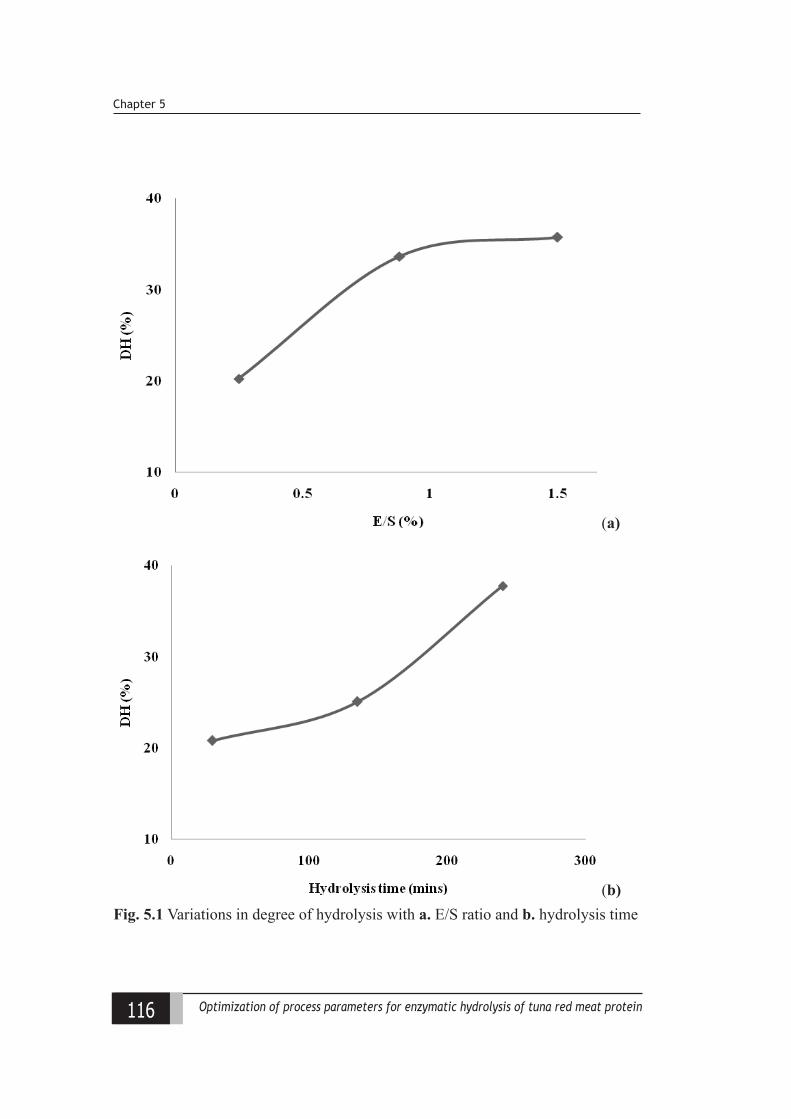
116 Optimization of process parameters for enzymatic hydrolysis of tuna red meat protein
Chapter 5
(a)
(b)Fig. 5.1 Variations in degree of hydrolysis with a. E/S ratio and b. hydrolysis time
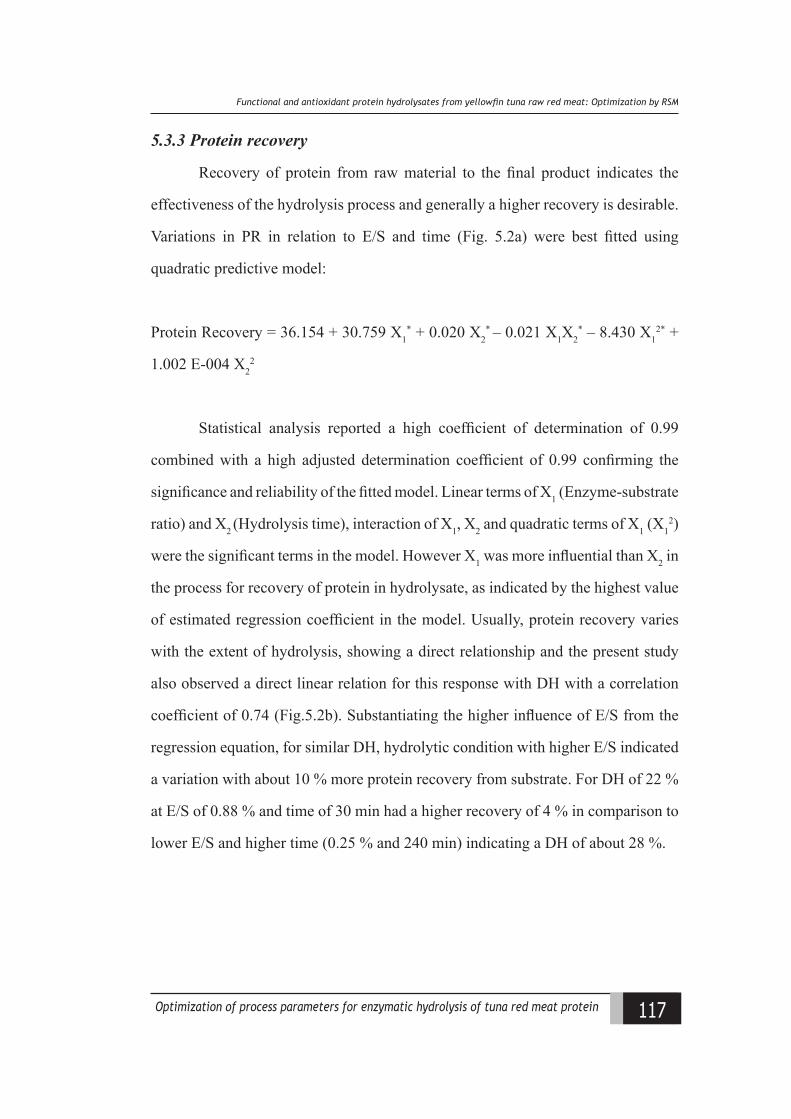
117Optimization of process parameters for enzymatic hydrolysis of tuna red meat protein
Funational and antioxidant protein hydrolysates from yellowfn tuna raw red meatt ptimiiation ly RS
5.3.3 Protein recovery
Recovery of protein from raw material to the final product indicates the
effectiveness of the hydrolysis process and generally a higher recovery is desirable.
Variations in PR in relation to E/S and time (Fig. 5.2a) were best fitted using
quadratic predictive model:
Protein Recovery = 36.154 + 30.759 X1* + 0.020 X2
* – 0.021 X1X2* – 8.430 X1
2* +
1.002 E-004 X22
Statistical analysis reported a high coefficient of determination of 0.99
combined with a high adjusted determination coefficient of 0.99 confirming the
significance and reliability of the fitted model. Linear terms of X1 (Enzyme-substrate
ratio) and X2 (Hydrolysis time), interaction of X1, X2 and quadratic terms of X1 (X12)
were the significant terms in the model. However X1 was more influential than X2 in
the process for recovery of protein in hydrolysate, as indicated by the highest value
of estimated regression coefficient in the model. Usually, protein recovery varies
with the extent of hydrolysis, showing a direct relationship and the present study
also observed a direct linear relation for this response with DH with a correlation
coefficient of 0.74 (Fig.5.2b). Substantiating the higher influence of E/S from the
regression equation, for similar DH, hydrolytic condition with higher E/S indicated
a variation with about 10 % more protein recovery from substrate. For DH of 22 %
at E/S of 0.88 % and time of 30 min had a higher recovery of 4 % in comparison to
lower E/S and higher time (0.25 % and 240 min) indicating a DH of about 28 %.
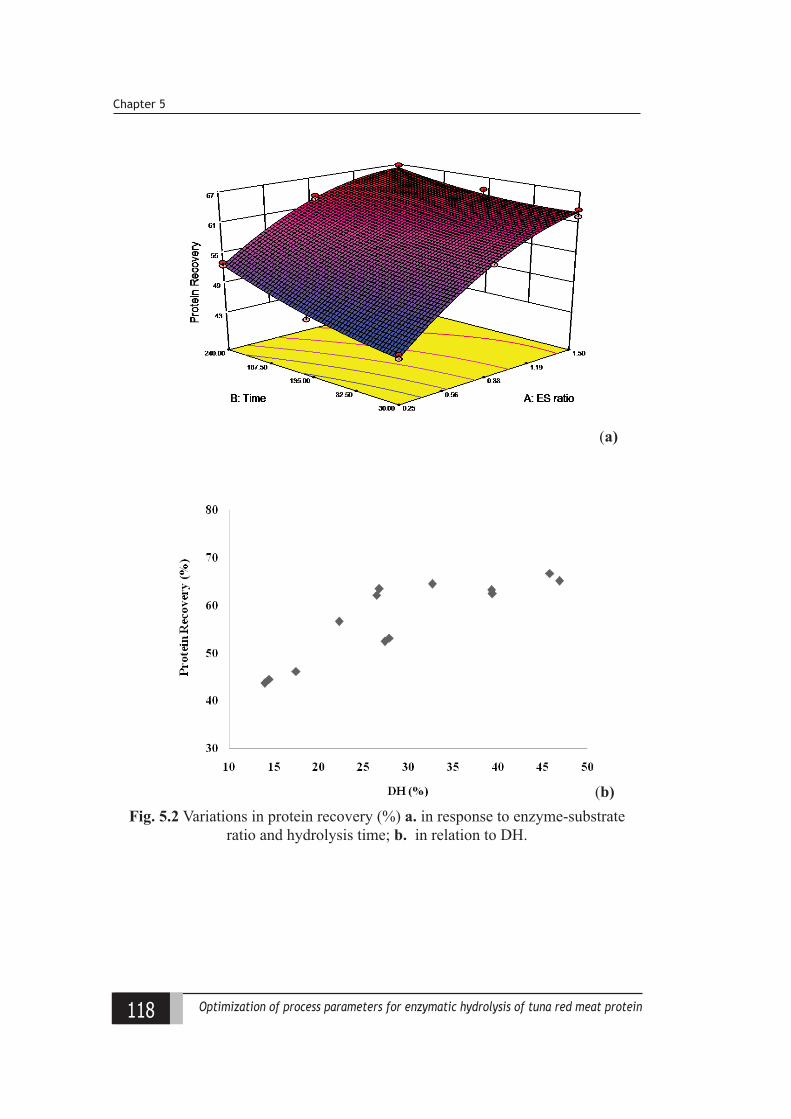
118 Optimization of process parameters for enzymatic hydrolysis of tuna red meat protein
Chapter 5
(a)
(b)Fig. 5.2 Variations in protein recovery (%) a. in response to enzyme-substrate
ratio and hydrolysis time; b. in relation to DH.
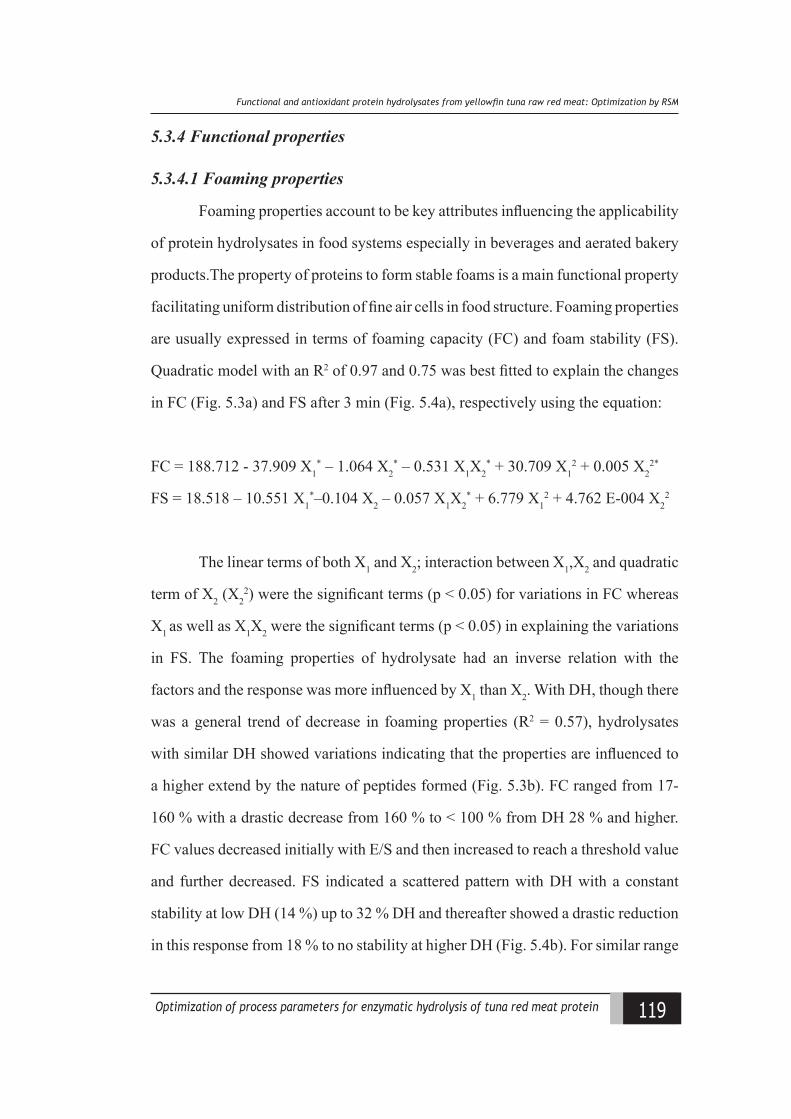
119Optimization of process parameters for enzymatic hydrolysis of tuna red meat protein
Funational and antioxidant protein hydrolysates from yellowfn tuna raw red meatt ptimiiation ly RS
5.3.4 Functional properties
5.3.4.1 Foaming properties
Foaming properties account to be key attributes influencing the applicability
of protein hydrolysates in food systems especially in beverages and aerated bakery
products.The property of proteins to form stable foams is a main functional property
facilitating uniform distribution of fine air cells in food structure. Foaming properties
are usually expressed in terms of foaming capacity (FC) and foam stability (FS).
Quadratic model with an R2 of 0.97 and 0.75 was best fitted to explain the changes
in FC (Fig. 5.3a) and FS after 3 min (Fig. 5.4a), respectively using the equation:
FC = 188.712 - 37.909 X1* – 1.064 X2
* – 0.531 X1X2* + 30.709 X1
2 + 0.005 X22*
FS = 18.518 – 10.551 X1*–0.104 X2 – 0.057 X1X2
* + 6.779 X12 + 4.762 E-004 X2
2
The linear terms of both X1 and X2; interaction between X1,X2 and quadratic
term of X2 (X22) were the significant terms (p < 0.05) for variations in FC whereas
X1 as well as X1X2 were the significant terms (p < 0.05) in explaining the variations
in FS. The foaming properties of hydrolysate had an inverse relation with the
factors and the response was more influenced by X1 than X2. With DH, though there
was a general trend of decrease in foaming properties (R2 = 0.57), hydrolysates
with similar DH showed variations indicating that the properties are influenced to
a higher extend by the nature of peptides formed (Fig. 5.3b). FC ranged from 17-
160 % with a drastic decrease from 160 % to < 100 % from DH 28 % and higher.
FC values decreased initially with E/S and then increased to reach a threshold value
and further decreased. FS indicated a scattered pattern with DH with a constant
stability at low DH (14 %) up to 32 % DH and thereafter showed a drastic reduction
in this response from 18 % to no stability at higher DH (Fig. 5.4b). For similar range
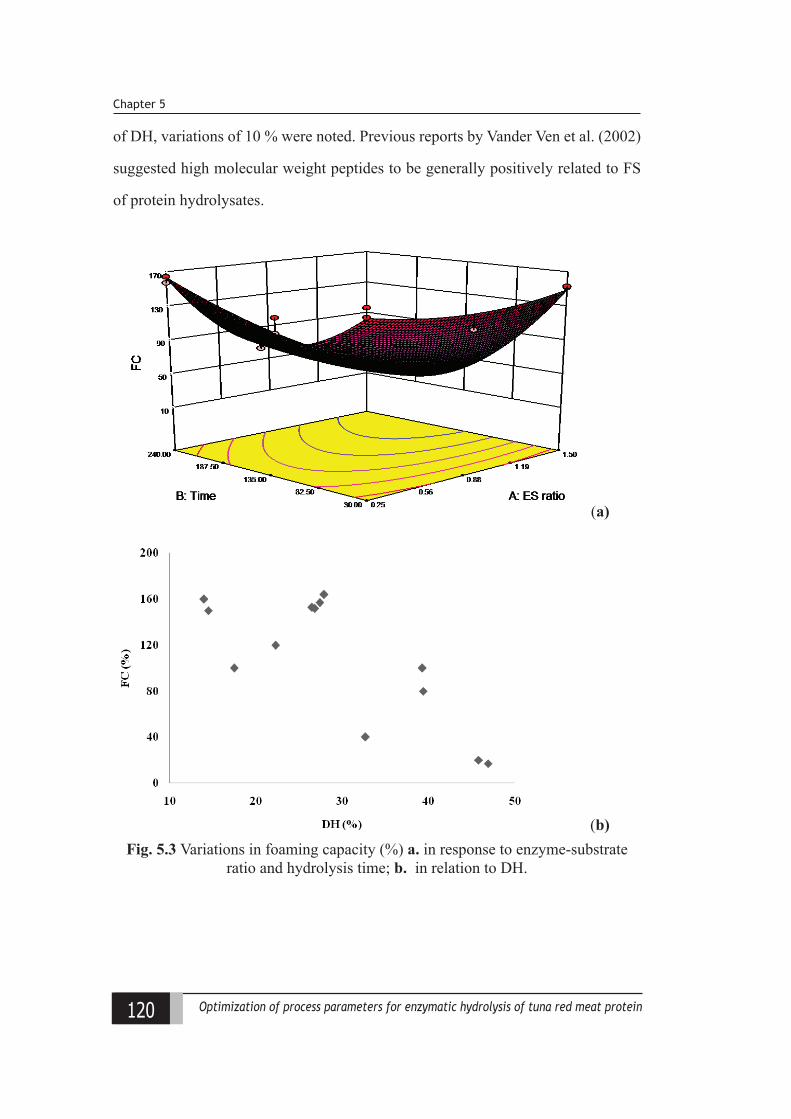
120 Optimization of process parameters for enzymatic hydrolysis of tuna red meat protein
Chapter 5
of DH, variations of 10 % were noted. Previous reports by Vander Ven et al. (2002)
suggested high molecular weight peptides to be generally positively related to FS
of protein hydrolysates.
(a)
(b)Fig. 5.3 Variations in foaming capacity (%) a. in response to enzyme-substrate
ratio and hydrolysis time; b. in relation to DH.
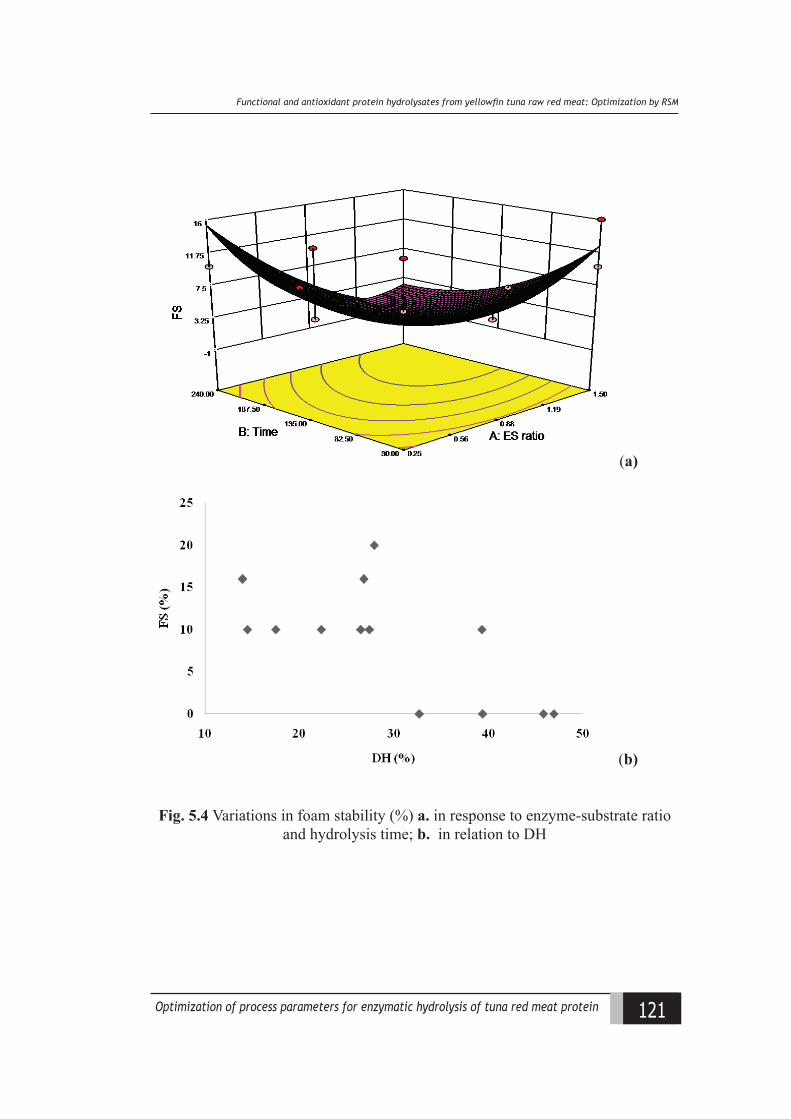
121Optimization of process parameters for enzymatic hydrolysis of tuna red meat protein
Funational and antioxidant protein hydrolysates from yellowfn tuna raw red meatt ptimiiation ly RS
(a)
(b)
Fig. 5.4 Variations in foam stability (%) a. in response to enzyme-substrate ratio and hydrolysis time; b. in relation to DH
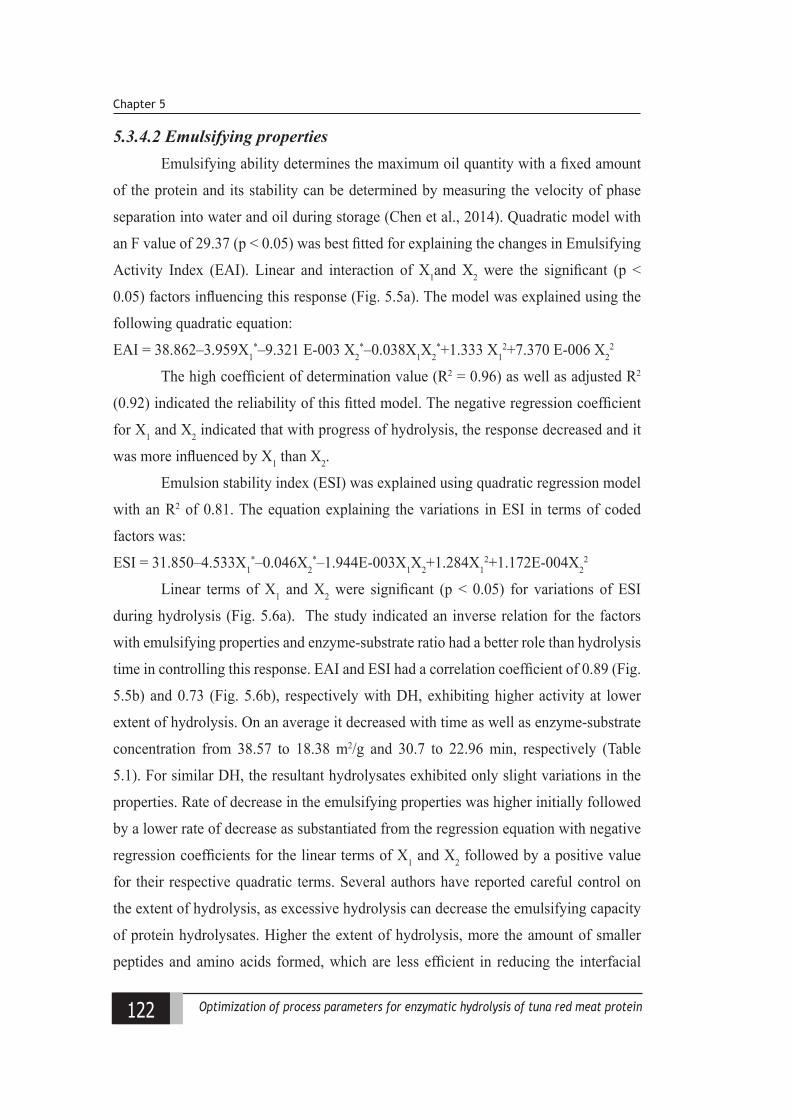
122 Optimization of process parameters for enzymatic hydrolysis of tuna red meat protein
Chapter 5
5.3.4.2 Emulsifying propertiesEmulsifying ability determines the maximum oil quantity with a fixed amount
of the protein and its stability can be determined by measuring the velocity of phase
separation into water and oil during storage (Chen et al., 2014). Quadratic model with
an F value of 29.37 (p < 0.05) was best fitted for explaining the changes in Emulsifying
Activity Index (EAI). Linear and interaction of X1and X2 were the significant (p <
0.05) factors influencing this response (Fig. 5.5a). The model was explained using the
following quadratic equation:
EAI = 38.862–3.959X1*–9.321 E-003 X2
*–0.038X1X2*+1.333 X1
2+7.370 E-006 X22
The high coefficient of determination value (R2 = 0.96) as well as adjusted R2
(0.92) indicated the reliability of this fitted model. The negative regression coefficient
for X1 and X2 indicated that with progress of hydrolysis, the response decreased and it
was more influenced by X1 than X2.
Emulsion stability index (ESI) was explained using quadratic regression model
with an R2 of 0.81. The equation explaining the variations in ESI in terms of coded
factors was:
ESI = 31.850–4.533X1*–0.046X2
*–1.944E-003X1X2+1.284X12+1.172E-004X2
2
Linear terms of X1 and X2 were significant (p < 0.05) for variations of ESI
during hydrolysis (Fig. 5.6a). The study indicated an inverse relation for the factors
with emulsifying properties and enzyme-substrate ratio had a better role than hydrolysis
time in controlling this response. EAI and ESI had a correlation coefficient of 0.89 (Fig.
5.5b) and 0.73 (Fig. 5.6b), respectively with DH, exhibiting higher activity at lower
extent of hydrolysis. On an average it decreased with time as well as enzyme-substrate
concentration from 38.57 to 18.38 m2/g and 30.7 to 22.96 min, respectively (Table
5.1). For similar DH, the resultant hydrolysates exhibited only slight variations in the
properties. Rate of decrease in the emulsifying properties was higher initially followed
by a lower rate of decrease as substantiated from the regression equation with negative
regression coefficients for the linear terms of X1 and X2 followed by a positive value
for their respective quadratic terms. Several authors have reported careful control on
the extent of hydrolysis, as excessive hydrolysis can decrease the emulsifying capacity
of protein hydrolysates. Higher the extent of hydrolysis, more the amount of smaller
peptides and amino acids formed, which are less efficient in reducing the interfacial
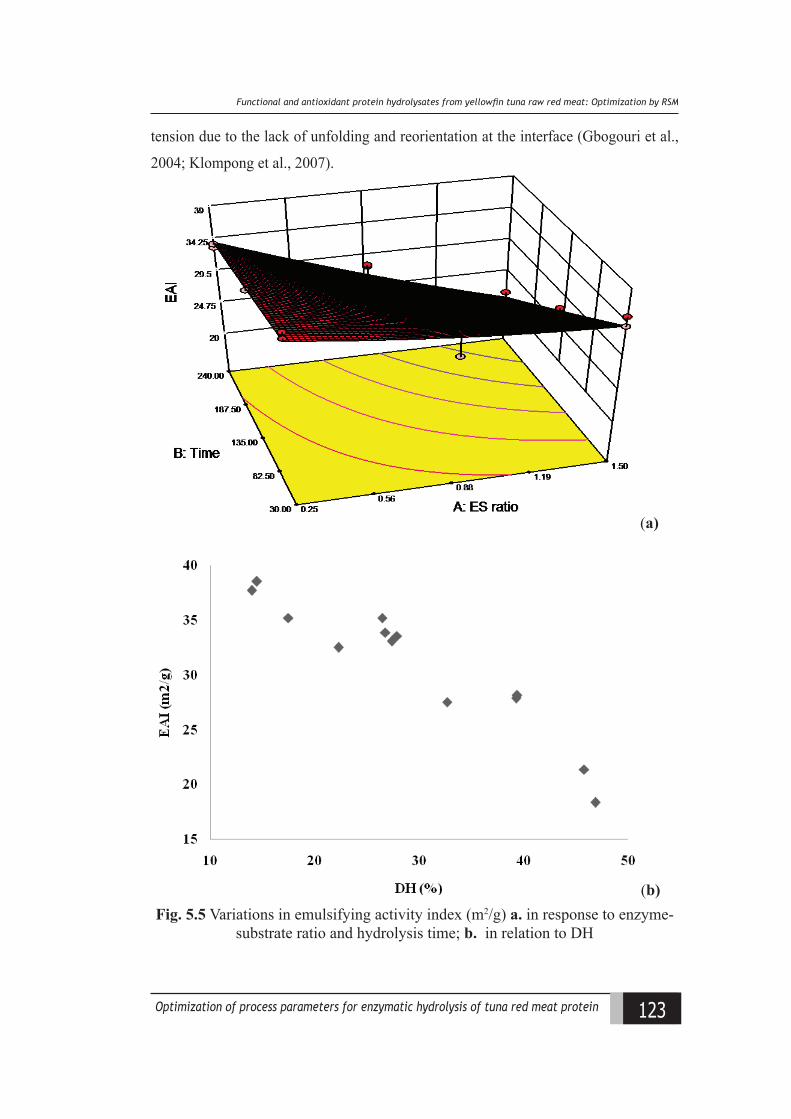
123Optimization of process parameters for enzymatic hydrolysis of tuna red meat protein
Funational and antioxidant protein hydrolysates from yellowfn tuna raw red meatt ptimiiation ly RS
tension due to the lack of unfolding and reorientation at the interface (Gbogouri et al.,
2004; Klompong et al., 2007).
(a)
(b)Fig. 5.5 Variations in emulsifying activity index (m2/g) a. in response to enzyme-
substrate ratio and hydrolysis time; b. in relation to DH
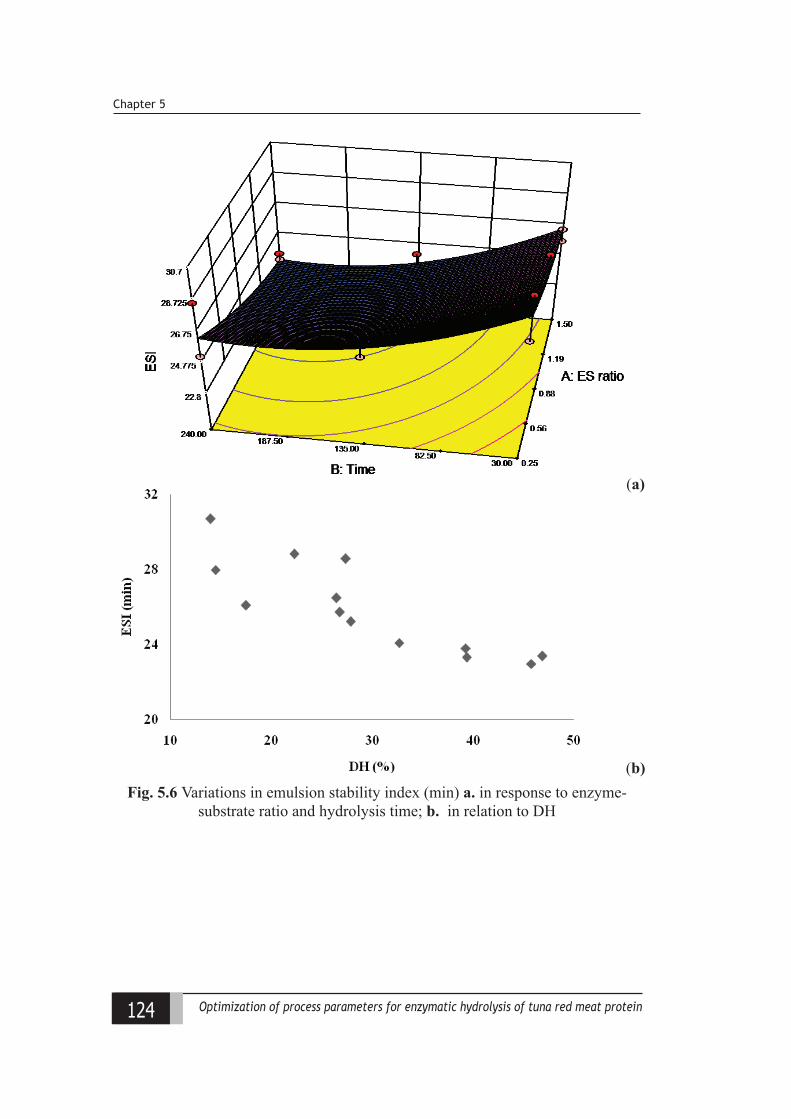
124 Optimization of process parameters for enzymatic hydrolysis of tuna red meat protein
Chapter 5
(a)
(b)Fig. 5.6 Variations in emulsion stability index (min) a. in response to enzyme-
substrate ratio and hydrolysis time; b. in relation to DH
125Optimization of process parameters for enzymatic hydrolysis of tuna red meat protein
Funational and antioxidant protein hydrolysates from yellowfn tuna raw red meatt ptimiiation ly RS
5.3.4.3 Oil absorption capacity
OAC is correlated with surface hydrophobicity which is facilitated by
exposure of more internal hydrophobic groups during hydrolysis of protein. Second
order regression model with a coefficient of determination of 0.73 (Fig. 5.7a) was
best fitted for explaining the variations in OAC of hydrolysates as a factor of E/S
and hydrolysis time using the equation:
OAC = 2.317 – 0.926X1 + 1.320E-003X2 + 7.457E-004X1X2 + 0.409X12* – 5.556E-
006 X22
Second order of X1 was the significant (p < 0.05) factor influencing this
response with an estimated regression coefficients of 0.41 whereas the effect of
linear terms of X1 and X2 were insignificant with respect to OAC variations. During
hydrolysis, OAC ranged from 1.78 – 2.29 g/g without any specific trend of increase
or decrease with the changes in factors viz., X1 or X2. Hydrolysates derived under
the same range of DH showed high variation in the response (Fig. 5.7b) of up to
0.15 g/g which confirms that this response was dependent on type of polypeptide
fragments formed. Similar findings were reported by Amiza et al. (2012) in cobia
frame hydrolysates with varying range of OAC between 2.4 – 2.8 ml/g without
being DH dependent.
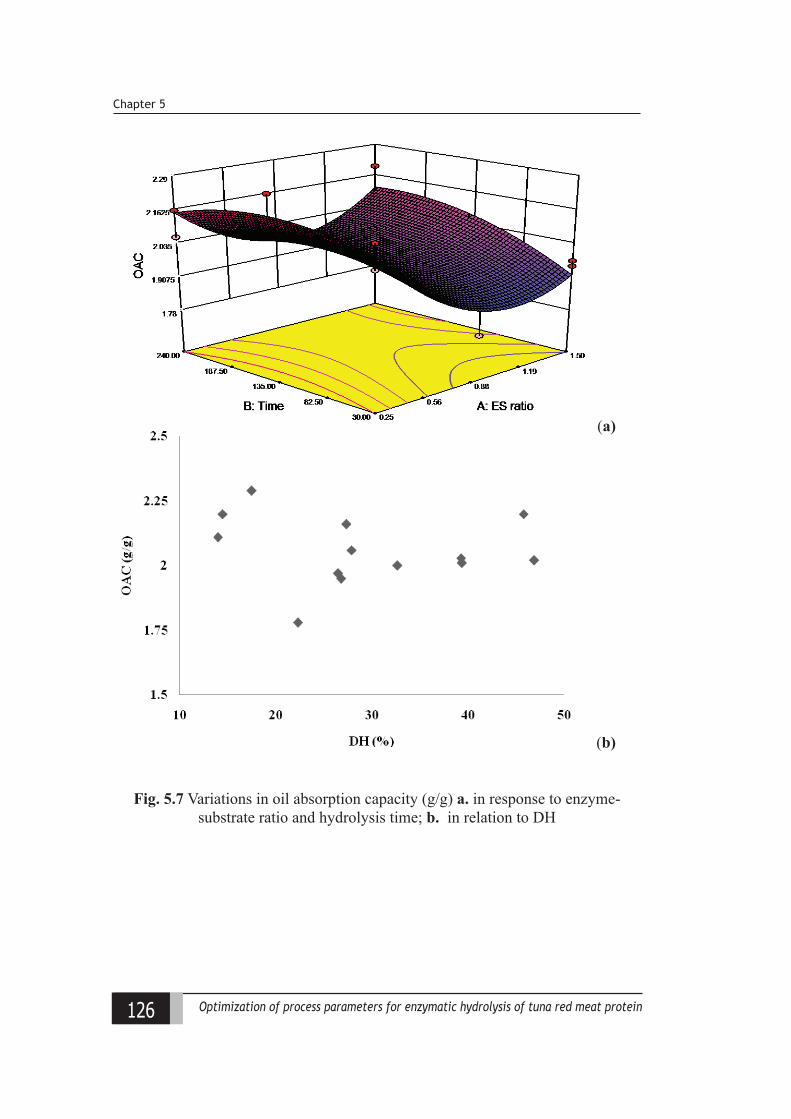
126 Optimization of process parameters for enzymatic hydrolysis of tuna red meat protein
Chapter 5
(a)
(b)
Fig. 5.7 Variations in oil absorption capacity (g/g) a. in response to enzyme-substrate ratio and hydrolysis time; b. in relation to DH
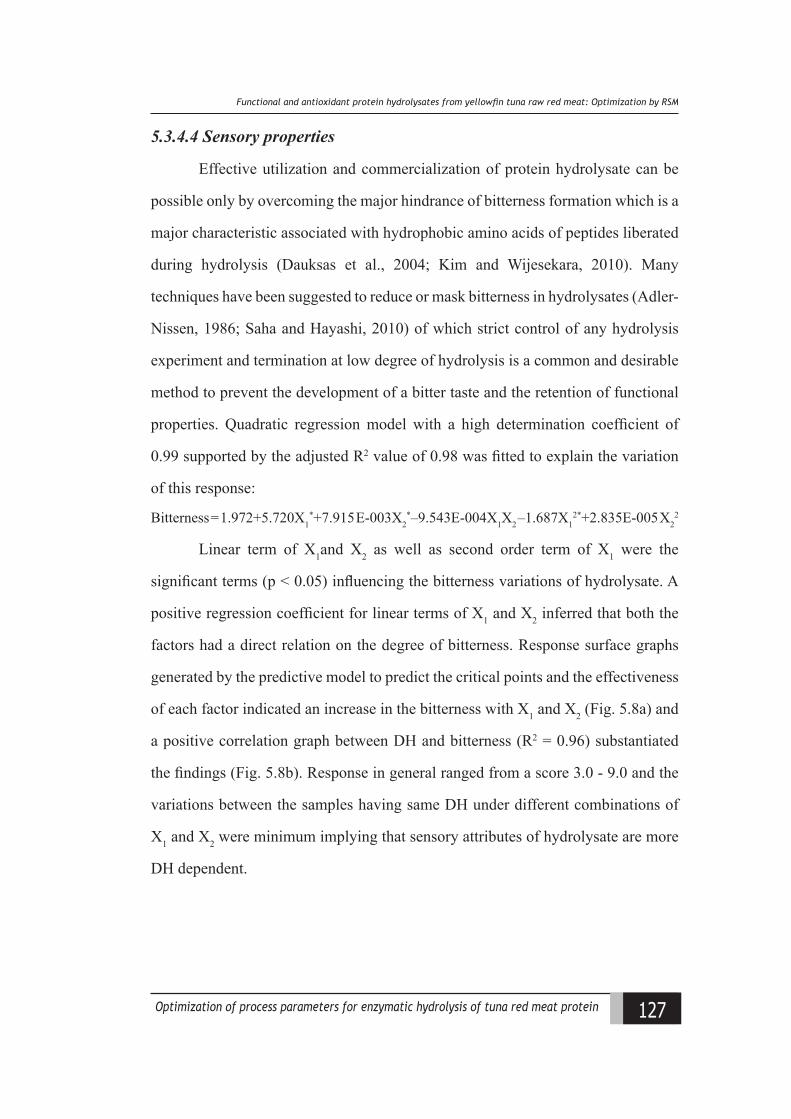
127Optimization of process parameters for enzymatic hydrolysis of tuna red meat protein
Funational and antioxidant protein hydrolysates from yellowfn tuna raw red meatt ptimiiation ly RS
5.3.4.4 Sensory properties
Effective utilization and commercialization of protein hydrolysate can be
possible only by overcoming the major hindrance of bitterness formation which is a
major characteristic associated with hydrophobic amino acids of peptides liberated
during hydrolysis (Dauksas et al., 2004; Kim and Wijesekara, 2010). Many
techniques have been suggested to reduce or mask bitterness in hydrolysates (Adler-
Nissen, 1986; Saha and Hayashi, 2010) of which strict control of any hydrolysis
experiment and termination at low degree of hydrolysis is a common and desirable
method to prevent the development of a bitter taste and the retention of functional
properties. Quadratic regression model with a high determination coefficient of
0.99 supported by the adjusted R2 value of 0.98 was fitted to explain the variation
of this response:
Bitterness = 1.972+5.720X1*+7.915 E-003X2
*–9.543E-004X1X2 –1.687X12*+2.835E-005 X2
2
Linear term of X1and X2 as well as second order term of X1 were the
significant terms (p < 0.05) influencing the bitterness variations of hydrolysate. A
positive regression coefficient for linear terms of X1 and X2 inferred that both the
factors had a direct relation on the degree of bitterness. Response surface graphs
generated by the predictive model to predict the critical points and the effectiveness
of each factor indicated an increase in the bitterness with X1 and X2 (Fig. 5.8a) and
a positive correlation graph between DH and bitterness (R2 = 0.96) substantiated
the findings (Fig. 5.8b). Response in general ranged from a score 3.0 - 9.0 and the
variations between the samples having same DH under different combinations of
X1 and X2 were minimum implying that sensory attributes of hydrolysate are more
DH dependent.
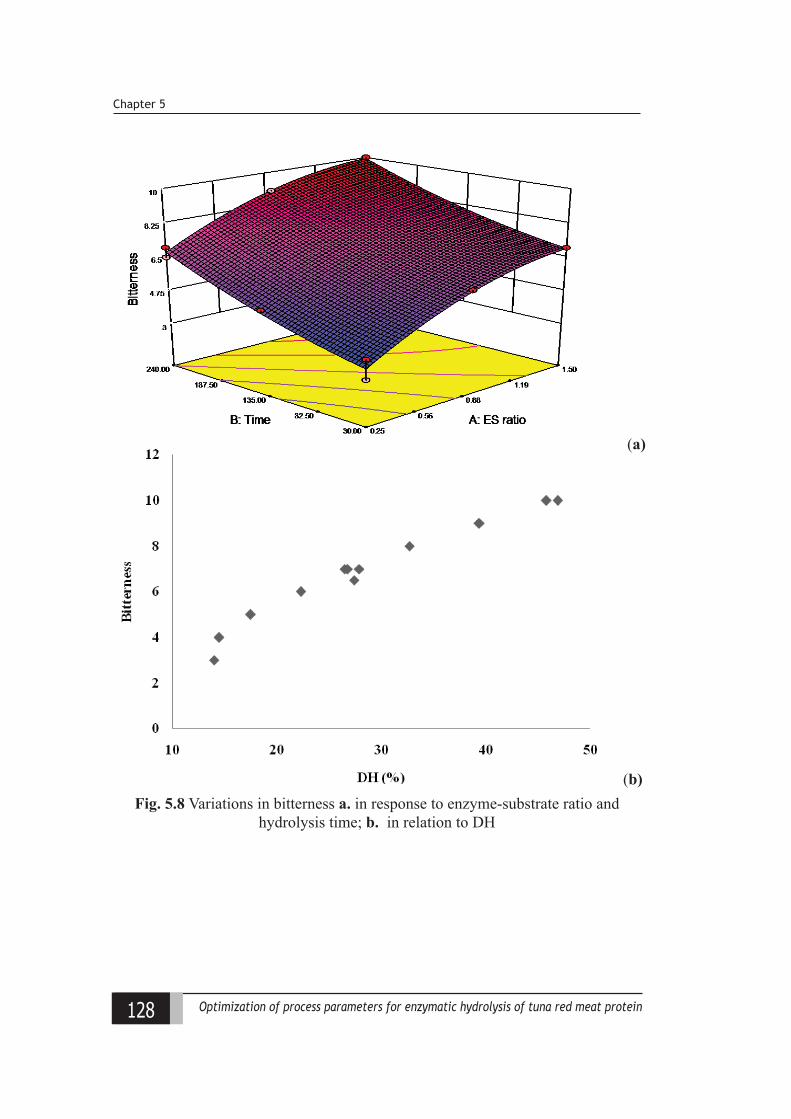
128 Optimization of process parameters for enzymatic hydrolysis of tuna red meat protein
Chapter 5
(a)
(b)Fig. 5.8 Variations in bitterness a. in response to enzyme-substrate ratio and
hydrolysis time; b. in relation to DH
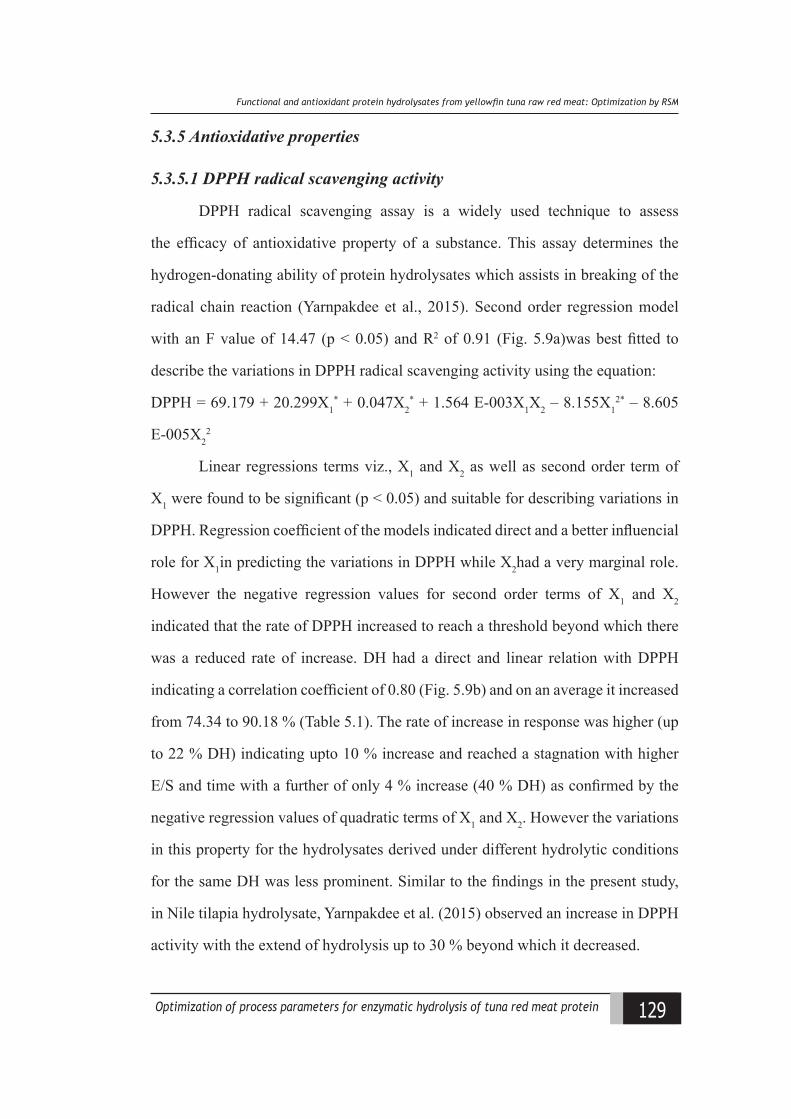
129Optimization of process parameters for enzymatic hydrolysis of tuna red meat protein
Funational and antioxidant protein hydrolysates from yellowfn tuna raw red meatt ptimiiation ly RS
5.3.5 Antioxidative properties
5.3.5.1 DPPH radical scavenging activity
DPPH radical scavenging assay is a widely used technique to assess
the efficacy of antioxidative property of a substance. This assay determines the
hydrogen-donating ability of protein hydrolysates which assists in breaking of the
radical chain reaction (Yarnpakdee et al., 2015). Second order regression model
with an F value of 14.47 (p < 0.05) and R2 of 0.91 (Fig. 5.9a)was best fitted to
describe the variations in DPPH radical scavenging activity using the equation:
DPPH = 69.179 + 20.299X1* + 0.047X2
* + 1.564 E-003X1X2 – 8.155X12* – 8.605
E-005X22
Linear regressions terms viz., X1 and X2 as well as second order term of
X1 were found to be significant (p < 0.05) and suitable for describing variations in
DPPH. Regression coefficient of the models indicated direct and a better influencial
role for X1in predicting the variations in DPPH while X2had a very marginal role.
However the negative regression values for second order terms of X1 and X2
indicated that the rate of DPPH increased to reach a threshold beyond which there
was a reduced rate of increase. DH had a direct and linear relation with DPPH
indicating a correlation coefficient of 0.80 (Fig. 5.9b) and on an average it increased
from 74.34 to 90.18 % (Table 5.1). The rate of increase in response was higher (up
to 22 % DH) indicating upto 10 % increase and reached a stagnation with higher
E/S and time with a further of only 4 % increase (40 % DH) as confirmed by the
negative regression values of quadratic terms of X1 and X2. However the variations
in this property for the hydrolysates derived under different hydrolytic conditions
for the same DH was less prominent. Similar to the findings in the present study,
in Nile tilapia hydrolysate, Yarnpakdee et al. (2015) observed an increase in DPPH
activity with the extend of hydrolysis up to 30 % beyond which it decreased.
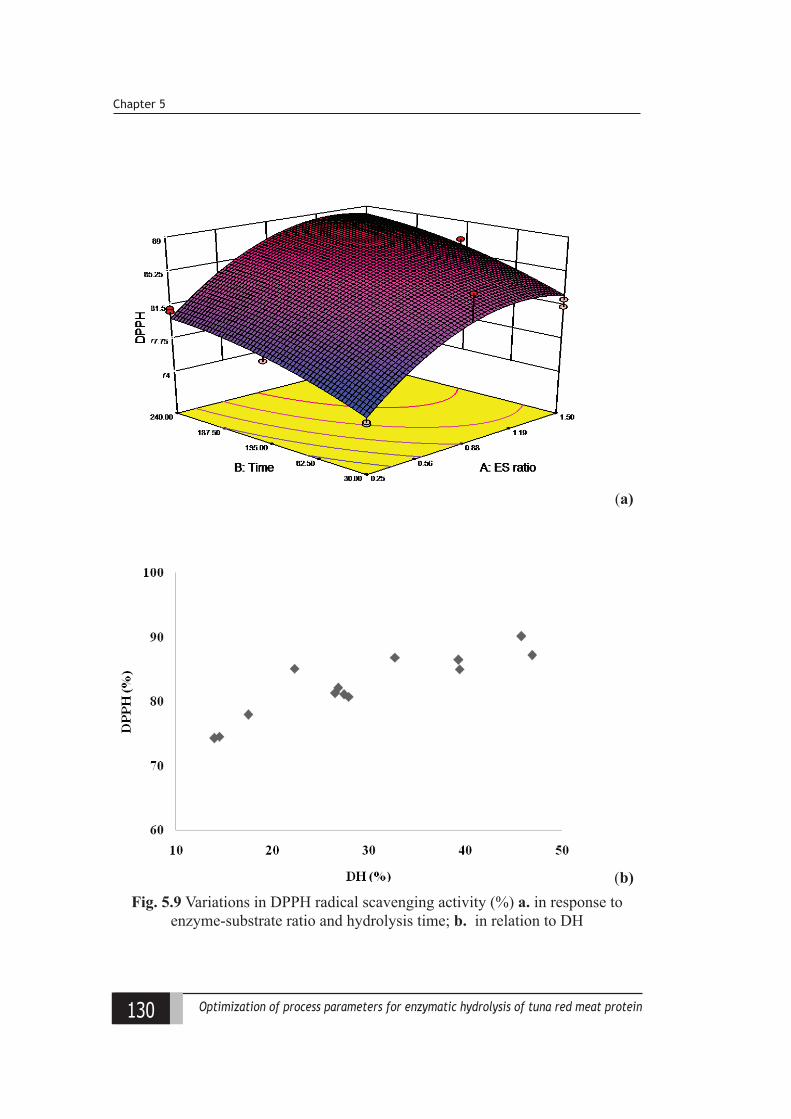
130 Optimization of process parameters for enzymatic hydrolysis of tuna red meat protein
Chapter 5
(a)
(b)Fig. 5.9 Variations in DPPH radical scavenging activity (%) a. in response to
enzyme-substrate ratio and hydrolysis time; b. in relation to DH
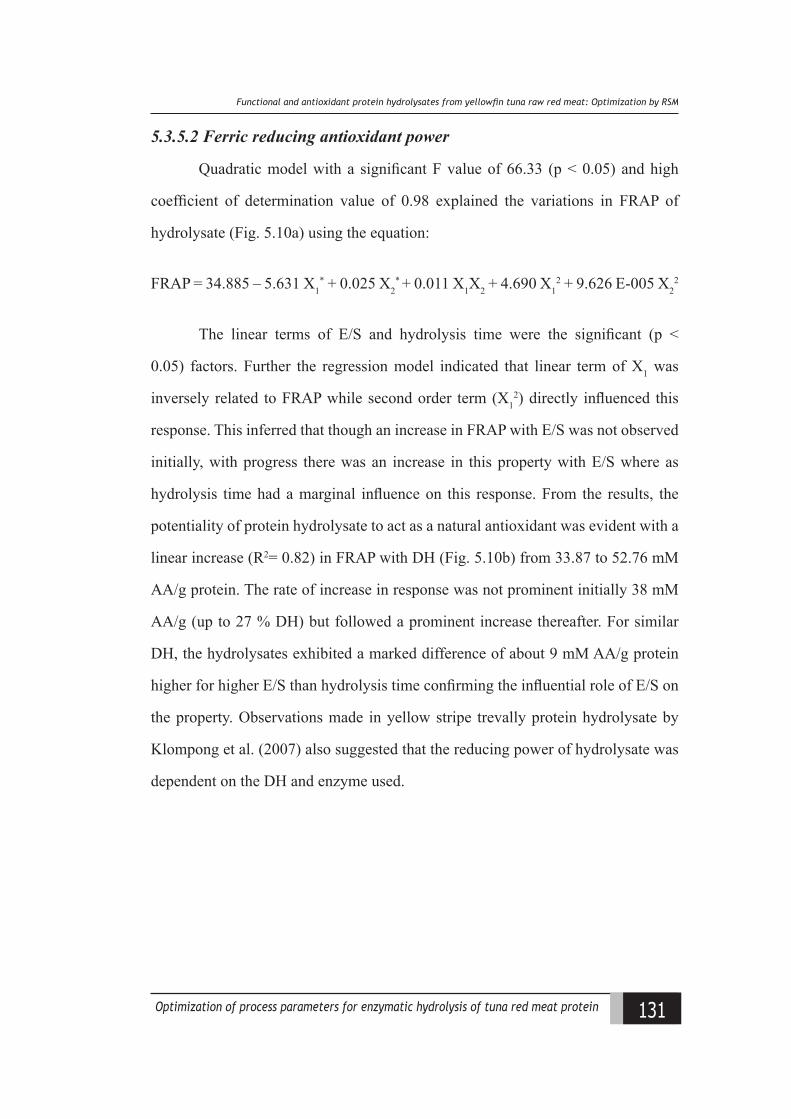
131Optimization of process parameters for enzymatic hydrolysis of tuna red meat protein
Funational and antioxidant protein hydrolysates from yellowfn tuna raw red meatt ptimiiation ly RS
5.3.5.2 Ferric reducing antioxidant power
Quadratic model with a significant F value of 66.33 (p < 0.05) and high
coefficient of determination value of 0.98 explained the variations in FRAP of
hydrolysate (Fig. 5.10a) using the equation:
FRAP = 34.885 – 5.631 X1* + 0.025 X2
* + 0.011 X1X2 + 4.690 X12 + 9.626 E-005 X2
2
The linear terms of E/S and hydrolysis time were the significant (p <
0.05) factors. Further the regression model indicated that linear term of X1 was
inversely related to FRAP while second order term (X12) directly influenced this
response. This inferred that though an increase in FRAP with E/S was not observed
initially, with progress there was an increase in this property with E/S where as
hydrolysis time had a marginal influence on this response. From the results, the
potentiality of protein hydrolysate to act as a natural antioxidant was evident with a
linear increase (R2= 0.82) in FRAP with DH (Fig. 5.10b) from 33.87 to 52.76 mM
AA/g protein. The rate of increase in response was not prominent initially 38 mM
AA/g (up to 27 % DH) but followed a prominent increase thereafter. For similar
DH, the hydrolysates exhibited a marked difference of about 9 mM AA/g protein
higher for higher E/S than hydrolysis time confirming the influential role of E/S on
the property. Observations made in yellow stripe trevally protein hydrolysate by
Klompong et al. (2007) also suggested that the reducing power of hydrolysate was
dependent on the DH and enzyme used.
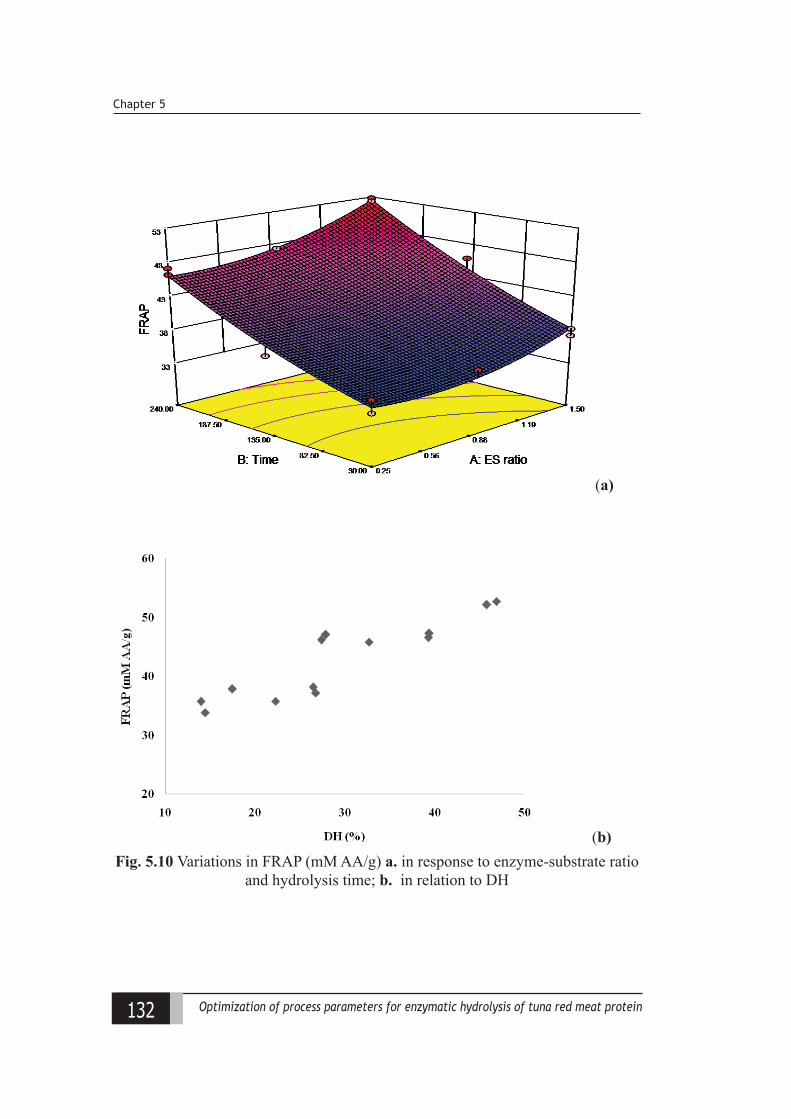
132 Optimization of process parameters for enzymatic hydrolysis of tuna red meat protein
Chapter 5
(a)
(b)Fig. 5.10 Variations in FRAP (mM AA/g) a. in response to enzyme-substrate ratio
and hydrolysis time; b. in relation to DH
133Optimization of process parameters for enzymatic hydrolysis of tuna red meat protein
Funational and antioxidant protein hydrolysates from yellowfn tuna raw red meatt ptimiiation ly RS
5.3.5.3 Reducing power
Protein hydrolysates donate electrons to scavenge the free radicals that
promote oxidation. Quadratic model with a significant F value (p < 0.05) of 14.71
and R2of 0.91 was best fitted (Fig. 5.11a) to explain the variations in reducing power
using the equation:
RP = 0.227+0.075X1*+3.982 E-004 X2
*–1.129 E-004 X1X2–0.018 X12–4.195 E-007
X22
Linear order of X1 and X2 had direct, marginal but significant (p < 0.05) role
in the explaining the variations of RP. In the present study, the reducing power was
comparatively lower for large molecular weight peptides and it ranged from 0.250 –
0.332, showing a linear and direct relation (R2 = 0.76) with the degree of hydrolysis
(Fig. 5.11b). The rate of increase was rapid initially from 14-27 % DH reaching
0.315 followed by a stagnation. Similar to FRAP, in RP also for hydrolysates
with similar DH under different hydrolytic conditions, a variation of upto 0.017
units were observed with higher property when E/S was higher in comparison to
hydrolysis time. Hence the results indicate that reducing properties of hydrolysates
are influenced by the nature of peptide fragments formed during hydrolysis and
that it varied with the hydrolysis conditions, for similar DH. Sarmadi and Ismail
(2010) proposed that antioxidative properties of hydrolysate are affected by peptide
structure and its amino acid sequence.
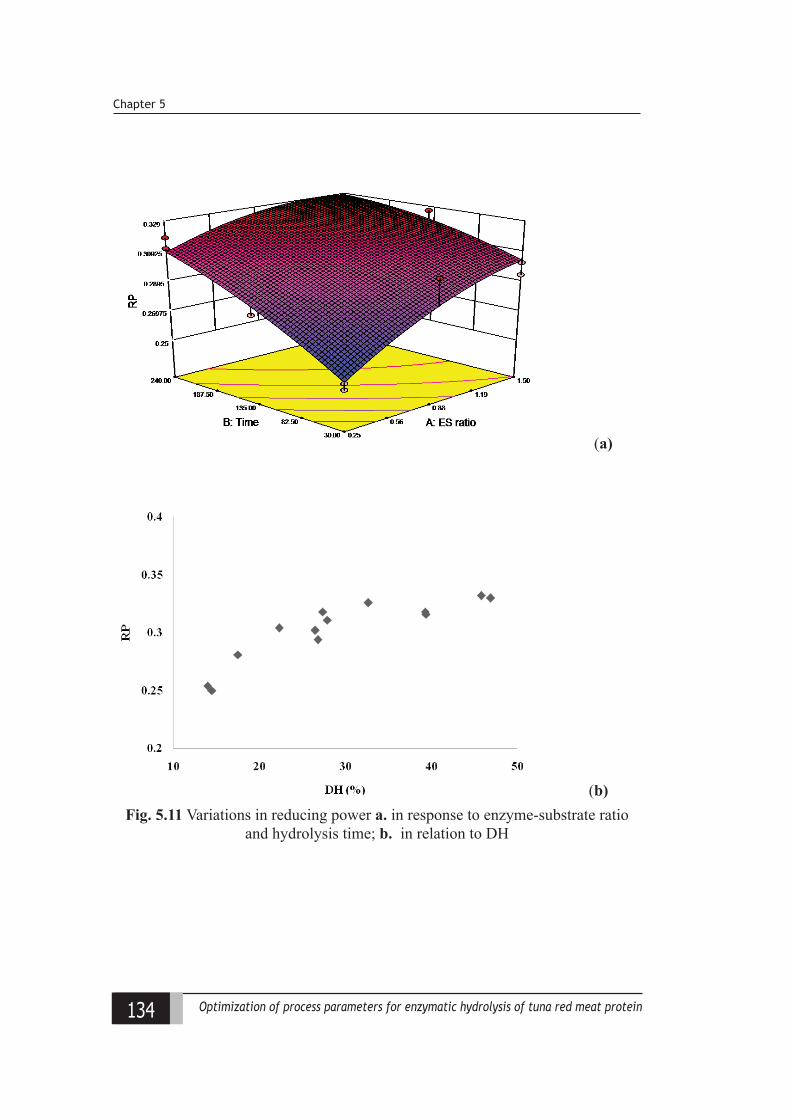
134 Optimization of process parameters for enzymatic hydrolysis of tuna red meat protein
Chapter 5
(a)
(b)Fig. 5.11 Variations in reducing power a. in response to enzyme-substrate ratio
and hydrolysis time; b. in relation to DH
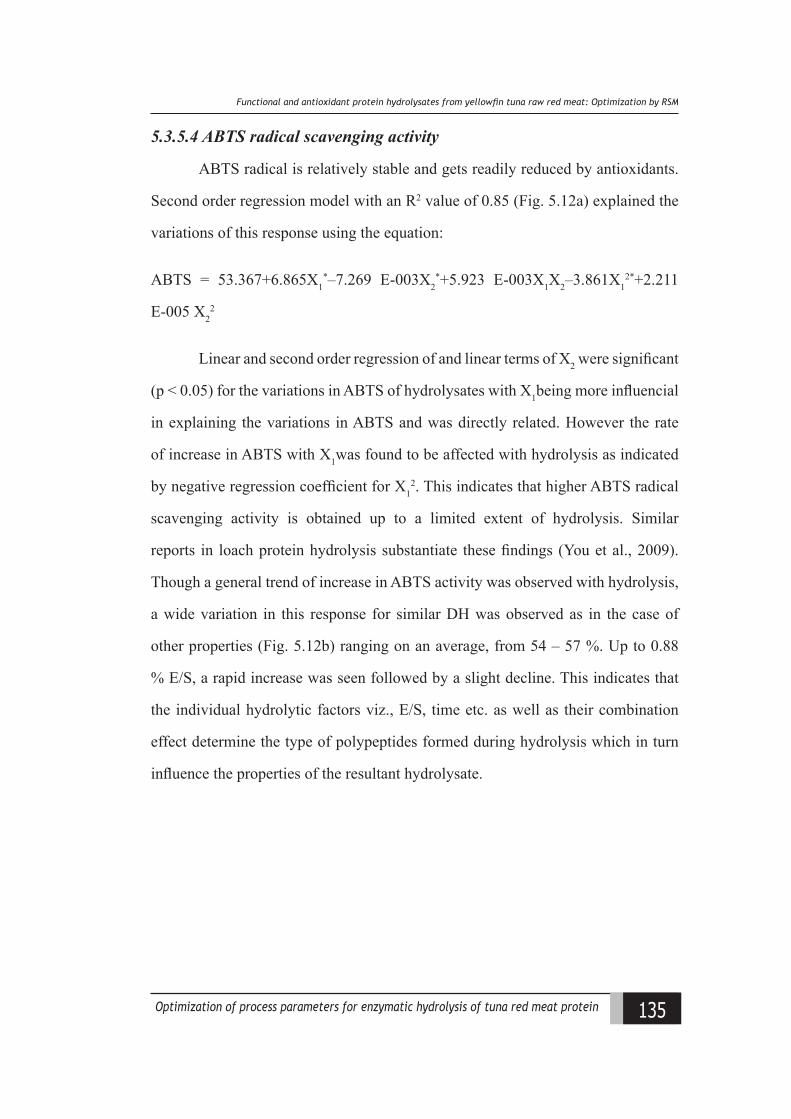
135Optimization of process parameters for enzymatic hydrolysis of tuna red meat protein
Funational and antioxidant protein hydrolysates from yellowfn tuna raw red meatt ptimiiation ly RS
5.3.5.4 ABTS radical scavenging activity
ABTS radical is relatively stable and gets readily reduced by antioxidants.
Second order regression model with an R2 value of 0.85 (Fig. 5.12a) explained the
variations of this response using the equation:
ABTS = 53.367+6.865X1*–7.269 E-003X2
*+5.923 E-003X1X2–3.861X12*+2.211
E-005 X22
Linear and second order regression of and linear terms of X2 were significant
(p < 0.05) for the variations in ABTS of hydrolysates with X1being more influencial
in explaining the variations in ABTS and was directly related. However the rate
of increase in ABTS with X1was found to be affected with hydrolysis as indicated
by negative regression coefficient for X12. This indicates that higher ABTS radical
scavenging activity is obtained up to a limited extent of hydrolysis. Similar
reports in loach protein hydrolysis substantiate these findings (You et al., 2009).
Though a general trend of increase in ABTS activity was observed with hydrolysis,
a wide variation in this response for similar DH was observed as in the case of
other properties (Fig. 5.12b) ranging on an average, from 54 – 57 %. Up to 0.88
% E/S, a rapid increase was seen followed by a slight decline. This indicates that
the individual hydrolytic factors viz., E/S, time etc. as well as their combination
effect determine the type of polypeptides formed during hydrolysis which in turn
influence the properties of the resultant hydrolysate.
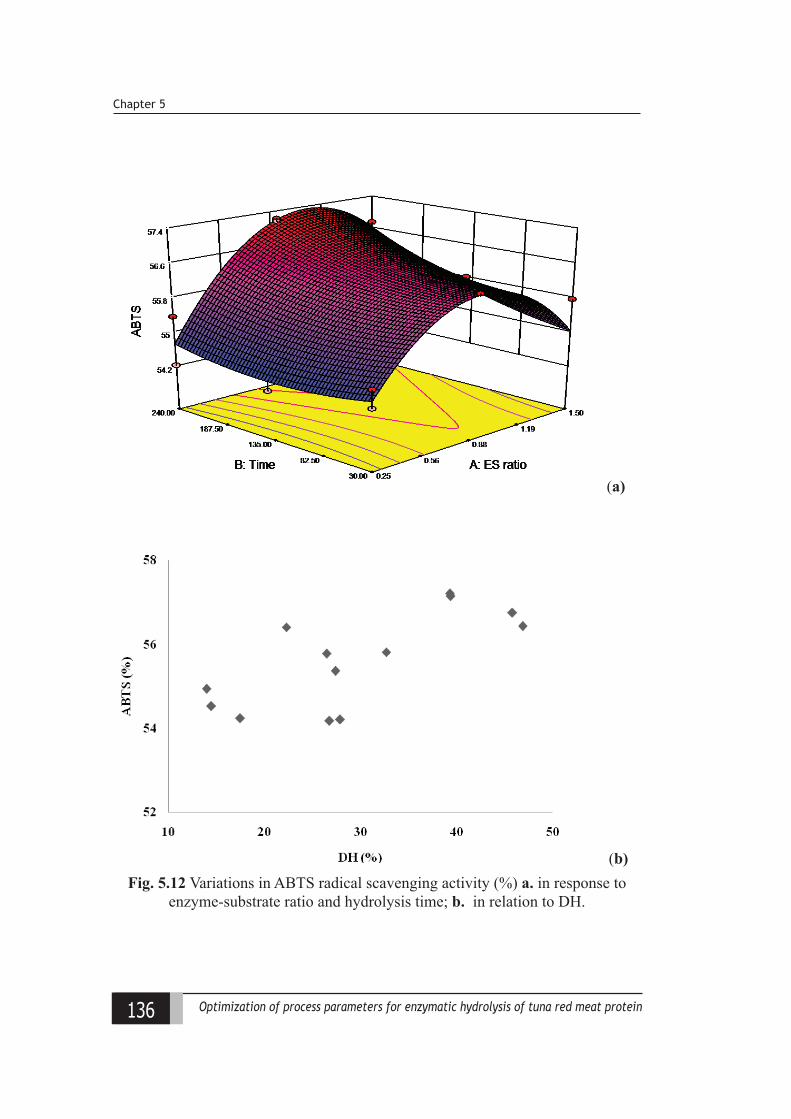
136 Optimization of process parameters for enzymatic hydrolysis of tuna red meat protein
Chapter 5
(a)
(b)Fig. 5.12 Variations in ABTS radical scavenging activity (%) a. in response to
enzyme-substrate ratio and hydrolysis time; b. in relation to DH.
137Optimization of process parameters for enzymatic hydrolysis of tuna red meat protein
Funational and antioxidant protein hydrolysates from yellowfn tuna raw red meatt ptimiiation ly RS
The hydrolytic condition was optimised to derive protein hydrolysates
with superior functional and antioxidative property, separately giving emphasis to
the protein recovery (Table 5.1). Optimized hydrolytic conditions for functional
properties was obtained with an enzyme-substrate ratio (E/S) of 0.41% and 30 min
hydrolysis time at 60oC and pH of 6.5 with a desirability of 0.611. Similarly, the
optimum conditions to exhibit the highest antioxidative properties with a desirability
of 0.932 were: 1.28 % E/S and 240 minutes hydrolysis time. This combination
was used to derive the desired tuna red meat protein hydrolysates. Further all
the response variables of the final product were validated. The experimental and
predicted values were within the range and did not differ statistically (p < 0.05),
thus confirming the reliability of the optimised condition. As suggested by Binsi
et al. (2016), sequential hydrolysis can be explored as a feasible option to derive
functional and antioxidative peptides from a single hydrolysis process.
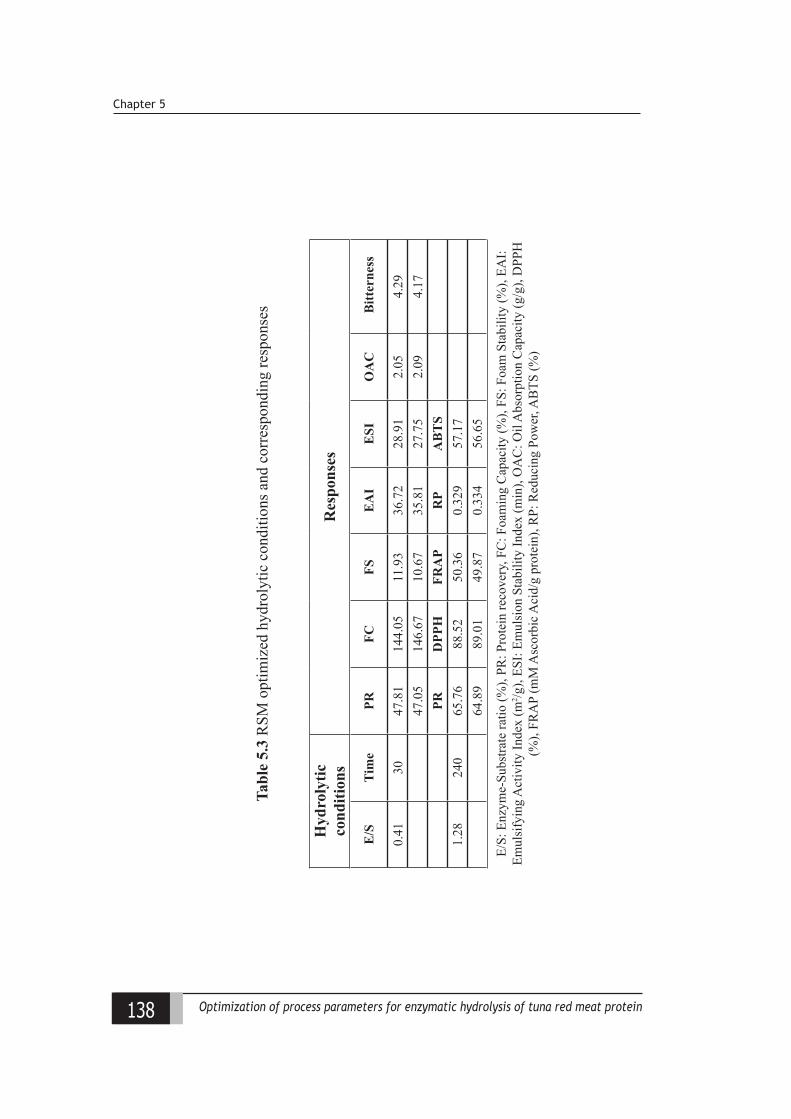
138 Optimization of process parameters for enzymatic hydrolysis of tuna red meat protein
Chapter 5
Tabl
e 5.
3 R
SM o
ptim
ized
hyd
roly
tic c
ondi
tions
and
cor
resp
ondi
ng re
spon
ses
Hyd
roly
tic
cond
ition
sR
espo
nses
E/S
Tim
ePR
FCFS
EA
IE
SIO
AC
Bitt
erne
ss
0.41
3047
.81
144.
0511
.93
36.7
228
.91
2.05
4.29
47.0
514
6.67
10.6
735
.81
27.7
52.
094.
17PR
DPP
HFR
AP
RP
AB
TS
1.28
240
65.7
688
.52
50.3
60.
329
57.1
764
.89
89.0
149
.87
0.33
456
.65
E/S:
Enz
yme-
Subs
trate
ratio
(%),
PR: P
rote
in re
cove
ry, F
C: F
oam
ing
Cap
acity
(%),
FS: F
oam
Sta
bilit
y (%
), EA
I: Em
ulsi
fyin
g A
ctiv
ity In
dex
(m2 /g
), ES
I: Em
ulsi
on S
tabi
lity
Inde
x (m
in),
OA
C: O
il A
bsor
ptio
n C
apac
ity (g
/g),
DPP
H
(%),
FRA
P (m
M A
scor
bic A
cid/
g pr
otei
n), R
P: R
educ
ing
Pow
er, A
BTS
(%)
139Optimization of process parameters for enzymatic hydrolysis of tuna red meat protein
Funational and antioxidant protein hydrolysates from yellowfn tuna raw red meatt ptimiiation ly RS
5.4 Conclusion
Valorization of tuna red meat, a protein rich by product from tuna processing
industry, to the form of protein hydrolysate by optimization of the process conditions
viz., E/S and time, based on protein recovery, functional and antioxidative activities
were attempted. Hydrolytic conditions for optimized functional and antioxidant
properties were separately derived based on RSM for further food and nutraceutical
applications. Determinants of coefficients of the fitted models explaining the
variations in the responses ranged from 0.73-0.99, indicating the fitness of the models.
Based on the observations in the present study, it may be concluded that enzyme-
substrate ratio (X1) is more influential in explaining the differences in the properties
of hydrolysates than hydrolysis time during the hydrolysis of yellowfin tuna red
meat using the enzyme papain. Comparative studies done on cooked and raw tuna
red meat indicated protein recovery during hydrolysis to be higher from raw tuna
red meat in comparison to cooked meat. Hydrolysate from cooked tuna red meat
exhibited superior functional properties except OAC, whereas except ABTS radical
scavenging activity, hydrolysates from raw tuna red meat exhibited superiority
with regard to antioxidative activities. The present study widens the possibility for
further exploration of tuna red meat hydrolysates for commercialization purpose.

140 Optimization of process parameters for enzymatic hydrolysis of tuna red meat protein
Chapter 3
141Optimization of process parameters for enzymatic hydrolysis of tuna red meat protein
Charaateriiation and storage stalility of the optimiied funational and antioxidant tuna protein hydrolysates
Chapter 6Characterization and
storage stability of the optimized functional and antioxidant tuna
protein hydrolysates
6.1 Introduction
Tuna represents an important element of the global fish and seafood
economy with an annual value of 42.2 billion US dollar (Galland et al., 2016). The
demand for thermally processed commodities has boosted the importance of tuna
species in seafood industry. However as mentioned earlier, the enormous quantities
of throw-outs generated during its processing has urged in the effective recovery
and its intelligent utilization and in this respect deriving bioactive hydrolysates is a
promisive option.
In the present study, attempts were made to characterize the optimized
functional hydrolysate and antioxidant hydrolysate from yellowfin tuna cannery
waste (chapter 4) with respect to the nutritional, structural, morphological, thermal
as well as physico-chemical aspects. Although the specific health benefits from
different hydrolysates are mostly supportable scientifically, the consistency of
these benefits is debatable on account of the quality changes during storage. Hence
considering this aspect, the optimized hydrolysates were subjected to storage
stability studies under chilled as well as ambient conditions. Further, based on the
142 Optimization of process parameters for enzymatic hydrolysis of tuna red meat protein
Chapter 6
laboratory-scale evaluations, attempts were made to model large scale production
of the optimized tuna protein hydrolysates and economic feasibility analysis was
worked out.
6.2 Materials and methods
6.2.1 Raw materials and chemicals
Spray dried hydrolysates derived from tuna red meat using papain enzyme
according to an RSM based protocol (previously discussed in chapter 4) for optimum
functional and antioxidative properties were used for the study. The optimized
hydrolytic conditions for deriving functional hydrolysate (FTPH) were viz., enzyme:
substrate (E/S) ratio of 0.34 %, hydrolysis time of 30 min, temperature of 60oC
and pH of 6.5. For antioxidant hydrolysate (ATPH), the hydrolytic conditions were
enzyme: substrate (E/S) ratio of 0.98 %, hydrolysis time of 240 min, temperature of
60oC and pH of 6.5. All the chemicals used for the study were of analytical grade.
6.2.2 Characterization studies
6.2.2.1 Degree of hydrolysis and proteolytic activity
Degree of hydrolysis was estimated as per the methodology described by
Hoyle and Merritt (1994) (described in chapter 4, section 4.2.5). Proteolytic activity
of the sample was projected from the tyrosine content of the protein hydrolysate
which measured the extent of hydrolysis under given conditions (Gajanan, 2014)
(described in chapter 3, section 3.2.5).
6.2.2.2 Protein recovery and yield
Protein recovery and yield in hydrolysate was evaluated (described in
chapter 3, section 3.2.3 and 3.2.4).
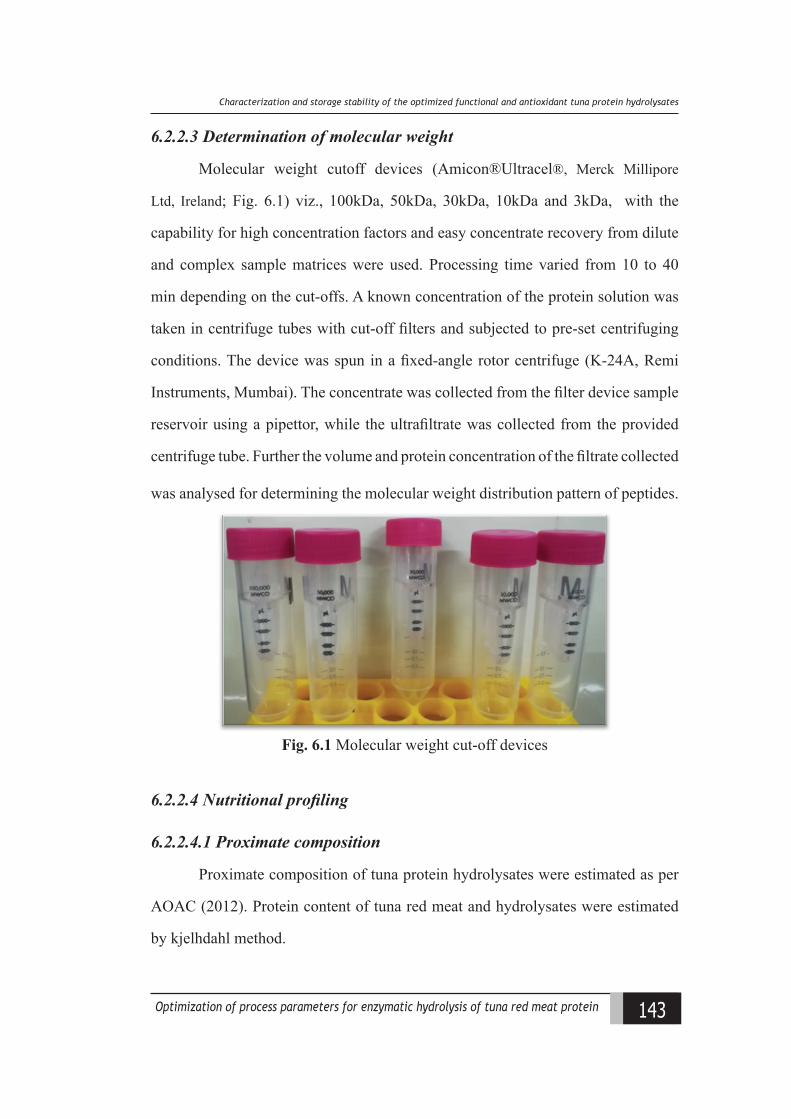
143Optimization of process parameters for enzymatic hydrolysis of tuna red meat protein
Charaateriiation and storage stalility of the optimiied funational and antioxidant tuna protein hydrolysates
6.2.2.3 Determination of molecular weight
Molecular weight cutoff devices (Amicon®Ultracel®, Merck Millipore
Ltd, Ireland; Fig. 6.1) viz., 100kDa, 50kDa, 30kDa, 10kDa and 3kDa, with the
capability for high concentration factors and easy concentrate recovery from dilute
and complex sample matrices were used. Processing time varied from 10 to 40
min depending on the cut-offs. A known concentration of the protein solution was
taken in centrifuge tubes with cut-off filters and subjected to pre-set centrifuging
conditions. The device was spun in a fixed-angle rotor centrifuge (K-24A, Remi
Instruments, Mumbai). The concentrate was collected from the filter device sample
reservoir using a pipettor, while the ultrafiltrate was collected from the provided
centrifuge tube. Further the volume and protein concentration of the filtrate collected
was analysed for determining the molecular weight distribution pattern of peptides.
Fig. 6.1 Molecular weight cut-off devices
6.2.2.4 Nutritional profiling
6.2.2.4.1 Proximate composition
Proximate composition of tuna protein hydrolysates were estimated as per
AOAC (2012). Protein content of tuna red meat and hydrolysates were estimated
by kjelhdahl method.
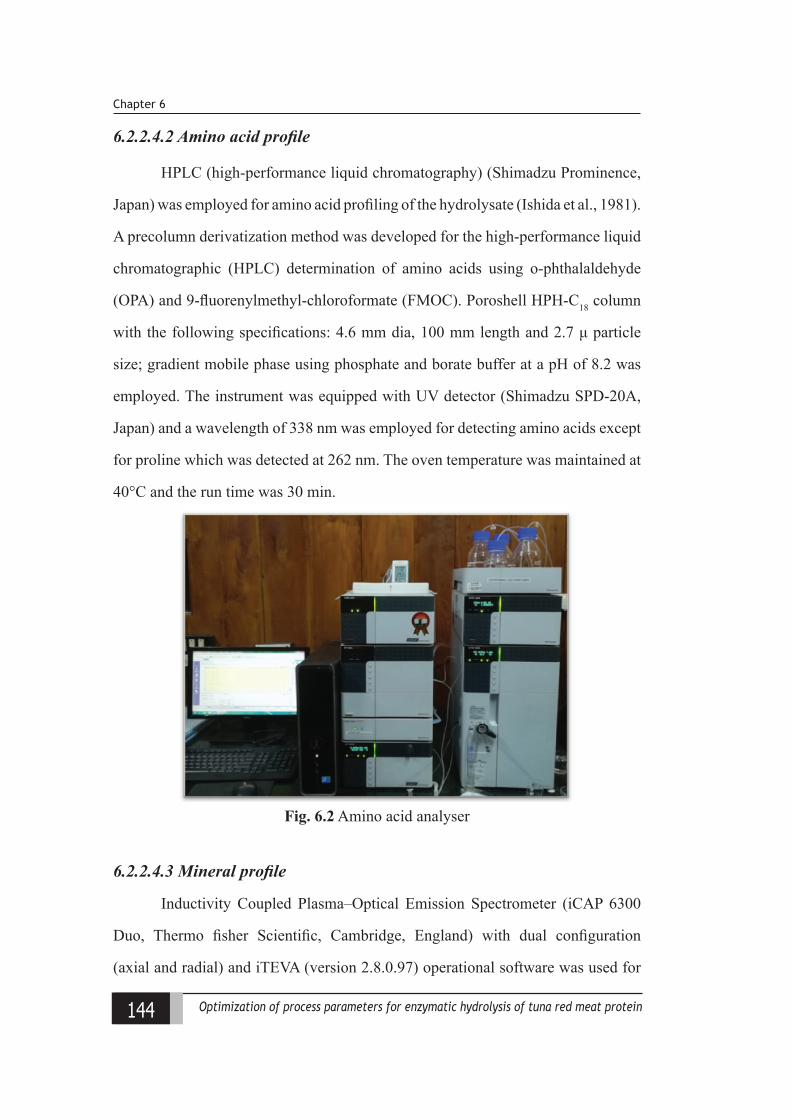
144 Optimization of process parameters for enzymatic hydrolysis of tuna red meat protein
Chapter 6
6.2.2.4.2 Amino acid profile
HPLC (high-performance liquid chromatography) (Shimadzu Prominence,
Japan) was employed for amino acid profiling of the hydrolysate (Ishida et al., 1981).
A precolumn derivatization method was developed for the high-performance liquid
chromatographic (HPLC) determination of amino acids using o-phthalaldehyde
(OPA) and 9-fluorenylmethyl-chloroformate (FMOC). Poroshell HPH-C18 column
with the following specifications: 4.6 mm dia, 100 mm length and 2.7 μ particle
size; gradient mobile phase using phosphate and borate buffer at a pH of 8.2 was
employed. The instrument was equipped with UV detector (Shimadzu SPD-20A,
Japan) and a wavelength of 338 nm was employed for detecting amino acids except
for proline which was detected at 262 nm. The oven temperature was maintained at
40°C and the run time was 30 min.
Fig. 6.2 Amino acid analyser
6.2.2.4.3 Mineral profile
Inductivity Coupled Plasma–Optical Emission Spectrometer (iCAP 6300
Duo, Thermo fisher Scientific, Cambridge, England) with dual configuration
(axial and radial) and iTEVA (version 2.8.0.97) operational software was used for
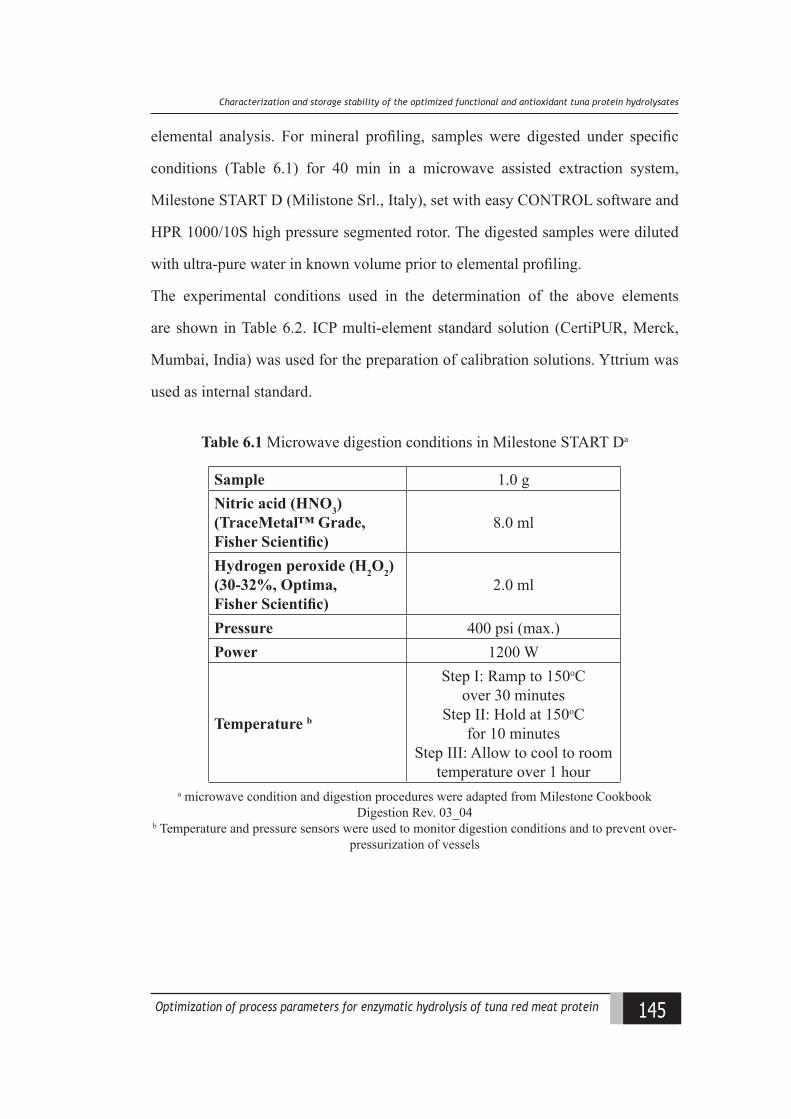
145Optimization of process parameters for enzymatic hydrolysis of tuna red meat protein
Charaateriiation and storage stalility of the optimiied funational and antioxidant tuna protein hydrolysates
elemental analysis. For mineral profiling, samples were digested under specific
conditions (Table 6.1) for 40 min in a microwave assisted extraction system,
Milestone START D (Milistone Srl., Italy), set with easy CONTROL software and
HPR 1000/10S high pressure segmented rotor. The digested samples were diluted
with ultra-pure water in known volume prior to elemental profiling.
The experimental conditions used in the determination of the above elements
are shown in Table 6.2. ICP multi-element standard solution (CertiPUR, Merck,
Mumbai, India) was used for the preparation of calibration solutions. Yttrium was
used as internal standard.
Table 6.1 Microwave digestion conditions in Milestone START Da
Sample 1.0 gNitric acid (HNO3)(TraceMetal™ Grade,Fisher Scientific)
8.0 ml
Hydrogen peroxide (H2O2)(30-32%, Optima,Fisher Scientific)
2.0 ml
Pressure 400 psi (max.)Power 1200 W
Temperature b
Step I: Ramp to 150oCover 30 minutes
Step II: Hold at 150oCfor 10 minutes
Step III: Allow to cool to roomtemperature over 1 hour
a microwave condition and digestion procedures were adapted from Milestone Cookbook Digestion Rev. 03_04
b Temperature and pressure sensors were used to monitor digestion conditions and to prevent over-pressurization of vessels
146 Optimization of process parameters for enzymatic hydrolysis of tuna red meat protein
Chapter 6
Table 6.2 Experimental conditions for elemental analysis using ICP-OES
Optics temperature 38°C
Camera temperature -44°C
Nebulizer MiraMist, Cyclonic Chamber
Main Argon flow rate 15 L min-1
Auxiliary Argon flow rate 0.5 L min-1
Nebulizer gas flow 0.5 L min-1
Maximum integration time 30 sec
Fig. 6.3 Inductivity Coupled Plasma–Optical Emission Spectrometer
6.2.2.5 Morphological and thermal characteristics
6.2.2.5.1 Scanning electron microscopy
Surface morphology of hydrolysate sample was determined in SEM (Philips
XL 30, The Netherlands). Samples fixed onto double-sided adhesive carbon tabs
mounted on SEM stubs were further coated with gold in vacuum using sputter
coater, and examined at 10 kV under a magnification of 650 x.
147Optimization of process parameters for enzymatic hydrolysis of tuna red meat protein
Charaateriiation and storage stalility of the optimiied funational and antioxidant tuna protein hydrolysates
6.2.2.5.2 Differential scanning colorimetry
Thermal characteristics of the sample were determined by employing
differential scanning calorimeter. Samples (about 3-5 mg, dry basis) were weighed
and placed on DSC aluminum pans and equilibrated over saturated salt solutions
in desiccators at 25°C. The samples were then hermetically sealed with lids for
analysis and weighed. The DSC analysis was performed in a TA-MDSC-2920(Ta
Instruments, New Castle, De, USA) in an inert atmosphere (45 ml/min of N2).
Instrument calibration was carried out with Indium (T melting = 156.6°C). Thermo-
analytical curves were obtained by heating/cooling the samples at a constant rate of
10°C/min and a temperature ramp of 20°C to 170°C under nitrogen atmospheric
condition. From the DSC thermogram, the temperature at onset (To), peak (Tp), the
end (Tf), and the enthalpy (DH) were determined.
6.2.2.5.3 Fourier-transform infrared spectroscopic analysis
FTIR spectrometer (Shimadzu IR-Prestige-21) by KBr method using diffuse
reflectance assembly was adopted to determine the spectra of the sample in the
wavelength range of 4500 to 400 cm-1. A known quantity of sample mixed with
potassium bromide (1:100 (w/w)) was analysed for the reflectance spectra with
recordings of upto 64 scans under a resolution of 4 cm-1. By using Kubelka-Munk
algorithm, the reflectance spectra were further transformed to transmission spectra.
6.2.2.6 Physico-chemical characteristics
6.2.2.6.1 Hygroscopicity
Sample hygroscopicity was adopted from the methodology of Cai and
Corke (2000) with slight modifications. A known quantity of the sample was kept
in desiccators containing saturated solution of NaCl (relative humidity of 75.3 %)
148 Optimization of process parameters for enzymatic hydrolysis of tuna red meat protein
Chapter 6
at 25 oC for a period of one week. Sample was re-weighed after the observation
period and hygroscopicity was measured as percentage of the amount of moisture
absorbed to that of the initial dry sample.
6.2.2.6.2 Bulk density and tapped density
Flow properties exhibited by the samples were determined by measuring
the bulk density (ρB) and tapped densities (ρT) (Chinta et al., 2009). For this, a
known quantity of sample powder was loosely filled into a graduated cylinder using
a funnel by slight tapping so as to assemble the powder sticking to the wall of the
cylinder. Bulk density of the sample was measured from weight of the sample to
the volume it occupied. Similarly, protein hydrolysate powder was filled into the
cylinder with tapping until it reached a constant volume to measure the tapped
density.
Hausner ratio and Carr Index, suggestive of the flow properties were determined
from the bulk and tapped densities as:
Hausner ratio = ρT/ ρB
Carr index = 100 (1 – ρB/ ρT)
6.2.2.6.3 Colour and browning intensity
Colour of the samples were measured using Hunter- Lab scan XE –
Spectrocolorimeter (Color Flex, Hunter Associates Laboratory, Reston, USA.) at
D-65 illuminant and 10° observer. Pre-determined quantity of samples were filled
in a 64 mm glass sample cup and results were expressed in terms of L*(lightness),
a*(+redness/-greenness), b*(+yellowness/-blueness). The instrument was calibrated
using white and black standard ceramic tiles and the readings were recorded in the
inbuilt software.
149Optimization of process parameters for enzymatic hydrolysis of tuna red meat protein
Charaateriiation and storage stalility of the optimiied funational and antioxidant tuna protein hydrolysates
Absorbance of known concentration of filtered samples (80 mg ml-1) were
measured at 420 nm in spectrophotometer (Lambda 25 UV/Vis, Perkin Elmer Life
and Analytical Sciences, Singapore) and expressed as browning intensity.
6.2.2.7 Functional and bioactive characteristics
6.2.2.7.1 Foaming properties
Foaming capacity and stability of fish protein hydrolysate were determined
according to the modified method of Sathe and Salunkhe (1981). Protein solution
(1.0 %) was prepared and the pH was adjusted to 2, 4, 6, 8 and 10. This protein
solution was whipped for 2 min at a speed of 16,000 rpm using a homogenizer (230
VAC T-25 digital Ultra-turrax, IKA, India) and poured into a 100 ml graduated
cylinder. The total sample volume was taken immediately for foam capacity. The
foaming capacity was calculated according to the following equation:
FC % = V2 – V1 x 100 V1
where V2 is the volume after whipping (ml) and V1 is the volume before whipping
(ml). The whipped sample was allowed to stand at room temperature for 3 min and
the volume of whipped sample was then recorded. Foam stability was calculated as
follows:
FS % = V2 – V1 x 100
V1
where V2 is the volume after standing (ml) and V1 is the volume before whipping
(ml). Similarly the foaming capacity and foam stability of protein solution at
different concentration viz., 0.1, 0.5, 1.0, 2.0 and 3.0 %, under neutral pH was
determined.
6.2.2.7.2 Emulsifying properties
Emulsifying properties were determined according to the method of Pearce
150 Optimization of process parameters for enzymatic hydrolysis of tuna red meat protein
Chapter 6
and Kinsella (1978). Vegetable oil (10 ml) and protein solution (30 ml, 1%) adjusted
to a pH of 2, 4, 6, 8 and 10 were mixed and homogenized using a homogenizer (230
VAC T-25 digital Ultra-turrax, IKA, India) at a speed of 20,000 rpm for 1 min. An
aliquot of the emulsion (50 μl) was pipetted from the bottom of the container at 0
and 10 min after homogenization and mixed with 5 ml of 0.1% sodium dodecyl
sulphate (SDS) solution. The absorbance of the diluted solution was measured at
500 nm using a spectrophotometer (Lambda 25 UV/Vis, Perkin Elmer Life and
Analytical Sciences, Singapore). The absorbance was measured immediately (A0)
and 10 min (A10) after emulsion formation was used to calculate the emulsifying
activity index (EAI) and the emulsion stability index (ESI) as follows:
EAI (m/g2) = 2 x 2.303 x A0
0.25 x Wt of protein
ESI (min) = A10 x Dt
DA
Dt =Time, DA =A0– A10
Similarly, the emulsifying properties of protein solution at different concentrations
viz., 0.1, 0.5, 1.0, 2.0 and 3.0 % at neutral pH were determined.
6.2.2.7.3 Antioxidative properties: pH and thermal stability studies
The methodology described by Yarnpakdee et al. (2015) was adopted for pH
and thermal stability studies. About 25 mg of sample was dispersed in distilled water
(8 ml), previously adjusted to different pHs (2, 4, 6, 8, 10) using 1 M HCl or NaOH.
The final volume was made up to 10 ml with the water having the corresponding pH
and allowed to stand at room temperature for 30 min. Further the pH of the mixtures
was adjusted to neutral (7.0) and made up to 25 ml with distilled water. The residual
antioxidant activities were determined viz., DPPH radical scavenging activity and
ABTS radical scavenging activity. To determine thermal stability, 10 ml of protein
hydrolysate solution (1 mg /ml) was placed in a temperature controlled water
151Optimization of process parameters for enzymatic hydrolysis of tuna red meat protein
Charaateriiation and storage stalility of the optimiied funational and antioxidant tuna protein hydrolysates
bath at different temperatures (30, 40, 50, 60, 70, 80 90 and 100 °C) for 30 min.
Further the solutions were rapidly cooled by placing in cold water and the residual
antioxidant activities were determined viz., DPPH radical scavenging activity and
ABTS radical scavenging activity.
6.2.3 Storage stability studies
Changes in physical, chemical, or microbiological properties of a product
can be considered as loss of stability. Optimized hydrolysate samples viz., FTPH
and ATPH were kept in plastic (polypropylene) bottles and closed air tightly. Further
they were stored at chilled conditions (4oC) and ambient conditions (25oC) for a
period of six months and samples were drawn periodically viz., every month for
quality analysis viz., moisture, pH, colour, solubility, TBARS, TMA, sensory and
microbiological indices.
6.2.3.1 Moisture
Moisture content was determined as per AOAC (2012) using oven drying
method wherein the loss in weight of food sample on account of evaporation of
water by drying was done. A known quantity of sample was subjected to 105°C in a
thermostatically controlled hot air oven until constant weight. From the difference
in weight, moisture content was estimated.
6.2.3.2 pH
A known quantity of the sample was finely blended with distilled water
in 1:9 ratio (w/v) and pH was measured using pH meter (ECPH S1042S, Eutech
Instruments, Singapore).
6.2.3.3 Colour
Hydrolysate powder was analysed for its colour characteristics viz., L*
(the degree of lightness), a* (redness(+)/greenness (-)) and b* (yellowness (+) or
blueness (-)) using Hunter Lab colorimeter (Colorflex EZ 45/0, Hunter Associates
Lab inc., Reston, Virginia, USA).
152 Optimization of process parameters for enzymatic hydrolysis of tuna red meat protein
Chapter 6
6.2.3.4 Solubility
Protein solubility of the samples were calculated as per the methodology of
Morr et al. (1985) (described in chapter 3; section 3.2.8.1)
6.2.3.5 Thio-barbituric Acid Reactive Substances
TBARS was estimated by distillation method described by Tarladgis et al.
(1960). This is one of the most widely used tests to evaluate the extent of lipid
oxidation in meats, based on the reaction between important oxidation product
malonaldehyde with TBA reagent to produce a coloured complex.
Sample of 10 g was taken and homogenised ((230 VAC T-25 digital Ultra-
turrax, IKA, India) with 50 ml distilled water. Then mixed with 2.5 ml of 4 N HCl
and 47.5 ml distilled water in a 250 ml round bottom flask which was connected to
a TBA distillation unit. About 50 ml distillate was collected within 10 min duration.
Five ml of distillate was then mixed with 5 ml TBA reagent and kept in boiling
water for 30 min. After cooling the solution, the optical density was measured in 1
cm quartz cuvette against a reagent blank at 538 nm by a UV Vis Spectrophotometer
(Lambda 25 UV/Vis, Perkin Elmer Life and Analytical Sciences, Singapore). The
results were expressed as mg malonaldehyde (MDA) per kg of sample.
TBARS = Absorbance x 7.8 x 5 Volume taken
6.2.3.6 Tri-methylamine nitrogen
TMA-N contents were determined using the Conway micro – diffusion
assay (Conway, 1950). TCA extract of the sample was prepared. About 1 ml of N/100
sulphuric acid was taken in the inner chamber of the conway’s unit. Simultaneously,
1 ml of TCA extract together with equal quantity of saturated potassium carbonate
and formaldehyde was taken in the outer chamber. TMA-N gets liberated while
153Optimization of process parameters for enzymatic hydrolysis of tuna red meat protein
Charaateriiation and storage stalility of the optimiied funational and antioxidant tuna protein hydrolysates
all other amines and ammonia are held back on addition of formaldehyde. TMA
absorbed in standard acid is estimated by titration
TMA-N (mg %) = (Blank – Titre volume) x 0.01 x 14 x Volume made up x 100 Volume of aliquot taken x Weight of sample
6.2.3.7 Sensory analysis
Sensory analysis of samples during storage was performed by a group of
10 trained panellists using a 9-point hedonic scale for attributes viz., appearance,
colour, texture, aroma and taste using score sheets as prescribed by Meilgaard et
al. (2006) (Annexure 3). The overall acceptability was evaluated on the basis of
these attributes. Final judgments were made based on the average scores given by
all panellists.
6.2.3.8 Microbiological analysis
Aerobic plate count was enumerated following the methodology prescribed
by USFDA (2001) adopting serial dilution of blended sample using pour plate
technique. For analysis, phosphate buffer was used in ratio (1: 9:: sample : buffer
(w/v)) and the homogenized sample was serially diluted using 9 ml sterile phosphate
buffer. Three consecutive dilutions were pipetted into clean dry petri dishes. About
12-15 ml plate count agar (cooled to 45 ± 1°C) was added to each plate and mixed
thoroughly and uniformly. Plates were then incubated at 35°C ± 2°C for 48 ± 2 h for
evaluating aerobic plate count and results expressed as log cfu/g.
6.2.4 Economic feasibility analysis
The parameters of the enzymatic process viz., enzyme-substrate
concentration, hydrolysis time, temperature and pH, previously identified as
optimum to produce TPH with superior functional properties viz., FTPH (0.34 %
E/S, 30 min, 60oC, pH 6.5) and superior antioxidant properties viz., ATPH (0.98
154 Optimization of process parameters for enzymatic hydrolysis of tuna red meat protein
Chapter 6
% E/S, 240 min, 60oC) in laboratory-scale evaluations, were used to model large
scale production utilizing the pilot facilities available at ICAR-CIFT. The economic
feasibility of producing the optimized tuna fish protein hydrolysate (TPH) on an
industrial scale, in order to identify the total investment cost, operation cost, return
on investment and the most importantly, the investment payback time was carried
out.
6.2.5 Statistical analysis
The analytical data obtained in triplicate were subjected to analysis of
variance (ANOVA). The differences between means were evaluated by duncan’s
multiple range test and were considered significant at 5 % levels. SPSS statistic
programme (SPSS 16.0 for Windows, SPSS Inc., Chicago, IL) was used for
interpretation of the results obtained.
155Optimization of process parameters for enzymatic hydrolysis of tuna red meat protein
Charaateriiation and storage stalility of the optimiied funational and antioxidant tuna protein hydrolysates
6.3 Results and discussion
6.3.1 Characteristics of optimized tuna protein hydrolysates
6.3.1.1 Degree of hydrolysis and proteolytic activity
Degree of hydrolysis is an indicator of the efficiency of the hydrolysis. It
measures the extent of breakage the protein molecules undergo to liberate a mixture
of high and low molecular weight peptides and free amino acids, responsible for the
bioactivity of the derived peptides. DH of the optimized functional hydrolysate was
observed to be 14.35 ± 0.15 % and the corresponding proteolytic activity, in terms
of amount of tyrosine liberated was 0.329 ± 0.003 (Table 6.3). DH of the optimized
antioxidant hydrolysate and its corresponding amount of tyrosine liberated was
observed to be 31.59 ± 1.06 % and 0.515 ± 0.006, respectively. The physicochemical
condition of the reaction determines the degree of hydrolysis as well as the
molecular weight of the peptides which are contributors to the bioactive property
exhibited by the peptides (Ren et al., 2008a). Opheim et al. (2015) reported short-
chain peptides produced on account of higher degree of hydrolysis to be associated
with higher bioactivity such as antioxidativity. Similarly authors like Nalinanon et
al. (2011) reported that functional properties like emulsion and foaming properties
are governed by their DH and hydrolysate concentrations. In concurrence with
these reports, the present study suggested limited degree of hydrolysis to result in
larger peptides (> 10 kDa) of higher proportion (60 %) in functionally optimized
hydrolysate. Similarly the higher degree of hydrolysis adopted for optimized
antioxidant hydrolysate resulted in higher proportion of smaller peptides (< 3 kDa),
accountable for superior antioxidant properties (Table 6.3).
6.3.1.2 Protein recovery and yield
Recovery of protein during hydrolysis is a major determinant factor that
indicates its efficacy. Generally a high protein recovery ensures efficiency of
the processing conditions adopted. Protein recovery reported for the optimized
156 Optimization of process parameters for enzymatic hydrolysis of tuna red meat protein
Chapter 6
hydrolysate sample was 39.64 % (FTPH) and 45.24 % (ATPH), respectively (Table
6.3). Correspondingly a yield of 5.9 % and 8.6 % was observed for FTPH and
ATPH from their respective solutions while it was about 6.9 % and 14.4 % from
their raw material. These variations in protein recovery and associated yield can be
linked to the extent of hydrolysis undergone wherein the proteins from the parent
substrate was extracted into the resultant hydrolysate solution upon hydrolysis, with
higher peptide cleavage proportional to the degree of hydrolysis. The optimized
hydrolytic conditions followed by subsequent filtration and centrifugation promoted
the concentration of desirable protein in the derived sample with removal of other
undesirable components like fat, minerals etc. Similar reports by Haslaniza et al.
(2010) indicated an increase in DH caused increased cleavage of peptide bonds
thus increasing the peptide solubility in the resultant hydrolysate solution. Longer
hydrolytic conditions along with higher enzyme concentration resulted in papain
to act more extensively on the substrate resulting in more recovery of protein into
the hydrolysate solution. Simultaneously the yield was also influenced by the
amount of protein recovered into the solution which was further spray dried to
powder. Generally reports suggested a yield ranging from 3 - 15 % (Gajanan et
al., 2016; Parvathy et al., 2016; 2018a) based on hydrolytic conditions followed
by subsequent drying adopted. Generally these lower yields are due to the reality
that only the soluble fractions are dried and further associated to the solid losses
occurring during spray drying operation.
6.3.1.3 Molecular weight
Molecular weight of the protein hydrolysate is regarded as one of the
main factors determining the functional and bioactive properties of hydrolysates
which inturn is crucial for its effective utilization (Klompong et al., 2007; Li et
al., 2013 and Taheri et al., 2014). Analysis of the molecular weight pattern of
157Optimization of process parameters for enzymatic hydrolysis of tuna red meat protein
Charaateriiation and storage stalility of the optimiied funational and antioxidant tuna protein hydrolysates
the derived hydrolysate using molecular weight cut-offs revealed a distribution
of 60 % peptides above 10 kDa in functional hydrolysate (Table 6.3). However,
in antioxidant hydrolysate, in contrary to FTPH, major share of peptides (45 %)
were of lower chain length (< 3 kDa), 30 % in the range of 3-10 kDa and about
25 % peptides between 10-30 kDa. Chi et al. (2014) in their studies reported a
positive correlation between the peptide molecular weight and functional properties
viz., emulsion stability index, emulsifying activity index, foam stability, and foam
capacity. Studies on the foam stability of casein hydrolysates was correlated to their
molecular weight distribution where a high proportion of peptides of molecular
weight >7 kDa, (intact protein as well as high molecular weight peptides) to be
positively related to foam stability (Van der Ven et al., 2002). Similarly, the findings
from the present study strengthened the reason for higher antioxidant activity
exhibited by the hydrolysate (ATPH) as supported by previous studies which
mentioned the antioxidant peptides to be highly influenced by their molecular
weight distribution (Li et al., 2008; Zhao et al., 2011). Studies by Picot et al.
(2010) reported that short peptides of molecular mass less than 3 - 4 kDa usually
contain bioactive properties. Lower molecular weight fish protein peptides ranging
between 0.5 and 1.5 kDa proved to exhibit higher antioxidant activity (Nalinanon
et al., 2011; Li et al., 2013; Centenaro et al., 2014). Chi et al. (2014) also reported
hydrolysates with lower molecular weight to be composed of shorter and more
active peptides, which could serve as electron donors and react with free
radicals to transform them into more stable substances and end the chain reactions.
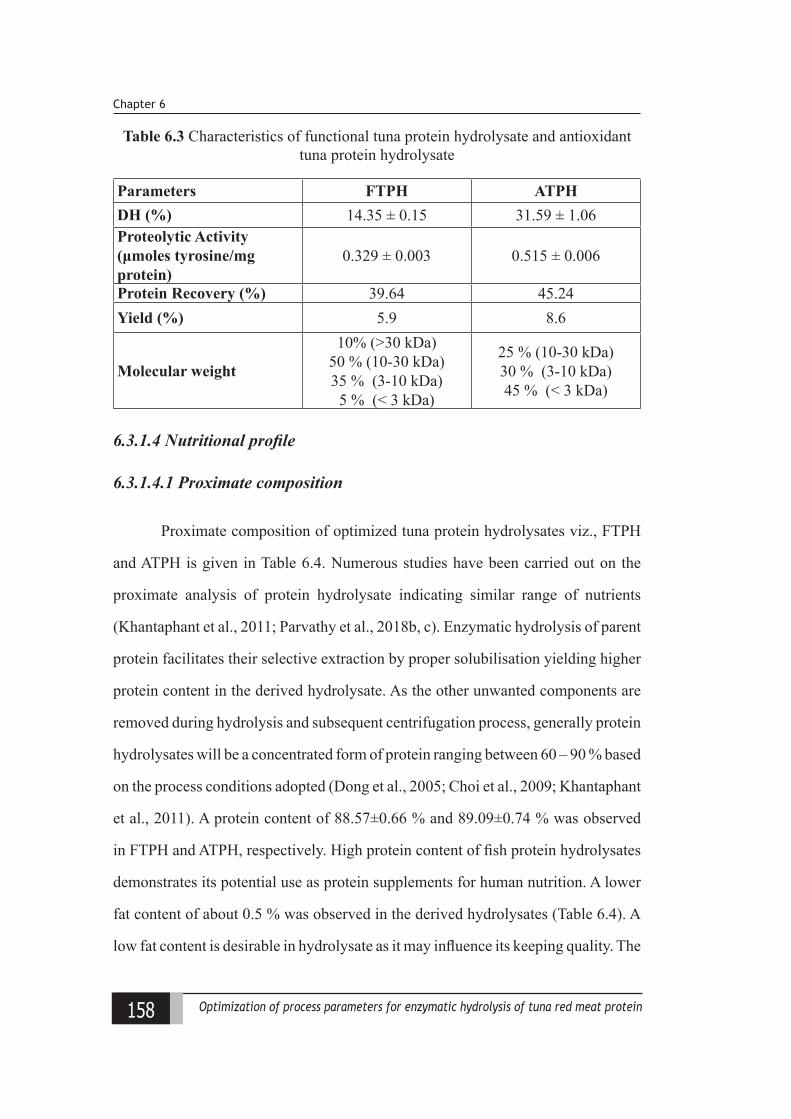
158 Optimization of process parameters for enzymatic hydrolysis of tuna red meat protein
Chapter 6
Table 6.3 Characteristics of functional tuna protein hydrolysate and antioxidant tuna protein hydrolysate
Parameters FTPH ATPHDH (%) 14.35 ± 0.15 31.59 ± 1.06Proteolytic Activity (μmoles tyrosine/mg protein)
0.329 ± 0.003 0.515 ± 0.006
Protein Recovery (%) 39.64 45.24Yield (%) 5.9 8.6
Molecular weight
10% (>30 kDa)50 % (10-30 kDa)35 % (3-10 kDa)
5 % (< 3 kDa)
25 % (10-30 kDa)30 % (3-10 kDa)45 % (< 3 kDa)
6.3.1.4 Nutritional profile
6.3.1.4.1 Proximate composition
Proximate composition of optimized tuna protein hydrolysates viz., FTPH
and ATPH is given in Table 6.4. Numerous studies have been carried out on the
proximate analysis of protein hydrolysate indicating similar range of nutrients
(Khantaphant et al., 2011; Parvathy et al., 2018b, c). Enzymatic hydrolysis of parent
protein facilitates their selective extraction by proper solubilisation yielding higher
protein content in the derived hydrolysate. As the other unwanted components are
removed during hydrolysis and subsequent centrifugation process, generally protein
hydrolysates will be a concentrated form of protein ranging between 60 – 90 % based
on the process conditions adopted (Dong et al., 2005; Choi et al., 2009; Khantaphant
et al., 2011). A protein content of 88.57±0.66 % and 89.09±0.74 % was observed
in FTPH and ATPH, respectively. High protein content of fish protein hydrolysates
demonstrates its potential use as protein supplements for human nutrition. A lower
fat content of about 0.5 % was observed in the derived hydrolysates (Table 6.4). A
low fat content is desirable in hydrolysate as it may influence its keeping quality. The
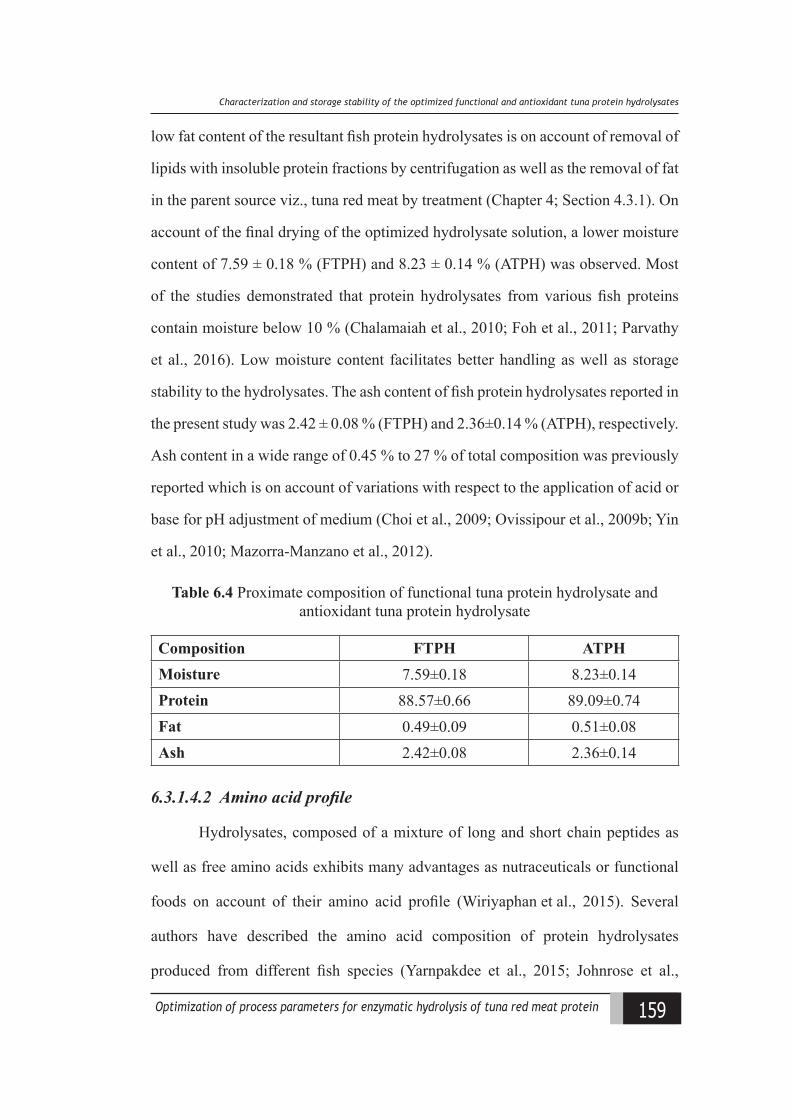
159Optimization of process parameters for enzymatic hydrolysis of tuna red meat protein
Charaateriiation and storage stalility of the optimiied funational and antioxidant tuna protein hydrolysates
low fat content of the resultant fish protein hydrolysates is on account of removal of
lipids with insoluble protein fractions by centrifugation as well as the removal of fat
in the parent source viz., tuna red meat by treatment (Chapter 4; Section 4.3.1). On
account of the final drying of the optimized hydrolysate solution, a lower moisture
content of 7.59 ± 0.18 % (FTPH) and 8.23 ± 0.14 % (ATPH) was observed. Most
of the studies demonstrated that protein hydrolysates from various fish proteins
contain moisture below 10 % (Chalamaiah et al., 2010; Foh et al., 2011; Parvathy
et al., 2016). Low moisture content facilitates better handling as well as storage
stability to the hydrolysates. The ash content of fish protein hydrolysates reported in
the present study was 2.42 ± 0.08 % (FTPH) and 2.36±0.14 % (ATPH), respectively.
Ash content in a wide range of 0.45 % to 27 % of total composition was previously
reported which is on account of variations with respect to the application of acid or
base for pH adjustment of medium (Choi et al., 2009; Ovissipour et al., 2009b; Yin
et al., 2010; Mazorra-Manzano et al., 2012).
Table 6.4 Proximate composition of functional tuna protein hydrolysate and antioxidant tuna protein hydrolysate
Composition FTPH ATPHMoisture 7.59±0.18 8.23±0.14Protein 88.57±0.66 89.09±0.74Fat 0.49±0.09 0.51±0.08Ash 2.42±0.08 2.36±0.14
6.3.1.4.2 Amino acid profile
Hydrolysates, composed of a mixture of long and short chain peptides as
well as free amino acids exhibits many advantages as nutraceuticals or functional
foods on account of their amino acid profile (Wiriyaphan et al., 2015). Several
authors have described the amino acid composition of protein hydrolysates
produced from different fish species (Yarnpakdee et al., 2015; Johnrose et al.,
160 Optimization of process parameters for enzymatic hydrolysis of tuna red meat protein
Chapter 6
2016) However variations were observed in their amino acid compositions which
is mainly accountable to factors viz., source of raw material, enzymes used as well
as hydrolysis conditions (Klompong et al., 2009a). Among all the amino acids,
aspartic acid and glutamic acid were found to be higher in most of the reported
fish protein hydrolysates (Yin et al., 2010; Ghassem et al., 2014). Similar to fish
muscle hydrolysates, other body parts like head, skin and visceral hydrolysates
were reported to contain all the essential and non-essential amino acids (Sathivel
et al., 2005a; Ovissipour et al., 2009a; Yin et al., 2010). Present study revealed the
richness in amino acids like glutamic acid, aspartic acid, lysine and leucine while
amino acids viz., phenyl alanine, tyrosine, methionine and cysteine were found
to be in lower amounts in the hydrolytes (Table 6.5). Previous studies conducted
by us on the amino acid profile of the source of hydrolysate viz., tuna red meat
also revealed similar profile with its abundance in amino acids like glutamic acid,
aspartic acid, lysine and leucine while tyrosine, methionine and cysteine were found
in low amounts. Similar to the present study, Sathivel et al. (2003) reported higher
levels of glutamic acid, aspartic acid, lysine and leucine in hydrolysates prepared
from the whole herring as well as herring body. Reports by Gamarro et al. (2013)
suggested that tuna red meat contained all the essential amino acids contributing to
about 49–52 % of the total amino acids. The EAA values viz., 49.96 % in functional
hydrolysate and 50.33 % in the antioxidant hydrolysate, exceeded the reference
value of 40 % recommended by WHO/FAO/UNU (2007). The present study also
indicated a high essential amino acid/non-essential amino acid ratio of 1.01 (FTPH)
and 1.03 (ATPH) strengthening its suitability as a dietary protein supplement.
Further, the hydrolysates had an extremely high content of flavour enhancers viz.,
glutamic acid, aspartic acid, glycine and alanine (38.31 % and 37.33 % of the total
161Optimization of process parameters for enzymatic hydrolysis of tuna red meat protein
Charaateriiation and storage stalility of the optimiied funational and antioxidant tuna protein hydrolysates
amino acids) in FTPH and ATPH, respectively. Moderately high levels of lysine
viz., 9.42 % and 9.43 % were present in the functional and antioxidant hydrolysate,
respectively. This is an amino acid required for appropriate growth and a precursor
for carnitine production, a nutrient necessary for converting fatty acids into energy
and regulating cholesterol levels. Protein hydrolysate also exhibited fairly higher
levels of hydrophobic amino acids viz., leucine, alanine, valine, proline, glycine
contributing to its antioxidant activity. Chi et al. (2015) confirmed that the higher
contents of hydrophobic and aromatic amino acids facilitated the radical scavenging
activities of protein hydrolysate facilitated by greater interaction between the
peptide and fatty acids as well as their ability to donate protons to electron-deficient
radicals and maintain their stabilities via resonance structures and enhance radical
scavenging activities.
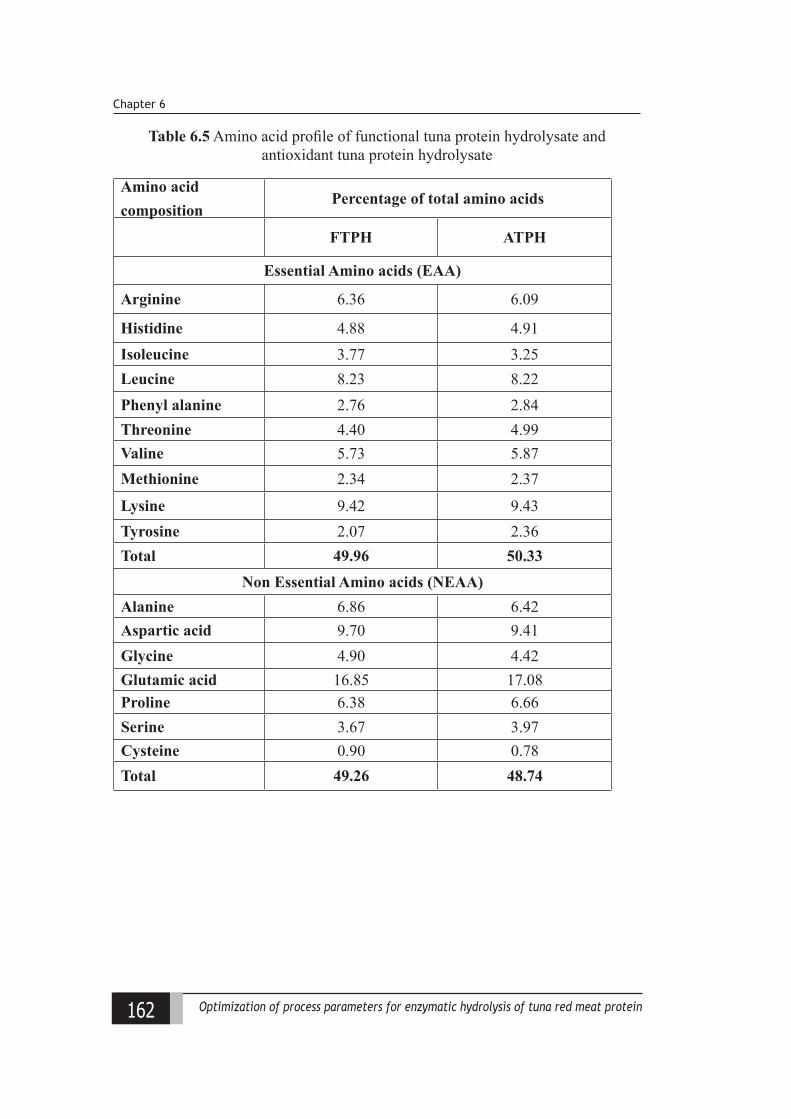
162 Optimization of process parameters for enzymatic hydrolysis of tuna red meat protein
Chapter 6
Table 6.5 Amino acid profile of functional tuna protein hydrolysate and antioxidant tuna protein hydrolysate
Amino acid composition
Percentage of total amino acids
FTPH ATPH
Essential Amino acids (EAA)
Arginine 6.36 6.09
Histidine 4.88 4.91Isoleucine 3.77 3.25Leucine 8.23 8.22Phenyl alanine 2.76 2.84Threonine 4.40 4.99Valine 5.73 5.87Methionine 2.34 2.37
Lysine 9.42 9.43Tyrosine 2.07 2.36Total 49.96 50.33
Non Essential Amino acids (NEAA)Alanine 6.86 6.42Aspartic acid 9.70 9.41Glycine 4.90 4.42Glutamic acid 16.85 17.08Proline 6.38 6.66Serine 3.67 3.97Cysteine 0.90 0.78Total 49.26 48.74
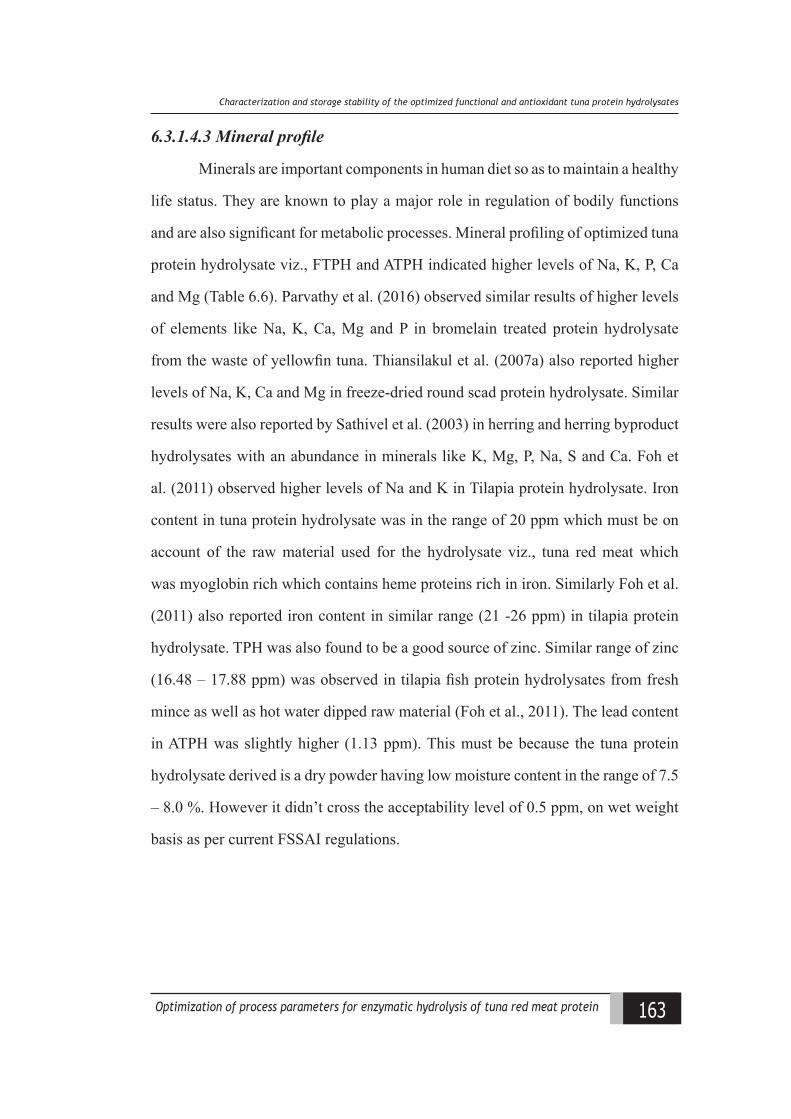
163Optimization of process parameters for enzymatic hydrolysis of tuna red meat protein
Charaateriiation and storage stalility of the optimiied funational and antioxidant tuna protein hydrolysates
6.3.1.4.3 Mineral profile
Minerals are important components in human diet so as to maintain a healthy
life status. They are known to play a major role in regulation of bodily functions
and are also significant for metabolic processes. Mineral profiling of optimized tuna
protein hydrolysate viz., FTPH and ATPH indicated higher levels of Na, K, P, Ca
and Mg (Table 6.6). Parvathy et al. (2016) observed similar results of higher levels
of elements like Na, K, Ca, Mg and P in bromelain treated protein hydrolysate
from the waste of yellowfin tuna. Thiansilakul et al. (2007a) also reported higher
levels of Na, K, Ca and Mg in freeze-dried round scad protein hydrolysate. Similar
results were also reported by Sathivel et al. (2003) in herring and herring byproduct
hydrolysates with an abundance in minerals like K, Mg, P, Na, S and Ca. Foh et
al. (2011) observed higher levels of Na and K in Tilapia protein hydrolysate. Iron
content in tuna protein hydrolysate was in the range of 20 ppm which must be on
account of the raw material used for the hydrolysate viz., tuna red meat which
was myoglobin rich which contains heme proteins rich in iron. Similarly Foh et al.
(2011) also reported iron content in similar range (21 -26 ppm) in tilapia protein
hydrolysate. TPH was also found to be a good source of zinc. Similar range of zinc
(16.48 – 17.88 ppm) was observed in tilapia fish protein hydrolysates from fresh
mince as well as hot water dipped raw material (Foh et al., 2011). The lead content
in ATPH was slightly higher (1.13 ppm). This must be because the tuna protein
hydrolysate derived is a dry powder having low moisture content in the range of 7.5
– 8.0 %. However it didn’t cross the acceptability level of 0.5 ppm, on wet weight
basis as per current FSSAI regulations.
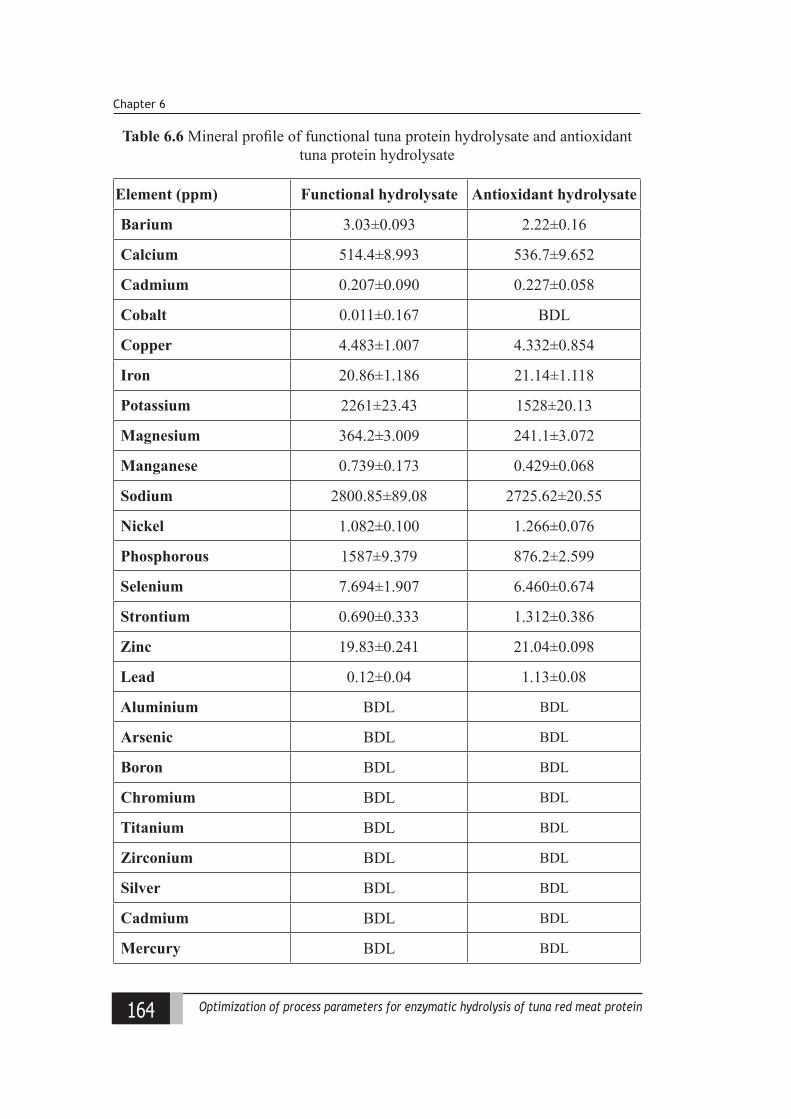
164 Optimization of process parameters for enzymatic hydrolysis of tuna red meat protein
Chapter 6
Table 6.6 Mineral profile of functional tuna protein hydrolysate and antioxidant tuna protein hydrolysate
Element (ppm) Functional hydrolysate Antioxidant hydrolysate
Barium 3.03±0.093 2.22±0.16
Calcium 514.4±8.993 536.7±9.652
Cadmium 0.207±0.090 0.227±0.058
Cobalt 0.011±0.167 BDL
Copper 4.483±1.007 4.332±0.854
Iron 20.86±1.186 21.14±1.118
Potassium 2261±23.43 1528±20.13
Magnesium 364.2±3.009 241.1±3.072
Manganese 0.739±0.173 0.429±0.068
Sodium 2800.85±89.08 2725.62±20.55
Nickel 1.082±0.100 1.266±0.076
Phosphorous 1587±9.379 876.2±2.599
Selenium 7.694±1.907 6.460±0.674
Strontium 0.690±0.333 1.312±0.386
Zinc 19.83±0.241 21.04±0.098
Lead 0.12±0.04 1.13±0.08
Aluminium BDL BDL
Arsenic BDL BDL
Boron BDL BDL
Chromium BDL BDL
Titanium BDL BDL
Zirconium BDL BDL
Silver BDL BDL
Cadmium BDL BDL
Mercury BDL BDL
165Optimization of process parameters for enzymatic hydrolysis of tuna red meat protein
Charaateriiation and storage stalility of the optimiied funational and antioxidant tuna protein hydrolysates
6.3.1.5 Morphological and thermal characteristics
6.3.1.5.1 Scanning electron microscopy
Particle size of protein powders is a key physical property that affects its
flowability (Kuakpetoon et al., 2001). The microstructure analysis of hydrolysate
revealed predominantly ruptured flake like structures having a size range of 5 -12
µm (Fig. 6.4). It is ideal to infer that, the higher extent of hydrolysis resulted in
breakage of complex protein molecules to low molecular weight peptides which
failed to retain the uniform spherical structure from the sprayed droplets on rapid
drying. Particle size of powders are found to be dependent on the spray drying
conditions viz., feed temperature, air inlet temperature and outlet temperatures
(Sathivel et al., 2009). Similar observations correlating the degree of hydrolysis
and the morphology of the spray dried particles were reported by Arias-Moscoso et
al. (2015). The shorter the peptide, lesser the ability to form a continuous network at
the droplet interphase. They reported an average hydrolysate particle size at pH 7.0
to be 4.0 to 1.5 μm, and the results to be consistent with the DH and electrophoretic
patterns.
FTPH ATPH
Fig. 6.4 SEM image of tuna protein hydrolysates
166 Optimization of process parameters for enzymatic hydrolysis of tuna red meat protein
Chapter 6
6.3.1.5.2 Differential scanning colorimetry
The thermally induced phase transitions and associated energetics as well
as the conformational changes of a sample as a function of temperature can be
well understood by employing differential scanning calorimetry (Chiu and Prenner,
2011). The DSC thermogram of tuna protein hydrolysates were characterized by two
endothermic peaks; the first one corresponding to glass transition point, considered
to be the temperature at which the protein polymer undergoes transition from glassy
to rubbery state. The onset and peak temperature for the hydrolysates were similar
with a value indicating 22.46 oC and 25.71 oC for FTPH and 22.70oC and 25.25oC for
ATPH (Fig. 6.5). This was accounted to be due to the commencement of long-range
coordinated molecular motion of disordered (amorphous) structure (Sperling, 2006).
Powder stickiness is identified as one of the main physical phenomenon related to
occur 10- 200C above this point (Roos, 1995; Hogan and O’callaghan, 2013). The
second prominent endothermic temperature transition was at 56.94oC and 66.86 oC
for FTPH while for ATPH it was observed at an onset temperature at 55.88oC and
peak at 66.04 oC. This point is related to the protein thermal resistance, where the
onset temperature indicated the beginning of sample melting as a function of the
heating rate. Foh et al. (2012) reported a lower denaturation temperature of 52.84oC
for hydrolysate prepared from Nile tilapia mince. On denaturation of protein, the
water molecules compete with the central and lateral chains of the protein molecule
resulting in breakage of hydrogen bonds exposing the hydrophobic groups which
alters the transition temperature (Pechkova et al., 2007).
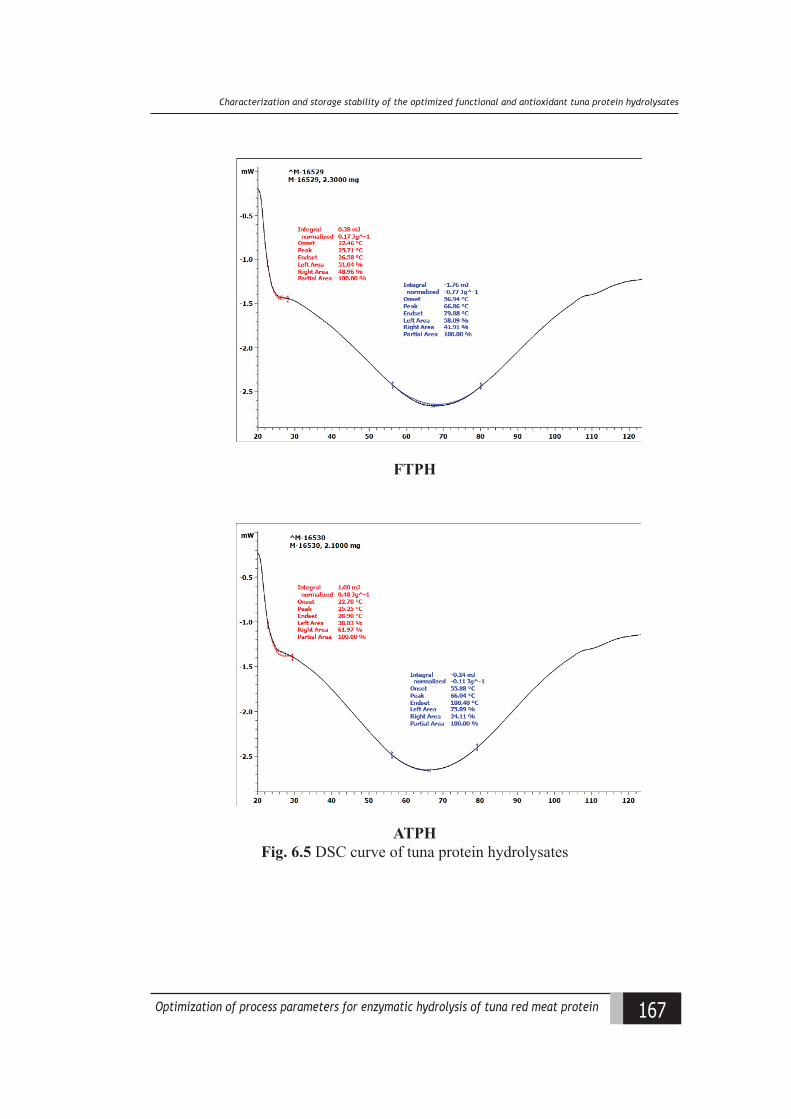
167Optimization of process parameters for enzymatic hydrolysis of tuna red meat protein
Charaateriiation and storage stalility of the optimiied funational and antioxidant tuna protein hydrolysates
FTPH
ATPHFig. 6.5 DSC curve of tuna protein hydrolysates
168 Optimization of process parameters for enzymatic hydrolysis of tuna red meat protein
Chapter 6
6.3.1.5.3 Fourier-transform infrared spectroscopic analysis The alterations in the secondary structure of proteins and polypeptides can
be well revealed by Fourier Transform Infrared (FTIR) spectroscopy (Nikoo et al., 2011). Heat treatment and enzymatic hydrolysis promote protein denaturation causing shifts in absorption spectrum peaks towards shorter wavelengths, referred to as blue shifts (Damodaran and Paraf, 1997). FTIR spectra of the hydrolysate molecule in the range of 4500 – 400 cm-1 were analysed (Fig. 6.6). The FTIR spectrum fingerprint region from 1,800 to 800 cm-1 is useful for analyzing proteinaceous material as this range is adsorbed by bond formation with the amide group. These absorptions are mainly due to C=O stretching, C-N stretching, N-H stretching, and O-C-N bending. Moreover, the region from 3,300 to 3,070 cm-1 almost exclusively indicates the N-H group with contributions from O-H stretching by the intermolecular hydrogen bonding related to free water. Among these absorption bands, the Amide-I band between 1600 and 1700 cm-1 and Amide-II between 1565 and 1520 cm-1, are the most useful peaks for infrared analysis of the secondary structure of proteins (Muyonga et al., 2004). The functional and antioxidant hydrolysate samples exhibited Amide-I band at 1644.39 cm-1 and 1656.92 cm-1, respectively. Amide-II band of FTPH and ATPH were observed at 1548.91 cm-1. Amide-I represents C=O stretching/hydrogen bonding coupled with COO- and Amide-II arises from bending vibration of N–H groups and stretching vibrations of C–N groups. The frequency range of 1660–1650 cm-1 is characteristic of α-helical structures (Hashim et al., 2010) and hence the present study confirmed the sample to have helical confirmation even after hydrolysis and subsequent spray drying process. Binsi et al. (2017c) observed gelatin short peptides or collagen like peptides to have undergone self-assemblage during freeze-drying process resulting in high helical content of pure gelatin.
Amide A and B bands were observed in the wavelengths of 3283.95 and 2961.82, respectively for both the hydrolysates. A free NH stretching vibration is generally observed in the range of 3400–3440 cm-1. Nevertheless, studies by Muyonga et al. (2004); Nikoo et al. (2011) reported band shifts to lower frequencies when an NH group of peptide is involved in hydrogen bonding, essentially indicating the peptide hydrogen bonding involved during tuna protein hydrolysis in the current investigation.
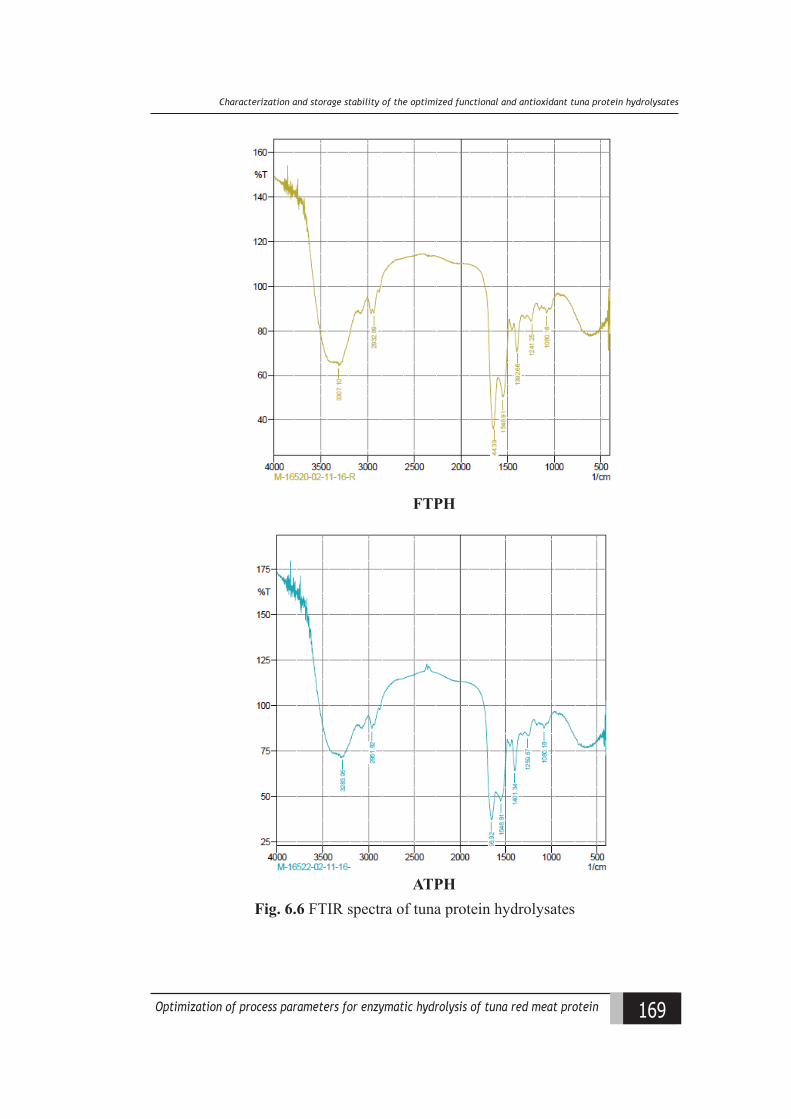
169Optimization of process parameters for enzymatic hydrolysis of tuna red meat protein
Charaateriiation and storage stalility of the optimiied funational and antioxidant tuna protein hydrolysates
FTPH
ATPHFig. 6.6 FTIR spectra of tuna protein hydrolysates
170 Optimization of process parameters for enzymatic hydrolysis of tuna red meat protein
Chapter 6
6.3.1.6 Physico-chemical properties
6.3.1.6.1 Hygroscopicity
Dry powders are generally hygroscopic in nature which inturn affects its
other physico-chemical properties like powder reconstitution as well as storage
stability. Proteins, on hydrolysis results in the formation of lower average molecular
weight peptides with greater number of available water binding sites (Hogan and
O’callaghan, 2013). This in turn facilitates its hygroscopic tendency in comparison
to the parent protein. Netto et al. (1998) reported an increase in moisture sorption
behaviour due to protein hydrolysis. The smaller particle size of powders resulting
in a greater surface area enhances the exposure of powders to the atmospheric
moisture facilitating higher absorption. The results of the present study indicate
fine flaked particles for the resultant hydrolysate which resulted in a hygroscopicity
of about 10.66 ± 0.05 % and 8.83 ± 0.10 % for FTPH and ATPH, respectively
(Table 6.6). The drier the sample, more is the tendancy to absorb moisture from
the surrounding. As previously reported FTPH was drier with a moisture content of
7.59 ± 0.18 % in comparison to ATPH which reported a slightly higher moisture of
8.23 ± 0.14 %. Similar results were reported by Suzihaque et al. (2015) for spray
dried pineapple powders where the powders produced at higher inlet temperature
were more hygroscopic compare to the lower inlet temperature on account of the
variations in moisture content in the resultant powder and corresponding water
concentration gradient between the product and the surrounding air.
6.3.1.6.2 Bulk density and tapped density
Bulk density (apparent or packing density) indicating the behavior of a
product in dry mixes, is a measure of the mass of powder which occupies a fixed
volume. It is an economically, commercially and functionally important property
which is dependent on particle density, particle internal porosity as well as
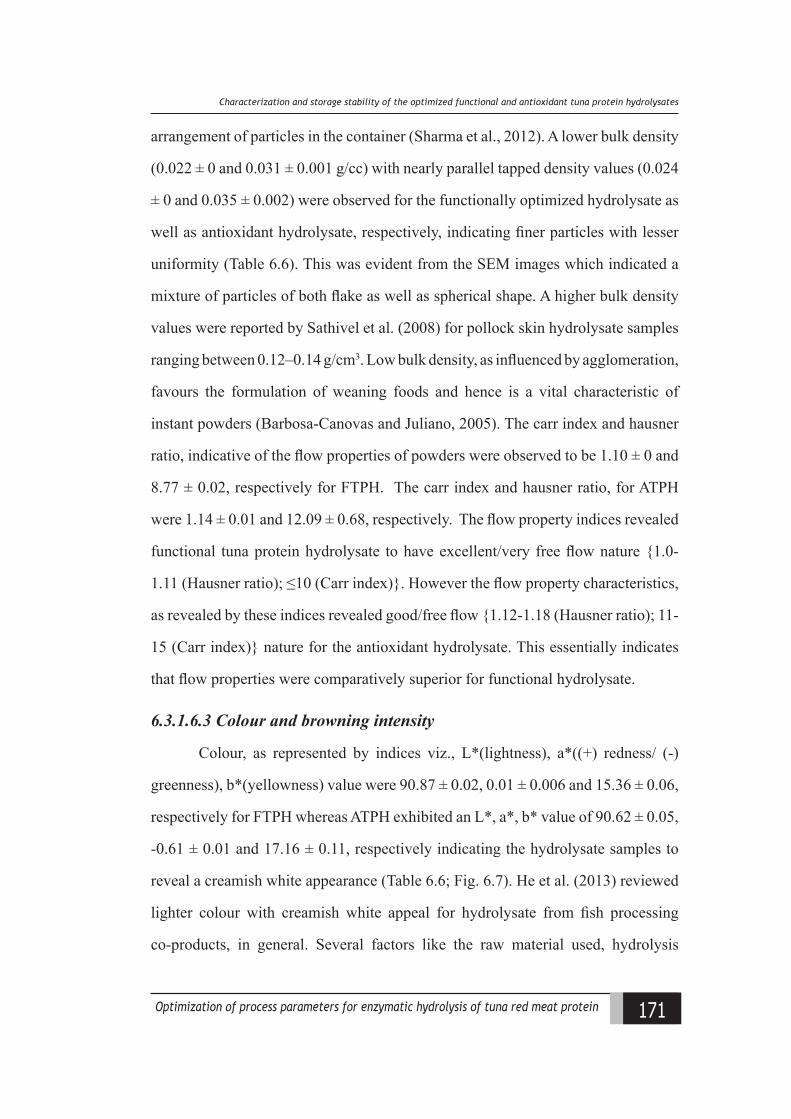
171Optimization of process parameters for enzymatic hydrolysis of tuna red meat protein
Charaateriiation and storage stalility of the optimiied funational and antioxidant tuna protein hydrolysates
arrangement of particles in the container (Sharma et al., 2012). A lower bulk density
(0.022 ± 0 and 0.031 ± 0.001 g/cc) with nearly parallel tapped density values (0.024
± 0 and 0.035 ± 0.002) were observed for the functionally optimized hydrolysate as
well as antioxidant hydrolysate, respectively, indicating finer particles with lesser
uniformity (Table 6.6). This was evident from the SEM images which indicated a
mixture of particles of both flake as well as spherical shape. A higher bulk density
values were reported by Sathivel et al. (2008) for pollock skin hydrolysate samples
ranging between 0.12–0.14 g/cm3. Low bulk density, as influenced by agglomeration,
favours the formulation of weaning foods and hence is a vital characteristic of
instant powders (Barbosa-Canovas and Juliano, 2005). The carr index and hausner
ratio, indicative of the flow properties of powders were observed to be 1.10 ± 0 and
8.77 ± 0.02, respectively for FTPH. The carr index and hausner ratio, for ATPH
were 1.14 ± 0.01 and 12.09 ± 0.68, respectively. The flow property indices revealed
functional tuna protein hydrolysate to have excellent/very free flow nature {1.0-
1.11 (Hausner ratio); ≤10 (Carr index)}. However the flow property characteristics,
as revealed by these indices revealed good/free flow {1.12-1.18 (Hausner ratio); 11-
15 (Carr index)} nature for the antioxidant hydrolysate. This essentially indicates
that flow properties were comparatively superior for functional hydrolysate.
6.3.1.6.3 Colour and browning intensity
Colour, as represented by indices viz., L*(lightness), a*((+) redness/ (-)
greenness), b*(yellowness) value were 90.87 ± 0.02, 0.01 ± 0.006 and 15.36 ± 0.06,
respectively for FTPH whereas ATPH exhibited an L*, a*, b* value of 90.62 ± 0.05,
-0.61 ± 0.01 and 17.16 ± 0.11, respectively indicating the hydrolysate samples to
reveal a creamish white appearance (Table 6.6; Fig. 6.7). He et al. (2013) reviewed
lighter colour with creamish white appeal for hydrolysate from fish processing
co-products, in general. Several factors like the raw material used, hydrolysis
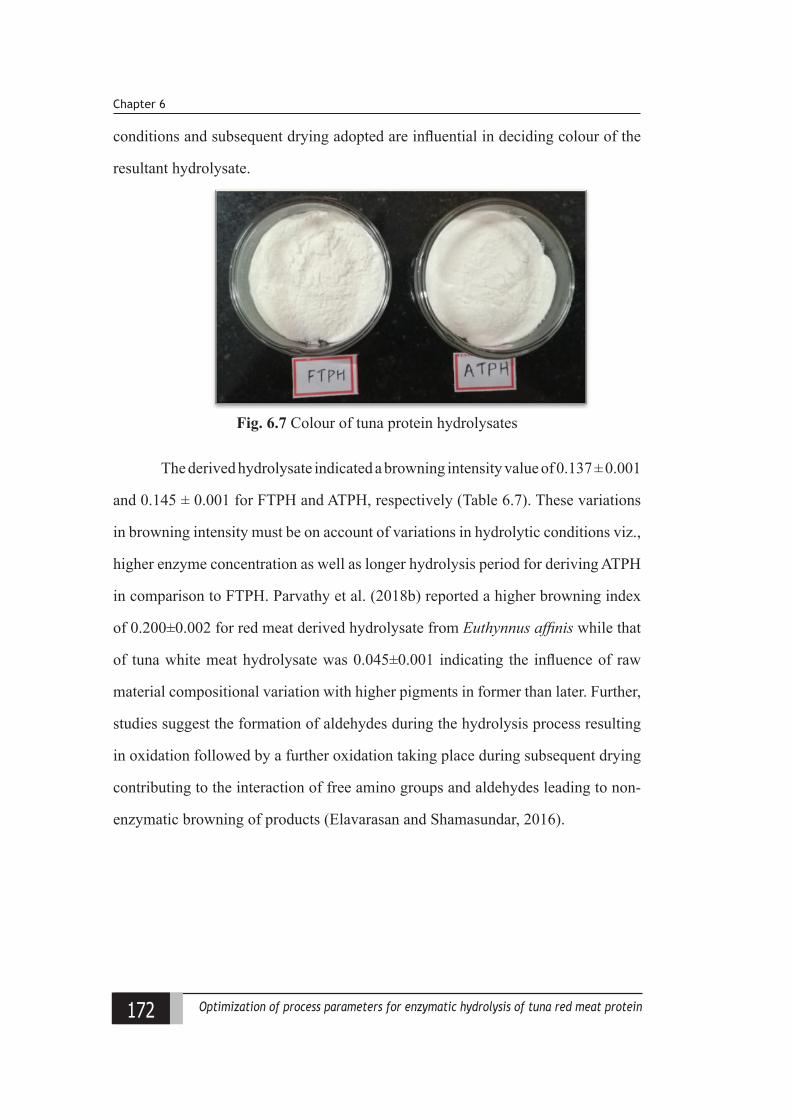
172 Optimization of process parameters for enzymatic hydrolysis of tuna red meat protein
Chapter 6
conditions and subsequent drying adopted are influential in deciding colour of the
resultant hydrolysate.
Fig. 6.7 Colour of tuna protein hydrolysates
The derived hydrolysate indicated a browning intensity value of 0.137 ± 0.001
and 0.145 ± 0.001 for FTPH and ATPH, respectively (Table 6.7). These variations
in browning intensity must be on account of variations in hydrolytic conditions viz.,
higher enzyme concentration as well as longer hydrolysis period for deriving ATPH
in comparison to FTPH. Parvathy et al. (2018b) reported a higher browning index
of 0.200±0.002 for red meat derived hydrolysate from Euthynnus affinis while that
of tuna white meat hydrolysate was 0.045±0.001 indicating the influence of raw
material compositional variation with higher pigments in former than later. Further,
studies suggest the formation of aldehydes during the hydrolysis process resulting
in oxidation followed by a further oxidation taking place during subsequent drying
contributing to the interaction of free amino groups and aldehydes leading to non-
enzymatic browning of products (Elavarasan and Shamasundar, 2016).
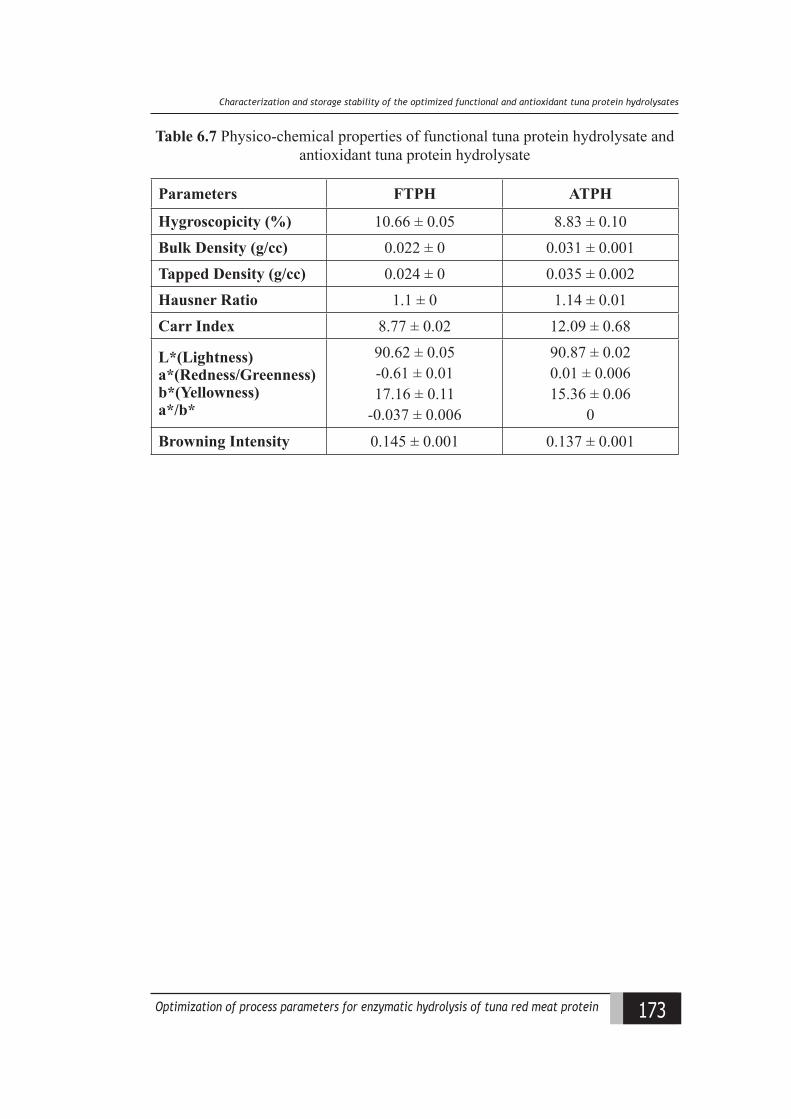
173Optimization of process parameters for enzymatic hydrolysis of tuna red meat protein
Charaateriiation and storage stalility of the optimiied funational and antioxidant tuna protein hydrolysates
Table 6.7 Physico-chemical properties of functional tuna protein hydrolysate and antioxidant tuna protein hydrolysate
Parameters FTPH ATPH
Hygroscopicity (%) 10.66 ± 0.05 8.83 ± 0.10Bulk Density (g/cc) 0.022 ± 0 0.031 ± 0.001Tapped Density (g/cc) 0.024 ± 0 0.035 ± 0.002Hausner Ratio 1.1 ± 0 1.14 ± 0.01Carr Index 8.77 ± 0.02 12.09 ± 0.68
L*(Lightness)a*(Redness/Greenness)b*(Yellowness)a*/b*
90.62 ± 0.05-0.61 ± 0.0117.16 ± 0.11
-0.037 ± 0.006
90.87 ± 0.020.01 ± 0.00615.36 ± 0.06
0
Browning Intensity 0.145 ± 0.001 0.137 ± 0.001
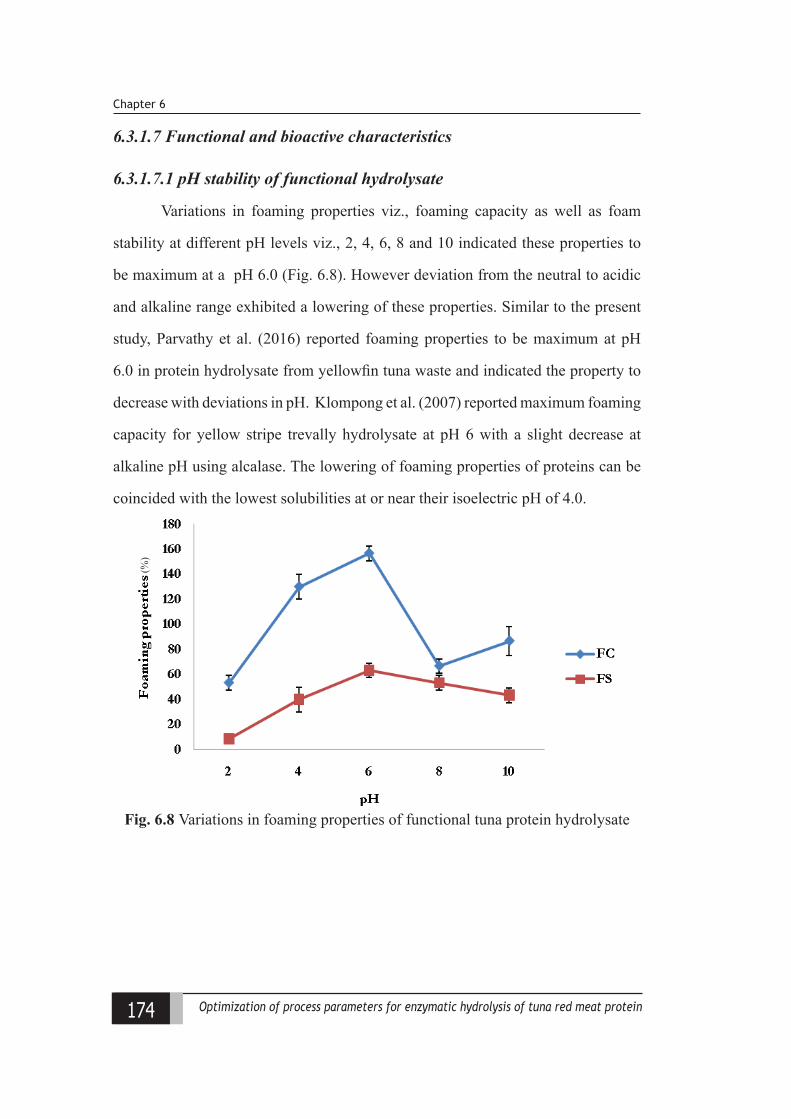
174 Optimization of process parameters for enzymatic hydrolysis of tuna red meat protein
Chapter 6
6.3.1.7 Functional and bioactive characteristics
6.3.1.7.1 pH stability of functional hydrolysate
Variations in foaming properties viz., foaming capacity as well as foam
stability at different pH levels viz., 2, 4, 6, 8 and 10 indicated these properties to
be maximum at a pH 6.0 (Fig. 6.8). However deviation from the neutral to acidic
and alkaline range exhibited a lowering of these properties. Similar to the present
study, Parvathy et al. (2016) reported foaming properties to be maximum at pH
6.0 in protein hydrolysate from yellowfin tuna waste and indicated the property to
decrease with deviations in pH. Klompong et al. (2007) reported maximum foaming
capacity for yellow stripe trevally hydrolysate at pH 6 with a slight decrease at
alkaline pH using alcalase. The lowering of foaming properties of proteins can be
coincided with the lowest solubilities at or near their isoelectric pH of 4.0.
(%)
Fig. 6.8 Variations in foaming properties of functional tuna protein hydrolysate
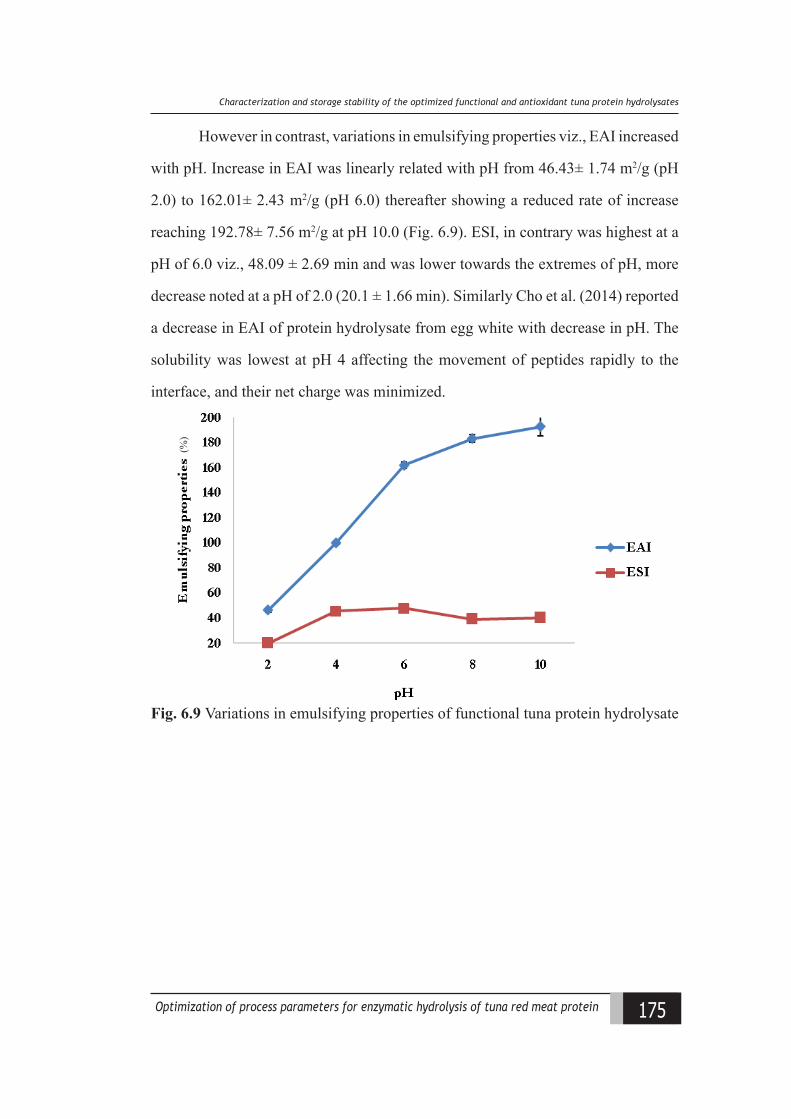
175Optimization of process parameters for enzymatic hydrolysis of tuna red meat protein
Charaateriiation and storage stalility of the optimiied funational and antioxidant tuna protein hydrolysates
However in contrast, variations in emulsifying properties viz., EAI increased
with pH. Increase in EAI was linearly related with pH from 46.43± 1.74 m2/g (pH
2.0) to 162.01± 2.43 m2/g (pH 6.0) thereafter showing a reduced rate of increase
reaching 192.78± 7.56 m2/g at pH 10.0 (Fig. 6.9). ESI, in contrary was highest at a
pH of 6.0 viz., 48.09 ± 2.69 min and was lower towards the extremes of pH, more
decrease noted at a pH of 2.0 (20.1 ± 1.66 min). Similarly Cho et al. (2014) reported
a decrease in EAI of protein hydrolysate from egg white with decrease in pH. The
solubility was lowest at pH 4 affecting the movement of peptides rapidly to the
interface, and their net charge was minimized.
(%)
Fig. 6.9 Variations in emulsifying properties of functional tuna protein hydrolysate
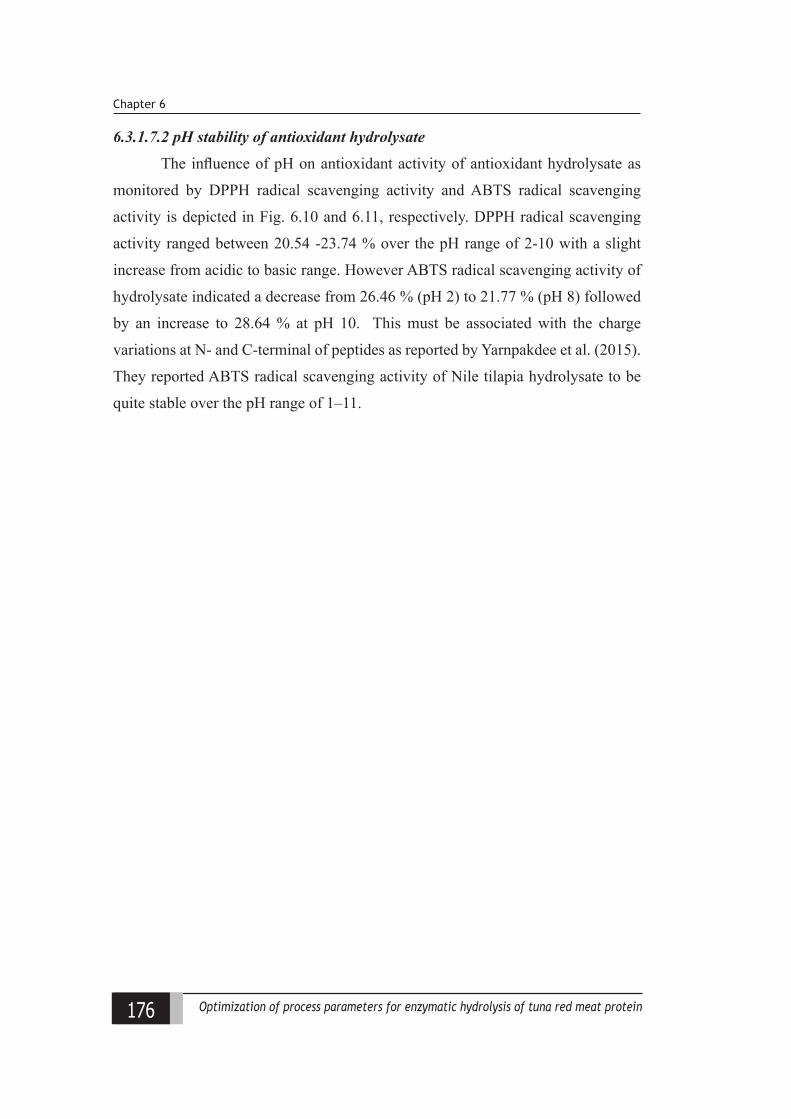
176 Optimization of process parameters for enzymatic hydrolysis of tuna red meat protein
Chapter 6
6.3.1.7.2 pH stability of antioxidant hydrolysate
The influence of pH on antioxidant activity of antioxidant hydrolysate as
monitored by DPPH radical scavenging activity and ABTS radical scavenging
activity is depicted in Fig. 6.10 and 6.11, respectively. DPPH radical scavenging
activity ranged between 20.54 -23.74 % over the pH range of 2-10 with a slight
increase from acidic to basic range. However ABTS radical scavenging activity of
hydrolysate indicated a decrease from 26.46 % (pH 2) to 21.77 % (pH 8) followed
by an increase to 28.64 % at pH 10. This must be associated with the charge
variations at N- and C-terminal of peptides as reported by Yarnpakdee et al. (2015).
They reported ABTS radical scavenging activity of Nile tilapia hydrolysate to be
quite stable over the pH range of 1–11.
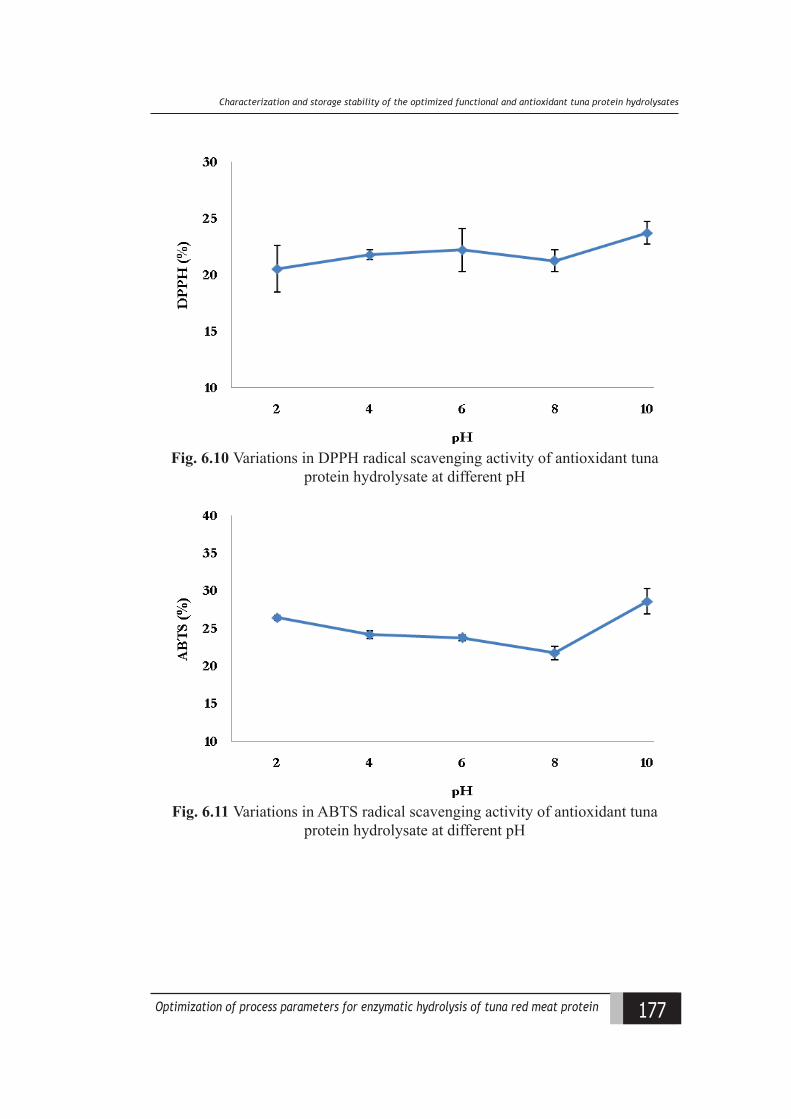
177Optimization of process parameters for enzymatic hydrolysis of tuna red meat protein
Charaateriiation and storage stalility of the optimiied funational and antioxidant tuna protein hydrolysates
Fig. 6.10 Variations in DPPH radical scavenging activity of antioxidant tuna protein hydrolysate at different pH
Fig. 6.11 Variations in ABTS radical scavenging activity of antioxidant tuna protein hydrolysate at different pH
178 Optimization of process parameters for enzymatic hydrolysis of tuna red meat protein
Chapter 6
6.3.1.7.3 Thermal stability of antioxidant hydrolysate
Thermal stability of the optimized hydrolysate indicated an increase in
DPPH radical scavenging activity by 6.55 % from 30 to 50oC thereafter maintained
a stable antioxidative potential ranging from 31.62 - 33.33 % upto 100oC (Fig. 6.12).
ABTS radical scavenging activity was reported to increase from 15.10 % at 30oC
to 24.10 % at 90oC thereafter abruptly decreased by 12.28 % on exposure to 100oC
(Fig. 6.13). This decrease reported must be due to the degradation or aggregation
of antioxidant peptide and the exposure of hydrophobic groups on account of heat
treatment. Yarnpakdee et al. (2015) reported ABTS radical scavenging and metal
chelating activities of Nile tilapia hydrolysate to remain constant when subjected
to the heating at 30–100 °C for 30 min. Reports suggest peptides with smaller
sizes to be more stable to aggregation at high temperature (Nalinanon et al., 2011).
The present study indicates the suitability of using this optimized hydrolysate as
antioxidant supplement in thermally processed foods as well as acidic foods.
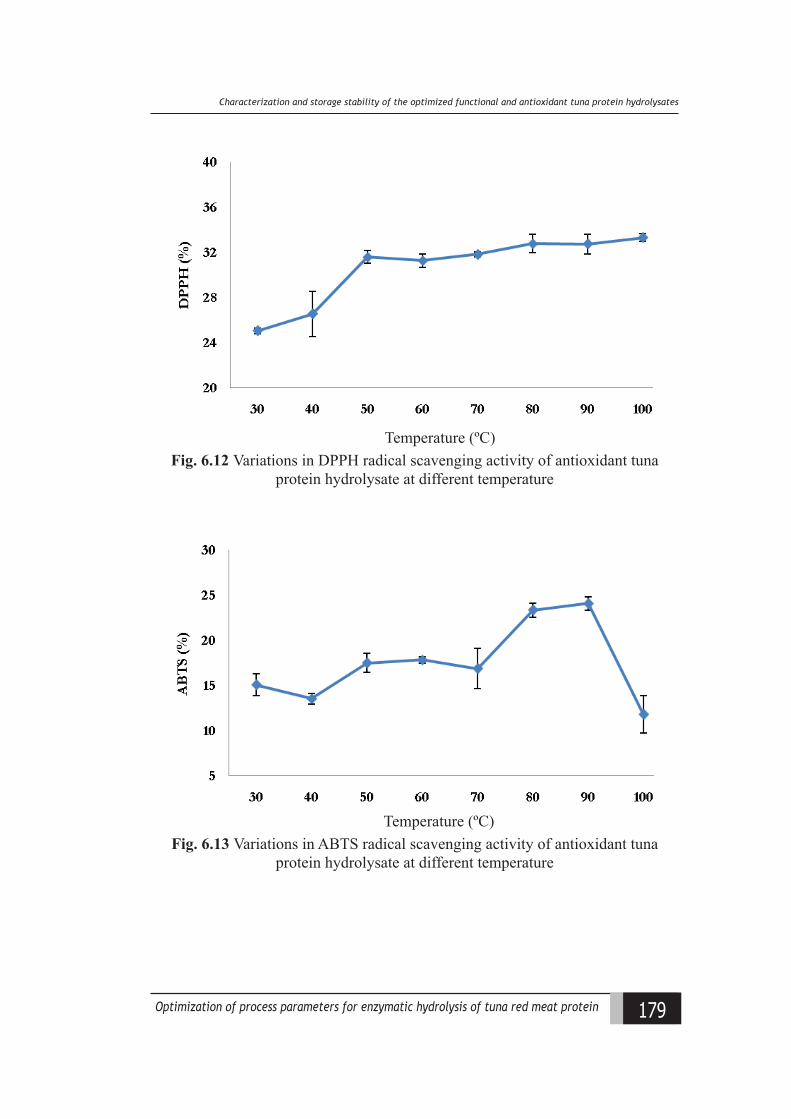
179Optimization of process parameters for enzymatic hydrolysis of tuna red meat protein
Charaateriiation and storage stalility of the optimiied funational and antioxidant tuna protein hydrolysates
Temperature (ºC)Fig. 6.12 Variations in DPPH radical scavenging activity of antioxidant tuna
protein hydrolysate at different temperature
Temperature (ºC)Fig. 6.13 Variations in ABTS radical scavenging activity of antioxidant tuna
protein hydrolysate at different temperature
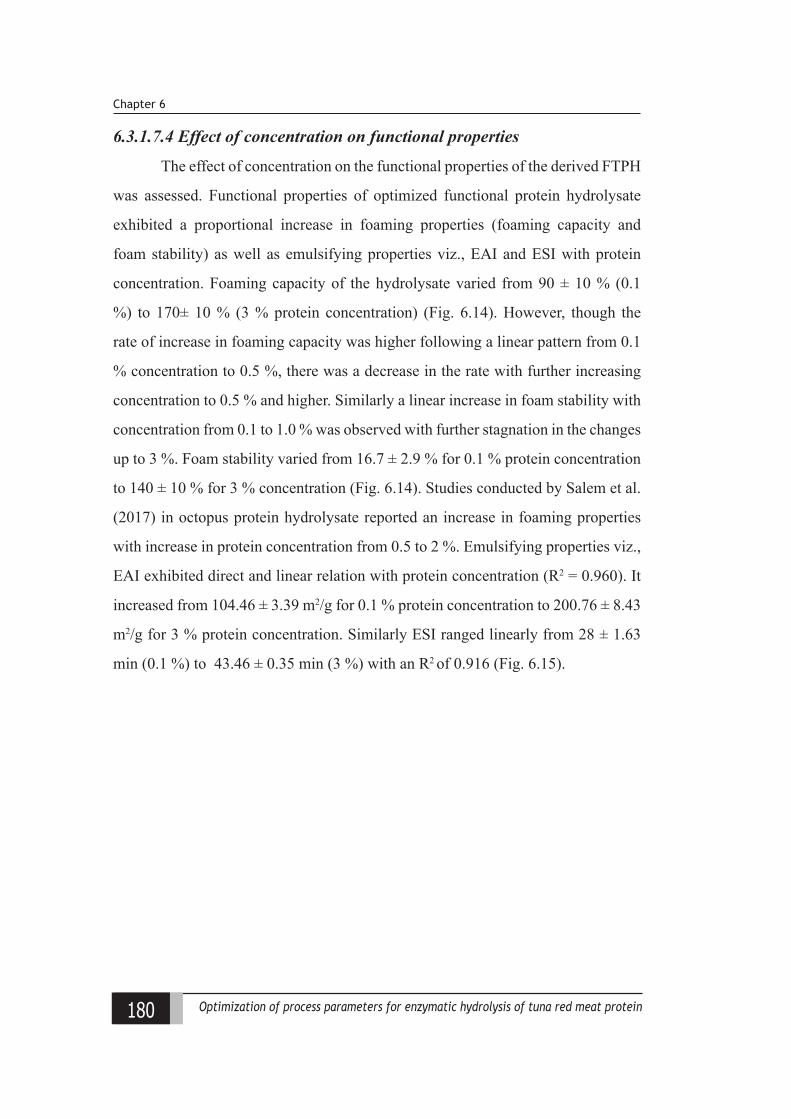
180 Optimization of process parameters for enzymatic hydrolysis of tuna red meat protein
Chapter 6
6.3.1.7.4 Effect of concentration on functional properties
The effect of concentration on the functional properties of the derived FTPH
was assessed. Functional properties of optimized functional protein hydrolysate
exhibited a proportional increase in foaming properties (foaming capacity and
foam stability) as well as emulsifying properties viz., EAI and ESI with protein
concentration. Foaming capacity of the hydrolysate varied from 90 ± 10 % (0.1
%) to 170± 10 % (3 % protein concentration) (Fig. 6.14). However, though the
rate of increase in foaming capacity was higher following a linear pattern from 0.1
% concentration to 0.5 %, there was a decrease in the rate with further increasing
concentration to 0.5 % and higher. Similarly a linear increase in foam stability with
concentration from 0.1 to 1.0 % was observed with further stagnation in the changes
up to 3 %. Foam stability varied from 16.7 ± 2.9 % for 0.1 % protein concentration
to 140 ± 10 % for 3 % concentration (Fig. 6.14). Studies conducted by Salem et al.
(2017) in octopus protein hydrolysate reported an increase in foaming properties
with increase in protein concentration from 0.5 to 2 %. Emulsifying properties viz.,
EAI exhibited direct and linear relation with protein concentration (R2 = 0.960). It
increased from 104.46 ± 3.39 m2/g for 0.1 % protein concentration to 200.76 ± 8.43
m2/g for 3 % protein concentration. Similarly ESI ranged linearly from 28 ± 1.63
min (0.1 %) to 43.46 ± 0.35 min (3 %) with an R2 of 0.916 (Fig. 6.15).
181Optimization of process parameters for enzymatic hydrolysis of tuna red meat protein
Charaateriiation and storage stalility of the optimiied funational and antioxidant tuna protein hydrolysates
(%)
(%)
Fig. 6.14 Variations in foaming properties of functional tuna protein hydrolysate at different concentration
(m2/g)
(min)
Fig. 6.15 Variations in emulsifying properties of functional tuna protein hydrolysate at different concentration
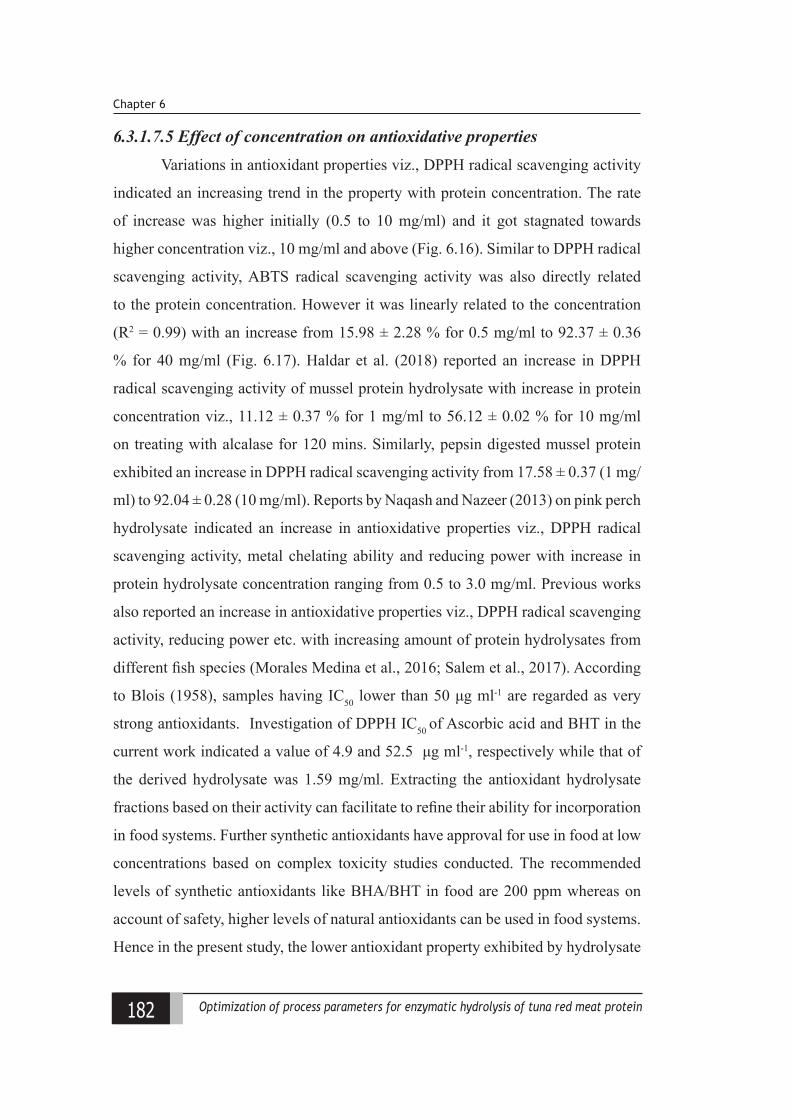
182 Optimization of process parameters for enzymatic hydrolysis of tuna red meat protein
Chapter 6
6.3.1.7.5 Effect of concentration on antioxidative propertiesVariations in antioxidant properties viz., DPPH radical scavenging activity
indicated an increasing trend in the property with protein concentration. The rate
of increase was higher initially (0.5 to 10 mg/ml) and it got stagnated towards
higher concentration viz., 10 mg/ml and above (Fig. 6.16). Similar to DPPH radical
scavenging activity, ABTS radical scavenging activity was also directly related
to the protein concentration. However it was linearly related to the concentration
(R2 = 0.99) with an increase from 15.98 ± 2.28 % for 0.5 mg/ml to 92.37 ± 0.36
% for 40 mg/ml (Fig. 6.17). Haldar et al. (2018) reported an increase in DPPH
radical scavenging activity of mussel protein hydrolysate with increase in protein
concentration viz., 11.12 ± 0.37 % for 1 mg/ml to 56.12 ± 0.02 % for 10 mg/ml
on treating with alcalase for 120 mins. Similarly, pepsin digested mussel protein
exhibited an increase in DPPH radical scavenging activity from 17.58 ± 0.37 (1 mg/
ml) to 92.04 ± 0.28 (10 mg/ml). Reports by Naqash and Nazeer (2013) on pink perch
hydrolysate indicated an increase in antioxidative properties viz., DPPH radical
scavenging activity, metal chelating ability and reducing power with increase in
protein hydrolysate concentration ranging from 0.5 to 3.0 mg/ml. Previous works
also reported an increase in antioxidative properties viz., DPPH radical scavenging
activity, reducing power etc. with increasing amount of protein hydrolysates from
different fish species (Morales Medina et al., 2016; Salem et al., 2017). According
to Blois (1958), samples having IC50 lower than 50 μg ml-1 are regarded as very
strong antioxidants. Investigation of DPPH IC50 of Ascorbic acid and BHT in the
current work indicated a value of 4.9 and 52.5 μg ml-1, respectively while that of
the derived hydrolysate was 1.59 mg/ml. Extracting the antioxidant hydrolysate
fractions based on their activity can facilitate to refine their ability for incorporation
in food systems. Further synthetic antioxidants have approval for use in food at low
concentrations based on complex toxicity studies conducted. The recommended
levels of synthetic antioxidants like BHA/BHT in food are 200 ppm whereas on
account of safety, higher levels of natural antioxidants can be used in food systems.
Hence in the present study, the lower antioxidant property exhibited by hydrolysate
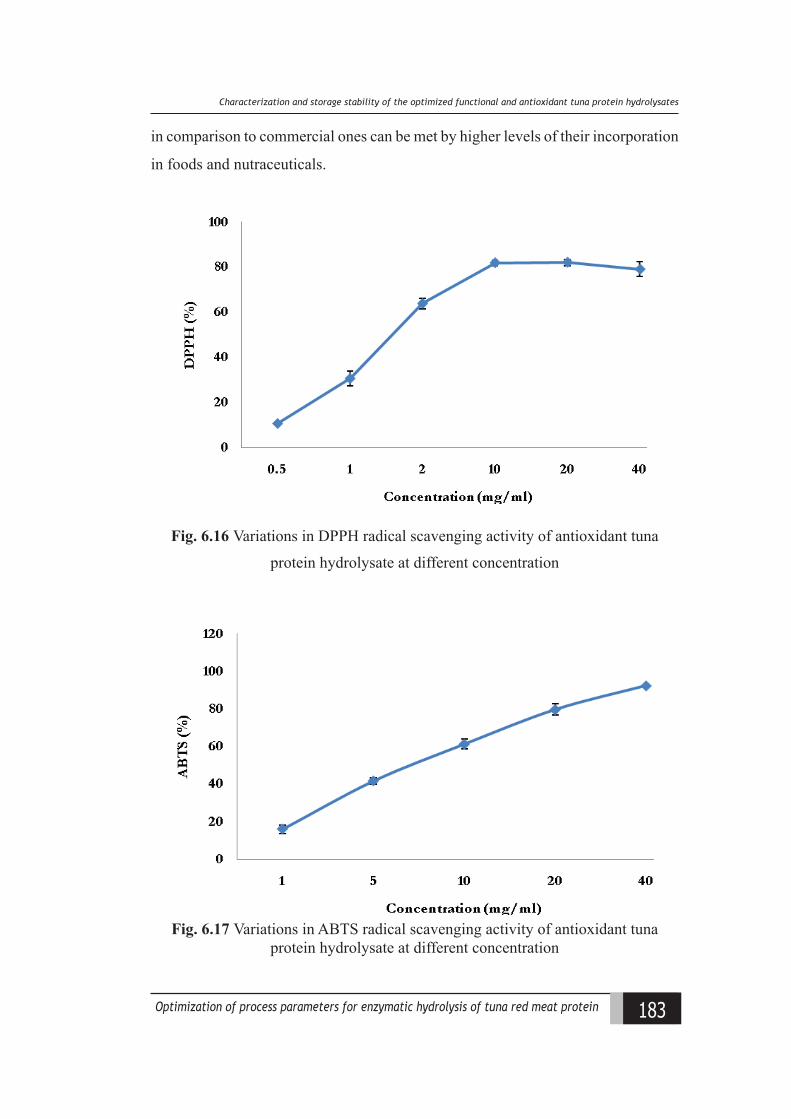
183Optimization of process parameters for enzymatic hydrolysis of tuna red meat protein
Charaateriiation and storage stalility of the optimiied funational and antioxidant tuna protein hydrolysates
in comparison to commercial ones can be met by higher levels of their incorporation
in foods and nutraceuticals.
Fig. 6.16 Variations in DPPH radical scavenging activity of antioxidant tuna
protein hydrolysate at different concentration
Fig. 6.17 Variations in ABTS radical scavenging activity of antioxidant tuna protein hydrolysate at different concentration
184 Optimization of process parameters for enzymatic hydrolysis of tuna red meat protein
Chapter 6
6.3.2 Storage stability studies
6.3.2.1 Moisture
Moisture content is one of several important parameters affecting stability
of products as it influences other physico-chemical parameters. Moisture content
is the combination of free and bound moisture present in a product. Under
unfavourable storage conditions, on account of the hygroscopic nature of protein
hydrolysate, moisture absorption occurs in the product which results in rapid
physical and chemical changes. In the present study, an increase in moisture content
was observed in both samples at both chilled and ambient conditions (Fig. 6.18;
Table 6.8). In FTPH, during the initial period, the variations in moisture content
were not significant but towards the fourth month there was a significant difference
was observed (p < 0.05) (Fig. 6.18a). Between the storage period also, there was no
significant difference till three months of storage. However, the increase was more
prominent at ambient conditions suggesting further possibilities of related physico-
chemical reactions to occur. In the case of ATPH, there was a significant increase
(p < 0.05) in the moisture content observed throughout the storage period, though
during initial chilled storage it was not prominent resulting in significant variations
between the samples stored under these two varying conditions (Fig. 6.18b).
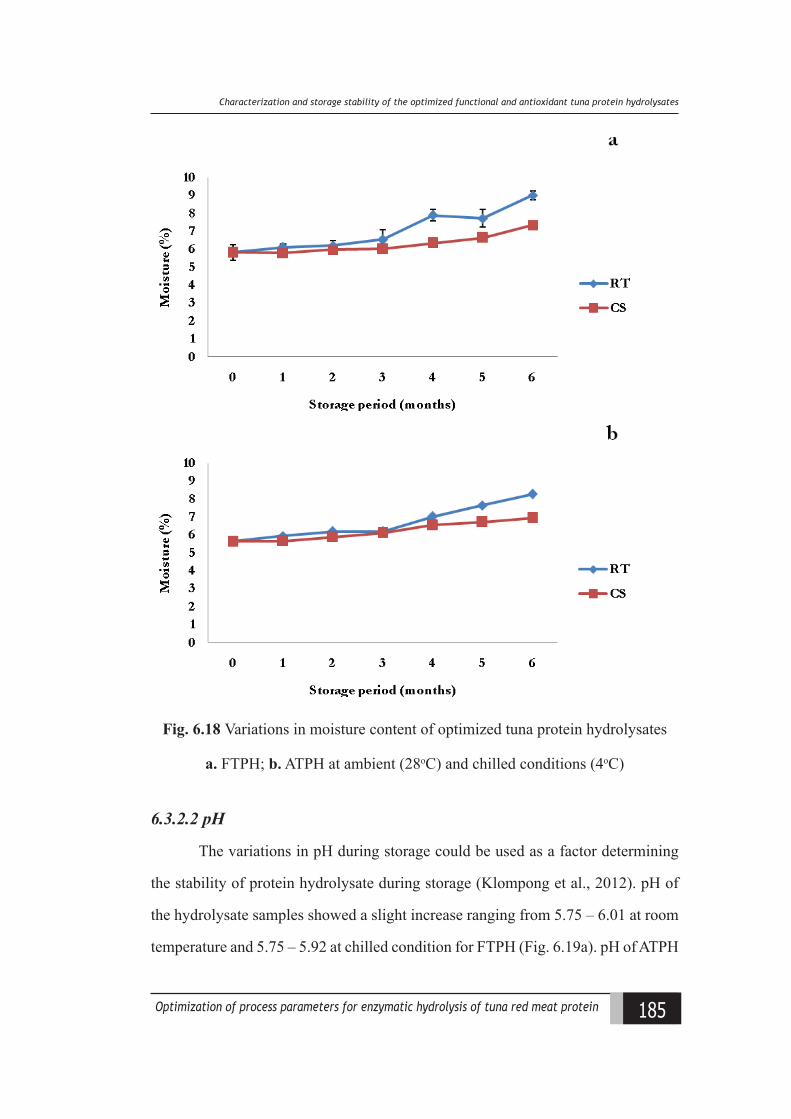
185Optimization of process parameters for enzymatic hydrolysis of tuna red meat protein
Charaateriiation and storage stalility of the optimiied funational and antioxidant tuna protein hydrolysates
Fig. 6.18 Variations in moisture content of optimized tuna protein hydrolysates
a. FTPH; b. ATPH at ambient (28oC) and chilled conditions (4oC)
6.3.2.2 pH
The variations in pH during storage could be used as a factor determining
the stability of protein hydrolysate during storage (Klompong et al., 2012). pH of
the hydrolysate samples showed a slight increase ranging from 5.75 – 6.01 at room
temperature and 5.75 – 5.92 at chilled condition for FTPH (Fig. 6.19a). pH of ATPH
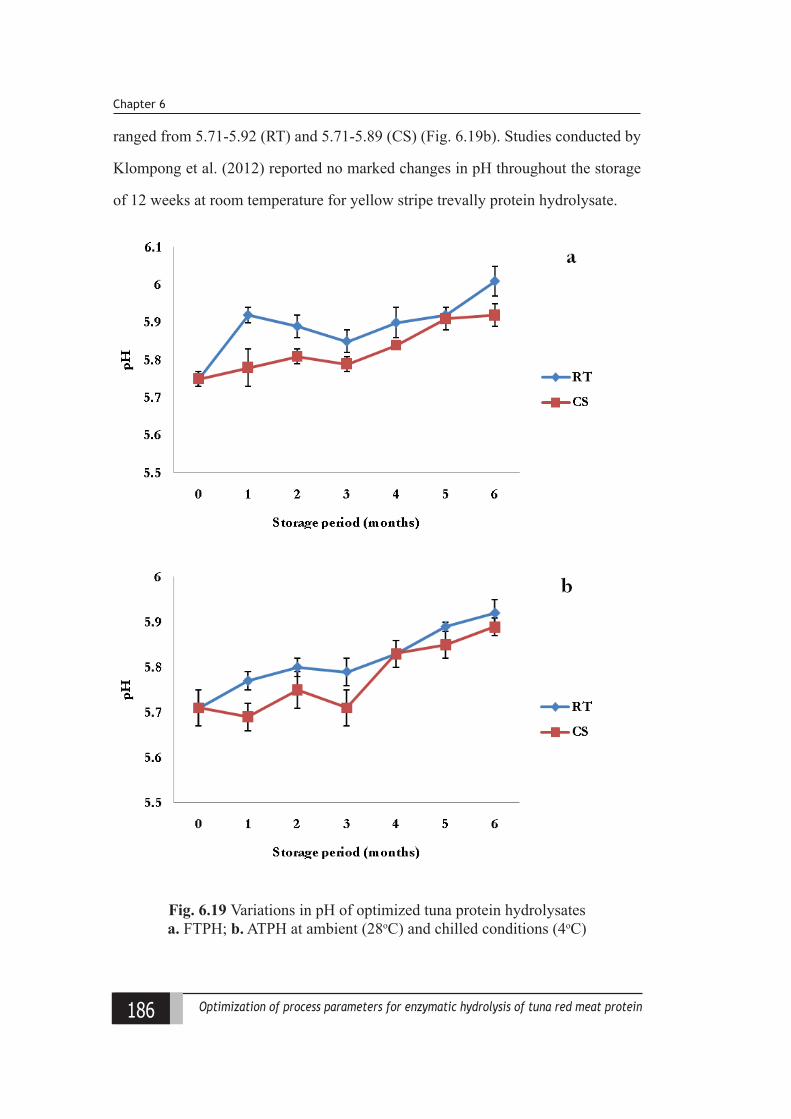
186 Optimization of process parameters for enzymatic hydrolysis of tuna red meat protein
Chapter 6
ranged from 5.71-5.92 (RT) and 5.71-5.89 (CS) (Fig. 6.19b). Studies conducted by
Klompong et al. (2012) reported no marked changes in pH throughout the storage
of 12 weeks at room temperature for yellow stripe trevally protein hydrolysate.
Fig. 6.19 Variations in pH of optimized tuna protein hydrolysates a. FTPH; b. ATPH at ambient (28oC) and chilled conditions (4oC)

187Optimization of process parameters for enzymatic hydrolysis of tuna red meat protein
Charaateriiation and storage stalility of the optimiied funational and antioxidant tuna protein hydrolysates
6.3.2.3 Colour
Colour variations in samples were observed to be more prominent during
ambient storage conditions (Table 6.8). Lightness values decreased (Fig. 6.20)
while a proportional increase in redness (Fig. 6.21) as well as yellowness (Fig.
6.22) was observed (p < 0.05). This was substantiated from the observations made
by Hoyle and Merritt (1994) who found that hydrolysates from herring exhibited
decrease in lightness and increase in yellowness indicating sample darkening during
storage. Studies conducted by Klompong et al. (2012) also indicated trevally protein
hydrolysate to exhibit a slight decrease in lightness while redness and yellowness
gradually increased during storage. The decrease in lightness and the increases in
redness and yellowness might be associated with non-enzymatic browning. The
formation of brown pigments might result from aldol condensation of carbonyls
produced from lipid oxidation upon reaction with basic groups in proteins via
Maillard reaction. In addition, the decrease in lightness was probably due to the
oxidation of myoglobin and the melanin pigment present in the sample. Authors have
reported nonenzymatic browning in different protein hydrolysates during storage at
medium to high aw and these changes to be dependent on storage temperature and
relative humidity (Rao and Labuza, 2012; Rao et al., 2012). Similar to the present
study, Thiansilakul et al. (2007a) observed yellowness of the protein hydrolysates
became more intense with storage time, being more pronounced at 25oC than at 4oC.
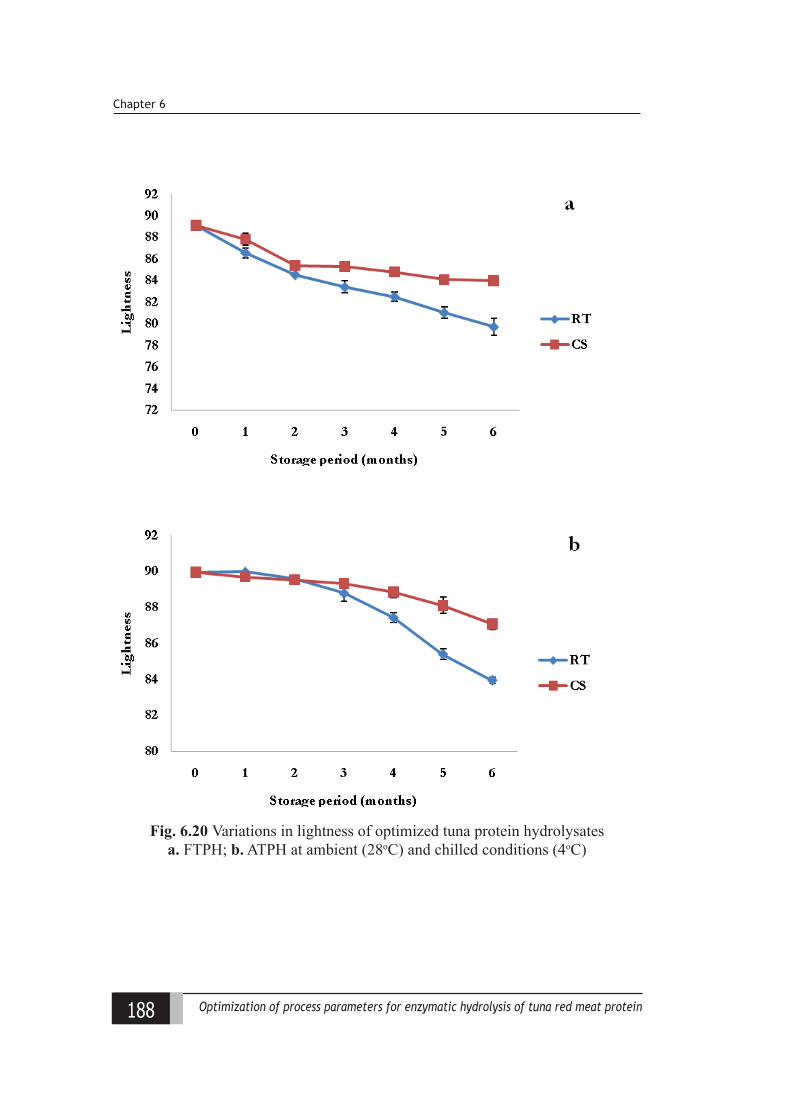
188 Optimization of process parameters for enzymatic hydrolysis of tuna red meat protein
Chapter 6
Fig. 6.20 Variations in lightness of optimized tuna protein hydrolysates a. FTPH; b. ATPH at ambient (28oC) and chilled conditions (4oC)
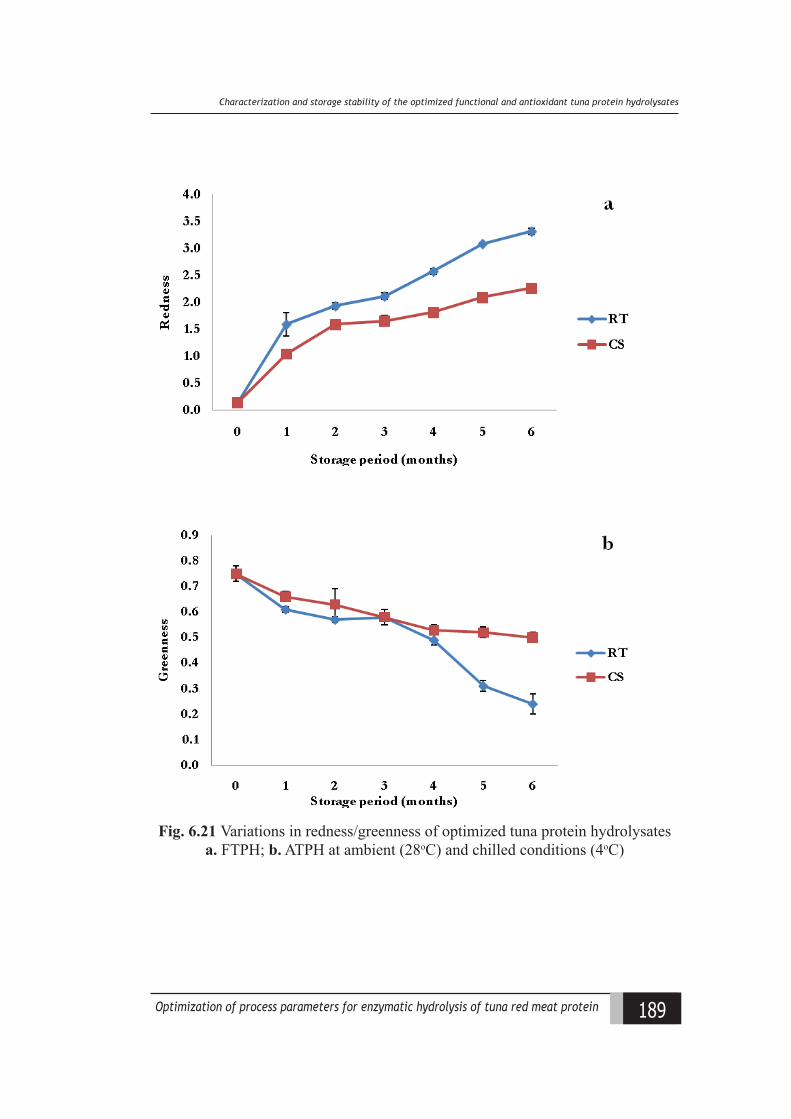
189Optimization of process parameters for enzymatic hydrolysis of tuna red meat protein
Charaateriiation and storage stalility of the optimiied funational and antioxidant tuna protein hydrolysates
Fig. 6.21 Variations in redness/greenness of optimized tuna protein hydrolysates a. FTPH; b. ATPH at ambient (28oC) and chilled conditions (4oC)
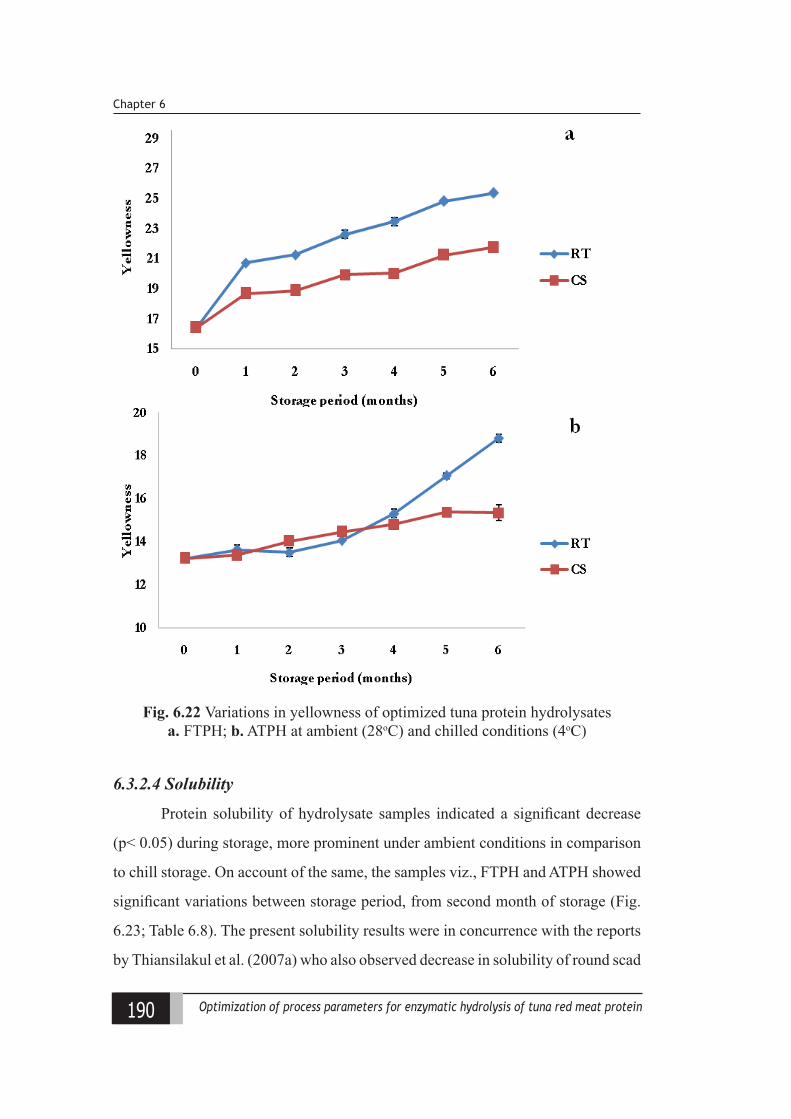
190 Optimization of process parameters for enzymatic hydrolysis of tuna red meat protein
Chapter 6
Fig. 6.22 Variations in yellowness of optimized tuna protein hydrolysates a. FTPH; b. ATPH at ambient (28oC) and chilled conditions (4oC)
6.3.2.4 Solubility
Protein solubility of hydrolysate samples indicated a significant decrease
(p< 0.05) during storage, more prominent under ambient conditions in comparison
to chill storage. On account of the same, the samples viz., FTPH and ATPH showed
significant variations between storage period, from second month of storage (Fig.
6.23; Table 6.8). The present solubility results were in concurrence with the reports
by Thiansilakul et al. (2007a) who also observed decrease in solubility of round scad
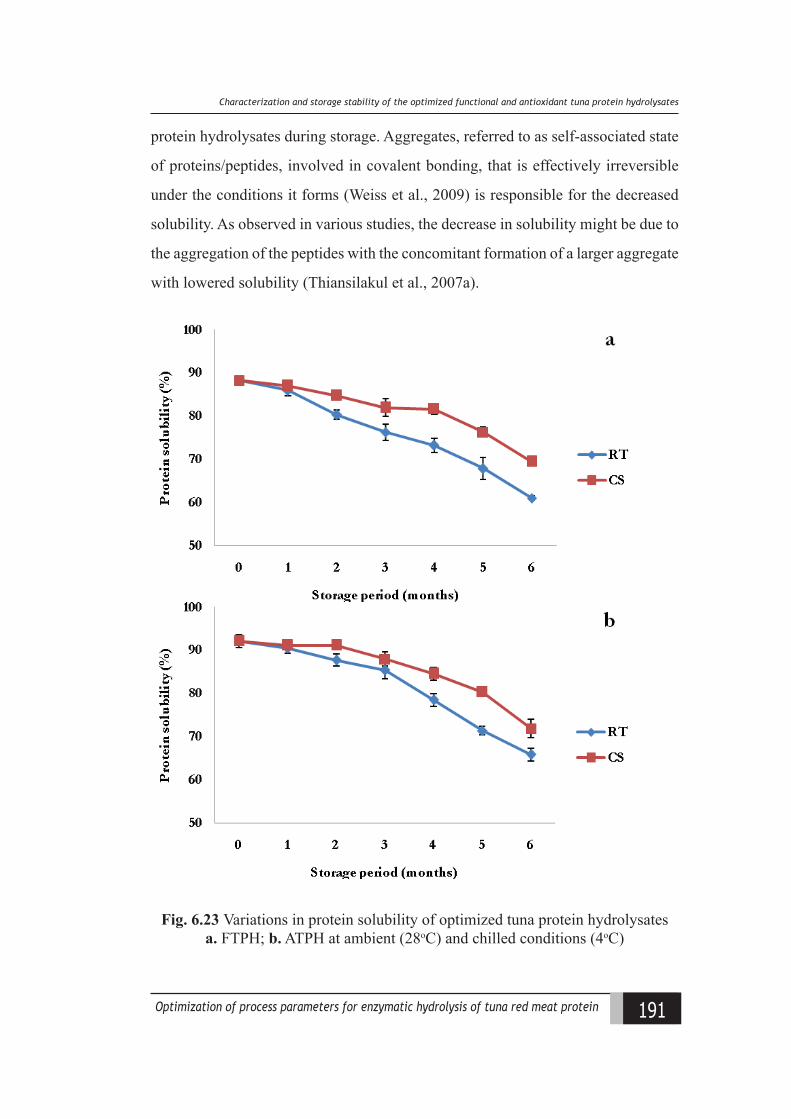
191Optimization of process parameters for enzymatic hydrolysis of tuna red meat protein
Charaateriiation and storage stalility of the optimiied funational and antioxidant tuna protein hydrolysates
protein hydrolysates during storage. Aggregates, referred to as self-associated state
of proteins/peptides, involved in covalent bonding, that is effectively irreversible
under the conditions it forms (Weiss et al., 2009) is responsible for the decreased
solubility. As observed in various studies, the decrease in solubility might be due to
the aggregation of the peptides with the concomitant formation of a larger aggregate
with lowered solubility (Thiansilakul et al., 2007a).
Fig. 6.23 Variations in protein solubility of optimized tuna protein hydrolysates a. FTPH; b. ATPH at ambient (28oC) and chilled conditions (4oC)
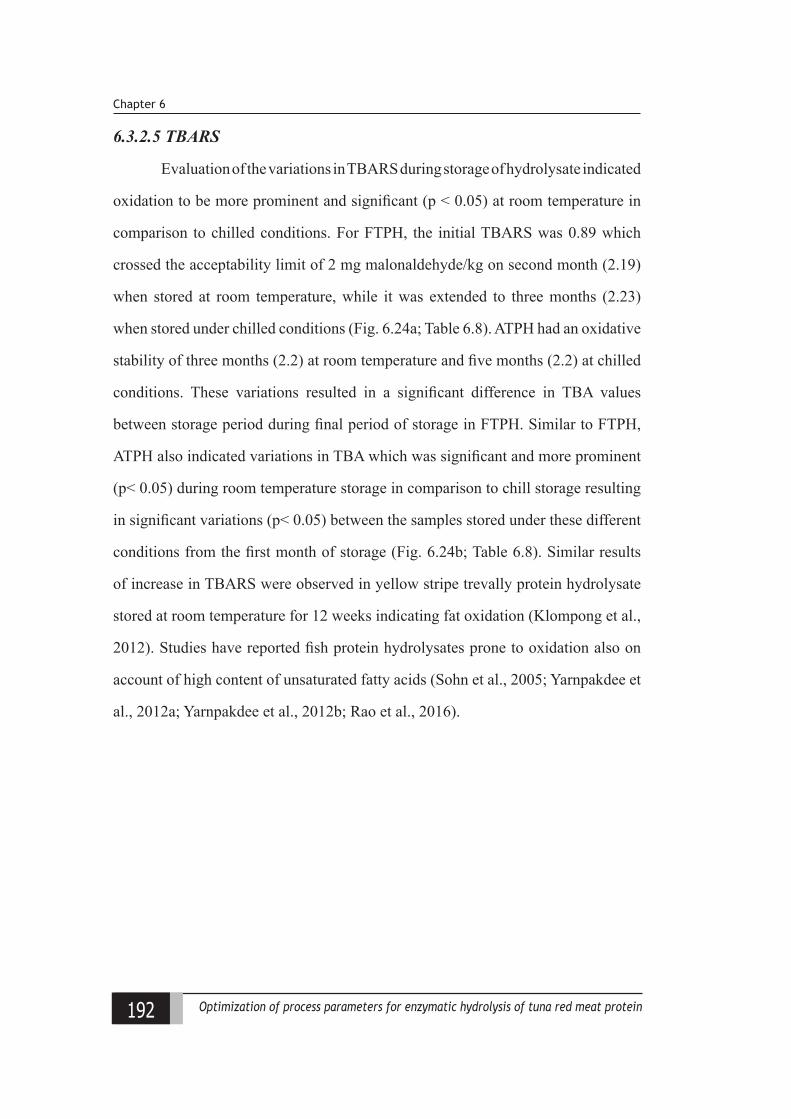
192 Optimization of process parameters for enzymatic hydrolysis of tuna red meat protein
Chapter 6
6.3.2.5 TBARS
Evaluation of the variations in TBARS during storage of hydrolysate indicated
oxidation to be more prominent and significant (p < 0.05) at room temperature in
comparison to chilled conditions. For FTPH, the initial TBARS was 0.89 which
crossed the acceptability limit of 2 mg malonaldehyde/kg on second month (2.19)
when stored at room temperature, while it was extended to three months (2.23)
when stored under chilled conditions (Fig. 6.24a; Table 6.8). ATPH had an oxidative
stability of three months (2.2) at room temperature and five months (2.2) at chilled
conditions. These variations resulted in a significant difference in TBA values
between storage period during final period of storage in FTPH. Similar to FTPH,
ATPH also indicated variations in TBA which was significant and more prominent
(p< 0.05) during room temperature storage in comparison to chill storage resulting
in significant variations (p< 0.05) between the samples stored under these different
conditions from the first month of storage (Fig. 6.24b; Table 6.8). Similar results
of increase in TBARS were observed in yellow stripe trevally protein hydrolysate
stored at room temperature for 12 weeks indicating fat oxidation (Klompong et al.,
2012). Studies have reported fish protein hydrolysates prone to oxidation also on
account of high content of unsaturated fatty acids (Sohn et al., 2005; Yarnpakdee et
al., 2012a; Yarnpakdee et al., 2012b; Rao et al., 2016).
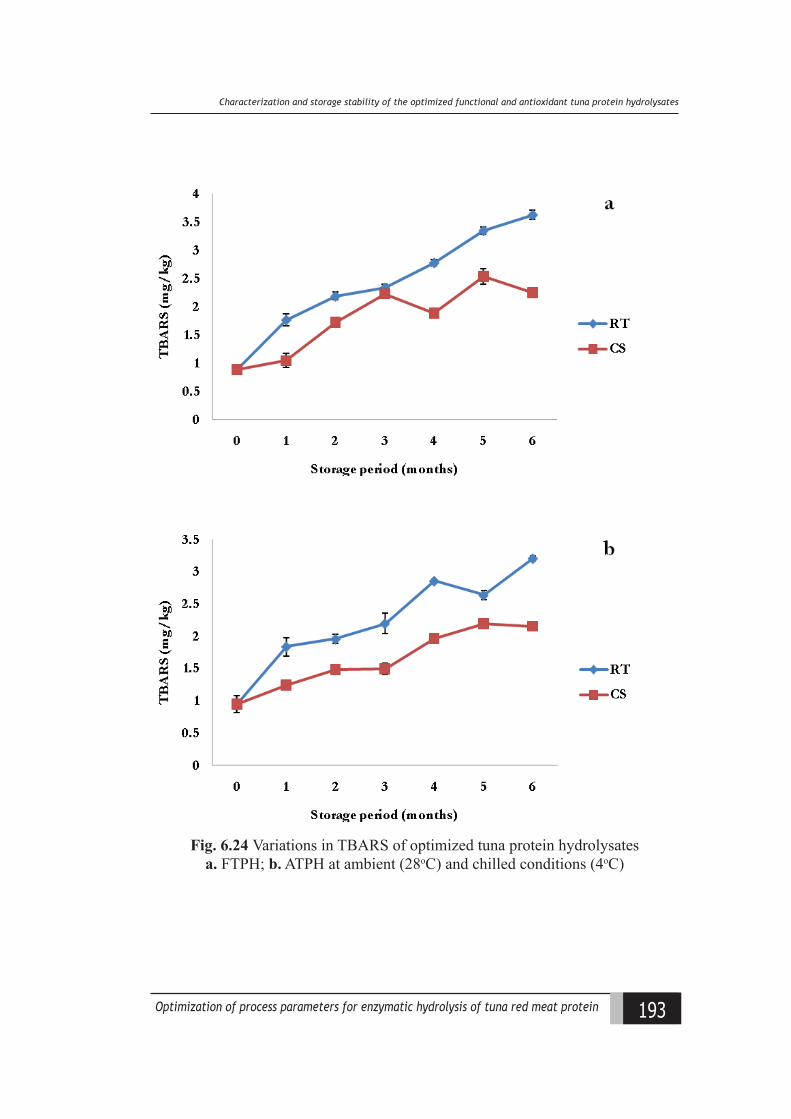
193Optimization of process parameters for enzymatic hydrolysis of tuna red meat protein
Charaateriiation and storage stalility of the optimiied funational and antioxidant tuna protein hydrolysates
Fig. 6.24 Variations in TBARS of optimized tuna protein hydrolysates a. FTPH; b. ATPH at ambient (28oC) and chilled conditions (4oC)
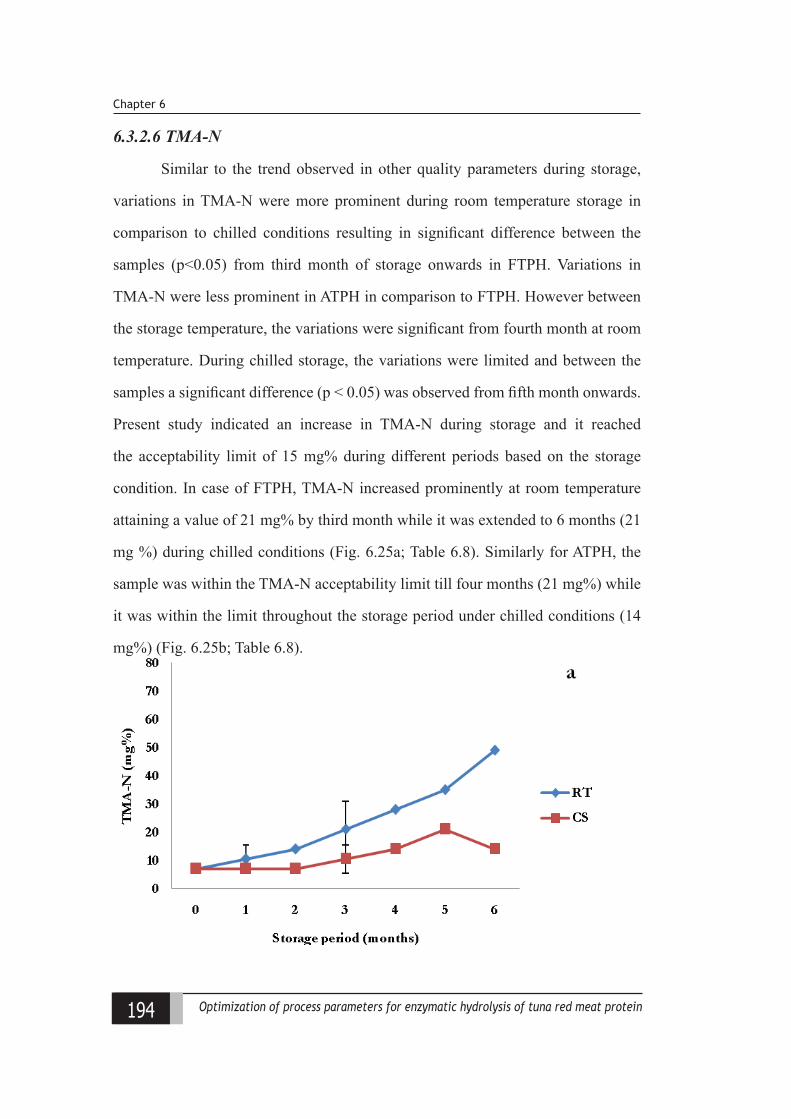
194 Optimization of process parameters for enzymatic hydrolysis of tuna red meat protein
Chapter 6
6.3.2.6 TMA-N
Similar to the trend observed in other quality parameters during storage,
variations in TMA-N were more prominent during room temperature storage in
comparison to chilled conditions resulting in significant difference between the
samples (p<0.05) from third month of storage onwards in FTPH. Variations in
TMA-N were less prominent in ATPH in comparison to FTPH. However between
the storage temperature, the variations were significant from fourth month at room
temperature. During chilled storage, the variations were limited and between the
samples a significant difference (p < 0.05) was observed from fifth month onwards.
Present study indicated an increase in TMA-N during storage and it reached
the acceptability limit of 15 mg% during different periods based on the storage
condition. In case of FTPH, TMA-N increased prominently at room temperature
attaining a value of 21 mg% by third month while it was extended to 6 months (21
mg %) during chilled conditions (Fig. 6.25a; Table 6.8). Similarly for ATPH, the
sample was within the TMA-N acceptability limit till four months (21 mg%) while
it was within the limit throughout the storage period under chilled conditions (14
mg%) (Fig. 6.25b; Table 6.8).
195Optimization of process parameters for enzymatic hydrolysis of tuna red meat protein
Charaateriiation and storage stalility of the optimiied funational and antioxidant tuna protein hydrolysates
Fig. 6.25 Variations in TMA-N of optimized tuna protein hydrolysates a. FTPH; b. ATPH at ambient (28oC) and chilled conditions (4oC)
6.3.2.7 Sensory indices
There was a significant reduction in sensory score for FTPH stored at room
temperature (p<0.05) whereas the reduction was not significant upto third month
under chilled conditions (Table 6.8). On account of this reduction, a significant
difference in the sensory score was noticed between samples stored under the
different storage conditions from first month onwards. Sensory scores ranged from
7.0 ± 0.47 to 2.0 ± 1.16 (RT) and 7.0 ± 0.47 to 5.0 ± 0.82 (CS) for FTPH (Fig. 6.26a;
Table 6.8) while it varied from 6.0 ± 1.33 to 2.0 ± 0.67 (RT) and 6.0 ± 1.33 to 4.0 ±
1.16 (CS) for ATPH (Fig. 6.26b). Results indicated an acceptability period of two
months and five months for FTPH stored under ambient and chilled conditions,
respectively. ATPH exhibited an acceptance of one month and three months under
ambient and chilled conditions, respectively based on sensory score.
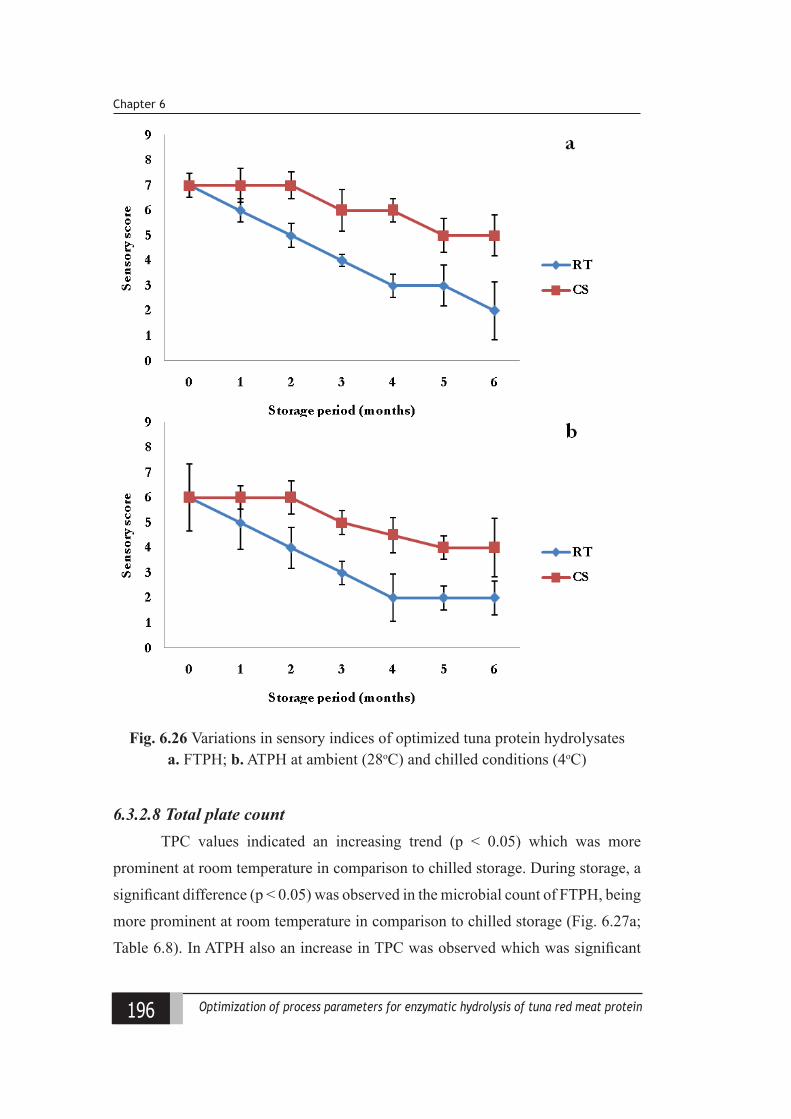
196 Optimization of process parameters for enzymatic hydrolysis of tuna red meat protein
Chapter 6
Fig. 6.26 Variations in sensory indices of optimized tuna protein hydrolysates a. FTPH; b. ATPH at ambient (28oC) and chilled conditions (4oC)
6.3.2.8 Total plate countTPC values indicated an increasing trend (p < 0.05) which was more
prominent at room temperature in comparison to chilled storage. During storage, a
significant difference (p < 0.05) was observed in the microbial count of FTPH, being
more prominent at room temperature in comparison to chilled storage (Fig. 6.27a;
Table 6.8). In ATPH also an increase in TPC was observed which was significant
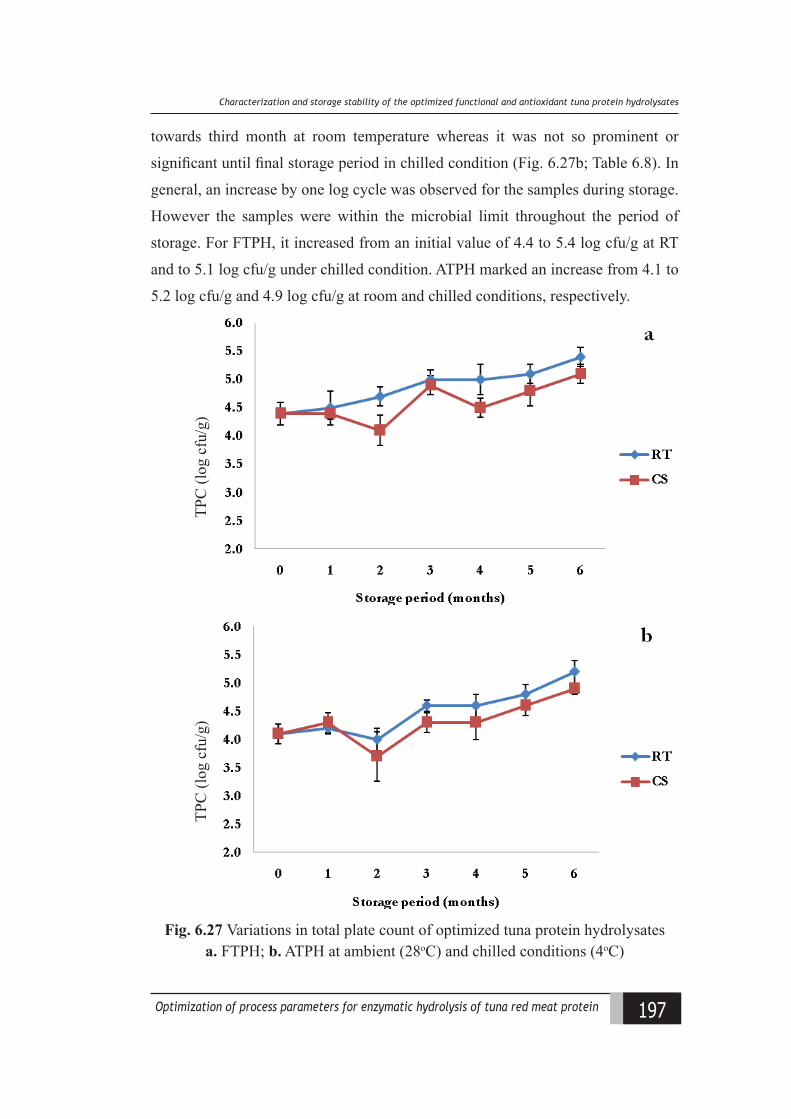
197Optimization of process parameters for enzymatic hydrolysis of tuna red meat protein
Charaateriiation and storage stalility of the optimiied funational and antioxidant tuna protein hydrolysates
towards third month at room temperature whereas it was not so prominent or
significant until final storage period in chilled condition (Fig. 6.27b; Table 6.8). In
general, an increase by one log cycle was observed for the samples during storage.
However the samples were within the microbial limit throughout the period of
storage. For FTPH, it increased from an initial value of 4.4 to 5.4 log cfu/g at RT
and to 5.1 log cfu/g under chilled condition. ATPH marked an increase from 4.1 to
5.2 log cfu/g and 4.9 log cfu/g at room and chilled conditions, respectively.
TPC
(log
cfu
/g)
TPC
(log
cfu
/g)
Fig. 6.27 Variations in total plate count of optimized tuna protein hydrolysates a. FTPH; b. ATPH at ambient (28oC) and chilled conditions (4oC)
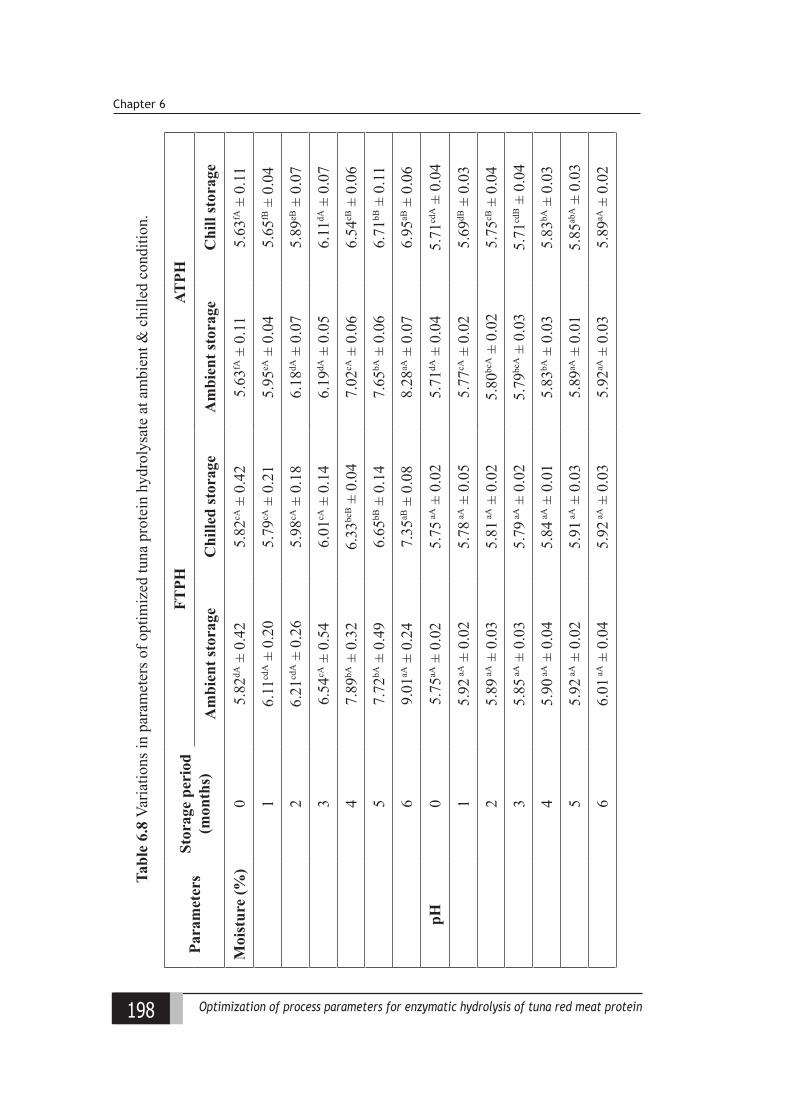
198 Optimization of process parameters for enzymatic hydrolysis of tuna red meat protein
Chapter 6
Para
met
ers
Stor
age
peri
od
(mon
ths)
FTPH
ATPH
Am
bien
t sto
rage
Chi
lled
stor
age
Am
bien
t sto
rage
Chi
ll st
orag
e
Moi
stur
e (%
) 0
5.82
dA ±
0.4
25.
82cA
± 0
.42
5.63
fA ±
0.1
15.
63fA
± 0
.11
16.
11cd
A ±
0.2
05.
79cA
± 0
.21
5.95
eA ±
0.0
45.
65fB
± 0
.04
26.
21cd
A ±
0.2
65.
98cA
± 0
.18
6.18
dA ±
0.0
75.
89eB
± 0
.07
36.
54cA
± 0
.54
6.01
cA ±
0.1
46.
19dA
± 0
.05
6.11
dA ±
0.0
7
47.
89bA
± 0
.32
6.33
bcB ±
0.0
47.
02cA
± 0
.06
6.54
cB ±
0.0
6
57.
72bA
± 0
.49
6.65
bB ±
0.1
47.
65bA
± 0
.06
6.71
bB ±
0.1
1
69.
01aA
± 0
.24
7.35
aB ±
0.0
88.
28aA
± 0
.07
6.95
aB ±
0.0
6
pH
05.
75aA
± 0
.02
5.75
aA ±
0.0
25.
71dA
± 0
.04
5.71
cdA ±
0.0
4
15.
92 a
A ±
0.0
25.
78 a
A ±
0.0
55.
77cA
± 0
.02
5.69
dB ±
0.0
3
25.
89 a
A ±
0.0
35.
81 a
A ±
0.0
25.
80bc
A ±
0.0
25.
75cB
± 0
.04
35.
85 a
A ±
0.0
35.
79 a
A ±
0.0
25.
79bc
A ±
0.0
35.
71cd
B ±
0.0
4
45.
90 a
A ±
0.0
45.
84 a
A ±
0.0
15.
83bA
± 0
.03
5.83
bA ±
0.0
3
55.
92 a
A ±
0.0
25.
91 a
A ±
0.0
35.
89aA
± 0
.01
5.85
abA ±
0.0
3
66.
01 a
A ±
0.0
45.
92 a
A ±
0.0
35.
92aA
± 0
.03
5.89
aA ±
0.0
2
Tabl
e 6.
8 Va
riatio
ns in
par
amet
ers o
f opt
imiz
ed tu
na p
rote
in h
ydro
lysa
te a
t am
bien
t & c
hille
d co
nditi
on.
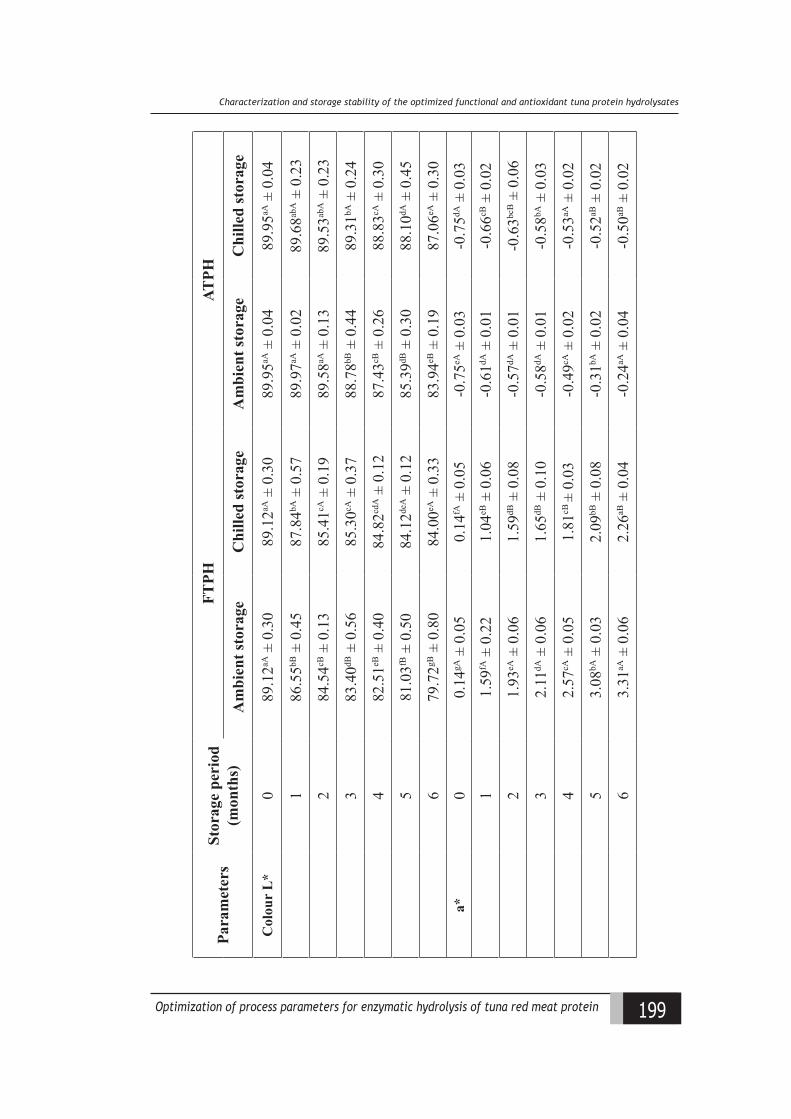
199Optimization of process parameters for enzymatic hydrolysis of tuna red meat protein
Charaateriiation and storage stalility of the optimiied funational and antioxidant tuna protein hydrolysates
Para
met
ers
Stor
age
peri
od
(mon
ths)
FTPH
ATPH
Am
bien
t sto
rage
Chi
lled
stor
age
Am
bien
t sto
rage
Chi
lled
stor
age
Col
our
L*
089
.12aA
± 0
.30
89.1
2aA ±
0.3
089
.95aA
± 0
.04
89.9
5aA ±
0.0
4
186
.55bB
± 0
.45
87.8
4bA ±
0.5
789
.97aA
± 0
.02
89.6
8abA ±
0.2
3
284
.54cB
± 0
.13
85.4
1cA ±
0.1
989
.58aA
± 0
.13
89.5
3abA ±
0.2
3
383
.40dB
± 0
.56
85.3
0cA ±
0.3
788
.78bB
± 0
.44
89.3
1bA ±
0.2
4
482
.51eB
± 0
.40
84.8
2cdA ±
0.1
287
.43cB
± 0
.26
88.8
3cA ±
0.3
0
581
.03fB
± 0
.50
84.1
2deA ±
0.1
285
.39dB
± 0
.30
88.1
0dA ±
0.4
5
679
.72gB
± 0
.80
84.0
0eA ±
0.3
383
.94eB
± 0
.19
87.0
6eA ±
0.3
0
a*0
0.14
gA ±
0.0
50.
14fA
± 0
.05
-0.7
5eA ±
0.0
3-0
.75dA
± 0
.03
11.
59fA
± 0
.22
1.04
eB ±
0.0
6-0
.61dA
± 0
.01
-0.6
6cB ±
0.0
2
21.
93eA
± 0
.06
1.59
dB ±
0.0
8-0
.57dA
± 0
.01
-0.6
3bcB ±
0.0
6
32.
11dA
± 0
.06
1.65
dB ±
0.1
0-0
.58dA
± 0
.01
-0.5
8bA ±
0.0
3
42.
57cA
± 0
.05
1.81
cB ±
0.0
3-0
.49cA
± 0
.02
-0.5
3aA ±
0.0
2
53.
08bA
± 0
.03
2.09
bB ±
0.0
8-0
.31bA
± 0
.02
-0.5
2aB ±
0.0
2
63.
31aA
± 0
.06
2.26
aB ±
0.0
4-0
.24aA
± 0
.04
-0.5
0aB ±
0.0
2
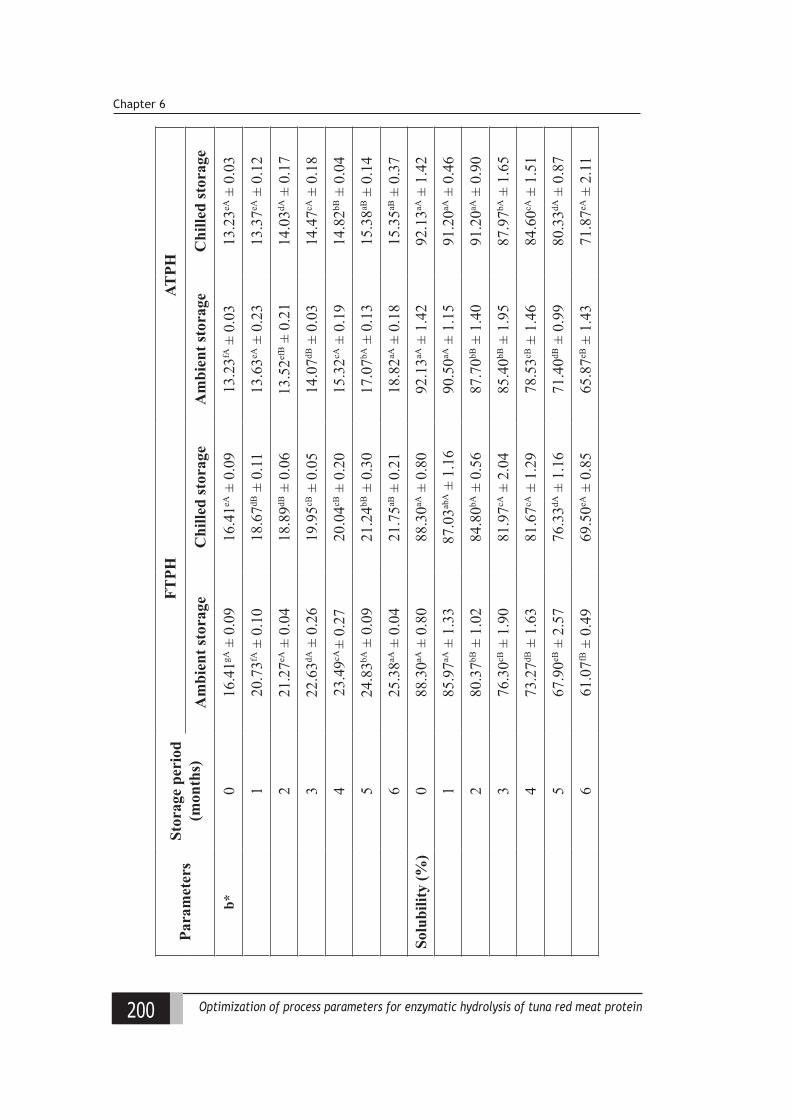
200 Optimization of process parameters for enzymatic hydrolysis of tuna red meat protein
Chapter 6
Para
met
ers
Stor
age
peri
od
(mon
ths)
FTPH
ATPH
Am
bien
t sto
rage
Chi
lled
stor
age
Am
bien
t sto
rage
Chi
lled
stor
age
b*0
16.4
1gA ±
0.0
916
.41eA
± 0
.09
13.2
3fA ±
0.0
313
.23eA
± 0
.03
120
.73fA
± 0
.10
18.6
7dB ±
0.1
113
.63eA
± 0
.23
13.3
7eA ±
0.1
2
221
.27eA
± 0
.04
18.8
9dB ±
0.0
613
.52ef
B ±
0.2
114
.03dA
± 0
.17
322
.63dA
± 0
.26
19.9
5cB ±
0.0
514
.07dB
± 0
.03
14.4
7cA ±
0.1
8
423
.49cA
± 0
.27
20.0
4cB ±
0.2
015
.32cA
± 0
.19
14.8
2bB ±
0.0
4
524
.83bA
± 0
.09
21.2
4bB ±
0.3
017
.07bA
± 0
.13
15.3
8aB ±
0.1
4
625
.38aA
± 0
.04
21.7
5aB ±
0.2
118
.82aA
± 0
.18
15.3
5aB ±
0.3
7
Solu
bilit
y (%
)0
88.3
0aA ±
0.8
088
.30aA
± 0
.80
92.1
3aA ±
1.4
292
.13aA
± 1
.42
185
.97aA
± 1
.33
87.0
3abA ±
1.1
690
.50aA
± 1
.15
91.2
0aA ±
0.4
6
280
.37bB
± 1
.02
84.8
0bA ±
0.5
687
.70bB
± 1
.40
91.2
0aA ±
0.9
0
376
.30cB
± 1
.90
81.9
7cA ±
2.0
485
.40bB
± 1
.95
87.9
7bA ±
1.6
5
473
.27dB
± 1
.63
81.6
7cA ±
1.2
978
.53cB
± 1
.46
84.6
0cA ±
1.5
1
567
.90eB
± 2
.57
76.3
3dA ±
1.1
671
.40dB
± 0
.99
80.3
3dA ±
0.8
7
661
.07fB
± 0
.49
69.5
0eA ±
0.8
565
.87eB
± 1
.43
71.8
7eA ±
2.1
1
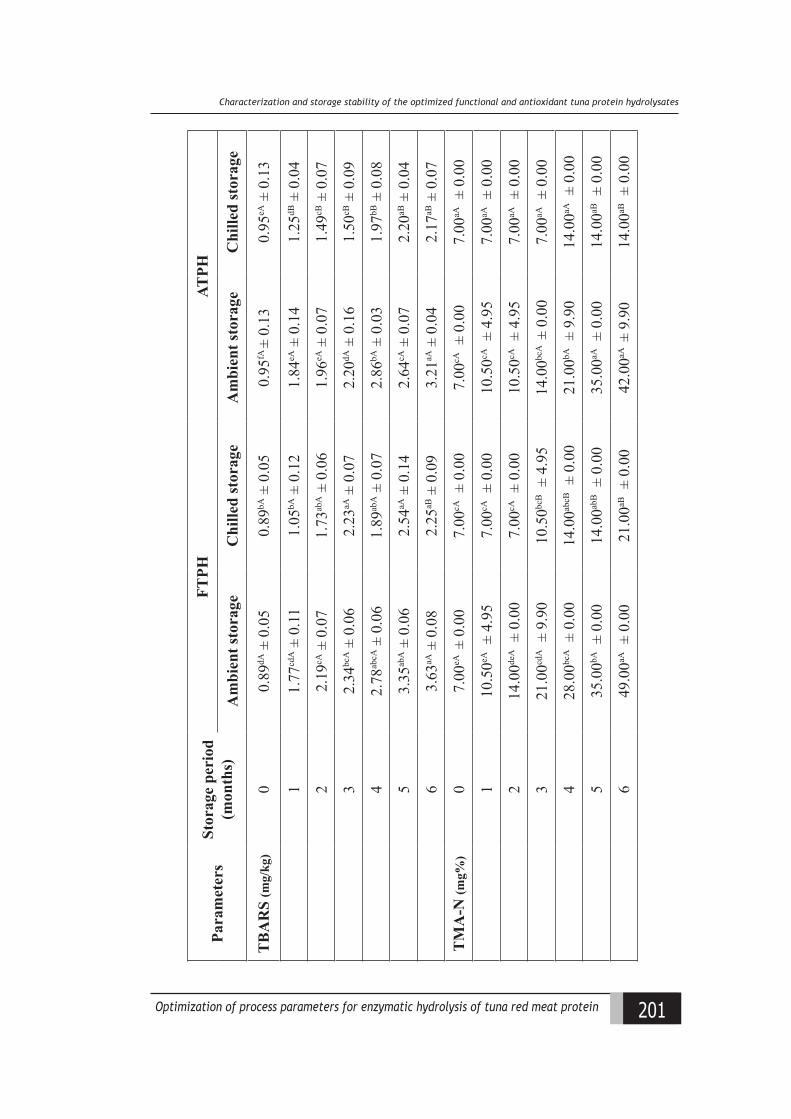
201Optimization of process parameters for enzymatic hydrolysis of tuna red meat protein
Charaateriiation and storage stalility of the optimiied funational and antioxidant tuna protein hydrolysates
Para
met
ers
Stor
age
peri
od
(mon
ths)
FTPH
ATPH
Am
bien
t sto
rage
Chi
lled
stor
age
Am
bien
t sto
rage
Chi
lled
stor
age
TB
AR
S (m
g/kg
) 0
0.89
dA ±
0.0
50.
89bA
± 0
.05
0.95
fA ±
0.1
30.
95eA
± 0
.13
11.
77cd
A ±
0.1
11.
05bA
± 0
.12
1.84
eA ±
0.1
41.
25dB
± 0
.04
22.
19cA
± 0
.07
1.73
abA ±
0.0
61.
96eA
± 0
.07
1.49
cB ±
0.0
7
32.
34bc
A ±
0.0
62.
23aA
± 0
.07
2.20
dA ±
0.1
61.
50cB
± 0
.09
42.
78ab
cA ±
0.0
61.
89ab
A ±
0.0
72.
86bA
± 0
.03
1.97
bB ±
0.0
8
53.
35ab
A ±
0.0
62.
54aA
± 0
.14
2.64
cA ±
0.0
72.
20aB
± 0
.04
63.
63aA
± 0
.08
2.25
aB ±
0.0
93.
21aA
± 0
.04
2.17
aB ±
0.0
7
TM
A-N
(mg%
) 0
7.00
eA ±
0.0
07.
00cA
± 0
.00
7.00
cA ±
0.0
07.
00aA
± 0
.00
110
.50eA
± 4
.95
7.00
cA ±
0.0
010
.50cA
± 4
.95
7.00
aA ±
0.0
0
214
.00de
A ±
0.0
07.
00cA
± 0
.00
10.5
0cA ±
4.9
57.
00aA
± 0
.00
321
.00cd
A ±
9.9
010
.50bc
B ±
4.9
514
.00bc
A ±
0.0
07.
00aA
± 0
.00
428
.00bc
A ±
0.0
014
.00ab
cB ±
0.0
021
.00bA
± 9
.90
14.0
0aA ±
0.0
0
535
.00bA
± 0
.00
14.0
0abB ±
0.0
035
.00aA
± 0
.00
14.0
0aB ±
0.0
0
649
.00aA
± 0
.00
21.0
0aB ±
0.0
042
.00aA
± 9
.90
14.0
0aB ±
0.0
0
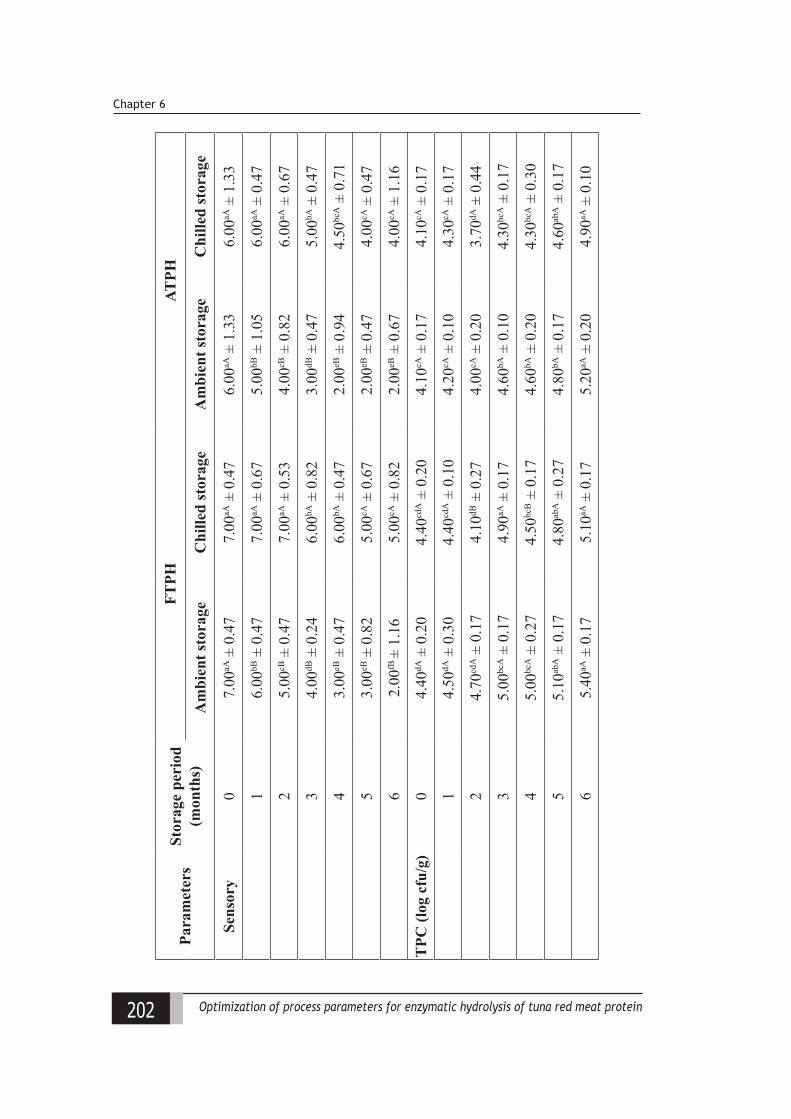
202 Optimization of process parameters for enzymatic hydrolysis of tuna red meat protein
Chapter 6
Para
met
ers
Stor
age
peri
od
(mon
ths)
FTPH
ATPH
Am
bien
t sto
rage
Chi
lled
stor
age
Am
bien
t sto
rage
Chi
lled
stor
age
Sens
ory
07.
00aA
± 0
.47
7.00
aA ±
0.4
76.
00aA
± 1
.33
6.00
aA ±
1.3
3
16.
00bB
± 0
.47
7.00
aA ±
0.6
75.
00bB
± 1
.05
6.00
aA ±
0.4
7
25.
00cB
± 0
.47
7.00
aA ±
0.5
34.
00cB
± 0
.82
6.00
aA ±
0.6
7
34.
00dB
± 0
.24
6.00
bA ±
0.8
23.
00dB
± 0
.47
5.00
bA ±
0.4
7
43.
00eB
± 0
.47
6.00
bA ±
0.4
72.
00eB
± 0
.94
4.50
bcA ±
0.7
1
53.
00eB
± 0
.82
5.00
cA ±
0.6
72.
00eB
± 0
.47
4.00
cA ±
0.4
7
62.
00fB
± 1
.16
5.00
cA ±
0.8
22.
00eB
± 0
.67
4.00
cA ±
1.1
6
TPC
(log
cfu
/g)
04.
40dA
± 0
.20
4.40
cdA ±
0.2
04.
10cA
± 0
.17
4.10
cA ±
0.1
7
14.
50dA
± 0
.30
4.40
cdA ±
0.1
04.
20cA
± 0
.10
4.30
cA ±
0.1
7
24.
70cd
A ±
0.1
74.
10dB
± 0
.27
4.00
cA ±
0.2
03.
70dA
± 0
.44
35.
00bc
A ±
0.1
74.
90aA
± 0
.17
4.60
bA ±
0.1
04.
30bc
A ±
0.1
7
45.
00bc
A ±
0.2
74.
50bc
B ±
0.1
74.
60bA
± 0
.20
4.30
bcA ±
0.3
0
55.
10ab
A ±
0.1
74.
80ab
A ±
0.2
74.
80bA
± 0
.17
4.60
abA ±
0.1
7
65.
40aA
± 0
.17
5.10
aA ±
0.1
75.
20aA
± 0
.20
4.90
aA ±
0.1
0
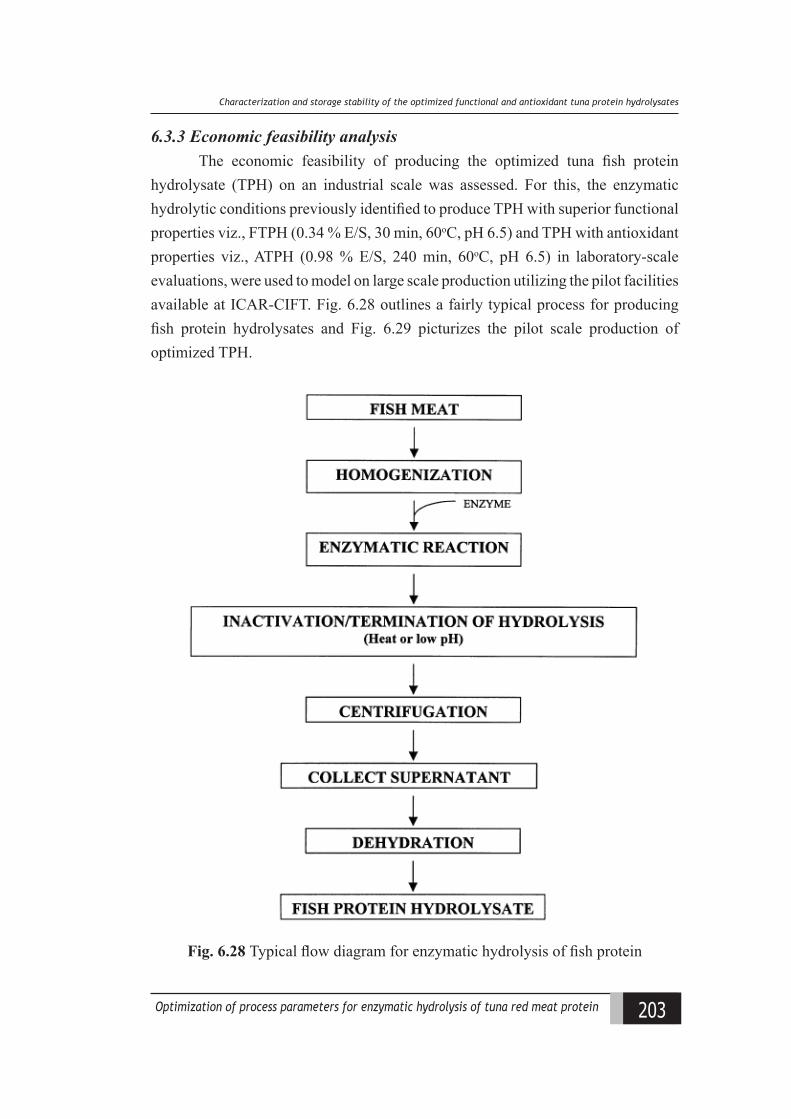
203Optimization of process parameters for enzymatic hydrolysis of tuna red meat protein
Charaateriiation and storage stalility of the optimiied funational and antioxidant tuna protein hydrolysates
6.3.3 Economic feasibility analysisThe economic feasibility of producing the optimized tuna fish protein
hydrolysate (TPH) on an industrial scale was assessed. For this, the enzymatic hydrolytic conditions previously identified to produce TPH with superior functional properties viz., FTPH (0.34 % E/S, 30 min, 60oC, pH 6.5) and TPH with antioxidant properties viz., ATPH (0.98 % E/S, 240 min, 60oC, pH 6.5) in laboratory-scale evaluations, were used to model on large scale production utilizing the pilot facilities available at ICAR-CIFT. Fig. 6.28 outlines a fairly typical process for producing fish protein hydrolysates and Fig. 6.29 picturizes the pilot scale production of optimized TPH.
Fig. 6.28 Typical flow diagram for enzymatic hydrolysis of fish protein
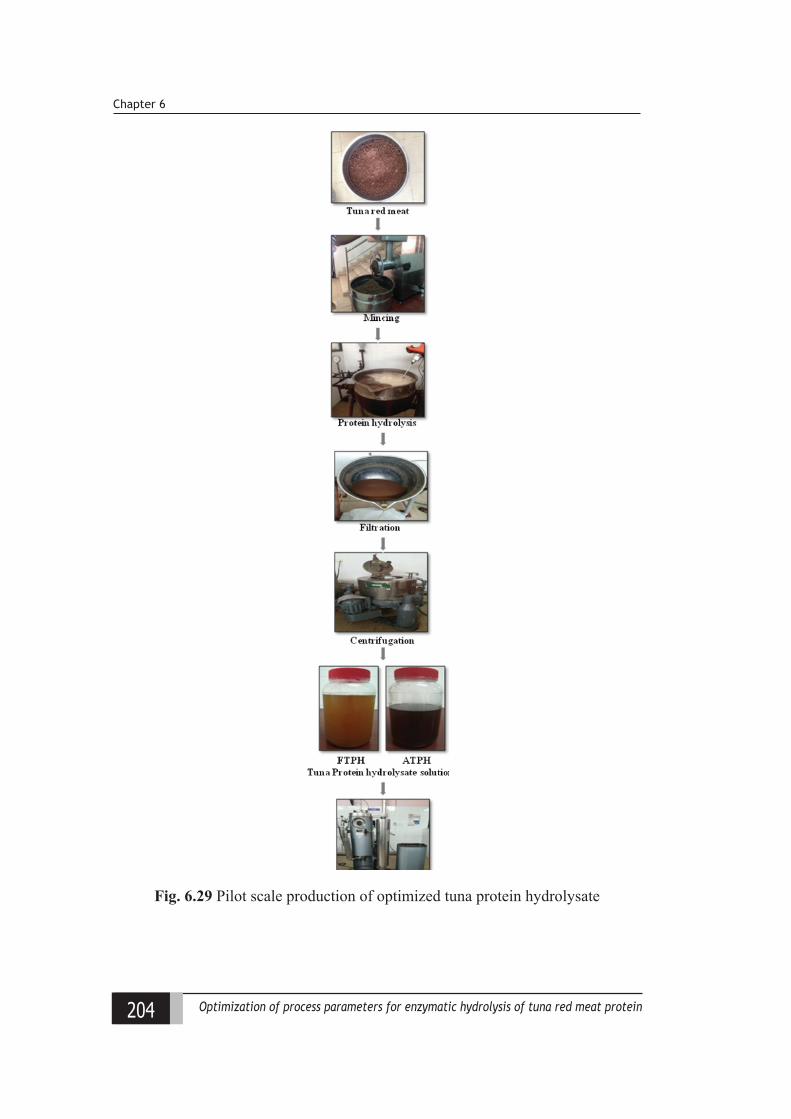
204 Optimization of process parameters for enzymatic hydrolysis of tuna red meat protein
Chapter 6
Fig. 6.29 Pilot scale production of optimized tuna protein hydrolysate
205Optimization of process parameters for enzymatic hydrolysis of tuna red meat protein
Charaateriiation and storage stalility of the optimiied funational and antioxidant tuna protein hydrolysates
The results of the upscaling showed that the yield obtained from raw material
after water washing and sodium bicarbonate solution treatment was about 87.5 %
and upon further mincing a loss of about 2 – 2.5 % was noted. On an average the
protein content of raw material was about 25 % and a recovery of about 48 % was
observed on conversion to its hydrolysate (FTPH) whereas the protein recovery
was about 56 % in ATPH. The yields obtained on spray drying of the hydrolysate
solution were 5.4 % (FTPH) and 7.9 % (ATPH). The final yields obtained from
the raw material to their respective hydrolysates were 10.8 % (FTPH) and 12.4 %
(ATPH).
Evaluation of purchase cost of cooked tuna red meat showed that currently
the Indian seafood industry proposes to sell the sample in bulk at the price of Rs
30/kg. Hence this amount was set as the purchase cost of raw material. Prices
of products were assumed at the current market prices of the same products, or
similar products as references. The commercial fish protein hydrolysate powders
reported a selling price ranging from Rs 250-300/kg for low end crude hydrolysate
for fertilizer application on bulk whereas the retail selling price was high upto Rs
1000 /kg. Hydrolysate for high end pharmaceutical applications have an average
international market price of Rs. 2000/kg whereas in India the hydrolysate price
in domestic market ranged from Rs 500 to 1000/kg. Based on this market survey
and our intended application which is meant for food and pharmaceutical sector, an
average price of Rs 750/kg was set as the selling price for the end product.
The equipments used in the hydrolysis process included a raw material
washing unit, grinder/mincer, chemical reactor for hydrolyzation, decanter,
centrifuge, filtration unit, sterilization unit, spray drier and packaging machine. The
cost of equipments with reference to the prevailing market price, by adjusting the
specific volume or capacity was considered.
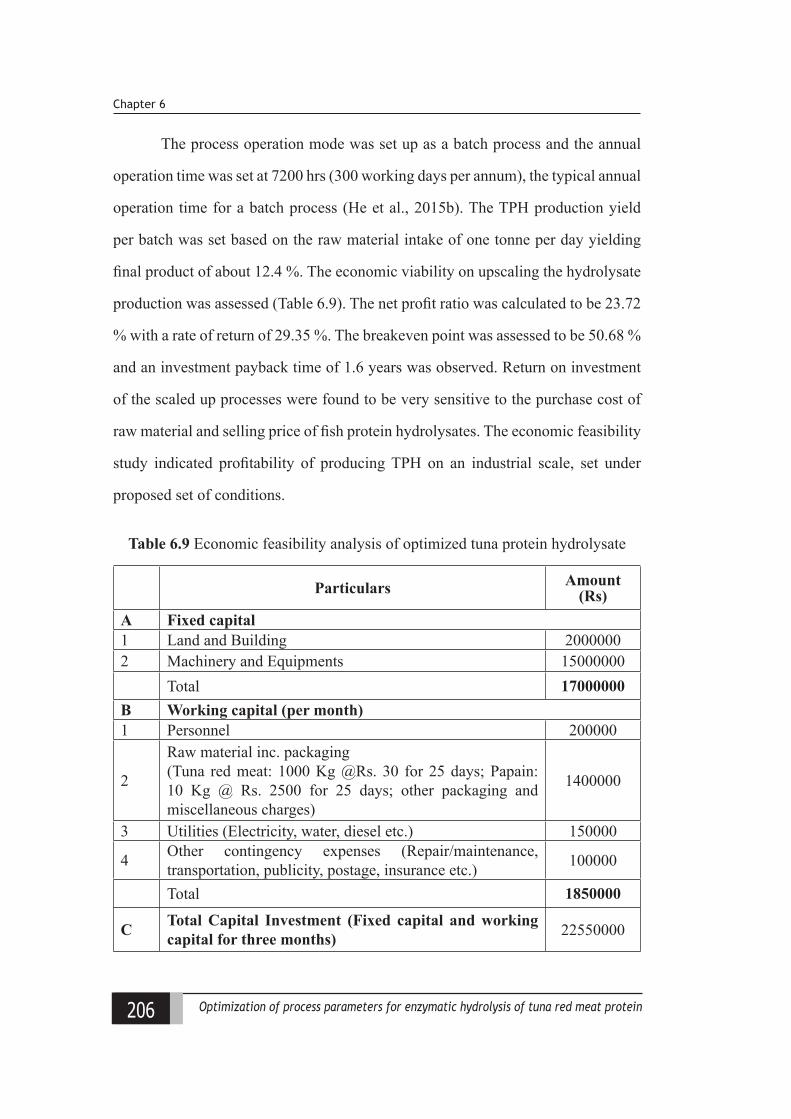
206 Optimization of process parameters for enzymatic hydrolysis of tuna red meat protein
Chapter 6
The process operation mode was set up as a batch process and the annual
operation time was set at 7200 hrs (300 working days per annum), the typical annual
operation time for a batch process (He et al., 2015b). The TPH production yield
per batch was set based on the raw material intake of one tonne per day yielding
final product of about 12.4 %. The economic viability on upscaling the hydrolysate
production was assessed (Table 6.9). The net profit ratio was calculated to be 23.72
% with a rate of return of 29.35 %. The breakeven point was assessed to be 50.68 %
and an investment payback time of 1.6 years was observed. Return on investment
of the scaled up processes were found to be very sensitive to the purchase cost of
raw material and selling price of fish protein hydrolysates. The economic feasibility
study indicated profitability of producing TPH on an industrial scale, set under
proposed set of conditions.
Table 6.9 Economic feasibility analysis of optimized tuna protein hydrolysate
Particulars Amount (Rs)
A Fixed capital1 Land and Building 20000002 Machinery and Equipments 15000000
Total 17000000B Working capital (per month)1 Personnel 200000
2
Raw material inc. packaging (Tuna red meat: 1000 Kg @Rs. 30 for 25 days; Papain: 10 Kg @ Rs. 2500 for 25 days; other packaging and miscellaneous charges)
1400000
3 Utilities (Electricity, water, diesel etc.) 150000
4 Other contingency expenses (Repair/maintenance, transportation, publicity, postage, insurance etc.) 100000
Total 1850000
C Total Capital Investment (Fixed capital and working capital for three months) 22550000
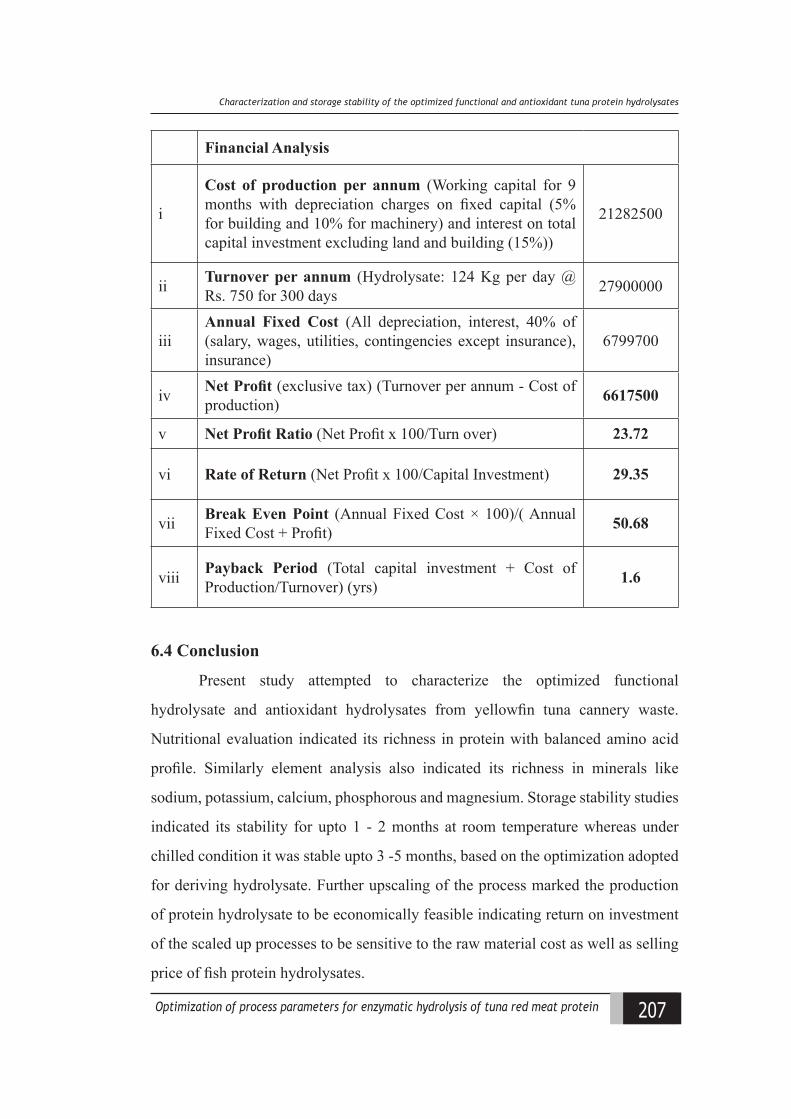
207Optimization of process parameters for enzymatic hydrolysis of tuna red meat protein
Charaateriiation and storage stalility of the optimiied funational and antioxidant tuna protein hydrolysates
Financial Analysis
i
Cost of production per annum (Working capital for 9 months with depreciation charges on fixed capital (5% for building and 10% for machinery) and interest on total capital investment excluding land and building (15%))
21282500
ii Turnover per annum (Hydrolysate: 124 Kg per day @ Rs. 750 for 300 days 27900000
iiiAnnual Fixed Cost (All depreciation, interest, 40% of (salary, wages, utilities, contingencies except insurance), insurance)
6799700
iv Net Profit (exclusive tax) (Turnover per annum - Cost of production) 6617500
v Net Profit Ratio (Net Profit x 100/Turn over) 23.72
vi Rate of Return (Net Profit x 100/Capital Investment) 29.35
vii Break Even Point (Annual Fixed Cost × 100)/( Annual Fixed Cost + Profit) 50.68
viii Payback Period (Total capital investment + Cost of Production/Turnover) (yrs) 1.6
6.4 Conclusion
Present study attempted to characterize the optimized functional
hydrolysate and antioxidant hydrolysates from yellowfin tuna cannery waste.
Nutritional evaluation indicated its richness in protein with balanced amino acid
profile. Similarly element analysis also indicated its richness in minerals like
sodium, potassium, calcium, phosphorous and magnesium. Storage stability studies
indicated its stability for upto 1 - 2 months at room temperature whereas under
chilled condition it was stable upto 3 -5 months, based on the optimization adopted
for deriving hydrolysate. Further upscaling of the process marked the production
of protein hydrolysate to be economically feasible indicating return on investment
of the scaled up processes to be sensitive to the raw material cost as well as selling
price of fish protein hydrolysates.

208 Optimization of process parameters for enzymatic hydrolysis of tuna red meat protein
Chapter 3
209Optimization of process parameters for enzymatic hydrolysis of tuna red meat protein
(una protein hydrolysate as fortifying and staliliiing agent in mayonnaise
Chapter 7Tuna protein hydrolysate
as fortifying and stabilizing agent in mayonnaise
7.1 Introduction
In the recent years, the preference of consumers for nutritionally rich
healthier diet has increased and this scenario has shifted the market demand
towards more fortified supplies. Concurrently, the health issues on account of
the intake of certain lipid rich foods have diverted the food sector towards the
development of low-fat food commodities. Previously, authors like McClements
and Demetriades (1998) have reported challenges associated with the development
of low fat products, having comparative appearance, texture, stability, and flavor as
their full-fat counter parts. Mayonnaise, being a semi-solid oil-in-water emulsion,
is extensively studied in this context. Mayonnaise is traditionally prepared from
a mixture of egg yolk, vinegar, oil and other optional ingredients (Aluko and
McIntosh, 2005; Thomareisa and Chatziantoniou, 2011). Egg yolk is a major
ingredient in mayonnaise formulation and they act as an emulsifying and stabilizing
agent in this emulsion system. However due to some health concerns like high
cholesterol content, allergic problems of some consumers to egg protein as well as
easy susceptibility to microbial contamination and spoilage, an urge for partial or
total replacement with cholesterol-free ingredients is gaining importance. In this
perspective, several plant and animal proteins have been extensively investigated as
210 Optimization of process parameters for enzymatic hydrolysis of tuna red meat protein
Chapter 7
egg substitute in mayonnaise emulsion systems (Ghoush et al., 2008; Ma and Boye,
2013; Ghazaei et al., 2015). Alternatively, reports by Binsi et al. (2017a) indicated
fish roe (egg) protein powder to have superior emulsifying properties and hence,
suggested as an ideal egg substitute in mayonnaise (Sathivel et al., 2009).Similarly,
Siripongvutikorn et al.(2016) used tuna roe and inulin as oil replacer in mayonnaise
formulation. Likewise, several studies highlighting enzymatic hydrolysis as an
effective means for improving the emulsifying properties of fish proteins have
been documented (Parvathy et al., 2016; Binsi et al., 2016). Even though many of
these reports highlighted the superior surface-active properties of the hydrolysates
compared to their native proteins, limited data is available on the application of fish
meat hydrolysate as egg substitute in mayonnaise preparations.
Tuna red meat, a major by-product from tuna cannery has currently low
commercial value on account of ineffective utilization. Previous studies have
established the superior surface active properties of tuna red meat protein including
emulsion properties, which can be explored in the stabilization of emulsion based
food formulations such as mayonnaise (Sánchez-Zapata et al., 2011; Chi et al.,
2015). As an advanced step, in the present work, attempt was made to evaluate the
usefulness of tuna red meat hydrolysate as egg substitute in mayonnaise formulation,
with emphasis on physico-chemical, rheological, sensory and microbiological
indices. Further, an optimized substitution rate was established based on selected
product acceptability parameters, and the stability of the selected formulation was
monitored under chilled storage condition.
211Optimization of process parameters for enzymatic hydrolysis of tuna red meat protein
(una protein hydrolysate as fortifying and staliliiing agent in mayonnaise
7.2 Materials and methods
7.2.1 Raw Materials and Chemicals
Protein hydrolysate from the red meat of yellow fin tuna optimized for
functional properties (chapter 4; table 4.3), hereafter referred to as TPH, was used
for the study. Mayonnaise ingredients viz., soyabean oil, sugar, vinegar, mustard and
salt were purchased from commercial suppliers. Egg yolk was carefully separated
from the egg white after puncturing of the yolk membrane and used. Further all
chemicals used for the study were of analytical grade.
7.2.2 Preparation of mayonnaise
Mayonnaise was formulated adopting the procedure described by Gaonkar
et al. (2010) with slight modifications, employing the following ingredients viz.,
soyabean oil (45 %, w/w), fresh egg yolk (15 %, w/w), sugar (20 % w/w), vinegar
(17 %, w/w), mustard (2 %, w/w) and salt (1 %, w/w). Egg yolk was thoroughly
mixed in a beaker, into which sugar and salt were dissolved with continuous
stirring. Further soybean oil was added in small proportions. One minute after
the incorporation of oil, vinegar was added and stirring was continued for another
minute. The resultant coarse emulsion was further homogenized (230 VAC T-25
digital Ultra-turrax, IKA, India) to get smooth textured mayonnaise which was
filled in air tight containers for further analysis. Protein fortified mayonnaise was
prepared by replacing egg yolk with TPH in different proportions.
7.2.3 Preliminary product acceptability study
Preliminary trials were carried out to finalise the replacement levels of egg
yolk with TPH in mayonnaise for further characterisation and storage analysis. For
this, egg yolk (15 %) in mayonnaise was replaced with TPH up to 5 % (1:2::TPH:egg
yolk), 7.5 % (1:1) and 10 % (2:1), hereafter referred to as fortified mayonnaise: F5,
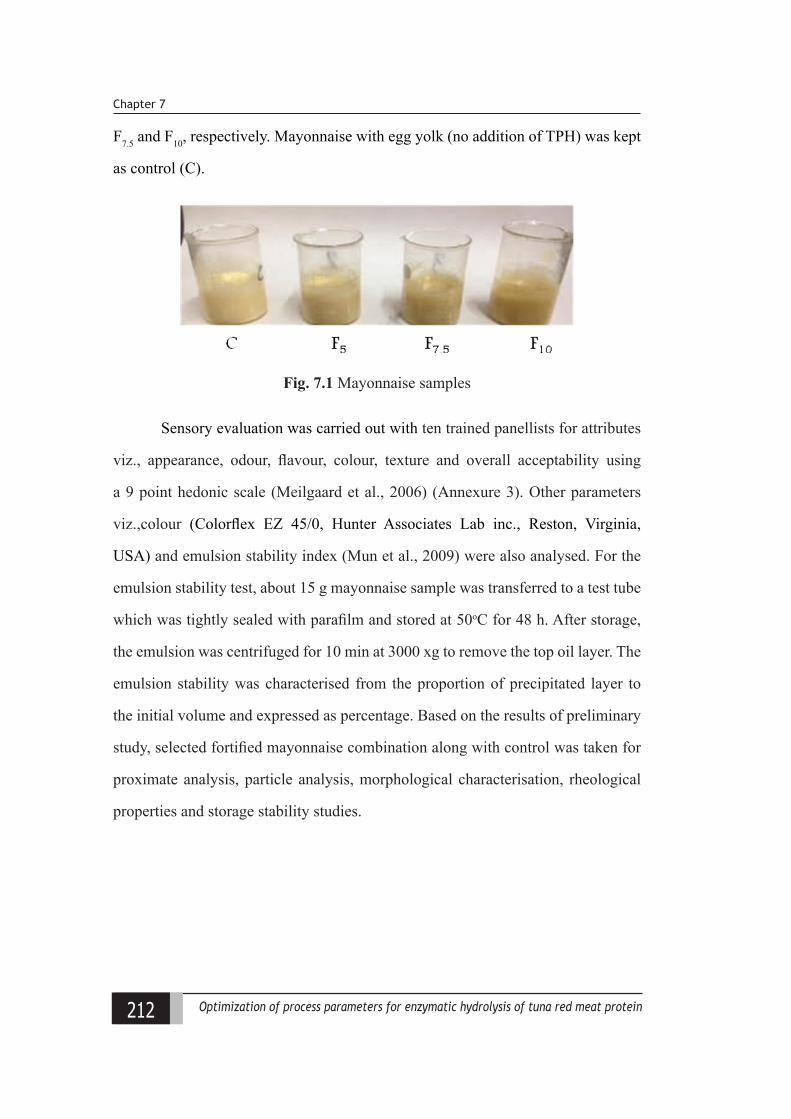
212 Optimization of process parameters for enzymatic hydrolysis of tuna red meat protein
Chapter 7
F7.5 and F10, respectively. Mayonnaise with egg yolk (no addition of TPH) was kept
as control (C).
Fig. 7.1 Mayonnaise samples
Sensory evaluation was carried out with ten trained panellists for attributes
viz., appearance, odour, flavour, colour, texture and overall acceptability using
a 9 point hedonic scale (Meilgaard et al., 2006) (Annexure 3). Other parameters
viz.,colour (Colorflex EZ 45/0, Hunter Associates Lab inc., Reston, Virginia,
USA) and emulsion stability index (Mun et al., 2009) were also analysed. For the
emulsion stability test, about 15 g mayonnaise sample was transferred to a test tube
which was tightly sealed with parafilm and stored at 50oC for 48 h. After storage,
the emulsion was centrifuged for 10 min at 3000 xg to remove the top oil layer. The
emulsion stability was characterised from the proportion of precipitated layer to
the initial volume and expressed as percentage. Based on the results of preliminary
study, selected fortified mayonnaise combination along with control was taken for
proximate analysis, particle analysis, morphological characterisation, rheological
properties and storage stability studies.
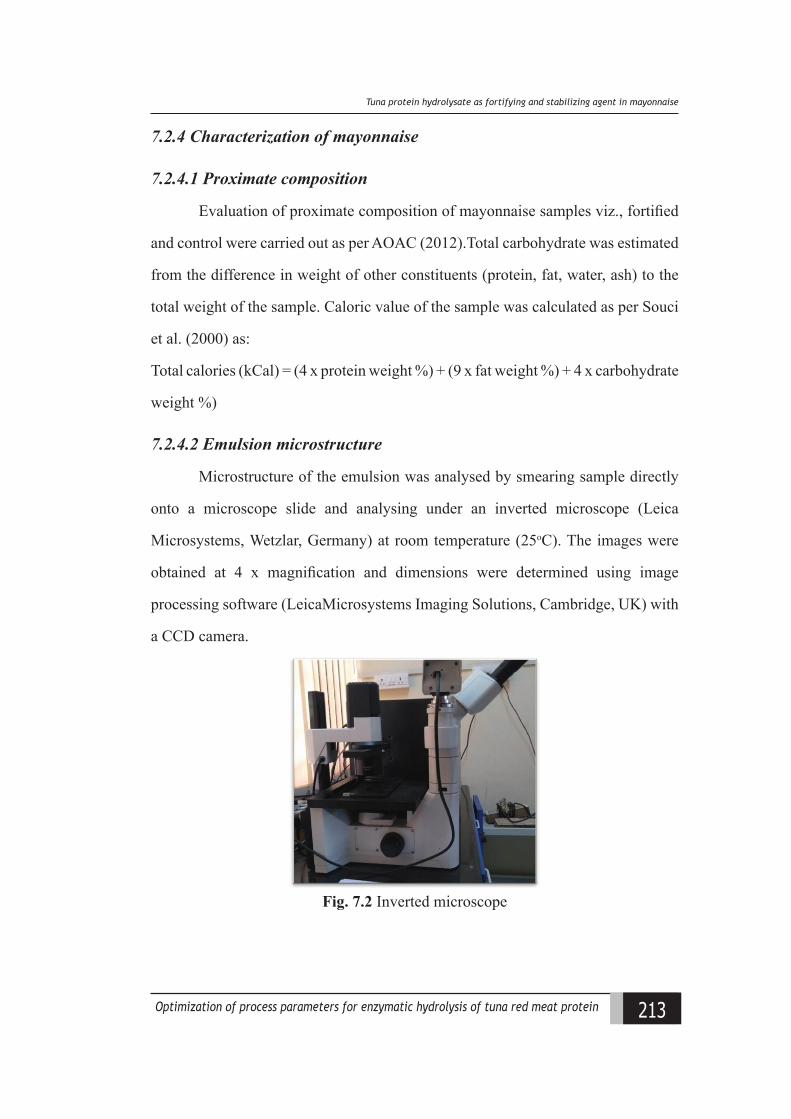
213Optimization of process parameters for enzymatic hydrolysis of tuna red meat protein
(una protein hydrolysate as fortifying and staliliiing agent in mayonnaise
7.2.4 Characterization of mayonnaise
7.2.4.1 Proximate composition
Evaluation of proximate composition of mayonnaise samples viz., fortified
and control were carried out as per AOAC (2012).Total carbohydrate was estimated
from the difference in weight of other constituents (protein, fat, water, ash) to the
total weight of the sample. Caloric value of the sample was calculated as per Souci
et al. (2000) as:
Total calories (kCal) = (4 x protein weight %) + (9 x fat weight %) + 4 x carbohydrate
weight %)
7.2.4.2 Emulsion microstructure
Microstructure of the emulsion was analysed by smearing sample directly
onto a microscope slide and analysing under an inverted microscope (Leica
Microsystems, Wetzlar, Germany) at room temperature (25oC). The images were
obtained at 4 x magnification and dimensions were determined using image
processing software (LeicaMicrosystems Imaging Solutions, Cambridge, UK) with
a CCD camera.
Fig. 7.2 Inverted microscope
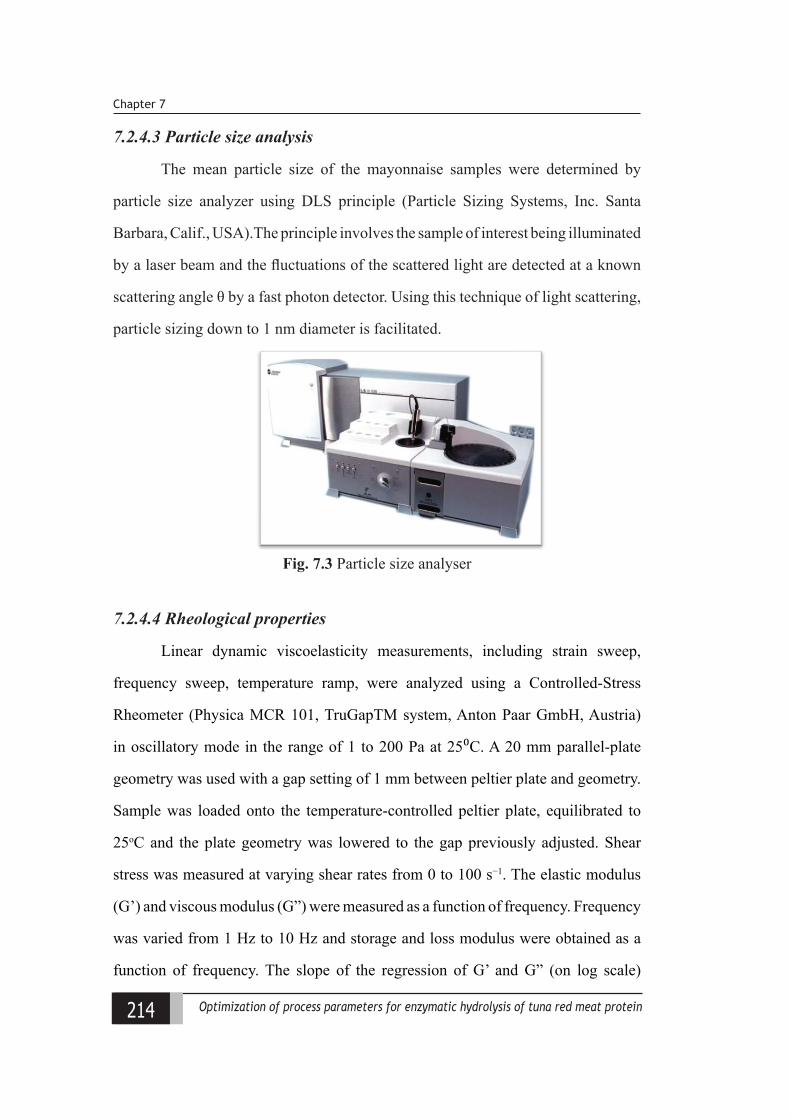
214 Optimization of process parameters for enzymatic hydrolysis of tuna red meat protein
Chapter 7
7.2.4.3 Particle size analysis
The mean particle size of the mayonnaise samples were determined by
particle size analyzer using DLS principle (Particle Sizing Systems, Inc. Santa
Barbara, Calif., USA).The principle involves the sample of interest being illuminated
by a laser beam and the fluctuations of the scattered light are detected at a known
scattering angle θ by a fast photon detector. Using this technique of light scattering,
particle sizing down to 1 nm diameter is facilitated.
Fig. 7.3 Particle size analyser
7.2.4.4 Rheological properties
Linear dynamic viscoelasticity measurements, including strain sweep,
frequency sweep, temperature ramp, were analyzed using a Controlled-Stress
Rheometer (Physica MCR 101, TruGapTM system, Anton Paar GmbH, Austria)
in oscillatory mode in the range of 1 to 200 Pa at 25⁰C. A 20 mm parallel-plate
geometry was used with a gap setting of 1 mm between peltier plate and geometry.
Sample was loaded onto the temperature-controlled peltier plate, equilibrated to
25oC and the plate geometry was lowered to the gap previously adjusted. Shear
stress was measured at varying shear rates from 0 to 100 s−1. The elastic modulus
(G’) and viscous modulus (G”) were measured as a function of frequency. Frequency
was varied from 1 Hz to 10 Hz and storage and loss modulus were obtained as a
function of frequency. The slope of the regression of G’ and G” (on log scale)
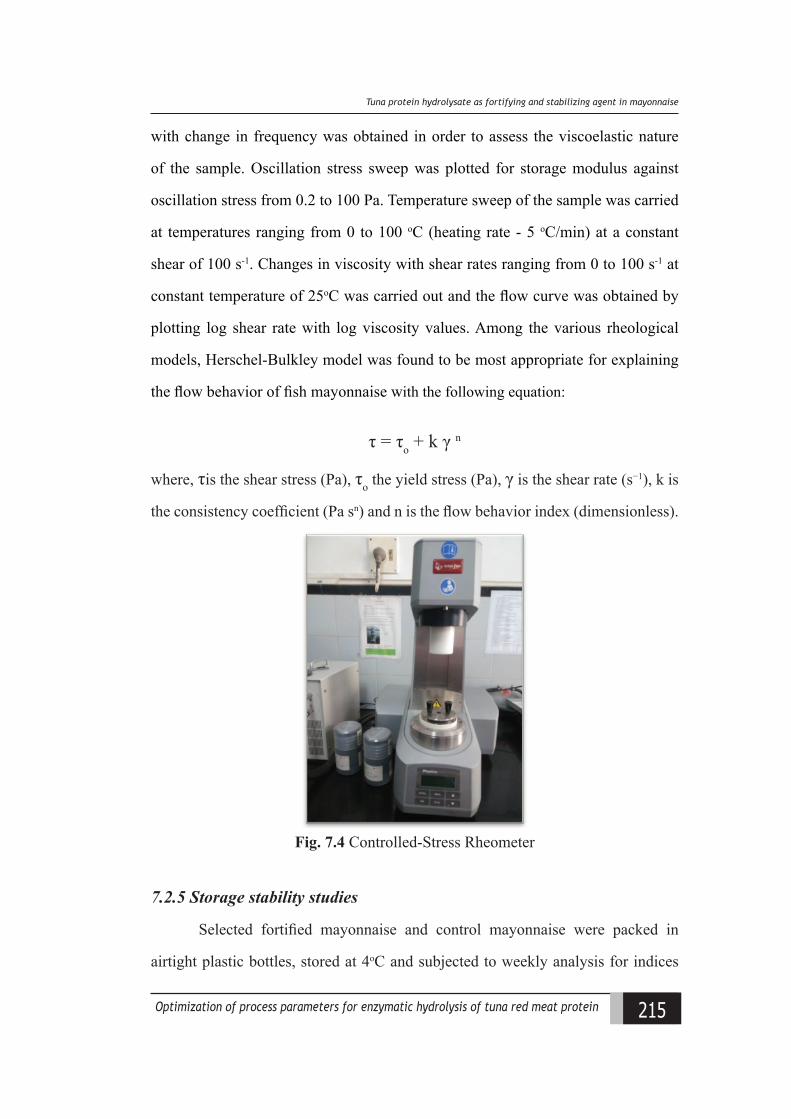
215Optimization of process parameters for enzymatic hydrolysis of tuna red meat protein
(una protein hydrolysate as fortifying and staliliiing agent in mayonnaise
with change in frequency was obtained in order to assess the viscoelastic nature
of the sample. Oscillation stress sweep was plotted for storage modulus against
oscillation stress from 0.2 to 100 Pa. Temperature sweep of the sample was carried
at temperatures ranging from 0 to 100 oC (heating rate - 5 oC/min) at a constant
shear of 100 s-1. Changes in viscosity with shear rates ranging from 0 to 100 s-1 at
constant temperature of 25oC was carried out and the flow curve was obtained by
plotting log shear rate with log viscosity values. Among the various rheological
models, Herschel-Bulkley model was found to be most appropriate for explaining
the flow behavior of fish mayonnaise with the following equation:
τ = τo + k γ n
where, τis the shear stress (Pa), τo the yield stress (Pa), γ is the shear rate (s−1), k is
the consistency coefficient (Pa sn) and n is the flow behavior index (dimensionless).
Fig. 7.4 Controlled-Stress Rheometer
7.2.5 Storage stability studies
Selected fortified mayonnaise and control mayonnaise were packed in
airtight plastic bottles, stored at 4oC and subjected to weekly analysis for indices
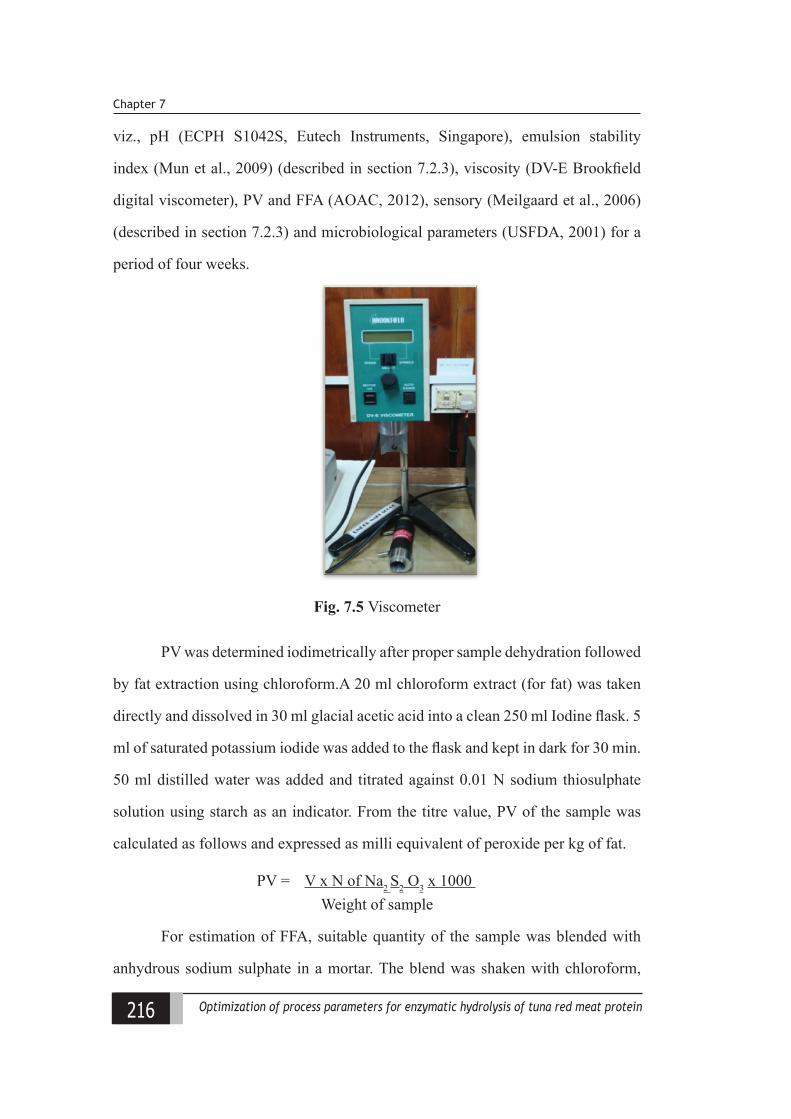
216 Optimization of process parameters for enzymatic hydrolysis of tuna red meat protein
Chapter 7
viz., pH (ECPH S1042S, Eutech Instruments, Singapore), emulsion stability
index (Mun et al., 2009) (described in section 7.2.3), viscosity (DV-E Brookfield
digital viscometer), PV and FFA (AOAC, 2012), sensory (Meilgaard et al., 2006)
(described in section 7.2.3) and microbiological parameters (USFDA, 2001) for a
period of four weeks.
Fig. 7.5 Viscometer
PV was determined iodimetrically after proper sample dehydration followed
by fat extraction using chloroform.A 20 ml chloroform extract (for fat) was taken
directly and dissolved in 30 ml glacial acetic acid into a clean 250 ml Iodine flask. 5
ml of saturated potassium iodide was added to the flask and kept in dark for 30 min.
50 ml distilled water was added and titrated against 0.01 N sodium thiosulphate
solution using starch as an indicator. From the titre value, PV of the sample was
calculated as follows and expressed as milli equivalent of peroxide per kg of fat.
PV = V x N of Na2 S2 O3 x 1000Weight of sample
For estimation of FFA, suitable quantity of the sample was blended with
anhydrous sodium sulphate in a mortar. The blend was shaken with chloroform,
217Optimization of process parameters for enzymatic hydrolysis of tuna red meat protein
(una protein hydrolysate as fortifying and staliliiing agent in mayonnaise
and filtered. Twenty millilitre of extract was taken in a clean beaker. Chloroform
was evaporated on a water bath and weight of fat determined. Another 20 ml of
the extract was transferred to conical flask. Chloroform evaporated off and to this
10 ml of neutral alcohol was added. This was titrated against 0.01 N NaOH using
phenolphthalein indicator. Percentage FFA was calculated (1 ml of 1N NaOH =
0.28 g of oleic acid in 1 L).
FFA = Volume of NaOH used X 0.01 X 0.28 X 100Weight of fat
For aerobic plate count, serial dilution of blended sample using pour plate
technique was adopted.Phosphate buffer was used for dilution in ratio (1: 9 :: sample
: buffer (w/v)) and the homogenized sample was serially diluted. Three consecutive
dilutions were pipetted into clean dry petri dishes. About 12-15 ml plate count agar
(cooled to 45 ± 1°C) was added to each plate and mixed thoroughly and uniformly.
Plates were then incubated at 35°C ± 2°C for 48 ± 2 h for evaluating aerobic plate
count and results expressed as log cfu/g.
7.2.6 Statistical analysis
The analytical data obtained in triplicate were subjected to analysis of
variance (ANOVA) and the differences between means were evaluated by duncan’s
multiple range test. SPSS statistic programme (SPSS 16.0 for Windows, SPSS Inc.,
Chicago, IL) was used for result interpretation.
218 Optimization of process parameters for enzymatic hydrolysis of tuna red meat protein
Chapter 7
7.3 Results and discussion
7.3.1 Preliminary product acceptability study
To comprehend the levels of TPH incorporation in mayonnaise as an egg
substitute without affecting the quality as well as stability attributes, initial trials
were carried out. Fortified mayonnaises viz., F5, F7.5, F10 and control sample were
mainly subjected to sensory acceptability and evaluation of selected physico-
chemical properties which are generally considered as crucial in determining the
acceptability and stability of mayonnaise viz., colour and emulsion stability. The
results indicated a significant decrease (p < 0.05) in overall sensory acceptability
of the product with higher levels of protein hydrolysate (at and beyond 50 %)
incorporation, as inferred from sensory evaluation scores. This must be on account
of the fish flavor as well as slight bitterness imparted by protein hydrolysate when
incorporated at higher concentrations (Table 7.1). The development of bitterness
in hydrolysate is generally associated with the levels of hydrophobic amino acids.
During hydrolysis of protein the buried hydrophobic peptides get exposed resulting
in detection of bitter taste by human taste buds. There are previous studies reporting
the release of bitter tasting peptides during hydrolysis creating acceptability issues
during food applications (Yarnpakdee et al., 2015).
Colour is one of the major perceptive attributes that influences the overall
acceptability of a product. Instrumental colour characteristics of the mayonnaise
formulations were evaluated (Table 7.1). Incorporation of TPH as egg yolk
substitute in mayonnaise formulation resulted in significant changes (p < 0.05)
to the product colour with higher levels of substitution imparting reddish-brown
colour to the mayonnaise. The colour variations are bound to occur on account of
the compositional variations in the samples. Normally, a product appeal is affected
when it deviates from the standard colour range and this variation also had an
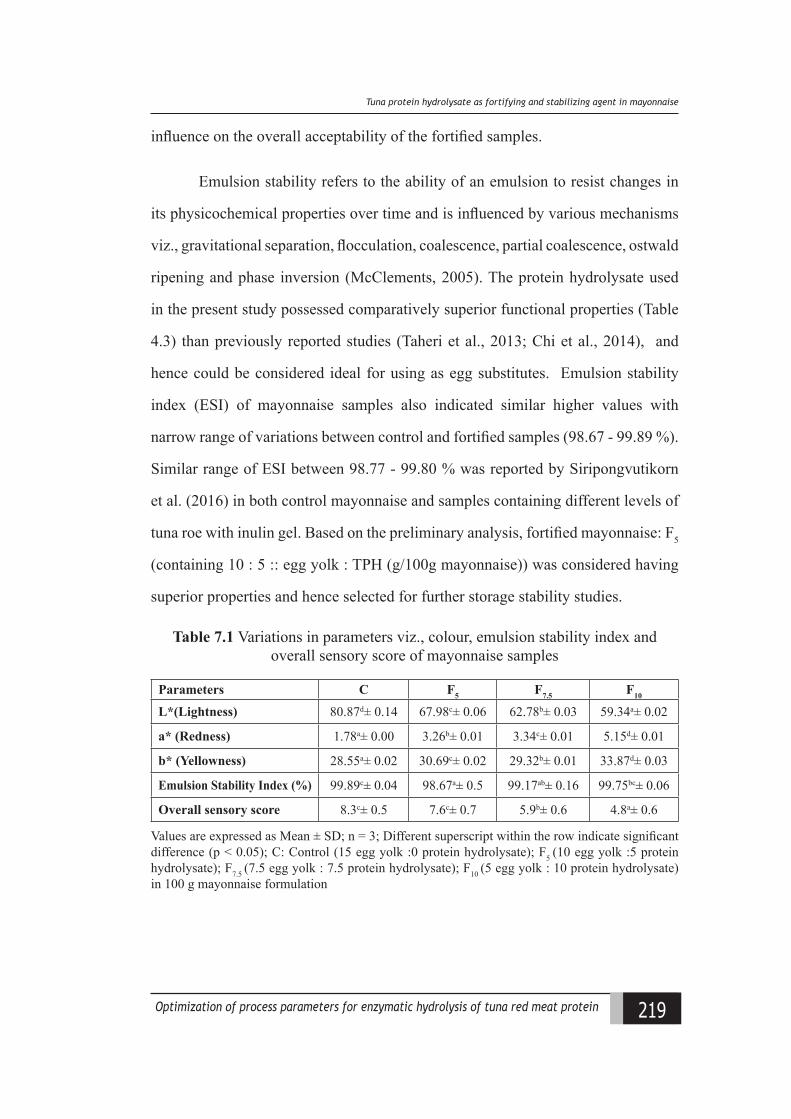
219Optimization of process parameters for enzymatic hydrolysis of tuna red meat protein
(una protein hydrolysate as fortifying and staliliiing agent in mayonnaise
influence on the overall acceptability of the fortified samples.
Emulsion stability refers to the ability of an emulsion to resist changes in
its physicochemical properties over time and is influenced by various mechanisms
viz., gravitational separation, flocculation, coalescence, partial coalescence, ostwald
ripening and phase inversion (McClements, 2005). The protein hydrolysate used
in the present study possessed comparatively superior functional properties (Table
4.3) than previously reported studies (Taheri et al., 2013; Chi et al., 2014), and
hence could be considered ideal for using as egg substitutes. Emulsion stability
index (ESI) of mayonnaise samples also indicated similar higher values with
narrow range of variations between control and fortified samples (98.67 - 99.89 %).
Similar range of ESI between 98.77 - 99.80 % was reported by Siripongvutikorn
et al. (2016) in both control mayonnaise and samples containing different levels of
tuna roe with inulin gel. Based on the preliminary analysis, fortified mayonnaise: F5
(containing 10 : 5 :: egg yolk : TPH (g/100g mayonnaise)) was considered having
superior properties and hence selected for further storage stability studies.
Table 7.1 Variations in parameters viz., colour, emulsion stability index and overall sensory score of mayonnaise samples
Parameters C F5 F7.5 F10
L*(Lightness) 80.87d± 0.14 67.98c± 0.06 62.78b± 0.03 59.34a± 0.02
a* (Redness) 1.78a± 0.00 3.26b± 0.01 3.34c± 0.01 5.15d± 0.01
b* (Yellowness) 28.55a± 0.02 30.69c± 0.02 29.32b± 0.01 33.87d± 0.03
Emulsion Stability Index (%) 99.89c± 0.04 98.67a± 0.5 99.17ab± 0.16 99.75bc± 0.06
Overall sensory score 8.3c± 0.5 7.6c± 0.7 5.9b± 0.6 4.8a± 0.6
Values are expressed as Mean ± SD; n = 3; Different superscript within the row indicate significant difference (p < 0.05); C: Control (15 egg yolk :0 protein hydrolysate); F5 (10 egg yolk :5 protein hydrolysate); F7.5 (7.5 egg yolk : 7.5 protein hydrolysate); F10 (5 egg yolk : 10 protein hydrolysate) in 100 g mayonnaise formulation
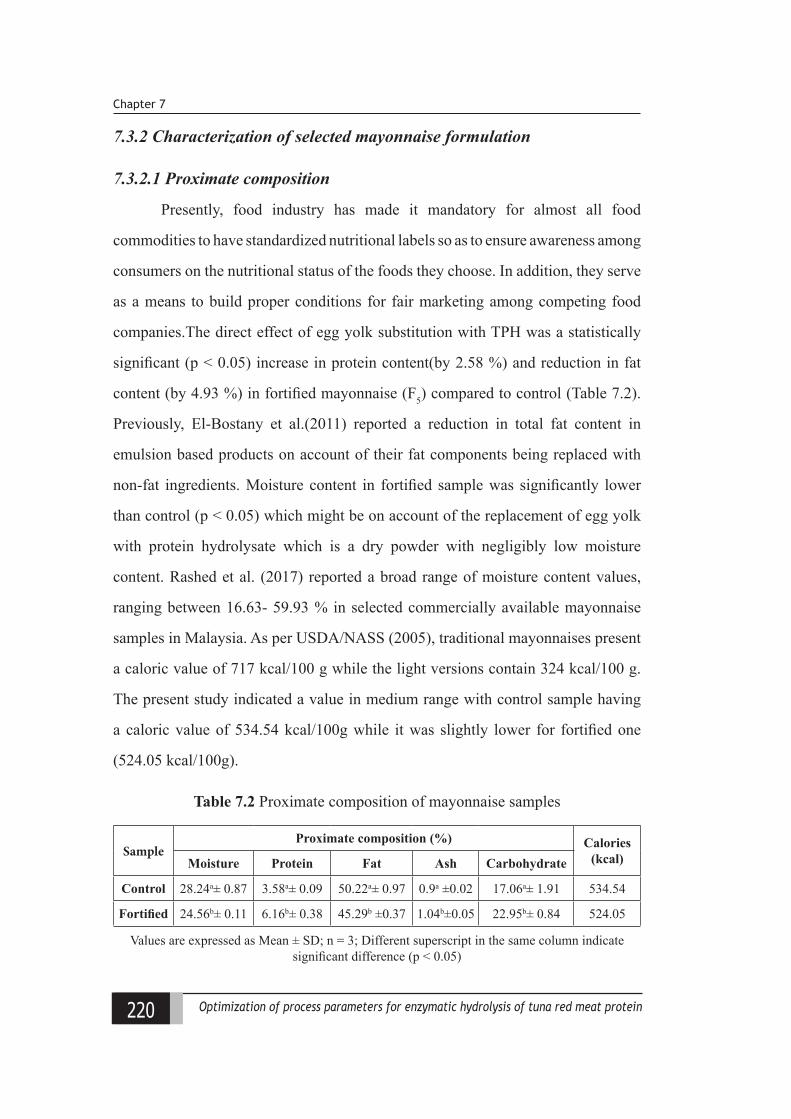
220 Optimization of process parameters for enzymatic hydrolysis of tuna red meat protein
Chapter 7
7.3.2 Characterization of selected mayonnaise formulation
7.3.2.1 Proximate composition
Presently, food industry has made it mandatory for almost all food
commodities to have standardized nutritional labels so as to ensure awareness among
consumers on the nutritional status of the foods they choose. In addition, they serve
as a means to build proper conditions for fair marketing among competing food
companies.The direct effect of egg yolk substitution with TPH was a statistically
significant (p < 0.05) increase in protein content(by 2.58 %) and reduction in fat
content (by 4.93 %) in fortified mayonnaise (F5) compared to control (Table 7.2).
Previously, El-Bostany et al.(2011) reported a reduction in total fat content in
emulsion based products on account of their fat components being replaced with
non-fat ingredients. Moisture content in fortified sample was significantly lower
than control (p < 0.05) which might be on account of the replacement of egg yolk
with protein hydrolysate which is a dry powder with negligibly low moisture
content. Rashed et al. (2017) reported a broad range of moisture content values,
ranging between 16.63- 59.93 % in selected commercially available mayonnaise
samples in Malaysia. As per USDA/NASS (2005), traditional mayonnaises present
a caloric value of 717 kcal/100 g while the light versions contain 324 kcal/100 g.
The present study indicated a value in medium range with control sample having
a caloric value of 534.54 kcal/100g while it was slightly lower for fortified one
(524.05 kcal/100g).
Table 7.2 Proximate composition of mayonnaise samples
SampleProximate composition (%) Calories
(kcal)Moisture Protein Fat Ash Carbohydrate
Control 28.24a± 0.87 3.58a± 0.09 50.22a± 0.97 0.9a ±0.02 17.06a± 1.91 534.54
Fortified 24.56b± 0.11 6.16b± 0.38 45.29b ±0.37 1.04b±0.05 22.95b± 0.84 524.05
Values are expressed as Mean ± SD; n = 3; Different superscript in the same column indicate significant difference (p < 0.05)
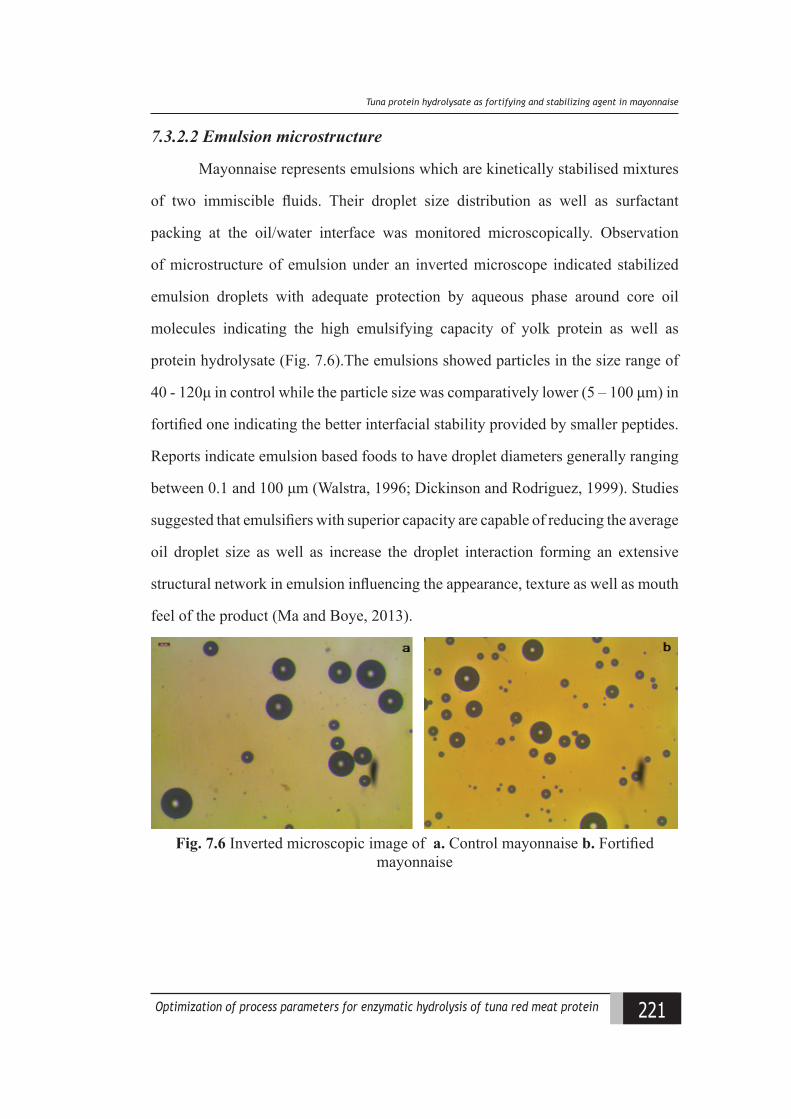
221Optimization of process parameters for enzymatic hydrolysis of tuna red meat protein
(una protein hydrolysate as fortifying and staliliiing agent in mayonnaise
7.3.2.2 Emulsion microstructure
Mayonnaise represents emulsions which are kinetically stabilised mixtures
of two immiscible fluids. Their droplet size distribution as well as surfactant
packing at the oil/water interface was monitored microscopically. Observation
of microstructure of emulsion under an inverted microscope indicated stabilized
emulsion droplets with adequate protection by aqueous phase around core oil
molecules indicating the high emulsifying capacity of yolk protein as well as
protein hydrolysate (Fig. 7.6).The emulsions showed particles in the size range of
40 - 120μ in control while the particle size was comparatively lower (5 – 100 μm) in
fortified one indicating the better interfacial stability provided by smaller peptides.
Reports indicate emulsion based foods to have droplet diameters generally ranging
between 0.1 and 100 μm (Walstra, 1996; Dickinson and Rodriguez, 1999). Studies
suggested that emulsifiers with superior capacity are capable of reducing the average
oil droplet size as well as increase the droplet interaction forming an extensive
structural network in emulsion influencing the appearance, texture as well as mouth
feel of the product (Ma and Boye, 2013).
Fig. 7.6 Inverted microscopic image of a. Control mayonnaise b. Fortified mayonnaise
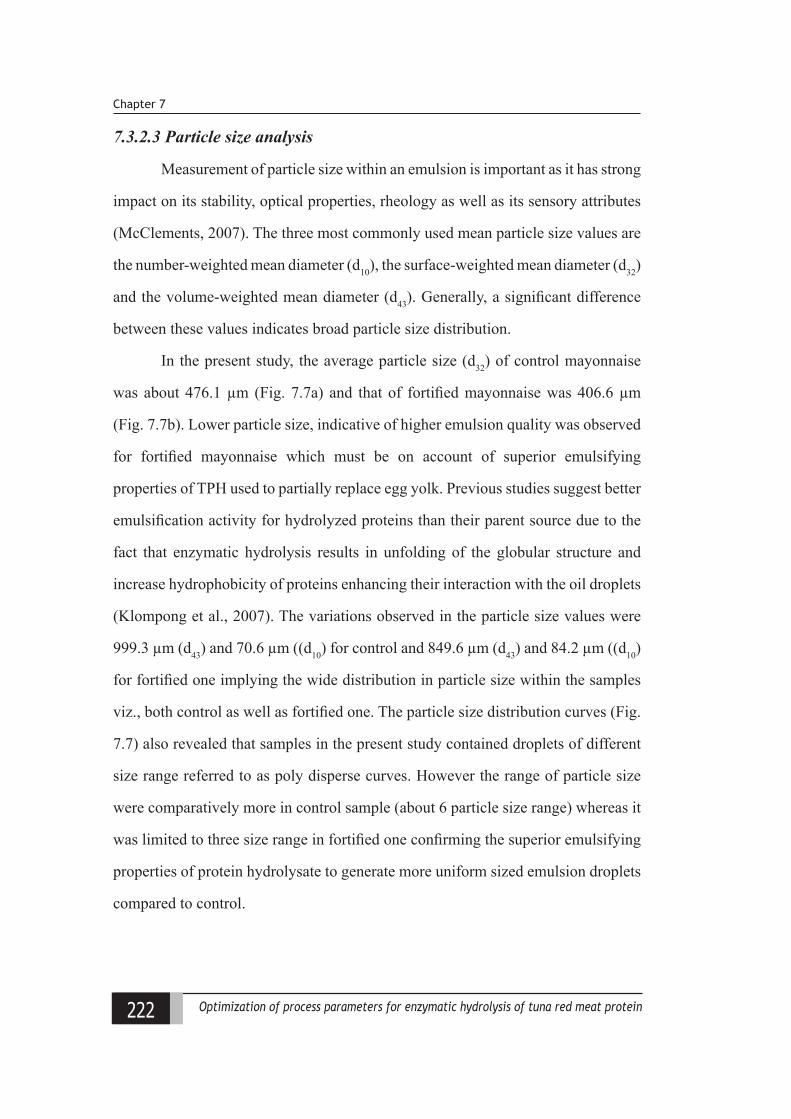
222 Optimization of process parameters for enzymatic hydrolysis of tuna red meat protein
Chapter 7
7.3.2.3 Particle size analysis
Measurement of particle size within an emulsion is important as it has strong
impact on its stability, optical properties, rheology as well as its sensory attributes
(McClements, 2007). The three most commonly used mean particle size values are
the number-weighted mean diameter (d10), the surface-weighted mean diameter (d32)
and the volume-weighted mean diameter (d43). Generally, a significant difference
between these values indicates broad particle size distribution.
In the present study, the average particle size (d32) of control mayonnaise
was about 476.1 µm (Fig. 7.7a) and that of fortified mayonnaise was 406.6 µm
(Fig. 7.7b). Lower particle size, indicative of higher emulsion quality was observed
for fortified mayonnaise which must be on account of superior emulsifying
properties of TPH used to partially replace egg yolk. Previous studies suggest better
emulsification activity for hydrolyzed proteins than their parent source due to the
fact that enzymatic hydrolysis results in unfolding of the globular structure and
increase hydrophobicity of proteins enhancing their interaction with the oil droplets
(Klompong et al., 2007). The variations observed in the particle size values were
999.3 µm (d43) and 70.6 µm ((d10) for control and 849.6 µm (d43) and 84.2 µm ((d10)
for fortified one implying the wide distribution in particle size within the samples
viz., both control as well as fortified one. The particle size distribution curves (Fig.
7.7) also revealed that samples in the present study contained droplets of different
size range referred to as poly disperse curves. However the range of particle size
were comparatively more in control sample (about 6 particle size range) whereas it
was limited to three size range in fortified one confirming the superior emulsifying
properties of protein hydrolysate to generate more uniform sized emulsion droplets
compared to control.
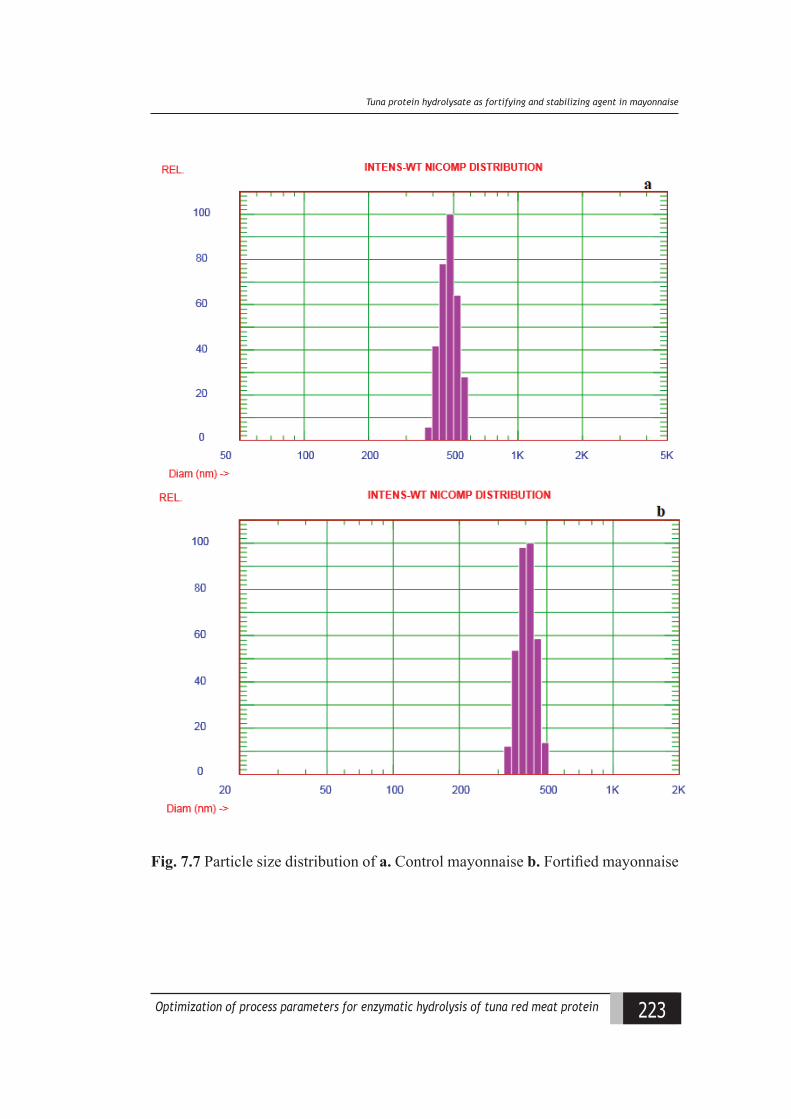
223Optimization of process parameters for enzymatic hydrolysis of tuna red meat protein
(una protein hydrolysate as fortifying and staliliiing agent in mayonnaise
Fig. 7.7 Particle size distribution of a. Control mayonnaise b. Fortified mayonnaise
224 Optimization of process parameters for enzymatic hydrolysis of tuna red meat protein
Chapter 7
7.3.2.4 Rheological properties
7.3.2.4.1 Frequency sweep
In order to assess the stability of mayonnaise emulsion, frequency sweep was
carried out at constant temperature of 25oC, in the frequency range of 1-10 Hz. The
rheological behavior of fortified and control samples showed distinct differences
as a function of frequency, with the fortified sample having significantly higher
storage and loss modulus values compared to that of control sample (Fig. 7.8).
Slope indicated the strength of the network with the applied frequency (Binsi et al.,
2006). The significantly higher G’ values of fortified samples suggests the superior
elastic behavior of fortified sample compared to that of control samples which may
be due to the formation of strong intermolecular network in the fortified samples.
The viscoelastic profile of the mayonnaise samples obtained by the frequency
sweep measurement classifies both the samples as ‘weak gels’ as G’ values were
higher than G’’ values; however strength of fortified sample gel is considered as
comparatively stronger, as the recorded G’ values were much higher than that of
control sample. Previously, the weak gelling characteristics of mayonnaise were
reported by Aslanzadeh et al. (2012) in low fat mayonnaise containing modified
wheat bran. The slope of the G’ curve as a function of frequency was determined
as 0.832 for control against a much lower value of 0.237 for fortified samples,
indicating the superior stability of the fortified sample against the application of
stress. The frequency sweep curve gives a good rheological description of how the
product will behave during storage and application as well as helps to characterize or
classify dispersion. Gallegos et al. (1992) observed that higher oil content produces
a significant increase in the elastic characteristics of mayonnaise. However, in the
present study such a correlation was not evident, which might be due to the presence
of peptides carrying exposed hydrophilic and hydrophobic groups which further
limited the diffusion of oil and water phase.
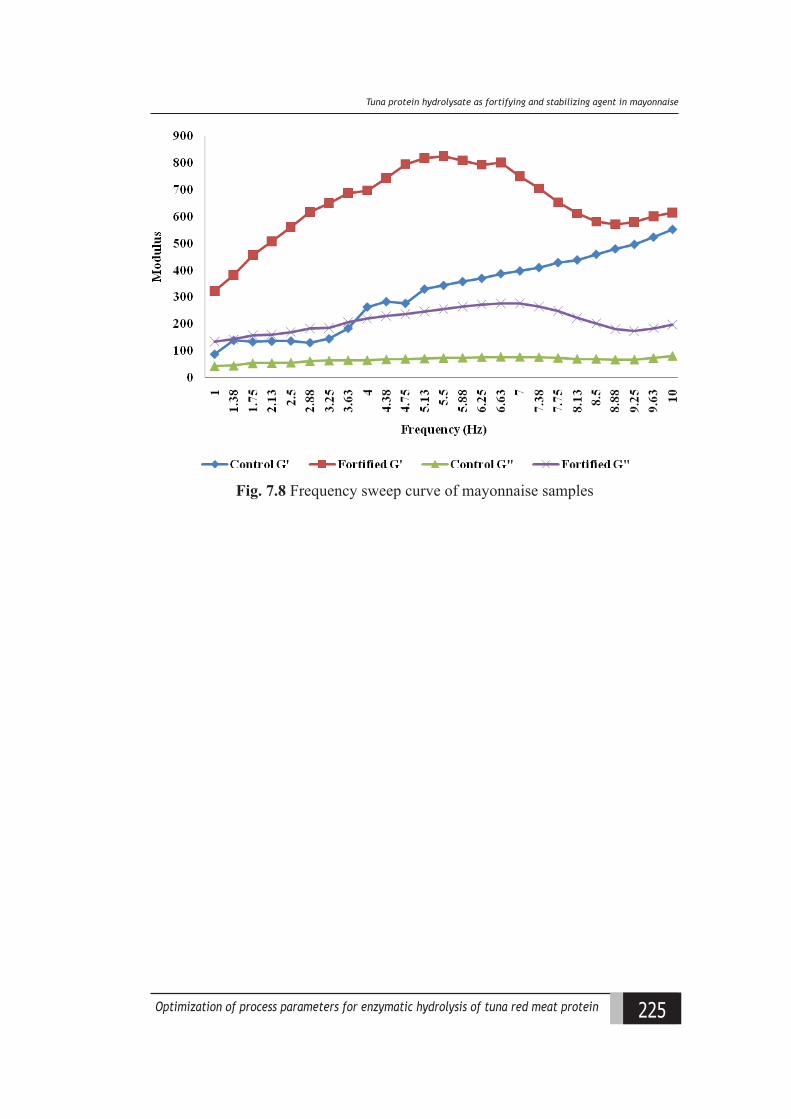
225Optimization of process parameters for enzymatic hydrolysis of tuna red meat protein
(una protein hydrolysate as fortifying and staliliiing agent in mayonnaise
Fig. 7.8 Frequency sweep curve of mayonnaise samples
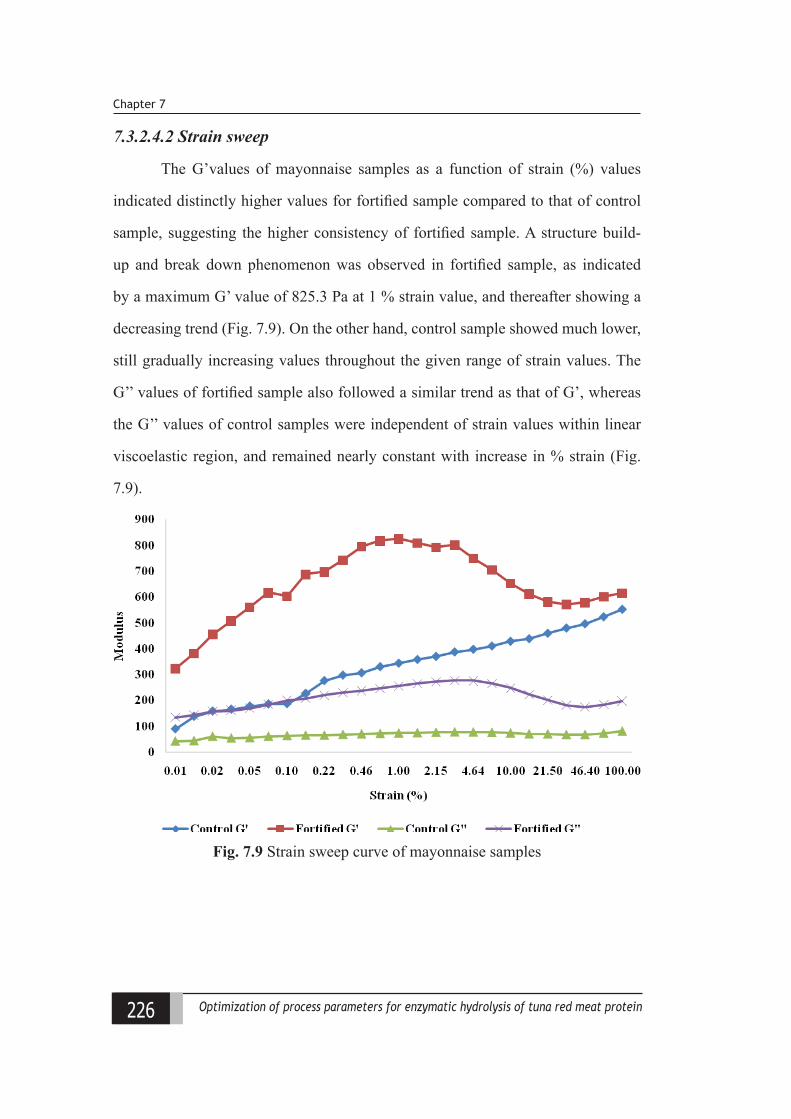
226 Optimization of process parameters for enzymatic hydrolysis of tuna red meat protein
Chapter 7
7.3.2.4.2 Strain sweep
The G’values of mayonnaise samples as a function of strain (%) values
indicated distinctly higher values for fortified sample compared to that of control
sample, suggesting the higher consistency of fortified sample. A structure build-
up and break down phenomenon was observed in fortified sample, as indicated
by a maximum G’ value of 825.3 Pa at 1 % strain value, and thereafter showing a
decreasing trend (Fig. 7.9). On the other hand, control sample showed much lower,
still gradually increasing values throughout the given range of strain values. The
G’’ values of fortified sample also followed a similar trend as that of G’, whereas
the G’’ values of control samples were independent of strain values within linear
viscoelastic region, and remained nearly constant with increase in % strain (Fig.
7.9).
Fig. 7.9 Strain sweep curve of mayonnaise samples
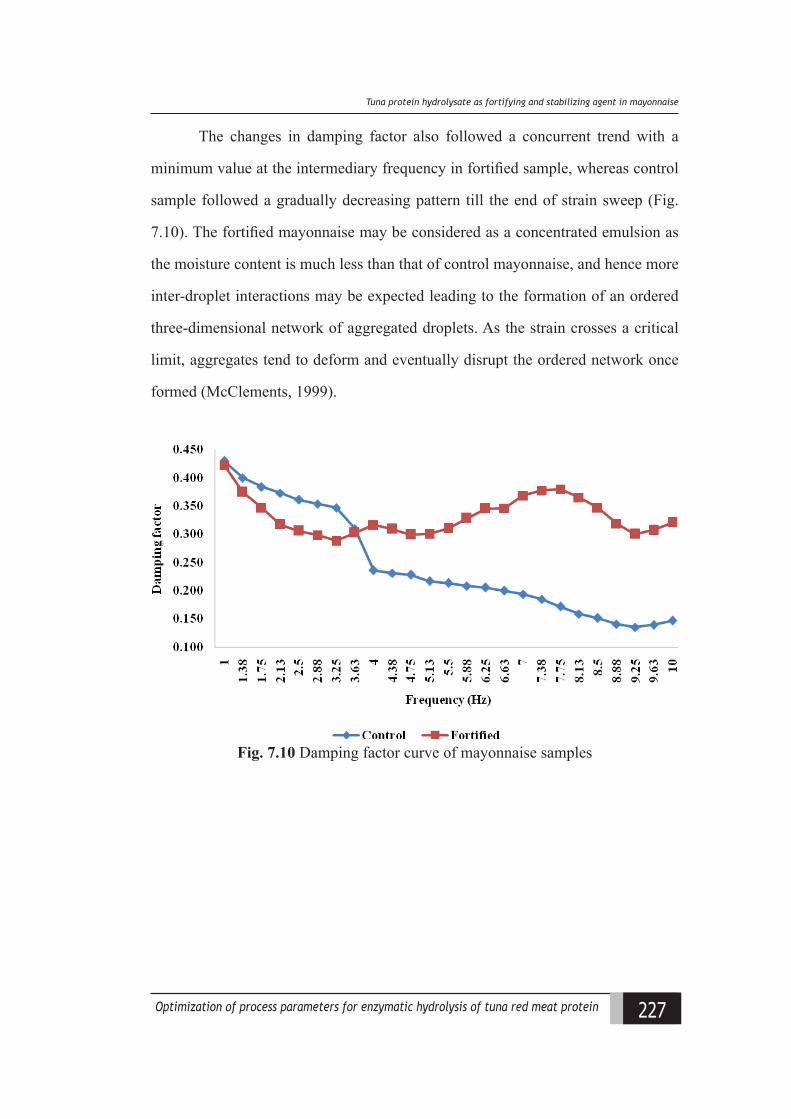
227Optimization of process parameters for enzymatic hydrolysis of tuna red meat protein
(una protein hydrolysate as fortifying and staliliiing agent in mayonnaise
The changes in damping factor also followed a concurrent trend with a
minimum value at the intermediary frequency in fortified sample, whereas control
sample followed a gradually decreasing pattern till the end of strain sweep (Fig.
7.10). The fortified mayonnaise may be considered as a concentrated emulsion as
the moisture content is much less than that of control mayonnaise, and hence more
inter-droplet interactions may be expected leading to the formation of an ordered
three-dimensional network of aggregated droplets. As the strain crosses a critical
limit, aggregates tend to deform and eventually disrupt the ordered network once
formed (McClements, 1999).
Fig. 7.10 Damping factor curve of mayonnaise samples
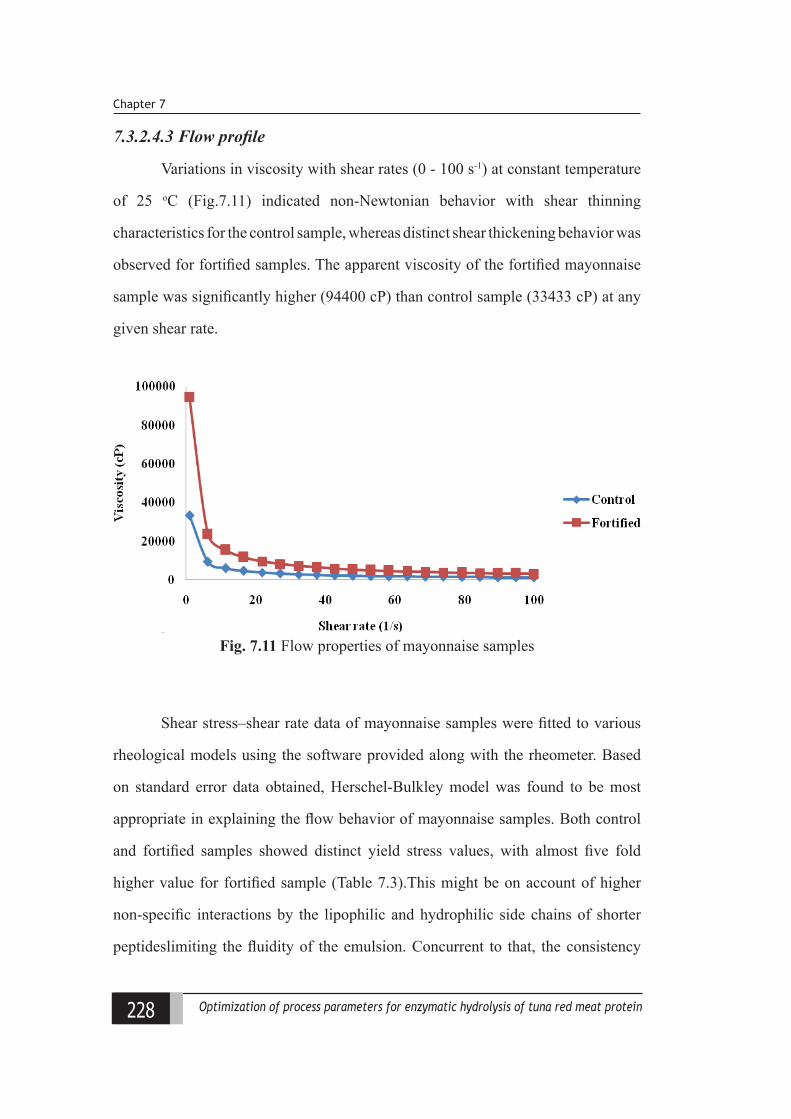
228 Optimization of process parameters for enzymatic hydrolysis of tuna red meat protein
Chapter 7
7.3.2.4.3 Flow profile
Variations in viscosity with shear rates (0 - 100 s-1) at constant temperature
of 25 oC (Fig.7.11) indicated non-Newtonian behavior with shear thinning
characteristics for the control sample, whereas distinct shear thickening behavior was
observed for fortified samples. The apparent viscosity of the fortified mayonnaise
sample was significantly higher (94400 cP) than control sample (33433 cP) at any
given shear rate.
.Fig. 7.11 Flow properties of mayonnaise samples
Shear stress–shear rate data of mayonnaise samples were fitted to various
rheological models using the software provided along with the rheometer. Based
on standard error data obtained, Herschel-Bulkley model was found to be most
appropriate in explaining the flow behavior of mayonnaise samples. Both control
and fortified samples showed distinct yield stress values, with almost five fold
higher value for fortified sample (Table 7.3).This might be on account of higher
non-specific interactions by the lipophilic and hydrophilic side chains of shorter
peptideslimiting the fluidity of the emulsion. Concurrent to that, the consistency
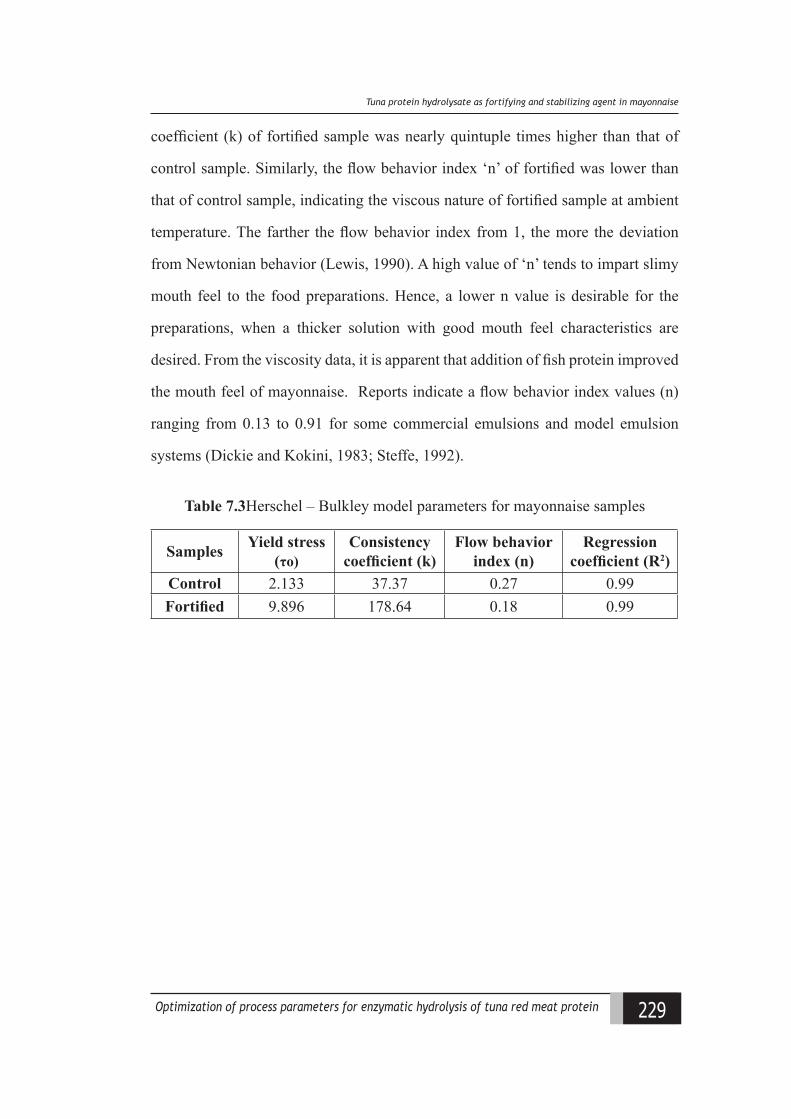
229Optimization of process parameters for enzymatic hydrolysis of tuna red meat protein
(una protein hydrolysate as fortifying and staliliiing agent in mayonnaise
coefficient (k) of fortified sample was nearly quintuple times higher than that of
control sample. Similarly, the flow behavior index ‘n’ of fortified was lower than
that of control sample, indicating the viscous nature of fortified sample at ambient
temperature. The farther the flow behavior index from 1, the more the deviation
from Newtonian behavior (Lewis, 1990). A high value of ‘n’ tends to impart slimy
mouth feel to the food preparations. Hence, a lower n value is desirable for the
preparations, when a thicker solution with good mouth feel characteristics are
desired. From the viscosity data, it is apparent that addition of fish protein improved
the mouth feel of mayonnaise. Reports indicate a flow behavior index values (n)
ranging from 0.13 to 0.91 for some commercial emulsions and model emulsion
systems (Dickie and Kokini, 1983; Steffe, 1992).
Table 7.3Herschel – Bulkley model parameters for mayonnaise samples
Samples Yield stress(τo)
Consistency coefficient (k)
Flow behavior index (n)
Regression coefficient (R2)
Control 2.133 37.37 0.27 0.99Fortified 9.896 178.64 0.18 0.99
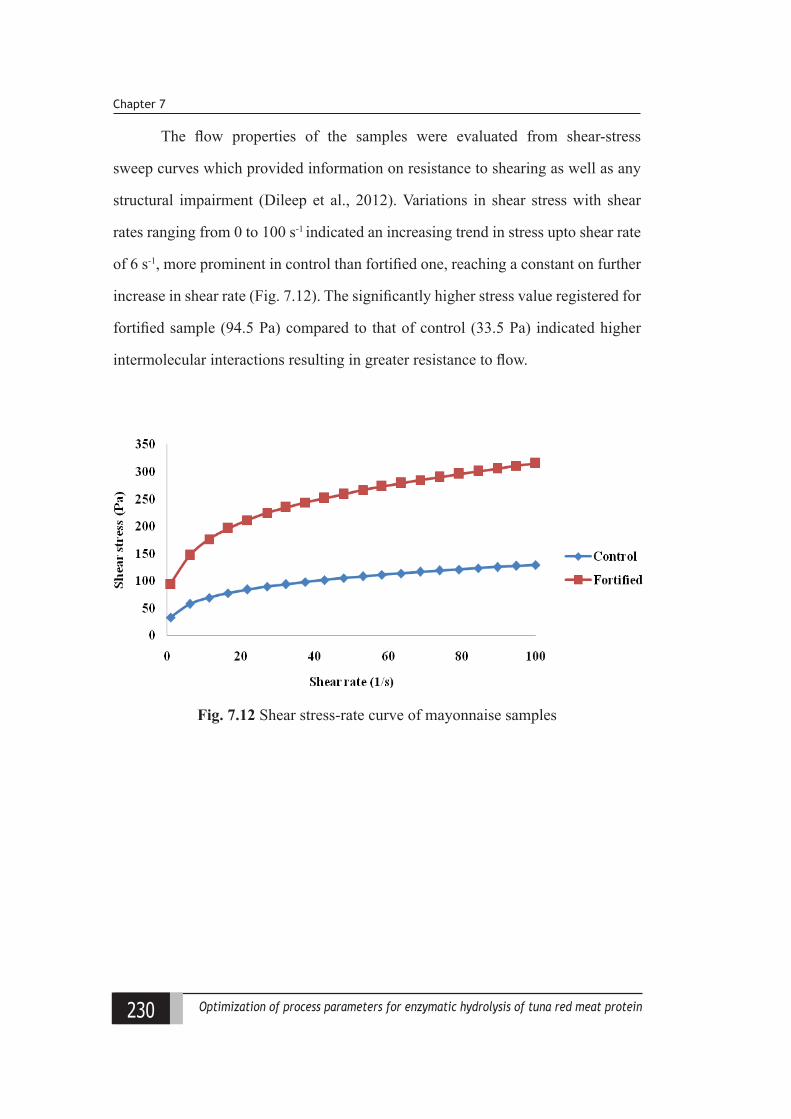
230 Optimization of process parameters for enzymatic hydrolysis of tuna red meat protein
Chapter 7
The flow properties of the samples were evaluated from shear-stress
sweep curves which provided information on resistance to shearing as well as any
structural impairment (Dileep et al., 2012). Variations in shear stress with shear
rates ranging from 0 to 100 s-1 indicated an increasing trend in stress upto shear rate
of 6 s-1, more prominent in control than fortified one, reaching a constant on further
increase in shear rate (Fig. 7.12). The significantly higher stress value registered for
fortified sample (94.5 Pa) compared to that of control (33.5 Pa) indicated higher
intermolecular interactions resulting in greater resistance to flow.
Fig. 7.12 Shear stress-rate curve of mayonnaise samples
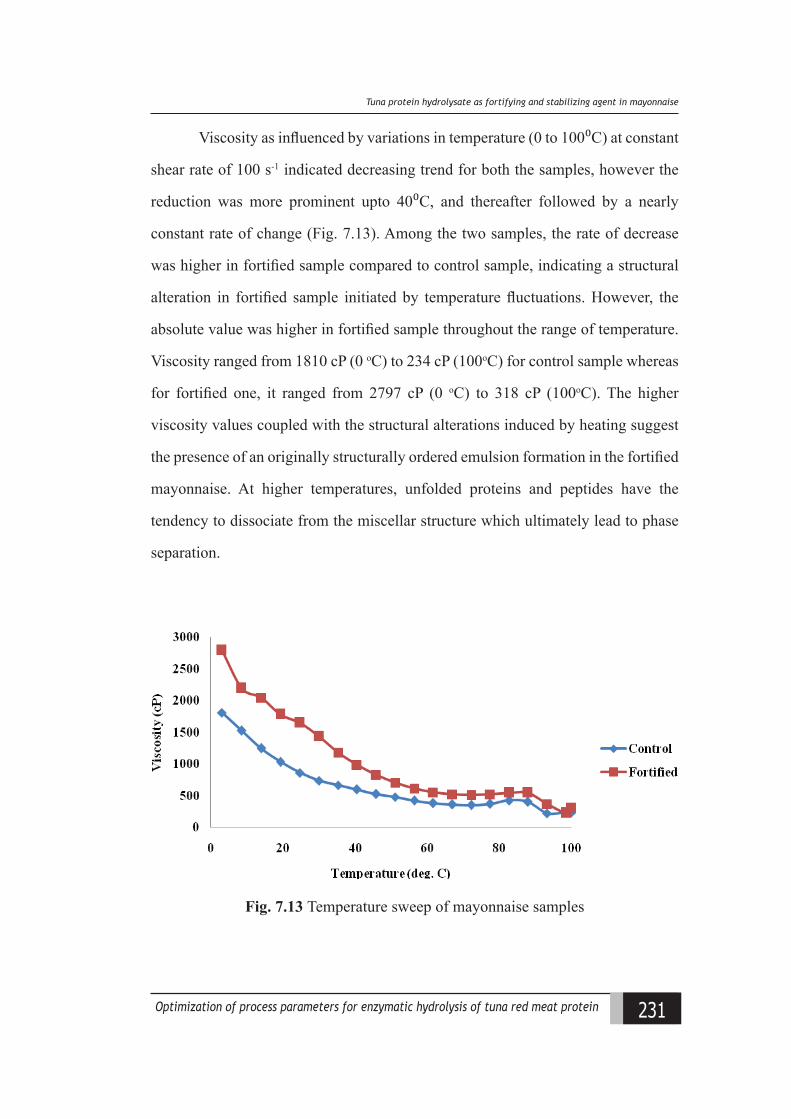
231Optimization of process parameters for enzymatic hydrolysis of tuna red meat protein
(una protein hydrolysate as fortifying and staliliiing agent in mayonnaise
Viscosity as influenced by variations in temperature (0 to 100⁰C) at constant
shear rate of 100 s-1 indicated decreasing trend for both the samples, however the
reduction was more prominent upto 40⁰C, and thereafter followed by a nearly
constant rate of change (Fig. 7.13). Among the two samples, the rate of decrease
was higher in fortified sample compared to control sample, indicating a structural
alteration in fortified sample initiated by temperature fluctuations. However, the
absolute value was higher in fortified sample throughout the range of temperature.
Viscosity ranged from 1810 cP (0 oC) to 234 cP (100oC) for control sample whereas
for fortified one, it ranged from 2797 cP (0 oC) to 318 cP (100oC). The higher
viscosity values coupled with the structural alterations induced by heating suggest
the presence of an originally structurally ordered emulsion formation in the fortified
mayonnaise. At higher temperatures, unfolded proteins and peptides have the
tendency to dissociate from the miscellar structure which ultimately lead to phase
separation.
Fig. 7.13 Temperature sweep of mayonnaise samples
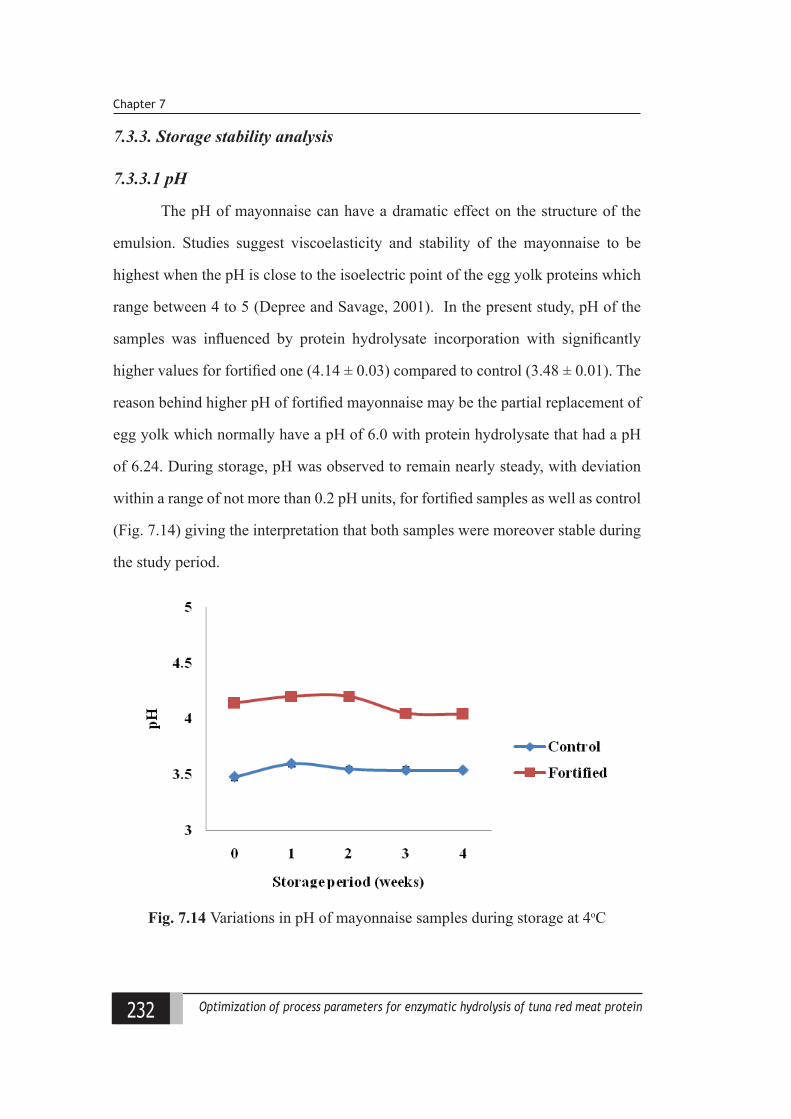
232 Optimization of process parameters for enzymatic hydrolysis of tuna red meat protein
Chapter 7
7.3.3. Storage stability analysis
7.3.3.1 pH
The pH of mayonnaise can have a dramatic effect on the structure of the
emulsion. Studies suggest viscoelasticity and stability of the mayonnaise to be
highest when the pH is close to the isoelectric point of the egg yolk proteins which
range between 4 to 5 (Depree and Savage, 2001). In the present study, pH of the
samples was influenced by protein hydrolysate incorporation with significantly
higher values for fortified one (4.14 ± 0.03) compared to control (3.48 ± 0.01). The
reason behind higher pH of fortified mayonnaise may be the partial replacement of
egg yolk which normally have a pH of 6.0 with protein hydrolysate that had a pH
of 6.24. During storage, pH was observed to remain nearly steady, with deviation
within a range of not more than 0.2 pH units, for fortified samples as well as control
(Fig. 7.14) giving the interpretation that both samples were moreover stable during
the study period.
Fig. 7.14 Variations in pH of mayonnaise samples during storage at 4oC
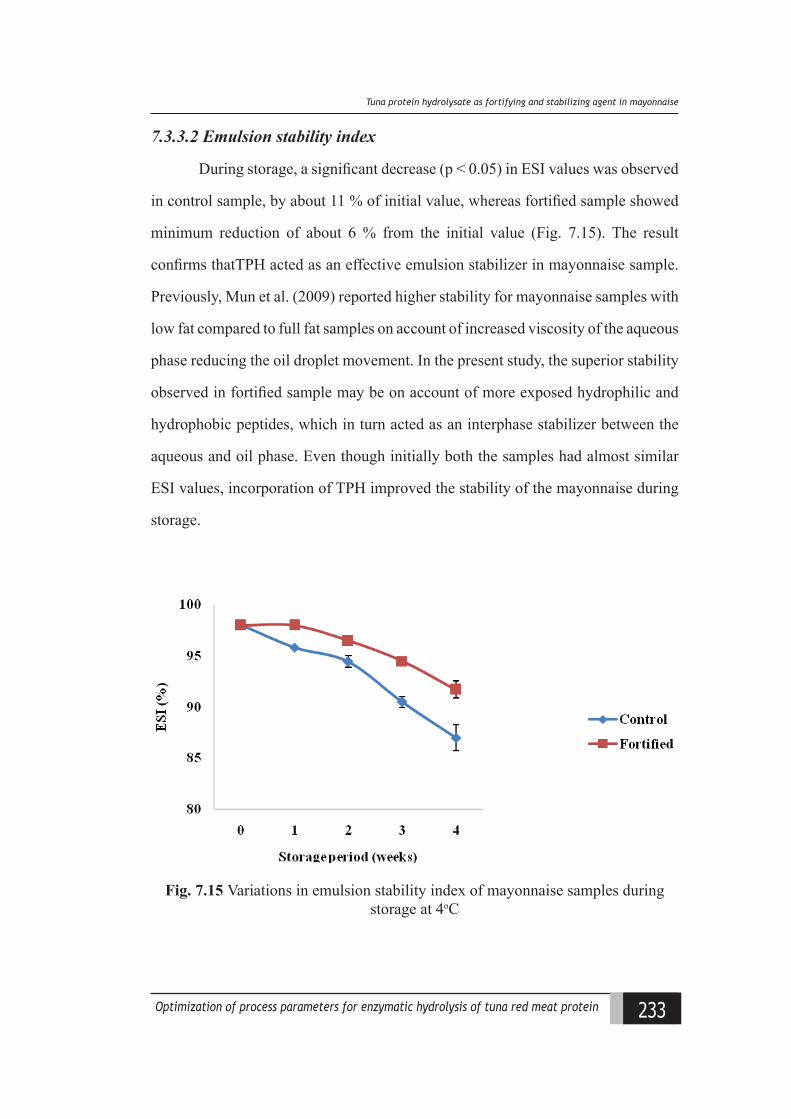
233Optimization of process parameters for enzymatic hydrolysis of tuna red meat protein
(una protein hydrolysate as fortifying and staliliiing agent in mayonnaise
7.3.3.2 Emulsion stability index
During storage, a significant decrease (p < 0.05) in ESI values was observed
in control sample, by about 11 % of initial value, whereas fortified sample showed
minimum reduction of about 6 % from the initial value (Fig. 7.15). The result
confirms thatTPH acted as an effective emulsion stabilizer in mayonnaise sample.
Previously, Mun et al. (2009) reported higher stability for mayonnaise samples with
low fat compared to full fat samples on account of increased viscosity of the aqueous
phase reducing the oil droplet movement. In the present study, the superior stability
observed in fortified sample may be on account of more exposed hydrophilic and
hydrophobic peptides, which in turn acted as an interphase stabilizer between the
aqueous and oil phase. Even though initially both the samples had almost similar
ESI values, incorporation of TPH improved the stability of the mayonnaise during
storage.
Fig. 7.15 Variations in emulsion stability index of mayonnaise samples during storage at 4oC
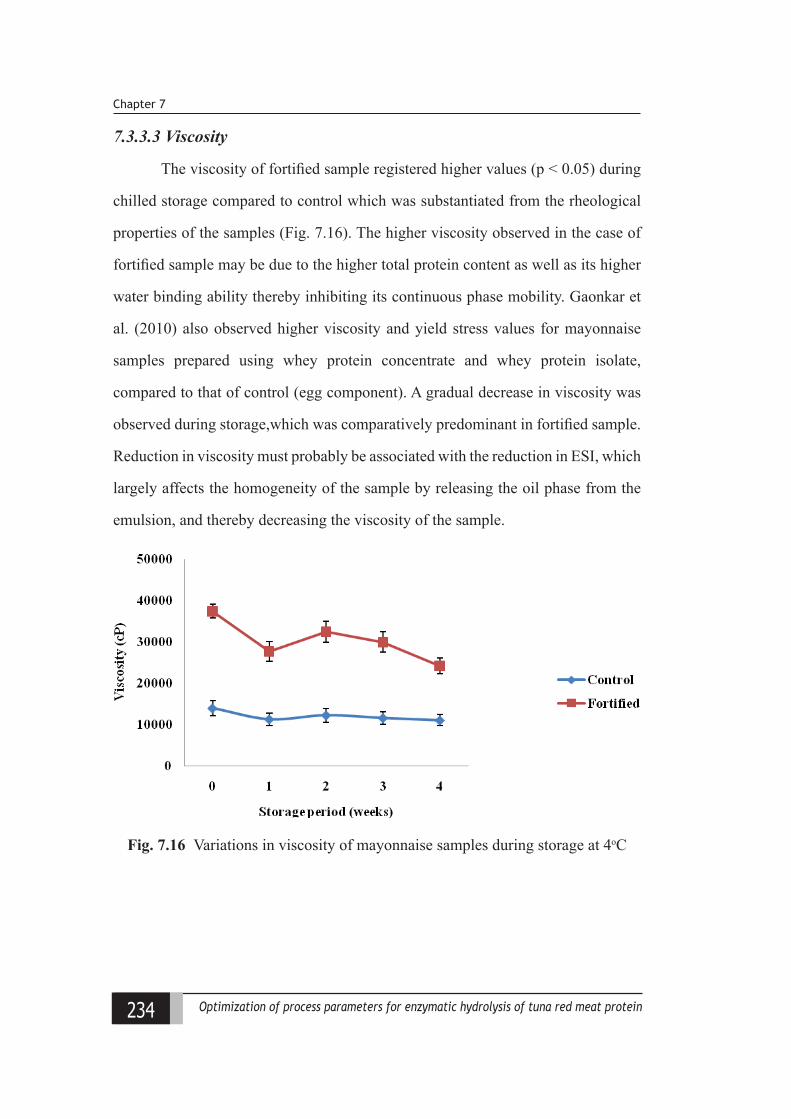
234 Optimization of process parameters for enzymatic hydrolysis of tuna red meat protein
Chapter 7
7.3.3.3 Viscosity
The viscosity of fortified sample registered higher values (p < 0.05) during
chilled storage compared to control which was substantiated from the rheological
properties of the samples (Fig. 7.16). The higher viscosity observed in the case of
fortified sample may be due to the higher total protein content as well as its higher
water binding ability thereby inhibiting its continuous phase mobility. Gaonkar et
al. (2010) also observed higher viscosity and yield stress values for mayonnaise
samples prepared using whey protein concentrate and whey protein isolate,
compared to that of control (egg component). A gradual decrease in viscosity was
observed during storage,which was comparatively predominant in fortified sample.
Reduction in viscosity must probably be associated with the reduction in ESI, which
largely affects the homogeneity of the sample by releasing the oil phase from the
emulsion, and thereby decreasing the viscosity of the sample.
Fig. 7.16 Variations in viscosity of mayonnaise samples during storage at 4oC
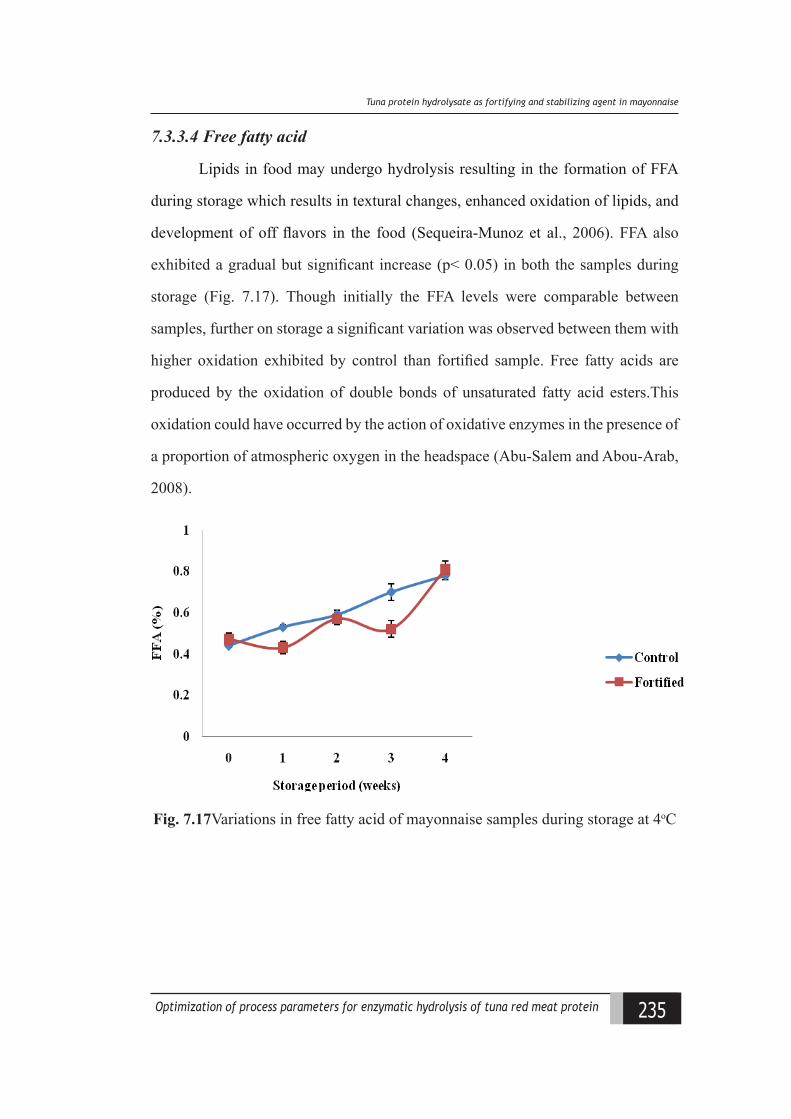
235Optimization of process parameters for enzymatic hydrolysis of tuna red meat protein
(una protein hydrolysate as fortifying and staliliiing agent in mayonnaise
7.3.3.4 Free fatty acid
Lipids in food may undergo hydrolysis resulting in the formation of FFA
during storage which results in textural changes, enhanced oxidation of lipids, and
development of off flavors in the food (Sequeira-Munoz et al., 2006). FFA also
exhibited a gradual but significant increase (p< 0.05) in both the samples during
storage (Fig. 7.17). Though initially the FFA levels were comparable between
samples, further on storage a significant variation was observed between them with
higher oxidation exhibited by control than fortified sample. Free fatty acids are
produced by the oxidation of double bonds of unsaturated fatty acid esters.This
oxidation could have occurred by the action of oxidative enzymes in the presence of
a proportion of atmospheric oxygen in the headspace (Abu-Salem and Abou-Arab,
2008).
Fig. 7.17Variations in free fatty acid of mayonnaise samples during storage at 4oC
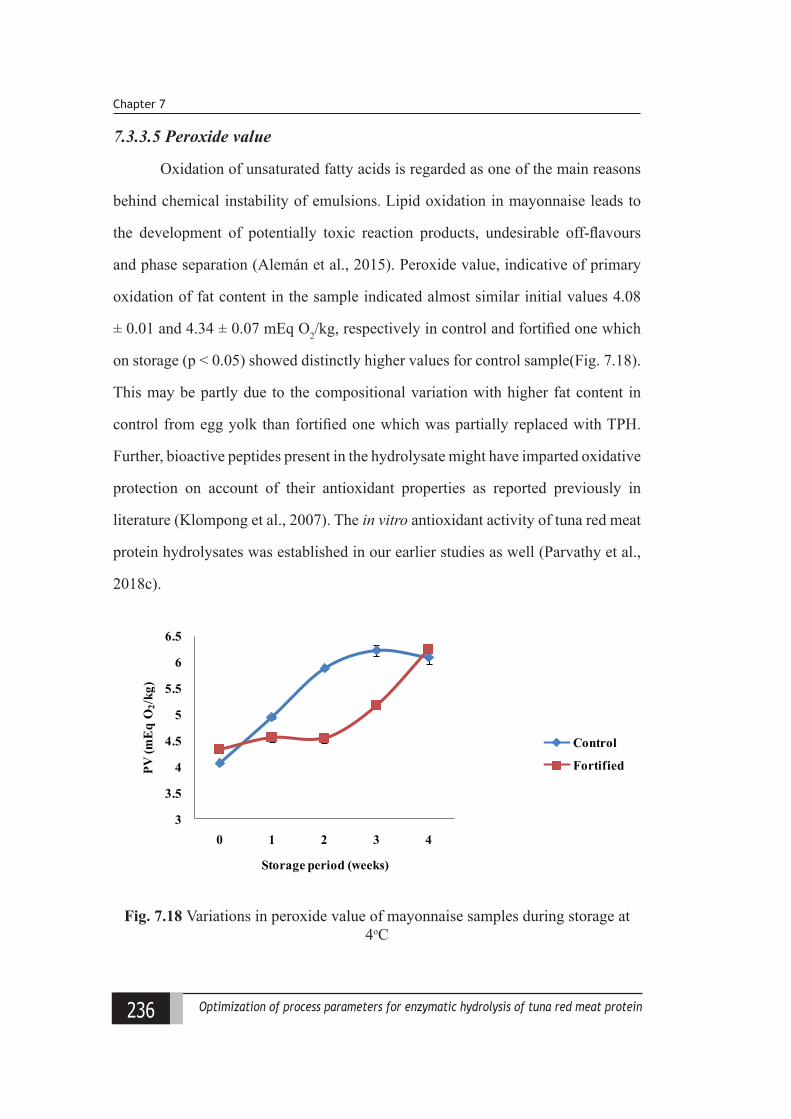
236 Optimization of process parameters for enzymatic hydrolysis of tuna red meat protein
Chapter 7
7.3.3.5 Peroxide value
Oxidation of unsaturated fatty acids is regarded as one of the main reasons
behind chemical instability of emulsions. Lipid oxidation in mayonnaise leads to
the development of potentially toxic reaction products, undesirable off-flavours
and phase separation (Alemán et al., 2015). Peroxide value, indicative of primary
oxidation of fat content in the sample indicated almost similar initial values 4.08
± 0.01 and 4.34 ± 0.07 mEq O2/kg, respectively in control and fortified one which
on storage (p < 0.05) showed distinctly higher values for control sample(Fig. 7.18).
This may be partly due to the compositional variation with higher fat content in
control from egg yolk than fortified one which was partially replaced with TPH.
Further, bioactive peptides present in the hydrolysate might have imparted oxidative
protection on account of their antioxidant properties as reported previously in
literature (Klompong et al., 2007). The in vitro antioxidant activity of tuna red meat
protein hydrolysates was established in our earlier studies as well (Parvathy et al.,
2018c).
3
3.5
4
4.5
5
5.5
6
6.5
0 1 2 3 4
PV (m
Eq
O2/
kg)
Storage period (weeks)
Control
Fortified
Fig. 7.18 Variations in peroxide value of mayonnaise samples during storage at 4oC
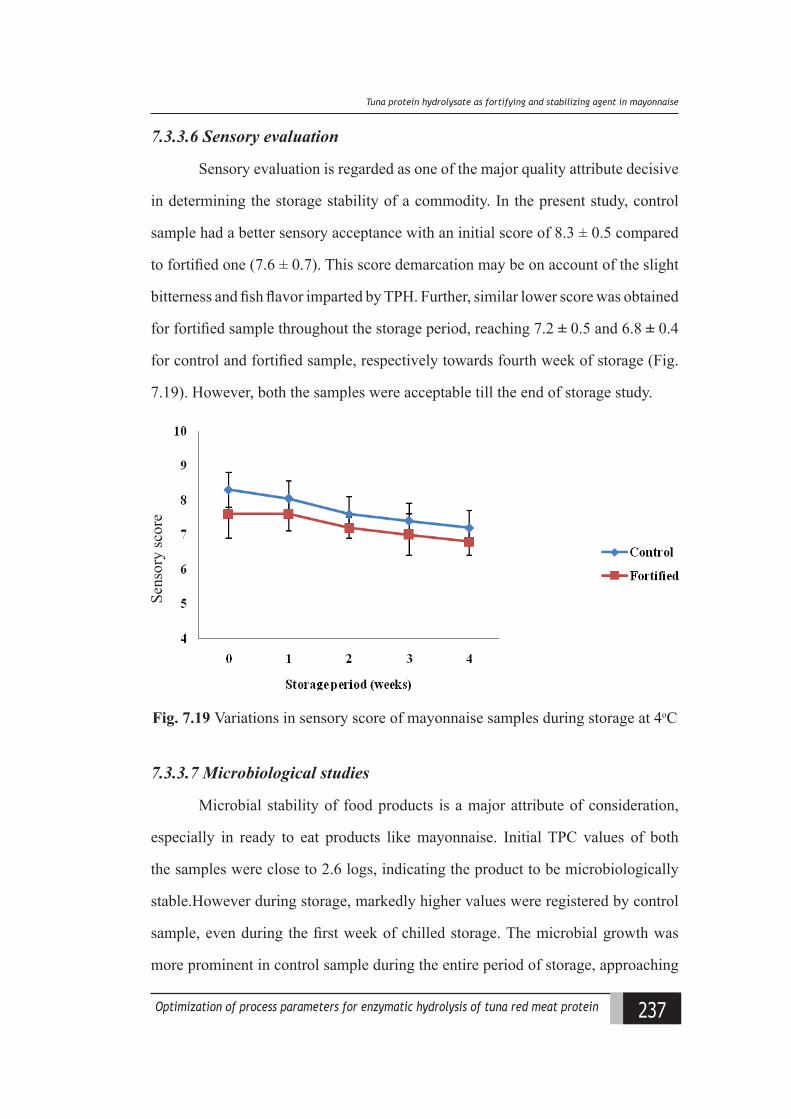
237Optimization of process parameters for enzymatic hydrolysis of tuna red meat protein
(una protein hydrolysate as fortifying and staliliiing agent in mayonnaise
7.3.3.6 Sensory evaluation
Sensory evaluation is regarded as one of the major quality attribute decisive
in determining the storage stability of a commodity. In the present study, control
sample had a better sensory acceptance with an initial score of 8.3 ± 0.5 compared
to fortified one (7.6 ± 0.7). This score demarcation may be on account of the slight
bitterness and fish flavor imparted by TPH. Further, similar lower score was obtained
for fortified sample throughout the storage period, reaching 7.2 ± 0.5 and 6.8 ± 0.4
for control and fortified sample, respectively towards fourth week of storage (Fig.
7.19). However, both the samples were acceptable till the end of storage study.
Sens
ory
scor
e
Fig. 7.19 Variations in sensory score of mayonnaise samples during storage at 4oC
7.3.3.7 Microbiological studies
Microbial stability of food products is a major attribute of consideration,
especially in ready to eat products like mayonnaise. Initial TPC values of both
the samples were close to 2.6 logs, indicating the product to be microbiologically
stable.However during storage, markedly higher values were registered by control
sample, even during the first week of chilled storage. The microbial growth was
more prominent in control sample during the entire period of storage, approaching
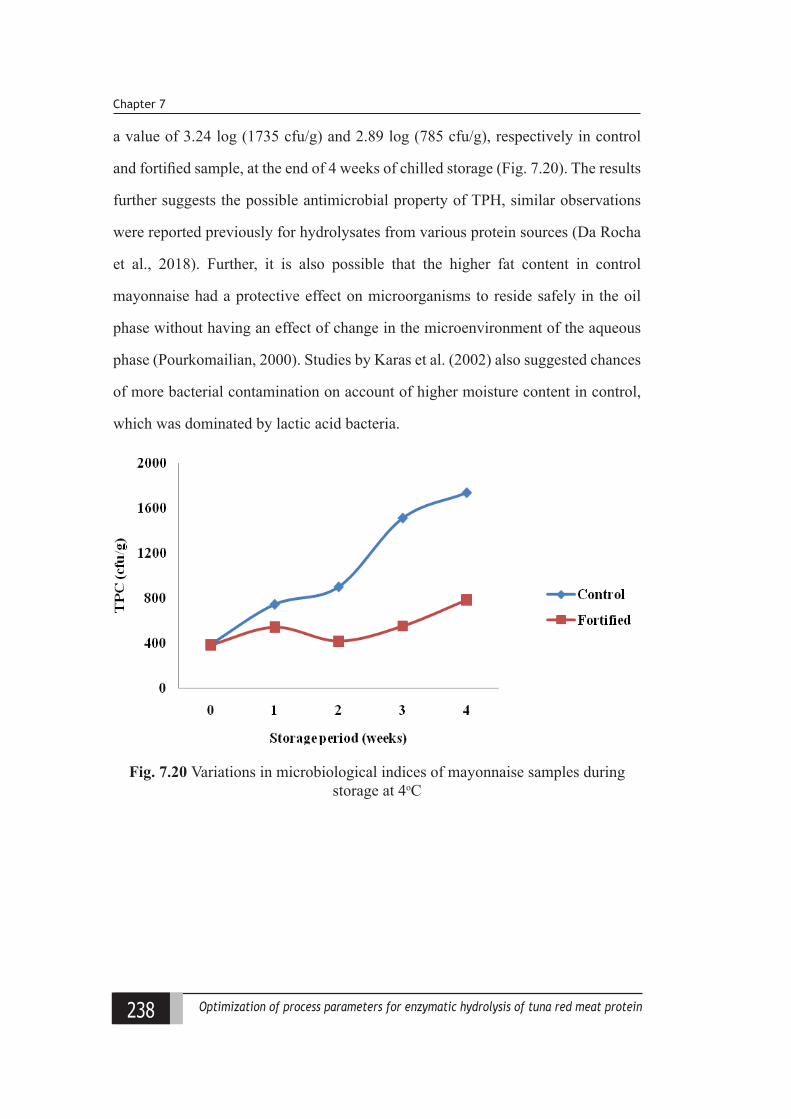
238 Optimization of process parameters for enzymatic hydrolysis of tuna red meat protein
Chapter 7
a value of 3.24 log (1735 cfu/g) and 2.89 log (785 cfu/g), respectively in control
and fortified sample, at the end of 4 weeks of chilled storage (Fig. 7.20). The results
further suggests the possible antimicrobial property of TPH, similar observations
were reported previously for hydrolysates from various protein sources (Da Rocha
et al., 2018). Further, it is also possible that the higher fat content in control
mayonnaise had a protective effect on microorganisms to reside safely in the oil
phase without having an effect of change in the microenvironment of the aqueous
phase (Pourkomailian, 2000). Studies by Karas et al. (2002) also suggested chances
of more bacterial contamination on account of higher moisture content in control,
which was dominated by lactic acid bacteria.
Fig. 7.20 Variations in microbiological indices of mayonnaise samples during storage at 4oC
239Optimization of process parameters for enzymatic hydrolysis of tuna red meat protein
(una protein hydrolysate as fortifying and staliliiing agent in mayonnaise
7.4 Conclusion
Fortified mayonnaise was attempted by partial replacement of egg yolk
with functionally optimized tuna protein hydrolysate. Incorporation of tuna protein
hydrolysate improved the nutritional status of the mayonnaise formulation. A
reduction in particle size and increased viscosity was observed in fortified sample.
Incorporation of TPH in mayonnaise modified the sample’s colour profile with
increased yellowness and redness in fortified formulation. Storage studies indicated
better oxidative stability for fortified samples compared to control during storage at
4oC. Present study explores the potentiality of protein hydrolysates in mayonnaise
preparations for fortification as well as better stability.

240 Optimization of process parameters for enzymatic hydrolysis of tuna red meat protein
Chapter 7
241Optimization of process parameters for enzymatic hydrolysis of tuna red meat protein
Utiliiation of (una red meat hydrolysate for fsh oil enaapsulation and enaapsulate aaaeptalility studies in seleated food produats
Chapter 8Utilization of Tuna red meat
hydrolysateforfishoilencapsulationand encapsulate acceptability studies
in selected food products8.1 Introduction
Encapsulation may be defined as a method which facilitates the entrapment
of one substance, being the compound of interest, also referred to as the active
agent within another substance viz., wall material. The encapsulated substance
can also be called as the core, fill, active, internal or payload phase while the
substance that is encapsulating is often referred to as the coating, membrane, shell,
capsule, carrier material, external phase, or matrix. It is an effective technique to
improve the stability and delivery of sensitive bioactive components like pigments,
minerals, vitamins, fatty acids, phytosterols, enzymes etc. as well as living cells
like probiotics into foods (Wandrey et al., 2010). These bioactive components are
completely enveloped and protected by a physical barrier/wallcoating without any
protrusion of these bioactive components, which in turn facilitates the controlled
and extended release of the core contents under specific conditions. Among the
different encapsulation techniques followed, spray drying is one of the oldest and
most common method adopted in the food industry on account of its flexible,
continuous, economic operations and it produces particles of micro and nano scale
(< 40 μm) (Zuidam and Heinrich, 2010).However, one of the major constraint
242 Optimization of process parameters for enzymatic hydrolysis of tuna red meat protein
Chapter 8
associated with oil encapsulation is the elevated operational temperature and the
mechanical shearing during atomisation which destabilises the emulsion, leading to
capsule collapse and oxidation of fish oil (Binsi et al., 2017a).
Several authors like Serfert et al. (2009); Morales-Medina et al. (2016)have
reported that microencapsulation by spray drying in the presence of antioxidants
can enhance the storage stability of fish oil. It is also thought that the stabilization
efficiency of antioxidants may not be the same when they are used as wall material
component and as core material along with the oil. In addition, the ordered
orientation of wall and core polymers in capsular alignment is a major aspect
affecting the stability of emulsions during homogenisation and atomisation, thereby
the encapsulation efficiency and the integrity of the microcapsules. In this regard,
employing polymers exhibiting dual properties viz., emulsifiers with antioxidative
properties are desirable, which can physically stabilize the oil-in-water emulsions
during atomisation and protect oil encapsulates from oxidation during storage.
Protein hydrolysates are breakdown products of proteins into smaller
peptides obtained by the enzymatic/chemical process. These peptides, based on the
extent of hydrolysis possess superior bioactivity compared to their parent proteins.
Recent studies have suggested the applicability of fish protein hydrolysate as
antioxidants in microencapsulated fish oil stabilization when used along with core
material (Morales-Medina et al., 2016).As previously researched, this observed
stability was mainly ascribed to the antioxidant properties of hydrolysates with their
superior free radical scavenging and metal chelating activities (Qian et al., 2008;
Sheriff et al., 2014). A second probable mechanism of use in microencapsulation
is the strengthening of capsular wall matrix by these peptides by acting as co-wall
polymers or rather as fillers, owing to their smaller size. In addition, the superior
emulsifying properties of protein hydrolysates are also thought to be helpful in the
243Optimization of process parameters for enzymatic hydrolysis of tuna red meat protein
Utiliiation of (una red meat hydrolysate for fsh oil enaapsulation and enaapsulate aaaeptalility studies in seleated food produats
structured orientation of core and wall polymers in the emulsion droplets, thereby
minimising capsular collapse during atomisation.
Tuna red meat which serves as a cheap and high-quality protein source,
was ideally utilized by converting to hydrolysates with desirable functional and
bioactive properties with the assumption that tuna protein hydrolysate significantly
improve the structural and oxidative stability of fish oil during both spray drying
and further storage. In the present work, a comparison was made between the
efficiency of yellowfin tuna (Thunnus albacares) red meat hydrolysate as wall
and core polymer for encapsulating sardine oil. Further, the storage stability of the
encapsulates under accelerated atmosphere (60oC), ambient temperature (28oC) and
chilled temperature (4oC) were evaluated.
8.2 Materials and methods
8.2.1 Raw materials, enzymes and chemicals
Fish oil extracted from Indian oil sardine (Sardinella longiceps) was procured
from a local seafood processing factory, analysed for the fatty acid composition
and was used for microencapsulate core preparation. Protein hydrolysate from the
red meat of yellow fin tuna optimized for antioxidant properties (chapter 4; table
4.3) was used for the study. Sodium caseinate (SRL Pvt. Ltd., Mumbai, India),
maltodextrin,gum Arabic, pepsin (activity 1 Anson unit/gm of protein), pancreatin
4 X (3 NF/USP from porcine pancreas) (Hi Media Pvt Ltd., Mumbai, India) were
used for the study. All chemicals of analytical grade were used for the study.
8.2.2 Fatty acid profiling
Fatty acid composition of sardine oil and sardine oil encapsulates were
determined in the present investigation. Total lipid was extracted from the
encapsulates by the method of Folch et al. (1957). Known quantity of sample was
244 Optimization of process parameters for enzymatic hydrolysis of tuna red meat protein
Chapter 8
triturated with 15 times the sample volume of ice cold chloroform: methanol (2:1)
and allowed to stand for five minutes for lipid extraction. It was then filtered and
transferred to a separating funnel to which water was added to a level of 20 % of
the filtrate. The flask was mixed well, released off vapour and allowed for phase
separation, overnight. The lower chloroform phase was passed through anhydrous
sodium sulphate and collected in a flat bottom flask. Solvent was completely
evaporated using a rotary evaporator and the lipid residue was dissolved in known
quantity of chloroform (about 10 ml). About one ml of the chloroform extract
was evaporated off the solvent under nitrogen or in case of oil or fat 25-100 mg
sample was taken in a 30 ml teflon lined screw capped test tube. For the purpose of
saponification, about 1.5 ml of 0.5 M methanolic NaOH was added, blanketed with
nitrogen gas, closed tightly and heated at 100oC for five mins. Further the tube was
cooled and 2 ml of boron trifluoride methanol was added, blanketed with nitrogen
gas, tightly closed and heated at 100oC for 30 mins. The tube was further cooled
and one ml of n-hexane was added and mixed thoroughly followed by the addition
of 5 ml saturated sodium chloride solution. The test tube cap was loosened and
allowed for phase separation for 5 to 10 mins. From the mixture, about 0.8 ml of
the upper hexane phase was carefully transferred into a test tube. The process was
repeated one more time to extract with 1 ml of hexane and the extract was pooled.
The solvent was evaporated to concentrate fatty acid methyl esters (FAME) which
was injected to gas chromatogram. Fatty acid composition analysis was performed
using gas chromatography (Varian, Guindy, Chennai; Model no: CP-3800) with a
Cpsil 88FAME column (100 m length x 0.25 mm internal diameter; 0.20 μm film
thicknesses. Nitrogen was used as the carrier gas. Injector and detector temperatures
were set at 260oC and 270oC, respectively. Injection was performed in split mode
(1:50). The column temperature was programmed initially at 140oC for 2 min and
then to increase at a uniform rate to reach a final temperature of 240oC in one
245Optimization of process parameters for enzymatic hydrolysis of tuna red meat protein
Utiliiation of (una red meat hydrolysate for fsh oil enaapsulation and enaapsulate aaaeptalility studies in seleated food produats
hour time. A flame ionization detector was employed and peaks were identified by
comparing the mass spectra with the mass spectral database.
Fig. 8.1 Gas chromatograph
8.2.3 Preparation of emulsion and spray drying
The composition of the emulsion was prepared with fish oil (core material)
to wall material in the ratio 1:5. The wall materials consisted of maltodextrin,
gum Arabic and sodium caseinate (2:2:1) in control (SO). Sodium caseinate was
partially (1:1) and completely replaced with protein hydrolysate for comparison in
which hydrolysate acted as a wall material component. Hereafter the encapsulate
where sodium caseinate was partially replaced is referred to as SPO and completely
replaced with protein hydrolysate is coded as PO. Another emulsion combination
consisted of fish oil containing 1 % protein hydrolysate (w/w of fish oil), where
hydrolysate acted as core material component, hereafter referred to as SOP. This
particular concentration of hydrolysate was selected based on ABTS IC50 value
of hydrolysate from previous studies which was observed to be 7.42 mg/ml. For
emulsion, wall materials were dissolved in distilled water and kept overnight at
chilled condition (4oC) to ensure full saturation of the polymer molecules. To the
saturated mixture, fish oil was added dropwise with continuous stirring at 1000 rpm
for 10 min using magnetic stirrer. The mixture was then homogenized with a high
246 Optimization of process parameters for enzymatic hydrolysis of tuna red meat protein
Chapter 8
speed homogenizer (Poly system PT 2100, Kinematica, AG) at 25,000 rpm for 5
min. Prior to spray drying, the emulsions were allowed to stabilize at 4oC for 1 h.
Spray drying was done using a pilot-scale spray dryer (Hemraj Pvt.
Ltd, Mumbai) equipped with a two-fluid nozzle atomizer under the following
experimental conditions viz., inlet temperature 160°C; outlet temperature 80°C;
spray flow feed nozzle diameter 1.5 mm; air pressure 2.5 bar. Fish oil encapsulates
prepared by spray drying were stored in air tight containers for further analysis.
8.2.4 Characterization of emulsion
8.2.4.1 Emulsion stability index
Emulsions were prepared employing sardine oil and wall material in 1:5
ratio in the previously described combinations (Section 8.2.3). Aliquot of prepared
emulsions (150 ml) were transferred to graduated test tubes and kept at 4oC for 24
h. After this time period, bulk unseparated phase volume was measured and the
stability was expressed as:
Emulsion Stability Index (%) = x 100
where H0 represented the initial emulsion volume and H1,the unseparated phase
volume.
8.2.5 Characterization of microencapsulates
8.2.5.1 Scanning electron microscopy
The surface appearance and morphology of sardine oil encapsulates was
monitored by employing SEM (Philips XL 30, The Netherlands). Samples were
fixed onto double-sided adhesive carbon tabs mounted on SEM stubs, coated
with gold in vacuum using sputter coater, and examined by SEM at 10kV with
magnification of 800 x.
247Optimization of process parameters for enzymatic hydrolysis of tuna red meat protein
Utiliiation of (una red meat hydrolysate for fsh oil enaapsulation and enaapsulate aaaeptalility studies in seleated food produats
Fig. 8.2 Scanning electron microscope
8.2.5.2 Differential scanning colorimetry
Thermal characteristics of the sample were determined by employing
differential scanning calorimeter (described in chapter 6; section 6.2.2.5.2).
Fig. 8.3 Differential scanning colorimeter
8.2.5.3 Fourier-transform infrared spectroscopic analysis
The FTIR spectra of encapsulates were recorded using a FTIR spectrometer
(Shimadzu IR-Prestige-21) (described in chapter 6; section 6.2.2.5.3).
248 Optimization of process parameters for enzymatic hydrolysis of tuna red meat protein
Chapter 8
Fig. 8.4 Fourier-transform infrared spectroscope
8.2.5.4 Encapsulation efficiency
Encapsulation efficiency (EE) throws idea regarding the efficacy of
encapsulation adopted. This is accounted by determining the relationship between
total oil and surface oil/free oil of the sample. Soxhlet method (AOAC, 2012) was
adopted to determine the total oil and free oil was determined as per the methodology
described by Sankarikutty et al. (1988). About 2.5 g of oil encapsulate was mixed
with 100 ml n-hexane with continuous stirring at ambient temperature for 15 min
and then passed through Whatmann No. 4 filter paper. The solvent was evaporated
in a rotary evaporator and the extracted oil was dried to constant weight by using a
stream of nitrogen.
EE (%) =
249Optimization of process parameters for enzymatic hydrolysis of tuna red meat protein
Utiliiation of (una red meat hydrolysate for fsh oil enaapsulation and enaapsulate aaaeptalility studies in seleated food produats
8.2.6 Physical properties of microencapsulates
8.2.6.1 Moisture content and hygroscopicity
Moisture content was evaluated from the percentage loss in sample weight
after oven drying at 105°C until it reached a constant weight in comparison to the
initial sample weight (AOAC, 2012).
Sample hygroscopicity was determined adopting the methodology of Cai and
Corke (2000) with slight modifications (described in chapter 6; section 6.2.2.6.1).
8.2.6.2 Bulk density and tapped density
Methodology described by Chinta et al. (2009) was followed for determining
bulk density (ρB) and tapped densities (ρT) of the samples to understand the flow
properties exhibited by them (described in chapter 6; section 6.2.2.6.2).
8.2.6.3 Colour
Colour of oil encapsulates were measured using Hunter- Lab scan XE –
Spectrocolorimeter (Color Flex, Hunter Associates Laboratory, Reston, USA.)
(described in chapter 6; section 6.2.2.6.3).
Fig. 8.5 Hunterlab colorimeter
250 Optimization of process parameters for enzymatic hydrolysis of tuna red meat protein
Chapter 8
8.2.7 In vitro oil release kinetics
In vitro oil release kinetics using simulated gastro-intestinal fluids were
studied by the methodology described by Burgar et al. (2009). The method in the US
Pharmacopeia (2000) was adapted for the preparation of simulated gastrointestinal
fluids. For making simulated gastric fluid (SGF), sodium chloride (2.0 g) and 36
% HCl (7.0 ml) were dissolved in 900 ml of deionised water. Pepsin (3.2 g) was
then added and the pH of the solution was adjusted to 1.2. The final volume was
made up to one litre and the solution stored at 4 °C until further use. Simulated
intestinal fluid (SIF) was prepared by dissolving potassium hydrogen phosphate
(6.8 g) in 900 ml of deionised water. Sodium hydroxide (0.2 M, 77 ml) and 100.0 g
of pancreatin were then added and the solution was left stirring overnight at 4 °C.
The pH was adjusted to 6.8 with 1 M sodium hydroxide or with 1 M HCl and the
final volume was made up to one litre with deionised water. Both the solutions were
stored at 4 °C until further use.
A known quantity of oil encapsulates (about 5.0 g) were initially subjected
to gastric digestion using SGF (50 ml) containing pepsin at 37oC for 2 h under
acidic condition (pH 1.2) in a shaking water bath. Further, pH was adjusted to 6.8
using 1 M sodium hydroxide and SIF (50 ml) was added and intestinal digestion
was continued under similar temperature conditions for another 3 h. The quantity of
oil released from the microcapsules after exposure to SGF and SIF was determined
separately by the method given by Millqvist-Fureby (2003). Solvent extraction
method with petroleum ether was adopted for the released oil estimation. The
whole sample, following exposure to gastric or gastric and intestinal fluids, was
transferred into a stoppered separating funnel. Petroleum ether (75 ml) was added
and the solution was mixed thoroughly. This was followed by the aqueous and
organic solvent phase separation. The extraction process was repeated twice, using
251Optimization of process parameters for enzymatic hydrolysis of tuna red meat protein
Utiliiation of (una red meat hydrolysate for fsh oil enaapsulation and enaapsulate aaaeptalility studies in seleated food produats
25 ml petroleum ether each time. The solvent phases were pooled together and
petroleum ether was removed at 60°C using a rotary evaporator and further dried in
a hot air oven at 100 ± 2°C for 1 h and cooled in a dessicator to room temperature.
From the weight of the extracted oil, the percentage of released oil in the sample
was calculated.
8.2.8 Storage stability of sardine oil encapsulates
Oxidative stability of fish oil encapsulates stored under accelerated
temperature of 60ºC was determined for one week on a daily basis by hot air oven
method. At ambient (28°C) and refrigerated (4°C) temperature, they were analysed
for upto 4 weeks at weekly interval. The sardine oil encapsulates were stored in
sealed and aluminium foil wrapped glass bottles to avoid exposure to oxygen and
light.
Peroxide value was determined following the methodology of Shantha
and Decker (1994). About 0.3 g of sample was mixed with 1.5 ml ofisooctane/2-
propanol (3:1, v/v) and vortexed at high speed. The organic phase was separated
bycentrifugation at 10,000 rpm for 2 min. To the organic solvent phase (0.2 ml),
2.8 ml of methanol/1-butanol(2:1, v/v) was added followed by addition of 30 μl of
ammonium thiocyanate and ferrous solution mixture and mixed well. The mixture
was incubated for 20 min and the absorbance measured at 510 nm. Hydroperoxide
concentration in the sample was determined using a standard curve (in triplicate)
made from cumene hydroperoxide and expressed in mmol of oxygen per kg.
Thiobarbituric acid reactive substances (TBARS) were assessed as per
McDonald and Hultin (1987). About 2 ml of thiobarbituric acid reagent was taken
in test tube into which 1 ml of the sample (5 mg of fish oil encapsulate in 1 ml of
acetate buffer) was added. For blank, sample was replaced with distilled water. Test
tubes were closed and vortexed thoroughly followed by incubation in boiling water
252 Optimization of process parameters for enzymatic hydrolysis of tuna red meat protein
Chapter 8
bath (100oC) for 15 min. Further it was cooled for 10 min and centrifuged at 1,000
rpm for 15 min. The absorbance of the supernatant was measured at 532 nm and
TBARS was expressed in mg of malonaldehyde/kg.
The variations in colour of microencapsulates were determined by Hunter-
Lab scan XE– Spectrocolorimeter (Color Flex, Hunter Associates Laboratory,
Reston, USA.) as described previously.
8.2.9 Product acceptability studies
The encapsulate selected with respect to its efficiency and stability was
subjected to acceptability studies for determining the encapsulate concentration
applicable in different food products without significantly affecting its sensory
parameters.Four different products viz.,milk, juice,corn flakes and noodles which
vary in ingredient composition and preparation methods were chosen. For the
study, a semi-trained panel consisting of 10 members was constituted for testing the
acceptability (Annexure 3). Encapsulate was added @ 2.5, 5.0, 7.5 and 10 % levels
in the selected food products and one was kept as control (no added encapsulate).
Sensory acceptability was conducted based on appearance, flavor, odour, taste, colour
and overall acceptability to determine the maximum permissible concentration of
encapsulate in these products. Further evaluation of the nutrient enrichment by
incorporation of the acceptable concentration of encapsulate in these four products
was also performed.
8.2.10 Statistical analysis
SPSS software version 16.0 (SPSS Inc, Chicago, Illinois, USA) was used
to conduct one way analysis of variance (ANOVA) on the data obtained. Duncan’s
multiple range test was adopted to determine the differences between the means and
were considered significant at 5 % levels (p<0.05).
253Optimization of process parameters for enzymatic hydrolysis of tuna red meat protein
Utiliiation of (una red meat hydrolysate for fsh oil enaapsulation and enaapsulate aaaeptalility studies in seleated food produats
8.3 Results and discussion
8.3.1 Fatty acid profiling
Fatty acid profiling of the sardine oil used for encapsulation indicated
palmitic acid to be the major contributor with 25.81% of the total fatty acids. A
high proportion of DHA (11.94%) and EPA (9.18%) were also observed in the
sample (Table 8.1) which was in agreement with previously reported values (Som
and Radhakrishnan, 2013; Binsi et al., 2017a). The fatty acid profile of the sardine
oil encapsulates also showed prominence of these components. Among the various
encapsulates, SOP samples showed comparable fatty acid profile as that of fresh
sardine oil. However, the content of unsaturated fatty acids, in particular the omega-3
fatty acids were markedly lower in PO samples compared to fresh sardine oil and
other oil encapsulates indicating the loss of these fatty acids to greater extend in PO
sample. This was assumed to be on account of severe oxidation of core oil during
homogenisation and subsequent atomisation.
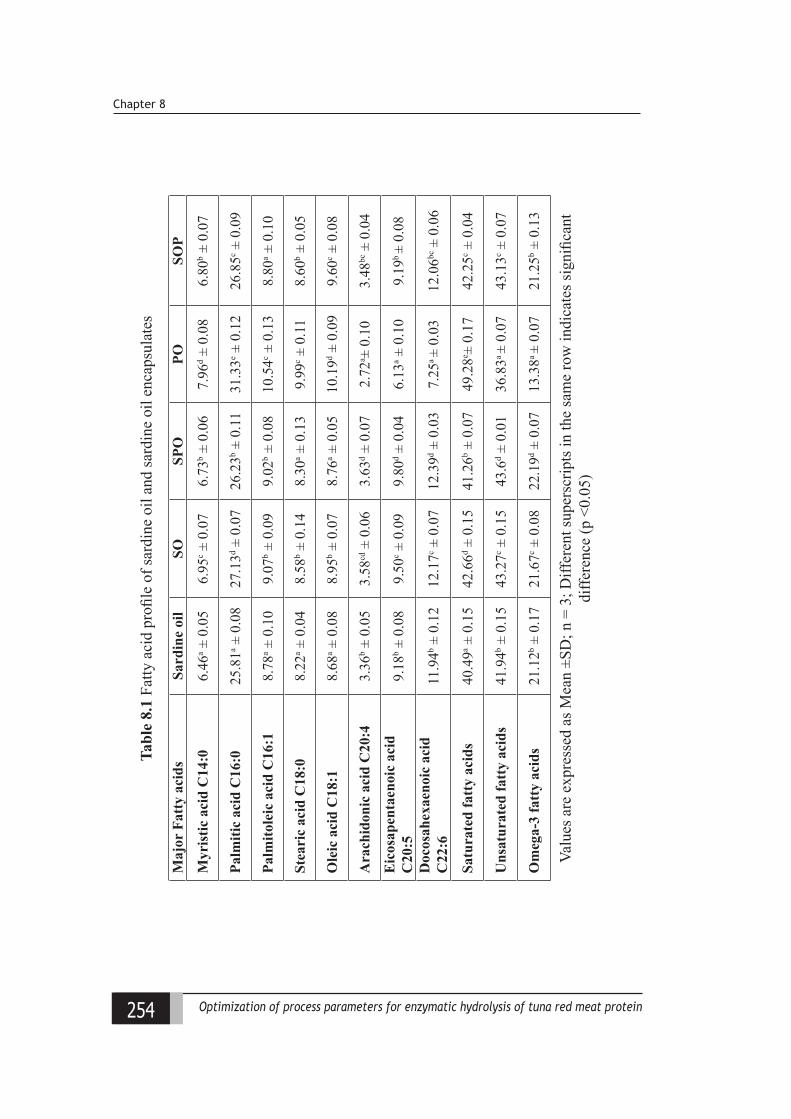
254 Optimization of process parameters for enzymatic hydrolysis of tuna red meat protein
Chapter 8
Maj
or F
atty
aci
dsSa
rdin
e oi
lSO
SPO
POSO
P
Myr
istic
aci
d C
14:0
6.46
a ± 0
.05
6.95
c ± 0
.07
6.73
b ± 0
.06
7.96
d ± 0
.08
6.80
b ± 0
.07
Palm
itic
acid
C16
:025
.81a ±
0.0
827
.13d ±
0.0
726
.23b ±
0.1
131
.33e ±
0.1
226
.85c ±
0.0
9
Palm
itole
ic a
cid
C16
:18.
78a ±
0.1
09.
07b ±
0.0
99.
02b ±
0.0
810
.54c ±
0.1
38.
80a ±
0.1
0
Stea
ric
acid
C18
:08.
22a ±
0.0
48.
58b ±
0.1
48.
30a ±
0.1
39.
99c ±
0.1
18.
60b ±
0.0
5
Ole
ic a
cid
C18
:18.
68a ±
0.0
88.
95b ±
0.0
78.
76a ±
0.0
510
.19d ±
0.0
99.
60c ±
0.0
8
Ara
chid
onic
aci
d C
20:4
3.36
b ± 0
.05
3.58
cd ±
0.0
63.
63d ±
0.0
72.
72a ±
0.1
03.
48bc
± 0
.04
Eic
osap
enta
enoi
c ac
id
C20
:59.
18b ±
0.0
89.
50c ±
0.0
99.
80d ±
0.0
46.
13a ±
0.1
09.
19b ±
0.08
Doc
osah
exae
noic
aci
d C
22:6
11.9
4b ± 0
.12
12.1
7c ± 0
.07
12.3
9d ± 0
.03
7.25
a ±
0.03
12.0
6bc ±
0.0
6
Satu
rate
d fa
tty
acid
s40
.49a ±
0.1
542
.66d ±
0.1
541
.26b ±
0.0
749
.28e ±
0.1
742
.25c ±
0.0
4
Uns
atur
ated
fatt
y ac
ids
41.9
4b ± 0
.15
43.2
7c ± 0
.15
43.6
d ± 0
.01
36.8
3a ±
0.07
43.1
3c ± 0
.07
Om
ega-
3 fa
tty
acid
s21
.12b ±
0.1
721
.67c ±
0.0
822
.19d ±
0.0
713
.38a
± 0.
0721
.25b ±
0.1
3
Tabl
e 8.
1 Fa
tty a
cid
profi
le o
f sar
dine
oil
and
sard
ine
oil e
ncap
sula
tes
Valu
es a
re e
xpre
ssed
as M
ean
±SD
; n =
3; D
iffer
ent s
uper
scrip
ts in
the
sam
e ro
w in
dica
tes s
igni
fican
t di
ffere
nce
(p <
0.05
)
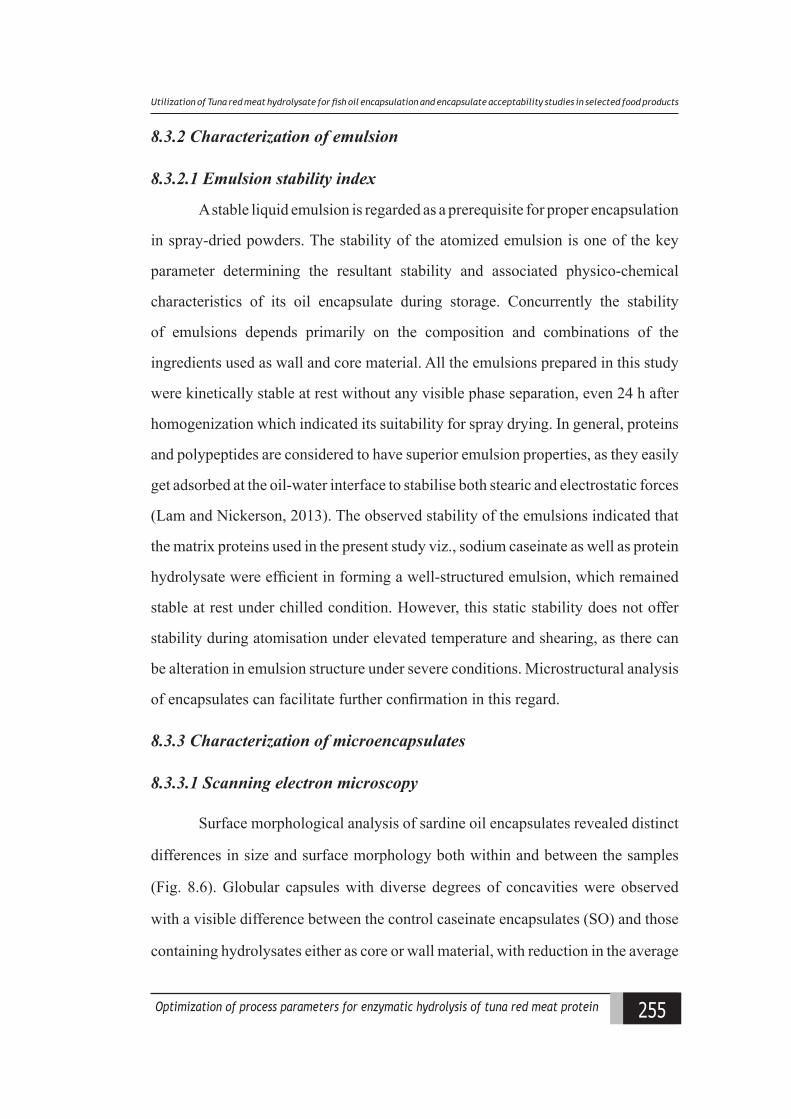
255Optimization of process parameters for enzymatic hydrolysis of tuna red meat protein
Utiliiation of (una red meat hydrolysate for fsh oil enaapsulation and enaapsulate aaaeptalility studies in seleated food produats
8.3.2 Characterization of emulsion
8.3.2.1 Emulsion stability index
A stable liquid emulsion is regarded as a prerequisite for proper encapsulation
in spray-dried powders. The stability of the atomized emulsion is one of the key
parameter determining the resultant stability and associated physico-chemical
characteristics of its oil encapsulate during storage. Concurrently the stability
of emulsions depends primarily on the composition and combinations of the
ingredients used as wall and core material. All the emulsions prepared in this study
were kinetically stable at rest without any visible phase separation, even 24 h after
homogenization which indicated its suitability for spray drying. In general, proteins
and polypeptides are considered to have superior emulsion properties, as they easily
get adsorbed at the oil-water interface to stabilise both stearic and electrostatic forces
(Lam and Nickerson, 2013). The observed stability of the emulsions indicated that
the matrix proteins used in the present study viz., sodium caseinate as well as protein
hydrolysate were efficient in forming a well-structured emulsion, which remained
stable at rest under chilled condition. However, this static stability does not offer
stability during atomisation under elevated temperature and shearing, as there can
be alteration in emulsion structure under severe conditions. Microstructural analysis
of encapsulates can facilitate further confirmation in this regard.
8.3.3 Characterization of microencapsulates
8.3.3.1 Scanning electron microscopy
Surface morphological analysis of sardine oil encapsulates revealed distinct
differences in size and surface morphology both within and between the samples
(Fig. 8.6). Globular capsules with diverse degrees of concavities were observed
with a visible difference between the control caseinate encapsulates (SO) and those
containing hydrolysates either as core or wall material, with reduction in the average
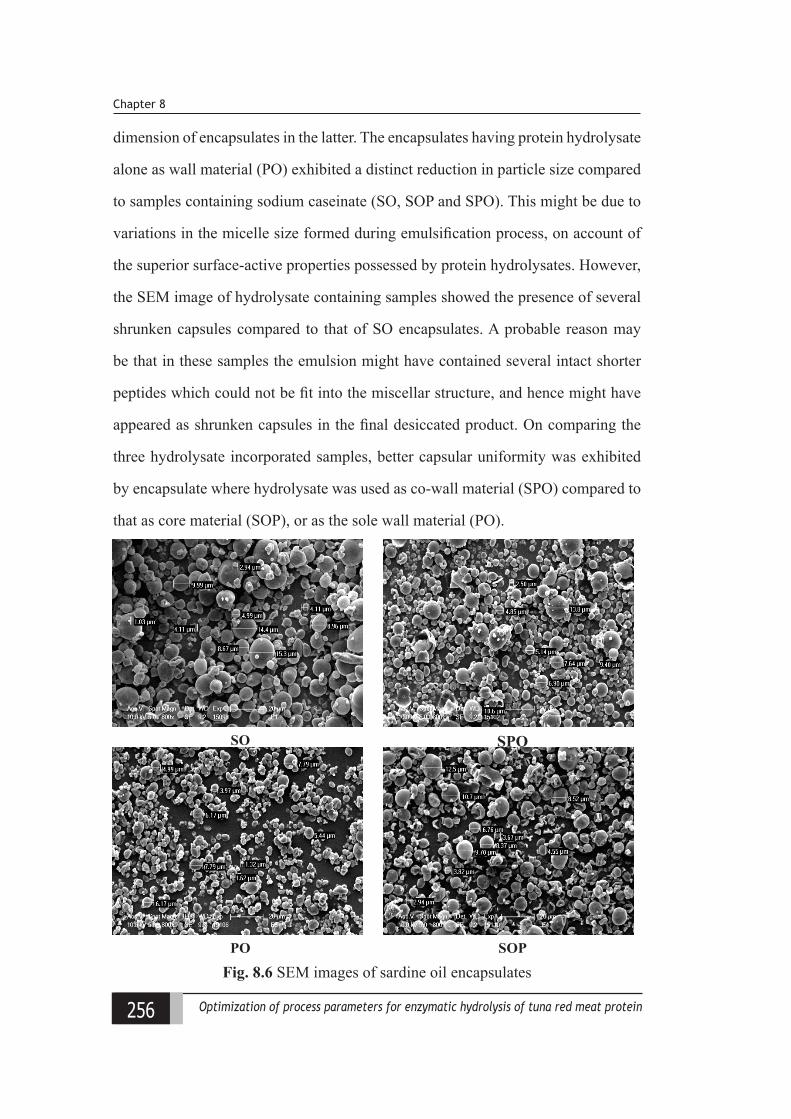
256 Optimization of process parameters for enzymatic hydrolysis of tuna red meat protein
Chapter 8
dimension of encapsulates in the latter. The encapsulates having protein hydrolysate
alone as wall material (PO) exhibited a distinct reduction in particle size compared
to samples containing sodium caseinate (SO, SOP and SPO). This might be due to
variations in the micelle size formed during emulsification process, on account of
the superior surface-active properties possessed by protein hydrolysates. However,
the SEM image of hydrolysate containing samples showed the presence of several
shrunken capsules compared to that of SO encapsulates. A probable reason may
be that in these samples the emulsion might have contained several intact shorter
peptides which could not be fit into the miscellar structure, and hence might have
appeared as shrunken capsules in the final desiccated product. On comparing the
three hydrolysate incorporated samples, better capsular uniformity was exhibited
by encapsulate where hydrolysate was used as co-wall material (SPO) compared to
that as core material (SOP), or as the sole wall material (PO).
SO SPO
PO SOP
Fig. 8.6 SEM images of sardine oil encapsulates

257Optimization of process parameters for enzymatic hydrolysis of tuna red meat protein
Utiliiation of (una red meat hydrolysate for fsh oil enaapsulation and enaapsulate aaaeptalility studies in seleated food produats
8.3.3.2 Differential scanning colorimetry
Thermal analysis of encapsulates were carried out to predict the crystallinity
and thermal behaviour of fish oil and microcapsules (Fig. 8.7). The DSC analysis of
pure sardine oil revealed three endothermic transitions corresponding to initial peak
temperature of 25.58oC and a second well defined melting curve with peak transition
at 30.83oC and the third minor transition at 84.27oC. The oil encapsulates, on the
other hand, showed distinctly different pattern with three different endothermic
transitions. The control SO encapsulate showed a glass transition at 25.33oC, closer
to that of pure fish oil. The incorporation of hydrolysate in the wall material slightly
reduced the glass transition point of encapsulates, whereas addition to core material
slightly increased the glass transition point. The well-defined melting transition
observed at 30.83oC of pure fish oil could not be detected in the thermogram of any
of the encapsulates. Instead, a distinct endothermic transition was observed at 71-
78oC, with the lowest temperature for SOP and the maximum for SO.This second
transition is more likely associated with the destabilisation of wall polymers owing
to helix-coil transformation of protein components. This was further confirmed by
the higher enthalpy of transition evidenced in hydrolysate containing samples, with
the highest value for PO followed by SOP and SPO. The endothermic transition
observed in pure fish oil at 84.27oC could not be detected in any of the encapsulates,
as it was merged with the second transition. However, a third endothermic transition
was evident at 102 -118oC with the lowest temperature for SO and the highest for
SOP. This point can be related to be the critical limit beyond which the amorphous
powders are prone to unfavourable changes like capsular collapse, oil release,
caking and stickiness further affecting their quality.
258 Optimization of process parameters for enzymatic hydrolysis of tuna red meat protein
Chapter 8
Sam
ple
Not
atio
n
Gla
ss tr
ansi
tion
Phas
e tra
nsiti
on I
Phas
e tra
nsiti
on II
Tran
sitio
n te
mpe
ratu
re
(o C)
Enth
alpy
(J
/g)
Tran
sitio
n te
mpe
ratu
re
(o C)
Enth
alpy
(J
/g)
Tran
sitio
n te
mpe
ratu
re
(o C)
Enth
alpy
(J
/g)
Sard
ine
oil
S25
.58
0.07
830
.83
-0.0
6584
.27
-0.2
8SO
E125
.33
0.16
77.2
6-0
.51
102.
82-0
.90
SPO
E224
.94
0.55
72.1
7-1
.38
115.
72-0
.54
POE3
25.3
10.
068
75.3
6-3
.71
113.
42-0
.39
SOP
E426
.88
0.29
71.0
7-2
.48
117.
92-0
.59
Fig.
8.7
The
rmal
cha
ract
eris
tics o
f sar
dine
oil
and
sard
ine
oil e
ncap
sula
tes
S
259Optimization of process parameters for enzymatic hydrolysis of tuna red meat protein
Utiliiation of (una red meat hydrolysate for fsh oil enaapsulation and enaapsulate aaaeptalility studies in seleated food produats
8.3.3.3 Fourier-transform infrared spectroscopic analysis
The encapsulates in the region of 4500 to 400 cm-1 were analysed for FTIR
pattern to figure out the interaction behaviour of wall materials as well as the
oxidation pattern of encapsulated fish oil. The amide-I band observed at 1649.14
cm-1 in SO which represents C=O stretching vibrations of amide groups coupled
with in-plane NH bending underwent a slight shift in band width toward higher
wave number in SPO and PO, and towards a lower wavenumber in SOP (Fig.
8.8). However, the Amide-II band that appeared at 1535.34 cm-1 in SO was much
compressed in SPO and PO, but shifted towards a higher wave number in SOP.
Moreover, an additional band at 1411.89 cm-1appeared in SPO and PO. Kong
and Yu (2007) mentioned that the bands between 1654 cm-1and 1658 cm-1were
assigned to alpha-helix while those between 1642 cm-1and 1624cm-1 to beta-pleated
components. The characteristic band for random coil conformation was assigned
to the band located at 1648 ± 2 cm-1. In the current study, the major structural
rearrangement was evident with the incorporation of hydrolysate as wall material,
from random coil to helical confirmation. However predominance of beta-pleated
conformation was observed when used along with core material. The amide-A
band, which represents NH stretching vibrations appeared at 3392.79 cm-1in SO
shifted towards lower band width in all the other samples with major shift in SOP.
Binsi et al. (2017c) reported the shifting of amide-A band towards lower frequency,
when the N-H group of a peptide is involved in a hydrogen bond. The major shift in
this band in SOP indicates the interaction between oil and the hydrolysate through
hydrogen bond, as expected during emulsion formation. However, amide-B band,
which also represent the NH stretching vibrations remained at the similar wave
length in all the samples.
260 Optimization of process parameters for enzymatic hydrolysis of tuna red meat protein
Chapter 8
The progress of oil oxidation was monitored by following the shift in
the characteristic groups of secondary and tertiary oxidation products. The band
at 2852.72 cm–1 in SO characteristic of the symmetric stretching vibration of the
aliphatic CH2, underwent slight shift to lower frequency in PO. Moreover, the band
corresponding to symmetric stretching vibration of aliphatic CH2 group present in
pure fish oil disappeared totally in all the encapsulates. The band corresponding
to ester carbonyl group of triglycerides observed at 1742.76 cm-1 in pure oil was
shifted to 1745.58 in SO, SPO and SOP, however, underwent minimum shift to
1743.65 in PO. This band is characteristic of the axial deformations of carbonyl
bonds, present in the majority of the oxidation products, and the broadening of this
band indicates the incidence of oxidation. Accordingly, in the present study, the area
under ester band followed the order of SOP<SO<SPO<PO, indicating extended
rate of oxidation in PO and SPO and a significantly lower value in SOP. The band
at 1147.69 assigned to the vibration of the C-O ester groups in pure sardine oil
shifted to 1149.57 cm-1 in all the encapsulates. However, the well pronounced C–H
stretching vibration of the cis-double bond observed in pure fish oil at 3011 cm-1
completely disappeared in all the encapsulates.Similarly, the bending vibrations of
the CH2 /CH3 observed at 1464 cm-1 in pure fish oil underwent major shift towards
lower frequency and was much condensed in all the encapsulates, indicating that all
the encapsulates underwent certain extent of oxidation during spray drying process.
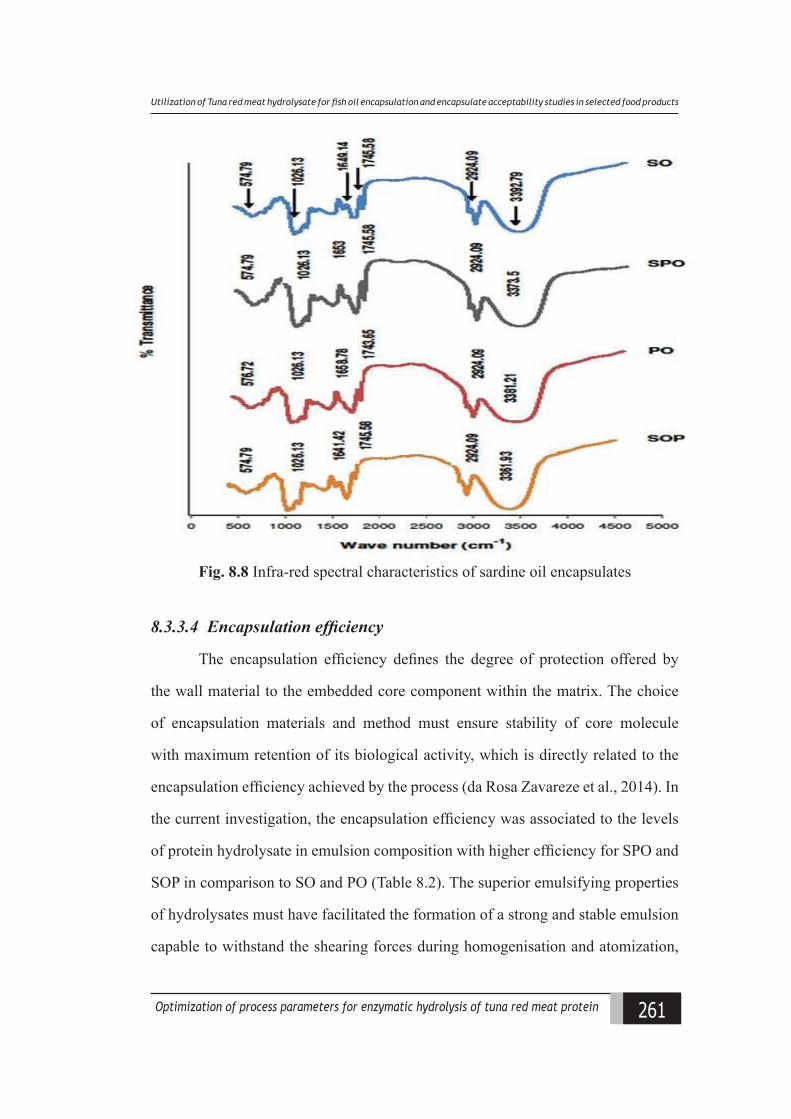
261Optimization of process parameters for enzymatic hydrolysis of tuna red meat protein
Utiliiation of (una red meat hydrolysate for fsh oil enaapsulation and enaapsulate aaaeptalility studies in seleated food produats
Fig. 8.8 Infra-red spectral characteristics of sardine oil encapsulates
8.3.3.4 Encapsulation efficiency
The encapsulation efficiency defines the degree of protection offered by
the wall material to the embedded core component within the matrix. The choice
of encapsulation materials and method must ensure stability of core molecule
with maximum retention of its biological activity, which is directly related to the
encapsulation efficiency achieved by the process (da Rosa Zavareze et al., 2014). In
the current investigation, the encapsulation efficiency was associated to the levels
of protein hydrolysate in emulsion composition with higher efficiency for SPO and
SOP in comparison to SO and PO (Table 8.2). The superior emulsifying properties
of hydrolysates must have facilitated the formation of a strong and stable emulsion
capable to withstand the shearing forces during homogenisation and atomization,
262 Optimization of process parameters for enzymatic hydrolysis of tuna red meat protein
Chapter 8
resulting in higher EE. However, the complete replacement of wall polymer with
hydrolysate significantly reduced the EE. This further suggests the possibility of
the formation of a weak capsule wall in PO encapsulates, supporting the hypothesis
that hydrolysate primarily act as filling polymers rather than as wall polymer.
8.3.4 Physical properties of microencapsulates
8.3.4.1 Moisture content
A major factor influencing the storage stability of dry powders is the
moisture content, which enhances oxidative and microbial deterioration during
storage.In the present study, the moisture content of the encapsulates ranged from
4.3 – 6.0 % (Table 8.2). It was observed that replacement of sodium caseinate with
protein hydrolysate as wall material resulted in a decrease in the moisture content.
SO encapsulates exhibited higher moisture content which might be due to larger
capsular size, hindering rapid diffusion and escapement of moisture during the
spray drying process. On the other hand, the hydrolysate rich in hydrophilic shorter
peptides reoriented the water molecules towards the capsular surface facilitating
quick release of moisture during atomization.
8.3.4.2 Hygroscopicity
One of the major determinant factors influencing the reconstitution property
of powder is its water absorption characteristics or hygroscopicity (Fernandes et
al., 2013). Simultaneously, hygroscopic powders easily absorb water from the
surrounding environment, developing stickiness and caking during storage affecting
the powder dispersibility, which is not desirable. Hence, moderate hygroscopic
nature is preferrable for spray-dried powders having desirable dispersibility and
storage stability.In the present study, incorporation of protein hydrolysate in the
emulsion increased the hygroscopicity of encapsulates(Table 8.2), which might be
due to the hygroscopic nature of hydrolysate itself (Mohan et al., 2015). In addition,
the smaller particle size of hydrolysate encapsulates as confirmed by microscopic
263Optimization of process parameters for enzymatic hydrolysis of tuna red meat protein
Utiliiation of (una red meat hydrolysate for fsh oil enaapsulation and enaapsulate aaaeptalility studies in seleated food produats
analysis, might have increased its surface area promoting more uptake of moisture
from the storage environment. The hygroscopicity of PO encapsulates was almost
double of that of SO samples, whereas SOP and SPO showed moderate values.
8.3.4.3 Bulk density and tapped density
Bulk density and tapped density are important parameters related to packing,
transport as well as distribution of powders. Though, high bulk density is preferred
from economic point of view, desirable flow properties demand low bulk density
to the powders. Both, bulk and tapped densities showed significantly higher values
when protein hydrolysate was used as wall material (SPO and PO), while showing
a lower value when used as core material along with fish oil (SOP) (Table 8.2).
The bulk density includes the contribution of the inter-particulate void
volume apart from true density of powder particles, hence also depends on size
and shape regularity of particles, and the spatial arrangement of particles in
powder bed(Binsi et al., 2017b). The increase in both bulk and tapped density
values associated with incorporation of hydrolysate in the wall material indicates
the formation of spherical microcapsules of smaller sizes in SPO and PO, as also
confirmed by SEM images, which might have facilitated the compact packing of
microencapsulates in a specific volume. Similarly, the lower bulk density coupled
with almost similar tapped density values observed in SOP encapsulates indicates
microcapsules of larger dimensions and lesser uniformity.
The carr index and hausner ratio are used to evaluate the flow properties
of powders (Fitzpatrick and Ahrné, 2005). In the present study, the flow property
indices revealed passable nature {1.26-1.34 (hausner ratio); 21-25 (carr index)} for
encapsulates, viz., SO (1.3; 23.21) and PO (1.31; 23.36), whereas the flow properties
were superior with fair flowability {1.19-1.25 (hausner ratio); 16-20 (carr index)}
for SPO (1.23; 18.67) and SOP (1.25; 19.84).
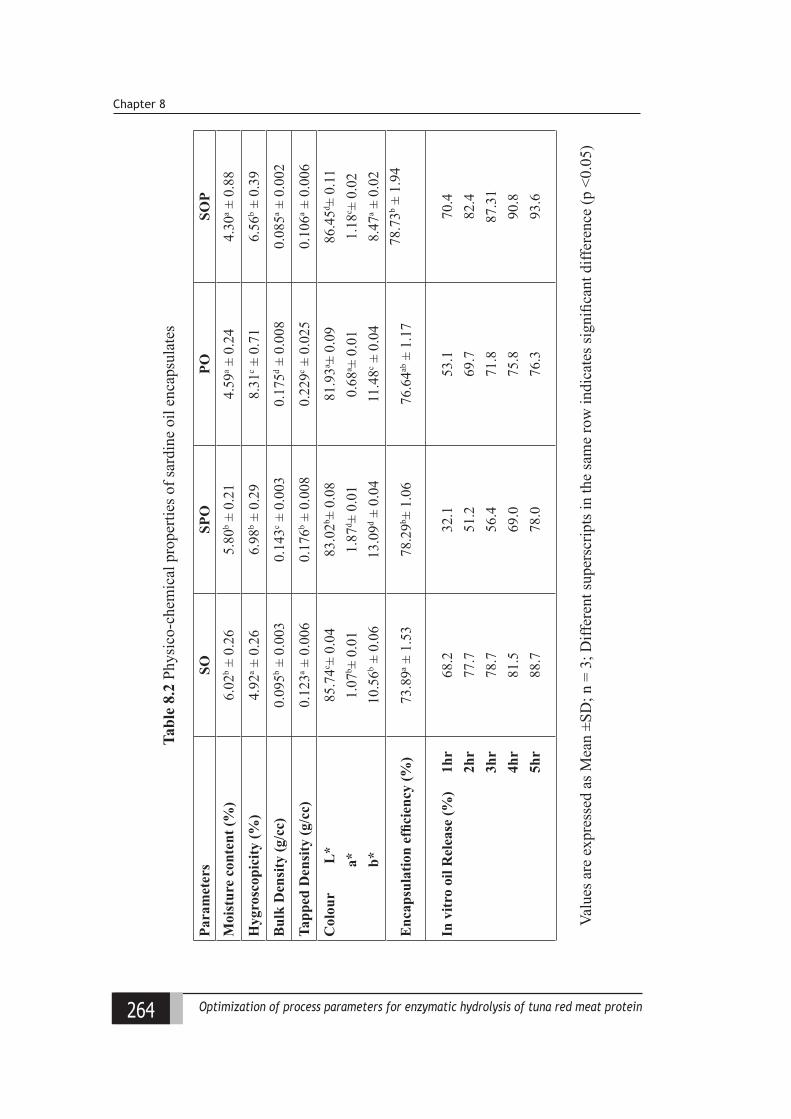
264 Optimization of process parameters for enzymatic hydrolysis of tuna red meat protein
Chapter 8
Tabl
e 8.
2 Ph
ysic
o-ch
emic
al p
rope
rties
of s
ardi
ne o
il en
caps
ulat
es
Para
met
ers
SOSP
OPO
SOP
Moi
stur
e co
nten
t (%
)6.
02b ±
0.2
65.
80b ±
0.2
14.
59a ±
0.2
44.
30a ±
0.8
8
Hyg
rosc
opic
ity (%
)4.
92a ±
0.2
66.
98b ±
0.2
98.
31c ±
0.7
16.
56b ±
0.3
9
Bul
k D
ensi
ty (g
/cc)
0.09
5b ± 0
.003
0.14
3c ± 0
.003
0.17
5d ± 0
.008
0.08
5a ± 0
.002
Tapp
ed D
ensi
ty (g
/cc)
0.12
3a ± 0
.006
0.17
6b ± 0
.008
0.22
9c ± 0
.025
0.10
6a ± 0
.006
Col
our
L*
a*
b*
85.7
4c ± 0
.04
1.07
b ± 0
.01
10.5
6b ± 0
.06
83.0
2b ± 0
.08
1.87
d ± 0
.01
13.0
9d ± 0
.04
81.9
3a ± 0
.09
0.68
a ± 0
.01
11.4
8c ± 0
.04
86.4
5d ± 0
.11
1.18
c ± 0
.02
8.47
a ± 0
.02
Enc
apsu
latio
n ef
ficie
ncy
(%)
73.8
9a ± 1
.53
78.2
9b ± 1
.06
76.6
4ab ±
1.1
778
.73b ±
1.9
4
In v
itro
oil R
elea
se (%
) 1h
r
2hr
3h
r
4hr
5h
r
68.2
77.7
78.7
81.5
88.7
32.1
51.2
56.4
69.0
78.0
53.1
69.7
71.8
75.8
76.3
70.4
82.4
87.3
190
.893
.6
Valu
es a
re e
xpre
ssed
as M
ean
±SD
; n =
3; D
iffer
ent s
uper
scrip
ts in
the
sam
e ro
w in
dica
tes s
igni
fican
t diff
eren
ce (p
<0.
05)
265Optimization of process parameters for enzymatic hydrolysis of tuna red meat protein
Utiliiation of (una red meat hydrolysate for fsh oil enaapsulation and enaapsulate aaaeptalility studies in seleated food produats
The lower hausner ratio and carr index value exhibited for SPO and SOP
signifies the free flowing and less cohesive nature of the powders on incorporation
of hydrolysate in wall as well as core material. However, absolute replacement of
caseinate with hydrolysate might have resulted in the aggregation and lumping of
powder in PO, due to higher hygroscopicity of the powder. Variations in the wall
material composition was reported as a major influential factor determining the
flow properties of oil encapsulate (Jeyakumari et al., 2015).
8.3.5 In vitro oil release kinetics
Simulated digestion technique facilitates to understand whether the intended
form and quantity of encapsulated oil is released in a controlled manner to the
specific parts of the gastro-intestinal tract during digestion process (Kosaraju et al.,
2009). In the current work, hydrolysate incorporation in the wall matrix significantly
retarded the release of encapsulated oil during gastric phase of digestion, with a
steady state of release during intestinal phase (Table 8.2; Fig. 8.9). The SO sample
released about 78 % of total oil after gastric digestion against the lowest value
of 51 % in SPO and 70 % in PO. Conversely, almost 82 % of total loaded oil
was released after gastric digestion in SOP, with a cumulative release of 94 % of
total loaded oil after gastro-intestinal digestion. Moreover, a spurt release of about
70 % of total loaded oil was observed in the case of SO and SOP within 1 hr of
gastric digestion, whereas only 32 % was released by SPO sample during the same
duration. The higher rate of gastric release coupled with lower surface oil content,
confirmed the poor structural integrity of capsular wall in SO and SOP samples.
Similarly, the lower extent of oil released during gastric digestion in SPO indicated
the structural stabilisation of capsular wall in the presence of hydrolysate. However,
in PO samples the fish oil was tightly held by the hydrolysate owing to the superior
fat binding and emulsifying properties of the hydrolysate (Parvathy et al., 2016).
The smaller capsular dimensions revealed by microscopic images in PO sample
also suggested a similar inference.
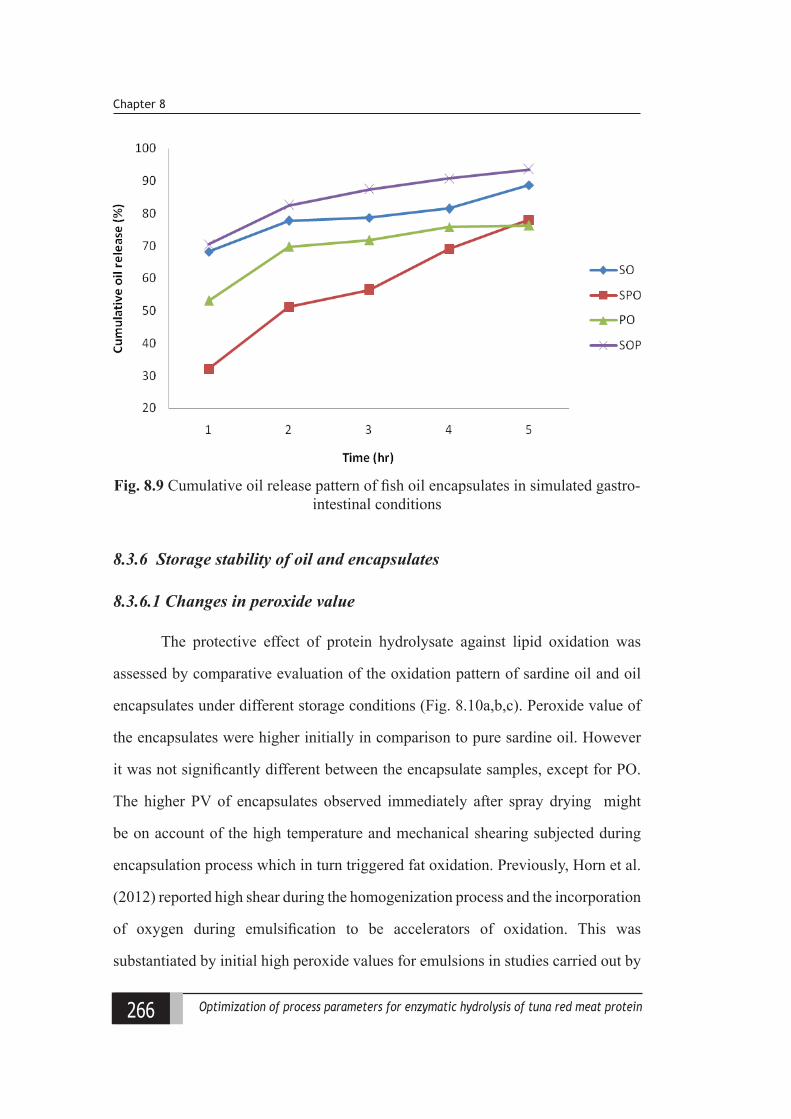
266 Optimization of process parameters for enzymatic hydrolysis of tuna red meat protein
Chapter 8
Fig. 8.9 Cumulative oil release pattern of fish oil encapsulates in simulated gastro-intestinal conditions
8.3.6 Storage stability of oil and encapsulates
8.3.6.1 Changes in peroxide value
The protective effect of protein hydrolysate against lipid oxidation was
assessed by comparative evaluation of the oxidation pattern of sardine oil and oil
encapsulates under different storage conditions (Fig. 8.10a,b,c). Peroxide value of
the encapsulates were higher initially in comparison to pure sardine oil. However
it was not significantly different between the encapsulate samples, except for PO.
The higher PV of encapsulates observed immediately after spray drying might
be on account of the high temperature and mechanical shearing subjected during
encapsulation process which in turn triggered fat oxidation. Previously, Horn et al.
(2012) reported high shear during the homogenization process and the incorporation
of oxygen during emulsification to be accelerators of oxidation. This was
substantiated by initial high peroxide values for emulsions in studies carried out by
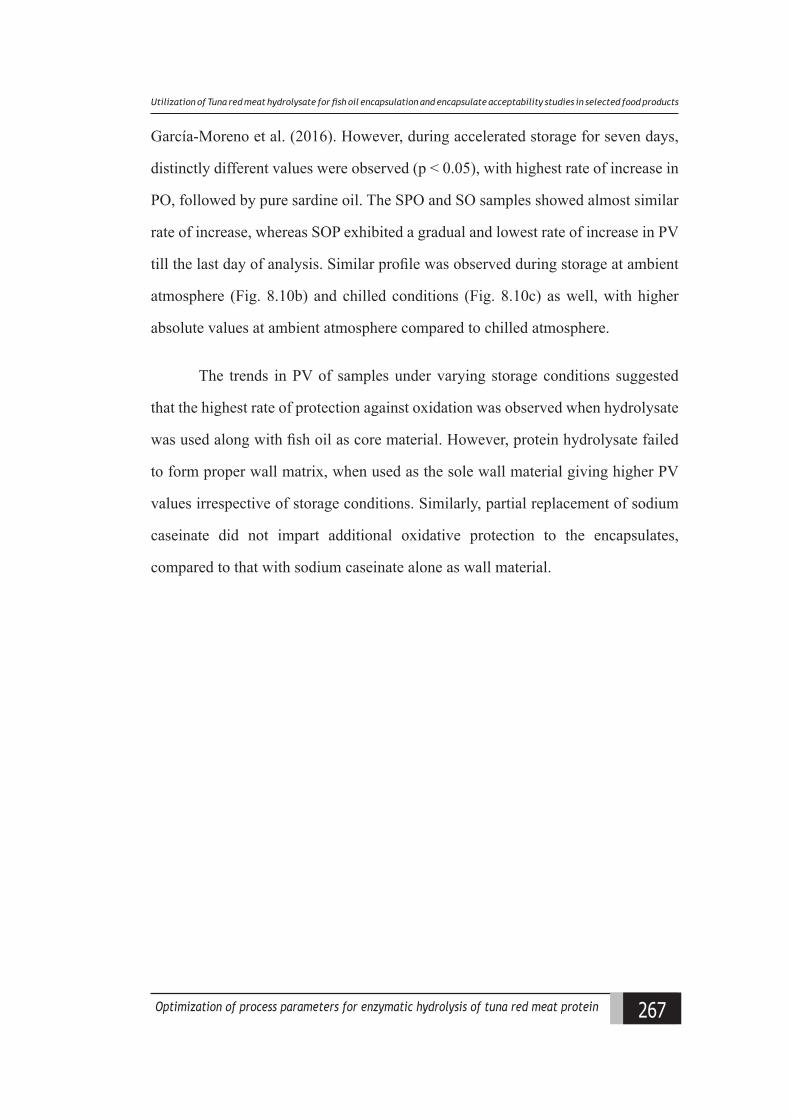
267Optimization of process parameters for enzymatic hydrolysis of tuna red meat protein
Utiliiation of (una red meat hydrolysate for fsh oil enaapsulation and enaapsulate aaaeptalility studies in seleated food produats
García-Moreno et al. (2016). However, during accelerated storage for seven days,
distinctly different values were observed (p < 0.05), with highest rate of increase in
PO, followed by pure sardine oil. The SPO and SO samples showed almost similar
rate of increase, whereas SOP exhibited a gradual and lowest rate of increase in PV
till the last day of analysis. Similar profile was observed during storage at ambient
atmosphere (Fig. 8.10b) and chilled conditions (Fig. 8.10c) as well, with higher
absolute values at ambient atmosphere compared to chilled atmosphere.
The trends in PV of samples under varying storage conditions suggested
that the highest rate of protection against oxidation was observed when hydrolysate
was used along with fish oil as core material. However, protein hydrolysate failed
to form proper wall matrix, when used as the sole wall material giving higher PV
values irrespective of storage conditions. Similarly, partial replacement of sodium
caseinate did not impart additional oxidative protection to the encapsulates,
compared to that with sodium caseinate alone as wall material.
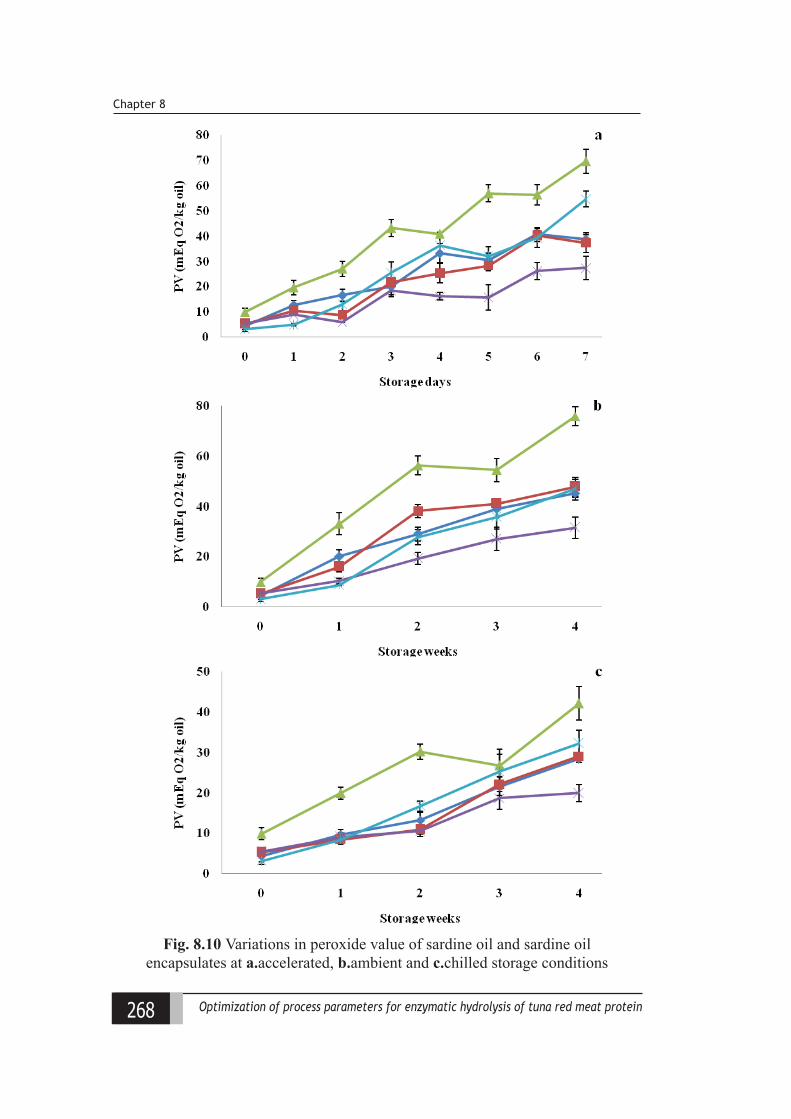
268 Optimization of process parameters for enzymatic hydrolysis of tuna red meat protein
Chapter 8
Fig. 8.10 Variations in peroxide value of sardine oil and sardine oil encapsulates at a.accelerated, b.ambient and c.chilled storage conditions
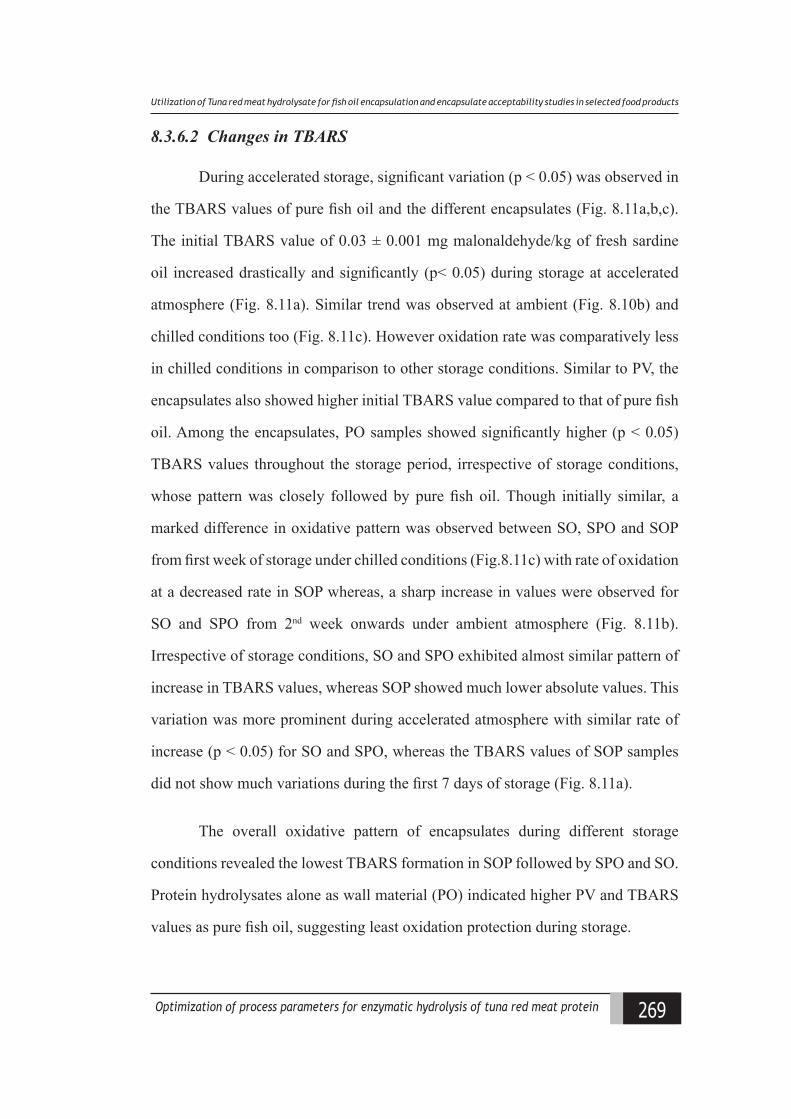
269Optimization of process parameters for enzymatic hydrolysis of tuna red meat protein
Utiliiation of (una red meat hydrolysate for fsh oil enaapsulation and enaapsulate aaaeptalility studies in seleated food produats
8.3.6.2 Changes in TBARS
During accelerated storage, significant variation (p < 0.05) was observed in
the TBARS values of pure fish oil and the different encapsulates (Fig. 8.11a,b,c).
The initial TBARS value of 0.03 ± 0.001 mg malonaldehyde/kg of fresh sardine
oil increased drastically and significantly (p< 0.05) during storage at accelerated
atmosphere (Fig. 8.11a). Similar trend was observed at ambient (Fig. 8.10b) and
chilled conditions too (Fig. 8.11c). However oxidation rate was comparatively less
in chilled conditions in comparison to other storage conditions. Similar to PV, the
encapsulates also showed higher initial TBARS value compared to that of pure fish
oil. Among the encapsulates, PO samples showed significantly higher (p < 0.05)
TBARS values throughout the storage period, irrespective of storage conditions,
whose pattern was closely followed by pure fish oil. Though initially similar, a
marked difference in oxidative pattern was observed between SO, SPO and SOP
from first week of storage under chilled conditions (Fig.8.11c) with rate of oxidation
at a decreased rate in SOP whereas, a sharp increase in values were observed for
SO and SPO from 2nd week onwards under ambient atmosphere (Fig. 8.11b).
Irrespective of storage conditions, SO and SPO exhibited almost similar pattern of
increase in TBARS values, whereas SOP showed much lower absolute values. This
variation was more prominent during accelerated atmosphere with similar rate of
increase (p < 0.05) for SO and SPO, whereas the TBARS values of SOP samples
did not show much variations during the first 7 days of storage (Fig. 8.11a).
The overall oxidative pattern of encapsulates during different storage
conditions revealed the lowest TBARS formation in SOP followed by SPO and SO.
Protein hydrolysates alone as wall material (PO) indicated higher PV and TBARS
values as pure fish oil, suggesting least oxidation protection during storage.
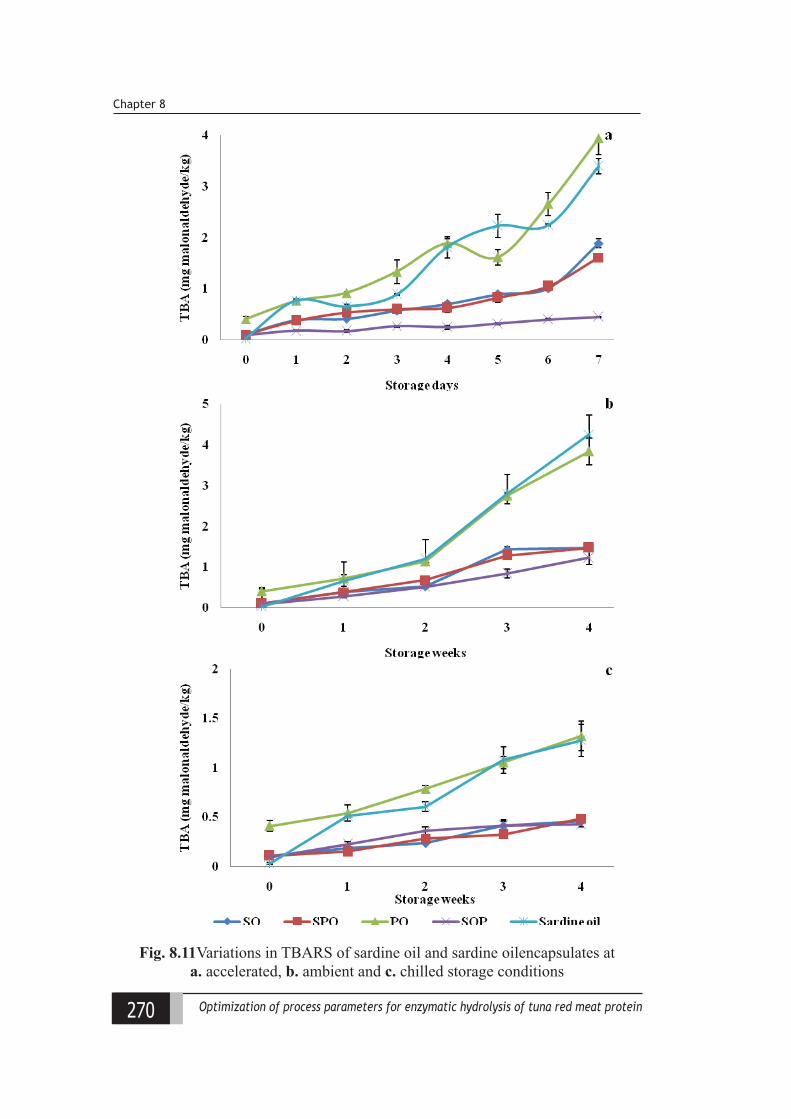
270 Optimization of process parameters for enzymatic hydrolysis of tuna red meat protein
Chapter 8
Fig. 8.11Variations in TBARS of sardine oil and sardine oilencapsulates at a. accelerated, b. ambient and c. chilled storage conditions
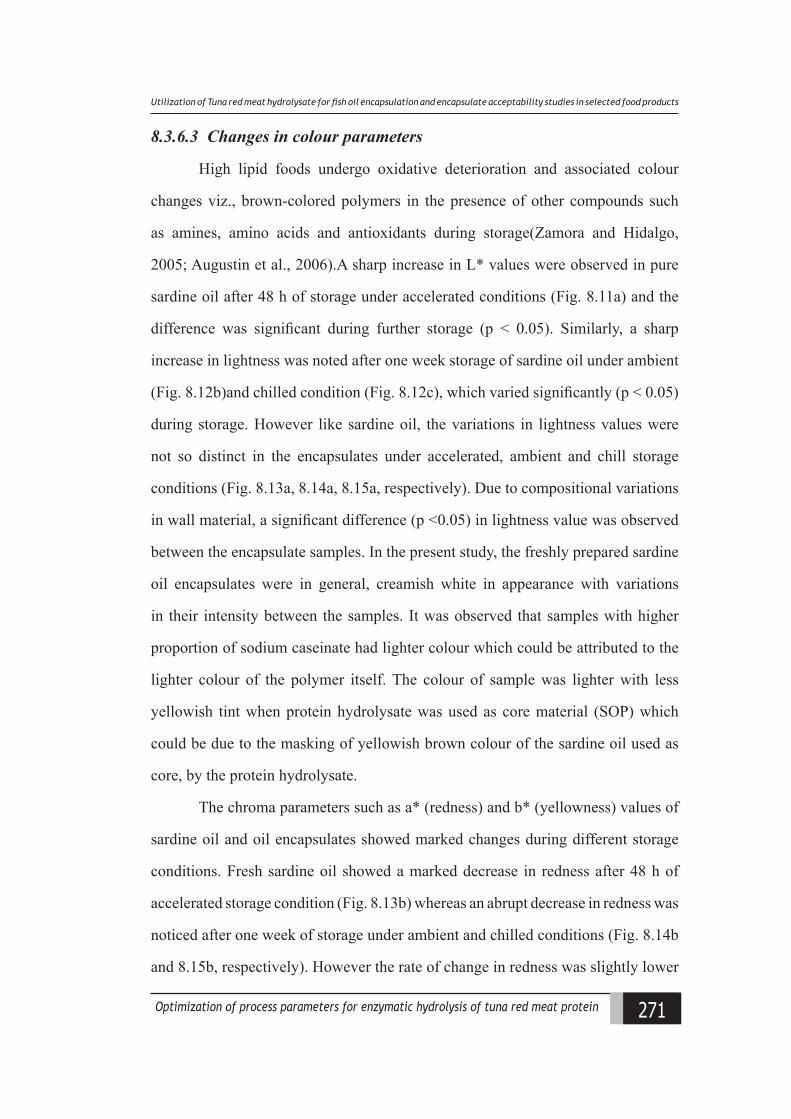
271Optimization of process parameters for enzymatic hydrolysis of tuna red meat protein
Utiliiation of (una red meat hydrolysate for fsh oil enaapsulation and enaapsulate aaaeptalility studies in seleated food produats
8.3.6.3 Changes in colour parameters
High lipid foods undergo oxidative deterioration and associated colour
changes viz., brown-colored polymers in the presence of other compounds such
as amines, amino acids and antioxidants during storage(Zamora and Hidalgo,
2005; Augustin et al., 2006).A sharp increase in L* values were observed in pure
sardine oil after 48 h of storage under accelerated conditions (Fig. 8.11a) and the
difference was significant during further storage (p < 0.05). Similarly, a sharp
increase in lightness was noted after one week storage of sardine oil under ambient
(Fig. 8.12b)and chilled condition (Fig. 8.12c), which varied significantly (p < 0.05)
during storage. However like sardine oil, the variations in lightness values were
not so distinct in the encapsulates under accelerated, ambient and chill storage
conditions (Fig. 8.13a, 8.14a, 8.15a, respectively). Due to compositional variations
in wall material, a significant difference (p <0.05) in lightness value was observed
between the encapsulate samples. In the present study, the freshly prepared sardine
oil encapsulates were in general, creamish white in appearance with variations
in their intensity between the samples. It was observed that samples with higher
proportion of sodium caseinate had lighter colour which could be attributed to the
lighter colour of the polymer itself. The colour of sample was lighter with less
yellowish tint when protein hydrolysate was used as core material (SOP) which
could be due to the masking of yellowish brown colour of the sardine oil used as
core, by the protein hydrolysate.
The chroma parameters such as a* (redness) and b* (yellowness) values of
sardine oil and oil encapsulates showed marked changes during different storage
conditions. Fresh sardine oil showed a marked decrease in redness after 48 h of
accelerated storage condition (Fig. 8.13b) whereas an abrupt decrease in redness was
noticed after one week of storage under ambient and chilled conditions (Fig. 8.14b
and 8.15b, respectively). However the rate of change in redness was slightly lower
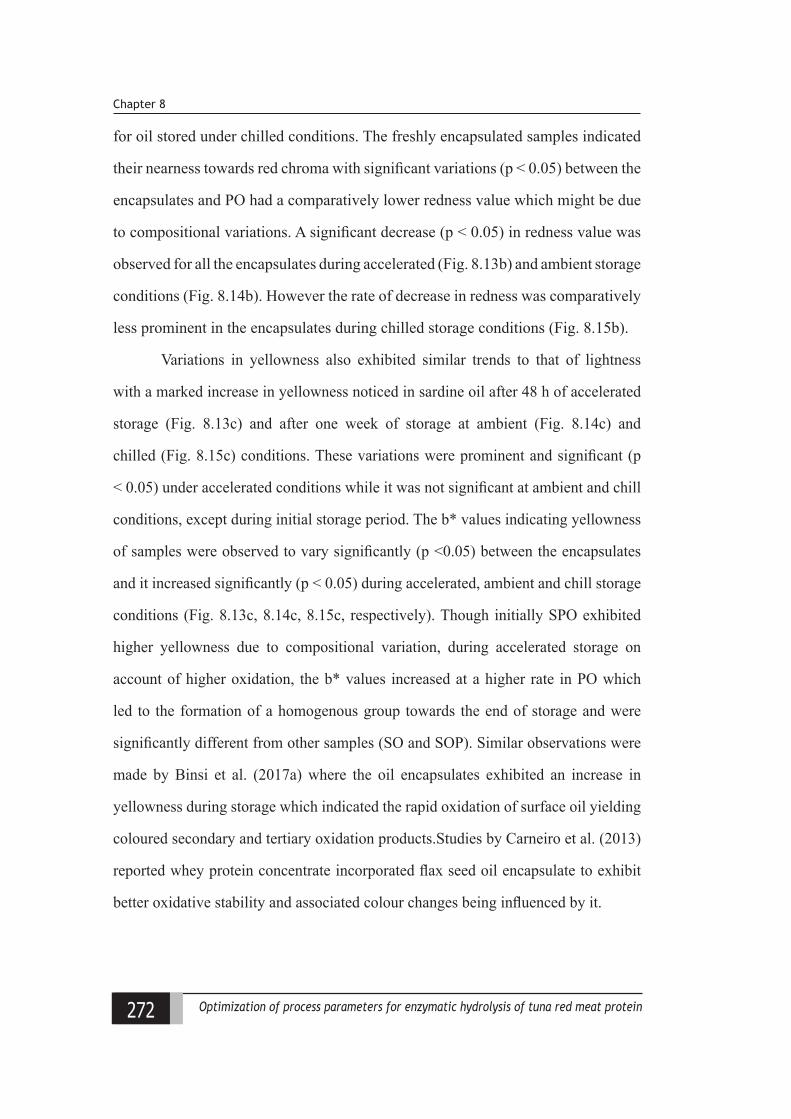
272 Optimization of process parameters for enzymatic hydrolysis of tuna red meat protein
Chapter 8
for oil stored under chilled conditions. The freshly encapsulated samples indicated
their nearness towards red chroma with significant variations (p < 0.05) between the
encapsulates and PO had a comparatively lower redness value which might be due
to compositional variations. A significant decrease (p < 0.05) in redness value was
observed for all the encapsulates during accelerated (Fig. 8.13b) and ambient storage
conditions (Fig. 8.14b). However the rate of decrease in redness was comparatively
less prominent in the encapsulates during chilled storage conditions (Fig. 8.15b).
Variations in yellowness also exhibited similar trends to that of lightness
with a marked increase in yellowness noticed in sardine oil after 48 h of accelerated
storage (Fig. 8.13c) and after one week of storage at ambient (Fig. 8.14c) and
chilled (Fig. 8.15c) conditions. These variations were prominent and significant (p
< 0.05) under accelerated conditions while it was not significant at ambient and chill
conditions, except during initial storage period. The b* values indicating yellowness
of samples were observed to vary significantly (p <0.05) between the encapsulates
and it increased significantly (p < 0.05) during accelerated, ambient and chill storage
conditions (Fig. 8.13c, 8.14c, 8.15c, respectively). Though initially SPO exhibited
higher yellowness due to compositional variation, during accelerated storage on
account of higher oxidation, the b* values increased at a higher rate in PO which
led to the formation of a homogenous group towards the end of storage and were
significantly different from other samples (SO and SOP). Similar observations were
made by Binsi et al. (2017a) where the oil encapsulates exhibited an increase in
yellowness during storage which indicated the rapid oxidation of surface oil yielding
coloured secondary and tertiary oxidation products.Studies by Carneiro et al. (2013)
reported whey protein concentrate incorporated flax seed oil encapsulate to exhibit
better oxidative stability and associated colour changes being influenced by it.

273Optimization of process parameters for enzymatic hydrolysis of tuna red meat protein
Utiliiation of (una red meat hydrolysate for fsh oil enaapsulation and enaapsulate aaaeptalility studies in seleated food produats
Fig. 8.12Variations in colour indices of sardine oil during a. accelerated (60oC), b. ambient (28 oC) and c. chilled storage (4oC)
a
b
c
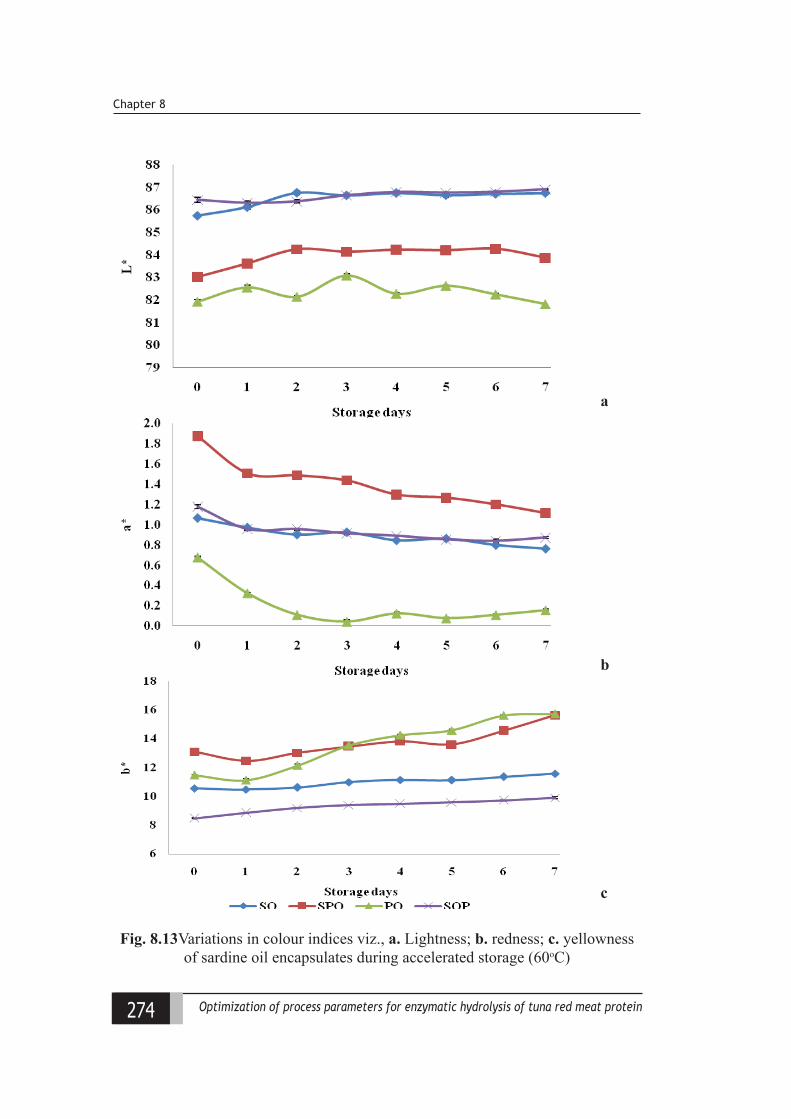
274 Optimization of process parameters for enzymatic hydrolysis of tuna red meat protein
Chapter 8
Fig. 8.13Variations in colour indices viz., a. Lightness; b. redness; c. yellowness of sardine oil encapsulates during accelerated storage (60oC)
a
b
c
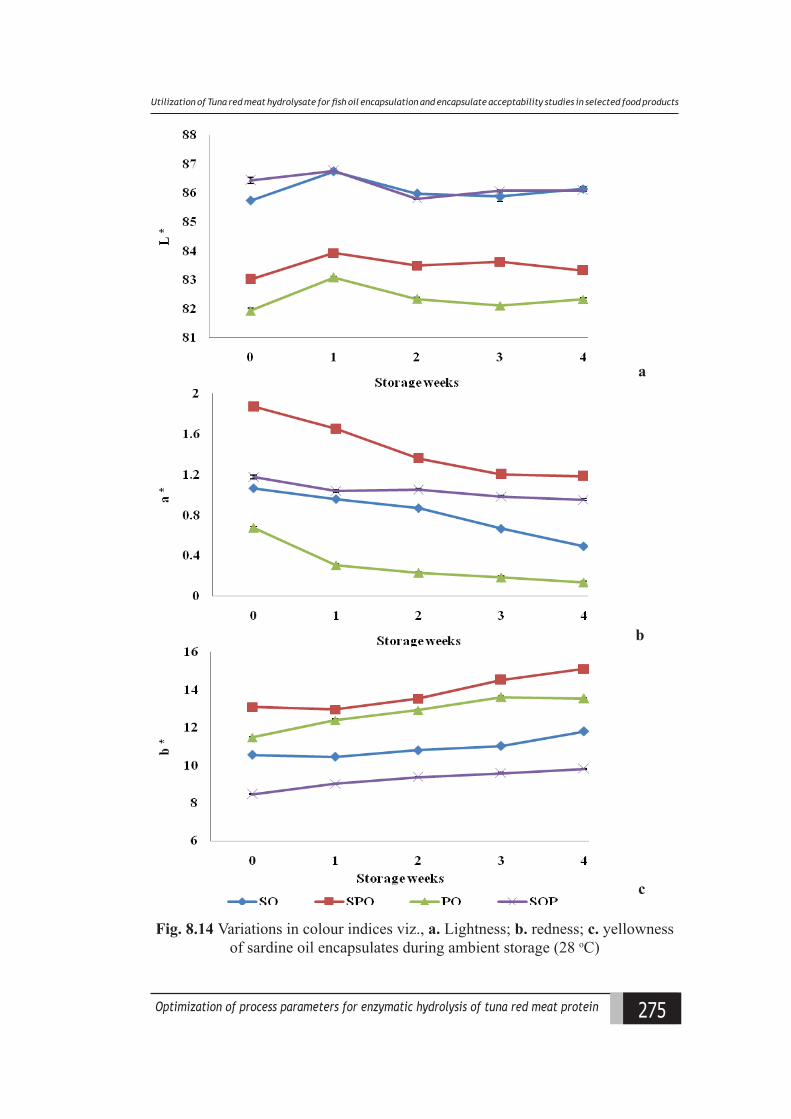
275Optimization of process parameters for enzymatic hydrolysis of tuna red meat protein
Utiliiation of (una red meat hydrolysate for fsh oil enaapsulation and enaapsulate aaaeptalility studies in seleated food produats
Fig. 8.14 Variations in colour indices viz., a. Lightness; b. redness; c. yellowness of sardine oil encapsulates during ambient storage (28 oC)
a
b
c
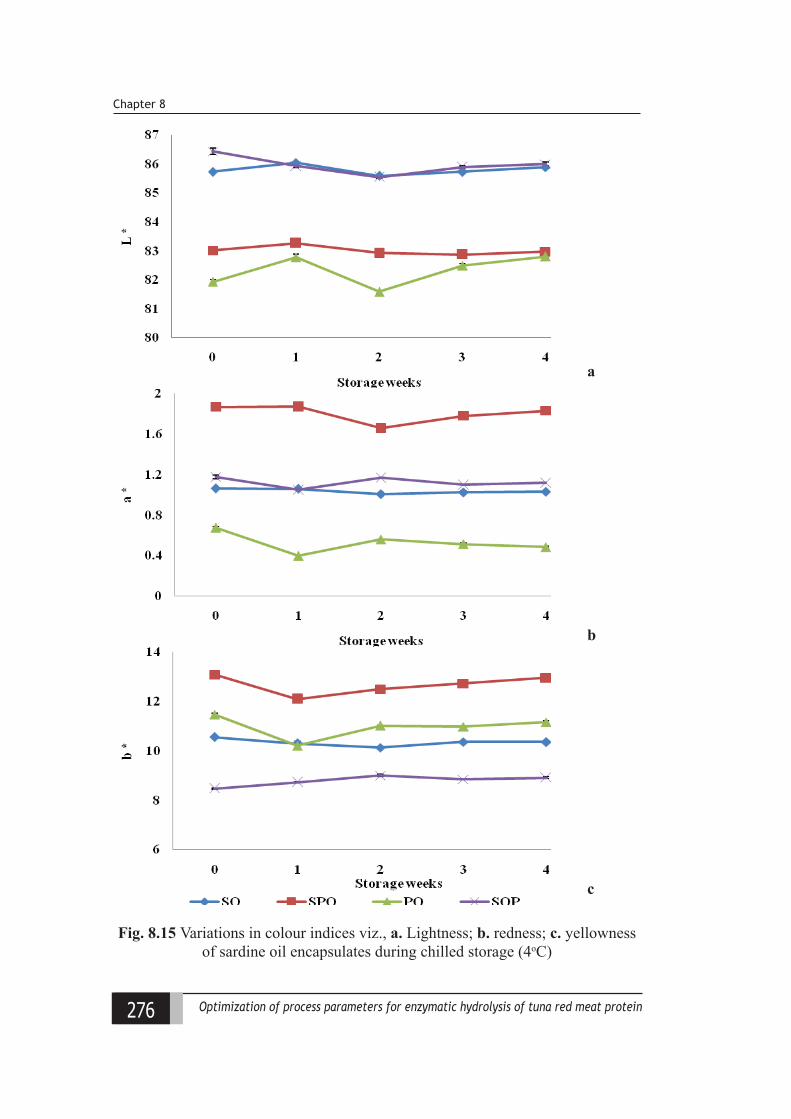
276 Optimization of process parameters for enzymatic hydrolysis of tuna red meat protein
Chapter 8
Fig. 8.15 Variations in colour indices viz., a. Lightness; b. redness; c. yellowness of sardine oil encapsulates during chilled storage (4oC)
a
b
c
277Optimization of process parameters for enzymatic hydrolysis of tuna red meat protein
Utiliiation of (una red meat hydrolysate for fsh oil enaapsulation and enaapsulate aaaeptalility studies in seleated food produats
8.3.7 Product acceptability study
Fortification or enrichment usually refers to the addition of nutrients to food
in which they are absent or present in negligible amounts. Enrichment of foods with
omega-3 PUFA is regarded as a way of increasing dietary intake of these fatty acids
for health promoting effects as well as to reduce the risk associated with coronary
diseases (Kolanowski, 2005). However, Drusch and Mannino (2009) reported the
major challenge associated with the development of enriched food products to
beits acceptance criteria, including addition of active ingredient, product freshness,
sensory characteristics, appearance, storage conditions, ease of preparation and
safety standards. Several studies have reported development of fish oil fortified
products viz., dairy products (Kolanowski and Laufenberg, 2006; Kolanowski
and Weiβbrodt, 2007; Kwak et al., 2014), bakery products (Masur et al., 2009;
Jeyakumari et al., 2016), mayonnaise (Jacobsen et al. 1999), spaghetti (Verardo
et al., 2009), juices (Ilyasoglu and El, 2014) etc. There is an increased demand for
foods fortifiedby omega-3 fatty acids and hence is now globally available (Bakry
et al., 2016).
Evaluating and improving the acceptability of a product is a critical step
as it determines the future market of a new commodity. In the present study, the
encapsulate selected with respect to its efficiency and stability viz., SOP, was subjected
to acceptability studies with the major objective of determining the encapsulate
concentration applicable in different food products without significantly affecting
its sensory parameters while simultaneously improving its nutritional value.Four
different food products viz., milk, juice, corn flakes and noodles which vary in
ingredient composition and preparation methods were chosen. Fish oil encapsulate
was enriched with omega 3 fatty acid as well as protein due to its composition
viz., presence of fish oil and tuna protein hydrolysate as core material. As per the
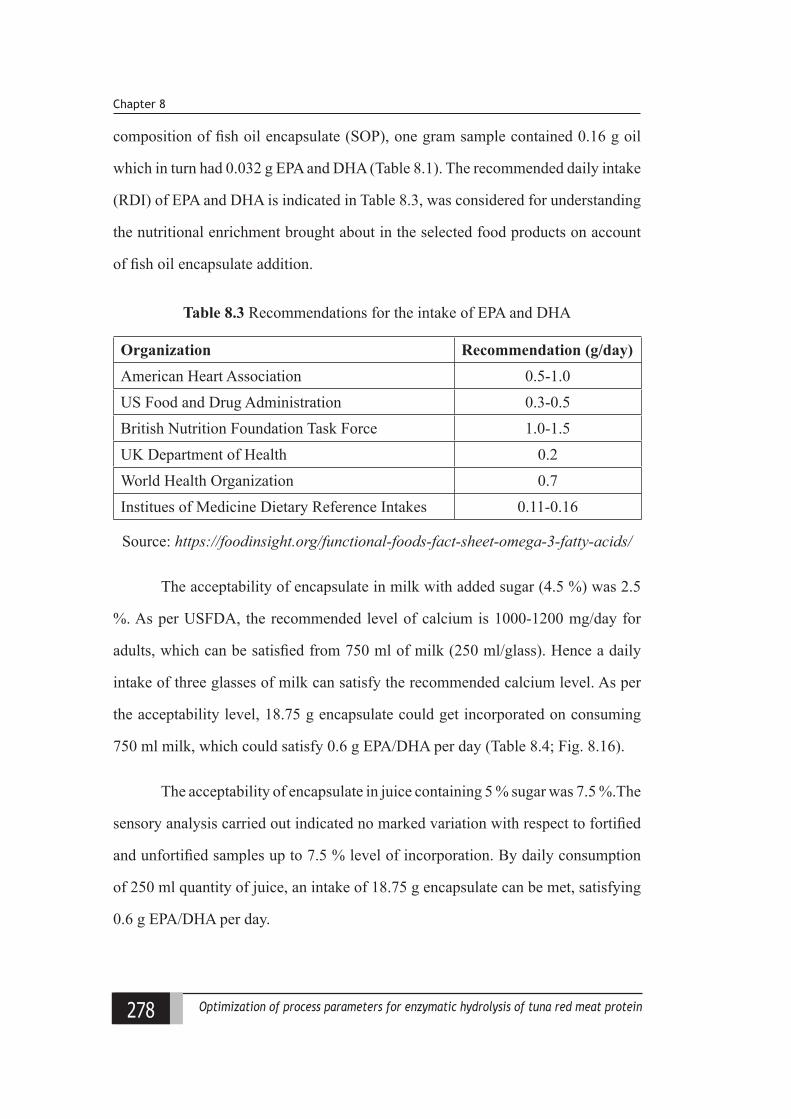
278 Optimization of process parameters for enzymatic hydrolysis of tuna red meat protein
Chapter 8
composition of fish oil encapsulate (SOP), one gram sample contained 0.16 g oil
which in turn had 0.032 g EPA and DHA (Table 8.1). The recommended daily intake
(RDI) of EPA and DHA is indicated in Table 8.3, was considered for understanding
the nutritional enrichment brought about in the selected food products on account
of fish oil encapsulate addition.
Table 8.3 Recommendations for the intake of EPA and DHA
Organization Recommendation (g/day)American Heart Association 0.5-1.0US Food and Drug Administration 0.3-0.5British Nutrition Foundation Task Force 1.0-1.5UK Department of Health 0.2World Health Organization 0.7Institues of Medicine Dietary Reference Intakes 0.11-0.16
Source: https://foodinsight.org/functional-foods-fact-sheet-omega-3-fatty-acids/
The acceptability of encapsulate in milk with added sugar (4.5 %) was 2.5
%. As per USFDA, the recommended level of calcium is 1000-1200 mg/day for
adults, which can be satisfied from 750 ml of milk (250 ml/glass). Hence a daily
intake of three glasses of milk can satisfy the recommended calcium level. As per
the acceptability level, 18.75 g encapsulate could get incorporated on consuming
750 ml milk, which could satisfy 0.6 g EPA/DHA per day (Table 8.4; Fig. 8.16).
The acceptability of encapsulate in juice containing 5 % sugar was 7.5 %.The
sensory analysis carried out indicated no marked variation with respect to fortified
and unfortified samples up to 7.5 % level of incorporation. By daily consumption
of 250 ml quantity of juice, an intake of 18.75 g encapsulate can be met, satisfying
0.6 g EPA/DHA per day.
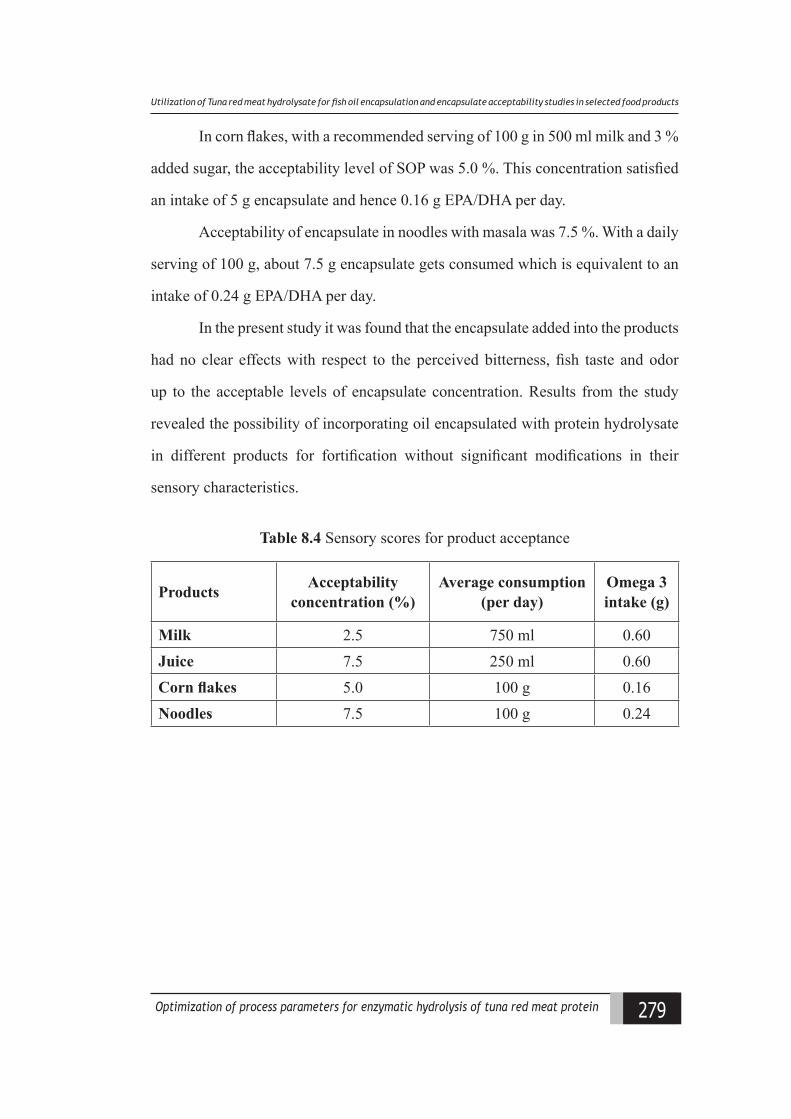
279Optimization of process parameters for enzymatic hydrolysis of tuna red meat protein
Utiliiation of (una red meat hydrolysate for fsh oil enaapsulation and enaapsulate aaaeptalility studies in seleated food produats
In corn flakes, with a recommended serving of 100 g in 500 ml milk and 3 %
added sugar, the acceptability level of SOP was 5.0 %. This concentration satisfied
an intake of 5 g encapsulate and hence 0.16 g EPA/DHA per day.
Acceptability of encapsulate in noodles with masala was 7.5 %. With a daily
serving of 100 g, about 7.5 g encapsulate gets consumed which is equivalent to an
intake of 0.24 g EPA/DHA per day.
In the present study it was found that the encapsulate added into the products
had no clear effects with respect to the perceived bitterness, fish taste and odor
up to the acceptable levels of encapsulate concentration. Results from the study
revealed the possibility of incorporating oil encapsulated with protein hydrolysate
in different products for fortification without significant modifications in their
sensory characteristics.
Table 8.4 Sensory scores for product acceptance
Products Acceptability concentration (%)
Average consumption (per day)
Omega 3 intake (g)
Milk 2.5 750 ml 0.60Juice 7.5 250 ml 0.60Corn flakes 5.0 100 g 0.16Noodles 7.5 100 g 0.24
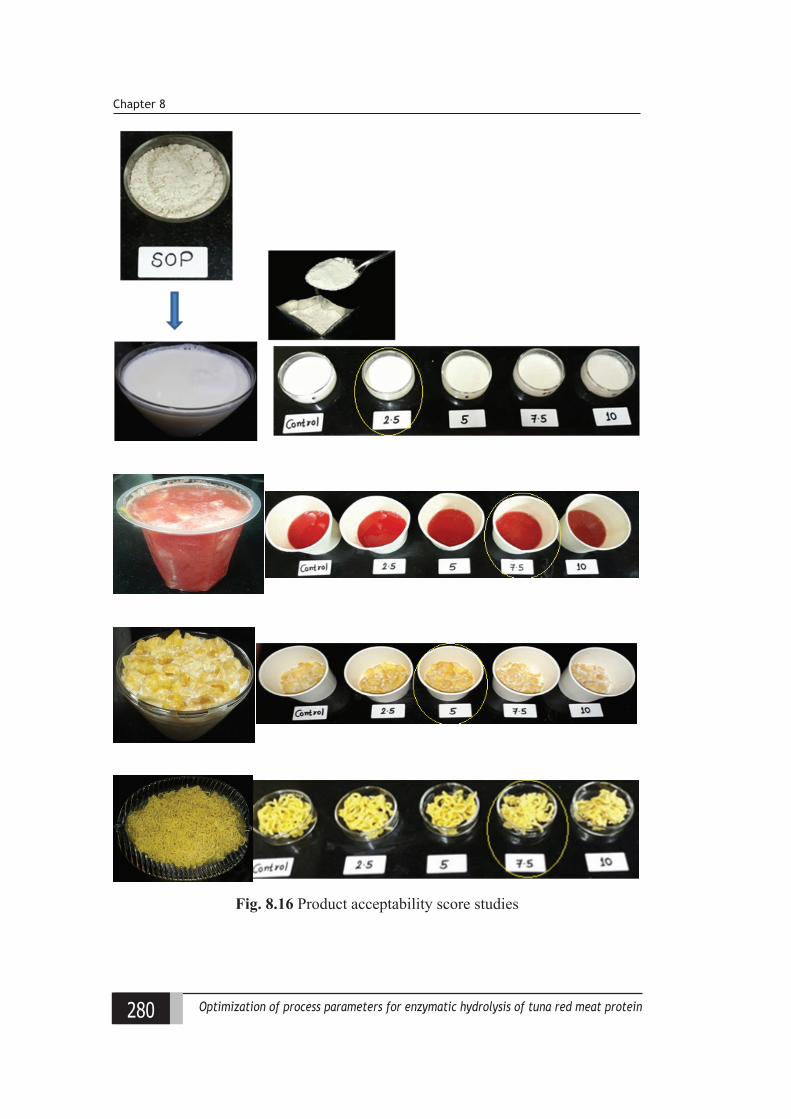
280 Optimization of process parameters for enzymatic hydrolysis of tuna red meat protein
Chapter 8
Fig. 8.16 Product acceptability score studies
281Optimization of process parameters for enzymatic hydrolysis of tuna red meat protein
Utiliiation of (una red meat hydrolysate for fsh oil enaapsulation and enaapsulate aaaeptalility studies in seleated food produats
8.4 Conclusion
The main objective of the present investigation was to compare the efficacy
of protein hydrolysate from yellowfin tuna red meat to enhance the structural and
oxidative stability of spray dried sardine oil when incorporated as wall material
and core material. The results indicated higher encapsulation efficiency for the
encapsulates containing protein hydrolysate either as wall or as core material.
However, the findings from oxidative stability studies suggested a lower rate of
protection when protein hydrolysate was used as wall material, compared to that
offered when used as core material along with fish oil. Further the possibilities of
incorporating oil encapsulate in selected products (milk, juice, corn flakes, noodles)
indicated acceptable sensory characteristics and increased nutritional value in
fortified products.

282 Optimization of process parameters for enzymatic hydrolysis of tuna red meat protein
Chapter 8
283Optimization of process parameters for enzymatic hydrolysis of tuna red meat protein
Utiliiation of yellowfn tuna protein hydrolysate in health leeerage formulation
Chapter 9Utilizationofyellowfin
tuna protein hydrolysate in health beverage formulation
9.1 Introduction
Food plays a major role in determining the health status of a person. Of the
different food components, protein is a major nutrient with a recommended daily
intake of 95-120 g and is hydrolysed during the gastrointestinal digestion process
into several peptides (Hernandes-Ledesma et al., 2014). Humans require a protein
intake sufficient to maintain the body nitrogen balance and allow for desirable rates
of deposition during growth. Seafood is an easily available and cheapest food source
meeting the protein requirements of approximately 3.1 billion people, globally
(FAO, 2016). There is a high potential in marine processing industries to convert
and utilize the food and their by-products as valuable functional ingredients. Of
the by-products, hydrolysates or bioactive peptides can be suggested as a potential
source of natural ingredient and in this context more focus is given by researchers
on improving the bioavailability and bioaccessibility of these marine protein
hydrolysates for validating as functional ingredients for healthy foods.
Protein hydrolysates have been defined as a mixture of polypeptides,
oligopeptides and amino acids derived by hydrolysis of protein sources, to various
extent. There has been increasing interest in these preparations over the last two
284 Optimization of process parameters for enzymatic hydrolysis of tuna red meat protein
Chapter 9
decades, with novel bioactive peptides continually being discovered, as it has been
shown that short-chain peptides from hydrolyzed proteins have a higher nutritive
value (Kristinsson and Rasco, 2000; Wisuthiphaet et al., 2015).
Nutritional content is an important factor considered by customers when
choosing their foods. Recent food market trend indicates diversification in
consumer’s food demand with more approach towards health benefit of foods beyond
basic nutrition. Knowledge on the association between nutrition and health has
resulted in the development of the concept of functional foods, which is a practical
and new approach towards improved health status (Girgih et al, 2013). Functional
foods defined to be those with specific health benefits, hold a strong market position
worldwide and the functional beverage sector accounts for approximately 12.5 %
of the world market (Anon, 2011). As studied by Sloan (2003), a wide range of
customers (47 %) opine that fortified foods and drinks satisfy their recommended
nutritional requirements. Food powders represent a large proportion of the total
processed food in the world on account of several reasons viz., low bulk weight,
storage, transport and usage conveniences, diverse applications, high stability and
the option of high production (Intipunya and Bhandari, 2010). In this regard, fortified
powder supplements which can be blended to form drinks are a good option which
has enhanced taste as well as improved nutritional value. High energy, proteinaceous
drinks help to meet instant energy requirement and compensate electrolytic loss.
Hence, new ingredients having superior functional properties are of interest for the
development of novel functional beverages. Recently there has been an exceptional
demand in the food industry for inexpensive proteins and bioactive peptides for
human consumption. Additionally reports indicate the relevance of utilizing protein
hydrolysates in the food industry to improve the quality of finished products,
especially their storage stability (Rao et al., 2016). Several attempts have been made
on utilization of protein hydrolysate in the formulation of various products (Sathivel
285Optimization of process parameters for enzymatic hydrolysis of tuna red meat protein
Utiliiation of yellowfn tuna protein hydrolysate in health leeerage formulation
et al., 2005b; Sinha et al., 2007; Rao et al., 2016) but, still there is immense scope
for its utilization in beverages especially in health based energy drinks on account
of its superior functionalities (Singh et al., 2009). Additionally, alternative uses for
co-products of the fish processing industry are highly sought as these co-products
are excellent sources of nutrients like protein. The utilization of protein hydrolysate
from cannery discards like tuna red meat for such health formulations is an ideal
approach which is more economical as well as adds on value. Therefore, the current
study was performed to formulate a health beverage mix by incorporation of tuna
protein hydrolysate (TPH) optimized from yellowfin tuna red meat, a processing
discard in tuna canning industry. The base mix was RSM optimized with sensory
acceptability as response. Further different levels of TPH were added to the base
mix, evaluated for its properties and the best combination was subjected to stability
studies under ambient temperature (28oC).
286 Optimization of process parameters for enzymatic hydrolysis of tuna red meat protein
Chapter 9
9.2 Materials and methods
9.2.1 Raw material, enzymes and chemicals
Tuna red meat, by-product after canning from Forstar Frozen Foods Pvt.
Ltd., a seafood industry at Mumbai, was utilized for the preparation of protein
hydrolysate using papain enzyme (Hi Media, India). Ingredients used for health mix
preparation included malted barley, malted wheat, milk powder, sugar and vanilla
flavor, procured from local suppliers. Malted barley and wheat were prepared from
whole barley and wheat, respectively which was soaked in water overnight, washed,
drained, spread in a container and covered with a moist cloth for about 16-20 h
for facilitating its germination. During this holding period, it was regularly mixed.
Sprouted wheat as well as barley was dried to desired moisture content (< 10%) at
60-70oC for 7-8 h and further powdered and roasted. All enzymes and chemicals
used for the analysis were of laboratory grade from Merck and Hi media, India.
9.2.2 Hydrolysis - Optimization studies
The hydrolysate used for the formulation of health beverage was derived
from tuna red meat using papain enzyme according to an RSM based protocol
(discussed in chapter 4) for optimum functional and antioxidative properties (Table
9.1). The optimized hydrolytic conditions were viz., enzyme: substrate (E/S) ratio
of 1.08 %, hydrolysis time of 30 min, temperature of 60oC and pH of 6.5. The
resultant solution was cooled, coarse filtered and centrifuged at 8000 g at 10oC for
20 min (K-24A, Remi Instruments, Mumbai) and the supernatant was further spray
dried (Hemaraj Enterprises, Mumbai) to get protein hydrolysate powder which was
used for fortification in health mix.
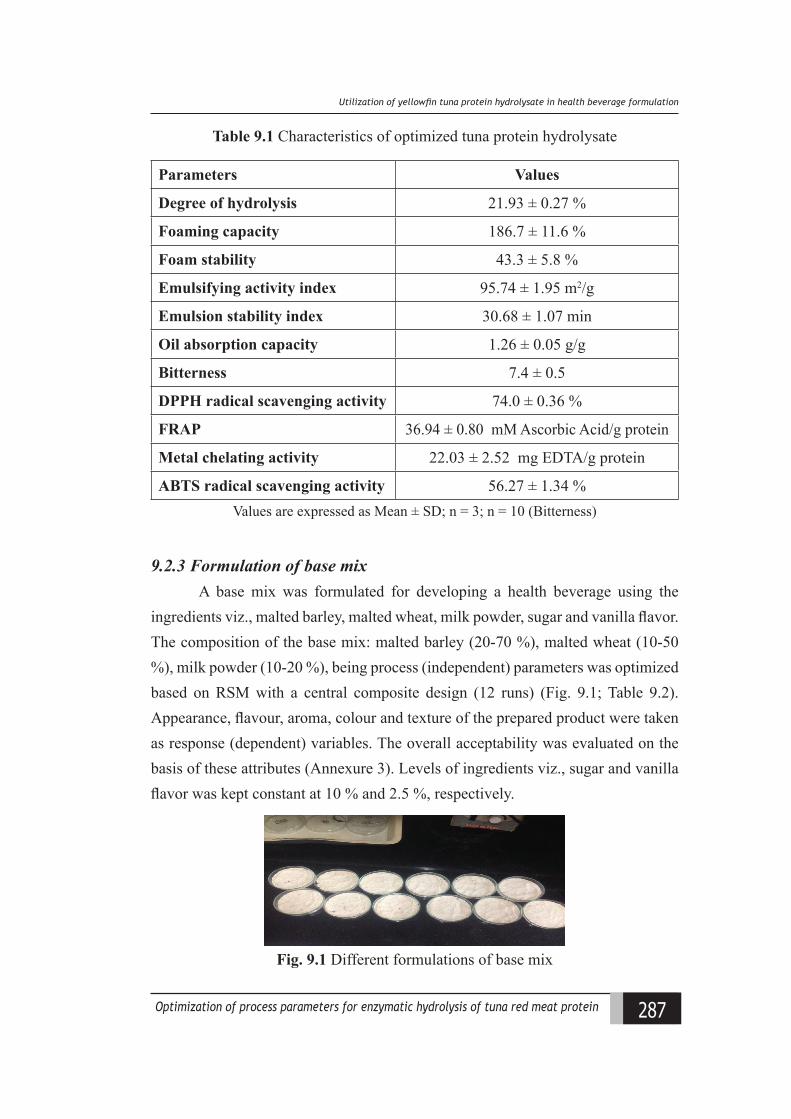
287Optimization of process parameters for enzymatic hydrolysis of tuna red meat protein
Utiliiation of yellowfn tuna protein hydrolysate in health leeerage formulation
Table 9.1 Characteristics of optimized tuna protein hydrolysate
Parameters Values
Degree of hydrolysis 21.93 ± 0.27 %
Foaming capacity 186.7 ± 11.6 %
Foam stability 43.3 ± 5.8 %
Emulsifying activity index 95.74 ± 1.95 m2/g
Emulsion stability index 30.68 ± 1.07 min
Oil absorption capacity 1.26 ± 0.05 g/g
Bitterness 7.4 ± 0.5
DPPH radical scavenging activity 74.0 ± 0.36 %
FRAP 36.94 ± 0.80 mM Ascorbic Acid/g protein
Metal chelating activity 22.03 ± 2.52 mg EDTA/g protein
ABTS radical scavenging activity 56.27 ± 1.34 %Values are expressed as Mean ± SD; n = 3; n = 10 (Bitterness)
9.2.3 Formulation of base mixA base mix was formulated for developing a health beverage using the
ingredients viz., malted barley, malted wheat, milk powder, sugar and vanilla flavor. The composition of the base mix: malted barley (20-70 %), malted wheat (10-50 %), milk powder (10-20 %), being process (independent) parameters was optimized based on RSM with a central composite design (12 runs) (Fig. 9.1; Table 9.2). Appearance, flavour, aroma, colour and texture of the prepared product were taken as response (dependent) variables. The overall acceptability was evaluated on the basis of these attributes (Annexure 3). Levels of ingredients viz., sugar and vanilla flavor was kept constant at 10 % and 2.5 %, respectively.
Fig. 9.1 Different formulations of base mix
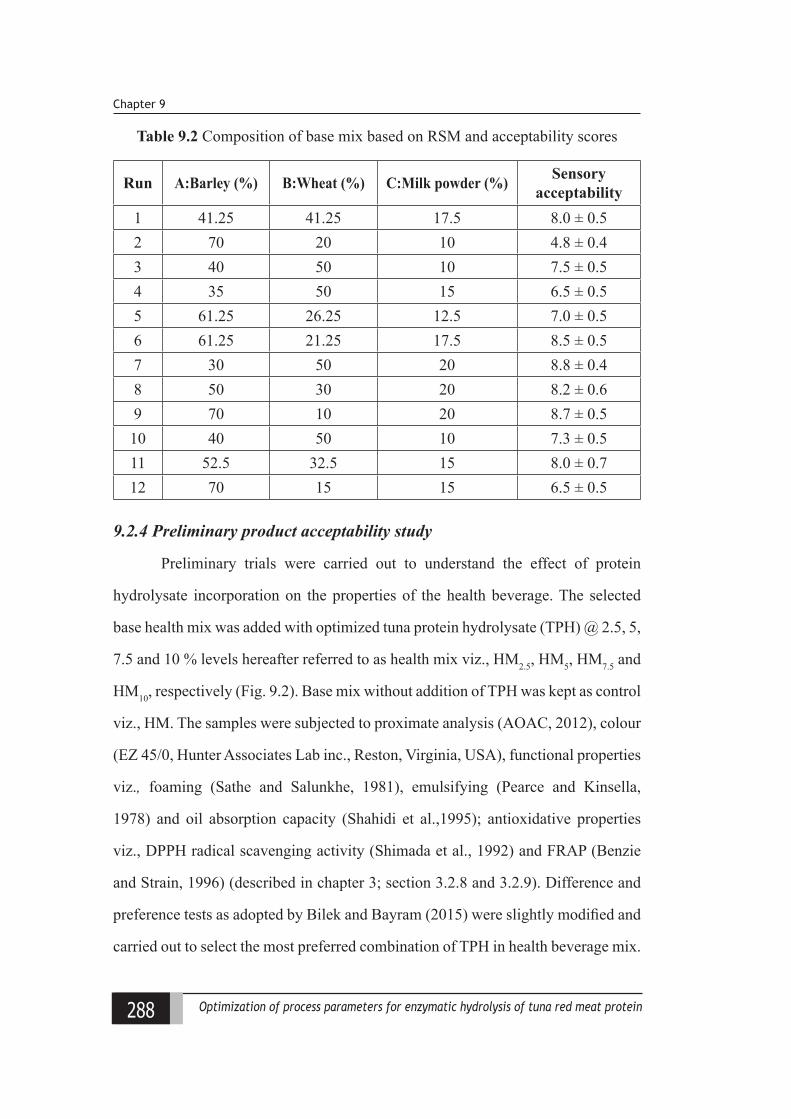
288 Optimization of process parameters for enzymatic hydrolysis of tuna red meat protein
Chapter 9
Table 9.2 Composition of base mix based on RSM and acceptability scores
Run A:Barley (%) B:Wheat (%) C:Milk powder (%) Sensory acceptability
1 41.25 41.25 17.5 8.0 ± 0.52 70 20 10 4.8 ± 0.43 40 50 10 7.5 ± 0.54 35 50 15 6.5 ± 0.55 61.25 26.25 12.5 7.0 ± 0.56 61.25 21.25 17.5 8.5 ± 0.57 30 50 20 8.8 ± 0.48 50 30 20 8.2 ± 0.69 70 10 20 8.7 ± 0.510 40 50 10 7.3 ± 0.511 52.5 32.5 15 8.0 ± 0.712 70 15 15 6.5 ± 0.5
9.2.4 Preliminary product acceptability study
Preliminary trials were carried out to understand the effect of protein
hydrolysate incorporation on the properties of the health beverage. The selected
base health mix was added with optimized tuna protein hydrolysate (TPH) @ 2.5, 5,
7.5 and 10 % levels hereafter referred to as health mix viz., HM2.5, HM5, HM7.5 and
HM10, respectively (Fig. 9.2). Base mix without addition of TPH was kept as control
viz., HM. The samples were subjected to proximate analysis (AOAC, 2012), colour
(EZ 45/0, Hunter Associates Lab inc., Reston, Virginia, USA), functional properties
viz., foaming (Sathe and Salunkhe, 1981), emulsifying (Pearce and Kinsella,
1978) and oil absorption capacity (Shahidi et al.,1995); antioxidative properties
viz., DPPH radical scavenging activity (Shimada et al., 1992) and FRAP (Benzie
and Strain, 1996) (described in chapter 3; section 3.2.8 and 3.2.9). Difference and
preference tests as adopted by Bilek and Bayram (2015) were slightly modified and
carried out to select the most preferred combination of TPH in health beverage mix.
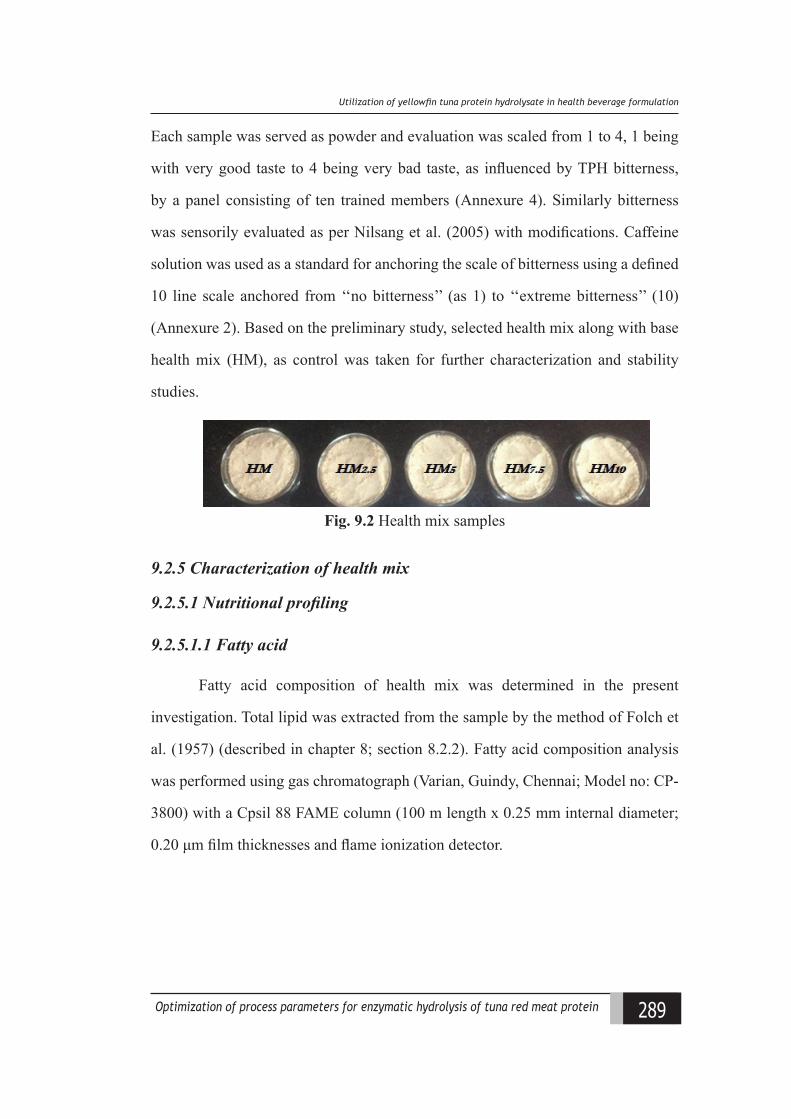
289Optimization of process parameters for enzymatic hydrolysis of tuna red meat protein
Utiliiation of yellowfn tuna protein hydrolysate in health leeerage formulation
Each sample was served as powder and evaluation was scaled from 1 to 4, 1 being
with very good taste to 4 being very bad taste, as influenced by TPH bitterness,
by a panel consisting of ten trained members (Annexure 4). Similarly bitterness
was sensorily evaluated as per Nilsang et al. (2005) with modifications. Caffeine
solution was used as a standard for anchoring the scale of bitterness using a defined
10 line scale anchored from ‘‘no bitterness’’ (as 1) to ‘‘extreme bitterness’’ (10)
(Annexure 2). Based on the preliminary study, selected health mix along with base
health mix (HM), as control was taken for further characterization and stability
studies.
Fig. 9.2 Health mix samples
9.2.5 Characterization of health mix
9.2.5.1 Nutritional profiling
9.2.5.1.1 Fatty acid
Fatty acid composition of health mix was determined in the present
investigation. Total lipid was extracted from the sample by the method of Folch et
al. (1957) (described in chapter 8; section 8.2.2). Fatty acid composition analysis
was performed using gas chromatograph (Varian, Guindy, Chennai; Model no: CP-
3800) with a Cpsil 88 FAME column (100 m length x 0.25 mm internal diameter;
0.20 μm film thicknesses and flame ionization detector.
290 Optimization of process parameters for enzymatic hydrolysis of tuna red meat protein
Chapter 9
9.2.5.1.2 Amino acid
HPLC (high-performance liquid chromatography) (Shimadzu Prominence,
Japan) was employed for amino acid profiling of the health mix (Ishida et al., 1981).
(described in chapter 6; section 6.2.2.4.2).
9.2.5.1.3 Mineral
Inductivity Coupled Plasma–Optical Emission Spectrometer (iCAP 6300
Duo, Thermo fisher Scientific, Cambridge, England) with dual configuration
(axial and radial) and iTEVA (version 2.8.0.97) operational software was used for
elemental analysis (described in chapter 6; section 6.2.2.4.3).
9.2.5.2 Physical properties
9.2.5.2.1 Particle density
About one gram of sample was taken in a 10 ml measuring cylinder with
a glass stopper to which petroleum ether (5 ml) was added and well shaken to
suspend the powder particles completely. Finally, all the powder particles sticking
on the cylinder wall were rinsed down with a further 1 ml of petroleum ether and
the total volume of petroleum ether together with suspended powder was noted. The
particle density was calculated as follows (Jinapong et al., 2008):
Particle density (g/ml) = Weight of powder Total volume of petroleum ether with suspended powder - 6
9.2.5.2.2 Bulk and tapped densities
Bulk and tapped densities were measured as per Chinta et al. (2009). A
known quantity of sample powder was loosely packed through a funnel into 10
ml graduated cylinder by slight tapping to collect the powder sticking to the wall
of the cylinder and the volume was recorded. Bulk density (ρB) of the powder
was calculated by dividing weight of the sample by its volume. Similarly, a known
quantity of the sample was poured into the cylinder and tapped until a constant
volume was reached to determine the tapped density (ρT).
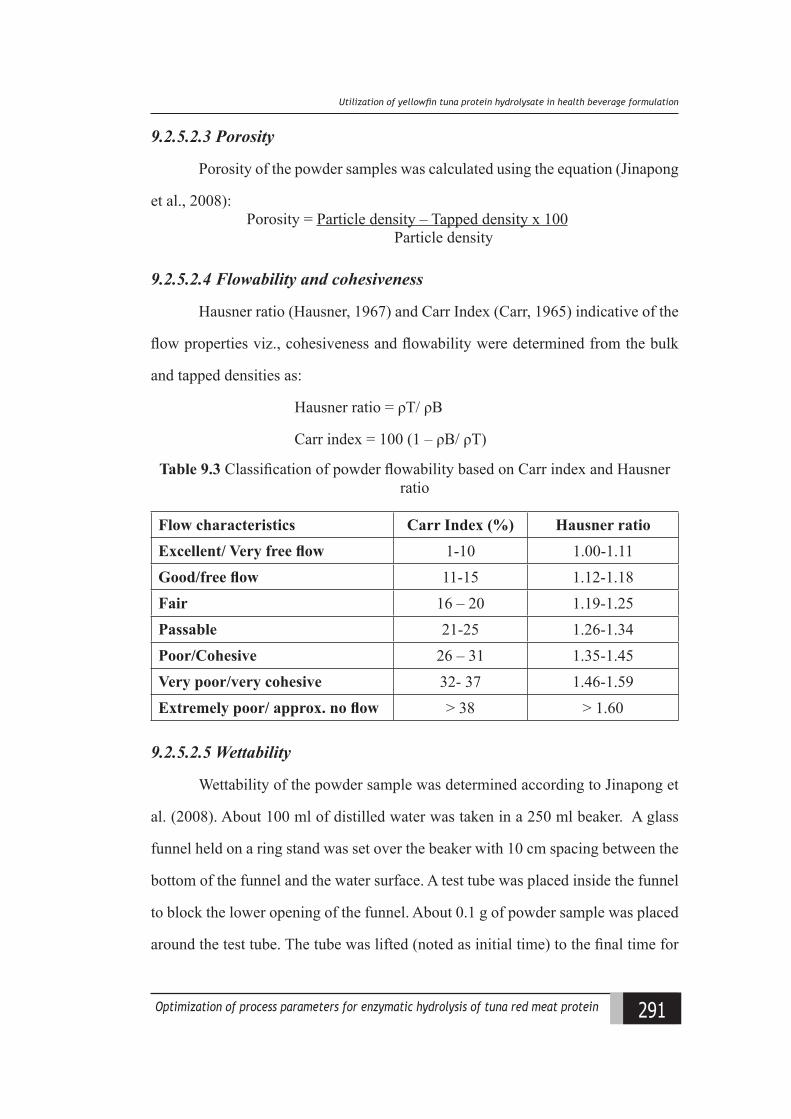
291Optimization of process parameters for enzymatic hydrolysis of tuna red meat protein
Utiliiation of yellowfn tuna protein hydrolysate in health leeerage formulation
9.2.5.2.3 Porosity
Porosity of the powder samples was calculated using the equation (Jinapong
et al., 2008): Porosity = Particle density – Tapped density x 100 Particle density
9.2.5.2.4 Flowability and cohesiveness
Hausner ratio (Hausner, 1967) and Carr Index (Carr, 1965) indicative of the
flow properties viz., cohesiveness and flowability were determined from the bulk
and tapped densities as:
Hausner ratio = ρT/ ρB
Carr index = 100 (1 – ρB/ ρT)
Table 9.3 Classification of powder flowability based on Carr index and Hausner ratio
Flow characteristics Carr Index (%) Hausner ratioExcellent/ Very free flow 1-10 1.00-1.11Good/free flow 11-15 1.12-1.18Fair 16 – 20 1.19-1.25Passable 21-25 1.26-1.34Poor/Cohesive 26 – 31 1.35-1.45Very poor/very cohesive 32- 37 1.46-1.59Extremely poor/ approx. no flow > 38 > 1.60
9.2.5.2.5 Wettability
Wettability of the powder sample was determined according to Jinapong et
al. (2008). About 100 ml of distilled water was taken in a 250 ml beaker. A glass
funnel held on a ring stand was set over the beaker with 10 cm spacing between the
bottom of the funnel and the water surface. A test tube was placed inside the funnel
to block the lower opening of the funnel. About 0.1 g of powder sample was placed
around the test tube. The tube was lifted (noted as initial time) to the final time for
292 Optimization of process parameters for enzymatic hydrolysis of tuna red meat protein
Chapter 9
the powder to become completely wetted (visually assessed as when all the powder
particles penetrated the surface of the water) was recorded to assess the wettability.
9.2.5.2.6 Dispersibility
Dispersibility measurement was performed as reported by Jinapong et al.
(2008). About 10 ml of distilled water, was poured into a 50 ml beaker into which
about one gram of powder was added. The sample was stirred vigorously with a
spoon for 15 s with about 25 complete back and forth movements around the beaker.
The reconstituted sample was sieved and the sieved milk (1 ml) was transferred to a
preweighed dry petriplate which was oven dried for about four hours at 100oC. The
dispersibility of the powder was calculated as:
Dispersibility (%) = (10 + a) x TS % a x 100-b
100
where a = amount of powder (g) used, b = moisture content in the powder, and %
TS = dry matter in the reconstituted sieved milk.
9.2.6 Antioxidant stability during in vitro gastrointestinal (GI) digestion
Simulated GI digestion using an in vitro pepsin–pancreatin hydrolysis was
carried out according to the method of Cinq-Mars et al. (2007) and You et al. (2010b),
with slight modification. The pH of the powder sample (3 mg, 15 ml) was adjusted
to 2.0 with 6 M HCl. Pepsin was then added (E/S 1:35 w/w), and the mixture was
incubated with continuous shaking (Shaking bath, Neolab Instruments, Mumbai,
India) for 1 h at 37oC. The pH was then adjusted to 5.3 with 0.9 M NaHCO3 solution
and further to pH 7.5 with 6 M NaOH. Pancreatin was added (E/S 1:25 w/w), and
the mixture was further incubated with continuous shaking for 3 h at 37oC. To
terminate the digestion, the solution was submerged in boiling water for 10 min.
Then, the GI digest was cooled to room temperature and centrifuged at 5000 g for
293Optimization of process parameters for enzymatic hydrolysis of tuna red meat protein
Utiliiation of yellowfn tuna protein hydrolysate in health leeerage formulation
15 min. The supernatant was used for analysis. To investigate the changes in DPPH
radical-scavenging activity of sample digested during the simulated GI digestion,
aliquots of GI digests were removed every one hour for 3 h during the in vitro
digestion.
9.2.7 Storage stability studies
Health mix selected based on the preliminary product acceptability study
together with control viz., base health mix (HM) were packed in airtight plastic
bottles, stored under ambient conditions (28oC) and subjected to monthly analysis
for indices viz., moisture (AOAC, 2012), pH (ECPH S1042S, Eutech Instruments,
Singapore), colour (EZ 45/0, Hunter Associates Lab inc., Reston, Virginia, USA),
PV (AOAC, 2012), FFA (AOAC, 2012), TMA-N and TVBN (Conway micro –
diffusion assay), sensory (Meilgaard et al., 2006) (Annexure 3) and microbiological
parameters (USFDA, 2001) for a period of six months (described in chapter 6;
section 6.2.3 and chapter 7; section 7.2.5).
9.2.8 Statistical analysis
The analytical data obtained in triplicate were subjected to analysis of
variance (ANOVA). The differences between means were evaluated by duncan’s
multiple range test and were considered significant at 5 % levels. SPSS statistic
programme (SPSS 16.0 for Windows, SPSS Inc., Chicago, IL) was used for
interpretation of the results obtained.
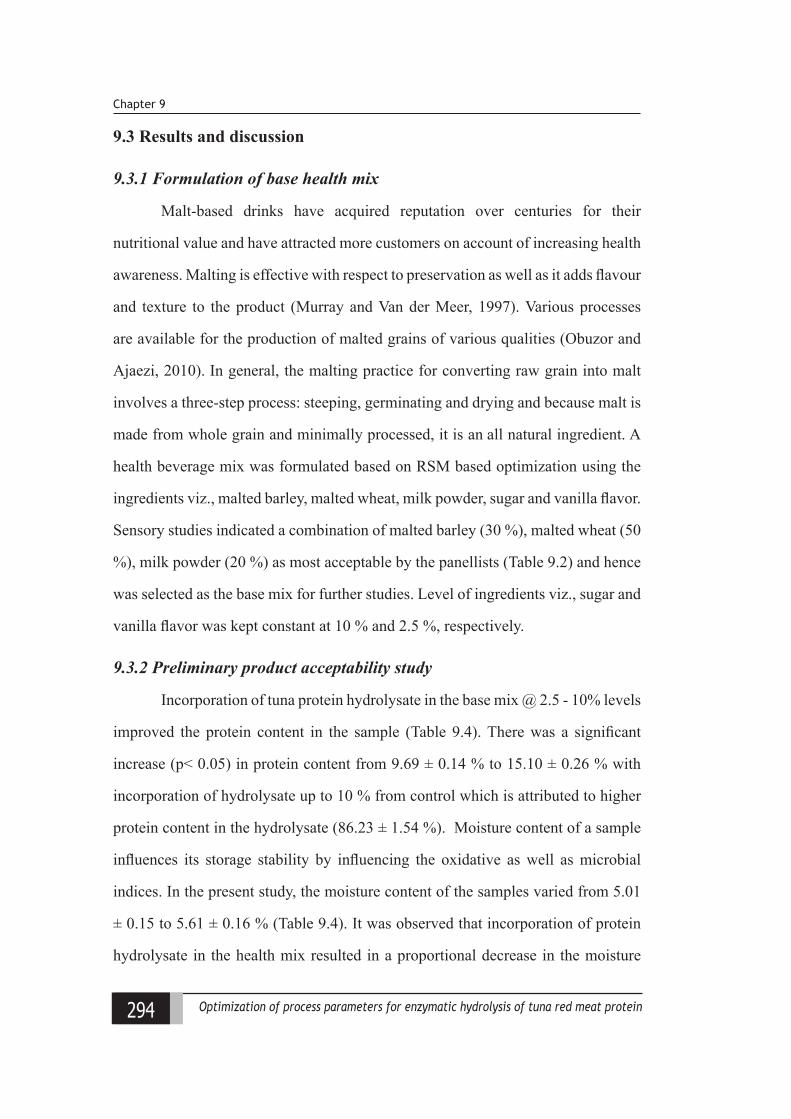
294 Optimization of process parameters for enzymatic hydrolysis of tuna red meat protein
Chapter 9
9.3 Results and discussion
9.3.1 Formulation of base health mix
Malt-based drinks have acquired reputation over centuries for their
nutritional value and have attracted more customers on account of increasing health
awareness. Malting is effective with respect to preservation as well as it adds flavour
and texture to the product (Murray and Van der Meer, 1997). Various processes
are available for the production of malted grains of various qualities (Obuzor and
Ajaezi, 2010). In general, the malting practice for converting raw grain into malt
involves a three-step process: steeping, germinating and drying and because malt is
made from whole grain and minimally processed, it is an all natural ingredient. A
health beverage mix was formulated based on RSM based optimization using the
ingredients viz., malted barley, malted wheat, milk powder, sugar and vanilla flavor.
Sensory studies indicated a combination of malted barley (30 %), malted wheat (50
%), milk powder (20 %) as most acceptable by the panellists (Table 9.2) and hence
was selected as the base mix for further studies. Level of ingredients viz., sugar and
vanilla flavor was kept constant at 10 % and 2.5 %, respectively.
9.3.2 Preliminary product acceptability study
Incorporation of tuna protein hydrolysate in the base mix @ 2.5 - 10% levels
improved the protein content in the sample (Table 9.4). There was a significant
increase (p< 0.05) in protein content from 9.69 ± 0.14 % to 15.10 ± 0.26 % with
incorporation of hydrolysate up to 10 % from control which is attributed to higher
protein content in the hydrolysate (86.23 ± 1.54 %). Moisture content of a sample
influences its storage stability by influencing the oxidative as well as microbial
indices. In the present study, the moisture content of the samples varied from 5.01
± 0.15 to 5.61 ± 0.16 % (Table 9.4). It was observed that incorporation of protein
hydrolysate in the health mix resulted in a proportional decrease in the moisture
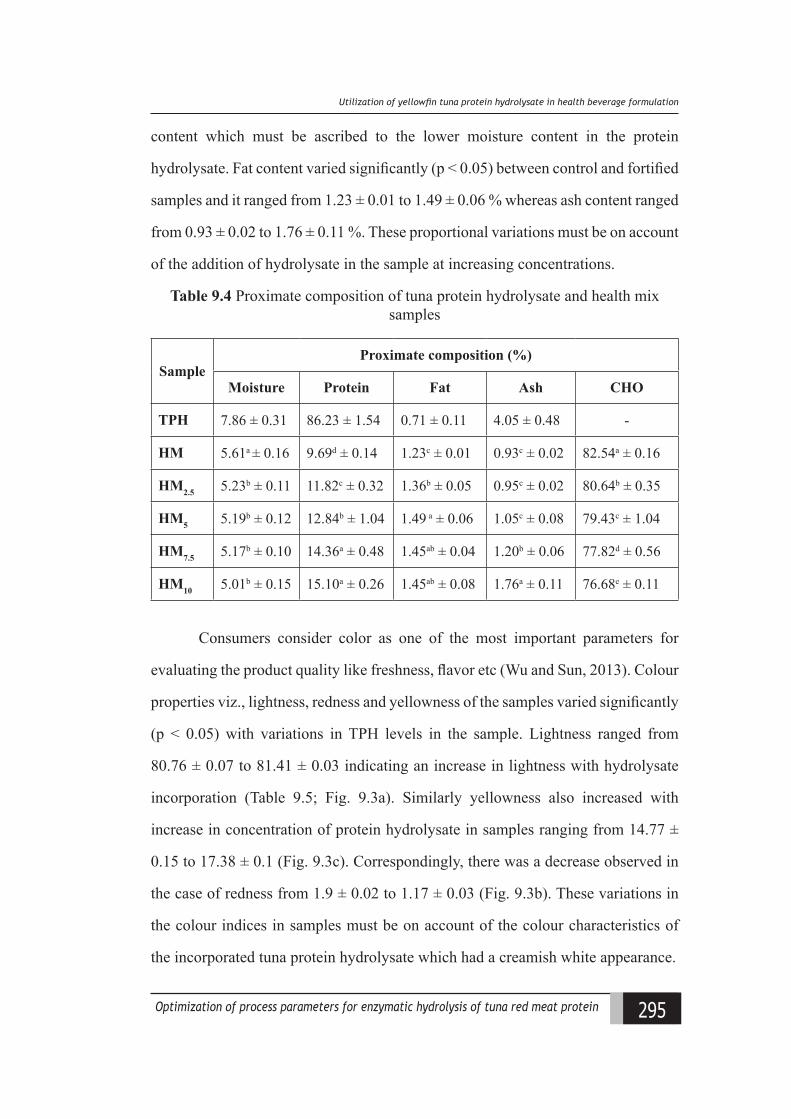
295Optimization of process parameters for enzymatic hydrolysis of tuna red meat protein
Utiliiation of yellowfn tuna protein hydrolysate in health leeerage formulation
content which must be ascribed to the lower moisture content in the protein
hydrolysate. Fat content varied significantly (p < 0.05) between control and fortified
samples and it ranged from 1.23 ± 0.01 to 1.49 ± 0.06 % whereas ash content ranged
from 0.93 ± 0.02 to 1.76 ± 0.11 %. These proportional variations must be on account
of the addition of hydrolysate in the sample at increasing concentrations.
Table 9.4 Proximate composition of tuna protein hydrolysate and health mix samples
SampleProximate composition (%)
Moisture Protein Fat Ash CHO
TPH 7.86 ± 0.31 86.23 ± 1.54 0.71 ± 0.11 4.05 ± 0.48 -
HM 5.61a ± 0.16 9.69d ± 0.14 1.23c ± 0.01 0.93c ± 0.02 82.54a ± 0.16
HM2.5 5.23b ± 0.11 11.82c ± 0.32 1.36b ± 0.05 0.95c ± 0.02 80.64b ± 0.35
HM5 5.19b ± 0.12 12.84b ± 1.04 1.49 a ± 0.06 1.05c ± 0.08 79.43c ± 1.04
HM7.5 5.17b ± 0.10 14.36a ± 0.48 1.45ab ± 0.04 1.20b ± 0.06 77.82d ± 0.56
HM10 5.01b ± 0.15 15.10a ± 0.26 1.45ab ± 0.08 1.76a ± 0.11 76.68e ± 0.11
Consumers consider color as one of the most important parameters for
evaluating the product quality like freshness, flavor etc (Wu and Sun, 2013). Colour
properties viz., lightness, redness and yellowness of the samples varied significantly
(p < 0.05) with variations in TPH levels in the sample. Lightness ranged from
80.76 ± 0.07 to 81.41 ± 0.03 indicating an increase in lightness with hydrolysate
incorporation (Table 9.5; Fig. 9.3a). Similarly yellowness also increased with
increase in concentration of protein hydrolysate in samples ranging from 14.77 ±
0.15 to 17.38 ± 0.1 (Fig. 9.3c). Correspondingly, there was a decrease observed in
the case of redness from 1.9 ± 0.02 to 1.17 ± 0.03 (Fig. 9.3b). These variations in
the colour indices in samples must be on account of the colour characteristics of
the incorporated tuna protein hydrolysate which had a creamish white appearance.
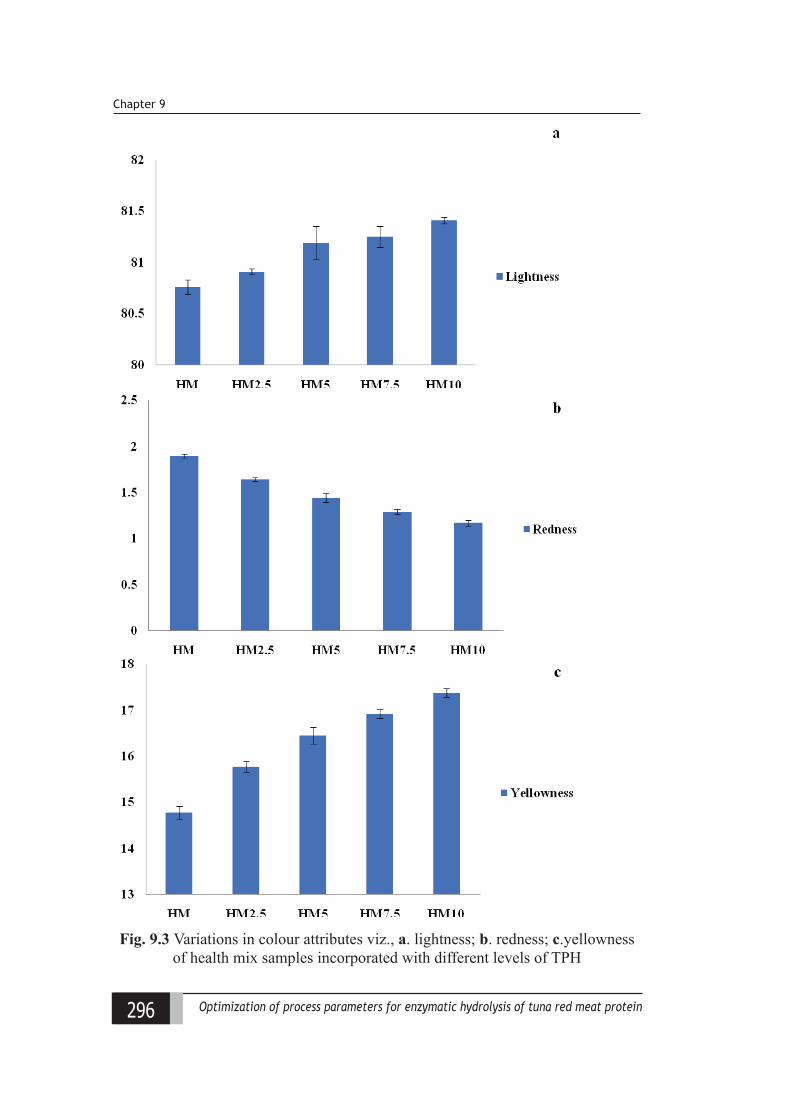
296 Optimization of process parameters for enzymatic hydrolysis of tuna red meat protein
Chapter 9
Fig. 9.3 Variations in colour attributes viz., a. lightness; b. redness; c.yellowness of health mix samples incorporated with different levels of TPH
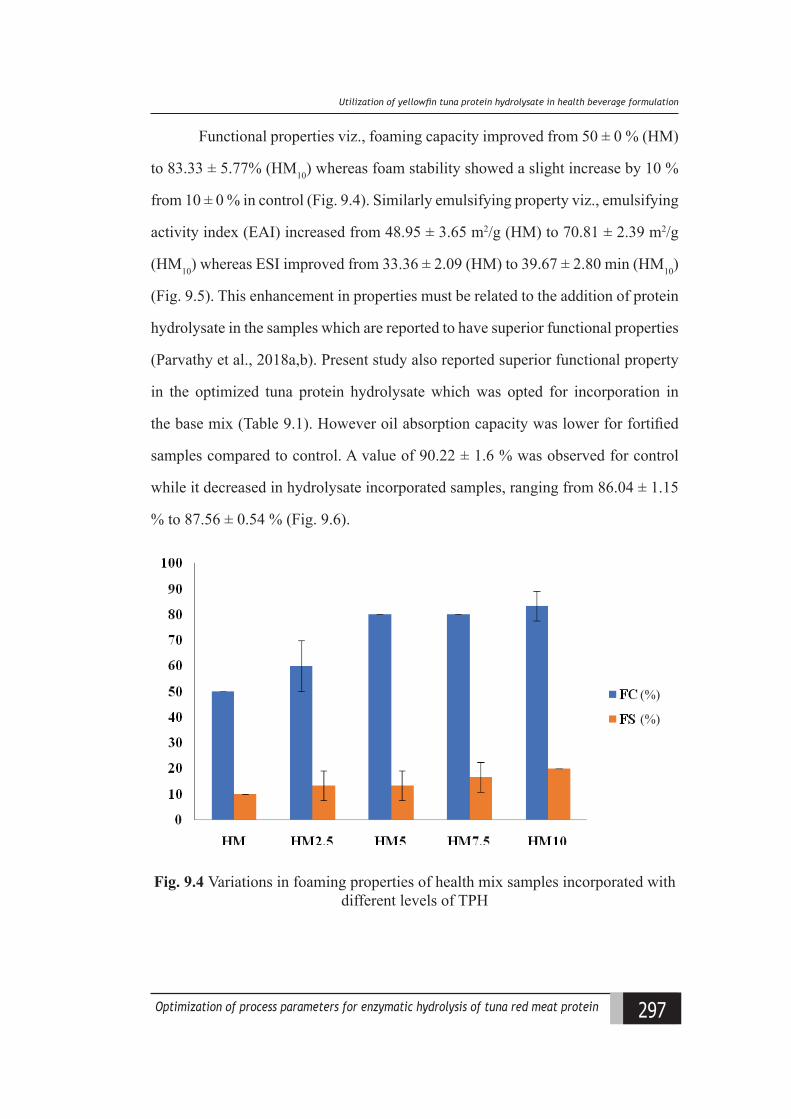
297Optimization of process parameters for enzymatic hydrolysis of tuna red meat protein
Utiliiation of yellowfn tuna protein hydrolysate in health leeerage formulation
Functional properties viz., foaming capacity improved from 50 ± 0 % (HM)
to 83.33 ± 5.77% (HM10) whereas foam stability showed a slight increase by 10 %
from 10 ± 0 % in control (Fig. 9.4). Similarly emulsifying property viz., emulsifying
activity index (EAI) increased from 48.95 ± 3.65 m2/g (HM) to 70.81 ± 2.39 m2/g
(HM10) whereas ESI improved from 33.36 ± 2.09 (HM) to 39.67 ± 2.80 min (HM10)
(Fig. 9.5). This enhancement in properties must be related to the addition of protein
hydrolysate in the samples which are reported to have superior functional properties
(Parvathy et al., 2018a,b). Present study also reported superior functional property
in the optimized tuna protein hydrolysate which was opted for incorporation in
the base mix (Table 9.1). However oil absorption capacity was lower for fortified
samples compared to control. A value of 90.22 ± 1.6 % was observed for control
while it decreased in hydrolysate incorporated samples, ranging from 86.04 ± 1.15
% to 87.56 ± 0.54 % (Fig. 9.6).
(%)
(%)
Fig. 9.4 Variations in foaming properties of health mix samples incorporated with different levels of TPH
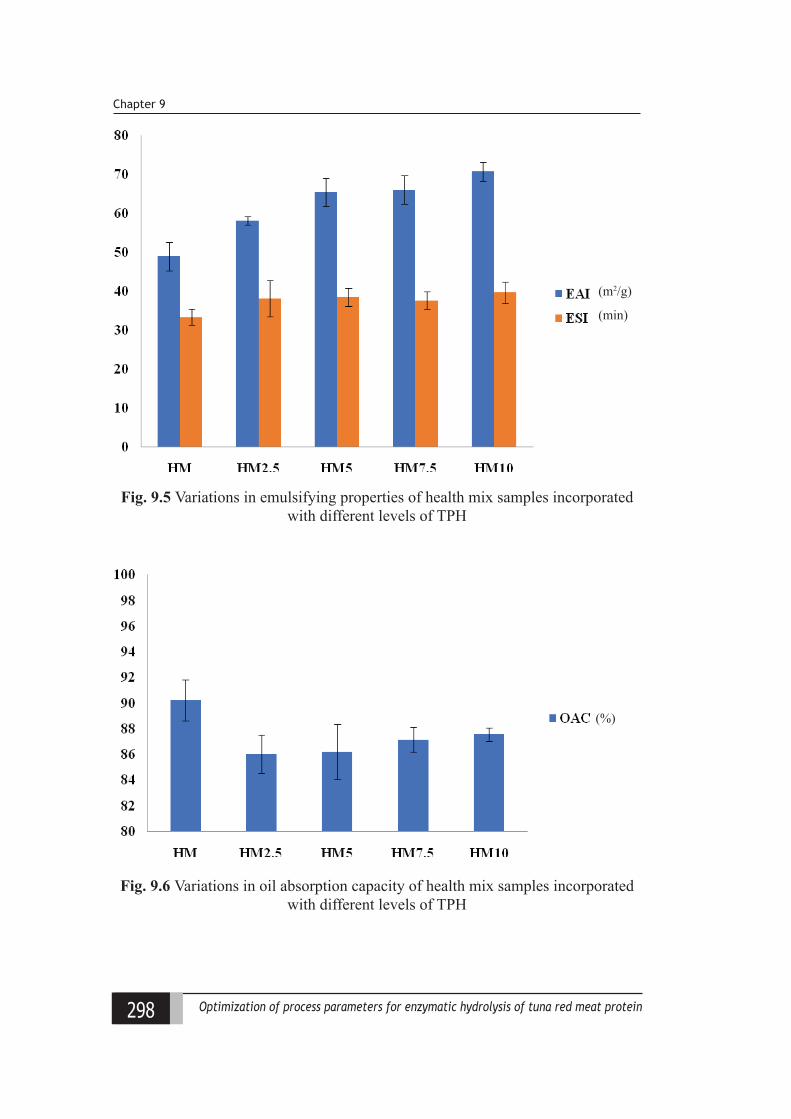
298 Optimization of process parameters for enzymatic hydrolysis of tuna red meat protein
Chapter 9
(m2/g)
(min)
Fig. 9.5 Variations in emulsifying properties of health mix samples incorporated with different levels of TPH
(%)
Fig. 9.6 Variations in oil absorption capacity of health mix samples incorporated with different levels of TPH
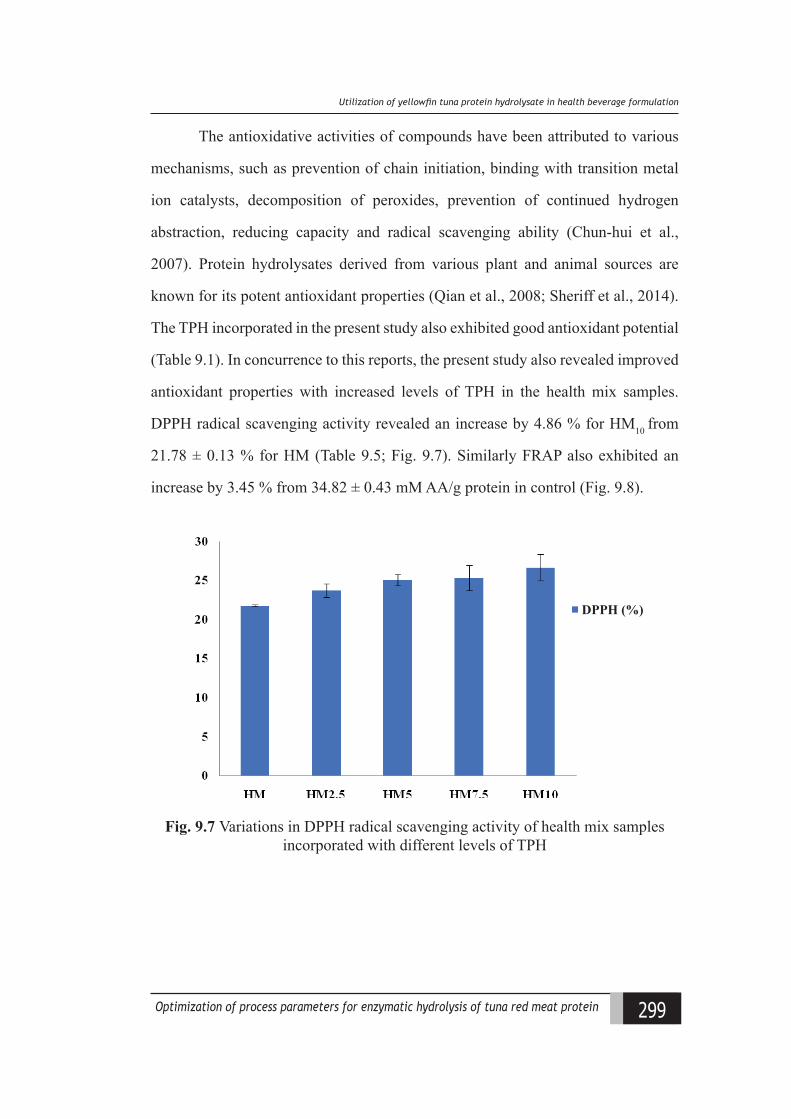
299Optimization of process parameters for enzymatic hydrolysis of tuna red meat protein
Utiliiation of yellowfn tuna protein hydrolysate in health leeerage formulation
The antioxidative activities of compounds have been attributed to various
mechanisms, such as prevention of chain initiation, binding with transition metal
ion catalysts, decomposition of peroxides, prevention of continued hydrogen
abstraction, reducing capacity and radical scavenging ability (Chun-hui et al.,
2007). Protein hydrolysates derived from various plant and animal sources are
known for its potent antioxidant properties (Qian et al., 2008; Sheriff et al., 2014).
The TPH incorporated in the present study also exhibited good antioxidant potential
(Table 9.1). In concurrence to this reports, the present study also revealed improved
antioxidant properties with increased levels of TPH in the health mix samples.
DPPH radical scavenging activity revealed an increase by 4.86 % for HM10 from
21.78 ± 0.13 % for HM (Table 9.5; Fig. 9.7). Similarly FRAP also exhibited an
increase by 3.45 % from 34.82 ± 0.43 mM AA/g protein in control (Fig. 9.8).
DPPH (%)
Fig. 9.7 Variations in DPPH radical scavenging activity of health mix samples incorporated with different levels of TPH
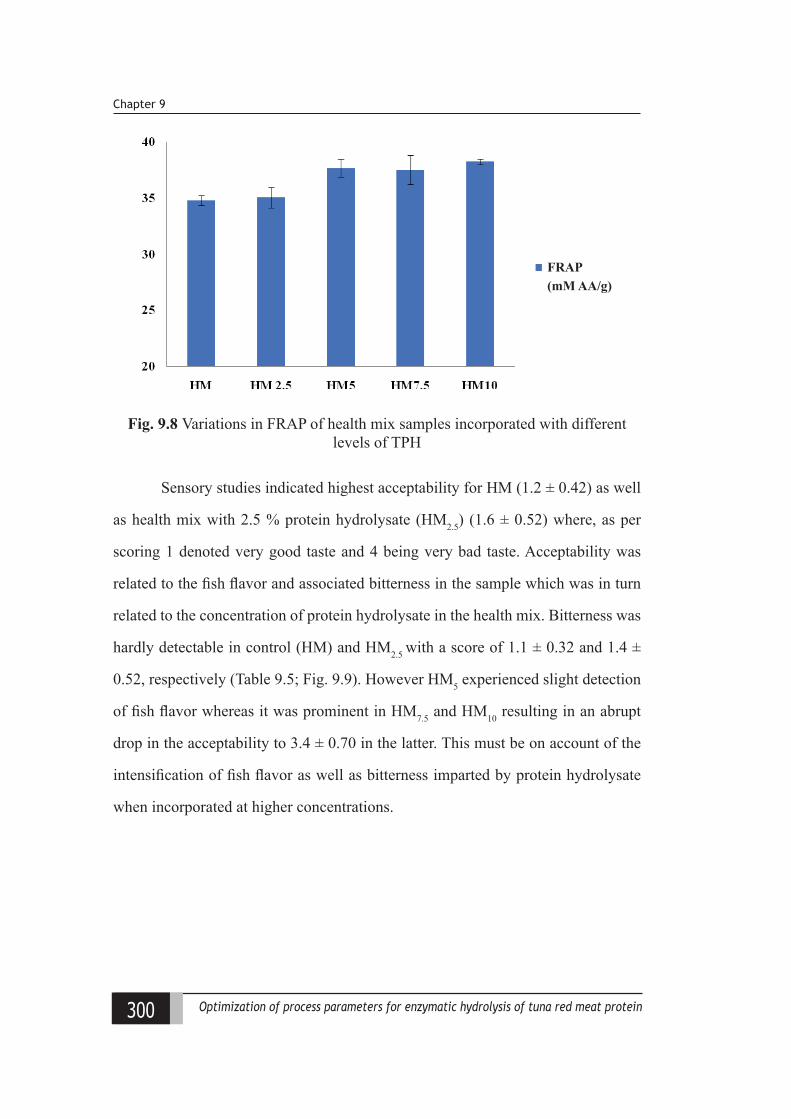
300 Optimization of process parameters for enzymatic hydrolysis of tuna red meat protein
Chapter 9
FRAP (mM AA/g)
Fig. 9.8 Variations in FRAP of health mix samples incorporated with different levels of TPH
Sensory studies indicated highest acceptability for HM (1.2 ± 0.42) as well
as health mix with 2.5 % protein hydrolysate (HM2.5) (1.6 ± 0.52) where, as per
scoring 1 denoted very good taste and 4 being very bad taste. Acceptability was
related to the fish flavor and associated bitterness in the sample which was in turn
related to the concentration of protein hydrolysate in the health mix. Bitterness was
hardly detectable in control (HM) and HM2.5 with a score of 1.1 ± 0.32 and 1.4 ±
0.52, respectively (Table 9.5; Fig. 9.9). However HM5 experienced slight detection
of fish flavor whereas it was prominent in HM7.5 and HM10 resulting in an abrupt
drop in the acceptability to 3.4 ± 0.70 in the latter. This must be on account of the
intensification of fish flavor as well as bitterness imparted by protein hydrolysate
when incorporated at higher concentrations.
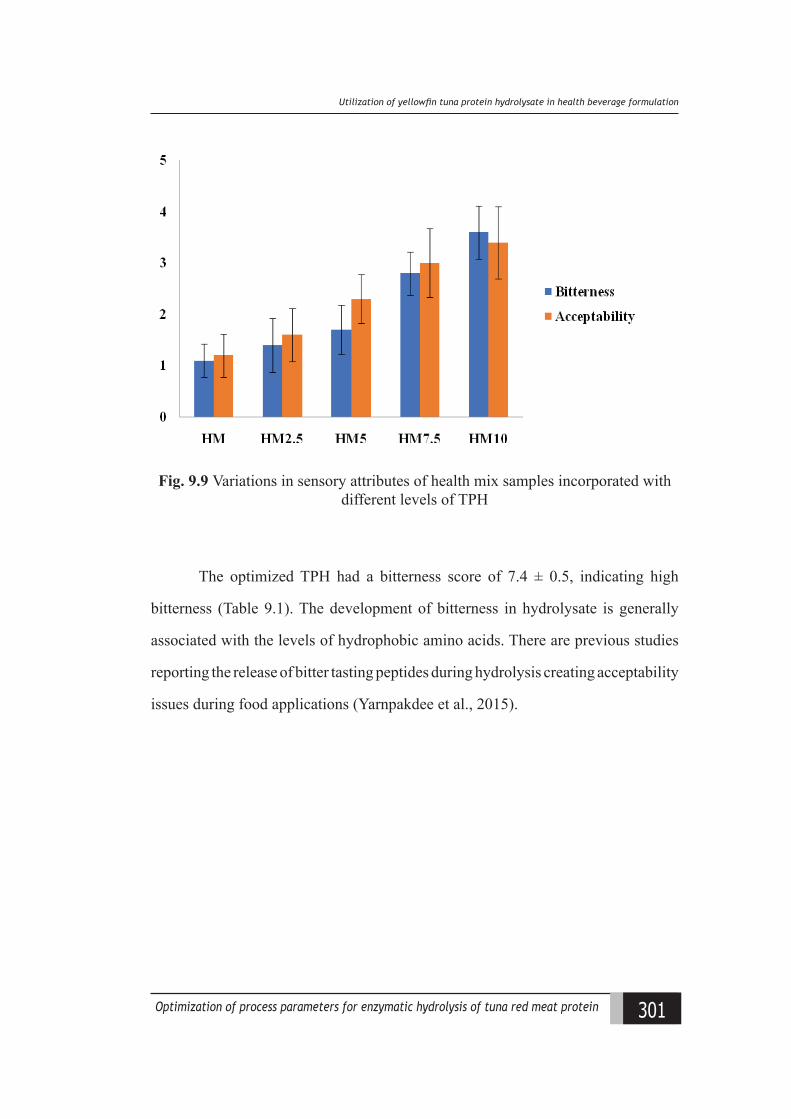
301Optimization of process parameters for enzymatic hydrolysis of tuna red meat protein
Utiliiation of yellowfn tuna protein hydrolysate in health leeerage formulation
Fig. 9.9 Variations in sensory attributes of health mix samples incorporated with different levels of TPH
The optimized TPH had a bitterness score of 7.4 ± 0.5, indicating high
bitterness (Table 9.1). The development of bitterness in hydrolysate is generally
associated with the levels of hydrophobic amino acids. There are previous studies
reporting the release of bitter tasting peptides during hydrolysis creating acceptability
issues during food applications (Yarnpakdee et al., 2015).
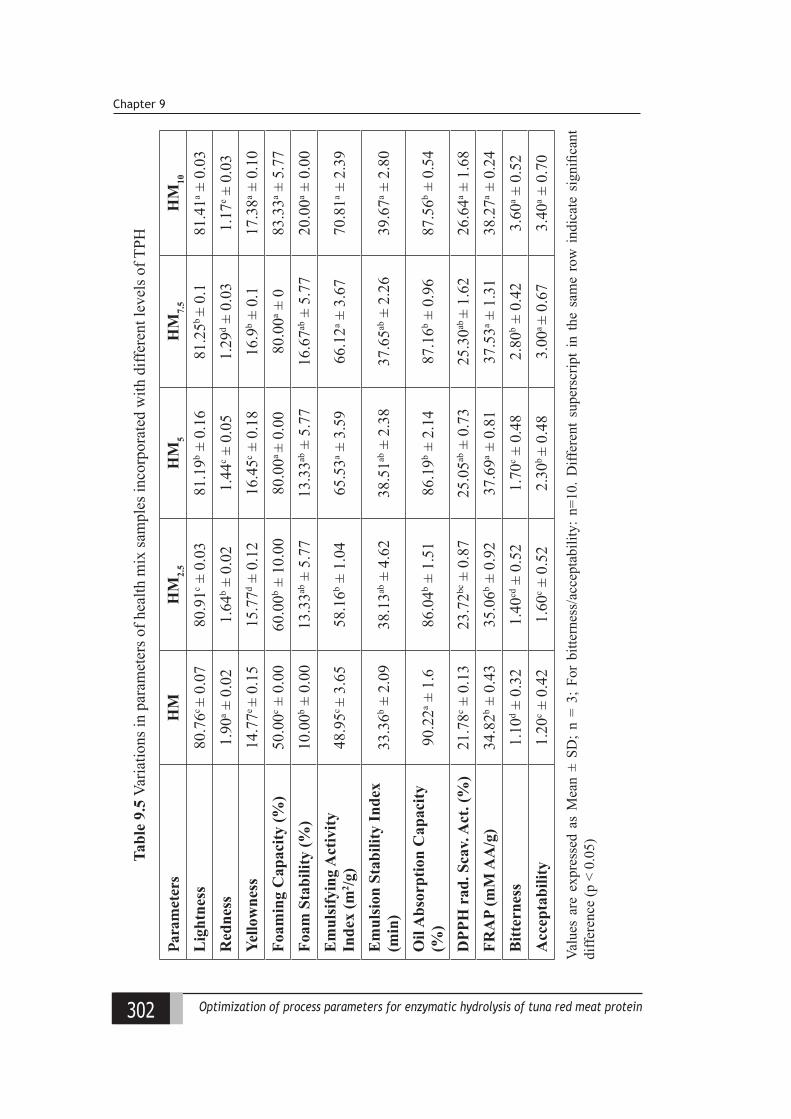
302 Optimization of process parameters for enzymatic hydrolysis of tuna red meat protein
Chapter 9
Para
met
ers
HM
HM
2.5
HM
5H
M7.
5H
M10
Lig
htne
ss80
.76c
± 0.
0780
.91c ±
0.0
381
.19b ±
0.1
681
.25b
± 0.
181
.41a ±
0.0
3R
edne
ss1.
90a ±
0.0
21.
64b ±
0.0
21.
44c ±
0.0
51.
29d ±
0.0
31.
17e ±
0.0
3Ye
llow
ness
14.7
7e ±
0.15
15.7
7d ± 0
.12
16.4
5c ± 0
.18
16.9
b ± 0
.117
.38a ±
0.1
0Fo
amin
g C
apac
ity (%
)50
.00c ±
0.0
060
.00b ±
10.
0080
.00a
± 0.
0080
.00a ±
083
.33a ±
5.7
7Fo
am S
tabi
lity
(%)
10.0
0b ± 0
.00
13.3
3ab ±
5.7
713
.33ab
± 5
.77
16.6
7ab ±
5.7
720
.00a ±
0.0
0E
mul
sify
ing
Act
ivity
In
dex
(m2 /g
)48
.95c
± 3.
6558
.16b ±
1.0
465
.53a ±
3.5
966
.12a ±
3.6
770
.81a ±
2.3
9
Em
ulsi
on S
tabi
lity
Inde
x (m
in)
33.3
6b ± 2
.09
38.1
3ab ±
4.6
238
.51ab
± 2
.38
37.6
5ab ±
2.2
639
.67a ±
2.8
0
Oil
Abs
orpt
ion
Cap
acity
(%
)90
.22a ±
1.6
86.0
4b ± 1
.51
86.1
9b ± 2
.14
87.1
6b ± 0
.96
87.5
6b ± 0
.54
DPP
H r
ad. S
cav.
Act
. (%
)21
.78c ±
0.1
323
.72bc
± 0
.87
25.0
5ab ±
0.7
325
.30ab
± 1
.62
26.6
4a ± 1
.68
FRA
P (m
M A
A/g
)34
.82b ±
0.4
335
.06b ±
0.9
237
.69a ±
0.8
137
.53a ±
1.3
138
.27a ±
0.2
4B
itter
ness
1.10
d ± 0
.32
1.40
cd ±
0.5
21.
70c ±
0.4
82.
80b ±
0.4
23.
60a ±
0.5
2A
ccep
tabi
lity
1.20
c ± 0
.42
1.60
c ± 0
.52
2.30
b ±
0.48
3.00
a ±
0.67
3.40
a ± 0
.70
Valu
es a
re e
xpre
ssed
as
Mea
n ±
SD;
n =
3; F
or b
itter
ness
/acc
epta
bilit
y: n
=10.
Diff
eren
t su
pers
crip
t in
the
sam
e ro
w i
ndic
ate
sign
ifica
nt
diffe
renc
e (p
< 0
.05)Tabl
e 9.
5 Va
riatio
ns in
par
amet
ers o
f hea
lth m
ix sa
mpl
es in
corp
orat
ed w
ith d
iffer
ent l
evel
s of T
PH
303Optimization of process parameters for enzymatic hydrolysis of tuna red meat protein
Utiliiation of yellowfn tuna protein hydrolysate in health leeerage formulation
9.3.3 Characterization of health mix
9.3.3.1 Nutritional profile
The new era of food system has introduced various diets and dietary habits
with simultaneous rise in burden on healthcare systems making it decisive to
develop novel products, interventions and refined guidelines which will perk up
health through diet. Foods that are self sustained to provide adequate nutrients and
appropriate calories, is a fundamental requirement for continued health. Nutrient
profiling is a synthetic indicator of its overall nutritional quality and aims to classify
individual foods based on their nutrient content and their contribution to a healthy
diet (Maillot et al., 2008). This gives insights into the composition of the available
processed foods in the market facilitating the customers to choose the right product
based on their demand (Pivk Kupirovič et al., 2019).
9.3.3.1.1 Fatty acid
Fatty acids play a major role in metabolism both for storage and transport
of energy, as vital components of all membranes as well as act as gene regulators.
Omega 3 fatty acids such as EPA (eicosapentaenoic acid) and DHA (docosahexaenoic
acid), well-known for their health benefits (Nettleton, 1995), have emerged as one
of the major ingredients in a growing variety of functional foods and beverages.
One of the possibilities of enrichment of food products with omega-3 PUFA is
the incorporation of marine sources (Kolanowski and Laufenberg, 2006). After
enormous daunting trials, recently food industry has succeeded in facilitating this
nutrient in getting well into a palatable beverage by optimizing the ingredient
formulations. Though fatty acids and lipids contribute only upto the tune of 1-3%
of total grain weight, they have a major role in determining the final product.
Analysis of fatty acids in the developed health mix samples indicated palmitic
and oleic acids to be in good proportion followed by linoleic, stearic and myristic
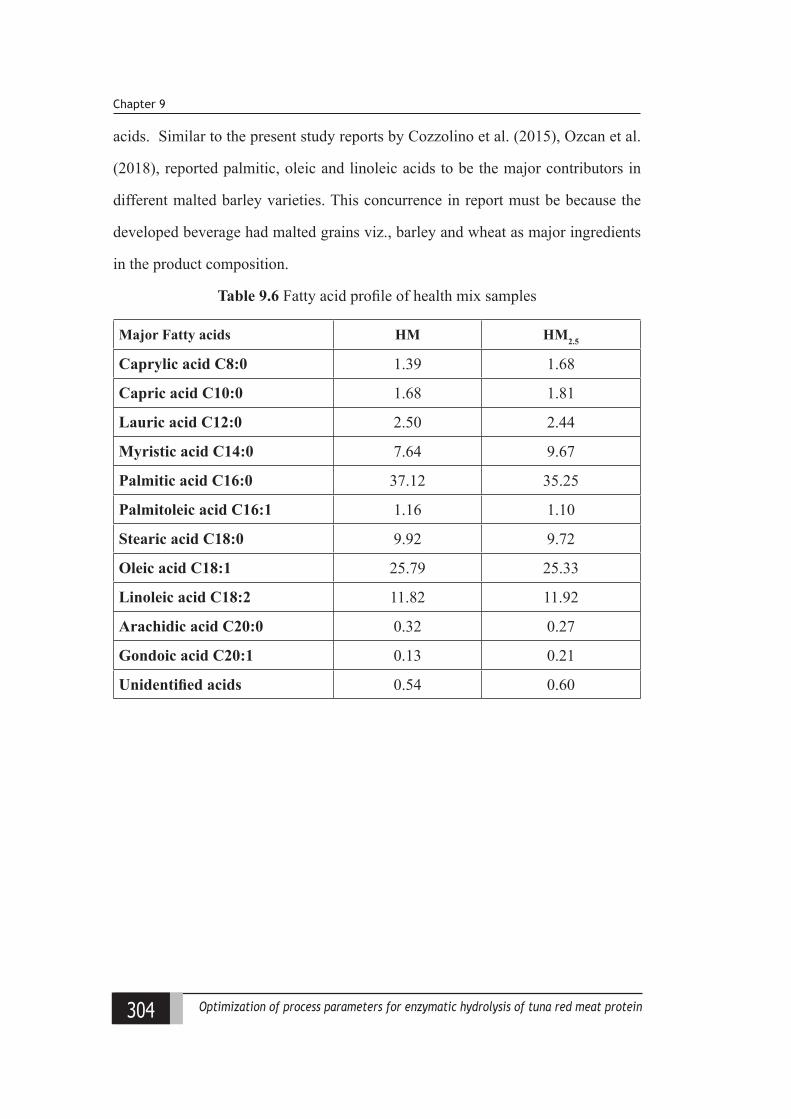
304 Optimization of process parameters for enzymatic hydrolysis of tuna red meat protein
Chapter 9
acids. Similar to the present study reports by Cozzolino et al. (2015), Ozcan et al.
(2018), reported palmitic, oleic and linoleic acids to be the major contributors in
different malted barley varieties. This concurrence in report must be because the
developed beverage had malted grains viz., barley and wheat as major ingredients
in the product composition.
Table 9.6 Fatty acid profile of health mix samples
Major Fatty acids HM HM2.5
Caprylic acid C8:0 1.39 1.68
Capric acid C10:0 1.68 1.81
Lauric acid C12:0 2.50 2.44
Myristic acid C14:0 7.64 9.67
Palmitic acid C16:0 37.12 35.25
Palmitoleic acid C16:1 1.16 1.10
Stearic acid C18:0 9.92 9.72
Oleic acid C18:1 25.79 25.33
Linoleic acid C18:2 11.82 11.92
Arachidic acid C20:0 0.32 0.27
Gondoic acid C20:1 0.13 0.21
Unidentified acids 0.54 0.60
305Optimization of process parameters for enzymatic hydrolysis of tuna red meat protein
Utiliiation of yellowfn tuna protein hydrolysate in health leeerage formulation
9.3.3.1.2 Amino acid
Proteins, made-up of the fundamental components viz., amino acids have a
major role to play in the world of food supplements. These ingredients help novel
functional beverages, in maintaining their status as healthy drinks (Gruenwald,
2009). Fortified products should supplement the essential amino acids in a balanced
manner to meet the dietary requirements. In the present study, amino acid analysis
indicated not much difference between base mix as well as fortified one. However
an increase in total essential amino acid content from 40.8 % to 42.18 % was
observed on fortification with hydrolysate which was desirable. The essential amino
acid profile indicated that leucine was present in the highest amount (Table 9.7).
Moreover, the data pertaining to non- essential amino acids indicated glutamic acid
to be in highest proportion. The presented health mix samples satisfied the reference
EAA value of 40 % (Table 9.7), as recommended by WHO/FAO/UNU (2007) and
hence marked to be a suitable dietary nutrient supplement. Similar reports were
given by Yasmin et al. (2015) with highest amount of glutamic acid in whey based
fructooligosaccharides supplemented low-calorie drink. Presence of branched
chain amino acids like isoleucine, leucine and valine promote muscle protein
synthesis and helps to increase the bio-availability of high complex carbohydrate
intake and are absorbed by muscle cells for anabolic muscle building activity (Jain
et al., 2013). The health mix samples had high levels of leucine and moderate levels
of isoleucine and valine thus being nutritionally advantageous. Studies by Sinha
et al. (2007) on the amino acid profile for whey protein concentrate for beverage
formulation also indicated glutamic acid to be the prominent amino acid followed
by leucine and aspartic acid.
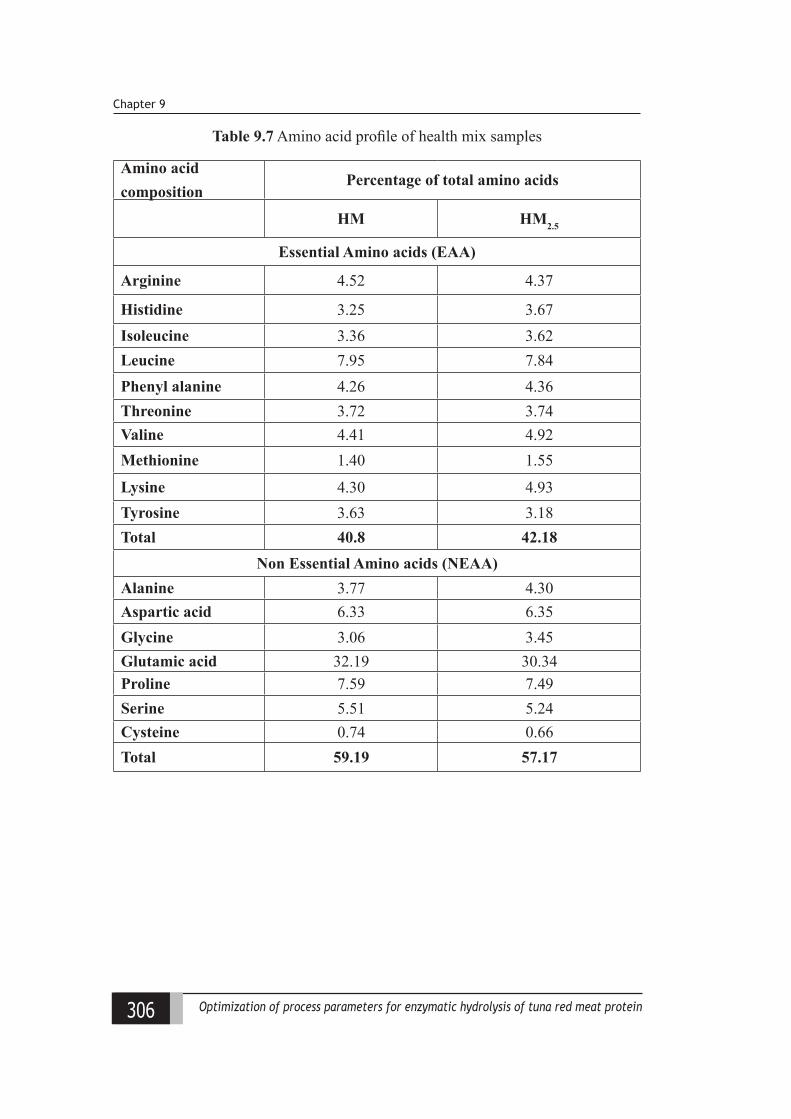
306 Optimization of process parameters for enzymatic hydrolysis of tuna red meat protein
Chapter 9
Table 9.7 Amino acid profile of health mix samples
Amino acid composition
Percentage of total amino acids
HM HM2.5
Essential Amino acids (EAA)
Arginine 4.52 4.37
Histidine 3.25 3.67Isoleucine 3.36 3.62Leucine 7.95 7.84Phenyl alanine 4.26 4.36Threonine 3.72 3.74Valine 4.41 4.92Methionine 1.40 1.55
Lysine 4.30 4.93Tyrosine 3.63 3.18Total 40.8 42.18
Non Essential Amino acids (NEAA)Alanine 3.77 4.30Aspartic acid 6.33 6.35Glycine 3.06 3.45Glutamic acid 32.19 30.34Proline 7.59 7.49Serine 5.51 5.24Cysteine 0.74 0.66Total 59.19 57.17
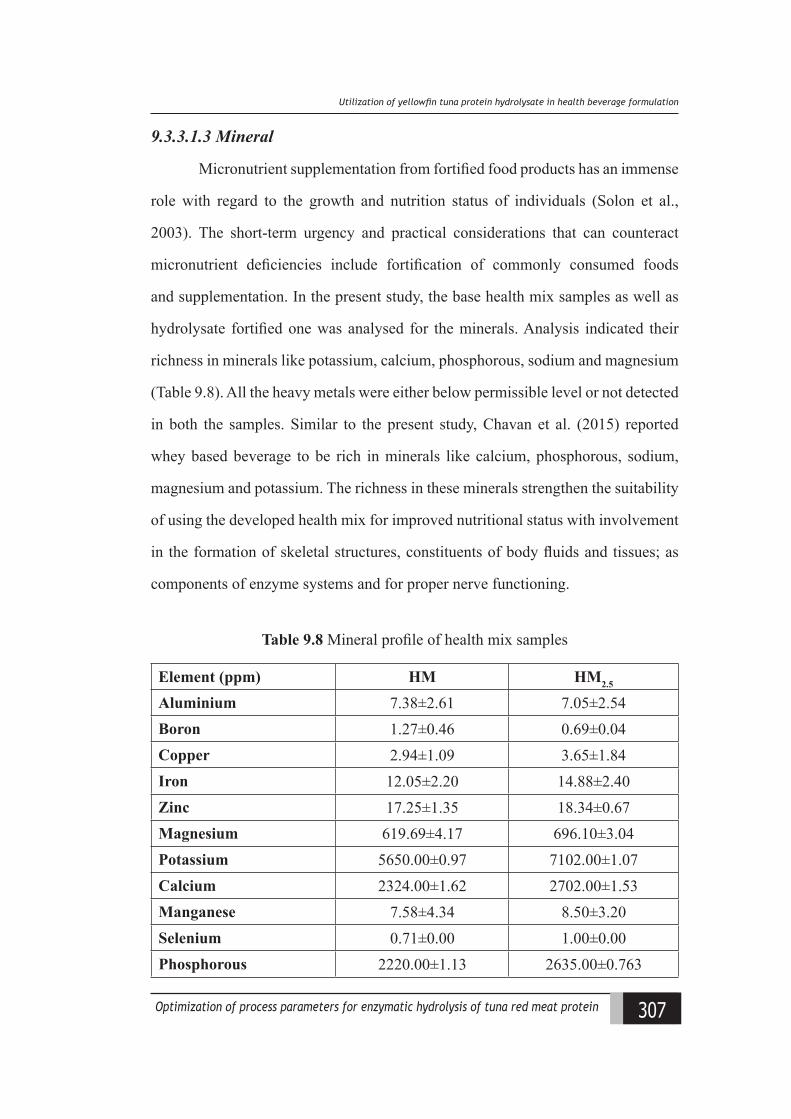
307Optimization of process parameters for enzymatic hydrolysis of tuna red meat protein
Utiliiation of yellowfn tuna protein hydrolysate in health leeerage formulation
9.3.3.1.3 Mineral
Micronutrient supplementation from fortified food products has an immense
role with regard to the growth and nutrition status of individuals (Solon et al.,
2003). The short-term urgency and practical considerations that can counteract
micronutrient deficiencies include fortification of commonly consumed foods
and supplementation. In the present study, the base health mix samples as well as
hydrolysate fortified one was analysed for the minerals. Analysis indicated their
richness in minerals like potassium, calcium, phosphorous, sodium and magnesium
(Table 9.8). All the heavy metals were either below permissible level or not detected
in both the samples. Similar to the present study, Chavan et al. (2015) reported
whey based beverage to be rich in minerals like calcium, phosphorous, sodium,
magnesium and potassium. The richness in these minerals strengthen the suitability
of using the developed health mix for improved nutritional status with involvement
in the formation of skeletal structures, constituents of body fluids and tissues; as
components of enzyme systems and for proper nerve functioning.
Table 9.8 Mineral profile of health mix samples
Element (ppm) HM HM2.5
Aluminium 7.38±2.61 7.05±2.54Boron 1.27±0.46 0.69±0.04Copper 2.94±1.09 3.65±1.84Iron 12.05±2.20 14.88±2.40Zinc 17.25±1.35 18.34±0.67Magnesium 619.69±4.17 696.10±3.04Potassium 5650.00±0.97 7102.00±1.07Calcium 2324.00±1.62 2702.00±1.53Manganese 7.58±4.34 8.50±3.20Selenium 0.71±0.00 1.00±0.00Phosphorous 2220.00±1.13 2635.00±0.763
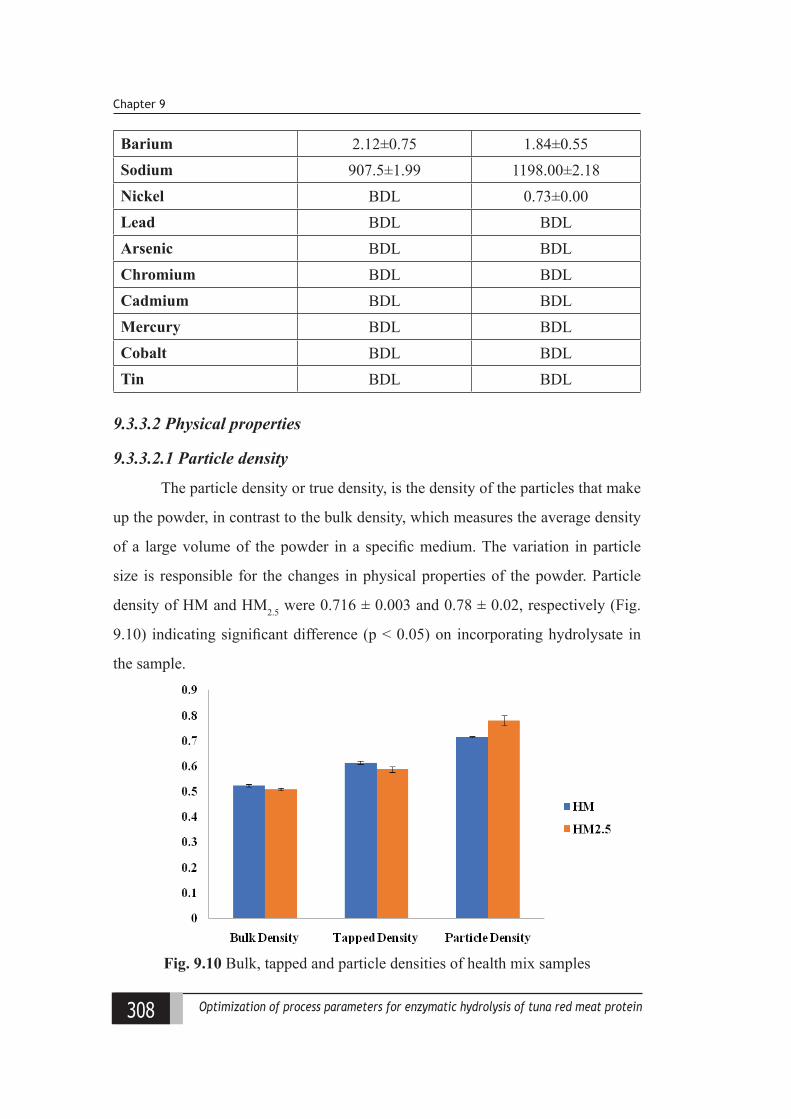
308 Optimization of process parameters for enzymatic hydrolysis of tuna red meat protein
Chapter 9
Barium 2.12±0.75 1.84±0.55Sodium 907.5±1.99 1198.00±2.18Nickel BDL 0.73±0.00Lead BDL BDLArsenic BDL BDLChromium BDL BDLCadmium BDL BDLMercury BDL BDLCobalt BDL BDLTin BDL BDL
9.3.3.2 Physical properties
9.3.3.2.1 Particle density
The particle density or true density, is the density of the particles that make
up the powder, in contrast to the bulk density, which measures the average density
of a large volume of the powder in a specific medium. The variation in particle
size is responsible for the changes in physical properties of the powder. Particle
density of HM and HM2.5 were 0.716 ± 0.003 and 0.78 ± 0.02, respectively (Fig.
9.10) indicating significant difference (p < 0.05) on incorporating hydrolysate in
the sample.
Fig. 9.10 Bulk, tapped and particle densities of health mix samples
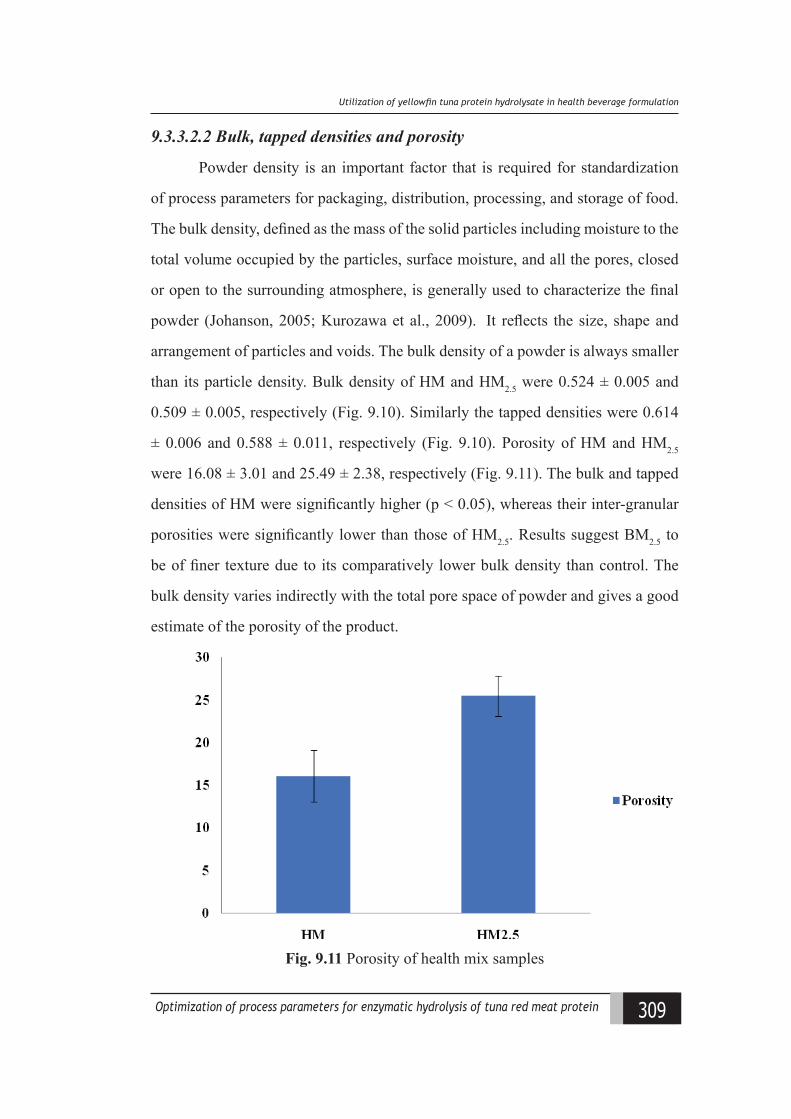
309Optimization of process parameters for enzymatic hydrolysis of tuna red meat protein
Utiliiation of yellowfn tuna protein hydrolysate in health leeerage formulation
9.3.3.2.2 Bulk, tapped densities and porosity
Powder density is an important factor that is required for standardization
of process parameters for packaging, distribution, processing, and storage of food.
The bulk density, defined as the mass of the solid particles including moisture to the
total volume occupied by the particles, surface moisture, and all the pores, closed
or open to the surrounding atmosphere, is generally used to characterize the final
powder (Johanson, 2005; Kurozawa et al., 2009). It reflects the size, shape and
arrangement of particles and voids. The bulk density of a powder is always smaller
than its particle density. Bulk density of HM and HM2.5 were 0.524 ± 0.005 and
0.509 ± 0.005, respectively (Fig. 9.10). Similarly the tapped densities were 0.614
± 0.006 and 0.588 ± 0.011, respectively (Fig. 9.10). Porosity of HM and HM2.5
were 16.08 ± 3.01 and 25.49 ± 2.38, respectively (Fig. 9.11). The bulk and tapped
densities of HM were significantly higher (p < 0.05), whereas their inter-granular
porosities were significantly lower than those of HM2.5. Results suggest BM2.5 to
be of finer texture due to its comparatively lower bulk density than control. The
bulk density varies indirectly with the total pore space of powder and gives a good
estimate of the porosity of the product.
Fig. 9.11 Porosity of health mix samples
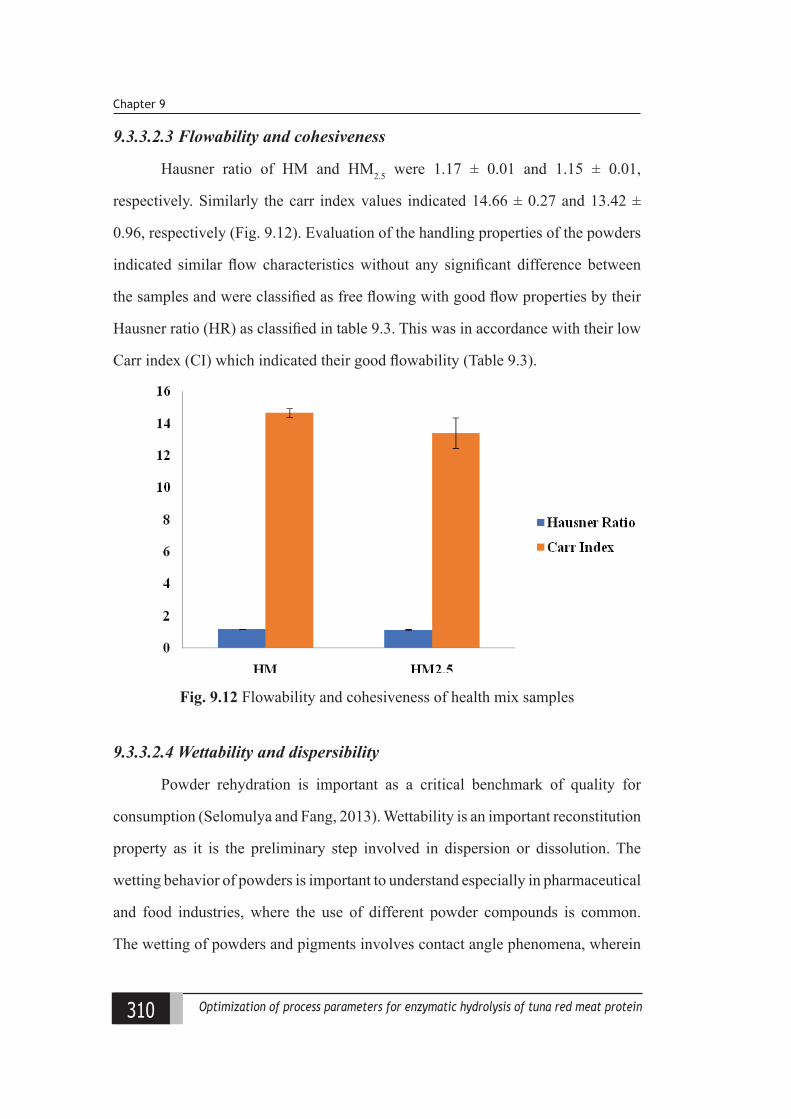
310 Optimization of process parameters for enzymatic hydrolysis of tuna red meat protein
Chapter 9
9.3.3.2.3 Flowability and cohesiveness
Hausner ratio of HM and HM2.5 were 1.17 ± 0.01 and 1.15 ± 0.01,
respectively. Similarly the carr index values indicated 14.66 ± 0.27 and 13.42 ±
0.96, respectively (Fig. 9.12). Evaluation of the handling properties of the powders
indicated similar flow characteristics without any significant difference between
the samples and were classified as free flowing with good flow properties by their
Hausner ratio (HR) as classified in table 9.3. This was in accordance with their low
Carr index (CI) which indicated their good flowability (Table 9.3).
Fig. 9.12 Flowability and cohesiveness of health mix samples
9.3.3.2.4 Wettability and dispersibility
Powder rehydration is important as a critical benchmark of quality for
consumption (Selomulya and Fang, 2013). Wettability is an important reconstitution
property as it is the preliminary step involved in dispersion or dissolution. The
wetting behavior of powders is important to understand especially in pharmaceutical
and food industries, where the use of different powder compounds is common.
The wetting of powders and pigments involves contact angle phenomena, wherein
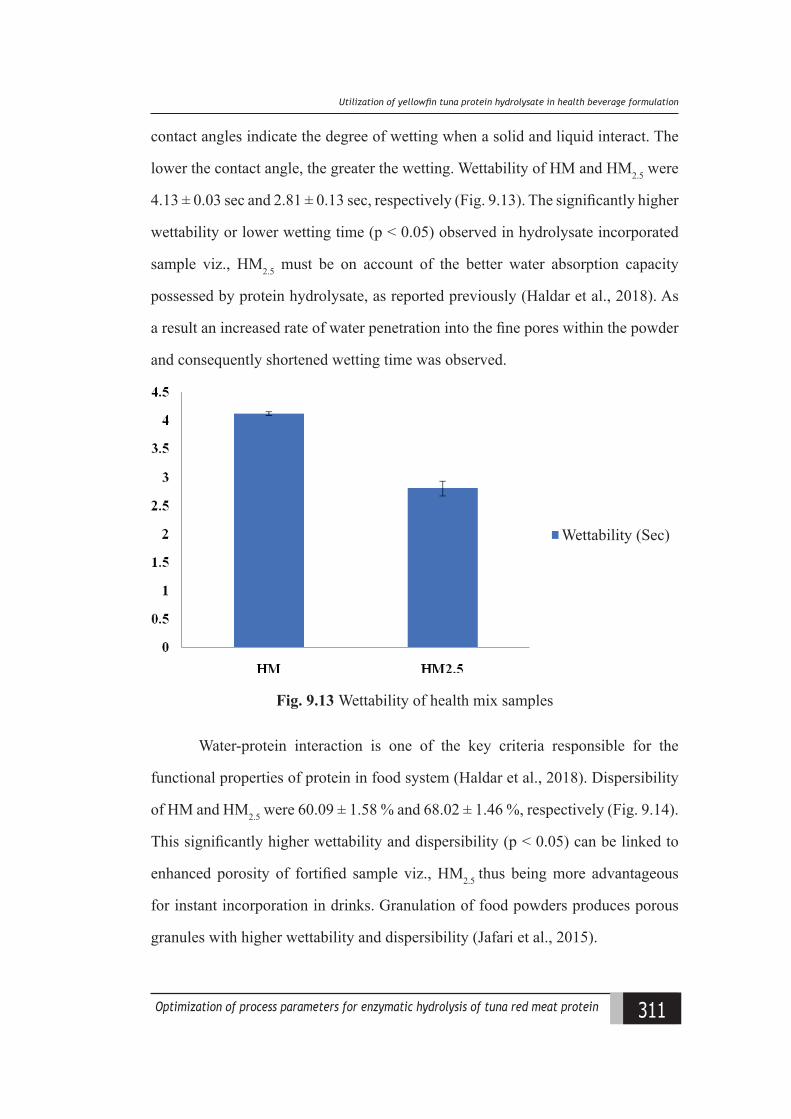
311Optimization of process parameters for enzymatic hydrolysis of tuna red meat protein
Utiliiation of yellowfn tuna protein hydrolysate in health leeerage formulation
contact angles indicate the degree of wetting when a solid and liquid interact. The
lower the contact angle, the greater the wetting. Wettability of HM and HM2.5 were
4.13 ± 0.03 sec and 2.81 ± 0.13 sec, respectively (Fig. 9.13). The significantly higher
wettability or lower wetting time (p < 0.05) observed in hydrolysate incorporated
sample viz., HM2.5 must be on account of the better water absorption capacity
possessed by protein hydrolysate, as reported previously (Haldar et al., 2018). As
a result an increased rate of water penetration into the fine pores within the powder
and consequently shortened wetting time was observed.
Wettability (Sec)
Fig. 9.13 Wettability of health mix samples
Water-protein interaction is one of the key criteria responsible for the
functional properties of protein in food system (Haldar et al., 2018). Dispersibility
of HM and HM2.5 were 60.09 ± 1.58 % and 68.02 ± 1.46 %, respectively (Fig. 9.14).
This significantly higher wettability and dispersibility (p < 0.05) can be linked to
enhanced porosity of fortified sample viz., HM2.5 thus being more advantageous
for instant incorporation in drinks. Granulation of food powders produces porous
granules with higher wettability and dispersibility (Jafari et al., 2015).
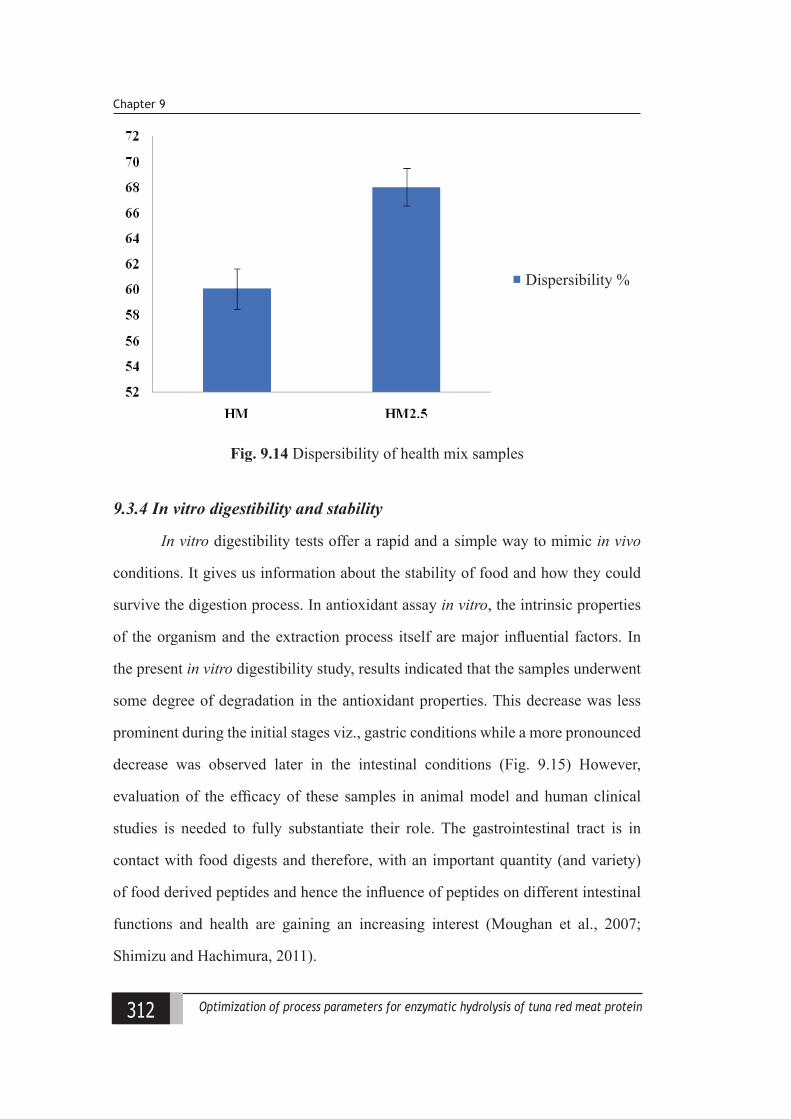
312 Optimization of process parameters for enzymatic hydrolysis of tuna red meat protein
Chapter 9
Dispersibility %
Fig. 9.14 Dispersibility of health mix samples
9.3.4 In vitro digestibility and stability
In vitro digestibility tests offer a rapid and a simple way to mimic in vivo
conditions. It gives us information about the stability of food and how they could
survive the digestion process. In antioxidant assay in vitro, the intrinsic properties
of the organism and the extraction process itself are major influential factors. In
the present in vitro digestibility study, results indicated that the samples underwent
some degree of degradation in the antioxidant properties. This decrease was less
prominent during the initial stages viz., gastric conditions while a more pronounced
decrease was observed later in the intestinal conditions (Fig. 9.15) However,
evaluation of the efficacy of these samples in animal model and human clinical
studies is needed to fully substantiate their role. The gastrointestinal tract is in
contact with food digests and therefore, with an important quantity (and variety)
of food derived peptides and hence the influence of peptides on different intestinal
functions and health are gaining an increasing interest (Moughan et al., 2007;
Shimizu and Hachimura, 2011).
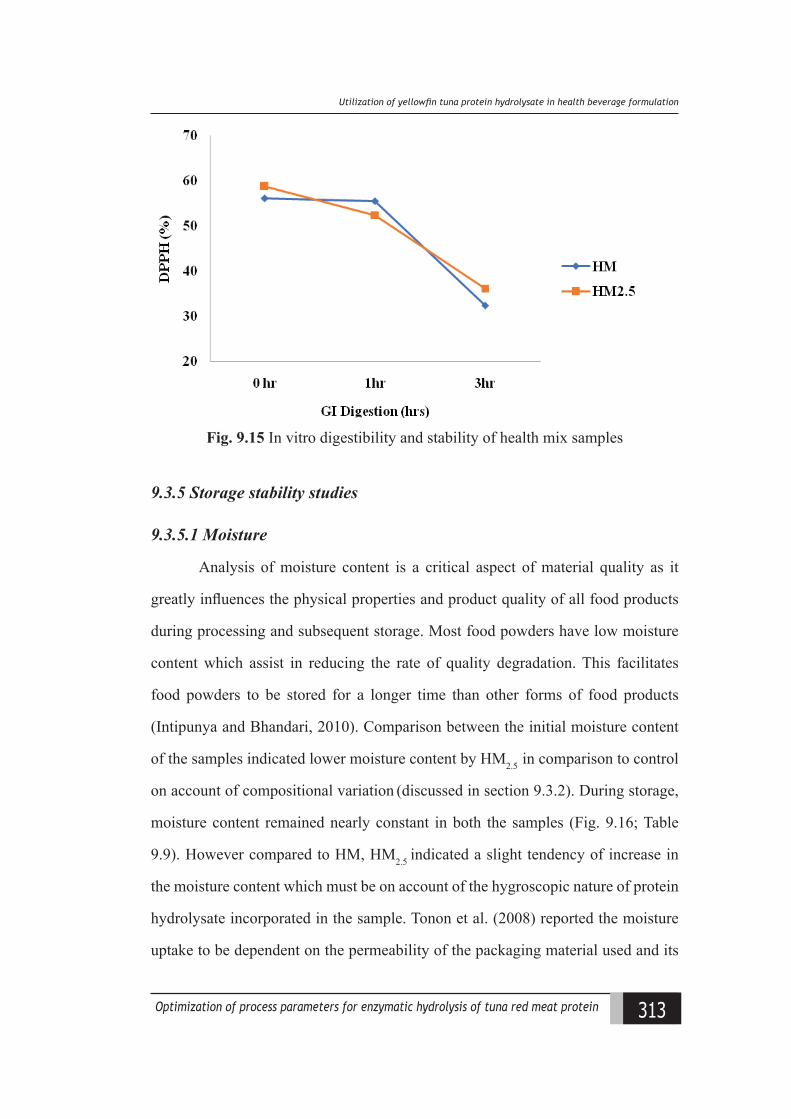
313Optimization of process parameters for enzymatic hydrolysis of tuna red meat protein
Utiliiation of yellowfn tuna protein hydrolysate in health leeerage formulation
Fig. 9.15 In vitro digestibility and stability of health mix samples
9.3.5 Storage stability studies
9.3.5.1 Moisture
Analysis of moisture content is a critical aspect of material quality as it
greatly influences the physical properties and product quality of all food products
during processing and subsequent storage. Most food powders have low moisture
content which assist in reducing the rate of quality degradation. This facilitates
food powders to be stored for a longer time than other forms of food products
(Intipunya and Bhandari, 2010). Comparison between the initial moisture content
of the samples indicated lower moisture content by HM2.5 in comparison to control
on account of compositional variation (discussed in section 9.3.2). During storage,
moisture content remained nearly constant in both the samples (Fig. 9.16; Table
9.9). However compared to HM, HM2.5 indicated a slight tendency of increase in
the moisture content which must be on account of the hygroscopic nature of protein
hydrolysate incorporated in the sample. Tonon et al. (2008) reported the moisture
uptake to be dependent on the permeability of the packaging material used and its
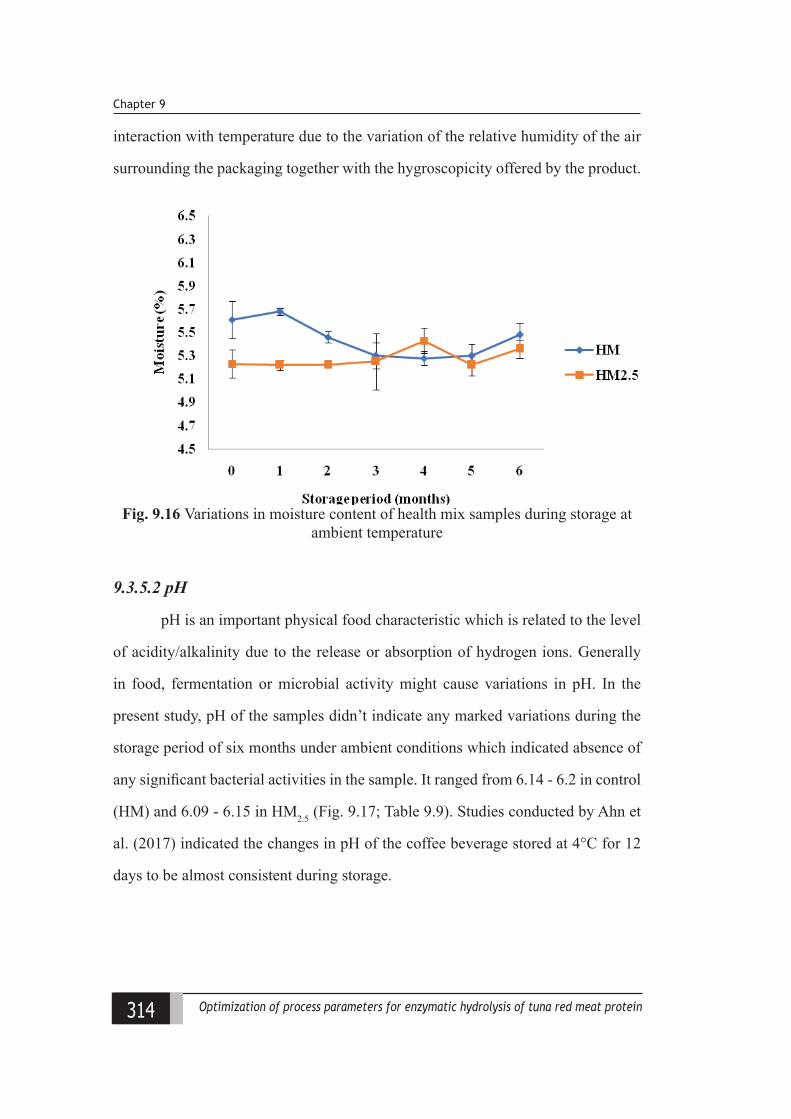
314 Optimization of process parameters for enzymatic hydrolysis of tuna red meat protein
Chapter 9
interaction with temperature due to the variation of the relative humidity of the air
surrounding the packaging together with the hygroscopicity offered by the product.
Fig. 9.16 Variations in moisture content of health mix samples during storage at ambient temperature
9.3.5.2 pH
pH is an important physical food characteristic which is related to the level
of acidity/alkalinity due to the release or absorption of hydrogen ions. Generally
in food, fermentation or microbial activity might cause variations in pH. In the
present study, pH of the samples didn’t indicate any marked variations during the
storage period of six months under ambient conditions which indicated absence of
any significant bacterial activities in the sample. It ranged from 6.14 - 6.2 in control
(HM) and 6.09 - 6.15 in HM2.5 (Fig. 9.17; Table 9.9). Studies conducted by Ahn et
al. (2017) indicated the changes in pH of the coffee beverage stored at 4°C for 12
days to be almost consistent during storage.
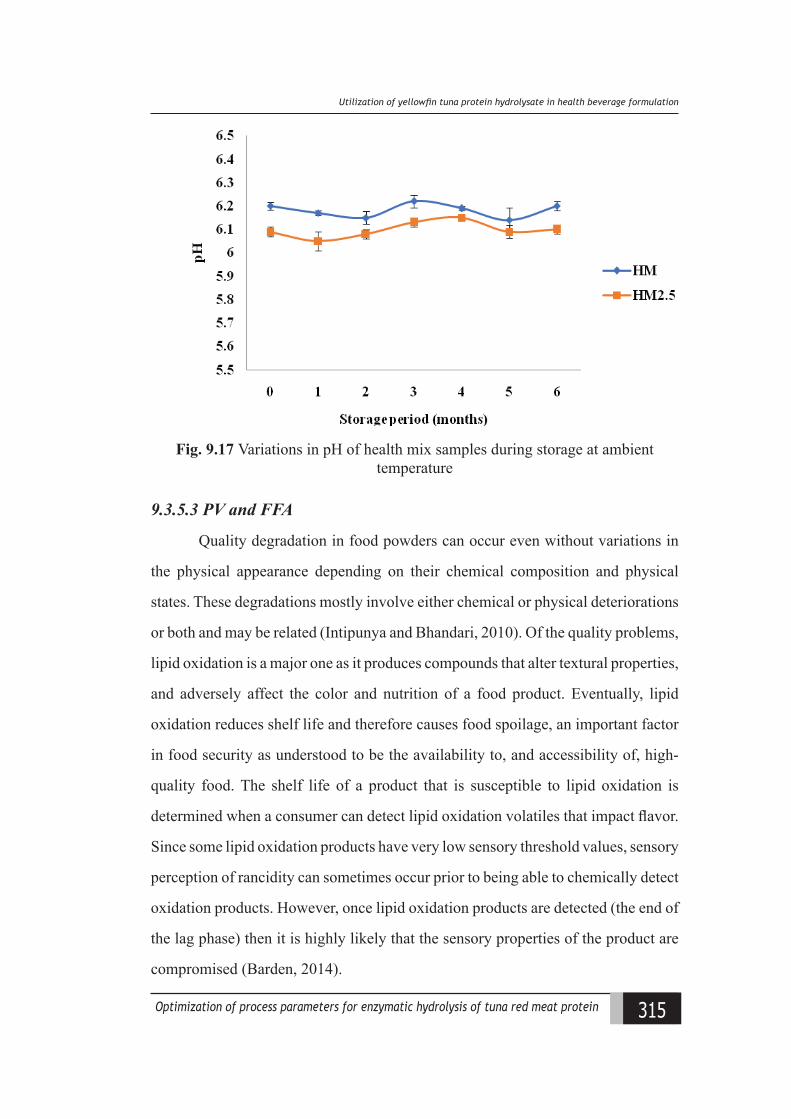
315Optimization of process parameters for enzymatic hydrolysis of tuna red meat protein
Utiliiation of yellowfn tuna protein hydrolysate in health leeerage formulation
Fig. 9.17 Variations in pH of health mix samples during storage at ambient temperature
9.3.5.3 PV and FFA
Quality degradation in food powders can occur even without variations in
the physical appearance depending on their chemical composition and physical
states. These degradations mostly involve either chemical or physical deteriorations
or both and may be related (Intipunya and Bhandari, 2010). Of the quality problems,
lipid oxidation is a major one as it produces compounds that alter textural properties,
and adversely affect the color and nutrition of a food product. Eventually, lipid
oxidation reduces shelf life and therefore causes food spoilage, an important factor
in food security as understood to be the availability to, and accessibility of, high-
quality food. The shelf life of a product that is susceptible to lipid oxidation is
determined when a consumer can detect lipid oxidation volatiles that impact flavor.
Since some lipid oxidation products have very low sensory threshold values, sensory
perception of rancidity can sometimes occur prior to being able to chemically detect
oxidation products. However, once lipid oxidation products are detected (the end of
the lag phase) then it is highly likely that the sensory properties of the product are
compromised (Barden, 2014).
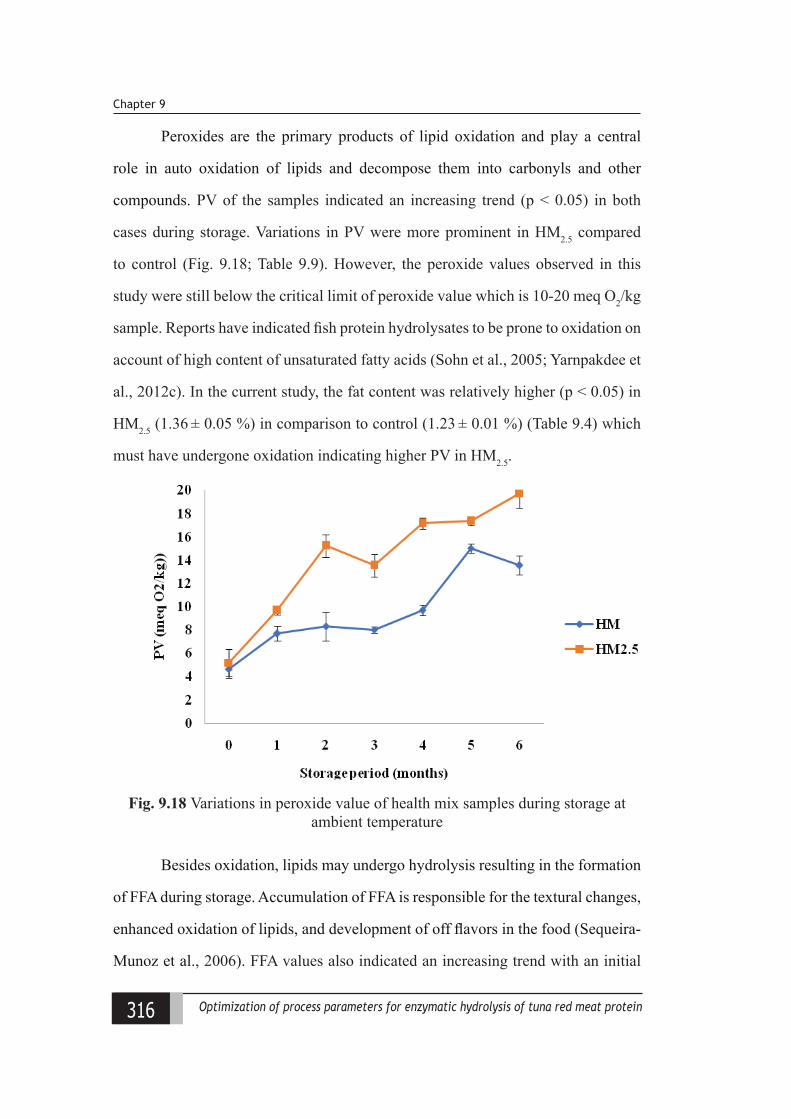
316 Optimization of process parameters for enzymatic hydrolysis of tuna red meat protein
Chapter 9
Peroxides are the primary products of lipid oxidation and play a central
role in auto oxidation of lipids and decompose them into carbonyls and other
compounds. PV of the samples indicated an increasing trend (p < 0.05) in both
cases during storage. Variations in PV were more prominent in HM2.5 compared
to control (Fig. 9.18; Table 9.9). However, the peroxide values observed in this
study were still below the critical limit of peroxide value which is 10-20 meq O2/kg
sample. Reports have indicated fish protein hydrolysates to be prone to oxidation on
account of high content of unsaturated fatty acids (Sohn et al., 2005; Yarnpakdee et
al., 2012c). In the current study, the fat content was relatively higher (p < 0.05) in
HM2.5 (1.36 ± 0.05 %) in comparison to control (1.23 ± 0.01 %) (Table 9.4) which
must have undergone oxidation indicating higher PV in HM2.5.
Fig. 9.18 Variations in peroxide value of health mix samples during storage at ambient temperature
Besides oxidation, lipids may undergo hydrolysis resulting in the formation
of FFA during storage. Accumulation of FFA is responsible for the textural changes,
enhanced oxidation of lipids, and development of off flavors in the food (Sequeira-
Munoz et al., 2006). FFA values also indicated an increasing trend with an initial
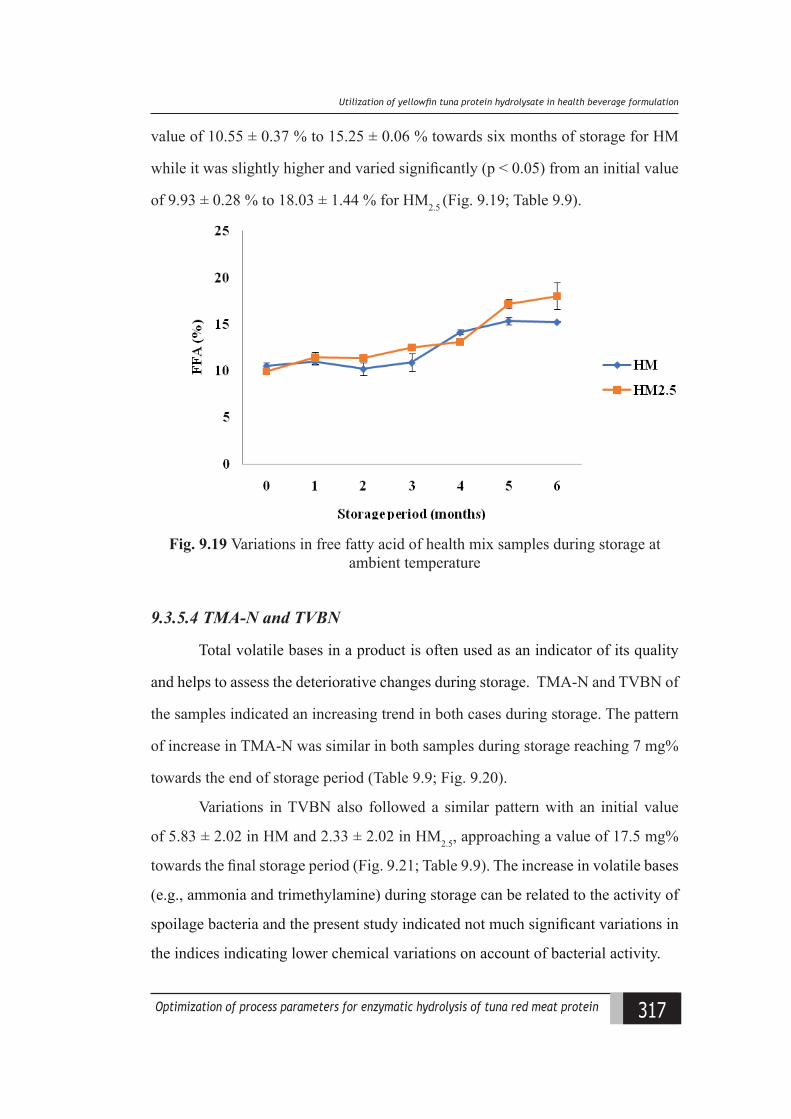
317Optimization of process parameters for enzymatic hydrolysis of tuna red meat protein
Utiliiation of yellowfn tuna protein hydrolysate in health leeerage formulation
value of 10.55 ± 0.37 % to 15.25 ± 0.06 % towards six months of storage for HM
while it was slightly higher and varied significantly (p < 0.05) from an initial value
of 9.93 ± 0.28 % to 18.03 ± 1.44 % for HM2.5 (Fig. 9.19; Table 9.9).
Fig. 9.19 Variations in free fatty acid of health mix samples during storage at ambient temperature
9.3.5.4 TMA-N and TVBN
Total volatile bases in a product is often used as an indicator of its quality
and helps to assess the deteriorative changes during storage. TMA-N and TVBN of
the samples indicated an increasing trend in both cases during storage. The pattern
of increase in TMA-N was similar in both samples during storage reaching 7 mg%
towards the end of storage period (Table 9.9; Fig. 9.20).
Variations in TVBN also followed a similar pattern with an initial value
of 5.83 ± 2.02 in HM and 2.33 ± 2.02 in HM2.5, approaching a value of 17.5 mg%
towards the final storage period (Fig. 9.21; Table 9.9). The increase in volatile bases
(e.g., ammonia and trimethylamine) during storage can be related to the activity of
spoilage bacteria and the present study indicated not much significant variations in
the indices indicating lower chemical variations on account of bacterial activity.
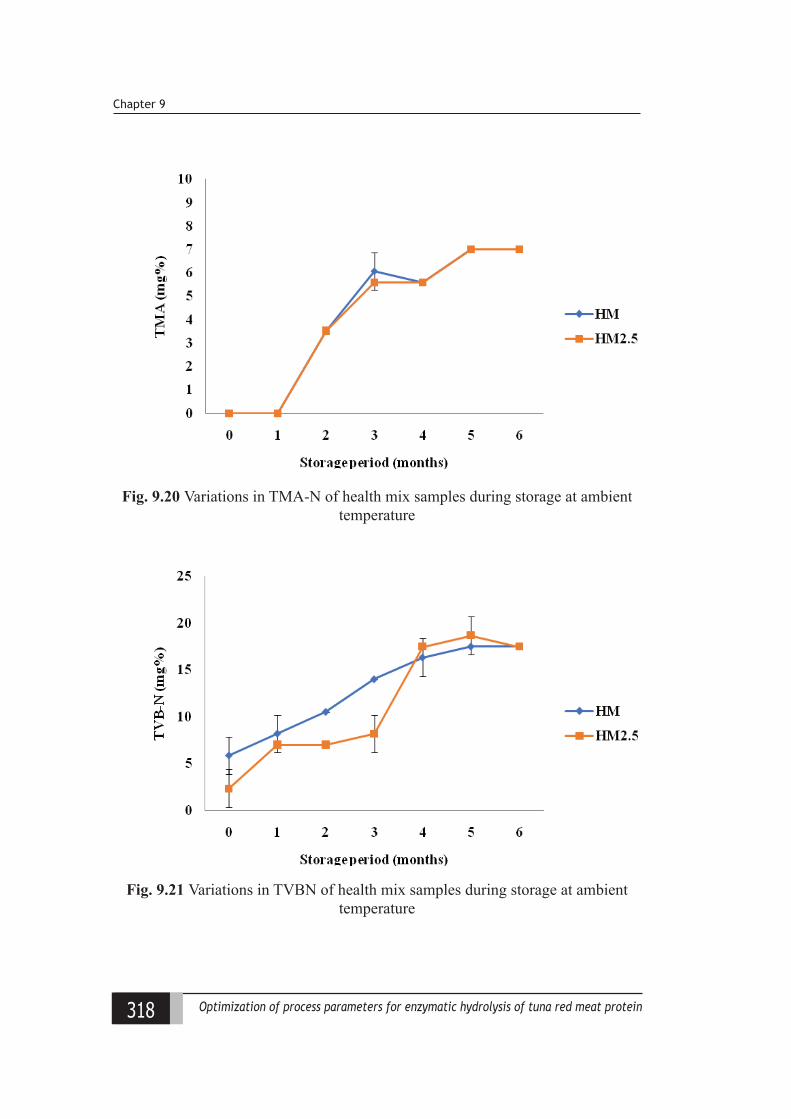
318 Optimization of process parameters for enzymatic hydrolysis of tuna red meat protein
Chapter 9
Fig. 9.20 Variations in TMA-N of health mix samples during storage at ambient temperature
Fig. 9.21 Variations in TVBN of health mix samples during storage at ambient temperature
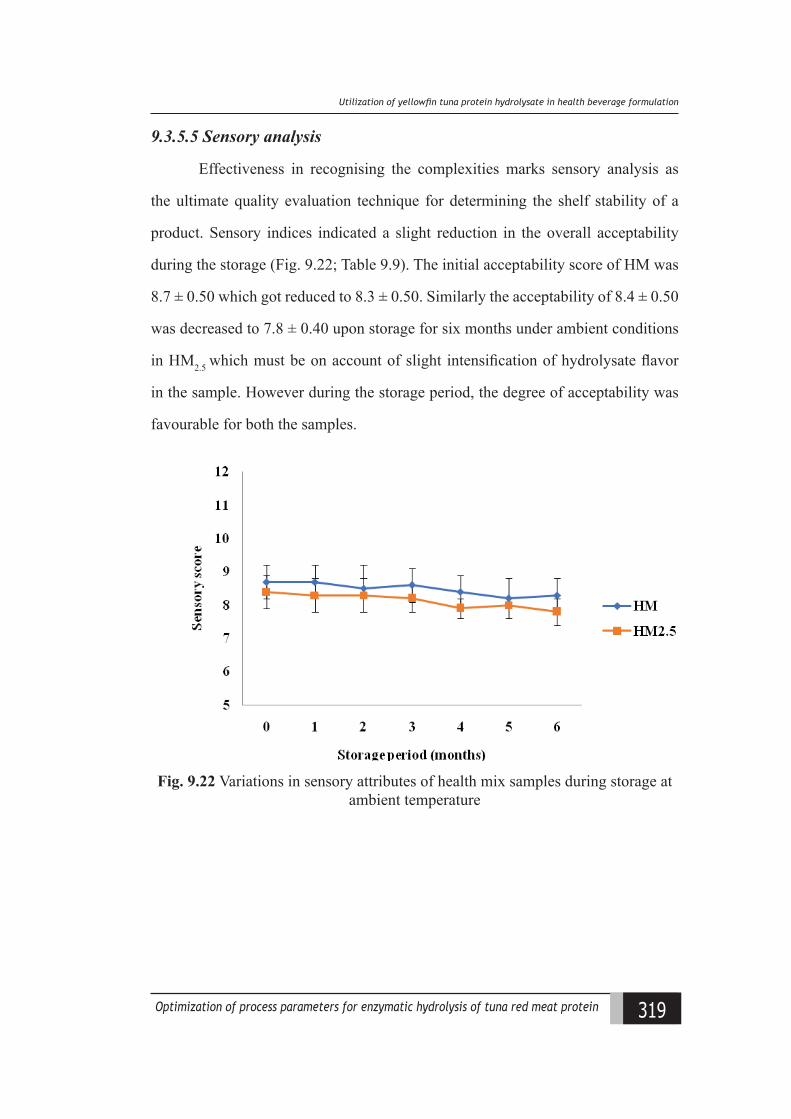
319Optimization of process parameters for enzymatic hydrolysis of tuna red meat protein
Utiliiation of yellowfn tuna protein hydrolysate in health leeerage formulation
9.3.5.5 Sensory analysis
Effectiveness in recognising the complexities marks sensory analysis as
the ultimate quality evaluation technique for determining the shelf stability of a
product. Sensory indices indicated a slight reduction in the overall acceptability
during the storage (Fig. 9.22; Table 9.9). The initial acceptability score of HM was
8.7 ± 0.50 which got reduced to 8.3 ± 0.50. Similarly the acceptability of 8.4 ± 0.50
was decreased to 7.8 ± 0.40 upon storage for six months under ambient conditions
in HM2.5 which must be on account of slight intensification of hydrolysate flavor
in the sample. However during the storage period, the degree of acceptability was
favourable for both the samples.
Fig. 9.22 Variations in sensory attributes of health mix samples during storage at ambient temperature
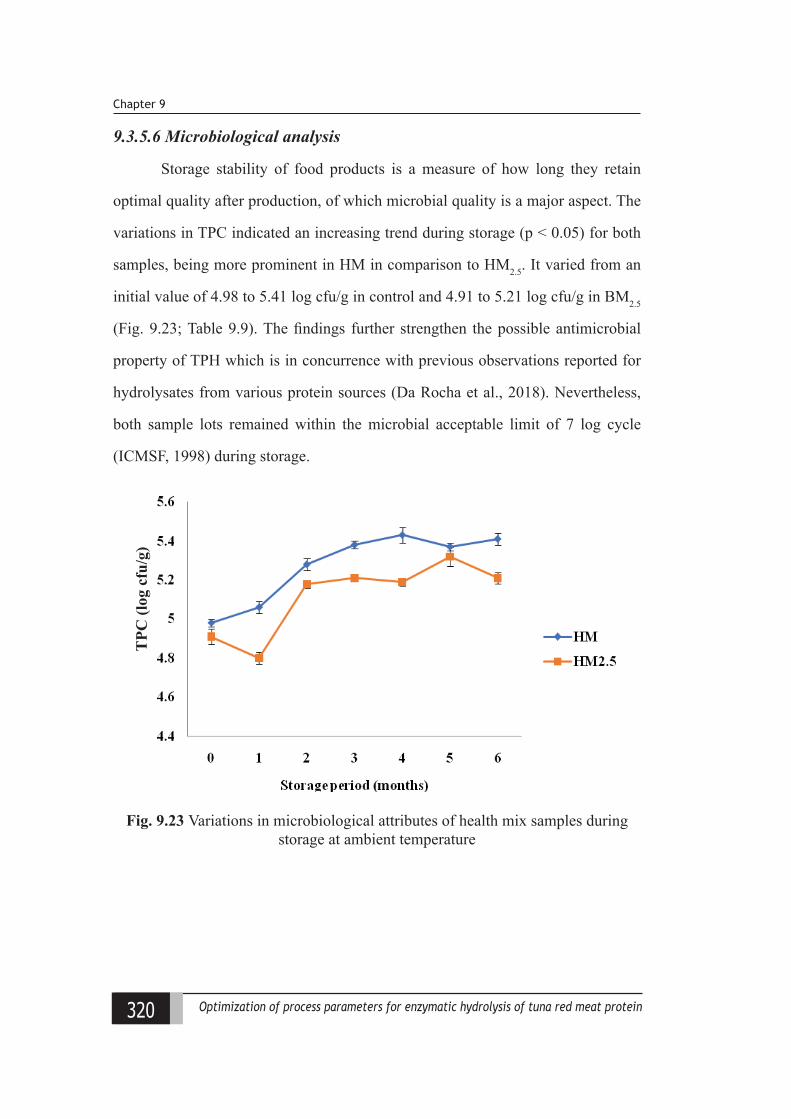
320 Optimization of process parameters for enzymatic hydrolysis of tuna red meat protein
Chapter 9
9.3.5.6 Microbiological analysis
Storage stability of food products is a measure of how long they retain
optimal quality after production, of which microbial quality is a major aspect. The
variations in TPC indicated an increasing trend during storage (p < 0.05) for both
samples, being more prominent in HM in comparison to HM2.5. It varied from an
initial value of 4.98 to 5.41 log cfu/g in control and 4.91 to 5.21 log cfu/g in BM2.5
(Fig. 9.23; Table 9.9). The findings further strengthen the possible antimicrobial
property of TPH which is in concurrence with previous observations reported for
hydrolysates from various protein sources (Da Rocha et al., 2018). Nevertheless,
both sample lots remained within the microbial acceptable limit of 7 log cycle
(ICMSF, 1998) during storage.
TPC
(log
cfu
/g)
Fig. 9.23 Variations in microbiological attributes of health mix samples during storage at ambient temperature
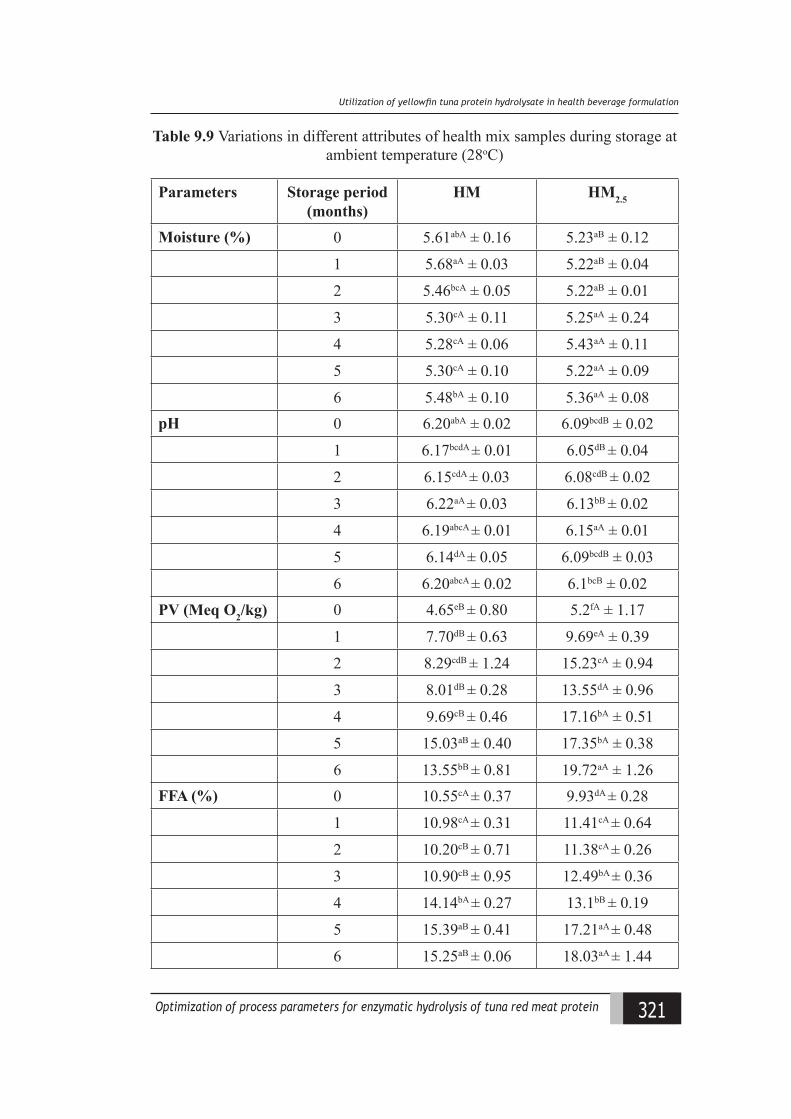
321Optimization of process parameters for enzymatic hydrolysis of tuna red meat protein
Utiliiation of yellowfn tuna protein hydrolysate in health leeerage formulation
Table 9.9 Variations in different attributes of health mix samples during storage at ambient temperature (28oC)
Parameters Storage period (months)
HM HM2.5
Moisture (%) 0 5.61abA ± 0.16 5.23aB ± 0.12
1 5.68aA ± 0.03 5.22aB ± 0.04
2 5.46bcA ± 0.05 5.22aB ± 0.01
3 5.30cA ± 0.11 5.25aA ± 0.24
4 5.28cA ± 0.06 5.43aA ± 0.11
5 5.30cA ± 0.10 5.22aA ± 0.09
6 5.48bA ± 0.10 5.36aA ± 0.08pH 0 6.20abA ± 0.02 6.09bcdB ± 0.02
1 6.17bcdA ± 0.01 6.05dB ± 0.04
2 6.15cdA ± 0.03 6.08cdB ± 0.02
3 6.22aA ± 0.03 6.13bB ± 0.02
4 6.19abcA ± 0.01 6.15aA ± 0.01
5 6.14dA ± 0.05 6.09bcdB ± 0.03
6 6.20abcA ± 0.02 6.1bcB ± 0.02PV (Meq O2/kg) 0 4.65eB ± 0.80 5.2fA ± 1.17
1 7.70dB ± 0.63 9.69eA ± 0.39
2 8.29cdB ± 1.24 15.23cA ± 0.94
3 8.01dB ± 0.28 13.55dA ± 0.96
4 9.69cB ± 0.46 17.16bA ± 0.51
5 15.03aB ± 0.40 17.35bA ± 0.38
6 13.55bB ± 0.81 19.72aA ± 1.26FFA (%) 0 10.55cA ± 0.37 9.93dA ± 0.28
1 10.98cA ± 0.31 11.41cA ± 0.64
2 10.20cB ± 0.71 11.38cA ± 0.26
3 10.90cB ± 0.95 12.49bA ± 0.36
4 14.14bA ± 0.27 13.1bB ± 0.19
5 15.39aB ± 0.41 17.21aA ± 0.48
6 15.25aB ± 0.06 18.03aA ± 1.44
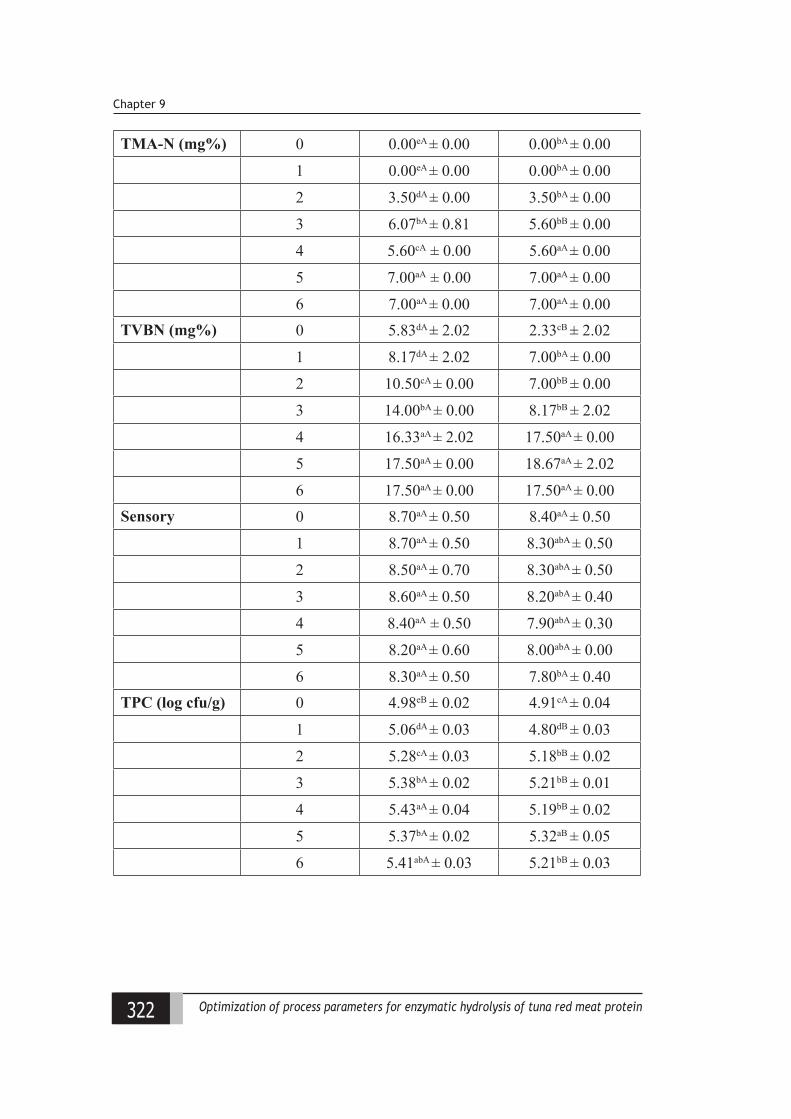
322 Optimization of process parameters for enzymatic hydrolysis of tuna red meat protein
Chapter 9
TMA-N (mg%) 0 0.00eA ± 0.00 0.00bA ± 0.00
1 0.00eA ± 0.00 0.00bA ± 0.00
2 3.50dA ± 0.00 3.50bA ± 0.00
3 6.07bA ± 0.81 5.60bB ± 0.00
4 5.60cA ± 0.00 5.60aA ± 0.00
5 7.00aA ± 0.00 7.00aA ± 0.00
6 7.00aA ± 0.00 7.00aA ± 0.00TVBN (mg%) 0 5.83dA ± 2.02 2.33cB ± 2.02
1 8.17dA ± 2.02 7.00bA ± 0.00
2 10.50cA ± 0.00 7.00bB ± 0.00
3 14.00bA ± 0.00 8.17bB ± 2.02
4 16.33aA ± 2.02 17.50aA ± 0.00
5 17.50aA ± 0.00 18.67aA ± 2.02
6 17.50aA ± 0.00 17.50aA ± 0.00Sensory 0 8.70aA ± 0.50 8.40aA ± 0.50
1 8.70aA ± 0.50 8.30abA ± 0.50
2 8.50aA ± 0.70 8.30abA ± 0.50
3 8.60aA ± 0.50 8.20abA ± 0.40
4 8.40aA ± 0.50 7.90abA ± 0.30
5 8.20aA ± 0.60 8.00abA ± 0.00
6 8.30aA ± 0.50 7.80bA ± 0.40TPC (log cfu/g) 0 4.98eB ± 0.02 4.91cA ± 0.04
1 5.06dA ± 0.03 4.80dB ± 0.03
2 5.28cA ± 0.03 5.18bB ± 0.02
3 5.38bA ± 0.02 5.21bB ± 0.01
4 5.43aA ± 0.04 5.19bB ± 0.02
5 5.37bA ± 0.02 5.32aB ± 0.05
6 5.41abA ± 0.03 5.21bB ± 0.03
323Optimization of process parameters for enzymatic hydrolysis of tuna red meat protein
Utiliiation of yellowfn tuna protein hydrolysate in health leeerage formulation
9.4 Conclusion
Utilization of 2.5% protein hydrolysate from yellowfin tuna red meat for
formulation of a health beverage mix containing malted barley and wheat was
attempted. Incorporation of tuna protein hydrolysate improved the nutritional status
of the health mix formulation. Further on account of its bioactive properties, the
health mix functionalities also improved upon TPH addition. Shelf stability analysis
of health mix samples under ambient temperature (28oC) indicated good stability
throughout the study period of six months. Present study explored the potentiality
of utilizing protein hydrolysates in beverage formulation for improved quality and
better storage stability.

324 Optimization of process parameters for enzymatic hydrolysis of tuna red meat protein
Chapter 9
325Optimization of process parameters for enzymatic hydrolysis of tuna red meat protein
Rummary
Chapter 10Summary
A study was carried out with the aim of standardization of enzymatic
hydrolytic conditions to obtain protein hydrolysate from yellowfin tuna
(Thunnus albacares) red meat with specific functional and bioactive
properties for their potential applications, characterization, storage
stability analysis and their performance evaluation in the incorporated food
formulations.
Initially a comparative evaluation of the peptides from white and red meat
of yellowfin tuna (Thunnus albacares) was carried out to explore the extent
to which the properties vary in red meat derived hydrolysate in comparison
to its white meat.
Protein hydrolysate was prepared employing hydrolytic conditions viz., 1%
(w/w) papain for one hour at optimized temperature of 600C and pH of 6.5,
from white and red meat of tuna to derive tuna white meat protein hydrolysate
(TWPH) and tuna red meat protein hydrolysate (TRPH), respectively.
Assessment of the peptide properties indicated better antioxidative activity
for TWPH. However, except oil absorption capacity (OAC), functional
properties viz., protein solubility, foaming capacity and emulsifying
properties were higher for TRPH indicating the application potential of tuna
red meat hydrolysate in food and pharmaceutical sector.
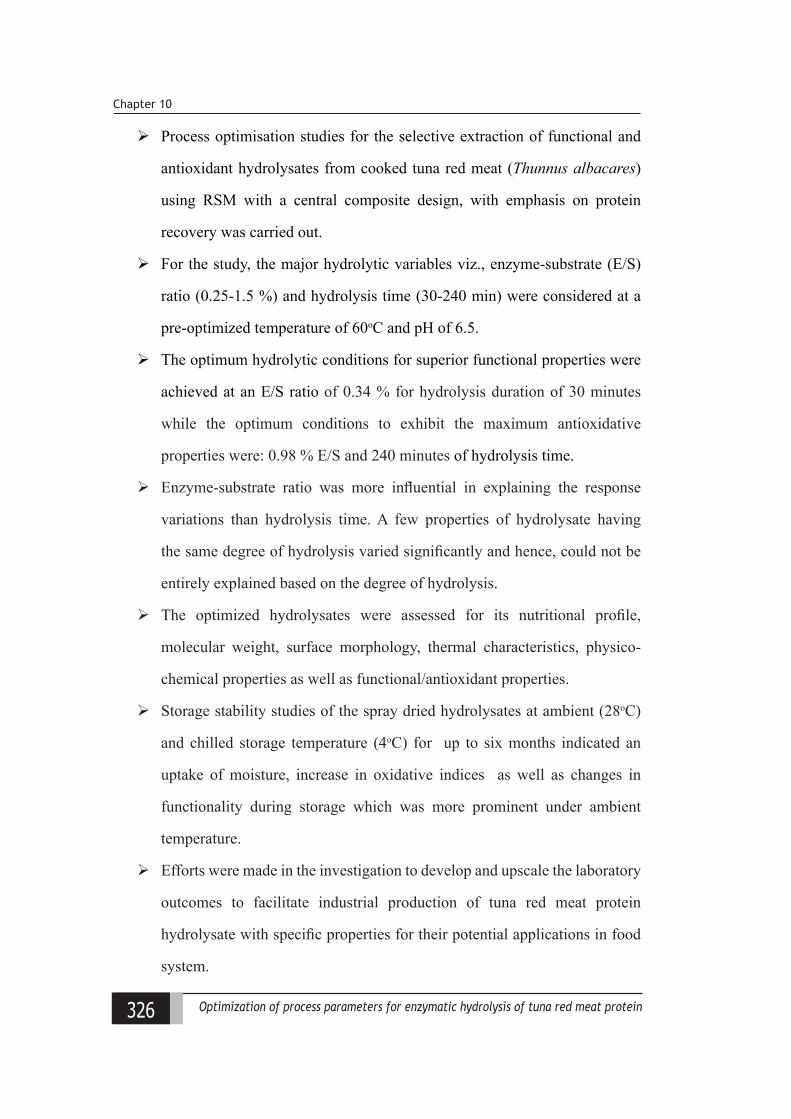
326 Optimization of process parameters for enzymatic hydrolysis of tuna red meat protein
Chapter 10
Process optimisation studies for the selective extraction of functional and
antioxidant hydrolysates from cooked tuna red meat (Thunnus albacares)
using RSM with a central composite design, with emphasis on protein
recovery was carried out.
For the study, the major hydrolytic variables viz., enzyme-substrate (E/S)
ratio (0.25-1.5 %) and hydrolysis time (30-240 min) were considered at a
pre-optimized temperature of 60oC and pH of 6.5.
The optimum hydrolytic conditions for superior functional properties were
achieved at an E/S ratio of 0.34 % for hydrolysis duration of 30 minutes
while the optimum conditions to exhibit the maximum antioxidative
properties were: 0.98 % E/S and 240 minutes of hydrolysis time.
Enzyme-substrate ratio was more influential in explaining the response
variations than hydrolysis time. A few properties of hydrolysate having
the same degree of hydrolysis varied significantly and hence, could not be
entirely explained based on the degree of hydrolysis.
The optimized hydrolysates were assessed for its nutritional profile,
molecular weight, surface morphology, thermal characteristics, physico-
chemical properties as well as functional/antioxidant properties.
Storage stability studies of the spray dried hydrolysates at ambient (28oC)
and chilled storage temperature (4oC) for up to six months indicated an
uptake of moisture, increase in oxidative indices as well as changes in
functionality during storage which was more prominent under ambient
temperature.
Efforts were made in the investigation to develop and upscale the laboratory
outcomes to facilitate industrial production of tuna red meat protein
hydrolysate with specific properties for their potential applications in food
system.
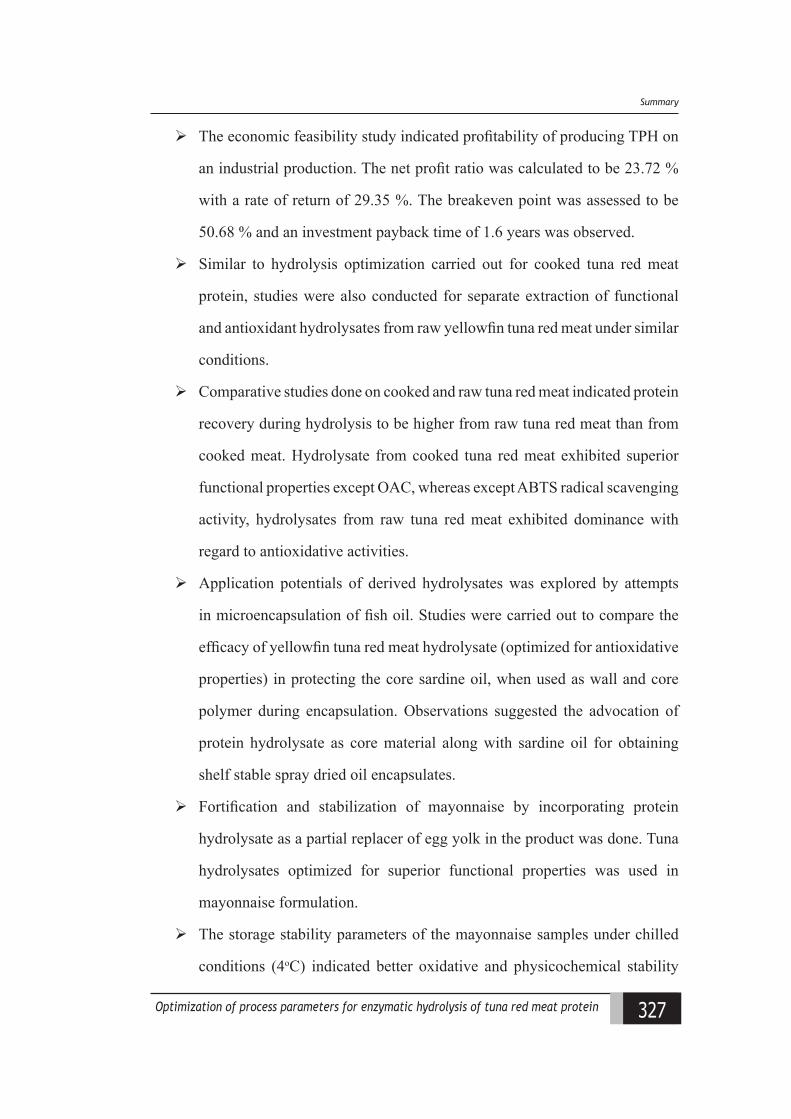
327Optimization of process parameters for enzymatic hydrolysis of tuna red meat protein
Rummary
The economic feasibility study indicated profitability of producing TPH on
an industrial production. The net profit ratio was calculated to be 23.72 %
with a rate of return of 29.35 %. The breakeven point was assessed to be
50.68 % and an investment payback time of 1.6 years was observed.
Similar to hydrolysis optimization carried out for cooked tuna red meat
protein, studies were also conducted for separate extraction of functional
and antioxidant hydrolysates from raw yellowfin tuna red meat under similar
conditions.
Comparative studies done on cooked and raw tuna red meat indicated protein
recovery during hydrolysis to be higher from raw tuna red meat than from
cooked meat. Hydrolysate from cooked tuna red meat exhibited superior
functional properties except OAC, whereas except ABTS radical scavenging
activity, hydrolysates from raw tuna red meat exhibited dominance with
regard to antioxidative activities.
Application potentials of derived hydrolysates was explored by attempts
in microencapsulation of fish oil. Studies were carried out to compare the
efficacy of yellowfin tuna red meat hydrolysate (optimized for antioxidative
properties) in protecting the core sardine oil, when used as wall and core
polymer during encapsulation. Observations suggested the advocation of
protein hydrolysate as core material along with sardine oil for obtaining
shelf stable spray dried oil encapsulates.
Fortification and stabilization of mayonnaise by incorporating protein
hydrolysate as a partial replacer of egg yolk in the product was done. Tuna
hydrolysates optimized for superior functional properties was used in
mayonnaise formulation.
The storage stability parameters of the mayonnaise samples under chilled
conditions (4oC) indicated better oxidative and physicochemical stability
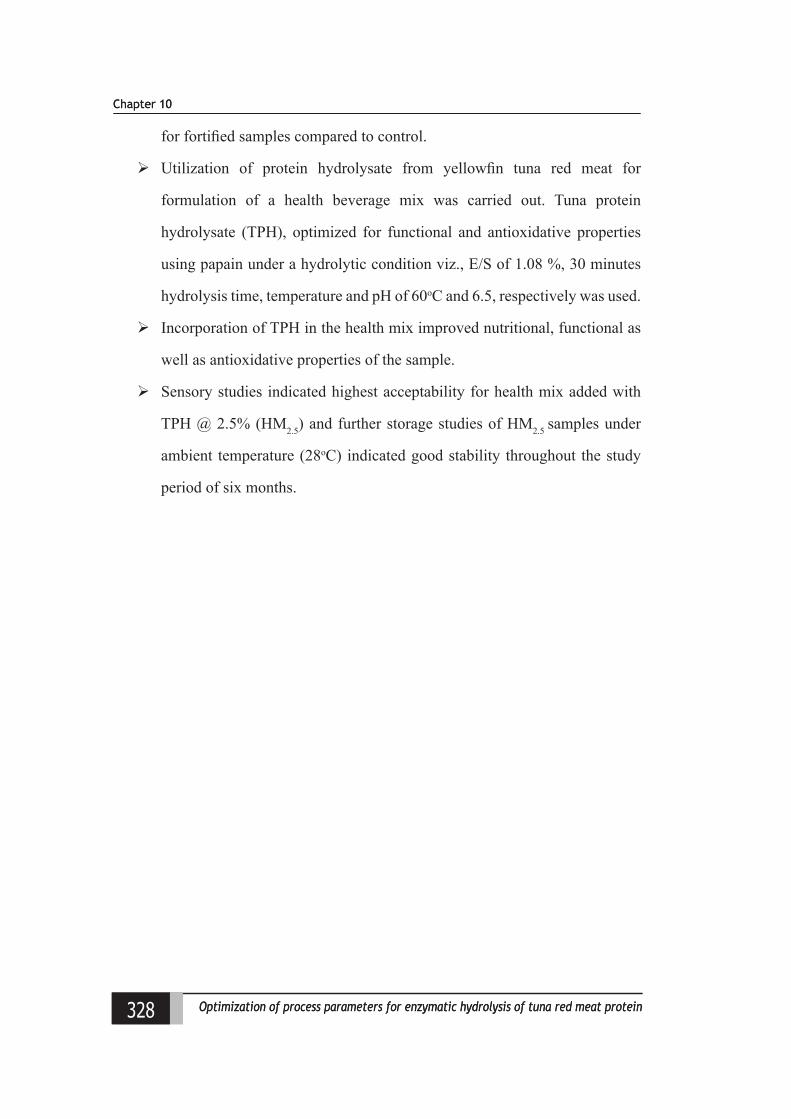
328 Optimization of process parameters for enzymatic hydrolysis of tuna red meat protein
Chapter 10
for fortified samples compared to control.
Utilization of protein hydrolysate from yellowfin tuna red meat for
formulation of a health beverage mix was carried out. Tuna protein
hydrolysate (TPH), optimized for functional and antioxidative properties
using papain under a hydrolytic condition viz., E/S of 1.08 %, 30 minutes
hydrolysis time, temperature and pH of 60oC and 6.5, respectively was used.
Incorporation of TPH in the health mix improved nutritional, functional as
well as antioxidative properties of the sample.
Sensory studies indicated highest acceptability for health mix added with
TPH @ 2.5% (HM2.5) and further storage studies of HM2.5 samples under
ambient temperature (28oC) indicated good stability throughout the study
period of six months.
328 ptimiiation of proaess parameters for eniymatia hydrolysis of tuna red meat protein
Chapter 10
329Optimization of process parameters for enzymatic hydrolysis of tuna red meat protein
REFERENCES
1. Aaslyng, M. D., & Frøst, M. B. (2010). The effect of the combination ofsalty, bitter and sour accompaniment on the flavor and juiciness of porkpatties. Journal of Sensory Studies, 25(4), 536-548.
2. Abdulazeez, S. S., Ramamoorthy, B., & Ponnusamy, P. (2013). Proximateanalysis and production of protein hydrolysate from king fish of ArabianGulf Coast-Saudi Arabia. International Journal of Pharmacy and BiologicalSciences, 3(1), 138-144.
3. Abdul-Hamid, A., Bakar, J., & Bee, G. H. (2002). Nutritional qualityof spray dried protein hydrolysate from Black Tilapia (Oreochromismossambicus). Food Chemistry, 78(1), 69-74.
4. Abraha, B., Mahmud, A., Samuel, M., Yhdego, W., & Kibrom, S. (2017).Production of Fish Protein Hydrolysate from Silver Catfish (Ariusthalassinus). MOJ Food Processing and Technology, 5 (4), 00132.
5. Abu-Salem, F. M., & Abou-Arab, A. A. (2008). Chemical, microbiologicaland sensory evaluation of mayonnaise prepared from ostrich eggs. Grasasy aceites, 59(4), 352-360.
6. Adler-Nissen, J. (1986). Enzymic hydrolysis of food proteins. Barking, UK:Elsevier Applied Science Publishers.
7. Ahn, S. I., Park, J. H., Kim, J. H., Oh, D. G., Kim, M., Chung, D., Jhoo,J. W., & Kim, G. Y. (2017). Optimization of manufacturing conditions forimproving storage stability of coffee-supplemented milk beverage usingresponse surface methodology. Korean Journal for Food Science of AnimalResources, 37(1), 87.
8. Alemán, M., Bou, R., Guardiola, F., Durand, E., Villeneuve, P., Jacobsen,C., & Sørensen, A. D. M. (2015). Antioxidative effect of lipophilized caffeicacid in fish oil enriched mayonnaise and milk. Food Chemistry, 167, 236-244.
9. Aluko, R. E., & McIntosh, T. (2005). Limited enzymatic proteolysis increases the level of incorporation of canola proteins into mayonnaise. InnovativeFood Science & Emerging Technologies, 6(2), 195-202.
329ptimiiation of proaess parameters for eniymatia hydrolysis of tuna red meat protein
References
10. Amarowicz, R. (2008). Antioxidant activity of protein hydrolysates. European Journal of Lipid Science and Technology, 110(6), 489-490.
11. Ambigaipalan, P., & Shahidi, F. (2017). Bioactive peptides from shrimp shell processing discards: Antioxidant and biological activities. Journal of Functional Foods, 34, 7-17.
12. Amiza, M. A., Kong, Y. L., & Faazaz, A. L. (2012). Effects of degree of hydrolysis on physicochemical properties of Cobia (Rachycentron canadum) frame hydrolysate. International Food Research Journal, 19(1), 199-206.
13. Anon. (2011). Future Directions for the Global Functional Foods Market, Market Report, June 2011, Leatherhead Food Research, UK., http://www.leatherheadfood.com/UserFiles/ pdfs/publicationspromopdf/Functional-Directions-for-theGlobal-Functional-Foods-Market-2011.pdf.
14. AOAC. (2012). Official Methods of Analysis. 19th Ed., Washington DC: Association of Official Analytical Chemists.
15. Arias-Moscoso, J. L., Maldonado-Arce, A., Rouzaud-Sandez, O., Márquez-Ríos, E., Torres-Arreola, W., Santacruz-Ortega, H., Gaxiola-Cortés, M. G., & Ezquerra-Brauer, J. M. (2015). Physicochemical characterization of protein hydrolysates produced by autolysis of jumbo squid (Dosidicus gigas) byproducts. Food Biophysics, 10(2), 145-154.
16. Arvanitoyannis, I. S., & Kassaveti, A. (2008). Fish industry waste: treatments, environmental impacts, current and potential uses. International Journal of Food Science & Technology, 43(4), 726-745.
17. Aslanzadeh, M., Mizani, M., Alimi, M., & Gerami, A. (2012). Rheological properties of low fat mayonnaise with different levels of modified wheat bran. Journal of Food Biosciences & Technology, 2, 27-34.
18. Aspevik, T., Totland, C., Lea, P., & Oterhals, Å. (2016). Sensory and surface-active properties of protein hydrolysates based on Atlantic salmon (Salmo salar) by-products. Process Biochemistry, 51(8), 1006-1014.
19. Augustin, M. A., Sanguansri, L., & Bode, O. (2006). Maillard reaction products as encapsulants for fish oil powders. Journal of Food Science, 71(2), E25-E32.
20. Awuor, O. L., Kirwa, M. E., Jackim, M. F., & Betty, M. (2017). Optimization of alcalase hydrolysis conditions for production of dagaa (Rastrineobola argentea) hydrolysate with antioxidative properties. Indian Journal of
330 ptimiiation of proaess parameters for eniymatia hydrolysis of tuna red meat protein
References
Chemistry, 3, 122.21. Bakry, A. M., Abbas, S., Ali, B., Majeed, H., Abouelwafa, M. Y., Mousa, A.,
& Liang, L. (2016). Microencapsulation of oils: A comprehensive review of benefits, techniques, and applications. Comprehensive Reviews in Food Science and Food Safety, 15(1), 143-182.
22. Bansal, R. C., & Goyal, M. (2005). Activated Carbon Adsorption. Boca Raton: CRC press.
23. Barbosa-Canovas, G. V., & Juliano, P. (2005). Compression and compaction characteristics of selected food powders. Advances in Food and Nutrition Research, 49(1), 233-300.
24. Barden, L. M. (2014). Understanding lipid oxidation in low-moisture food. PhD Dissertation, University of Massachusetts Amherst ScholarWorks@UMass Amherst
25. Barkia, A., Bougatef, A. L. I., KHALED, H. B., & Nasri, M. (2010). Antioxidant activities of sardinelle heads and/or viscera protein hydrolysates prepared by enzymatic treatment. Journal of Food Biochemistry, 34, 303-320.
26. Bechtel, P. J. (2003). Properties of different fish processing by‐products from pollock, cod and salmon. Journal of Food Processing and Preservation, 27(2), 101-116.
27. Benjakul, S., & Morrissey, M. T. (1997). Protein hydrolysates from Pacific whiting solid wastes. Journal of Agricultural and Food Chemistry, 45(9), 3423-3430.
28. Benjakul, S., Klomklao, S., & Simpson, B. K. (2010). Enzymes in Fish Processing. 4th Edn., Sussex, England: Blackwell Publishing Ltd.
29. Benzie, I. F., & Strain, J. J. (1996). The ferric reducing ability of plasma (FRAP) as a measure of “antioxidant power”: the FRAP assay. Analytical Biochemistry, 239(1), 70-76.
30. Bernardi, D. M., Paris, L. D. D., Dieterich, F., Boscolo, W. R., Sary, C., Signor, A., ... & Sgarbieri, V. C. (2016). Production of hydrolysate from processed Nile tilapia (Oreochromis niloticus) residues and assessment of its antioxidant activity. Food Science and Technology, 36(4), 709-716.
31. Bhaskar, N., Benila, T., Radha, C., & Lalitha, R. G. (2008). Optimization of enzymatic hydrolysis of visceral waste proteins of Catla (Catla catla) for preparing protein hydrolysate using a commercial protease. Bioresource
331 ptimiiation of proaess parameters for eniymatia hydrolysis of tuna red meat protein
References
Technology, 99(2), 335-343.32. Bhaskar, N., & Mahendrakar, N. S. (2008). Protein hydrolysate from visceral
waste proteins of Catla (Catla catla): Optimization of hydrolysis conditions for a commercial neutral protease. Bioresource Technology, 99(10), 4105-4111.
33. Bhingarde, O. R., Koli, J. M., Patange, S. B., Sonavane, A. E., Shingare, P. E., Relekar, P. P., & Mulye, V. B. (2017). Effect of different concentration of pepsin enzyme on extraction of fish protein hydrolysate from Malabar sole fish (Cynoglossus macrostomus). Doctoral dissertation, Dr. Balasaheb Sawant Konkan Krishi Vidyapeeth, Dapoli, Dist: Ratnagiri.
34. Bilek, S. E., & Bayram, S. K. (2015). Fruit juice drink production containing hydrolyzed collagen. Journal of Functional Foods, 14, 562-569.
35. Binsan, W., Benjakul, S., Visessanguan, W., Roytrakul, S., Tanaka, M., & Kishimura, H. (2008). Antioxidative activity of Mungoong, an extract paste, from the cephalothorax of white shrimp (Litopenaeus vannamei). Food Chemistry, 106(1), 185-193.
36. Binsi, P. K., Shamasundar, B. A., & Dileep, A. O. (2006). Some physico-chemical, functional and rheological properties of actomyosin from green mussel (Perna viridis). Food Research International, 39(9), 992-1001.
37. Binsi, P. K., Viji, P., Panda, S. K., Mathew, S., Zynudheen, A. A., & Ravishankar, C. N. (2016). Characterisation of hydrolysates prepared from engraved catfish (Nemapteryx caelata) roe by serial hydrolysis. Journal of Food Science and Technology, 53(1), 158-170.
38. Binsi, P. K., Natasha, N., Sarkar, P. C., Ashraf, P. M., George, N., & Ravishankar, C. N. (2017a). Structural, functional and in vitro digestion characteristics of spray dried fish roe powder stabilised with gum arabic. Food Chemistry, 221, 1698-1708.
39. Binsi, P.K., Nayak, N., Sarkar, P.C., Jeyakumari, A., Muhamed Ashraf, P., Ninan, G., & Ravishankar, C.N. (2017b). Structural and oxidative stabilization of spray dried fish oil microencapsulates with gum arabic and sage polyphenols: Characterization and release kinetics. Food Chemistry, 219, 158–168.
40. Binsi, P. K., Nayak, N., Sarkar, P. C., Joshy, C. G., Ninan, G., & Ravishankar, C. N. (2017c). Gelation and thermal characteristics of microwave extracted fish gelatin–natural gum composite gels. Journal of Food Science and
332 ptimiiation of proaess parameters for eniymatia hydrolysis of tuna red meat protein
References
Technology, 54(2), 518-530.41. Blois, M. S. (1958). Antioxidant determinations by the use of a stable free
radical. Nature, 181(4617), 1199-1200.42. Bougatef, A., Nedjar-Arroume, N., Ravallec-Plé, R., Leroy, Y., Guillochon,
D., Barkia, A., & Nasri, M. (2008). Angiotensin I-converting enzyme (ACE) inhibitory activities of sardinelle (Sardinella aurita) by-products protein hydrolysates obtained by treatment with microbial and visceral fish serine proteases. Food Chemistry, 111(2), 350-356.
43. Bougatef, A., Nedjar-Arroume, N., Manni, L., Ravallec, R., Barkia, A., Guillochon, D., & Nasri, M. (2010). Purification and identification of novel antioxidant peptides from enzymatic hydrolysates of sardinelle (Sardinella aurita) by-products proteins. Food Chemistry, 118(3), 559-565.
44. Burgar, M.I., Hoobin, P., Weerakkody, R., Sanguansri, L., & Augustin, M.A. (2009). NMR of microencapsulated fish oil samples during in-vitro digestion. Food Biophysics, 4(1), 32–41.
45. Byun, H. G., Lee, J. K., Park, H. G., Jeon, J. K., & Kim, S. K. (2009). Antioxidant peptides isolated from the marine rotifer, Brachionus rotundiformis. Process Biochemistry, 44(8), 842-846.
46. Cai, Y. Z., & Corke, H. (2000). Production and Properties of Spray‐dried Amaranthus Betacyanin Pigments. Journal of Food Science, 65(7), 1248-1252.
47. Cao, W., Zhang, C., Hong, P., & Ji, H. (2008). Response surface methodology for autolysis parameters optimization of shrimp head and amino acids released during autolysis. Food Chemistry, 109(1), 176-183.
48. Carneiro, H.C., Tonon, R.V., Grosso, C.R., & Hubinger, M.D. (2013). Encapsulation efficiency and oxidative stability of flax seed oil microencapsulated by spray drying using different combinations of wall materials. Journal of Food Engineering, 115(4): 443-451.
49. Carr, R. L. (1965). Evaluating flow properties of solids. Chemical Engineering, 72,163-168.
50. Casarin, F., Cladera-Olivera, F., & Brandelli, A. (2008). Use of poultry byproduct for production of keratinolytic enzymes. Food and Bioprocess Technology, 1(3), 301-305.
51. Cavalheiro, C. P., Lüdtke, F. L., Stefanello, F. S., Kubota, E. H., Terra, N. N., & Fries, L. L. M. (2014). Replacement of mechanically deboned chicken
333 ptimiiation of proaess parameters for eniymatia hydrolysis of tuna red meat protein
References
meat with its protein hydrolysate in mortadella-type sausages. Food Science and Technology, 34(3), 478-484.
52. Centenaro, G. S., Centenaro, M. S., & Hernandez, C. P. (2011). Antioxidant activity of protein hydrolysates of fish and chicken bones. Advance Journal of Food Science and Technology, ISSN : 2042-4876
53. Centenaro, G. S., Salas-Mellado, M., Pires, C., Batista, I., Nunes, M. L., & Prentice, C. (2014). Fractionation of protein hydrolysates of fish and chicken using membrane ultrafiltration: investigation of antioxidant activity. Applied Biochemistry And Biotechnology, 172(6), 2877-2893.
54. Chabeaud, A., Dutournié, P., Guérard, F., Vandanjon, L., & Bourseau, P. (2009). Application of response surface methodology to optimise the antioxidant activity of a saithe (Pollachius virens) hydrolysate. Marine Biotechnology, 11(4), 445-455.
55. Chalamaiah, M., Rao, G. N., Rao, D. G., & Jyothirmayi, T. (2010). Protein hydrolysates from meriga (Cirrhinus mrigala) egg and evaluation of their functional properties. Food Chemistry, 120(3), 652-657.
56. Chalamaiah, M., Hemalatha, R., & Jyothirmayi, T. (2012). Fish protein hydrolysates: proximate composition, amino acid composition, antioxidant activities and applications: a review. Food Chemistry, 135(4), 3020-3038.
57. Chavan, R. S., Shraddha, R. C., Kumar, A., & Nalawade, T. (2015). Whey based beverage: Its functionality, formulations, health benefits and applications. Journal of Food Processing and Technology, 6(10), 1.
58. Chen, W., Li, X., Rahman, M. R. T., Al-Hajj, N. Q. M., Dey, K. C., & Raqib, S. M. (2014). Emulsification properties of soy bean protein. Nusantara Bioscience, 6(2).
59. Cheung, I. W., Liceaga, A. M., & Li‐Chan, E. C. (2009). Pacific hake (Merluccius productus) hydrolysates as cryoprotective agents in frozen Pacific cod fillet mince. Journal of Food Science, 74(8), C588-C594.
60. Cheung, I. W., & Li-Chan, E. C. (2014). Application of taste sensing system for characterisation of enzymatic hydrolysates from shrimp processing by-products. Food Chemistry, 145, 1076-1085.
61. Cheung, L. K., Aluko, R. E., Cliff, M. A., & Li-Chan, E. C. (2015). Effects of exopeptidase treatment on antihypertensive activity and taste attributes of enzymatic whey protein hydrolysates. Journal of Functional Foods, 13, 262-275.
334 ptimiiation of proaess parameters for eniymatia hydrolysis of tuna red meat protein
References
62. Chi, C. F., Cao, Z. H., Wang, B., Hu, F. Y., Li, Z. R., & Zhang, B. (2014). Antioxidant and functional properties of collagen hydrolysates from Spanish mackerel skin as influenced by average molecular weight. Molecules, 19(8), 11211-11230.
63. Chi, C. F., Hu, F. Y., Wang, B., Li, Z. R., & Luo, H. Y. (2015). Influence of amino acid compositions and peptide profiles on antioxidant capacities of two protein hydrolysates from skipjack tuna (Katsuwonus pelamis) dark muscle. Marine drugs, 13(5), 2580-2601.
64. Chinta, D. D., Graves, R. A., Pamujula, S., Praetorius, N., Bostanian, L. A., & Mandal, T. K. (2009). Spray-dried chitosan as a direct compression tableting excipient. Drug Development and Industrial Pharmacy, 35(1), 43-48.
65. Chiu, M. H., & Prenner, E. J. (2011). Differential scanning calorimetry: An invaluable tool for a detailed thermodynamic characterization of macromolecules and their interactions. Journal of Pharmacy and Bioallied Sciences, 3(1), 39-59.
66. Cho, D. Y., Jo, K., Cho, S. Y., Kim, J. M., Lim, K., Suh, H. J., & Oh, S. (2014). Antioxidant effect and functional properties of hydrolysates derived from egg-white protein. Korean Journal for Food Science of Animal Resources, 34(3), 362.
67. Choi, Y. J., Hur, S., Choi, B. D., Konno, K., & Park, J. W. (2009). Enzymatic hydrolysis of recovered protein from frozen small croaker and functional properties of its hydrolysates. Journal of Food Science, 74(1), C17-C24.
68. Choonpicharn, S., Jaturasitha, S., Rakariyatham, N., Suree, N., & Niamsup, H. (2015). Antioxidant and antihypertensive activity of gelatin hydrolysate from Nile tilapia skin. Journal of Food Science and Technology, 52(5), 3134-3139.
69. Chun-hui, L., Chang-hai, W., Zhi-liang, X., & Yi, W. (2007). Isolation, chemical characterization and antioxidant activities of two polysaccharides from the gel and the skin of Aloe barbadensis Miller irrigated with sea water. Process Biochemistry, 42(6), 961-970.
70. Cinq-Mars, C. D., Hu, C., Kitts, D. D., & Li-Chan, E. C. (2007). Investigations into inhibitor type and mode, simulated gastrointestinal digestion, and cell transport of the angiotensin I-converting enzyme–inhibitory peptides in Pacific hake (Merluccius productus) fillet hydrolysate. Journal of
335 ptimiiation of proaess parameters for eniymatia hydrolysis of tuna red meat protein
References
Agricultural and Food Chemistry, 56(2), 410-419.71. Clemente, A. (2000). Enzymatic protein hydrolysates in human
nutrition. Trends in Food Science & Technology, 11(7), 254-262.72. Comas, D. I., Wagner, J. R., & Tomás, M. C. (2006). Creaming stability of
oil in water (O/W) emulsions: Influence of pH on soybean protein–lecithin interaction. Food Hydrocolloids, 20(7), 990-996.
73. Conway, E. J. (1950). Microdiffusion Analysis and Volumetric Error, 3rd
Edn. London: Crosby Lockwood and Son.74. Cozzolino, D., Roumeliotis, S., & Eglinton, J. (2015). Relationships
between fatty acid contents of barley grain, malt, and wort with malt quality measurements. Cereal Chemistry, 92(1), 93-97.
75. Da Rocha, M., Alemán, A., Baccan, G. C., López-Caballero, M. E., Gómez-Guillén, C., Montero, P., & Prentice, C. (2018). Anti-Inflammatory, Antioxidant, and Antimicrobial Effects of Underutilized Fish Protein Hydrolysate. Journal of Aquatic Food Product Technology, 27(5), 592-608.
76. da Rosa Zavareze, E., Telles, A.C., El Halal, S.L.M., da Rocha, M., Colussi, R., de Assis, L.M., de Castro L.A.S., Dias, A.R.G.,& Prentice-Hernández, C. (2014). Production and characterization of encapsulated antioxidative protein hydrolysates from Whitemouth croaker (Micropogonias furnieri) muscle and byproduct. LWT-Food Science and Technology, 59(2), 841-848.
77. Damodaran, S. (1996). Amino acids, peptides and proteins. In: Food Chemistry ( Fennema, O.R., Ed.), New York: Marcel Dekker Inc., pp. 321-429.
78. Damodaran, S., & Paraf, A. (1997). Food Proteins and Their Applications. New York :Marcel Dekker.
79. Daud, N. A., Babji, A. S., & Yusop, S. M. (2015). Effects of enzymatic hydrolysis on the antioxidative and antihypertensive activities from red tilapia fish protein. Journal of Nutrition & Food Sciences, 5(387).
80. Dauksas, E., Slizyte, R., Rustad, T., & Storro, I. (2004). Bitterness in fish protein hydrolysates and methods for removal. Journal of Aquatic Food Product Technology, 13(2), 101-114.
81. Dávalos, A., Miguel, M., Bartolome, B., & Lopez-Fandino, R. (2004). Antioxidant activity of peptides derived from egg white proteins by enzymatic hydrolysis. Journal of Food Protection, 67(9), 1939-1944.
82. Decker, E. A., & Welch, B. (1990). Role of ferritin as a lipid oxidation
336 ptimiiation of proaess parameters for eniymatia hydrolysis of tuna red meat protein
References

catalyst in muscle food. Journal of Agricultural and Food Chemistry, 38(3), 674-677.
83. Dekkers, E., Raghavan, S., Kristinsson, H. G., & Marshall, M. R. (2011). Oxidative stability of mahi mahi red muscle dipped in tilapia protein hydrolysates. Food Chemistry, 124(2), 640-645.
84. Depree, J. A., & Savage, G. P. (2001). Physical and flavour stability of mayonnaise. Trends in Food Science & Technology, 12(5-6), 157-163.
85. Dey, S. S., & Dora, K. C. (2014). Antioxidative activity of protein hydrolysate produced by alcalase hydrolysis from shrimp waste (Penaeus monodon and Penaeus indicus). Journal of Food Science and Technology, 51(3), 449-457.
86. Dhaval, A., Yadav, N., & Purwar, S. (2016). Potential applications of food derived bioactive peptides in management of health. International Journal of Peptide Research and Therapeutics, 22(3), 377-398.
87. Di Bernardini, R., Harnedy, P., Bolton, D., Kerry, J., O’Neill, E., Mullen, A. M., & Hayes, M. (2011). Antioxidant and antimicrobial peptidic hydrolysates from muscle protein sources and by-products. Food Chemistry, 124(4), 1296-1307.
88. Diaz, M. N., Frei, B., Vita, J. A., & Keaney Jr, J. F. (1997). Antioxidants and atherosclerotic heart disease. New England Journal of Medicine, 337(6), 408-416.
89. Dickie, A. M., & Kokini, J. L. (1983). An improved model for food thickness from non‐Newtonian fluid mechanics in the mouth. Journal of Food Science, 48(1), 57-61.
90. Dickinson, E., & Rodriguez, J. M. (1999). Advances in Food Emulsion & Foams. London: Elsevier.
91. Dileep, A. O., Shamasundar, B. A., Binsi, P. K., Badii, F., & Howell, N. K. (2012). Composition, physicochemical and rheological properties of fresh bigeye snapper fish (Priacanthus hamrur) mince. Journal of Food Biochemistry, 36(5), 577-586.
92. Dong, Y. L., Sheng, G. Y., Fu, J. M., & Wen, K. W. (2005). Chemical characterization and anti‐anaemia activity of fish protein hydrolysate from Saurida elongata. Journal of the Science of Food and Agriculture, 85(12), 2033-2039.
93. Dong, S., Zeng, M., Wang, D., Liu, Z., Zhao, Y., & Yang, H. (2008). Antioxidant and biochemical properties of protein hydrolysates prepared
337 ptimiiation of proaess parameters for eniymatia hydrolysis of tuna red meat protein
References
from Silver carp (Hypophthalmichthys molitrix). Food Chemistry, 107(4), 1485-1493.
94. dos Santos, S. D. A., Martins, V. G., Salas-Mellado, M., & Prentice, C. (2011). Evaluation of functional properties in protein hydrolysates from bluewing searobin (Prionotus punctatus) obtained with different microbial enzymes. Food and Bioprocess Technology, 4(8), 1399-1406.
95. Drusch, S., & Mannino, S. (2009). Patent-based review on industrial approaches for the microencapsulation of oils rich in polyunsaturated fatty acids. Trends in Food Science & Technology, 20(6-7), 237-244.
96. Elavarasan, K. (2014). Application of proteolysis for the production of fish protein hydrolysate and its characterization. Doctoral dissertation, Karnataka Veterinary, Animal and Fisheries Sciences University, Bidar.
97. Elavarasan, K., Naveen Kumar, V., & Shamasundar, B. A. (2014). Antioxidant and functional properties of fish protein hydrolysates from fresh water carp (Catla catla) as influenced by the nature of enzyme. Journal of Food Processing and Preservation, 38(3), 1207-1214.
98. Elavarasan, K., & Shamasundar, B. A. (2016). Effect of oven drying and freeze drying on the antioxidant and functional properties of protein hydrolysates derived from freshwater fish (Cirrhinus mrigala) using papain enzyme. Journal of Food Science and Technology, 53(2), 1303-1311.
99. Elaziz, M. A., Hemdan, A. M., Hassanien, A., Oliva, D., & Xiong, S. (2017). Analysis of bioactive amino acids from fish hydrolysates with a new bioinformatic intelligent system approach. Scientific Reports, 7(1), 10860.
100. El-Bostany, A. N., Ahmed, M. G., & Amany, A. S. (2011). Development of light mayonnaise formula using carbohydrate-based fat replacement. Australian Journal of Basic and Applied Sciences, 5(9), 673-682.
101. FAO (2016). The state of world fisheries and aquaculture 2016. Contributing to food security and nutrition for all Rome, ISBN 978-92-5-109185-2.
102. Fernandes, R.V.B., Borges, S. V., & Botrel, D.A. (2013). Influence of spray drying operating conditions on microencapsulated rosemary essential oil properties. Food Science and Technology (Campinas), 33(Suppl. 1), 171-178.
103. Fitzpatrick, J. J., & Ahrné, L. (2005). Food powder handling and processing: Industry problems, knowledge barriers and research opportunities. Chemical Engineering and Processing: Process Intensification, 44(2), 209-214.
338 ptimiiation of proaess parameters for eniymatia hydrolysis of tuna red meat protein
References
104. Foh, M. B. K., Kamara, M. T., Amadou, I., Foh, B. M., & Wenshui, X. (2011). Chemical and physicochemical properties of tilapia (Oreochromis niloticus) fish protein hydrolysate and concentrate. International Journal of Biological Chemistry, 5(1), 21-36.
105. Foh, M. B. K., Wenshui, X., Amadou, I., & Jiang, Q. (2012). Influence of pH shift on functional properties of protein isolated of tilapia (Oreochromis niloticus) muscles and of soy protein isolate. Food and Bioprocess Technology, 5(6), 2192-2200.
106. Folch J., Lees M., & Sloane-Stanley G.H. (1957). A simple method for the isolation and purification of total lipids from animal tissues. The Journal of Biological Chemistry, 226(1), 497-509.
107. Ford, L.R., Borwankar, D., Pechak, & Schwimmer, B. (2004). Dressings and sauces. In: Food emulsions (Friberg, S., Larsson, K. and Sjoblom, J.), 4th ed. New York: Marcel Dekker.
108. Fu, Y., Chen, J., Bak, K. H., & Lametsch, R. (2019). Valorisation of protein hydrolysates from animal by‐products: perspectives on bitter taste and debittering methods: a review. International Journal of Food Science & Technology.
109. Gajanan, P. G. (2014). Properties of bioactive peptides derived from seafood processing waste by enzymatic hydrolysis and fermented fish products. Doctoral dissertation, Karnataka Veterinary, Animal and Fisheries Sciences University, Bidar
110. Gajanan, P. G., Elavarasan, K., & Shamasundar, B. A. (2016). Bioactive and functional properties of protein hydrolysates from fish frame processing waste using plant proteases. Environmental Science and Pollution Research, 23(24), 24901-24911.
111. Galland, G., Rogers, A., & Nickson, A. (2016). Netting billions: a global valuation of tuna. The Pew Charitable Trusts, 1-22.
112. Gallegos, C., Berjano, M., & Choplin, L. (1992). Linear viscoelastic behavior of commercial and model mayonnaise. Journal of Rheology, 36(3), 465-478.
113. Gamarro, E. G., Orawattanamateekul, W., Sentina, J., & Gopal, T. S. (2013). By-products of tuna processing. GLOBEFISH Research Programme, 112, I.
114. Gaonkar, G., Koka, R., Chen, K., & Campbell, B. (2010). Emulsifying functionality of enzyme-modified milk proteins in O/W and mayonnaise-
339 ptimiiation of proaess parameters for eniymatia hydrolysis of tuna red meat protein
References
like emulsions. African Journal of Food Science, 4(1), 016-025.115. García-Moreno, P. J., Guadix, A., Guadix, E. M., & Jacobsen, C. (2016).
Physical and oxidative stability of fish oil-in-water emulsions stabilized with fish protein hydrolysates. Food Chemistry, 203, 124-135.
116. Gbogouri, G. A., Linder, M., Fanni, J., & Parmentier, M. (2004). Influence of hydrolysis degree on the functional properties of salmon byproducts hydrolysates. Journal of Food Science, 69(8), C615-C622.
117. Geirsdottir, M., Sigurgisladottir, S., Hamaguchi, P. Y., Thorkelsson, G., Johannsson, R., Kristinsson, H. G., & Kristjansson, M. M. (2011). Enzymatic hydrolysis of blue whiting (Micromesistius poutassou); functional and bioactive properties. Journal of Food Science, 76(1), C14-C20.
118. Ghassem, M., Fern, S. S., Said, M., Ali, Z. M., Ibrahim, S., & Babji, A. S. (2014). Kinetic characterization of Channa striatus muscle sarcoplasmic and myofibrillar protein hydrolysates. Journal of Food Science and Technology, 51(3), 467-475.
119. Ghazaei, S., Mizani, M., Piravi-Vanak, Z., & Alimi, M. (2015). Particle size and cholesterol content of a mayonnaise formulated by OSA-modified potato starch. Food Science and Technology, 35(1), 150-156.
120. Ghelichi, S., Shabanpour, B., & Pourashouri, P. (2018). Proximate and amino acid composition, antioxidant properties, ACE inhibitory effect, and antibacterial power of protein hydrolysates of common carp roe by alcalase. Fisheries Science and Technology, 7(2), 145-155.
121. Ghorbel, S., Souissi, N., Triki-Ellouz, Y., Dufosse, L., Guerard, F., & Nasri, M. (2005). Preparation and testing of Sardinella protein hydrolysates as nitrogen source for extracellular lipase production by Rhizopus oryzae. World Journal of Microbiology and Biotechnology, 21(1), 33-38.
122. Ghoush, M. A., Samhouri, M., Al-Holy, M., & Herald, T. (2008). Formulation and fuzzy modeling of emulsion stability and viscosity of a gum–protein emulsifier in a model mayonnaise system. Journal of Food Engineering, 84(2), 348-357.
123. Giménez, B., Alemán, A., Montero, P., & Gómez-Guillén, M. C. (2009). Antioxidant and functional properties of gelatin hydrolysates obtained from skin of sole and squid. Food Chemistry, 114(3), 976-983.
124. Girgih, A. T., Udenigwe, C. C., Hasan, F. M., Gill, T. A., & Aluko, R. E. (2013). Antioxidant properties of Salmon (Salmo salar) protein hydrolysate
340 ptimiiation of proaess parameters for eniymatia hydrolysis of tuna red meat protein
References
and peptide fractions isolated by reverse-phase HPLC. Food Research International, 52(1), 315-322.
125. Godinho, I., Pires, C., Pedro, S., Teixeira, B., Mendes, R., Nunes, M. L., & Batista, I. (2016). Antioxidant Properties of Fish Protein Hydrolysates Prepared from Cod Protein Hydrolysate by Bacillus sp. Applied Biochemistry and Biotechnology, 178(6), 1095-1112.
126. Gong, M., Mohan, A., Gibson, A., & Udenigwe, C. C. (2015). Mechanisms of plastein formation, and prospective food and nutraceutical applications of the peptide aggregates. Biotechnology Reports, 5, 63-69.
127. Gordon, M. H. (2001). The development of oxidative rancidity. In: Antioxidants in Food-Practical Applications (Pokorny, J., Yanishlieva, N. and Gordon, M. Eds.), Washington: CRC Press, pp. 7–22.
128. Greyling, N. (2017). Optimisation of enzymatic hydrolysis of monkfish heads for preparing protein hydrolysates as animal feed ingredient. Doctoral dissertation, Stellenbosch: Stellenbosch University.
129. Gruenwald, J. (2009). Novel botanical ingredients for beverages. Clinics in Dermatology, 27(2), 210-216.
130. Guerard, F., Dufosse, L., De La Broise, D., & Binet, A. (2001). Enzymatic hydrolysis of proteins from yellowfin tuna (Thunnus albacares) wastes using Alcalase. Journal of Molecular Catalysis B: Enzymatic, 11(4-6), 1051-1059.
131. Guerard, F., Guimas, L., & Binet, A. (2002). Production of tuna waste hydrolysates by a commercial neutral protease preparation. Journal of Molecular Catalysis B: Enzymatic, 19, 489-498.
132. Guerard, F., Sumaya-Martinez, M. T., Laroque, D., Chabeaud, A., & Dufossé, L. (2007). Optimization of free radical scavenging activity by response surface methodology in the hydrolysis of shrimp processing discards. Process Biochemistry, 42(11), 1486-1491.
133. Haldar, A., Das, M., Chatterjee, R., Dey, T. K., Dhar, P., & Chakrabarti, J. (2018). Functional properties of protein hydrolysates from fresh water mussel Lamellidens marginalis (Lam.).
134. Hall, G. M., & Ahmad, N. H. (1992). Functional properties of fish protein hydrolysates. In: Fish Processing Technology (Hall, G. M. Ed.), USA: Blackie Academic and Professional, pp. 249-265.
135. Halim, N. R. A., Yusof, H. M., & Sarbon, N. M. (2016). Functional
341 ptimiiation of proaess parameters for eniymatia hydrolysis of tuna red meat protein
References
and bioactive properties of fish protein hydolysates and peptides: A comprehensive review. Trends in Food Science & Technology, 51, 24-33.
136. Halliwell, B, & Gutteridge, J. M. C. (2007). Free Radicals in Biology and Medicine, 4th Edn., Oxford, UK: Oxford University Press.
137. Harnedy, P. A., & FitzGerald, R. J. (2012). Bioactive peptides from marine processing waste and shellfish: A review. Journal of Functional Foods, 4(1), 6-24.
138. Hashim, D. M., Man, Y. C., Norakasha, R., Shuhaimi, M., Salmah, Y., & Syahariza, Z. A. (2010). Potential use of Fourier transform infrared spectroscopy for differentiation of bovine and porcine gelatins. Food Chemistry, 118(3), 856-860.
139. Haslaniza, H., Maskat, M. Y., Wan Aida, W. M., & Mamot, S. (2010). The effects of enzyme concentration, temperature and incubation time on nitrogen content and degree of hydrolysis of protein precipitate from cockle (Anadara granosa) meat wash water. International Food Research Journal, 17(1), 147-152.
140. Hausner, H. H. (1967). Friction conditions in a mass of metal powder. International Journal of Powder Metallurgy, 3(4), 7-13.
141. He, S., Franco, C., & Zhang, W. (2012). Process optimisation and physicochemical characterisation of enzymatic hydrolysates of proteins from co‐products of Atlantic Salmon (Salmo salar) and Yellowtail Kingfish (Seriola lalandi). International Journal of Food Science & Technology, 47(11), 2397-2404.
142. He, S., Franco, C., & Zhang, W. (2013). Functions, applications and production of protein hydrolysates from fish processing co-products (FPCP). Food Research International, 50(1), 289-297.
143. He, S., Franco, C., & Zhang, W. (2015a). Fish protein hydrolysates: Application in deep‐fried food and food safety analysis. Journal of Food Science, 80(1), E108-E115.
144. He, S., Franco, C. M., & Zhang, W. (2015b). Economic feasibility analysis of the industrial production of fish protein hydrolysates using conceptual process simulation software. Journal of Bioprocessing & Biotechniques, 5(1), 1.
145. Hermannsdottir, R., Johannsdottir, J., Smaradottir, H., Sigurgisladottir, S., Gudmundsdottir, B. K., & Bjornsdottir, R. (2009). Analysis of effects induced
342 ptimiiation of proaess parameters for eniymatia hydrolysis of tuna red meat protein
References
by a pollock protein hydrolysate on early development, innate immunity and the bacterial community structure of first feeding of Atlantic halibut (Hippoglossus hippoglossus L.) larvae. Fish & Shellfish Immunology, 27(5), 595-602.
146. Hernández-Ledesma, B., García-Nebot, M. J., Fernández-Tomé, S., Amigo, L., & Recio, I. (2014). Dairy protein hydrolysates: Peptides for health benefits. International Dairy Journal, 38(2), 82-100.
147. Herpandi, N. H., Rosma, A., & Wan Nadiah, W. A. (2011). The tuna fishing industry: a new outlook on fish protein hydrolysates. Comprehensive Reviews in Food Science and Food Safety, 10(4), 195-207.
148. Herpandi, H., Huda, N., Rosma, A., & Wan Nadia, W. A. (2012). Degree of hydrolysis and free tryptophan content of Skipjack Tuna (Katsuwonus pelamis) protein hydrolysates produced with different type of industrial proteases. International Food Research Journal, 19(3), 863-867.
149. Hevrøy, E. M., Espe, M., Waagbø, R., Sandnes, K., Ruud, M., & Hemre, G. I. (2005). Nutrient utilization in Atlantic salmon (Salmo salar L.) fed increased levels of fish protein hydrolysate during a period of fast growth. Aquaculture Nutrition, 11(4), 301-313.
150. Himonides, A. T., Taylor, A. K., & Morris, A. J. (2011). A study of the enzymatic hydrolysis of fish frames using model systems. Food and Nutrition Sciences, 2(06), 575-585.
151. Hogan, S. A., & O’callaghan, D. J. (2013). Moisture sorption and stickiness behaviour of hydrolysed whey protein/lactose powders. Dairy Science & Technology, 93(4-5), 505-521.
152. Horn, A. F., Nielsen, N. S., Jensen, L. S., Horsewell, A., & Jacobsen, C. (2012). Thechoice of homogenisation equipment affects lipid oxidation in emulsions. Food Chemistry, 134, 803–810.
153. Hou, H., Li, B., & Zhao, X. (2011). Enzymatic hydrolysis of defatted mackerel protein with low bitter taste. Journal of Ocean University of China, 10(1), 85-92.
154. Hou, Y., Wu, Z., Dai, Z., Wang, G., & Wu, G. (2017). Protein hydrolysates in animal nutrition: industrial production, bioactive peptides, and functional significance. Journal of Animal Science and Biotechnology, 8(1), 24.
155. Hoyle, N. T., & Merritt, J. H. (1994). Quality of fish protein hydrolysates from herring (Clupea harengus). Journal of Food Science, 59(1), 76-79.
343 ptimiiation of proaess parameters for eniymatia hydrolysis of tuna red meat protein
References
156. Hsu, K. C. (2010). Purification of antioxidative peptides prepared from enzymatic hydrolysates of tuna dark muscle by-product. Food Chemistry, 122(1), 42-48.
157. Ibarra, J. P., Teixeira, A., Simpson, R., Valencia, P., Pinto, M., & Almonacid, S. (2013). Addition of fish protein hydrolysate for enhanced water retention in Sous Vide processing of salmon. Journal of Food Processing and Technology, 4(7).
158. ICMSF (1998). Microorganisms in foods. International Commission on Microbiological Specification for food. Microbial ecology of foods. London: Blackie Academic and Professional.
159. Idowu, A. T., Benjakul, S., Sinthusamran, S., Sookchoo, P., & Kishimura, H. (2019). Protein hydrolysate from salmon frames: Production, characteristics and antioxidative activity. Journal of Food Biochemistry, 43(2), e12734.
160. Ilyasoglu, H., & El, S. N. (2014). Nanoencapsulation of EPA/DHA with sodium caseinate–gum arabic complex and its usage in the enrichment of fruit juice. LWT-Food Science and Technology, 56(2), 461-468.
161. Intarasirisawat, R., Benjakul, S., Visessanguan, W., & Wu, J. (2014). Effects of skipjack roe protein hydrolysate on properties and oxidative stability of fish emulsion sausage. LWT-Food Science and Technology, 58(1), 280-286.
162. Intipunya, P., & Bhandari, B. R. (2010). Chemical deterioration and physical instability of food powders. In: Chemical Deterioration and Physical Instability of Food and Beverages (Leif, H. S., Jens R., Mogens, L. A. Eds.), UK: Woodhead Publishing, pp. 663-700.
163. Ishida, Y., Fujita, T., & Asai, K. (1981). New detection and separation method for amino acids by high-performance liquid chromatography. Journal of Chromatography A, 204, 143-148.
164. Ismail, N., & Sahibon, N. S. (2018). Evaluation of Bouillon Cube Prepared with the Addition of Threadfin Bream (Nemipterus japonicus) Hydrolysate. Pertanika Journal of Tropical Agricultural Science, 41(3).
165. Jacobsen, C., Adler-Nissen, J., & Meyer, A. S. (1999). Effect of ascorbic acid on iron release from the emulsifier interface and on the oxidative flavor deterioration in fish oil enriched mayonnaise. Journal of Agricultural and Food Chemistry, 47(12), 4917-4926.
166. Jafari, S. M., Fathi, M., & Mandala, I. (2015). Emerging product formation. In: Food Waste Recovery Processing Technologies and Industrial Techniques
344 ptimiiation of proaess parameters for eniymatia hydrolysis of tuna red meat protein
References
(Charis Galanakis, Ed.), New York: Elsevier Inc., pp. 293-317.167. Jain, S., Gupta, R., & Jain, S. (2013). Development of low cost nutritional
beverage from whey. IOSR Journal of Environmental Science Toxicology and Food Technology, 5, 73-88.
168. Jamil, N. H., Halim, N. R. A., & Sarbon, N. M. (2016). Optimization of enzymatic hydrolysis condition and functional properties of eel (Monopterus sp.) protein using response surface methodology (RSM). International Food Research Journal, 23(1).
169. Je, J. Y., Park, P. J., & Kim, S. K. (2005). Antioxidant activity of a peptide isolated from Alaska pollack (Theragra chalcogramma) frame protein hydrolysate. Food Research International, 38(1), 45-50.
170. Jemil, I., Jridi, M., Nasri, R., Ktari, N., Salem, R. B. S. B., Mehiri, M., Hajji, M., & Nasri, M. (2014). Functional, antioxidant and antibacterial properties of protein hydrolysates prepared from fish meat fermented by Bacillus subtilis A26. Process Biochemistry, 49(6), 963-972.
171. Jeyakumari, A., Kothari, D. C., & Venkateshwarlu, G. (2015). Oxidative stability of microencapsulated fish oil during refrigerated storage. Journal of Food Processing and Preservation, 39(6), 1944-1955.
172. Jeyakumari, A., Janarthanan, G., Chouksey, M. K., & Venkateshwarlu, G. (2016). Effect of fish oil encapsulates incorporation on the physico-chemical and sensory properties of cookies. Journal of Food Science and Technology, 53(1), 856-863.
173. Jinapong, N., Suphantharika, M., & Jamnong, P. (2008). Production of instant soymilk powders by ultrafiltration, spray drying and fluidized bed agglomeration. Journal of Food Engineering, 84(2), 194-205.
174. Johanson, K. (2005). Powder flow properties. In: Encapsulated and Powdered Foods (Onwulata, C., Ed.), Boca Raton: Taylor and Francis, pp. 331–361.
175. Johnrose, P., Savariar, V., Swapna, J., & Joacy, M. (2016). Bioactive and functional properties of fish protein hydrolysate from Leiognathus bindus. Asian Journal of Pharmaceutical and Clinical Research, 9(5): 277-281.
176. Jun, S. Y., Park, P. J., Jung, W. K., & Kim, S. K. (2004). Purification and characterization of an antioxidative peptide from enzymatic hydrolysate of yellowfin sole (Limanda aspera) frame protein. European Food Research and Technology, 219(1), 20-26.
177. Karas, R., Skvarča, M., & Žlender, B. (2002). Sensory quality of
345 ptimiiation of proaess parameters for eniymatia hydrolysis of tuna red meat protein
References
standard and light mayonnaise during storage. Food Technology and Biotechnology, 40(2), 119-127.
178. Kasapis, S., Norton, I. T., & Ubbink, J. B. (2009). Modern Biopolymer Science: Bridging the Divide Between Fundamental Treatise and Industrial Application. London: Academic Press.
179. Khaled, H. B., Ghlissi, Z., Chtourou, Y., Hakim, A., Ktari, N., Fatma, M. A., Barkia, A., Sahnoun, Z., & Nasri, M. (2012). Effect of protein hydrolysates from sardinelle (Sardinella aurita) on the oxidative status and blood lipid profile of cholesterol-fed rats. Food Research International, 45(1), 60-68.
180. Khantaphant, S., Benjakul, S., & Kishimura, H. (2011). Antioxidative and ACE inhibitory activities of protein hydrolysates from the muscle of brownstripe red snapper prepared using pyloric caeca and commercial proteases. Process Biochemistry, 46(1), 318-327.
181. Kim, D. C., Chae, H. J., & In, M. J. (2004). Existence of stable fibrin-clotting inhibitor in salt-fermented anchovy sauce. Journal of Food Composition and Analysis, 17(1), 113-118.
182. Kim, H. O., & Li-Chan, E. C. (2006). Quantitative structure− activity relationship study of bitter peptides. Journal of Agricultural and Food Chemistry, 54(26), 10102-10111.
183. Kim, S. K., & Mendis, E. (2006). Bioactive compounds from marine processing byproducts–a review. Food Research International, 39(4), 383-393.
184. Kim, S. Y., Je, J. Y., & Kim, S. K. (2007). Purification and characterization of antioxidant peptide from hoki (Johnius belengerii) frame protein by gastrointestinal digestion. The Journal of Nutritional Biochemistry, 18(1), 31-38.
185. Kim, S. K., & Wijesekara, I. (2010). Development and biological activities of marine-derived bioactive peptides: A review. Journal of Functional Foods, 2(1), 1-9.
186. Kinsella, J. E., & Melachouris, N. (1976). Functional properties of proteins in foods: a survey. Critical Reviews in Food Science & Nutrition, 7(3), 219-280.
187. Kinsella, J. E. (1982). Relationship between structure and functional properties of food proteins. In: Food Proteins (Fox, P. F., & Cowden, J. J., Eds.), London: Applied Science Publisher, pp. 51-103.
346 ptimiiation of proaess parameters for eniymatia hydrolysis of tuna red meat protein
References
188. Kittiphattanabawon, P., Benjakul, S., Visessanguan, W., & Shahidi, F. (2012). Cryoprotective effect of gelatin hydrolysate from blacktip shark skin on surimi subjected to different freeze-thaw cycles. LWT-Food Science and Technology, 47(2), 437-442.
189. Klomklao, S., Benjakul, S., & Kishimura, H. (2013). Functional properties and antioxidative activity of protein hydrolysates from toothed ponyfish muscle treated with viscera extract from hybrid catfish. International Journal of Food Science and Technology, 48, 1483-1489.
190. Klompong, V., Benjakul, S., Kantachote, D., & Shahidi, F. (2007). Antioxidative activity and functional properties of protein hydrolysate of yellow stripe trevally (Selaroides leptolepis) as influenced by the degree of hydrolysis and enzyme type. Food Chemistry, 102(4), 1317-1327.
191. Klompong, V., Benjakul, S., Yachai, M., Visessanguan, W., Shahidi, F., & Hayes, K. D. (2009a). Amino acid composition and antioxidative peptides from protein hydrolysates of yellow stripe trevally (Selaroides leptolepis). Journal of Food Science, 74(2), C126-C133.
192. Klompong, V., Benjakul, S., Kantachote, D., & Shahidi, F. (2009b). Characteristics and use of yellow stripe trevally hydrolysate as culture media. Journal of Food Science, 74(6), S219-S225.
193. Klompong, V., Benjakul, S., Kantachote, D., & Shahidi, F. (2012). Storage stability of protein hydrolysate from yellow stripe trevally (Selaroides leptolepis). International Journal of Food Properties, 15(5), 1042-1053.
194. Kodera, T., Asano, M., & Nio, N. (2006). Characteristic property of low bitterness in protein hydrolysates by a novel soybean protease D3. Journal of Food Science, 71(9), S609-S614.
195. Kolanowski, W. (2005). Bioavailability of omega-3 PUFA from foods enriched with fish oil-a mini review. Polish Journal of Food and Nutrition Sciences, 14(4), 335-340.
196. Kolanowski, W., & Laufenberg, G. (2006). Enrichment of food products with polyunsaturated fatty acids by fish oil addition. European Food Research and Technology, 222(3-4), 472-477.
197. Kolanowski, W., & Weißbrodt, J. (2007). Sensory quality of dairy products fortified with fish oil. International Dairy Journal, 17(10), 1248-1253.
198. Kong, J., & Yu, S. (2007). Fourier transform infrared spectroscopic analysis of protein secondary structures. Acta Biochimica et Biophysica Sinica,
347 ptimiiation of proaess parameters for eniymatia hydrolysis of tuna red meat protein
References
39(8), 549-559.199. Kong, Y. Y., Chen, S. S., Wei, J. Q., Chen, Y. P., Lan, W. T., Yang, Q. W.,
& Huang, G. R. (2015). Preparation of antioxidative peptides from spanish mackerel (Scomberomorus niphonius) processing byproducts by enzymatic hydrolysis. Biotechnology, 14(4), 188-193.
200. Konno, K., Hirayama, C., Nakamura, M., Tateishi, K., Tamura, Y., Hattori, M., & Kohno, K. (2004). Papain protects papaya trees from herbivorous insects: role of cysteine proteases in latex. The Plant Journal, 37(3), 370-378.
201. Korhonen, H., & Pihlanto, A. (2003). Food-derived bioactive peptides-opportunities for designing future foods. Current Pharmaceutical Design, 9(16), 1297-1308.
202. Kosaraju, S. L, Weerakkody, R., & Augustin, M.A. (2009). In-vitro evaluation of hydrocolloid–based encapsulated fish oil. Food Hydrocolloids, 23(5), 1413-1419.
203. Kotzamanis, Y. P., Gisbert, E., Gatesoupe, F. J., Infante, J. Z., & Cahu, C. (2007). Effects of different dietary levels of fish protein hydrolysates on growth, digestive enzymes, gut microbiota, and resistance to Vibrio anguillarum in European sea bass (Dicentrarchus labrax) larvae. Comparative Biochemistry and Physiology Part A: Molecular & Integrative Physiology, 147(1), 205-214.
204. Kouakou, C., Bergé, J. P., Baron, R., Lethuaut, L., Prost, C., & Cardinal, M. (2014). Odor modification in salmon hydrolysates using the Maillard reaction. Journal of Aquatic Food Product Technology, 23(5), 453-467.
205. Kristinsson, H. G., & Rasco, B. A. (2000). Fish protein hydrolysates: production, biochemical, and functional properties. Critical Reviews in Food Science and Nutrition, 40(1), 43-81.
206. Kristinsson, H. G. (2006). Aquatic food protein hydrolysates. In: Maximising the Value of Marine By‐products. (Shahidi, F. Ed.), 1st Edn., Woodhead, UK: Cambridge, pp. 229‐248.
207. Kristinsson, H. G. (2007). Functional and bioactive peptides from hydrolyzed aquatic food proteins. In: Marine Nutraceuticals and Functional Foods (Nutraceutical Science and Technology (Shahidi, F., & Barrow, C. Eds.), Boca Raton: CRC Press, pp. 229-246.
208. Kuakpetoon, D., Flores, R. A., & Milliken, G. A. (2001). Dry mixing of
348 ptimiiation of proaess parameters for eniymatia hydrolysis of tuna red meat protein
References
wheat flours: Effect of particle properties and blending ratio. LWT-Food Science and Technology, 34(3), 183-193.
209. Kuehler, C. A., & Stine, C. M. (1974). Effect of enzymatic hydrolysis on some functional properties of whey protein. Journal of Food Science, 39(2), 379-382.
210. Kurozawa, L. E., Park, K. J., & Hubinger, M. D. (2009). Effect of maltodextrin and gum arabic on water sorption and glass transition temperature of spray dried chicken meat hydrolysate protein. Journal of Food Engineering, 91(2), 287-296.
211. Kwak, H. S., Al Mijan, M., & Ganesan, P. (2014). Application of nanomaterials, nano‐and microencapsulation to milk and dairy products. Nano-and Microencapsulation for Foods, 273-300.
212. Lalasidis, G. (1978). Four new methods of debittering protein hydrolysates and a fraction of hydrolysates with high content of essential amino acids. In Annales de la nutrition et de l’alimentation, 32(2-3), 709-723.
213. Lam, R. S. H., & Nickerson, M. T. (2013). Food proteins: A review on theiremulsifying properties using a structure–function approach. Food Chemistry, 141, 975–984.
214. Leksrisompong, P., Gerard, P., Lopetcharat, K., & Drake, M. (2012). Bitter taste inhibiting agents for whey protein hydrolysate and whey protein hydrolysate beverages. Journal of Food Science, 77(8), S282-S287.
215. Lewis, M.J. (1990). Physical properties of foods and food processing systems. New York: Ellis Harwood Ltd.
216. Li, L., Wang, J., Zhao, M., Cui, C., & Jiang, Y. (2006). Artificial neural network for production of antioxidant peptides derived from bighead carp muscles with alcalase. Food Technology & Biotechnology, 44(3).
217. Li, Y., Jiang, B., Zhang, T., Mu, W., & Liu, J. (2008). Antioxidant and free radical-scavenging activities of chickpea protein hydrolysate (CPH). Food Chemistry, 106(2), 444-450.
218. Li, Z., Wang, B., Chi, C., Gong, Y., Luo, H., & Ding, G. (2013). Influence of average molecular weight on antioxidant and functional properties of cartilage collagen hydrolysates from Sphyrna lewini, Dasyatis akjei and Raja porosa. Food Research International, 51(1), 283-293.
219. Liaset, B., Lied, E., & Espe, M. (2000). Enzymatic hydrolysis of by‐products from the fish‐filleting industry; chemical characterisation and nutritional
349 ptimiiation of proaess parameters for eniymatia hydrolysis of tuna red meat protein
References
evaluation. Journal of the Science of Food and Agriculture, 80(5), 581-589.220. Liaset, B., Nortvedt, R., Lied, E., & Espe, M. (2002). Studies on the nitrogen
recovery in enzymic hydrolysis of Atlantic salmon (Salmo salar, L.) frames by Protamex™ protease. Process Biochemistry, 37(11), 1263-1269.
221. Liceaga‐Gesualdo, A. M., & Li‐Chan, E. C. Y. (1999). Functional properties of fish protein hydrolysate from herring (Clupea harengus). Journal of Food Science, 64(6), 1000-1004.
222. Lin, C. C., & Liang, J. H. (2002). Effect of antioxidants on the oxidative stability of chicken breast meat in a dispersion system. Journal of Food Science, 67(2), 530-533.
223. Lin, M., Ke, L. N., Han, P., Qiu, L., Chen, Q. X., Lin, H. T., & Wang, Q. (2010). Inhibitory effects of p-alkylbenzoic acids on the activity of polyphenol oxidase from potato (Solanum tuberosum). Food Chemistry, 119(2), 660-663.
224. Linde, G. A., Junior, A. L., de Faria, E. V., Colauto, N. B., de Moraes, F. F., & Zanin, G. M. (2009). Taste modification of amino acids and protein hydrolysate by α-cyclodextrin. Food Research International, 42(7), 814-818.
225. Liu, C., Morioka, K., Itoh, Y., & Obatake, A. (2000). Contribution of lipid oxidation to bitterness and loss of free amino acids in the autolytic extract from fish wastes: Effective utilization of fish wastes. Fisheries Science, 66(2), 343-348.
226. Liu, J., Lyu, F., Zhou, X., Wang, B., Wang, X., & Ding, Y. (2015). Preparation of skipjack tuna (Katsuwonus pelamis) protein hydrolysate using combined controlled enzymatic hydrolysis and glycation for improved solubility and emulsifying properties. Journal of Food and Nutrition Research, 3(7), 471-477.
227. Liu, C., Ma, X., Che, S., Wang, C., & Li, B. (2018). The Effect of Hydrolysis with Neutrase on Molecular Weight, Functional Properties, and Antioxidant Activities of Alaska Pollock Protein Isolate. Journal of Ocean University of China, 17(6), 1423-1431.
228. Lovšin-Kukman, I., Zelenik-Blatnik, M., & Abram, V. (1996). Bitterness intensity of soybean protein hydrolysates—chemical and organoleptic characterization. Zeitschrift für Lebensmittel-Untersuchung und Forschung, 203(3), 272-276.
350 ptimiiation of proaess parameters for eniymatia hydrolysis of tuna red meat protein
References
229. Ma, Z., & Boye, J. I. (2013). Advances in the design and production of reduced-fat and reduced-cholesterol salad dressing and mayonnaise: a review. Food and Bioprocess Technology, 6(3), 648-670.
230. Mahmoud, M. I. (1994). Physicochemical and functional properties of protein hydrolysates in nutritional products. Food Technology, 48, 89-113.
231. Maillot, M., Ferguson, E. L., Drewnowski, A., & Darmon, N. (2008). Nutrient profiling can help identify foods of good nutritional quality for their price: a validation study with linear programming. The Journal of Nutrition, 138(6), 1107-1113.
232. Manninen, A. H. (2009). Protein hydrolysates in sports nutrition. Nutrition & Metabolism, 6(1), 38.
233. Masur, S. B., Tarachand, K. C., & Kulkarni, U. N. (2009). Development of high protein biscuits from bengal gram flour. Karnataka Journal of Agricultural Sciences, 22(4), 862-864.
234. Mazorra-Manzano, M. A., Pacheco-Aguilar, R., Ramírez-Suárez, J. C., Garcia-Sanchez, G., & Lugo-Sánchez, M. E. (2012). Endogenous proteases in Pacific whiting (Merluccius productus) muscle as a processing aid in functional fish protein hydrolysate production. Food and Bioprocess Technology, 5(1), 130-137.
235. McCarthy, A., O’Callaghan, Y., & O’Brien, N. (2013). Protein hydrolysates from agricultural crops—bioactivity and potential for functional food development. Agriculture, 3(1), 112-130.
236. McClements, D. J., & Demetriades, K. (1998). An integrated approach to the development of reduced-fat food emulsions. Critical Reviews in Food Science and Nutrition, 38(6), 511-536.
237. McClements, D. J. (1999). Emulsion formation. In: Food Emulsions: Principles, Practice and Techniques (McClements, D. J. Ed.), Boca Raton: CRC Press, pp. 161-183.
238. McClements, D. J. (2005). Food Emulsions: Principles, Practice, and Techniques. Boca Raton: CRC Press.
239. McClements, D. J. (2007). Critical review of techniques and methodologies for characterization of emulsion stability. Critical Reviews in Food Science and Nutrition, 47(7), 611-649.
240. McDonald, R. E.,& Hultin, H.O. (1987). Some characteristics of the enzymic lipid peroxidation system in the microsomal fraction of flounder
351 ptimiiation of proaess parameters for eniymatia hydrolysis of tuna red meat protein
References
skeletal muscle. Journal of Food Science, 521, 15–21.241. Meilgaard, M., Civille, G. V., & Carr, B. T. (2006). Sensory Evaluation
Techniques, 4th edn., Boca Raton: CRC Press.242. Mendonça Diniz, F., & Martin, A. M. (1998). Influence of process variables
on the hydrolysis of shark muscle protein/Influencia de las variables de proceso en la hidrólisis de proteína del músculo de tiburón. Food Science and Technology International, 4(2), 91-98.
243. Millqvist-Fureby, A. (2003). Characterisation of spray-dried emulsions with mixed fat phases. Colloids and Surfaces B: Biointerfaces, 31, 65–79.
244. Mohan, A., Rajendran, S. R., He, Q. S., Bazinet, L., & Udenigwe, C. C. (2015). Encapsulation of food protein hydrolysates and peptides: a review. RSC Advances, 5(97), 79270-79278.
245. Moll, D. (1990). Manufacturing protein hydrolysates without giving rise to a bitter taste. In: Food Ingredients Europe, conference proceedings. The Netherlands: Expoconsult Publishers, pp. 257-260.
246. Morales-Medina, R., Tamm, F., Guadix, A.M., Guadix, E.M., & Drusch, S. (2016). Functional and antioxidant properties of hydrolysates of sardine (S. pilchardus) and horse mackerel (T. mediterraneus) for the microencapsulation of fish oil by spray-drying. Food Chemistry, 194, 1208-1216.
247. Morr, C. V., German, B., Kinsella, J. E., Regenstein, J. M., Buren, J. V., Kilara, A., Lewis, B. A., & Mangino, M. E. (1985). A collaborative study to develop a standardized food protein solubility procedure. Journal of Food Science, 50(6), 1715-1718.
248. Motoki, M., & Kumazawa, Y. (2000). Recent research trends in transglutaminase technology for food processing. Food Science and Technology Research, 6(3), 151-160.
249. Moughan, P. J., Fuller, M. F., Han, K. S., Kies, A. K., & Miner-Williams, W. (2007). Food-derived bioactive peptides influence gut function. International Journal of Sport Nutrition and Exercise Metabolism, 17(s1), S5-S22.
250. Mukhin, V. A., Novikov, V. Y., & Ryzhikova, L. S. (2001). A protein hydrolysate enzymatically produced from the industrial waste of processing Icelandic scallop Chlamys islandica. Applied Biochemistry and Microbiology, 37(3), 292-296.
251. Mun, S., Kim, Y. L., Kang, C. G., Park, K. H., Shim, J. Y., & Kim, Y. R. (2009). Development of reduced-fat mayonnaise using 4αGTase-
352 ptimiiation of proaess parameters for eniymatia hydrolysis of tuna red meat protein
References
modified rice starch and xanthan gum. International Journal of Biological Macromolecules, 44(5), 400-407.
252. Munoz, M. E., Galan, A. I., Palacios, E., Diez, M. A., Muguerza, B., Cobaleda, C., Calvo, J. I., Aruoma, O. I., Sanchez-Garcia, I., & Jimenez, R. (2010). Effect of an antioxidant functional food beverage on exercise-induced oxidative stress: a long-term and large-scale clinical intervention study. Toxicology, 278(1), 101-111.
253. Murray, C. R., & Van der Meer, W. J. (1997). Improvements in production of fermented malt beverages. Biotechnology Advances, 15(1), 276-276.
254. Mutilangi, W. A. M., Panyam, D., & Kilara, A. (1996). Functional properties of hydrolysates from proteolysis of heat‐denatured whey protein isolate. Journal of Food Science, 61(2), 270-275.
255. Muyonga, J. H., Cole, C. G. B., & Duodu, K. G. (2004). Fourier transform infrared (FTIR) spectroscopic study of acid soluble collagen and gelatin from skins and bones of young and adult Nile perch (Lates niloticus). Food Chemistry, 86(3), 325-332.
256. Myers, R. H., Montgomery, R. C., & Anderson-Cook, C. M. (2009). Response Surface Methodology, Process and Product Optimization Using Design Experiments. 3rd Edn., New York: Wiley.
257. Najafian, L., & Babji, A. S. (2012). A review of fish-derived antioxidant and antimicrobial peptides: their production, assessment, and applications. Peptides, 33(1), 178-185.
258. Nakajima, K., Yoshie-Stark, Y., & Ogushi, M. (2009). Comparison of ACE inhibitory and DPPH radical scavenging activities of fish muscle hydrolysates. Food Chemistry, 114(3), 844-851.
259. Nalinanon, S., Benjakul, S., Kishimura, H., & Shahidi, F. (2011). Functionalities and antioxidant properties of protein hydrolysates from the muscle of ornate threadfin bream treated with pepsin from skipjack tuna. Food Chemistry, 124(4), 1354-1362.
260. Naqash, S. Y., & Nazeer, R. A. (2012). In vitro antioxidant and antiproliferative activities of bioactive peptide isolated from Nemipterus Japonicus Backbone. International Journal of Food Properties, 15(6), 1200-1211.
261. Naqash, S. Y., & Nazeer, R. A. (2013). Antioxidant and functional properties of protein hydrolysates from pink perch (Nemipterus japonicus)
353 ptimiiation of proaess parameters for eniymatia hydrolysis of tuna red meat protein
References
muscle. Journal of Food Science and Technology, 50(5), 972-978.262. Nasri, R., Amor, I. B., Bougatef, A., Nedjar-Arroume, N., Dhulster, P.,
Gargouri, J., Chaabouni, M. K., & Nasri, M. (2012). Anticoagulant activities of goby muscle protein hydrolysates. Food Chemistry, 133(3), 835-841.
263. Nawar, W. W. (1985). Lipids. In: Food Chemistry (Fennema, O. R. Ed.), 2nd Edn., New York: Marcel Dekker Inc., pp. 139-244.
264. Nesse, K. O., Nagalakshmi, A. P., Marimuthu, P., & Singh, M. (2011). Efficacy of a fish protein hydrolysate in malnourished children. Indian Journal of Clinical Biochemistry, 26(4), 360-365.
265. Nettleton, J. A. (1995). Omega3 Fatty Acids and Health,1st Edn. New York: Chapman & Hall.
266. Netto, F. M., Desobry, S. A., & Labuza, T. P. (1998). Effect of water content on the glass transition, caking and stickiness of protein hydrolysates. International Journal of Food Properties, 1(2), 141-161.
267. Newman, J., Egan, T., Harbourne, N., & Jacquier, J. C. (2014). Correlation of sensory bitterness in dairy protein hydrolysates: Comparison of prediction models built using sensory, chromatographic and electronic tongue data. Talanta, 126, 46-53.
268. Ngo, D. H., Qian, Z. J., Ryu, B., Park, J. W., & Kim, S. K. (2010). In vitro antioxidant activity of a peptide isolated from Nile tilapia (Oreochromis niloticus) scale gelatin in free radical-mediated oxidative systems. Journal of Functional Foods, 2(2), 107-117.
269. Nguyen, H. T. M., Pérez-Gálvez, R., & Bergé, J. P. (2012). Effect of diets containing tuna head hydrolysates on the survival and growth of shrimp Penaeus vannamei. Aquaculture, 324, 127-134.
270. Niki, E. (2010). Assessment of antioxidant capacity in vitro and in vivo. Free Radical Biology and Medicine, 49(4), 503-515.
271. Nikoo, M., Xu, X., Benjakul, S., Xu, G., Ramirez-Suarez, J. C., Ehsani, A., Kasankala, L. M., Duan, X., & Abbas, S. (2011). Characterization of gelatin from the skin of farmed Amur sturgeon Acipenser schrenckii. International Aquatic Research (Islamic Azad University, Tonekabon Branch), 3(2), 135-145.
272. Nilsang, S., Lertsiri, S., Suphantharika, M., & Assavanig, A. (2005). Optimization of enzymatic hydrolysis of fish soluble concentrate by commercial proteases. Journal of Food Engineering, 70(4), 571-578.
354 ptimiiation of proaess parameters for eniymatia hydrolysis of tuna red meat protein
References
273. Nishioka, M., Tanioka, Y., Miyamoto, E., Enomoto, T., & Watanabe, F. (2007). TLC analysis of a corrinoid compound from dark muscle of the yellowfin tuna (Thunnus albacares). Journal of Liquid Chromatography & Related Technologies, 30(15), 2245-2252.
274. Noguchi, N., & Niki, E. (1999). Chemistry of active oxygen species and antioxidants. In: Antioxidant Status, Diet, Nutrition, and Health (Papas, A. M. Ed.), Boca Raton: CRC Press, pp. 3-20.
275. Normah, I., Jamilah, B., Saari, N., & Yaakob, B. C. M. (2005). Optimization of hydrolysis conditions for the production of threadfin bream (Nemipterus japonicus) hydrolysate by alcalase. Journal of Muscle Foods, 16(2), 87-102.
276. Normah, I., Hafsah, M. S., & Izzaira, A. N. (2013). Bitterness of green mussel (Perna viridis) hydrolysate as influenced by the degree of hydrolysis. International Food Research Journal, 20(5), 2261-2268.
277. Obuzor, G. U., & Ajaezi, N. E. (2010). Nutritional content of popular malt drinks produced in Nigeria. African Journal of Food Science, 4(9), 585-590.
278. Ogonda, L. A., Muge, E. K., Mbatia, B., & Mulaa, F. J. (2017). Optimization of alcalase hydrolysis conditions for production of dagaa (Rastrineobola argentea) hydrolysate with antioxidative properties. Industrial Chemistry, 3(122), 2.
279. Opheim, M., Šližytė, R., Sterten, H., Provan, F., Larssen, E., & Kjos, N. P. (2015). Hydrolysis of Atlantic salmon (Salmo salar) rest raw materials—Effect of raw material and processing on composition, nutritional value, and potential bioactive peptides in the hydrolysates. Process Biochemistry, 50(8), 1247-1257.
280. Ovissipour, M., Abedian, A., Motamedzadegan, A., Rasco, B., Safari, R., & Shahiri, H. (2009a). The effect of enzymatic hydrolysis time and temperature on the properties of protein hydrolysates from Persian sturgeon (Acipenser persicus) viscera. Food Chemistry, 115(1), 238-242.
281. Ovissipour, M., Taghiof, M., Motamedzadegan, A., Rasco, B., & Molla, A. E. (2009b). Optimization of enzymatic hydrolysis of visceral waste proteins of beluga sturgeon Huso huso using Alcalase. International Aquatic Research, 1(1), 31-38.
282. Ovissipour, M., Kenari, A. A., Motamedzadegan, A., & Nazari, R. M. (2012). Optimization of enzymatic hydrolysis of visceral waste proteins of yellowfin
355 ptimiiation of proaess parameters for eniymatia hydrolysis of tuna red meat protein
References
tuna (Thunnus albacares). Food and Bioprocess Technology, 5(2), 696-705.283. Oyaizu, M. (1986). Studies on products of browning reaction: antioxidative
activity of products of browning reaction. Jpn. J. Nutr, 44(6).284. Özcan, M. M., Aljuhaimi, F., & Uslu, N. (2018). Effect of malt process steps
on bioactive properties and fatty acid composition of barley, green malt and malt grains. Journal of Food Science and Technology, 55(1), 226-232.
285. Pacheco-Aguilar, R., Mazorra-Manzano, M. A., & Ramírez-Suárez, J. C. (2008). Functional properties of fish protein hydrolysates from Pacific whiting (Merluccius productus) muscle produced by a commercial protease. Food Chemistry, 109(4), 782-789.
286. Parvathy, U., Zynudheen, A. A., Panda, S. K., Jeyakumari, A., & Anandan, R. (2016). Extraction of protein from yellowfin tuna (Thunnus albacares) waste by enzymatic hydrolysis and its characterization. Fishery Technology, 53, 115-124.
287. Parvathy, U., Binsi, P. K., Zynudheen, A. A., Ninan, G., & Murthy, L. N. (2018a). Peptides from white and red meat of yellowfin tuna (Thunnus albacares): A comparative evaluation. Indian Journal of Fisheries, 65(3), 74-83.
288. Parvathy, U., Zynudheen, A. A., Murthy, L. N., Jeyakumari, A., & Visnuvinayagam1a, S. (2018b). Characterization and profiling of protein hydrolysates from white and red meat of tuna (Euthynnus affinis). Fishery Technology, 55(4), 248-257.
289. Parvathy, U., Nizam, K. M., Zynudheen, A. A., Ninan, G., Panda, S. K., & Ravishankar, C. N. (2018c). Characterization of fish protein hydrolysate from red meat of Euthynnus affinis and its application as an antioxidant in iced sardine. Journal of Scientific and Industrial Research, 77, 111-119.
290. Pasupuleti, V. K., & Braun, S. (2010). State of the art manufacturing of protein hydrolysates. In: Protein Hydrolysates in Biotechnology (Pasupuleti, V. K., & Demain A. L., eds.) New York: Springer, pp. 11-32.
291. Pearce, K. N., & Kinsella, J. E. (1978). Emulsifying properties of proteins: evaluation of a turbidimetric technique. Journal of Agricultural and Food Chemistry, 26(3), 716-723.
292. Pechkova, E., Sivozhelezov, V., & Nicolini, C. (2007). Protein thermal stability: The role of protein structure and aqueous environment. Archives of Biochemistry and Biophysics, 466(1), 40-48.
356 ptimiiation of proaess parameters for eniymatia hydrolysis of tuna red meat protein
References
293. Petrova, I., Tolstorebrov, I., & Eikevik, T. M. (2018). Production of fish protein hydrolysates step by step: technological aspects, equipment used, major energy costs and methods of their minimizing. International Aquatic Research, 10(3), 223-241.
294. Phanturat, P., Benjakul, S., Visessanguan, W., & Roytrakul, S. (2010). Use of pyloric caeca extract from bigeye snapper (Priacanthus macracanthus) for the production of gelatin hydrolysate with antioxidative activity. LWT-Food Science and Technology, 43(1), 86-97.
295. Phillips, M. C. (1981). Protein conformation at liquid interfaces and its role in stabilizing emulsions and foams. Food Technology, 35, 50-57.
296. Phillips, L. G., Haque, Z., & Kinsella, J. E. (1987). A method for the measurement of foam formation and stability. Journal of Food Science, 52(4), 1074-1077.
297. Phillips, L. G., Whitehead, D. M., & Kinsella, J. E. (1994). Protein stabilized foams. In: Structure-Function of Food Proteins. (Phillips, L. G., Whitehead, D. M., & Kinsella, J. E. Eds.) New York: Academic Press, pp. 131-152.
298. Picot, L., Ravallec, R., Fouchereau‐Péron, M., Vandanjon, L., Jaouen, P., Chaplain‐Derouiniot, M., ...... & Bergé, J. P. (2010). Impact of ultrafiltration and nanofiltration of an industrial fish protein hydrolysate on its bioactive properties. Journal of the Science of Food and Agriculture, 90(11), 1819-1826.
299. Pires, C., Costa, S., Batista, A. P., Nunes, M. C., Raymundo, A., & Batista, I. (2012). Properties of protein powder prepared from Cape hake by-products. Journal of Food Engineering, 108(2), 268-275.
300. Pivk Kupirovič, U., Miklavec, K., Hribar, M., Kušar, A., Žmitek, K., & Pravst, I. (2019). Nutrient profiling is needed to improve the nutritional quality of the foods labelled with health-related claims. Nutrients, 11(2), 287.
301. Plascencia‐Jatomea, M., Olvera‐Novoa, M. A., Arredondo‐Figueroa, J. L., Hall, G. M., & Shirai, K. (2002). Feasibility of fishmeal replacement by shrimp head silage protein hydrolysate in Nile tilapia (Oreochromis niloticus L) diets. Journal of the Science of Food and Agriculture, 82(7), 753-759.
302. Podrażka, M., Bączyńska, E., Kundys, M., Jeleń, P., & Witkowska Nery, E. (2018). Electronic tongue—a tool for all tastes?. Biosensors, 8(1), 3.
303. Pourkomailian, B. (2000). Sauces and dressings. In: The stability and Shelf-
357 ptimiiation of proaess parameters for eniymatia hydrolysis of tuna red meat protein
References
life of Food (Kilcast, D., & Subramaniam, P. Eds.), Washington DC: CRC Press, 311-331.
304. Qian, Z.J., Jung, W.K., Byun, H.G., & Kim, S.K. (2008). Protective effect of an antioxidative peptide purified from gastrointestinal digests of oyster, Crassostrea gigas against free radical induced DNA damage. Bioresource Technology, 99(9), 3365-3371.
305. Quaglia, G. B., & Orban, E. (1990). Influence of enzymatic hydrolysis on structure and emulsifying properties of sardine (Sardina pilchardus) protein hydrolysates. Journal of Food Science, 55(6), 1571-1573.
306. Raftani Amiri, Z., Safari, R., & Bakhshandeh, T. (2016). Functional properties of fish protein hydrolysates from cuttlefish (Sepia pharaonis) muscle produced by two commercial enzymes. Iranian Journal of Fisheries Sciences, 15(4), 1485-1499.
307. Rajabzadeh, M., Pourashouri, P., Shabanpour, B., & Alishahi, A. (2018). Amino acid composition, antioxidant and functional properties of protein hydrolysates from the roe of rainbow trout (Oncorhynchus mykiss). International Journal of Food Science & Technology, 53(2), 313-319.
308. Rajapakse, N., Mendis, E., Jung, W. K., Je, J. Y., & Kim, S. K. (2005). Purification of a radical scavenging peptide from fermented mussel sauce and its antioxidant properties. Food Research International, 38(2), 175-182.
309. Rajaram, D., & Nazeer, R. A. (2010). Antioxidant properties of protein hydrolysates obtained from marine fishes Lepturacanthus savala and Sphyraena barracuda. International Journal of Biotechnology & Biochemistry, 6(3), 435-445.
310. Rao, Q., & Labuza, T. P. (2012). Effect of moisture content on selected physicochemical properties of two commercial hen egg white powders. Food Chemistry, 132(1), 373-384.
311. Rao, Q., Rocca-Smith, J. R., Schoenfuss, T. C., & Labuza, T. P. (2012). Accelerated shelf-life testing of quality loss for a commercial hydrolysed hen egg white powder. Food Chemistry, 135(2), 464-472.
312. Rao, Q., Klaassen Kamdar, A., & Labuza, T. P. (2016). Storage stability of food protein hydrolysates—a review. Critical Reviews in Food Science and Nutrition, 56(7), 1169-1192.
313. Rashed, A. A., Noh, M. F. M., Khalid, N. M., Rahman, N. I. A. R., Tasirin, A.,
358 ptimiiation of proaess parameters for eniymatia hydrolysis of tuna red meat protein
References
Omar, W. S. W., Nawi, M. N. M., Jamilan, M. A., & Selamat, R. (2017). The nutritional composition of mayonnaise and salad dressing in the Malaysian market. Sains Malaysiana, 46(1), 139-147.
314. Ratnavathi, C. V., & Komala, V. V. (2016). Sorghum Grain Quality. In: Sorghum Biochemistry (Ratnavathi, C. V., Jagannath Patil, & Chavan, U. D. Eds.), Academic Press, pp. 1-61.
315. Re, R., Pellegrini, N., Proteggente, A., Pannala, A., Yang, M., & Rice-Evans, C. (1999). Antioxidant activity applying an improved ABTS radical cation decolorization assay. Free Radical Biology and Medicine, 26, 1231-1237.
316. Refstie, S., Olli, J. J., & Standal, H. (2004). Feed intake, growth, and protein utilisation by post-smolt Atlantic salmon (Salmo salar) in response to graded levels of fish protein hydrolysate in the diet. Aquaculture, 239(1-4), 331-349.
317. Ren, J., Zhao, M., Shi, J., Wang, J., Jiang, Y., Cui, C., Kakuda, Y., & Xue, S. J. (2008a). Optimization of antioxidant peptide production from grass carp sarcoplasmic protein using response surface methodology. LWT-Food Science and Technology, 41(9), 1624-1632.
318. Ren, J., Zhao, M., Shi, J., Wang, J., Jiang, Y., Cui, C., Kakuda, Y., & Xue, S. J. (2008b). Purification and identification of antioxidant peptides from grass carp muscle hydrolysates by consecutive chromatography and electrospray ionization-mass spectrometry. Food Chemistry, 108(2), 727-736.
319. Ritchie, A. H., & Mackie, I. M. (1982). Preparation of fish protein hydrolysates. Animal Feed Science and Technology, 7(2), 125-133.
320. Roos, Y. (1995). Characterization of food polymers using state diagrams. Journal of Food Engineering, 24(3), 339-360.
321. Roslan, J., Yunos, K. F. M., Abdullah, N., & Kamal, S. M. M. (2014). Characterization of fish protein hydrolysate from tilapia (Oreochromis niloticus) by-product. Agriculture and Agricultural Science Procedia, 2, 312-319.
322. Rubio-Rodríguez, N., Beltrán, S., Jaime, I., Sara, M., Sanz, M. T., & Carballido, J. R. (2010). Production of omega-3 polyunsaturated fatty acid concentrates: a review. Innovative Food Science & Emerging Technologies, 11(1), 1-12.
323. Rustad, T. (2003). Utilisation of marine by-products. Electronic Journal of Environmental, Agricultural and Food Chemistry, 2(4), 458-463.
359 ptimiiation of proaess parameters for eniymatia hydrolysis of tuna red meat protein
References
324. Saadi, S., Saari, N., Anwar, F., Hamid, A. A., & Mohd Ghazali, H. (2015). Recent advances in food biopeptides: Production, biological functionalities and therapeutic applications. Biotechnology Advances, 33, 80–116.
325. Safari, R., Motamedzadegan, A., Ovissipour, M., Regenstein, J. M., Gildberg, A., & Rasco, B. (2012). Use of hydrolysates from yellowfin tuna (Thunnus albacares) heads as a complex nitrogen source for lactic acid bacteria. Food and Bioprocess Technology, 5(1), 73-79.
326. Saha, B. C., & Hayashi, K. (2001). Debittering of protein hydrolyzates. Biotechnology Advances, 19(5), 355-370.
327. Saidi, S., Deratani, A., Belleville, M. P., & Amar, R. B. (2014). Antioxidant properties of peptide fractions from tuna dark muscle protein by-product hydrolysate produced by membrane fractionation process. Food Research International, 65, 329-336.
328. Salem, R. B. S. B., Bkhairia, I., Abdelhedi, O., & Nasri, M. (2017). Octopus vulgaris protein hydrolysates: characterization, antioxidant and functional properties. Journal of Food Science and Technology, 54(6), 1442-1454.
329. Samaranayaka, A. G., & Li-Chan, E. C. (2008). Autolysis-assisted production of fish protein hydrolysates with antioxidant properties from Pacific hake (Merluccius productus). Food Chemistry, 107(2), 768-776.
330. Samaranayaka, A. G., & Li-Chan, E. C. (2011). Food-derived peptidic antioxidants: A review of their production, assessment, and potential applications. Journal of Functional Foods, 3(4), 229-254.
331. Sánchez-Zapata, E., Amensour, M., Oliver, R., Navarro, C., Fernández-López, J., Sendra, E., Sayas, E., & Pérez-Alvarez, J. A. (2011). Quality characteristics of dark muscle from yellowfin tuna Thunnus albacares to its potential application in the food industry. Food and Nutrition Sciences, 2(01), 22.
332. Sankarikutty, B., Sreekumar, M. M., Narayanan, C. S., & Mathew, A. G. (1988). Studies on microencapsulation of cardamom oil by spray drying technique. Journal of Food Science and Technology, 25, 352-356.
333. Santos, S. D. A., Martins, V. G., Salas-Mellado, M., & Prentice, C. (2011). Evaluation of functional properties in protein hydrolysates from bluewing searobin (Prionotus punctatus) obtained with different microbial enzymes. Food and Bioprocess Technology, 4(8), 1399-1406.
334. Saputra, D., & Nurhayati, T. (2016). Production of fish hydrolysates
360 ptimiiation of proaess parameters for eniymatia hydrolysis of tuna red meat protein
References
protein from waste of fish carp (Cyprinus Carpio) by enzymatic hydrolysis.ComTech: Computer, Mathematics and Engineering Applications, 7(1), 11-18.
335. Sarmadi, B. H. and Ismail, A. 2010. Anti-oxidative peptides from food proteins: A review. Peptides, 31(10): 1949-1956.
336. Sathe, S. K., & Salunkhe, D. K. (1981). Functional properties of the great northern bean (Phaseolus vulgaris L.) proteins: emulsion, foaming, viscosity, and gelation properties. Journal of Food Science, 46(1), 71-81.
337. Sathivel, S., Bechtel, P. J., Babbitt, J., Smiley, S., Crapo, C., Reppond, K. D., & Prinyawiwatkul, W. (2003). Biochemical and functional properties of herring (Clupea harengus) byproduct hydrolysates. Journal of Food Science, 68(7), 2196-2200.
338. Sathivel, S., Smiley, S., Prinyawiwatkul, W., & Bechtel, P. J. (2005a). Functional and nutritional properties of red salmon (Oncorhynchus nerka) enzymatic hydrolysates. Journal of Food Science, 70(6), c401-c406.
339. Sathivel, S., Bechtel, P. J., Babbitt, J. K., Prinyawiwatkul, W., & Patterson, M. (2005b). Functional, nutritional, and rheological properties of protein powders from arrowtooth flounder and their application in mayonnaise. Journal of Food Science, 70(2), E57-E63.
340. Sathivel, S., Huang, J., & Bechtel, P. J. (2008). Properties of pollock (Theragra chalcogramma) skin hydrolysates and effects on lipid oxidation of skinless pink salmon (Oncorhynchus gorbuscha) fillets during 4 months of frozen storage. Journal of Food Biochemistry, 32(2), 247-263.
341. Sathivel, S., Yin, H., Bechtel, P. J., & King, J. M. (2009). Physical and nutritional properties of catfish roe spray dried protein powder and its application in an emulsion system. Journal of Food Engineering, 95(1), 76-81.
342. Selomulya, C., & Fang, Y. (2013). Food powder rehydration. In: Handbook of Food powders: Processes and Properties. (Bhandari, B., Bansal, N., Zhang, M., & Schuck , P. Eds.), Cambridge UK: Woodhead Publishing Limited, pp. 379 – 408.
343. Seo, W.H., Lee, H.G. & Baek, H.H. (2008). Evaluation of bitterness in enzymatic hydrolysates of soy protein isolate by taste dilution analysis. Journal of Food Science, 73, S41–S46.
344. Sequeira-Munoz, A., Chevalier, D., LeBail, A., Ramaswamy, H. S., &
361 ptimiiation of proaess parameters for eniymatia hydrolysis of tuna red meat protein
References
Simpson, B. K. (2006). Physicochemical changes induced in carp (Cyprinus carpio) fillets by high pressure processing at low temperature. Innovative Food Science & Emerging Technologies, 7(1-2), 13-18.
345. Serfert, Y., Drusch, S., & Schwarz, K. (2009). Chemical stabilisation of oils rich in long-chain polyunsaturated fatty acids during homogenisation, microencapsulation and storage. Food Chemistry, 113(4), 1106-1112.
346. Shahidi, F., Han, X. Q., & Synowiecki, J. (1995). Production and characteristics of protein hydrolysates from capelin (Mallotus villosus). Food Chemistry, 53(3), 285-293.
347. Shahidi, F., & Zhong, Y. (2008). Bioactive peptides. Journal of AOAC International, 91(4), 914-931.
348. Shankar, T. J., Sokhansanj, S., Bandyopadhyay, S., & Bawa, A. S. (2010). A case study on optimization of biomass flow during single-screw extrusion cooking using genetic algorithm (GA) and response surface method (RSM). Food and Bioprocess Technology, 3(4), 498-510.
349. Shantha, N. C., & Decker, E.A. (1994). Rapid, sensitive, iron-based spectrophotometric methods for determination of peroxide value of food lipid. Journal of AOAC International, 772, 421–424.
350. Sharma, A., Jana, A. H., & Chavan, R. S. (2012). Functionality of milk powders and milk‐based powders for end use applications—a review. Comprehensive Reviews in Food Science and Food Safety, 11(5), 518-528.
351. Sheriff, S.A., Sundaram, B., Ramamoorthy, B., & Ponnusamy, P. (2014). Synthesis and in vitro antioxidant functions of protein hydrolysate from backbones of Rastrelliger kanagurta by proteolytic enzymes. Saudi Journal of Biological Sciences, 21(1), 19–26.
352. Shimada, K., Fujikawa, K., Yahara, K., & Nakamura, T. (1992). Antioxidative properties of xanthan on the autoxidation of soybean oil in cyclodextrin emulsion. Journal of Agricultural and Food Chemistry, 40(6), 945-948.
353. Shimizu, M., & Hachimura, S. (2011). Gut as a target for functional food. Trends in Food Science & Technology, 22(12), 646-650.
354. Siala, R., Khabir, A., Lassoued, I., Abdelhedi, O., Elfeki, A., Vallaeys, T., & Nasri, M. (2016). Functional and antioxidant properties of protein hydrolysates from grey triggerfish muscle and in vivo evaluation of hypoglycemic and hypolipidemic activities. Journal of Applied &
362 ptimiiation of proaess parameters for eniymatia hydrolysis of tuna red meat protein
References
Environmental Microbiology, 4(6), 105-119.355. Silva, J. F. X., Ribeiro, K., Silva, J. F., Cahú, T. B., & Bezerra, R. S. (2014).
Utilization of tilapia processing waste for the production of fish protein hydrolysate. Animal Feed Science and Technology, 196, 96-106.
356. Silva, T. C. D., Rocha, J. D., Moreira, P., Signor, A., & Boscolo, W. R. (2017). Fish protein hydrolysate in diets for Nile tilapia post-larvae. Pesquisa Agropecuária Brasileira, 52(7), 485-492.
357. Silvestre, M. P. C. (1997). Review of methods for the analysis of protein hydrolysates. Food Chemistry, 60(2), 263-271.
358. Simpson, B. K. (1989). On the mechanism of enzyme action: digestive proteases from selected marine organisms. Biotechnology and Applied Biochemistry, 11, 226-234.
359. Singh, A. K., Sinha, S., & Singh, K. (2009). Study on β-galactosidase Isolation, Purification and Optimization of Lactose Hydrolysis in Whey for Production of Instant Energy Drink. International Journal of Food Engineering, 5(2).
360. Sinha, R., Radha, C., Prakash, J., & Kaul, P. (2007). Whey protein hydrolysate: Functional properties, nutritional quality and utilization in beverage formulation. Food Chemistry, 101(4), 1484-1491.
361. Sinthusamran, S., Benjakul, S., Kijroongrojana, K., Prodpran, T., & Kishimura, H. (2018). Protein Hydrolysates from Pacific White Shrimp Cephalothorax Manufactured with Different Processes: Compositions, Characteristics and Antioxidative Activity. Waste and Biomass Valorization, 1-14.
362. Siripongvutikorn, S., Usawakesmanee, W., & Hunsakul, K. (2016). Utilization of tuna roe and using inulin as oil replacer for producing value added omega-3 mayonnaise product. Functional Foods in Health and Disease, 6(3), 158-172.
363. Šližytė, R., Daukšas, E., Falch, E., Storrø, I., & Rustad, T. (2005). Characteristics of protein fractions generated from hydrolysed cod (Gadus morhua) by-products. Process Biochemistry, 40(6), 2021-2033.
364. Šližytė, R., Mozuraitytė, R., Martínez-Alvarez, O., Falch, E., Fouchereau-Peron, M., & Rustad, T. (2009). Functional, bioactive and antioxidative properties of hydrolysates obtained from cod (Gadus morhua) backbones. Process Biochemistry, 44(6), 668-677.
363 ptimiiation of proaess parameters for eniymatia hydrolysis of tuna red meat protein
References
365. Slizyte, R., Rommi, K., Mozuraityte, R., Eck, P., Five, K., & Rustad, T. (2016). Bioactivities of fish protein hydrolysates from defatted salmon backbones. Biotechnology Reports, 11, 99-109.
366. Sloan, A. E. (2003). What consumers want--and don’t want--on food and beverage labels. Food Technology, 57, 26–36.
367. Sohn, J. H., Taki, Y., Ushio, H., Kohata, T., Shioya, I., & Ohshima, T. (2005). Lipid oxidations in ordinary and dark muscles of fish: Influences on rancid off‐odor development and color darkening of yellowtail flesh during ice storage. Journal of Food Science, 70(7), s490-s496.
368. Solon, F. S., Sarol Jr, J. N., Bernardo, A. B., Solon, J. A. A., Mehansho, H., Sanchez-Fermin, L. E., Wambangco, L. S., & Juhlin, K. D. (2003). Effect of a multiple-micronutrient-fortified fruit powder beverage on the nutrition status, physical fitness, and cognitive performance of schoolchildren in the Philippines. Food and Nutrition Bulletin, 24(4_suppl_1), S129-S140.
369. Som, C. R., & Radhakrishnan, C. K. (2013). Seasonal variation in the fatty acid composition of Sardinella longiceps and Sardinella fimbriata: Implications for nutrition and pharmaceutical industry. Indian Journal of Geo-Marine Sciences, 42(2), 206-210.
370. Souci, S. W., Fachman, W., & Kraut, H. (2000). Food Composition and Nutrition Tables. 6th Edn., Stuttgart,Germany: Medpharm GmbH Scientific Publishers.
371. Souissi, N., Bougatef, A., Triki-Ellouz, Y., & Nasri, M. (2007). Biochemical and functional properties of sardinella (Sardinella aurita) by-product hydrolysates. Food Technology and Biotechnology, 45(2), 187-194.
372. Sperling, L. H. (2006). Glass-rubber transition behavior. Introduction To Physical Polymer Science, 4, 349-425.
373. Spinelli, J., Koury, B., & Miller, R. (1972). Approaches to the utilization of fish for the preparation of protein isolates: Isolation and properties of myofibrillar and sarcoplasmic fish proteins. Journal of Food Science, 37(4), 599-603.
374. Srikanya, A., Dhanapal, K., Sravani, K., Madhavi, K., Yeshdas, B., & Praveen Kumar, G. (2018). Antioxidant and antimicrobial activity of protein hydrolysate prepared from tilapia fish waste by enzymatic treatment. International Journal of Current Microbiology and Applied Sciences, 7(10), 2891-2899.
364 ptimiiation of proaess parameters for eniymatia hydrolysis of tuna red meat protein
References
375. Sripokar, P., Benjakul, S., & Klomklao, S. (2019). Antioxidant and functional properties of protein hydrolysates obtained from starry triggerfish muscle using trypsin from albacore tuna liver. Biocatalysis and Agricultural Biotechnology, 17, 447-454.
376. Steffe, J. F. (1992). Yield stress: phenomena and measurement. In: Advances in Food Engineering (Singh, R. P., & Wirakaratakusumah, M. A. Eds.), London: CRC Press, pp. 363-376.
377. Stone, H., Bleibaum, R. N. & Thomas, H. A. (2012). Sensory Evaluation Practices. 4th Edn., San Diego: Academic Press.
378. Suh, H. J., Bae, S. H., & Noh, D. O. (2000). Debittering of corn gluten hydrolysate with active carbon. Journal of the Science of Food and Agriculture, 80(5), 614-618.
379. Sumaya‐Martínez, T., Castillo‐Morales, A., Favela‐Torres, E., Huerta‐Ochoa, S., & Prado‐Barragán, L. A. (2005). Fish protein hydrolysates from gold carp (Carassius auratus): I. A study of hydrolysis parameters using response surface methodology. Journal of the Science of Food and Agriculture, 85(1), 98-104.
380. Sultanbawa, Y., & Aksnes, A. (2006). Tuna process waste-an unexploited resource. Infofish International, 3, 37.
381. Suzihaque, M. U. H., Hashib, S. A., & Ibrahim, U. K. (2015). Effect of inlet temperature on pineapple powder and banana milk powder. Procedia-Social and Behavioral Sciences, 195, 2829-2838.
382. Taheri, A., Anvar, S. A. A., Ahari, H., & Fogliano, V. (2013). Comparison the functional properties of protein hydrolysates from poultry by-products and rainbow trout (Onchorhynchus mykiss) viscera. Iranian Journal of Fisheries Sciences, 12(1), 154-169.
383. Taheri, A., Farvin, K. S., Jacobsen, C., & Baron, C. P. (2014). Antioxidant activities and functional properties of protein and peptide fractions isolated from salted herring brine. Food Chemistry, 142, 318-326.
384. Tamura, M., Miyoshi, T., Mori, N., Kinomura, K., Kawaguchi, M., Ishibashi, N., & Okai, H. (1990). Mechanism for the bitter tasting potency of peptides using o-aminoacyl sugars as model compounds+. Agricultural and Biological Chemistry, 54(6), 1401-1409.
385. Tanuja, S., Viji, P., Zynudheen, A. A., & Joshy, C. (2012). Composition, functional properties and antioxidative activity of hydrolysates prepared from
365 ptimiiation of proaess parameters for eniymatia hydrolysis of tuna red meat protein
References
the frame meat of Striped catfish (Pangasianodon hypophthalmus). Egyptian Journal of Biology, 14(1), 27-35.
386. Tarladgis, B. G., Watts, B. M., Younathan, M. T., & Dugan Jr, L. (1960). A distillation method for the quantitative determination of malonaldehyde in rancid foods. Journal of the American Oil Chemists’ Society, 37(1), 44-48.
387. Tavano, O. L. (2013). Protein hydrolysis using proteases: an important tool for food biotechnology. Journal of Molecular Catalysis B: Enzymatic, 90, 1-11.
388. Taylor, W. H. (1957). Formol titration: an evaluation of its various modifications. Analyst, 82(976), 488-498.
389. Tejpal, C. S., Vijayagopal, P., Elavarasan, K., Prabu, D. L., Lekshmi, R. G. K., Asha, K. K., Anandan, R., Chatterjee, N. S., & Mathew, S. (2017). Antioxidant, functional properties and amino acid composition of pepsin-derived protein hydrolysates from whole tilapia waste as influenced by pre-processing ice storage. Journal of Food Science and Technology, 54(13), 4257-4267.
390. Theodore, A. E., Raghavan, S., & Kristinsson, H. G. (2008). Antioxidative activity of protein hydrolysates prepared from alkaline-aided channel catfish protein isolates. Journal of Agricultural and Food Chemistry, 56(16), 7459-7466.
391. Thiansilakul, Y., Benjakul, S., & Shahidi, F. (2007a). Compositions, functional properties and antioxidative activity of protein hydrolysates prepared from round scad (Decapterus maruadsi). Food Chemistry, 103(4), 1385-1394.
392. Thiansilakul, Y., Benjakul, S., & Shahidi, F. (2007b). Antioxidative activity of protein hydrolysate from round scad muscle using alcalase and flavourzyme. Journal of Food Biochemistry, 31(2), 266-287.
393. Thomareisa, A. S., & Chatziantoniou, S. (2011). Evaluation of the consistency of low-fat mayonnaise by squeezing flow viscometry. Procedia Food Science, 1, 1997-2002.
394. Tonon, R. V., Brabet, C., & Hubinger, M. D. (2008). Influence of process conditions on the physicochemical properties of açai (Euterpe oleraceae Mart.) powder produced by spray drying. Journal of Food Engineering, 88(3), 411-418.
395. Townsend, A. A., & Nakai, S. (1983). Relationships between hydrophobicity
366 ptimiiation of proaess parameters for eniymatia hydrolysis of tuna red meat protein
References
and foaming characteristics of food proteins. Journal of Food Science, 48(2), 588-594.
396. U. S. Pharmacopeia (2000). National formulatory (USP 24 NF 19). Rockville, MD.
397. USDA-NASS (U.S. Department of Agriculture -National Agricultural Statistics Service). (2005). Agricultural Statistics. Livestock Data. Arkansas Statistical Office. http://www.nass.usda.gov/ar/bulllvsk.htm.
398. USFDA (2001). Aerobic Plate Count. Bacteriological Analytical Manual, USA: United States Foods and Drugs Administration.
399. Van der Ven, C., Gruppen, H., de Bont, D. B., & Voragen, A. G. (2002). Correlations between biochemical characteristics and foam-forming and-stabilizing ability of whey and casein hydrolysates. Journal of Agricultural and Food Chemistry, 50(10), 2938-2946.
400. Vegarud, G. E., & Langsrud, T. (1989). The level of bitterness and solubility of hydrolysates produced by controlled proteolysis of caseins. Journal of Dairy Research, 56(3), 375-379.
401. Venugopal, V., & Shahidi, F. (1994). Thermostable water dispersions of myofibrillar proteins from Atlantic mackerel (Scomber scombrus). Journal of food science, 59(2), 265-268.
402. Verardo, V., Ferioli, F., Riciputi, Y., Iafelice, G., Marconi, E., & Caboni, M. F. (2009). Evaluation of lipid oxidation in spaghetti pasta enriched with long chain n− 3 polyunsaturated fatty acids under different storage conditions. Food Chemistry, 114(2), 472-477.
403. Walstra, P. (1996). Disperse systems: basic considerations. In: Food Chemistry ( Fennema, O. R. Ed.) 3rd Edn., New York: Marcel Decker, pp. 96-151.
404. Wandrey, C., Bartkowiak, A., & Harding, S.E. (2010). Materials for Encapsulation. In: Encapsulation Technologies for Food Active Ingredients and Food Processing (Zuidam, N. J. & Nedovic, V. A. Eds.), Netherlands, Dordrecht: Springer, pp. 31-100.
405. Wang, Y., Zhu, F., Han, F., & Wang, H. (2008). Purification and characterization of antioxidative peptides from salmon protamine hydrolysate. Journal of Food Biochemistry, 32(5), 654-671.
406. Wang, X., Yu, H., Xing, R., Chen, X., Liu, S., & Li, P. (2017). Optimization of the extraction and stability of antioxidative peptides from mackerel
367 ptimiiation of proaess parameters for eniymatia hydrolysis of tuna red meat protein
References
(Pneumatophorus japonicus) protein. Biomed Research International, 2017.407. Wang, X., Yu, H., Xing, R., Chen, X., Liu, S., & Li, P. (2018). Optimization
of antioxidative peptides from mackerel (Pneumatophorus japonicus) viscera. Peer J, 6, e4373.
408. Wangtueai, S., Siebenhandl-Ehn, S., & Haltrich, D. (2016). Optimization of the preparation of gelatin hydrolysates with antioxidative activity from Lizardfish (Saurida spp.) scales gelatin. Chiang Mai Journal of Science, 43(1), 1122-1133.
409. Wasswa, J., Tang, J., Gu, X. H., & Yuan, X. Q. (2007). Influence of the extent of enzymatic hydrolysis on the functional properties of protein hydrolysate from grass carp (Ctenopharyngodon idella) skin. Food Chemistry, 104(4), 1698-1704.
410. Weiss IV, W. F., Young, T. M., & Roberts, C. J. (2009). Principles, approaches, and challenges for predicting protein aggregation rates and shelf life. Journal of Pharmaceutical Sciences, 98(4), 1246-1277.
411. Wergedahl, H., Liaset, B., Gudbrandsen, O. A., Lied, E., Espe, M., Muna, Z., Mork, S., & Berge, R. K. (2004). Fish protein hydrolysate reduces plasma total cholesterol, increases the proportion of HDL cholesterol, and lowers acyl-CoA: cholesterol acyltransferase activity in liver of Zucker rats. The Journal of Nutrition, 134(6), 1320-1327.
412. WHO/FAO/UNU Expert Consultation. (2007). Protein and amino acid requirements in human nutrition. World Health Organ Tech Rep Ser, 935, 1-265.
413. Wilding, P., Lillford, P. J., & Regenstein, J. M. (1984). Functional properties of proteins in foods. Journal of Chemical Technology and Biotechnology. Biotechnology, 34(3), 182-189.
414. Wiriyaphan, C., Xiao, H., Decker, E. A., & Yongsawatdigul, J. (2015). Chemical and cellular antioxidative properties of threadfin bream (Nemipterus spp.) surimi byproduct hydrolysates fractionated by ultrafiltration. Food Chemistry, 167, 7-15.
415. Wisuthiphaet, N., Kongruang, S., & Chamcheun, C. (2015). Production of fish protein hydrolysates by acid and enzymatic hydrolysis. Journal of Medical and Bioengineering, 4(6).
416. Wisuthiphaet, N., Klinchan, S., & Kongruang, S. (2016). Fish protein hydrolysate production by acid and enzymatic hydrolysis. King Mongkut’s
368 ptimiiation of proaess parameters for eniymatia hydrolysis of tuna red meat protein
References
University of Technology North Bangkok International Journal of Applied Science and Technology, 9(4).
417. Wongsakul, S., Prasertsan, P., Bornscheuer, U. T., & H‐Kittikun, A. (2003). Synthesis of 2‐monoglycerides by alcoholysis of palm oil and tuna oil using immobilized lipases. European Journal of Lipid Science and Technology, 105(2), 68-73.
418. Wu, W. U., Hettiarachchy, N. S., & Qi, M. (1998). Hydrophobicity, solubility, and emulsifying properties of soy protein peptides prepared by papain modification and ultrafiltration. Journal of the American Oil Chemists’ Society, 75(7), 845-850.
419. Wu, Y., Cui, S. W., Tang, J., & Gu, X. (2007). Optimization of extraction process of crude polysaccharides from boat-fruited sterculia seeds by response surface methodology. Food Chemistry, 105(4), 1599-1605.
420. Wu, D., & Sun, D. W. (2013). Colour measurements by computer vision for food quality control-A review. Trends in Food Science & Technology, 29(1), 5-20.
421. Yang, J. I., Ho, H. Y., Chu, Y. J., & Chow, C. J. (2008). Characteristic and antioxidant activity of retorted gelatin hydrolysates from cobia Rachycentron canadum) skin. Food Chemistry, 110(1), 128-136.
422. Yarnpakdee, S., Benjakul, S., Kristinsson, H. G. & Maqsood, S. (2012a). Effect of pretreatment on lipid oxidation and fishy odour development in protein hydrolysates from the muscle of Indian mackerel. Food Chemistry, 135, 2474-2482.
423. Yarnpakdee, S., Benjakul, S., & Kristinsson, H. G. (2012b). Effect of pretreatments on chemical compositions of mince from Nile tilapia (Oreochromis niloticus) and fishy odor development in protein hydrolysate. International Aquatic Research, 4(1), 7.
424. Yarnpakdee, S., Benjakul, S., Nalinanon, S., & Kristinsson, H. G. (2012c). Lipid oxidation and fishy odour development in protein hydrolysate from Nile tilapia (Oreochromis niloticus) muscle as affected by freshness and antioxidants. Food Chemistry, 132(4), 1781-1788.
425. Yarnpakdee, S., Benjakul, S., Penjamras, P., & Kristinsson, H. G. (2014). Chemical compositions and muddy flavour/odour of protein hydrolysate from Nile tilapia and broadhead catfish mince and protein isolate. Food Chemistry, 142, 210-216.
369 ptimiiation of proaess parameters for eniymatia hydrolysis of tuna red meat protein
References
426. Yarnpakdee, S., Benjakul, S., Kristinsson, H. G., & Kishimura, H. (2015). Antioxidant and sensory properties of protein hydrolysate derived from Nile tilapia (Oreochromis niloticus) by one-and two-step hydrolysis. Journal of Food Science and Technology, 52(6), 3336-3349.
427. Yasmin, A., Butt, M. S., Yasin, M., & Qaisrani, T. B. (2015). Compositional analysis of developed whey based fructooligosaccharides supplemented low-calorie drink. Journal of Food Science and Technology, 52(3), 1849-1856.
428. Yin, H., Pu, J., Wan, Y., Xiang, B., Bechtel, P. J., & Sathivel, S. (2010). Rheological and functional properties of catfish skin protein hydrolysates. Journal of Food Science, 75(1), E11-E17.
429. Yoshie-Stark, Y., Wada, Y., Schott, M., & Wäsche, A. (2006). Functional and bioactive properties of rapeseed protein concentrates and sensory analysis of food application with rapeseed protein concentrates. LWT-Food Science and Technology, 39(5), 503-512.
430. You, L., Zhao, M., Cui, C., Zhao, H., & Yang, B. (2009). Effect of degree of hydrolysis on the antioxidant activity of loach (Misgurnus anguillicaudatus) protein hydrolysates. Innovative Food Science & Emerging Technologies, 10(2), 235-240.
431. You, L., Zhao, M., Regenstein, J. M., & Ren, J. (2010a). Purification and identification of antioxidative peptides from loach (Misgurnus anguillicaudatus) protein hydrolysate by consecutive chromatography and electrospray ionization-mass spectrometry. Food Research International, 43(4), 1167-1173.
432. You, L., Zhao, M., Regenstein, J. M., & Ren, J. (2010b). Changes in the antioxidant activity of loach (Misgurnus anguillicaudatus) protein hydrolysates during a simulated gastrointestinal digestion. Food Chemistry, 120(3), 810–816.
433. You, L., Zhao, M., Regenstein, J. M., & Ren, J. (2011). In vitro antioxidant activity and in vivo anti-fatigue effect of loach (Misgurnus anguillicaudatus) peptides prepared by papain digestion. Food Chemistry, 124(1), 188-194.
434. Yu, S. Y., & Tan, L. K. (1990). Acceptability of crackers (‘Keropok’) with fish protein hydrolysate. International Journal of Food Science & Technology, 25(2), 204-208.
435. Zamora, R., & Hidalgo, F. J. (2005). Coordinate contribution of lipid
370 ptimiiation of proaess parameters for eniymatia hydrolysis of tuna red meat protein
References
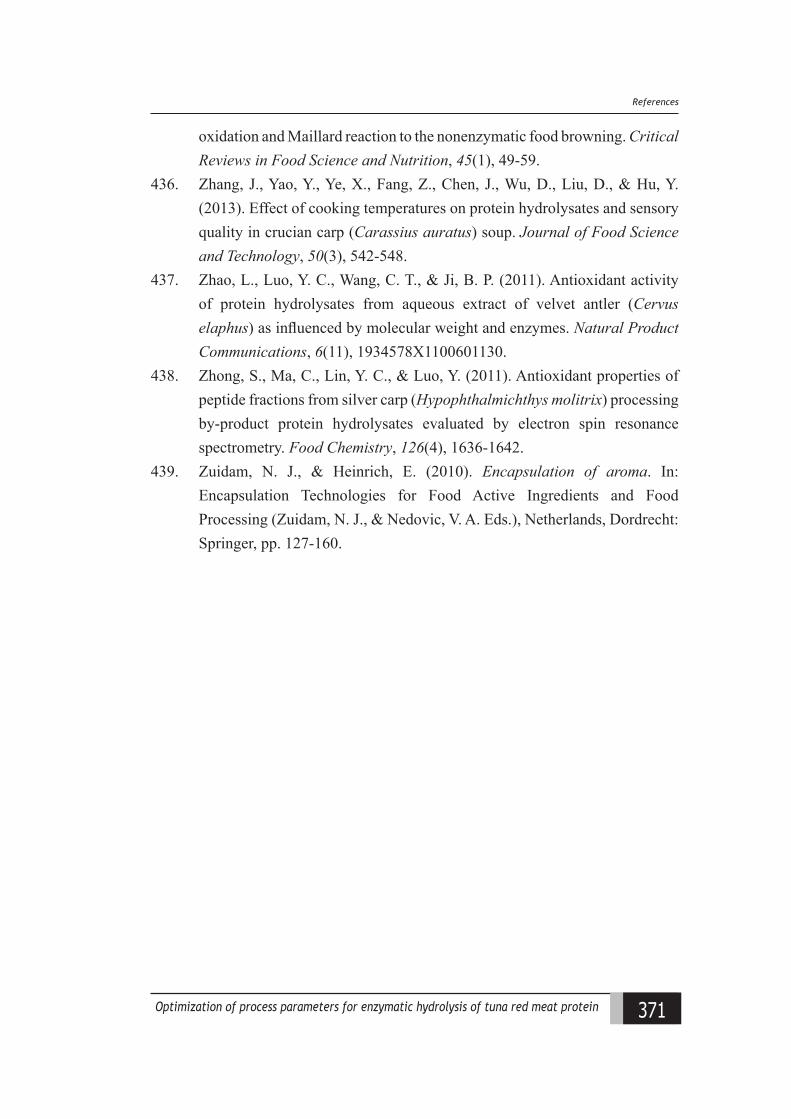
oxidation and Maillard reaction to the nonenzymatic food browning. Critical Reviews in Food Science and Nutrition, 45(1), 49-59.
436. Zhang, J., Yao, Y., Ye, X., Fang, Z., Chen, J., Wu, D., Liu, D., & Hu, Y. (2013). Effect of cooking temperatures on protein hydrolysates and sensory quality in crucian carp (Carassius auratus) soup. Journal of Food Science and Technology, 50(3), 542-548.
437. Zhao, L., Luo, Y. C., Wang, C. T., & Ji, B. P. (2011). Antioxidant activity of protein hydrolysates from aqueous extract of velvet antler (Cervus elaphus) as influenced by molecular weight and enzymes. Natural Product Communications, 6(11), 1934578X1100601130.
438. Zhong, S., Ma, C., Lin, Y. C., & Luo, Y. (2011). Antioxidant properties of peptide fractions from silver carp (Hypophthalmichthys molitrix) processing by-product protein hydrolysates evaluated by electron spin resonance spectrometry. Food Chemistry, 126(4), 1636-1642.
439. Zuidam, N. J., & Heinrich, E. (2010). Encapsulation of aroma. In: Encapsulation Technologies for Food Active Ingredients and Food Processing (Zuidam, N. J., & Nedovic, V. A. Eds.), Netherlands, Dordrecht: Springer, pp. 127-160.
371 ptimiiation of proaess parameters for eniymatia hydrolysis of tuna red meat protein
References

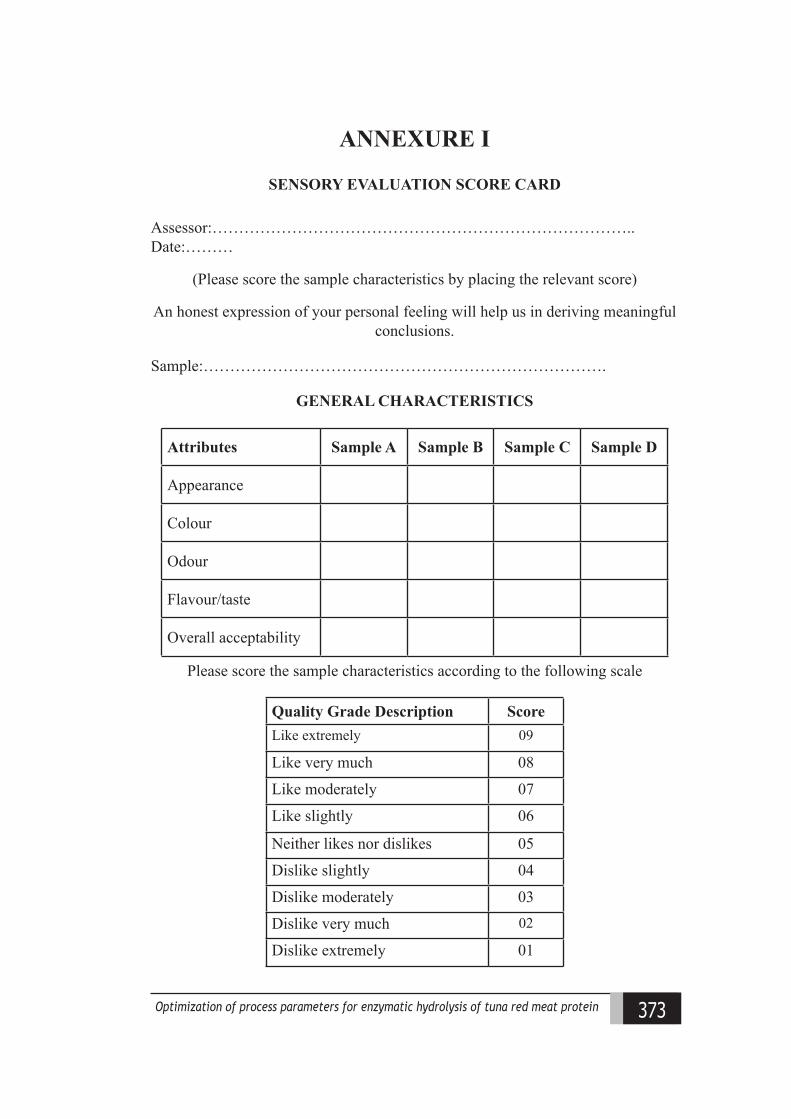
ANNEXURE I
SENSORY EVALUATION SCORE CARD
Assessor:……………………………………………………………………..Date:………
(Please score the sample characteristics by placing the relevant score)
An honest expression of your personal feeling will help us in deriving meaningful conclusions.
Sample:………………………………………………………………….
GENERAL CHARACTERISTICS
Attributes Sample A Sample B Sample C Sample D
Appearance
Colour
Odour
Flavour/taste
Overall acceptability
Please score the sample characteristics according to the following scale
Quality Grade Description ScoreLike extremely 09
Like very much 08
Like moderately 07
Like slightly 06
Neither likes nor dislikes 05
Dislike slightly 04
Dislike moderately 03
Dislike very much 02
Dislike extremely 01
373 ptimiiation of proaess parameters for eniymatia hydrolysis of tuna red meat protein

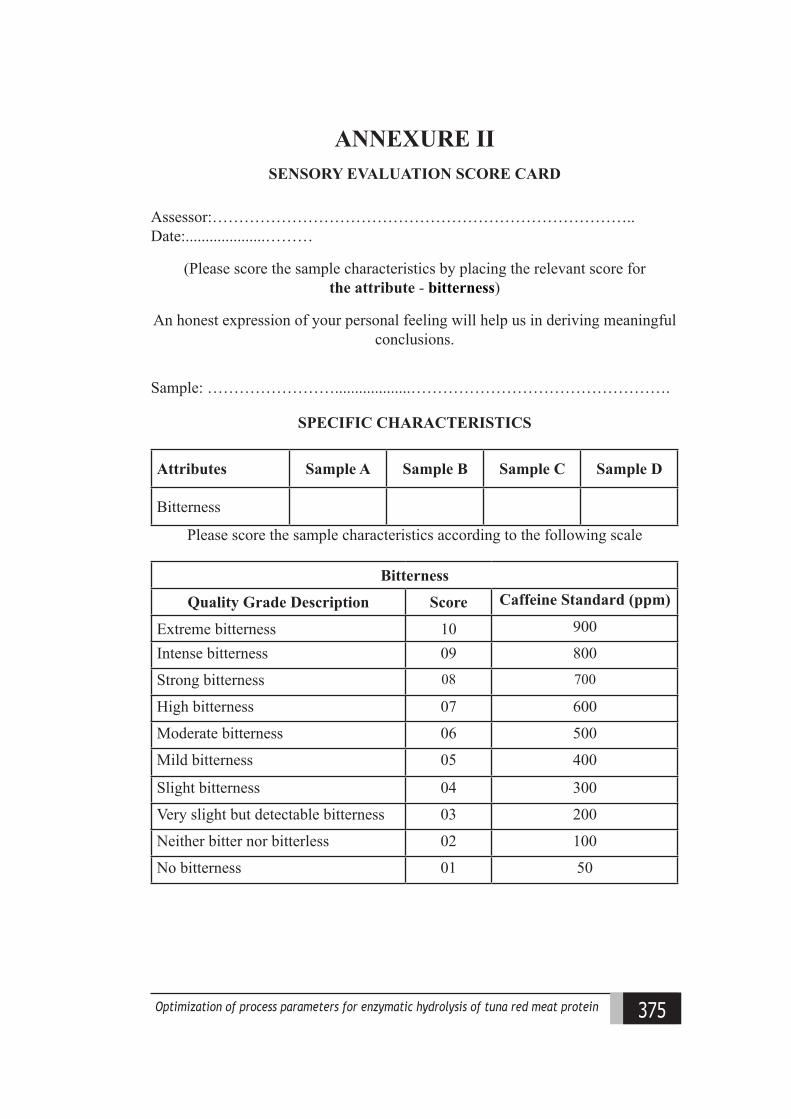
ANNEXURE IISENSORY EVALUATION SCORE CARD
Assessor:……………………………………………………………………..Date:....................………
(Please score the sample characteristics by placing the relevant score for the attribute - bitterness)
An honest expression of your personal feeling will help us in deriving meaningful conclusions.
Sample: ……………………...................………………………………………….
SPECIFIC CHARACTERISTICS
Attributes Sample A Sample B Sample C Sample D
Bitterness
Please score the sample characteristics according to the following scale
Bitterness
Quality Grade Description Score Caffeine Standard (ppm)
Extreme bitterness 10 900
Intense bitterness 09 800
Strong bitterness 08 700
High bitterness 07 600
Moderate bitterness 06 500
Mild bitterness 05 400
Slight bitterness 04 300
Very slight but detectable bitterness 03 200
Neither bitter nor bitterless 02 100
No bitterness 01 50
375 ptimiiation of proaess parameters for eniymatia hydrolysis of tuna red meat protein

ANNEXURE IIISENSORY EVALUATION SCORE CARD
Assessor:…………………………………............…………………………………..Date:…….................…
(Please score the sample characteristics by placing the relevant score)
An honest expression of your personal feeling will help us in deriving meaningful conclusions.
Sample:……………………………..................…………………………………….
GENERAL CHARACTERISTICS
Attributes Sample A Sample B Sample C Sample D
Appearance
Colour
Odour
Flavour
Texture
Overall acceptability
Please score the sample characteristics according to the following scale
Quality Grade Description ScoreLike extremely 09
Like very much 08
Like moderately 07
Like slightly 06
Neither likes nor dislikes 05
Dislike slightly 04
Dislike moderately 03
Dislike very much 02
Dislike extremely 01
377 ptimiiation of proaess parameters for eniymatia hydrolysis of tuna red meat protein

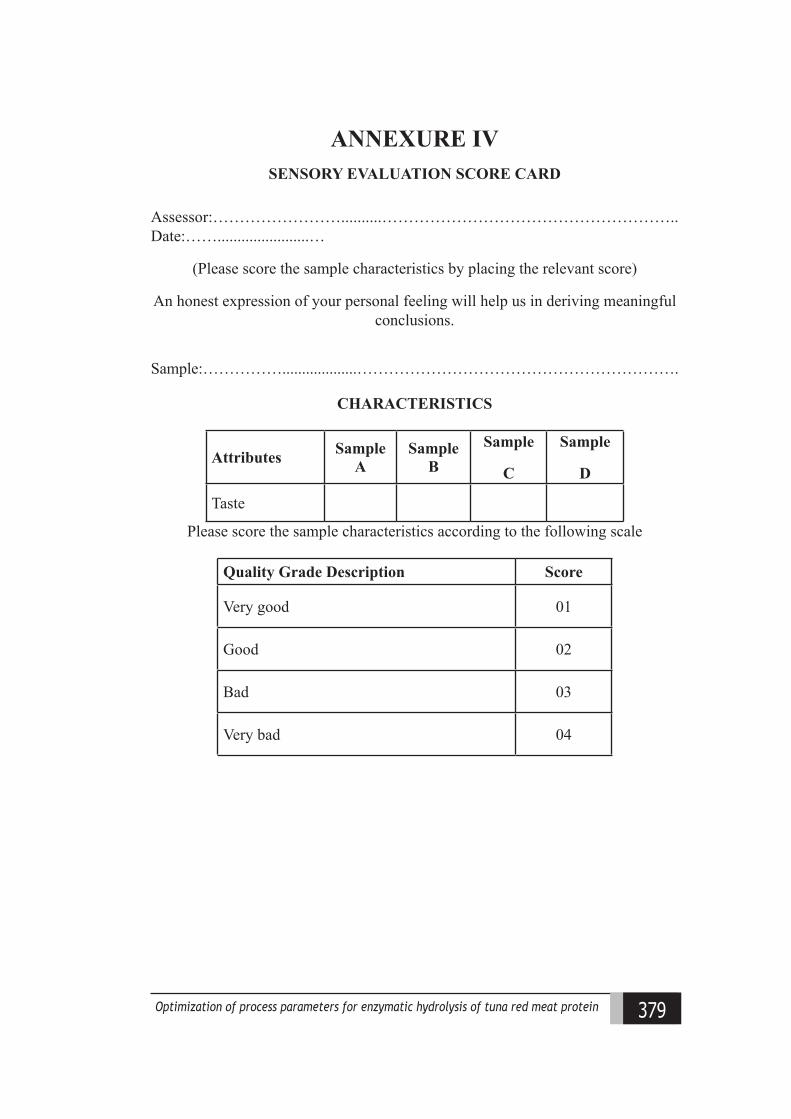
ANNEXURE IVSENSORY EVALUATION SCORE CARD
Assessor:……………………..........………………………………………………..Date:…….......................…
(Please score the sample characteristics by placing the relevant score)
An honest expression of your personal feeling will help us in deriving meaningful conclusions.
Sample:……………...................…………………………………………………….
CHARACTERISTICS
Attributes Sample A
Sample B
Sample
C
Sample
D
Taste
Please score the sample characteristics according to the following scale
Quality Grade Description Score
Very good 01
Good 02
Bad 03
Very bad 04
379 ptimiiation of proaess parameters for eniymatia hydrolysis of tuna red meat protein

380 Optimization of process parameters for enzymatic hydrolysis of tuna red meat protein
Chapter 10
381Optimization of process parameters for enzymatic hydrolysis of tuna red meat protein
Rummary
Publications and Award
Research articles
• Parvathy, U., Binsi P.K., Madhurima Anant Jadhav, Visnuvinayagam, S., P. Muhamed Ashraf, George Ninan and Zynudheen A.A. (2019). Protein hydrolysate from yellowfin tuna red meat as fortifying and stabilizing agent in mayonnaise. Journal of Food Science and Technology, https://doi.org/10.1007/s13197-019-04069-x
• Parvathy, U., Binsi, P.K., Jeyakumari, A., George Ninan, Zynudheen, A.A. and Ravishankar, C.N. (2019). Tuna red meat hydrolysate as core and wall polymer for fish oil encapsulation: a comparative analysis. Journal of Food Science and Technology, 1-13.
• Parvathy, U., Binsi, P.K., Joshy, C.G., Jeyakumari, A., Zynudheen, A.A., George Ninan and Ravishankar, C.N. (2019). Selective Extraction of Surface-active and Antioxidant Hydrolysates from Yellowfin Tuna Red Meat Protein using Papain by Response Surface Methodology. The Indian Journal of Nutrition and Dietetics, [S.l.]: 10-25.
• Parvathy, U., Binsi, P.K., Zynudheen, A.A., George Ninan and Murthy, L.N. (2018). Peptides from white and red meat of yellowfin tuna (Thunnus albacares): A comparative evaluation. Indian Journal of Fisheries, 65(3): 74-83.
• Parvathy, U., Binsi, P.K., Joshy, C.G., Jeyakumari, A., Zynudheen, A.A., George Ninan and Ravishankar, C.N. (2018). Functional Hydrolysates from Yellow Fin Tuna Red Meat Using RSM Based Optimization. International Journal of Current Microbiology and Applied Sciences, 7(11): 1462-1474.
Popular articles
• Parvathy, U., Binsi P.K., George Ninan and Zynudheen A.A. (2019). Marine peptides: Application potentials in food and nutraceutical sector. Beverage and Food World, 46(6): 37-38.
Pulliaations and Award

382 Optimization of process parameters for enzymatic hydrolysis of tuna red meat protein
Chapter 10
383Optimization of process parameters for enzymatic hydrolysis of tuna red meat protein
Rummary
• Parvathy, U., Binsi, P.K., Zynudheen, A.A. and George Ninan (2018). Utilization of yellowfin tuna protein hydrolysate in health beverage formulation. FishTech Reporter, 4 (1), January-June: 19-20.
• Parvathy, U., Binsi, P.K., Jeyakumari, A., George Ninan, Zynudheen, A.A. and Ravishankar, C.N. (2018). Fish Protein Hydrolysates: A potential additive in foods. Aquastar, August: 31-35.
• Jeyakumari, A., Parvathy, U., Murthy, L.N. and Visnuvinayagam, S. (2017). Fish protein hydrolysate: Properties and Application. Beverage and Food World, 44(2): 40-42.
Abstracts
• Parvathy, U., Binsi, P.K., Madhurima Anant Jadhav, George Ninan and Zynudheen, A.,A. (2018). Tuna protein hydrolysate as fortifying and stabilizing agent in mayonnaise. Book of Abstracts: Swadeshi Science Congress, Thiruvananthapuram, 7-9th November, 2018, p 85.
• Parvathy, U., Binsi, P.K., Joshy, C.G., Zynudheen, A.A., George Ninan and Ravishankar, C.N. (2017). Enzymatic hydrolysis for the selective extraction of surface active and antioxidant hydrolysates from yellowfin tuna red meat: Optimization using RSM. Book of Abstracts: 11th IFAF, 21-24th November, Cochin, 2017, p 342.
• Parvathy, U., Binsi, P.K., Jeyakumari, A., George Ninan, Zynudheen, A.,A. and Ravishankar, C. N. (2017). Protein hydrolysate from yellowfin tuna (Thunnus albacares) red meat for oxidative and structural stabilization of microencapsulated fish oil. Book of Abstracts: 11th IFAF, 21-24th November, Cochin, 2017, p 519-520.
Brochures
• Parvathy, U. (2019). TunaPro. In: ICAR-CIFT Aquaceuticals• Parvathy, U. (2019). NutriMayo. In: ICAR-CIFT Aquaceuticals• Parvathy, U. (2019). OmegaPro Nutrimix. In: ICAR-CIFT Aquaceuticals• Parvathy, U. (2019). HealthPro+. In: ICAR-CIFT Aquaceuticals • Parvathy, U., Jeyakumari, Murthy, L.N. and Visnuvinayagam, S. (2017).
Fish protein hydrolysate ( In: English, Hindi and Marathi)
Pulliaations and Award

384 Optimization of process parameters for enzymatic hydrolysis of tuna red meat protein
Chapter 10Pulliaations and Award
385Optimization of process parameters for enzymatic hydrolysis of tuna red meat protein
RummaryPulliaations and Award
Award
• Received the ‘Young Scientist Award’ for the paper entitled ‘Protein hydrolysate from yellowfin tuna (Thunnus albacares) red meat for oxidative and structural stabilization of microencapsulated fish oil by Parvathy U., Binsi P.K., Jeyakumari A., George Ninan, Zynudheen A.A. and C. N. Ravishankar in the 11th Indian fisheries and aquaculture forum on fostering innovations in fisheries and aquaculture during 21-24th November, 2017 organised by Asian Fisheries Society, Indian branch.
Related Documents