Citation: García Arteaga, V.; Demand, V.; Kern, K.; Strube, A.; Szardenings, M.; Muranyi, I.; Eisner, P.; Schweiggert-Weisz, U. Enzymatic Hydrolysis and Fermentation of Pea Protein Isolate and Its Effects on Antigenic Proteins, Functional Properties, and Sensory Profile. Foods 2022, 11, 118. https://doi.org/ 10.3390/foods11010118 Academic Editors: Nanju Alice Lee, Michelle Colgrave and Andreas L. Lopata Received: 16 November 2021 Accepted: 30 December 2021 Published: 4 January 2022 Publisher’s Note: MDPI stays neutral with regard to jurisdictional claims in published maps and institutional affil- iations. Copyright: © 2022 by the authors. Licensee MDPI, Basel, Switzerland. This article is an open access article distributed under the terms and conditions of the Creative Commons Attribution (CC BY) license (https:// creativecommons.org/licenses/by/ 4.0/). foods Article Enzymatic Hydrolysis and Fermentation of Pea Protein Isolate and Its Effects on Antigenic Proteins, Functional Properties, and Sensory Profile Verónica García Arteaga 1,2 , Victoria Demand 1 , Karolin Kern 3 , Andrea Strube 1 , Michael Szardenings 3 , Isabel Muranyi 1 , Peter Eisner 1,4,5 and Ute Schweiggert-Weisz 1,6, * 1 Fraunhofer Institute for Process Engineering and Packaging IVV, 85354 Freising, Germany; [email protected] (V.G.A.); [email protected] (V.D.); [email protected] (A.S.); [email protected] (I.M.); [email protected] (P.E.) 2 Center of Life and Food Sciences Weihenstephan, Technical University of Munich, 85354 Freising, Germany 3 Fraunhofer Institute for Cell Therapy and Immunology IZI, 04103 Leipzig, Germany; [email protected] (K.K.); [email protected] (M.S.) 4 ZIEL—Institute for Food & Health, Technical University of Munich, 85354 Freising, Germany 5 Steinbeis-Hochschule, School of Technology and Engineering, 12489 Berlin, Germany 6 Institute for Nutritional and Food Sciences, University of Bonn, 53115 Bonn, Germany * Correspondence: [email protected] or [email protected];Tel.: +49-228-733721 Abstract: Combinations of enzymatic hydrolysis using different proteolytic enzymes (papain, Esperase ® , trypsin) and lactic fermentation with Lactobacillus plantarum were used to alter potential pea allergens, the functional properties and sensory profile of pea protein isolate (PPI). The order in which the treatments were performed had a major impact on the changes in the properties of the pea protein isolate; the highest changes were seen with the combination of fermentation followed by enzymatic hydrolysis. SDS-PAGE, gel filtration, and ELISA results showed changes in the protein molecular weight and a reduced immunogenicity of treated samples. Treated samples showed significantly increased protein solubility at pH 4.5 (31.19–66.55%) and at pH 7.0 (47.37–74.95%), compared to the untreated PPI (6.98% and 40.26%, respectively). The foaming capacity was significantly increased (1190–2575%) compared to the untreated PPI (840%). The treated PPI showed reduced pea character- istic off-flavors, where only the treatment with Esperase ® significantly increased the bitterness. The results from this study suggest that the combination of enzymatic hydrolysis and lactic fermentation is a promising method to be used in the food industry to produce pea protein ingredients with higher functionality and a highly neutral taste. A reduced detection signal of polyclonal rabbit anti-pea-antibodies against the processed protein preparations in ELISA furthermore might indicate a decreased immunological reaction after consumption. Keywords: pea protein isolate; lactic fermentation; Lactobacillus plantarum; enzymatic hydrolysis; functional properties; protein solubility; pea allergens; sensory properties; bitterness 1. Introduction Peas (Pisum sativum L.) are increasingly used due to their sustainable production [1], economic benefits [2], high protein content (15–30%), and alleged low allergenicity. They belong to the legume family (Fabaceae) and their proteins are classified as salt-, water-, and ethanol soluble, corresponding to globulins, albumins, and prolamins, respectively [3]. Peas are not on the list of main allergens and do not need to be declared as allergenic in food products; however, two allergenic protein fractions from the storage proteins have been identified [4] and are recognized by the International Committee of Allergen Nomenclature as main pea globulin allergens. The allergen Pis s1 correspond to the mature vicilin (47–50 kDa) as well as to one of vicilin’s proteolytic fractions (32 kDa). The Pis s2 correspond to convicilin (67–70 kDa). The ability of allergen proteins (antigen) to cause Foods 2022, 11, 118. https://doi.org/10.3390/foods11010118 https://www.mdpi.com/journal/foods

Welcome message from author
This document is posted to help you gain knowledge. Please leave a comment to let me know what you think about it! Share it to your friends and learn new things together.
Transcript
�����������������
Citation: García Arteaga, V.;
Demand, V.; Kern, K.; Strube, A.;
Szardenings, M.; Muranyi, I.; Eisner,
P.; Schweiggert-Weisz, U. Enzymatic
Hydrolysis and Fermentation of Pea
Protein Isolate and Its Effects on
Antigenic Proteins, Functional
Properties, and Sensory Profile. Foods
2022, 11, 118. https://doi.org/
10.3390/foods11010118
Academic Editors: Nanju Alice Lee,
Michelle Colgrave and Andreas
L. Lopata
Received: 16 November 2021
Accepted: 30 December 2021
Published: 4 January 2022
Publisher’s Note: MDPI stays neutral
with regard to jurisdictional claims in
published maps and institutional affil-
iations.
Copyright: © 2022 by the authors.
Licensee MDPI, Basel, Switzerland.
This article is an open access article
distributed under the terms and
conditions of the Creative Commons
Attribution (CC BY) license (https://
creativecommons.org/licenses/by/
4.0/).
foods
Article
Enzymatic Hydrolysis and Fermentation of Pea Protein Isolateand Its Effects on Antigenic Proteins, Functional Properties,and Sensory ProfileVerónica García Arteaga 1,2 , Victoria Demand 1, Karolin Kern 3 , Andrea Strube 1, Michael Szardenings 3,Isabel Muranyi 1, Peter Eisner 1,4,5 and Ute Schweiggert-Weisz 1,6,*
1 Fraunhofer Institute for Process Engineering and Packaging IVV, 85354 Freising, Germany;[email protected] (V.G.A.); [email protected] (V.D.); [email protected] (A.S.);[email protected] (I.M.); [email protected] (P.E.)
2 Center of Life and Food Sciences Weihenstephan, Technical University of Munich, 85354 Freising, Germany3 Fraunhofer Institute for Cell Therapy and Immunology IZI, 04103 Leipzig, Germany;
[email protected] (K.K.); [email protected] (M.S.)4 ZIEL—Institute for Food & Health, Technical University of Munich, 85354 Freising, Germany5 Steinbeis-Hochschule, School of Technology and Engineering, 12489 Berlin, Germany6 Institute for Nutritional and Food Sciences, University of Bonn, 53115 Bonn, Germany* Correspondence: [email protected] or [email protected]; Tel.: +49-228-733721
Abstract: Combinations of enzymatic hydrolysis using different proteolytic enzymes (papain, Esperase®,trypsin) and lactic fermentation with Lactobacillus plantarum were used to alter potential pea allergens,the functional properties and sensory profile of pea protein isolate (PPI). The order in which thetreatments were performed had a major impact on the changes in the properties of the pea proteinisolate; the highest changes were seen with the combination of fermentation followed by enzymatichydrolysis. SDS-PAGE, gel filtration, and ELISA results showed changes in the protein molecularweight and a reduced immunogenicity of treated samples. Treated samples showed significantlyincreased protein solubility at pH 4.5 (31.19–66.55%) and at pH 7.0 (47.37–74.95%), compared to theuntreated PPI (6.98% and 40.26%, respectively). The foaming capacity was significantly increased(1190–2575%) compared to the untreated PPI (840%). The treated PPI showed reduced pea character-istic off-flavors, where only the treatment with Esperase® significantly increased the bitterness. Theresults from this study suggest that the combination of enzymatic hydrolysis and lactic fermentationis a promising method to be used in the food industry to produce pea protein ingredients withhigher functionality and a highly neutral taste. A reduced detection signal of polyclonal rabbitanti-pea-antibodies against the processed protein preparations in ELISA furthermore might indicatea decreased immunological reaction after consumption.
Keywords: pea protein isolate; lactic fermentation; Lactobacillus plantarum; enzymatic hydrolysis;functional properties; protein solubility; pea allergens; sensory properties; bitterness
1. Introduction
Peas (Pisum sativum L.) are increasingly used due to their sustainable production [1],economic benefits [2], high protein content (15–30%), and alleged low allergenicity. Theybelong to the legume family (Fabaceae) and their proteins are classified as salt-, water-, andethanol soluble, corresponding to globulins, albumins, and prolamins, respectively [3].
Peas are not on the list of main allergens and do not need to be declared as allergenicin food products; however, two allergenic protein fractions from the storage proteinshave been identified [4] and are recognized by the International Committee of AllergenNomenclature as main pea globulin allergens. The allergen Pis s1 correspond to the maturevicilin (47–50 kDa) as well as to one of vicilin’s proteolytic fractions (32 kDa). The Pis s2correspond to convicilin (67–70 kDa). The ability of allergen proteins (antigen) to cause
Foods 2022, 11, 118. https://doi.org/10.3390/foods11010118 https://www.mdpi.com/journal/foods
Foods 2022, 11, 118 2 of 18
an immune response (immunogenicity) depends on different factors, such as the antigendose, exposure, and host genetic background [5], and thus, their ability to cause allergicreactions [6]. Moreover, pea allergens have shown homology between epitopes (recognitionsites) from other legume allergens [7] and serological cross-reactivity has been proved [4,8,9].Different methods to modify food allergens and their impact on food allergenicity havebeen reviewed [10].
Enzymatic hydrolysis is one of the most common methods used for this purpose andhas been proven effective in allergen degradation of different legumes [11–13]. Modifi-cation of pea allergens by enzymatic treatment has been studied to a lesser extent. Peaprotein isolate (PPI) treated with trypsin [14], Alcalase [15], flavourzyme, papain, andpepsin [16] have shown a reduced immunogenicity by means of ELISA methods. Fraczek,Kostyra [14] found that a higher degree of hydrolysis resulted in a higher reduction inimmunogenic potential. Moreover, changes in the molecular weight distribution of proteinsare also known to affect functional and sensory properties. Partial hydrolysis was shown toincrease protein solubility and emulsifying capacity; however, further hydrolysis reducedboth [17–19]. Depending on the composition, the low molecular weight peptides formedduring enzymatic hydrolysis can promote a bitter taste. The mechanism is not yet fullyunderstood but mainly hydrophobic amino acid residues appear responsible [20].
For debittering of protein hydrolysates, fermentation has been widely studied [21–25].Lactic acid bacteria reduced the bitterness of hydrolysates by releasing aminopeptidasescleaving hydrophobic amino acid residues [23]. There are several studies focusing onchanges in the aroma profile of fermented pea, pea proteins, and pea products [26–28];however, to our knowledge, there are no studies focusing on the debittering of pea proteinhydrolysates by lactic fermentation.
The effects of fermentation on the functional properties have been studied for differentlegumes [21,29,30], and, to a lesser extent, for peas [31–33]. Moreover and to our knowledge,only one study has investigated the effects of fermentation on the antigenicity of peaflour [34].
The combination of enzymatic hydrolysis and microbial fermentation seems verypromising for the production of low-allergenic and tasty functional food ingredients. Acombination has been investigated for soy [22] and lupin protein isolate [35,36], but not yetfor pea. For this reason, this study aimed to investigate the effects of combining enzymatichydrolysis and fermentation on allergenic proteins (Pis s1 and Pis s2), as measured bySDS-PAGE and the ability of polyclonal sera to recognize antigens, functional propertiesand on the debittering and characteristic off-flavors of pea proteins. According to previousfindings, papain, Esperase®, trypsin and Lactobacillus plantarum were selected for enzy-matic hydrolysis [18] and fermentation [33], respectively. The specificity of an enzyme isdetermined by the arrangement of amino acids within the active site and the structureof the substrates. The acidification during fermentation could cause protein aggregationhiding protein parts from binding with the enzyme active site. Therefore, two sequences ofthe reactions, enzymatic treatment and fermentation, were investigated as the order of themethod combination might be relevant for changes in the molecular weight distributionof the hydrolysates, functional properties and taste. Moreover, the treatments and theorder of the method combination might also change the epitope binding sites and thus, theimmunogenicity of pea allergenic proteins.
2. Materials and Methods2.1. Materials
Pea seeds (Pisum sativum L., cultivar Navarro) were provided by NorddeutschePflanzenzucht Hans-Georg-Lembke KG (Holtsee, Germany). Trypsin and Esperase® 8.0 Lwere obtained from Sigma-Aldrich (Munich, Germany). Papain was from Carl Roth GmbH(Karlsruhe, Germany). L. plantarum (DSM 20174) was purchased from the German collec-tion of microorganisms and cell cultures (Deutsche Sammlung von Mikroorganismen undZellkulturen, Germany). Broad Range™ Unstained Protein Standard, 4–20% Criterion™

Foods 2022, 11, 118 3 of 18
TGX stain-free™ precast polyacrylamide gels, Coomassie Brilliant Blue R-250 were fromBio-Rad Laboratories GmbH (Feldkirchen, Germany). Sodium dihydrogen phosphate,sodium dodecyl sulfate, sodium tetraborate decahydrate, o-phthaldialdehyde, and sodiummonohydrogen phosphate were purchased from Sigma-Aldrich (Munich, Germany). Allchemicals used in this study were of analytical grade unless otherwise indicated.
2.2. Production of Pea Protein Isolate
Pea flour was prepared by dehulling, splitting and impact-milling pea seeds as de-scribed by García Arteaga, Leffler [33]. The pea protein isolation was performed accordingto García Arteaga, Apéstegui Guardia [18]. Briefly, an alkaline protein extract (pH 8.0)was adjusted to pH 4.5 for protein isoelectric precipitation. The precipitated proteins wereneutralized, pasteurized (70 ± 2 ◦C) for 2 min and spray-dried.
2.3. Pea Protein Isolate Modification
The PPI was treated by enzymatic treatment, microbial fermentation or a combinationof both. Table 1 shows the specific conditions for the enzyme preparations and microbialstrain. The combination experiments were carried out as follows: enzymatic hydrolysiswith the individual enzyme preparations followed by fermentation (HyF), and fermentationfollowed by hydrolysis (FdH), and are presented in Table 2. A 9% (w/w) PPI dispersion inDI water was homogenized using an Ultra-Turrax (IKA® Werke GmbH & Co KG, Staufen,Germany) for 90 s at 11,000 rpm and pasteurized at 80 ◦C for 10 min. The pH and tempera-ture were adjusted to the optimal conditions (Table 1) prior to the addition of enzymes or ofL. plantarum in each treatment. The pH was adjusted using 3.0 mol/L hydrochloric acid or3.0 mol/L sodium hydroxide. Inactivation of enzymes or microorganisms was performedat 90 ◦C for 10 min before proceeding to the next treatment or finalizing the experiment.The denatured enzyme and the inactivated microbial cells were not removed from thesamples. The final samples were neutralized (pH 7.0) at room temperature, lyophilizedand grinded for 10 s at 7500 rpm (Grindomix GM200, Retsch GmbH, Haan, Germany). Anuntreated PPI dispersion was used as reference. Samples of each treatment were preparedin duplicate.
Table 1. Optimal conditions of commercial enzyme preparations and microorganism.
Enzyme/Microorganism Amount Temp. (◦C) pH Value (-) Activity Origin
Papain 0.1% E/S 65 7 Cysteine Endoprotease Papaya latexEsperase® 8.0 L 0.5% E/S 65 8 Serine Endoprotease Bacillus sp.
Trypsin 0.1% E/S 50 8 Serine Endoprotease Bovine pancreasLactobacillus plantarum 7 Log CFU/mL 30 6.5 Anaerobe Pickled cabbage
E/S: enzyme/substrate ratio; Temp: temperature.
Table 2. Treatment sample code.
Sample Code Treatment 1 Treatment 2
Untreated PPI - -Fermented PPI L. plantarum -
P_Hy Papain -P_HyF Papain L. plantarumP_FdH L. plantarum PapainE_Hy Esperase® -
E_HyF Esperase® L. plantarumE_FdH L. plantarum Esperase®
T_Hy Trypsin -T_HyF Trypsin L. plantarumT_FdH L. plantarum Trypsin
Foods 2022, 11, 118 4 of 18
2.3.1. FermentationGrowth and Culture Conditions
To optimally cultivate L. plantarum strains, a late exponential growth phase was chosen.Briefly, a 200-µL aliquot of L. plantarum in MRS (De Man, Rogosa, and Sharpe) coveredwith 50 µL sterile paraffin oil was incubated using a microplate reader (Synergy HTX,BioTek Instruments GmbH, Waldbronn, Germany). The OD was measured every 15 min ata wavelength of 600 nm. The exponential phase lasted approximately from the 11 h untilthe 24 h since beginning of fermentation; thus, a late exponential phase was selected at 18 hto obtain inocula of L. plantarum.
Determination of Viable Cell Counts for Inoculum and after Fermentation
The L. plantarum was incubated in MRS-broth for 18 h at 30 ◦C under anaerobicconditions. Serial dilutions were used for the determination of viable bacteria cell andOD measurements to select the OD corresponding to a viable cell count of a 7-log colonyforming units per milliliter per sample (CFU/mL). The OD 0.1 was used as reference forliquid cultured aliquots before each fermentation. The log CFU/mL of fermented sampleswere determined at the beginning and the end of the fermentation on MRS agar from100 µL of diluted sample.
Fermentation of PPI Dispersions
The pasteurized PPI dispersions or inactivated PPI hydrolysates were transferred intosterile 2-L Schott flasks. Prior to inoculation, the solutions were adjusted to pH 6.5 andcooled down to 30 ◦C before 0.5% (w/v) glucose was added. The aliquot taken for CFUdetermination represented the initial viable cell number t = 0 h after 10 min inoculation.The flasks were flushed with nitrogen to achieve anaerobic conditions and the fermentationwas carried out for 24 h without stirring. The pH was assessed after 24 h. After inactivation,the HyF samples were cooled to room temperature, neutralized, and lyophilized. For theFdH samples, the inactivated fermented solutions were adjusted to the optimal conditionsof each enzyme.
2.3.2. Enzymatic Hydrolysis
The pasteurized PPI dispersions or inactivated fermented PPI were transferred tothermostatically controlled stainless-steel reactors and the optimal conditions for eachenzyme were set. The enzyme to substrate ratio was calculated based on the proteincontent. The hydrolysis was carried out for 2 h with constant stirring (80 rpm) usingan agitator (R50-20D, Phoenix Instruments GmbH, Garbsen, Germany) and maintainingoptimal conditions. After inactivation, the HyF samples were cooled and adjusted to theoptimal conditions for fermentation. The FdH samples were cooled to room temperature,neutralized, and lyophilized. The sample codes are shown in Table 2.
2.4. Chemical Composition
The dry matter content (105 ◦C), ash content (950 ◦C) and protein content (N × 6.25)were analyzed according to AOAC Official Methods [37,38] by means of a thermogravimet-ric method (TGA 701, Leco Instruments, Germany) and the Dumas combustion method(TruMac N, Leco Instruments, Mönchengladbach, Germany), respectively.
2.5. Determination of Protein Degradation2.5.1. Molecular Weight Distribution
The molecular weight distribution was analyzed by sodium dodecyl sulfate polyacry-lamide gel electrophoresis (SDS-PAGE) according to Laemmli [39] with slight modificationsand as described in detail in García Arteaga, Apéstegui Guardia [18]. Briefly, 5 µg/µLprotein solution (based on dry matter) was prepared in 1× reducing buffer (50% (v/v)2× Tris-HCl reducing buffer, 50% (v/v) phosphate buffer (pH 7)). The samples were heated(95 ◦C, 5 min) prior to centrifugation at 12,045× g for 3 min (MiniSpin, Eppendorf AG,

Foods 2022, 11, 118 5 of 18
Hamburg, Germany). An aliquot of 3 µL of the supernatants was added into the gel pocketof the Bio-Rad 4–20% Criterion™ TGX Stain-Free™ Precast Gels. The Broad Range™ Un-stained Protein Standard was used as the molecular weight marker. The running time was30 min, followed by staining using Coomassie Brilliant Blue R-250. Finally, gel images wereobtained using an EZ Imager (Gel Doc™ EZ Imager, Bio-Rad Laboratories, Feldkirchen,Germany). SDS-PAGE was performed in duplicate, with each sample being preparedtwo times independently.
2.5.2. Degree of Hydrolysis
The degree of hydrolysis (DH) was determined according to Nielsen, Petersen [40] us-ing o-phthaldialdehyde (OPA). The DH was calculated based on the total number of peptidebonds per protein equivalent (htot). The constant values used for α (degree of dissociationof the α-amino group), β (slope of calibration through linear regression) and htot factorwere 1.0, 4.0, and 8.0, respectively, according to theoretical general values for unexaminedraw material [40]. The DH was calculated according to the following equations:
Serine-NH2 =Abssample − Absblank
Absstandard − Absblank× 0.951
meqvL
×Vsample × 100
msample × PCsample
Serine-NH2 = meqv serine-NH2/g protein;Abssample = sample absorbance value;Absblank = blank absorbance value;Absstandard = standard absorbance value;Vsample = volume of sample solution (L);msample = weight of sample (g);PCsample = protein content of sample (%);
h =Serine-NH2 − β
α
Serine-NH2 = meqv serine-NH2/g protein;h = number of hydrolyzed peptide bonds;β = slope of calibration through linear regression;α = degree of dissociation of the α-amino group;
DH =h
htot× 100
DH = degree of hydrolysis (%)h = number of hydrolyzed peptide bonds;htot = total number of peptide bonds per protein equivalent.
The sample preparation was performed in duplicate and each prepared sample wasmeasured in triplicate.
2.5.3. Gel Filtration Chromatography
Two grams of untreated and treated samples were solubilized in 2 mL of 50 mMTris-HCl and 100 mM KCl, pH 7.5. Samples were centrifuged in an Eppendorf centrifuge5424 R at 20,000× g. Supernatant (1.6 mL) was applied to Superdex 200 gel filtration column(26/600, GE Healthcare; 60 cm × 26 mm) using ÄKTA avant System. The sample wasprocessed at a flow rate of 2 mL/min in 50 mM Tris-HCl and 100 mM KCl, pH 7.5. Peakeluate fractioning was used to collect the eluate in 2.5-mL fractions. Elution was monitoredat 280 nm. On average 74 fractions were collected.
Foods 2022, 11, 118 6 of 18
2.5.4. Generation of Polyclonal Rabbit Sera
The immunization of three rabbits (“Continental Giant”) with a suspension of theuntreated PPI powder was performed by a certified external supplier (Seramun DiagnosticaGmbH, Heidesee, Germany). Three rabbits are required to obtain a complete coverageof all proteins. A basic immunization with 1 mg and Complete Freund’s Adjuvant wasfollowed by one booster injection on day 21 using 0.5 mg in combination with IncompleteFreund’s Adjuvant. The serum was recovered 7 days after the booster injection. Final serashowed at >1,000,000 dilution >5× binding to PPI compared to the pre-immune serum.
2.5.5. Immunogenicity Measured by Enzyme-Linked Immunosorbent Assay (ELISA)
Purified sample fractions were measured in duplicate by indirect ELISA. MaxiSorp96-well immuno plates (Life Technologies) were coated by adding 100 µL of gel filtrationfractions to each well. The plates were incubated at 4 ◦C for 20 h. The wells were emptiedand 100 µL 5% NFDM (blocking buffer) in PBS was added to each well. The plates wereincubated for 1 h at 4 ◦C. After 3× washing with 0.1% Tween/PBS, the plates were incubatedwith the rabbit sera immunized with PPI (1:2000 in blocking buffer) at 4 ◦C for 1 h. Anotherwashing step with 0.1% Tween/PBS was performed. Moreover, 100 µL/well the detectionantibody (Goat-anti-rabbit IgG, Dianova 111-035-003, 1:5000 in blocking buffer) was addedand incubated at 4 ◦C for 1 h. The plate was washed twice with 0.1% Tween/PBS and oncewith PBS. The color reaction was developed by the addition of 100 mL of TMB MicrowellSubstrate System (BioLegend) to each well and incubation at room temperature for 5 min.The reaction was stopped by the addition of 50 µL of 20% H2SO4 to each well. The colordeveloped was measured at optical density (OD) 450 nm using a TECAN Infinite® M1000microtiter plate reader. Background for the intensity calculation were wells coated withblocking buffer only.
2.6. Functional Properties
All functional experiments were performed in duplicate.
2.6.1. Protein Solubility
The protein solubility was performed according to Morr, German [41] at pH 4.5 and7.0. The soluble protein was determined using the Biuret method (550 nm), accordingto the AACC Approved Methods of Analysis [42], using bovine serum albumin (BSA)as standard.
2.6.2. Emulsifying Capacity
The emulsifying capacity was determined according to Wang and Johnson [43] usingan 1 L-reactor equipped with a stirrer and an Ultra-Turrax (IKA-Werke GmbH and Co. KG,Staufen, Germany). Mazola corn oil was added gradually (10 mL/min) to 1% (w/w)neutralized sample dispersions until a phase inversion occurred (<10 µS/cm). The volumeof added oil was used to calculate the emulsifying capacity (mL oil/g sample).
EC =Voil
msample
EC = emulsifying capacity (mL/g);Voil = volume of oil used until phase inversion (mL);msample = weight of sample (g).
2.6.3. Foaming Properties
The foaming capacity and foam stability were analyzed according to Phillips, Haque [44]using a whipping machine (Hobart N50, Hobart GmbH, Offenburg, Germany). Briefly,5% (w/v) dispersions were adjusted to pH 7.0 and stirred for 15 min. The dispersions
Foods 2022, 11, 118 7 of 18
were whipped (580 rpm) for 8 min and the foaming capacities determined as the relationbetween the initial and final volume.
FC =V2
V1× 100
FC = foaming capacity (%);V1 = volume of sample solution before whipping (mL);V2 = volume of foam after whipping (mL).
2.7. Sensory Analysis2.7.1. Sample Preparation
The sensory analysis was performed using the combined treated samples (HyF andFdH) and the PPI. Sample solutions (2%, w/w) were prepared with tap water and codedusing three-digit random numbers.
2.7.2. Sample Evaluation
The sensory evaluation was conducted according to the ISO 8587:2006 Sensoryanalysis—Methodology—Ranking, which compares different products according to theintensity of a given characteristic or property. First, a ten-member panel ranked attributesregarding bitterness and plant-like (pea-like/green/beany) flavor. These attributes wereevaluated on a 1 (attribute not perceivable) to 7 (very strong perception) ranging scales.
2.8. Statistical Analysis
Complete raw data of untreated PPI, treated PPI and controls (temperature treatment)can be found in Mendeley Data files [45]. All results are expressed as mean values ± standarddeviations. The microbial growth results were analyzed using the two-sample t-test.Further results were analyzed by one-way analysis of variance (ANOVA). The meanvalues were compared using Tukey’s post-hoc test. All statistical analyses, except thosefrom the sensory analysis, were performed using OriginPro 2018b and were consideredstatistically significant at p < 0.05. A Friedman Test and Duncan Test as post-hoc testwere used to analyze the results from the sensory analysis (p < 0.10). Ranking recordingand statistical analyses of sensory data were carried out using RedJade software (RedJadeSensory Solutions, LLC, Martinez, CA, USA).
3. Results and Discussion3.1. Microbial Growth
L. plantarum requires tryptophan, arginine, glutamate and branched-chain aminoacids (isoleucine, leucine, valine) for growth [46]. Besides of tryptophan, PPI is a goodsource of all the required amino acids; thus, L. plantarum was able to grow both, in thePPI dispersion and hydrolyzed PPI (Table 3). However, fermentation of PPI hydrolysatesresulted in significantly higher viable cell counts compared to the fermented PPI. Thiscould be due to some release of amino acids and peptides during hydrolysis, which providea readily available source of nutrients for L. plantarum growth. The hydrolysates showedslight differences in CFU after fermentation, with P_HyF showing the highest value of9.53 Log CFU/mL followed by E_HyF and T_HyF with 9.30 Log CFU/mL and 9.17 LogCFU/mL, respectively. The pH was measured after 24 h of fermentation and was similarfor all fermented samples (pH 4.5 ± 0.2). A recent study showed that lactic fermentation ofhydrolyzed lupin protein isolate resulted in similar pH values regardless of the enzymeused [35].

Foods 2022, 11, 118 8 of 18
Table 3. Colony forming units (CFU) after inoculation and 24 h of fermentation.
Log CFU/mL
0 h 24 h
Fermented PPI 7.40 ± 0.10 a 8.89 ± 0.09 b*P_HyF 7.41 ± 0.03 a 9.53 ± 0.45 b
E_HyF 7.37 ± 0.15 a 9.30 ± 0.01 b
T_HyF 7.39 ± 0.01 a 9.17 ± 0.03 b
Results are expressed as means ± standard deviation (n = 2). Means marked with different letters indicatesignificant differences between 0 h and 24 h within same row (two-sample t-test, p < 0.05). Means marked with anasterisk (*) indicate significant differences between fermented pea protein isolate (PPI) and fermented hydrolysates(HyF) within the same column (One-way ANOVA, Tukey, p < 0.05). P: papain; E: Esperase®; T: trypsin.
3.2. Chemical Composition
The untreated PPI showed a protein content of 84.7 ± 0.1% (Table 4). The averageprotein content of PPI hydrolysates (83.4 ± 1.4%) was significantly higher compared tofermented PPI (79.5 ± 0.3%) and to the average of the samples produced by the combinationof both treatments (76.6 ± 1.3%). The differences in protein contents might be due partialmetabolism of the proteins and increase in organic acids such as lactic acid and, in lesserextent, acetic acid [46]. In addition, the ash content could be attributed to the additionof inorganic acid (hydrochloric acid) and sodium hydroxide to adjust the pH for eachsample conditions.
Table 4. Chemical composition of untreated and treated pea protein isolates.
Samples Dry Matter (%) Protein Content (%) * Ash Content (%) *
Untreated PPI 96.6 ± 0.3 a 84.7 ± 0.1 a 5.2 ± 0.5 a
Fermented PPI 94.9 ± 0.6 b 79.5 ± 0.3 b 6.9 ± 0.1 bde
P_Hy 92.7 ± 0.7 c 84.9 ± 0.1 a 5.5 ± 0.1 ac
P_HyF 97.6 ± 0.1 a 78.3 ± 0.2 c 7.2 ± 0.5 b
P_FdH 96.7 ± 1.2 a 78.0 ± 0.2 c 5.9 ± 0.8 cd
E_Hy 94.8 ± 1.0 b 82.0 ± 0.8 c 6.3 ± 0.2 b
E_HyF 97.6 ± 0.2 a 74.9 ± 0.1 d 9.3 ± 0.2 c
E_FdH 96.6 ± 0.3 a 76.4 ± 0.3 e 8.4 ± 0.5 c
T_Hy 92.5 ± 0.9 c 83.3 ± 0.1 c 5.9 ± 0.5 ab
T_HyF 97.9 ± 0.5 a 75.8 ± 0.3 d 7.9 ± 1.1 e
T_FdH 96.1 ± 1.9 a 76.1 ± 0.2 d 7.8 ± 0.8 e
Results are expressed as means ± standard deviation (n = 4). Means marked with different letters withinone column indicate significant differences between treated samples from each enzyme and the untreated peaprotein isolate (PPI) and fermented PPI (Tukey, p < 0.05). P: papain; E: Esperase®; T: trypsin; Hy: hydrolysis;HyF: hydrolysis followed by fermentation; FdH: fermentation followed by hydrolysis. * based on the drymatter content.
3.3. Proteolysis of PPI
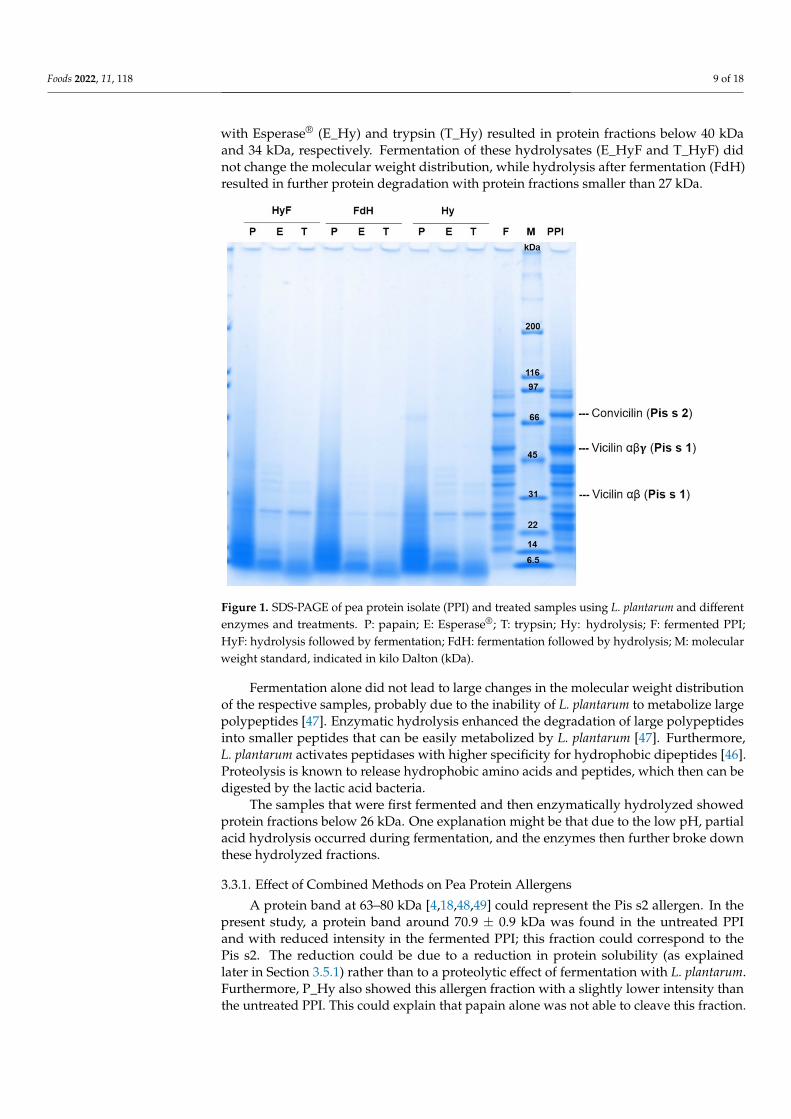
The SDS-PAGE and gel filtration were performed to observe the effects of the differenttreatments on the pea proteins. The molecular weight distribution of the untreated PPI andtreated samples is shown in Figure 1 and the positions of the main allergens are marked.The untreated PPI showed protein fractions between 97.5 and 6.5 kDa. The fermentedPPI did not show major changes in the electrophoretic pattern as previously shown byGarcía Arteaga, Leffler [33] for six lactic fermentations. The enzymatic hydrolysis facilitatedsignificant changes in the molecular weight distribution of the respective samples with anincrease in smaller peptides. This was observed in the samples that were only enzymaticallyhydrolyzed as well as in the samples with combined methods. The protein pattern of thesample treated with papain (P_Hy) only showed bands smaller than 40 kDa—with theexception of one band around 69.1 kDa. This band was degraded by the subsequentfermentation (P_HyF) and only bands smaller than 27 kDa were found. The proteolysis
Foods 2022, 11, 118 9 of 18
with Esperase® (E_Hy) and trypsin (T_Hy) resulted in protein fractions below 40 kDaand 34 kDa, respectively. Fermentation of these hydrolysates (E_HyF and T_HyF) didnot change the molecular weight distribution, while hydrolysis after fermentation (FdH)resulted in further protein degradation with protein fractions smaller than 27 kDa.
Foods 2022, 11, x FOR PEER REVIEW 9 of 19
3.3. Proteolysis of PPI The SDS-PAGE and gel filtration were performed to observe the effects of the differ-
ent treatments on the pea proteins. The molecular weight distribution of the untreated PPI and treated samples is shown in Figure 1 and the positions of the main allergens are marked. The untreated PPI showed protein fractions between 97.5 and 6.5 kDa. The fer-mented PPI did not show major changes in the electrophoretic pattern as previously shown by García Arteaga, Leffler [33] for six lactic fermentations. The enzymatic hydrol-ysis facilitated significant changes in the molecular weight distribution of the respective samples with an increase in smaller peptides. This was observed in the samples that were only enzymatically hydrolyzed as well as in the samples with combined methods. The protein pattern of the sample treated with papain (P_Hy) only showed bands smaller than 40 kDa—with the exception of one band around 69.1 kDa. This band was degraded by the subsequent fermentation (P_HyF) and only bands smaller than 27 kDa were found. The proteolysis with Esperase® (E_Hy) and trypsin (T_Hy) resulted in protein fractions below 40 kDa and 34 kDa, respectively. Fermentation of these hydrolysates (E_HyF and T_HyF) did not change the molecular weight distribution, while hydrolysis after fermentation (FdH) resulted in further protein degradation with protein fractions smaller than 27 kDa.
Fermentation alone did not lead to large changes in the molecular weight distribution of the respective samples, probably due to the inability of L. plantarum to metabolize large polypeptides [47]. Enzymatic hydrolysis enhanced the degradation of large polypeptides into smaller peptides that can be easily metabolized by L. plantarum [47]. Furthermore, L. plantarum activates peptidases with higher specificity for hydrophobic dipeptides [46]. Proteolysis is known to release hydrophobic amino acids and peptides, which then can be digested by the lactic acid bacteria.
The samples that were first fermented and then enzymatically hydrolyzed showed protein fractions below 26 kDa. One explanation might be that due to the low pH, partial acid hydrolysis occurred during fermentation, and the enzymes then further broke down these hydrolyzed fractions.
Figure 1. SDS-PAGE of pea protein isolate (PPI) and treated samples using L. plantarum and differ-ent enzymes and treatments. P: papain; E: Esperase®; T: trypsin; Hy: hydrolysis; F: fermented PPI;
Figure 1. SDS-PAGE of pea protein isolate (PPI) and treated samples using L. plantarum and differentenzymes and treatments. P: papain; E: Esperase®; T: trypsin; Hy: hydrolysis; F: fermented PPI;HyF: hydrolysis followed by fermentation; FdH: fermentation followed by hydrolysis; M: molecularweight standard, indicated in kilo Dalton (kDa).
Fermentation alone did not lead to large changes in the molecular weight distributionof the respective samples, probably due to the inability of L. plantarum to metabolize largepolypeptides [47]. Enzymatic hydrolysis enhanced the degradation of large polypeptidesinto smaller peptides that can be easily metabolized by L. plantarum [47]. Furthermore,L. plantarum activates peptidases with higher specificity for hydrophobic dipeptides [46].Proteolysis is known to release hydrophobic amino acids and peptides, which then can bedigested by the lactic acid bacteria.
The samples that were first fermented and then enzymatically hydrolyzed showedprotein fractions below 26 kDa. One explanation might be that due to the low pH, partialacid hydrolysis occurred during fermentation, and the enzymes then further broke downthese hydrolyzed fractions.
3.3.1. Effect of Combined Methods on Pea Protein Allergens
A protein band at 63–80 kDa [4,18,48,49] could represent the Pis s2 allergen. In thepresent study, a protein band around 70.9 ± 0.9 kDa was found in the untreated PPIand with reduced intensity in the fermented PPI; this fraction could correspond to thePis s2. The reduction could be due to a reduction in protein solubility (as explainedlater in Section 3.5.1) rather than to a proteolytic effect of fermentation with L. plantarum.Furthermore, P_Hy also showed this allergen fraction with a slightly lower intensity thanthe untreated PPI. This could explain that papain alone was not able to cleave this fraction.
Foods 2022, 11, 118 10 of 18
Protein bands found around 50.1 ± 0.8 kDa and 31.91 ± 0.5 kDa could correspond tothe Pis s1 of the mature vicilin (αβγ) and its proteolytic fraction (αβ), respectively. The Piss1 αβγ was present in the untreated PPI and with less intensity in the fermented PPI. Itsproteolytic fraction was present in the untreated PPI, fermented PPI, E_Hy, T_Hy, E_HyF,and T_HyF.
3.3.2. Effect of Combined Methods on the Degree of Hydrolysis
Both trypsin and Esperase® are serine endoproteases, with trypsin having specificityfor basic residues, such as lysine and arginine derivatives [50] and Esperase® havinga broader specificity, such as for both hydrophobic and hydrophilic residues [51]. Thelatter might explain the higher DH of all Esperase® treated samples (Table 5). Papaincleaves peptide bonds C-terminal of glycine and cysteine residues among others [52].Glycine and cysteine residues might interfere with the OPA agent giving unstable andweak signals [40,53]. This effect might have been the reason why papain treated samplesshowed lower DH compared to other hydrolyzed samples even when the electrophoreticresults showed significant changes.
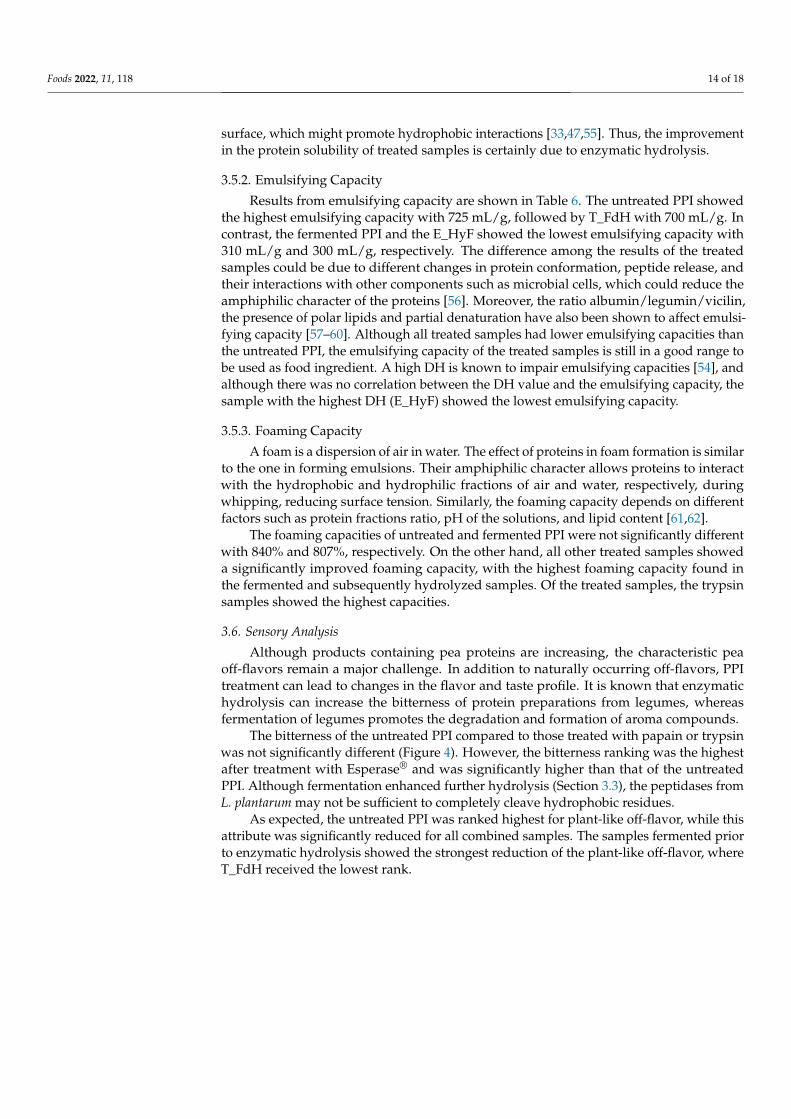
Table 5. Degree of hydrolysis (%) of untreated and treated pea protein isolates.
Samples DH [%]
Untreated PPI 1.88 ± 0.14 a
Fermented PPI 1.32 ± 0.05 b
P_Hy 3.73 ± 0.08 c
P_HyF 5.48 ± 0.16 d
P_FdH 3.92 ± 0.44 c
E_Hy 9.57 ± 0.46 c
E_HyF 10.76 ± 0.15 d
E_FdH 9.98 ± 0.37 c
T_Hy 6.86 ± 0.06 c
T_HyF 9.22 ± 0.20 d
T_FdH 9.26 ± 0.27 d
Results are expressed as means ± standard deviation (n = 4). Means marked with different letters within onecolumn indicate significant differences treated samples from one enzyme and the untreated pea protein isolate(PPI) and the fermented PPI (Tukey, p < 0.05). P: papain; E: Esperase®; T: trypsin; Hy: hydrolysis; HyF: hydrolysisfollowed by fermentation; FdH: fermentation followed by hydrolysis.
Furthermore, the combination of fermentation after enzymatic hydrolysis significantlyincreased the DH value compared to the untreated PPI, the fermented PPI and the enzy-matic treated sample. This could be related to the aforementioned ability of L. plantarum totake up the smaller peptides released after enzymatic hydrolysis. However, P_FdH andE_FdH did not show significant differences to P_Hy and E_Hy samples, respectively. Inthe case of P_FdH, this could be due to the higher exposure of cysteine residues interferingwith the measurement; in the case of E_FdH, this could be due to protein agglomerationpromoted by fermentation, which hides the cleavage site for Esperase®.
3.4. Reaction of Polyclonal Antibodies with PPI
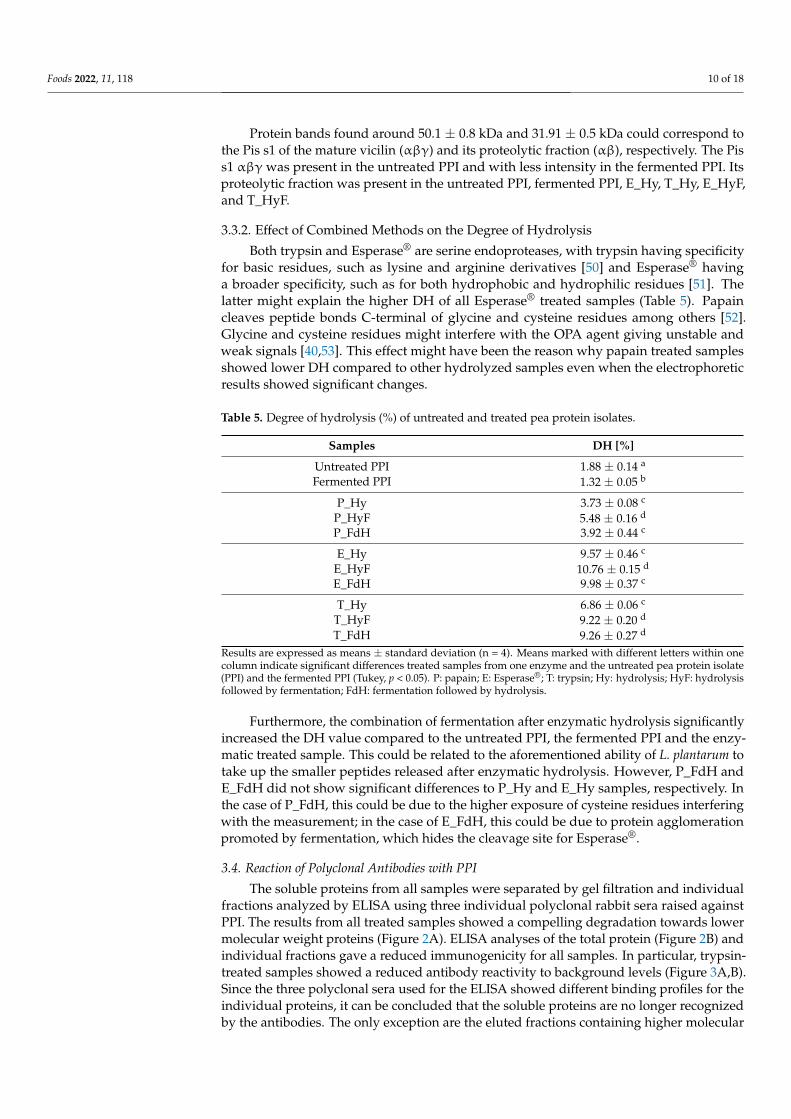
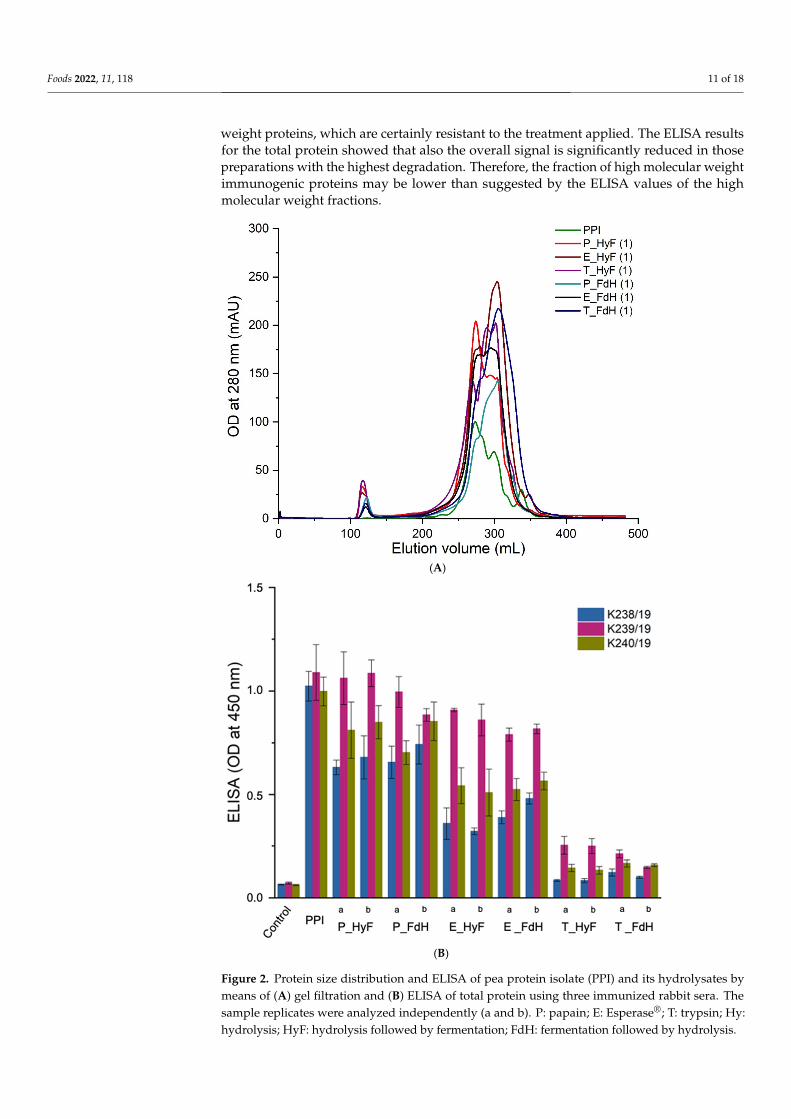
The soluble proteins from all samples were separated by gel filtration and individualfractions analyzed by ELISA using three individual polyclonal rabbit sera raised againstPPI. The results from all treated samples showed a compelling degradation towards lowermolecular weight proteins (Figure 2A). ELISA analyses of the total protein (Figure 2B) andindividual fractions gave a reduced immunogenicity for all samples. In particular, trypsin-treated samples showed a reduced antibody reactivity to background levels (Figure 3A,B).Since the three polyclonal sera used for the ELISA showed different binding profiles for theindividual proteins, it can be concluded that the soluble proteins are no longer recognizedby the antibodies. The only exception are the eluted fractions containing higher molecular
Foods 2022, 11, 118 11 of 18
weight proteins, which are certainly resistant to the treatment applied. The ELISA resultsfor the total protein showed that also the overall signal is significantly reduced in thosepreparations with the highest degradation. Therefore, the fraction of high molecular weightimmunogenic proteins may be lower than suggested by the ELISA values of the highmolecular weight fractions.
Foods 2022, 11, x FOR PEER REVIEW 11 of 19
T: trypsin; Hy: hydrolysis; HyF: hydrolysis followed by fermentation; FdH: fermentation followed by hydrolysis.
3.4. Reaction of Polyclonal Antibodies with PPI The soluble proteins from all samples were separated by gel filtration and individual
fractions analyzed by ELISA using three individual polyclonal rabbit sera raised against PPI. The results from all treated samples showed a compelling degradation towards lower molecular weight proteins (Figure 2A). ELISA analyses of the total protein (Figure 2B) and individual fractions gave a reduced immunogenicity for all samples. In particular, tryp-sin-treated samples showed a reduced antibody reactivity to background levels (Figure 3A,B). Since the three polyclonal sera used for the ELISA showed different binding pro-files for the individual proteins, it can be concluded that the soluble proteins are no longer recognized by the antibodies. The only exception are the eluted fractions containing higher molecular weight proteins, which are certainly resistant to the treatment applied. The ELISA results for the total protein showed that also the overall signal is significantly reduced in those preparations with the highest degradation. Therefore, the fraction of high molecular weight immunogenic proteins may be lower than suggested by the ELISA values of the high molecular weight fractions.
These SDS-PAGE results in combination with the results from the gel filtration and ELISA show that the combination of enzymatic hydrolysis and fermentation degrades pea proteins to a higher degree. Reduced reactivity with the antibody sera could imply reduc-tion of the allergic potential of pea protein preparations. Fermentation followed by enzy-matic hydrolysis was particularly successful, as it seemed to degrade all major potential pea allergens. However, the reduction in allergenicity needs to be confirmed by further immunological studies, such as prick tests.
(A)
Foods 2022, 11, x FOR PEER REVIEW 12 of 19
(B)
Figure 2. Protein size distribution and ELISA of pea protein isolate (PPI) and its hydrolysates by means of (A) gel filtration and (B) ELISA of total protein using three immunized rabbit sera. The sample replicates were analyzed independently (a and b). P: papain; E: Esperase®; T: trypsin; Hy: hydrolysis; HyF: hydrolysis followed by fermentation; FdH: fermentation followed by hydrolysis.
Figure 2. Protein size distribution and ELISA of pea protein isolate (PPI) and its hydrolysates bymeans of (A) gel filtration and (B) ELISA of total protein using three immunized rabbit sera. Thesample replicates were analyzed independently (a and b). P: papain; E: Esperase®; T: trypsin; Hy:hydrolysis; HyF: hydrolysis followed by fermentation; FdH: fermentation followed by hydrolysis.

Foods 2022, 11, 118 12 of 18Foods 2022, 11, x FOR PEER REVIEW 13 of 19
(A)
(B)
Figure 3. Gel filtration and ELISA results from trypsin treated protein isolates by combination meth-ods of (A) enzymatic hydrolysis followed by fermentation (T_HyF) and (B) fermentation followed by enzymatic hydrolysis (T_FdH).
3.5. Functional Properties
Figure 3. Gel filtration and ELISA results from trypsin treated protein isolates by combination meth-ods of (A) enzymatic hydrolysis followed by fermentation (T_HyF) and (B) fermentation followed byenzymatic hydrolysis (T_FdH).

Foods 2022, 11, 118 13 of 18
These SDS-PAGE results in combination with the results from the gel filtration andELISA show that the combination of enzymatic hydrolysis and fermentation degradespea proteins to a higher degree. Reduced reactivity with the antibody sera could implyreduction of the allergic potential of pea protein preparations. Fermentation followedby enzymatic hydrolysis was particularly successful, as it seemed to degrade all majorpotential pea allergens. However, the reduction in allergenicity needs to be confirmed byfurther immunological studies, such as prick tests.
3.5. Functional Properties
Changes in the molecular weight distribution of proteins cause changes in the exposedhydrophobic and ionizable groups as well as in the ability of the proteins to aggregate,which can influence the functional properties [54]. Therefore, the effect of protein degrada-tion on functional properties were studied in detail.
3.5.1. Protein Solubility
The results of the protein solubility analyses are shown in Table 6; these resultscorrelate strongly with the DH values. At acidic pH (pH 4.5), the untreated and fermentedPPI were significantly different from all other samples. Samples treated with Esperase®
showed the highest protein solubility of up to 66%, whereas the protein solubility of papainand trypsin treated samples was also significantly increased. The fermentation followed byenzymatic hydrolysis was most effective in increasing solubility at acidic pH.
Table 6. Functional properties of untreated and treated pea protein isolates.
SamplesProtein Solubility [%] Emulsifying Capacity Foaming Capacity
pH 4.5 pH 7.0 (mL/g) (%)
Untreated PPI 6.98 ± 0.47 a 40.26 ± 0.81 a 725 ± 8 a 840 ± 8 a
Fermented PPI 5.72 ± 0.44 a 10.72 ± 1.67 b 310 ± 13 b 807 ± 3 a
P_Hy 31.19 ± 1.24 b 43.64 ± 1.99 ac 465 ± 18 c 1234 ± 56 b
P_HyF 35.87 ± 1.12 c 42.85 ± 1.38 ac 398 ± 21 d 1190 ± 17 b
P_FdH 38.12 ± 1.69 c 47.37 ± 4.42 c 383 ± 10 d 1335 ± 73 c
E_Hy 60.01 ± 1.25 b 61.52 ± 1.01 c 391 ± 10 c 1261 ± 67 b
E_HyF 63.74 ± 1.46 c 74.95 ± 2.65 d 300 ± 14 b 985 ± 33 c
E_FdH 66.55 ± 1.64 d 67.28 ± 2.76 e 450 ± 4 d 1576 ± 22 d
T_Hy 42.95 ± 7.04 b 50.94 ± 2.19 c 670 ± 31 c 1993 ± 53 b
T_HyF 48.89 ± 1.87 bc 52.55 ± 1.20 c 664 ± 24 c 1934 ± 150 b
T_FdH 51.31 ± 0.44 c 63.08 ± 2.22 d 705 ± 12 ac 2575 ± 47 c
Results are expressed as means ± standard deviation (n = 4). Means marked with different letters within onecolumn indicate significant differences between treated samples from one enzyme and the untreated pea proteinisolate (PPI) and the fermented PPI (Tukey, p < 0.05). P: papain; E: Esperase®; T: trypsin; Hy: hydrolysis; HyF:hydrolysis followed by fermentation; FdH: fermentation followed by hydrolysis.
At neutral pH, the fermented PPI showed significant lower protein solubility comparedto the untreated PPI. The PPI showed similar protein solubility to P_Hy and P_HyF, whereasthe P_FdH was significantly different. The papain and trypsin treated samples showedthe highest protein solubility when the fermentation step was followed by enzymatichydrolysis. Among the samples that were only hydrolyzed or were hydrolyzed and thenfermented, a significant difference in protein solubility could not be measured. However,the samples treated with Esperase® were significantly different from each other and fromthe untreated PPI. The lower solubility of E_FdH compared to E_HyF could be explainedby an increase in insoluble aggregates due to acid denaturation during fermentation, whichhinders the Esperase® activity to cleave on specific protein sites.
Other studies have shown negative or no effect of fermentation on the protein solubility.This has been attributed to changes in the protein surface, surface charge and the LAB cell
Foods 2022, 11, 118 14 of 18
surface, which might promote hydrophobic interactions [33,47,55]. Thus, the improvementin the protein solubility of treated samples is certainly due to enzymatic hydrolysis.
3.5.2. Emulsifying Capacity
Results from emulsifying capacity are shown in Table 6. The untreated PPI showedthe highest emulsifying capacity with 725 mL/g, followed by T_FdH with 700 mL/g. Incontrast, the fermented PPI and the E_HyF showed the lowest emulsifying capacity with310 mL/g and 300 mL/g, respectively. The difference among the results of the treatedsamples could be due to different changes in protein conformation, peptide release, andtheir interactions with other components such as microbial cells, which could reduce theamphiphilic character of the proteins [56]. Moreover, the ratio albumin/legumin/vicilin,the presence of polar lipids and partial denaturation have also been shown to affect emulsi-fying capacity [57–60]. Although all treated samples had lower emulsifying capacities thanthe untreated PPI, the emulsifying capacity of the treated samples is still in a good range tobe used as food ingredient. A high DH is known to impair emulsifying capacities [54], andalthough there was no correlation between the DH value and the emulsifying capacity, thesample with the highest DH (E_HyF) showed the lowest emulsifying capacity.
3.5.3. Foaming Capacity
A foam is a dispersion of air in water. The effect of proteins in foam formation is similarto the one in forming emulsions. Their amphiphilic character allows proteins to interactwith the hydrophobic and hydrophilic fractions of air and water, respectively, duringwhipping, reducing surface tension. Similarly, the foaming capacity depends on differentfactors such as protein fractions ratio, pH of the solutions, and lipid content [61,62].
The foaming capacities of untreated and fermented PPI were not significantly differentwith 840% and 807%, respectively. On the other hand, all other treated samples showeda significantly improved foaming capacity, with the highest foaming capacity found inthe fermented and subsequently hydrolyzed samples. Of the treated samples, the trypsinsamples showed the highest capacities.
3.6. Sensory Analysis
Although products containing pea proteins are increasing, the characteristic peaoff-flavors remain a major challenge. In addition to naturally occurring off-flavors, PPItreatment can lead to changes in the flavor and taste profile. It is known that enzymatichydrolysis can increase the bitterness of protein preparations from legumes, whereasfermentation of legumes promotes the degradation and formation of aroma compounds.
The bitterness of the untreated PPI compared to those treated with papain or trypsinwas not significantly different (Figure 4). However, the bitterness ranking was the highestafter treatment with Esperase® and was significantly higher than that of the untreatedPPI. Although fermentation enhanced further hydrolysis (Section 3.3), the peptidases fromL. plantarum may not be sufficient to completely cleave hydrophobic residues.
As expected, the untreated PPI was ranked highest for plant-like off-flavor, while thisattribute was significantly reduced for all combined samples. The samples fermented priorto enzymatic hydrolysis showed the strongest reduction of the plant-like off-flavor, whereT_FdH received the lowest rank.

Foods 2022, 11, 118 15 of 18Foods 2022, 11, x FOR PEER REVIEW 16 of 19
Figure 4. Results are expressed as sum of ranks ± standard deviation (n = 11). Rank sums marked with different letters indicate significant differences (Duncan’s, p < 0.1). An asterisk (*) indicate sig-nificant differences to the untreated PPI (Duncan’s, p < 0.1). PPI: pea protein isolate; P: papain; E: Esperase®; T: trypsin; HyF: hydrolyzed followed by fermentation; FdH: fermentation followed by hydrolysis.
4. Conclusions Various studies have investigated the effects of enzymatic hydrolysis and fermenta-
tion on pea proteins; however, to the best of our knowledge, a combination of both meth-ods has not yet been investigated. Our study shows that the order of combination of both methods can have a significant impact on the proteins, their immunological and func-tional properties, as well as the characteristic off-flavors of PPI. The fermentation of PPI followed by enzymatic hydrolysis showed stronger protein degradation and an effect on functionality of the proteins as well as a reduction of off-flavors. The SDS-PAGE and gel filtration showed a significant reduction in the proteins molecular weight by enzymatic digestion. Analyses of the individual size fractions showed a reduced immunogenicity using three different polyclonal sera in ELISA. However, further in vivo tests are required to confirm that treated PPI will be tolerated better by allergic or sensitized individuals at those amounts corresponding to the daily consumption in protein-enriched food. The in-crease in protein solubility, especially in acidic conditions, suggests that treated pea pro-teins can be used to increase the protein content in different food products. The reduction of pea off-flavors could allow the increase of protein content without hindering the ac-ceptance by consumers; the application in different products and their acceptance still need to be investigated. The combination of treatments can be a promising method to be used in the food industry to enhance pea protein isolate functionality and neutralize off-flavors, and could significantly lower the allergenicity.
Author Contributions: Conceptualization, V.G.A.; formal analysis, V.G.A.; investigation, V.G.A., V.D., K.K. and A.S.; methodology, V.G.A., K.K., A.S., M.S. and I.M.; resources, P.E. and U.S.-W.; supervision, I.M., P.E. and U.S.-W.; writing—original draft, V.G.A.; writing—review and editing, V.G.A., K.K., A.S., M.S., I.M., P.E. and U.S.-W. All authors have read and agreed to the published version of the manuscript.
Funding: This work was supported by the Fraunhofer Future Foundation, Germany. Project num-ber: 113 867.
Figure 4. Results are expressed as sum of ranks ± standard deviation (n = 11). Rank sums markedwith different letters indicate significant differences (Duncan’s, p < 0.1). An asterisk (*) indicatesignificant differences to the untreated PPI (Duncan’s, p < 0.1). PPI: pea protein isolate; P: papain;E: Esperase®; T: trypsin; HyF: hydrolyzed followed by fermentation; FdH: fermentation followed byhydrolysis.
4. Conclusions
Various studies have investigated the effects of enzymatic hydrolysis and fermentationon pea proteins; however, to the best of our knowledge, a combination of both methodshas not yet been investigated. Our study shows that the order of combination of bothmethods can have a significant impact on the proteins, their immunological and functionalproperties, as well as the characteristic off-flavors of PPI. The fermentation of PPI followedby enzymatic hydrolysis showed stronger protein degradation and an effect on functionalityof the proteins as well as a reduction of off-flavors. The SDS-PAGE and gel filtration showeda significant reduction in the proteins molecular weight by enzymatic digestion. Analysesof the individual size fractions showed a reduced immunogenicity using three differentpolyclonal sera in ELISA. However, further in vivo tests are required to confirm thattreated PPI will be tolerated better by allergic or sensitized individuals at those amountscorresponding to the daily consumption in protein-enriched food. The increase in proteinsolubility, especially in acidic conditions, suggests that treated pea proteins can be usedto increase the protein content in different food products. The reduction of pea off-flavorscould allow the increase of protein content without hindering the acceptance by consumers;the application in different products and their acceptance still need to be investigated. Thecombination of treatments can be a promising method to be used in the food industry toenhance pea protein isolate functionality and neutralize off-flavors, and could significantlylower the allergenicity.
Author Contributions: Conceptualization, V.G.A.; formal analysis, V.G.A.; investigation, V.G.A.,V.D., K.K. and A.S.; methodology, V.G.A., K.K., A.S., M.S. and I.M.; resources, P.E. and U.S.-W.;supervision, I.M., P.E. and U.S.-W.; writing—original draft, V.G.A.; writing—review and editing,V.G.A., K.K., A.S., M.S., I.M., P.E. and U.S.-W. All authors have read and agreed to the publishedversion of the manuscript.
Funding: This work was supported by the Fraunhofer Future Foundation, Germany. Project number:113 867.
Foods 2022, 11, 118 16 of 18
Acknowledgments: The authors thank Eva Müller for her valuable contribution to this work. Wegreatly appreciate the sensory panel of the Fraunhofer Institute for Process Engineering and PackagingIVV, Freising, Germany, for the sensory evaluation.
Conflicts of Interest: The authors declare no conflict of interest.
References1. Stagnari, F.; Maggio, A.; Galieni, A.; Pisante, M. Multiple benefits of legumes for agriculture sustainability: An overview.
Chem. Biol. Technol. Agric. 2017, 4, 2. [CrossRef]2. Powers, S.E.; Thavarajah, D. Checking Agriculture’s Pulse: Field Pea (Pisum Sativum L.), Sustainability, and Phosphorus Use
Efficiency. Front. Plant Sci. 2019, 10, 1489. [CrossRef]3. Osborne, T.B. The vegetable proteins. Monographs on Biochemistry. J. Soc. Chem. Ind. 1924, 43, 440.4. Sanchez-Monge, R.; Lopez-Torrejon, G.; Pascual, C.Y.; Varela, J.; Martin-Esteban, M.; Salcedo, G. Vicilin and convicilin are
potential major allergens from pea. Clin. Exp. Allergy 2004, 34, 1747–1753. [CrossRef] [PubMed]5. Birmingham, N.; Thanesvorakul, S.; Gangur, V. Relative Immunogenicity of Commonly Allergenic Foods versus Rarely Allergenic
and Nonallergenic Foods in Mice. J. Food Prot. 2002, 65, 1988–1991. [CrossRef]6. Zhang, J.; Tao, A. Antigenicity, Immunogenicity, Allergenicity. In Allergy Bioinformatics; Tao, A., Raz, E., Eds.; Springer: Dordrecht,
The Netherlands, 2015; pp. 175–186.7. Lima-Cabello, E.; Robles-Bolivar, P.; Alché, J.D.; Jimenez-Lopez, J.C. Narrow Leafed Lupin Beta-Conglutin Proteins Epitopes
Identification and Molecular Features Analysis Involved in Cross-Allergenicity to Peanut and Other Legumes. Genom. Comput.Biol. 2016, 2, 29. [CrossRef]
8. Dreyer, L.; Astier, C.; Dano, D.; Hosotte, M.; Jarlot-Chevaux, S.; Sergeant, P.; Kanny, G. Consommation croissante d’alimentscontenant du pois jaune: Un risque d’allergie? Rev. Fr. D’allergol. 2014, 54, 20–26. [CrossRef]
9. Wensing, M.; Knulst, A.C.; Piersma, S.; O’Kane, F.; Knol, E.F.; Koppelman, S.J. Patients with anaphylaxis to pea can have peanutallergy caused by cross-reactive IgE to vicilin (Ara h 1). J. Allergy Clin. Immunol. 2003, 111, 420–424. [CrossRef]
10. Dong, X.; Wang, J.; Raghavan, V. Critical reviews and recent advances of novel non-thermal processing techniques on themodification of food allergens. Crit. Rev. Food Sci. Nutr. 2021, 61, 196–210. [CrossRef]
11. Kasera, R.; Singh, A.; Lavasa, S.; Prasad, K.N.; Arora, N. Enzymatic hydrolysis: A method in alleviating legume allergenicity.Food Chem. Toxicol. 2015, 76, 54–60. [CrossRef]
12. Aluko, R.E. Determination of Nutritional and Bioactive Properties of Peptides in Enzymatic Pea, Chickpea, and Mung BeanProtein Hydrolysates. J. AOAC Int. 2008, 91, 947–956. [CrossRef]
13. Meinlschmidt, P.; Sussmann, D.; Schweiggert-Weisz, U.; Eisner, P. Enzymatic treatment of soy protein isolates: Effects on thepotential allergenicity, technofunctionality, and sensory properties. Food Sci. Nutr. 2016, 4, 11–23. [CrossRef]
14. Fraczek, R.; Kostyra, E.; Krawczuk, S.; Kostyra, H. Immunoreactive properties of pea protein extract and its trypsin hydrolysates.J. Anim. Feed. Sci. 2007, 16, 472–484. [CrossRef]
15. Szymkiewicz, A.; Jedrychowski, L. Effect of acylation and enzymatic modification on pea proteins allergenicity. Pol. J. Food Nutr.Sci. 2008, 58, 345–350.
16. Lidzba, N.; Arteaga, V.G.; Schiermeyer, A.; Havenith, H.; Muranyi, I.; Schillberg, S.; Lehmann, J.; Ueberham, E. Developmentof Monoclonal Antibodies against Pea Globulins for Multiplex Assays Targeting Legume Proteins. J. Agric. Food Chem. 2021,69, 2864–2874. [CrossRef] [PubMed]
17. Klost, M.; Drusch, S. Functionalisation of pea protein by tryptic hydrolysis—Characterisation of interfacial and functionalproperties. Food Hydrocoll. 2019, 86, 134–140. [CrossRef]
18. Arteaga, V.G.; Guardia, M.A.; Muranyi, I.; Eisner, P.; Schweiggert-Weisz, U. Effect of enzymatic hydrolysis on molecular weightdistribution, techno-functional properties and sensory perception of pea protein isolates. Innov. Food Sci. Emerg. Technol. 2020,65, 102449. [CrossRef]
19. Schlegel, K.; Sontheimer, K.; Hickisch, A.; Wani, A.A.; Eisner, P.; Schweiggert-Weisz, U. Enzymatic hydrolysis of lupin proteinisolates—Changes in the molecular weight distribution, technofunctional characteristics, and sensory attributes. Food Sci. Nutr.2019, 7, 2747–2759. [CrossRef]
20. Adler-Nissen, J.; Olsen, H.S. The Influence of Peptide Chain Length on Taste and Functional Properties of Enzymatically ModifiedSoy Protein. In Functionality and Protein Structure; American Chemical Society (ACS): Washington, DC, USA, 1979; pp. 125–146.
21. Schlegel, K.; Leidigkeit, A.; Eisner, P.; Schweiggert-Weisz, U. Technofunctional and Sensory Properties of Fermented LupinProtein Isolates. Foods 2019, 8, 678. [CrossRef]
22. Meinlschmidt, P.; Schweiggert-Weisz, U.; Eisner, P. Soy protein hydrolysates fermentation: Effect of debittering and degradationof major soy allergens. LWT 2016, 71, 202–212. [CrossRef]
23. El Abboudi, M.; El Soda, M.; Pandian, S.; Barreau, M.; Trépanier, G.; Simard, R.E. Peptidase activities in debittering andnondebittering strains of lactobacilli. Int. Dairy J. 1992, 2, 55–64. [CrossRef]
24. Tchorbanov, B.; Marinova, M.; Grozeva, L. Debittering of Protein Hydrolysates by Lactobacillus LBL-4 Aminopeptidase. Enzym.Res. 2011, 2011, 538676. [CrossRef] [PubMed]
Foods 2022, 11, 118 17 of 18
25. Song, P.; Cheng, L.; Tian, K.; Zhang, M.; Singh, S.; Niu, D.; Prior, B.; Mchunu, N.P.; Wang, Z.-X. A novel aminopeptidase withpotential debittering properties in casein and soybean protein hydrolysates. Food Sci. Biotechnol. 2020, 29, 1491–1499. [CrossRef]
26. Schindler, S.; Zelena, K.; Krings, U.; Bez, J.; Eisner, P.; Berger, R.G. Improvement of the Aroma of Pea (Pisum sativum) ProteinExtracts by Lactic Acid Fermentation. Food Biotechnol. 2012, 26, 58–74. [CrossRef]
27. Ben-Harb, S.; Saint-Eve, A.; Panouillé, M.; Souchon, I.; Bonnarme, P.; Dugat-Bony, E.; Irlinger, F. Design of microbial consortia forthe fermentation of pea-protein-enriched emulsions. Int. J. Food Microbiol. 2019, 293, 124–136. [CrossRef]
28. El Youssef, C.; Bonnarme, P.; Fraud, S.; Péron, A.-C.; Helinck, S.; Landaud, S. Sensory Improvement of a Pea Protein-BasedProduct Using Microbial Co-Cultures of Lactic Acid Bacteria and Yeasts. Foods 2020, 9, 349. [CrossRef]
29. Sadowska, J.; Fornal, J.; Vidal-Valverde, C.; Frias, J. Natural fermentation of lentils. Functional properties and potential inbreadmaking of fermented lentil flour. Food/Nahrung 1999, 43, 396–401. [CrossRef]
30. Lampart-Szczapa, E.; Konieczny, P.; Nogala-Kalucka, M.; Walczak, S.; Kossowska, I.; Malinowska, M. Some functional propertiesof lupin proteins modified by lactic fermentation and extrusion. Food Chem. 2006, 96, 290–296. [CrossRef]
31. Çabuk, B.; Stone, A.K.; Korber, D.R.; Tanaka, T.; Nickerson, M.T. Effect of Lactobacillus plantarum Fermentation on the Surface andFunctional Properties of Pea Protein-Enriched Flour. Food Technol. Biotechnol. 2018, 56, 411–420. [CrossRef]
32. Kumitch, H.M.; Stone, A.K.; Nickerson, M.T.; Korber, D.R.; Tanaka, T. Effect of fermentation time on the physicochemical andfunctional properties of pea protein-enriched flour fermented by Aspergillus oryzae and Aspergillus niger. Cereal Chem. J. 2020,97, 416–428. [CrossRef]
33. Arteaga, V.G.; Leffler, S.; Muranyi, I.; Eisner, P.; Schweiggert-Weisz, U. Sensory profile, functional properties and molecularweight distribution of fermented pea protein isolate. Curr. Res. Food Sci. 2021, 4, 1–10. [CrossRef] [PubMed]
34. Barkholt, V.; Jørgensen, P.B.; Sørensen, D.; Bahrenscheer, J.; Haikara, A.; Lemola, E.; Laitila, A.; Frøkiaer, H. Protein modificationby fermentation: Effect of fermentation on the potential allergenicity of pea. Allergy 1998, 53, 106–108. [CrossRef]
35. Schlegel, K.; Lidzba, N.; Ueberham, E.; Eisner, P.; Schweiggert-Weisz, U. Fermentation of Lupin Protein Hydrolysates—Effectson Their Functional Properties, Sensory Profile and the Allergenic Potential of the Major Lupin Allergen Lup an 1. Foods 2021,10, 281. [CrossRef] [PubMed]
36. Yang, H.; Qu, Y.; Li, J.; Liu, X.; Wu, R.; Wu, J. Improvement of the protein quality and degradation of allergens in soybean meal bycombination fermentation and enzymatic hydrolysis. LWT 2020, 128, 109442. [CrossRef]
37. AOAC. Method 923.03. Ash of flour. In Official Methods of Analysis of the Association of Official Analytical Chemists (AOAC); Horwitz,W.A., Ed.; AOAC International: Gaithersburg, MD, USA, 2003.
38. AOAC. Method 968.06. Protein (crude) in animal feed. In Official Methods of Analysis of the Association of Official Analytical Chemists(AOAC); Horwitz, W.A., Ed.; AOAC International: Gaithersburg, MD, USA, 2003.
39. Laemmli, U.K. Cleavage of structural proteins during assembly of head of bacteriophage-T4. Nature 1970, 227, 680–685. [CrossRef][PubMed]
40. Nielsen, P.M.; Petersen, D.; Dambmann, C. Improved Method for Determining Food Protein Degree of Hydrolysis. J. Food Sci.2001, 66, 642–646. [CrossRef]
41. Morr, C.V.; German, B.; Kinsella, J.E.; Regenstein, J.M.; Van Buren, J.P.; Kilara, A.; Lewis, B.A.; Mangino, M.E. A collaborativestudy to develop a standarized food protein solubility procedure. J. Food Sci. 1985, 50, 1715–1718. [CrossRef]
42. AACC Approved Methods of Analysis. Method 46-15.01. Crude Protein—5-Minute Biuret Method for Wheat and Other Grains.In American Association of Cereal Chemists; Cereals & Grains Association: Eagan, MN, USA, 2000.
43. Wang, C.; Johnson, L.A. Functional properties of hydrothermally cooked soy protein products. J. Am. Oil Chem. Soc. 2001,78, 189–195. [CrossRef]
44. Phillips, L.G.; Haque, Z.; Kinsella, J.E. A Method for the Measurement of Foam Formation and Stability. J. Food Sci. 1987,52, 1074–1077. [CrossRef]
45. García Arteaga, V.; Demand, V.; Kern, K.; Strube, A.; Szardenings, M.; Muranyi, I.; Eisner, P.; Schweiggert-Weisz, U. EnzymaticHydrolysis and Fermentation of Pea Protein Isolate and Its Effects on Potential Allergens, Functional Properties and SensoryProfile. Mendeley Data 2021, V2. [CrossRef]
46. Corsetti, A.; Valmorri, S. Lactic Acid Bacteria|Lactobacillus spp.: Lactobacillus plantarum. In Encyclopedia of Dairy Sciences, 2nd ed.;Fuquay, J.W., Ed.; Elsevier BV: Amsterdam, The Netherlands, 2011; pp. 111–118.
47. Kleerebezem, M.; Boekhorst, J.; van Kranenburg, R.; Molenaar, D.; Kuipers, O.P.; Leer, R.; Tarchini, R.; Peters, S.A.; Sandbrink,H.M.; Fiers, M.W.; et al. Complete genome sequence of Lactobacillus plantarum WCFS1. Proc. Natl. Acad. Sci. USA 2003,100, 1990–1995. [CrossRef]
48. Popp, J.; Trendelenburg, V.; Niggemann, B.; Randow, S.; Völker, E.; Vogel, L.; Reuter, A.; Spiric, J.; Schiller, D.; Beyer, K.; et al.Pea (Pisum sativum) allergy in children: Pis s 1 is an immunodominant major pea allergen and presents IgE binding sites withpotential diagnostic value. Clin. Exp. Allergy 2020, 50, 625–635. [CrossRef]
49. Bourgeois, M.; Jacquin, F.; Savois, V.; Sommerer, N.; Labas, V.; Henry, C.; Burstin, J. Dissecting the proteome of pea mature seedsreveals the phenotypic plasticity of seed protein composition. Proteomics 2009, 9, 254–271. [CrossRef] [PubMed]
50. Vajda, T.; Szabó, T. Specificity of trypsin and alpha-chymotrypsin towards neutral substrates. Acta Biochim. Biophys. Acad. Sci.Hung. 1976, 11, 287–294.
51. Georgieva, D.N.; Stoeva, S.; Voelter, W.; Genov, N.; Betzel, C. Substrate Specificity of the Highly Alkalophilic Bacterial ProteinaseEsperase: Relation to the X-ray Structure. Curr. Microbiol. 2001, 42, 368–371. [CrossRef]

Foods 2022, 11, 118 18 of 18
52. Drenth, J.; Jansonius, J.N.; Koekoek, R.; Wolthers, B.G. The Structure of Papain. In Advances in Protein Chemistry; Anfinsen, C.B.,Edsall, J.T., Richards, F.M., Eds.; Academic Press: Cambridge, MA, USA, 1971; pp. 79–115.
53. Chen, R.F.; Scott, C.; Trepman, E. Fluorescence properties of o-phthaldialdehyde derivatives of amino acids. Biochim. Biophys.Acta Protein Struct. 1979, 576, 440–455. [CrossRef]
54. Tavano, O. Protein hydrolysis using proteases: An important tool for food biotechnology. J. Mol. Catal. B Enzym. 2013, 90, 1–11.[CrossRef]
55. Klost, M.; Brzeski, C.; Drusch, S. Effect of protein aggregation on rheological properties of pea protein gels. Food Hydrocoll. 2020,108, 106036. [CrossRef]
56. Daeschel, M.A.; McGuire, J. Interrelationships between protein surface adsorption and bacterial adhesion. Biotechnol. Genet. Eng.Rev. 1998, 15, 413–438. [CrossRef] [PubMed]
57. Shevkani, K.; Singh, N.; Kaur, A.; Rana, J.C. Structural and functional characterization of kidney bean and field pea proteinisolates: A comparative study. Food Hydrocoll. 2015, 43, 679–689. [CrossRef]
58. Barac, M.; Cabrilo, S.; Pesic, M.; Stanojevic, S.; Zilic, S.; Macej, O.; Ristic, N. Profile and Functional Properties of Seed Proteinsfrom Six Pea (Pisum sativum) Genotypes. Int. J. Mol. Sci. 2010, 11, 4973–4990. [CrossRef] [PubMed]
59. Dagorn-Scaviner, C.; Gueguen, J.; Lefebvre, J. Emulsifying Properties of Pea Globulins as Related to Their Adsorption Behaviors.J. Food Sci. 1987, 52, 335–341. [CrossRef]
60. McClements, D.J.; Bai, L.; Chung, C. Recent Advances in the Utilization of Natural Emulsifiers to Form and Stabilize Emulsions.Annu. Rev. Food Sci. Technol. 2017, 8, 205–236. [CrossRef] [PubMed]
61. Zayas, J.F. Foaming Properties of Proteins. In Functionality of Proteins in Food; Springer: Berlin/Heidelberg, Germany,1997; pp. 260–309.
62. Denkov, N.D.; Marinova, K.G. Antifoam Effects of Solid Particles, Oil Drops and Oil—Solid Compounds in Aqueous Foams. InColloidal Particles at Liquid Interfaces; Cambridge University Press: Cambridge, UK, 2006.
Related Documents