Welcome message from author
This document is posted to help you gain knowledge. Please leave a comment to let me know what you think about it! Share it to your friends and learn new things together.
Transcript
Scientia Iranica B (2021) 28(4), 2250{2258
Sharif University of TechnologyScientia Iranica
Transactions B: Mechanical Engineeringhttp://scientiairanica.sharif.edu
Optimization of friction stir welding parameters withTaguchi method for maximum electrical conductivity inAl-1080 welded sections
R. Delir Nazarloua, B. Nemati Akhgarb, and F. Omidbakhsha;�
a. Department of Mechanical Engineering, College of Engineering, Tabriz Branch, Islamic Azad University, Tabriz, Iran.b. Department of Mining Engineering, Engineering Faculty, Urmia University, Urmia, P.O. Box 57561/51818, Iran.
Received 1 August 2020; received in revised form 14 October 2020; accepted 21 March 2021
KEYWORDSTaguchi method;Electricalconductivity;Welding parameters;ANOVA test;1080 aluminum.
Abstract. This paper attempts to optimize welding parameters. The strength andquality of FSWed (Friction Stir Welding) sections are a�ected by materials transfer, workhardening, and transformations. These properties depend strongly on materials transfer,which is under the control of welding parameters. The soundness of friction stir weldedsections is usually studied by Non Destructive Test (NDT) techniques. However, it couldbe characterized by physical properties such as electrical conductivity. The higher electricalconductivity implies less defects and higher welding quality. For this purpose, the TaguchiL9 orthogonal design of experiment was used to optimize the welding parameters. Theoptimum process parameters and their e�ectiveness in the electrical conductivity of weldedsections were analyzed by Signal-to-Noise (S=N) ratio and Analysis Of Variance (ANOVA)tests. The results indicated that the tilt angle and tool shape were the most in uentialparameters to catch the maximum conductivity in welded joints. The optimum tool shapeand tilt angle were cylindrical and 3�, respectively. The optimum conditions for weldingand rotational speeds were characterized by 100 mm/min and 900 rpm in the stir zone,250 mm/min and 900 rpm in Advancing Side (AS), and 100 mm/min and 450 rpm inRetreating Side (RS), respectively.© 2021 Sharif University of Technology. All rights reserved.
1. Introduction
Friction Stir Welding (FSW) as a solid state joiningtechnique was developed by TWI in 1991 [1]. In FSW,a non-consumable tool rotates between two parts ata constant speed [2]. The rotation of a pin providesfrictional heat that facilitates the transfer of materialby hot deformation of plasticized materials [3]. Joiningprocess with FSW is based on the deformed material
*. Corresponding author.E-mail addresses: [email protected] [email protected] (F. Omidbakhsh)
doi: 10.24200/sci.2021.56528.4772
deposition behind the rotating tool [4]. This weldingtechnique is suitable for materials such as aluminum,magnesium, and titanium. These alloys are wellknown for their poor weldability by conventional fusionwelding techniques [5,6].
In the last decade, many researches have beencarried out on the FSW mechanism to provide aninsight into the e�ects of process parameters on mate-rial transfer mechanism, microstructure variation, andmechanical properties of welded joints [7,8].
In the FSW process, several parameters a�ectthe soundness and strength of welded parts involvingwelding speed, rotational speed, tilt angle, tool shape,etc. [9,10]. The e�ects of process parameters onwelds properties have been investigated with a series
R. Delir Nazarlou et al./Scientia Iranica, Transactions B: Mechanical Engineering 28 (2021) 2250{2258 2251
of classical experimental test methods; however, theirinteractions have not been studied. Although thee�ects of these parameters on the joint properties havebeen well-approved [11,12], their simultaneous e�ectson the weld properties have not been well evaluated.In recent years, several attempts have been madeto optimize the welding parameters with Design ofExperiment (DOE) and Taguchi method [13,14]. TheDOE is an e�ective way to maximize the volume of datacollection and reduce the number of trials. Recently,Shunmugasundaram et al. [15] studied the e�ects ofrotational speed, welding speed, and tilt angle on thetensile strength of Al-5052 and 6063 alloys by TaguchiL9 orthogonal design. The results have con�rmed thatthe Taguchi design could be a very useful method topredict the modi�ed conditions of the welding process.
Regarding the developments of experimentalstudy methods in recent years, the statistical ex-perimental designs have been employed for a moree�cient analysis of various systems [16]. The statisticalexperimental design provides maximum data with highreliability through fewer experiments and leads togreater time saving and cost reduction. Goyal andGarg [17] studied the strength of FSWed aluminumwelded plates by Taguchi method with 5 factors and 6levels. Their research approved that the Taguchi designcould be a strong tool to predict the modi�ed weldingconditions. In Taguchi design, the optimum conditionscould be obtained in three statuses based on the desiredtarget of response such as \smaller is better", \larger isbetter", or \nominal is best". Simple statistical toolsof Signal-to-Noise ratio (S=N) and analysis of variance(ANOVA) are usually used with Taguchi design. Thestatistical methods are the main tools for predictingoptimal conditions and in uence of each factor onresponses [18,19]. These analyses would provide veryuseful information about the main e�ective parametersin the tests and their mutual interactions.
It is well known that the electrical conductivityof metals desponds on the phase distribution, grainsize, lattice defects density, point defects, dislocationsdensity, impurity concentration, residuals stresses, andmechanical strains [20]. On the other hand, the phasetransformations during the FSW process that providedi�erent zones involving Thermo-Mechanical A�ectedZone (TMAZ), Heat A�ected Zone (HAZ), and re-
crystallized regions a�ect the electrical conductivitysigni�cantly [21]. All of these phenomena are a�ectedby FSW parameters and number of heat inputs.
In aluminum alloys, the e�ects of phase trans-formations in TMAZ and HAZ zones lead to coarsedeformed recrystallized grains and some second-phaseprecipitations [22,23]. In aluminum alloys, second-phase precipitation is the most important strengthen-ing process that has prominent e�ects on the physicaland mechanical behavior of these alloys [24].
As mentioned above, defects density and phasetransformation a�ect the electrical conductivity ofFSWed aluminum parts. Therefore, electrical conduc-tivity could be used as an indirect and non-destructivemethod for welded parts quality characterization. Inthe last years, several attempts have been made tostudy the electrical resistivity variations due to FSW[20,25]. However, the electrical resistivity uctuationby welding parameters variation has not been studiedcompletely and there is not a comprehensive under-standing in this regard.
In this study, to prevent the precipitation andphase transformation e�ects on the electrical conduc-tivity of FSWed parts, pure commercial aluminumalloy was used. In order to optimize the electricalconductivity, an e�ort has been made to optimize theFSW parameters of 1080 alloy using Taguchi analysis.The aim was to investigate the e�ects of welding pa-rameters including tool shape, tilt angle, welding speed,and rotational speed on the electrical conductivity ofwelded sections. For this purpose, the Taguchi methodwas employed to predict the main e�ective parameterand �nally, to de�ne an optimized condition; the resultswere reviewed by S=N ratio analysis.
2. Experimental methods
2.1. Selection of materialsIn this research, samples were prepared from 1080aluminum alloy. Its chemical composition was analyzedby Spark Emission Spectrometer and the resultinganalysis is presented in Table 1.
This alloy is widely used in the electrical andchemical industries due to its high corrosion resistancewith high thermal and electrical conductivity [26].
Other characteristics of this series are excellent
Table 1. The chemical composition of AA1080.
ElementsSi Fe Cu Mn Mg Zn Cr Ni Ti Be Ca
Content (Wt. %) 0.08 0.14 0.01 0.007 0.03 0.01 0.005 0.007 0.012 None Trace
ElementsPb% Sn% Sr% V% Na% Bi% Zr% B% Ga% Li% Al%
Content (Wt. %) Trace < 0:002 None 0.013 Trace < 0:003 0.005 0.0005 0.01 None Balance
2252 R. Delir Nazarlou et al./Scientia Iranica, Transactions B: Mechanical Engineering 28 (2021) 2250{2258
workability and low mechanical properties [17]; how-ever, the strength and mechanical properties could beslightly improved with strain hardening [26]. Thesealloys are designated as non-heat treatable [27] andtheir microstructure is precipitate free [28]. Therefore,the electrical conductivity variation after the FSWwould not be a�ected due to the precipitation orageing processes, which are the dominant strengtheningmechanisms in aluminum alloys.
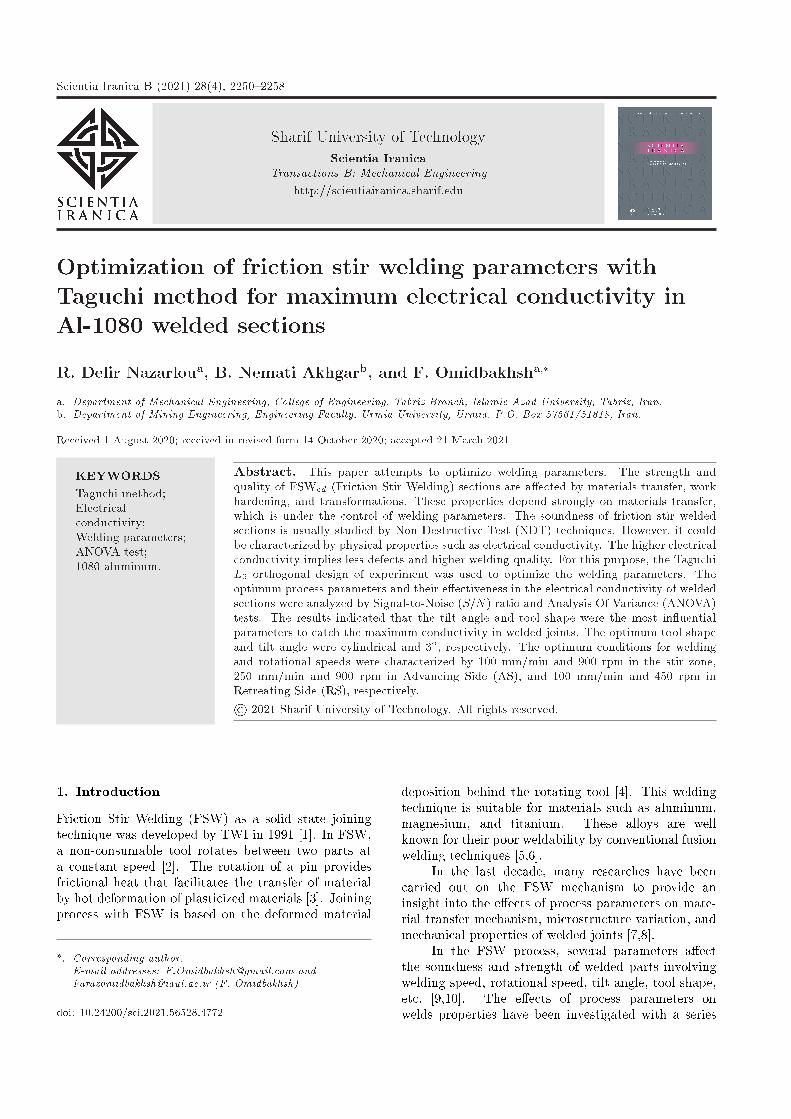
2.2. Samples and welding tools preparationThe plate lamination was checked by Ultrasonic Test-ing (UT) method. Samples were cut out by a wirecutter machine in the rolling direction with the dimen-sions 150 � 50 � 10 mm. The FSW tools were builtof H13 tools steel and were heat treated to the �nalhardness of 52HRc. The tools shape and dimensionsare shown in Figure 1.
2.3. Taguchi methodFor experimental design by Taguchi, four factors in-volving tool shape, tilt angle, welding speed, androtational speed were considered at three levels. Theselected parameters and levels for Taguchi design inthese experiments are presented in Table 2. Numbers1, 2, and 3 exhibit the lowest, mid, and highest levels,
Table 3. L9 (34) orthogonal array of Taguchi design andarrangement of selected parameters.
Exp. no. Toolshape
Tiltangle
Weldingspeed
Rotationalspeed
1 1 1 1 12 1 2 2 23 1 3 3 34 2 1 2 35 2 2 3 16 2 3 1 27 3 1 3 28 3 2 1 39 3 3 2 1
respectively. Four parameters at three levels mean thatthe L9 (34) orthogonal array of Taguchi design mustbe randomly performed in 9 runs (Table 3). The S=Nratio and ANOVA analysis were used for evaluation ofoptimum conditions.
2.4. Experimental procedureThe welding procedure was done by a vertical millingmachine equipped with a special �xture to restrain the
Figure 1. Tool design and dimensions of Friction Stir Welding (FSW) prepared in the welding process.
Table 2. Process parameters and their levels used in the experiments.
Parameters Symbol Level 1 Level 2 Level 3
Tool shape TS Cylindrical Square TriangleTilt angle TA 1 degree 2 degrees 3 degrees
Welding speed WS 100 mm/min 160 mm/min 250 mm/minRotational speed RS 450 rpm 900 rpm 1120 rpm
R. Delir Nazarlou et al./Scientia Iranica, Transactions B: Mechanical Engineering 28 (2021) 2250{2258 2253
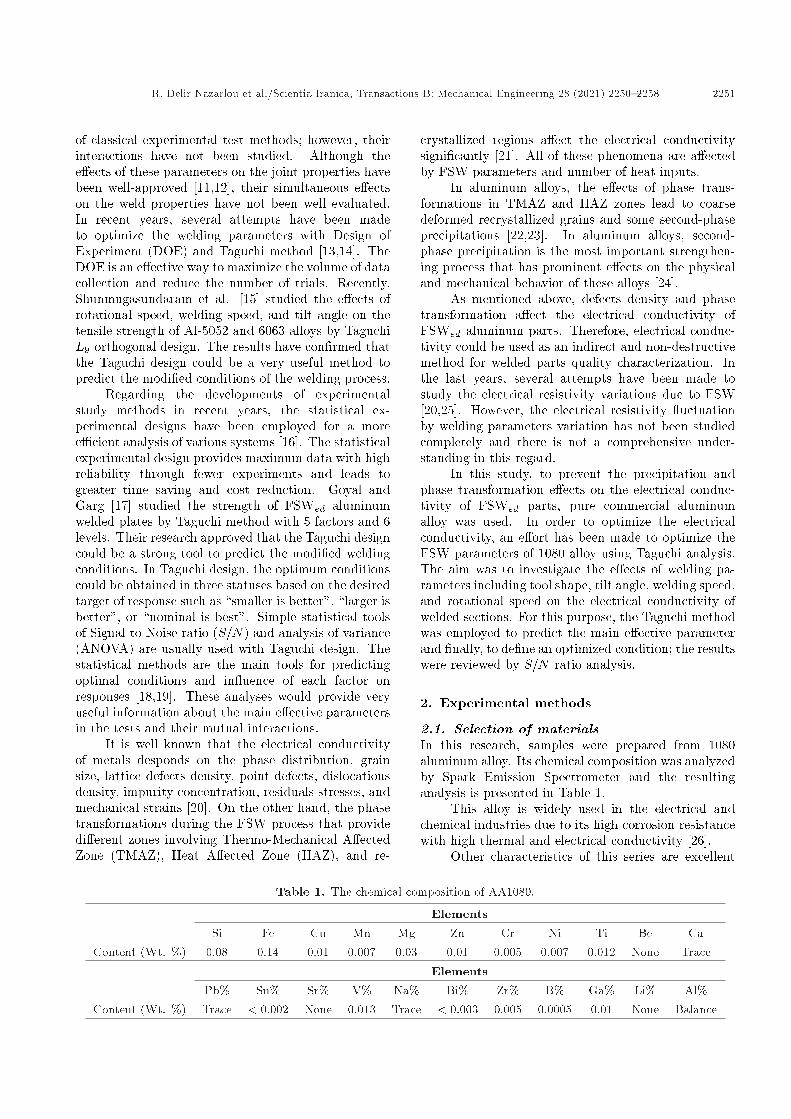
Figure 2. Friction stir welding setup used for welding ofaluminum samples.
samples. The FSW setup used in this experiment isshown in Figure 2. The cross-section of the weldedspecimen is presented in Figure 3.
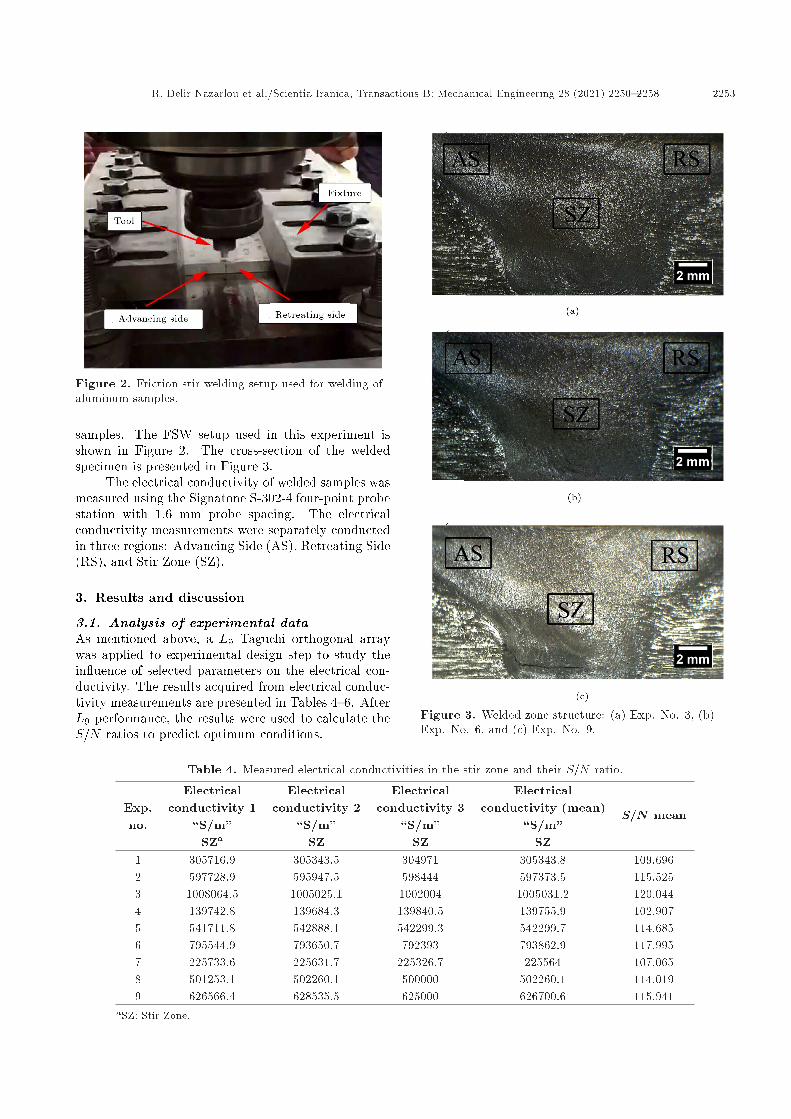
The electrical conductivity of welded samples wasmeasured using the Signatone S-302-4 four-point probestation with 1.6 mm probe spacing. The electricalconductivity measurements were separately conductedin three regions: Advancing Side (AS), Retreating Side(RS), and Stir Zone (SZ).
3. Results and discussion
3.1. Analysis of experimental dataAs mentioned above, a L9 Taguchi orthogonal arraywas applied to experimental design step to study thein uence of selected parameters on the electrical con-ductivity. The results acquired from electrical conduc-tivity measurements are presented in Tables 4{6. AfterL9 performance, the results were used to calculate theS=N ratios to predict optimum conditions.
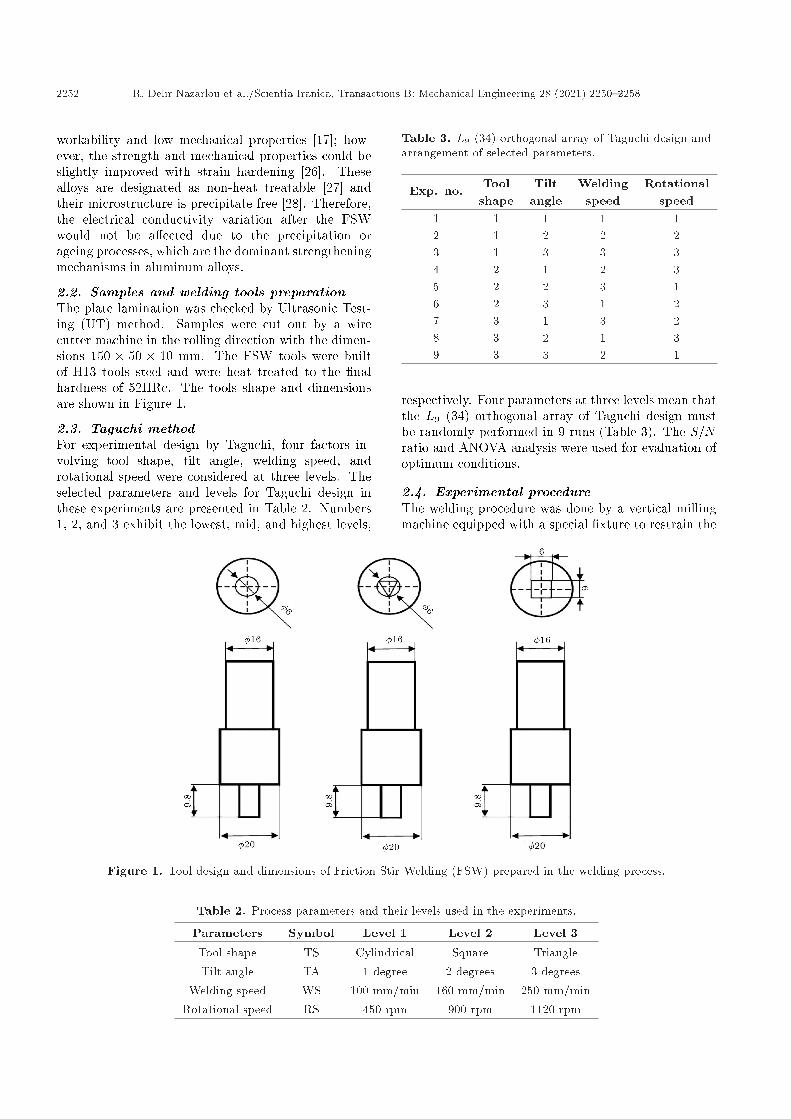
Figure 3. Welded zone structure: (a) Exp. No. 3, (b)Exp. No. 6, and (c) Exp. No. 9.
Table 4. Measured electrical conductivities in the stir zone and their S=N ratio.
Exp.no.
Electricalconductivity 1
\S/m"SZa
Electricalconductivity 2
\S/m"SZ
Electricalconductivity 3
\S/m"SZ
Electricalconductivity (mean)
\S/m"SZ
S=N mean
1 305716.9 305343.5 304971 305343.8 109.6962 597728.9 595947.5 598444 597373.5 115.5253 1008064.5 1005025.1 1002004 1005031.2 120.0444 139742.8 139684.3 139840.5 139755.9 102.9075 541711.8 542888.1 542299.3 542299.7 114.6856 795544.9 793650.7 792393 793862.9 117.9957 225733.6 225631.7 225326.7 225564 107.0658 501253.1 502260.1 500000 502260.1 114.0199 626566.4 628535.5 625000 626700.6 115.941
aSZ: Stir Zone.
2254 R. Delir Nazarlou et al./Scientia Iranica, Transactions B: Mechanical Engineering 28 (2021) 2250{2258
Table 5. Measured electrical conductivities in the advancing side and their S=N ratio.
Exp.no.
Electricalconductivity 1
\S/m"ASa
Electricalconductivity 2
\S/m"AS
Electricalconductivity 3
\S/m"AS
Electricalconductivity (mean)
\S/m"AS
S=N mean
1 311138.7 310752 310559 310816.6 109.8502 1262626.2 1257861.6 1253132.8 1257874 121.9933 1386962.5 1381215.4 1375515.8 1381231 122.8054 145751.3 145645.2 145708.8 145701.8 103.2695 738007.3 740192.4 735835.1 738011.7 117.3616 918273.6 922509.2 925069.3 921950.8 119.2947 239808.1 239635.7 239348.9 239597.6 107.5908 648929.2 648088.1 645577.7 647531.7 116.2259 842459.9 846023.6 843881.8 844121.8 118.528
aAS: Advancing Side.
Table 6. Measured electrical conductivities the retreating side and their S=N ratio.
Exp.no.
Electricalconductivity 1
\S/m"RSa
Electricalconductivity 2
\S/m"RS
Electricalconductivity 3
\S/m"RS
Electricalconductivity (mean)
\S/m"RS
S=N mean
1 301295.5 301659.1 301932.3 301629 109.5892 540540.5 539374.3 537923.6 539279.5 114.6363 583771.1 582750.5 581733.5 582751.8 115.3104 127404.7 127485.9 127437.2 127442.7 102.1065 496277.9 497265 495294.7 496279.2 113.9156 596658.7 598444 595592.6 596898.5 115.5187 157232.7 157133.8 157035.1 157133.9 103.9258 334112.9 333667 333444.4 333741.5 110.4689 469924.8 471475.7 470588.2 470662.9 113.454
aRS: Retreating Side.
The S=N analysis was performed to �nd theoptimized condition. Since the target of the study is tooptimize the welding parameters to catch the weldingcondition with the highest electrical conductivity, thecorresponding S=N ratio analysis was performed using\larger is better" approach. The S=N ratio wascalculated through Eq. (1) [18]:
S=N = �10 log
1n
nXi=1
1y2i
!; (1)
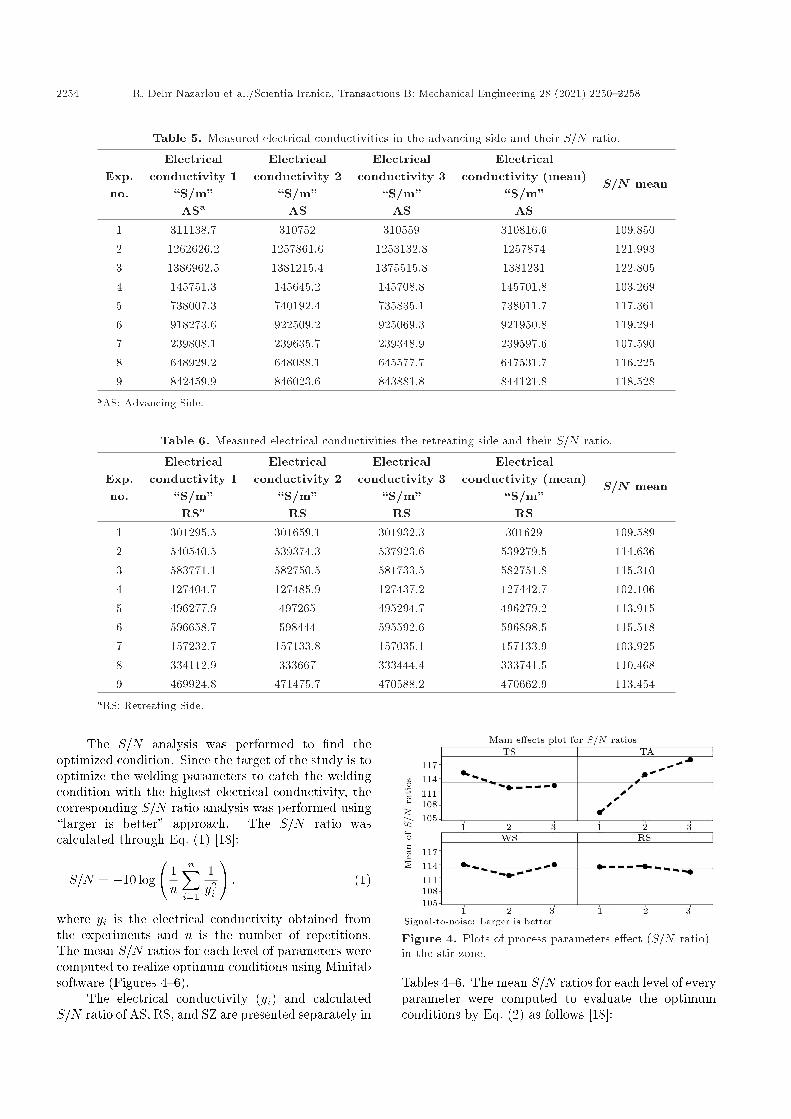
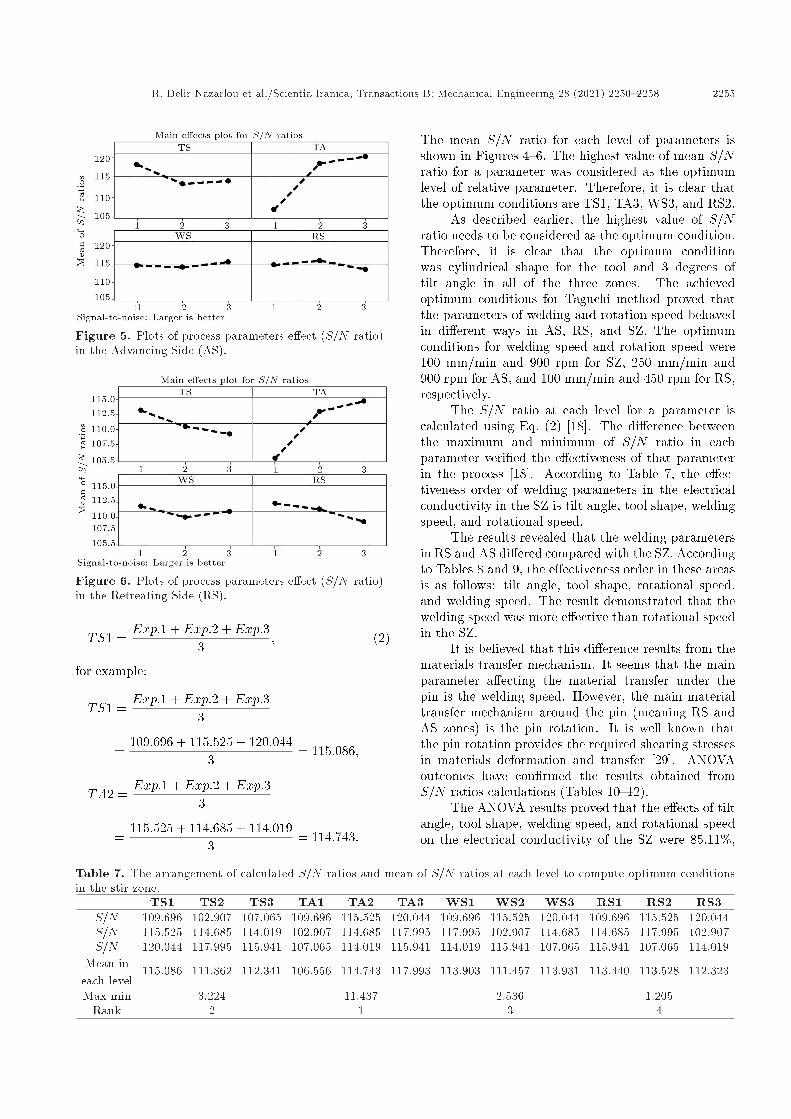
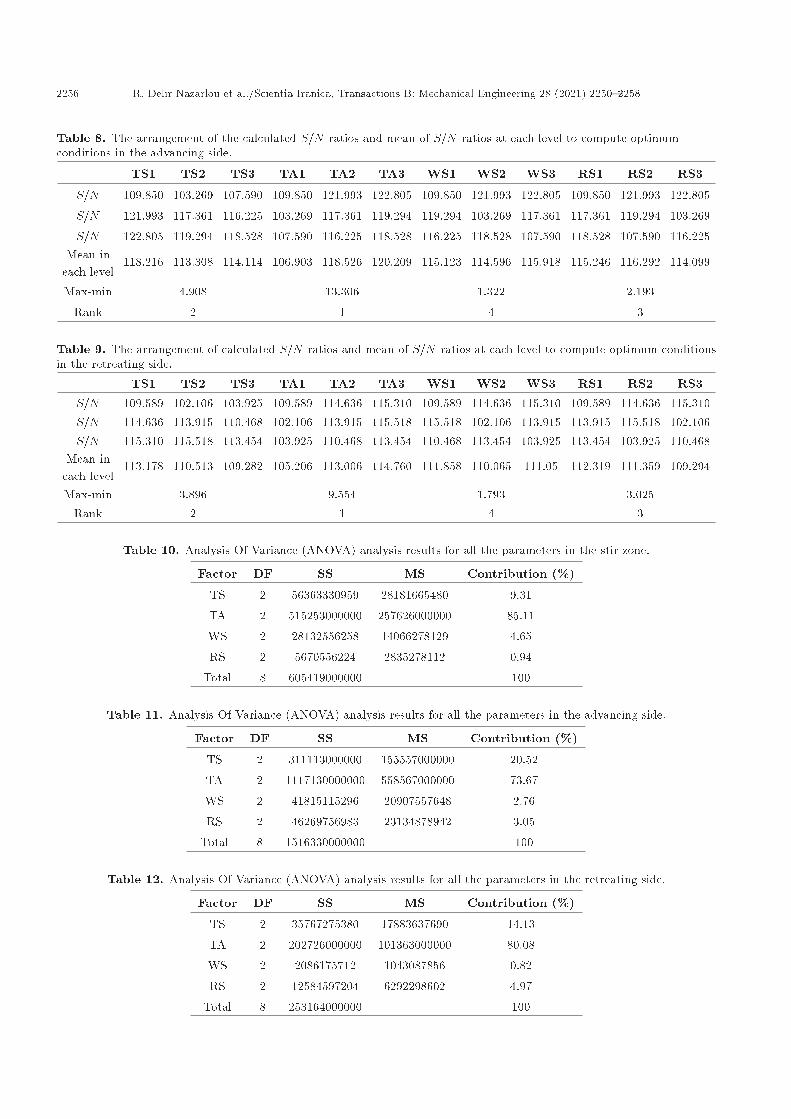
where yi is the electrical conductivity obtained fromthe experiments and n is the number of repetitions.The mean S=N ratios for each level of parameters werecomputed to realize optimum conditions using Minitabsoftware (Figures 4{6).
The electrical conductivity (yi) and calculatedS=N ratio of AS, RS, and SZ are presented separately in
Figure 4. Plots of process parameters e�ect (S=N ratio)in the stir zone.
Tables 4{6. The mean S=N ratios for each level of everyparameter were computed to evaluate the optimumconditions by Eq. (2) as follows [18]:
R. Delir Nazarlou et al./Scientia Iranica, Transactions B: Mechanical Engineering 28 (2021) 2250{2258 2255
Figure 5. Plots of process parameters e�ect (S=N ratio)in the Advancing Side (AS).
Figure 6. Plots of process parameters e�ect (S=N ratio)in the Retreating Side (RS).
TS1 =Exp:1 + Exp:2 + Exp:3
3; (2)
for example:
TS1 =Exp:1 + Exp:2 + Exp:3
3
=109:696 + 115:525 + 120:044
3= 115:086;
TA2 =Exp:1 + Exp:2 + Exp:3
3
=115:525 + 114:685 + 114:019
3= 114:743:
The mean S=N ratio for each level of parameters isshown in Figures 4{6. The highest value of mean S=Nratio for a parameter was considered as the optimumlevel of relative parameter. Therefore, it is clear thatthe optimum conditions are TS1, TA3, WS3, and RS2.
As described earlier, the highest value of S=Nratio needs to be considered as the optimum condition.Therefore, it is clear that the optimum conditionwas cylindrical shape for the tool and 3 degrees oftilt angle in all of the three zones. The achievedoptimum conditions for Taguchi method proved thatthe parameters of welding and rotation speed behavedin di�erent ways in AS, RS, and SZ. The optimumconditions for welding speed and rotation speed were100 mm/min and 900 rpm for SZ, 250 mm/min and900 rpm for AS, and 100 mm/min and 450 rpm for RS,respectively.
The S=N ratio at each level for a parameter iscalculated using Eq. (2) [18]. The di�erence betweenthe maximum and minimum of S=N ratio in eachparameter veri�ed the e�ectiveness of that parameterin the process [18]. According to Table 7, the e�ec-tiveness order of welding parameters in the electricalconductivity in the SZ is tilt angle, tool shape, weldingspeed, and rotational speed.
The results revealed that the welding parametersin RS and AS di�ered compared with the SZ. Accordingto Tables 8 and 9, the e�ectiveness order in these areasis as follows: tilt angle, tool shape, rotational speed,and welding speed. The result demonstrated that thewelding speed was more e�ective than rotational speedin the SZ.
It is believed that this di�erence results from thematerials transfer mechanism. It seems that the mainparameter a�ecting the material transfer under thepin is the welding speed. However, the main materialtransfer mechanism around the pin (meaning RS andAS zones) is the pin rotation. It is well known thatthe pin rotation provides the required shearing stressesin materials deformation and transfer [29]. ANOVAoutcomes have con�rmed the results obtained fromS=N ratios calculations (Tables 10{12).
The ANOVA results proved that the e�ects of tiltangle, tool shape, welding speed, and rotational speedon the electrical conductivity of the SZ were 85.11%,
Table 7. The arrangement of calculated S=N ratios and mean of S=N ratios at each level to compute optimum conditionsin the stir zone.
TS1 TS2 TS3 TA1 TA2 TA3 WS1 WS2 WS3 RS1 RS2 RS3S=N 109.696 102.907 107.065 109.696 115.525 120.044 109.696 115.525 120.044 109.696 115.525 120.044S=N 115.525 114.685 114.019 102.907 114.685 117.995 117.995 102.907 114.685 114.685 117.995 102.907S=N 120.044 117.995 115.941 107.065 114.019 115.941 114.019 115.941 107.065 115.941 107.065 114.019
Mean ineach level
115.086 111.862 112.341 106.556 114.743 117.993 113.903 111.457 113.931 113.440 113.528 112.323
Max-min 3.224 11.437 2.536 1.205Rank 2 1 3 4
2256 R. Delir Nazarlou et al./Scientia Iranica, Transactions B: Mechanical Engineering 28 (2021) 2250{2258
Table 8. The arrangement of the calculated S=N ratios and mean of S=N ratios at each level to compute optimumconditions in the advancing side.
TS1 TS2 TS3 TA1 TA2 TA3 WS1 WS2 WS3 RS1 RS2 RS3
S=N 109.850 103.269 107.590 109.850 121.993 122.805 109.850 121.993 122.805 109.850 121.993 122.805
S=N 121.993 117.361 116.225 103.269 117.361 119.294 119.294 103.269 117.361 117.361 119.294 103.269
S=N 122.805 119.294 118.528 107.590 116.225 118.528 116.225 118.528 107.590 118.528 107.590 116.225Mean in
each level118.216 113.308 114.114 106.903 118.526 120.209 115.123 114.596 115.918 115.246 116.292 114.099
Max-min 4.908 13.306 1.322 2.193
Rank 2 1 4 3
Table 9. The arrangement of calculated S=N ratios and mean of S=N ratios at each level to compute optimum conditionsin the retreating side.
TS1 TS2 TS3 TA1 TA2 TA3 WS1 WS2 WS3 RS1 RS2 RS3
S=N 109.589 102.106 103.925 109.589 114.636 115.310 109.589 114.636 115.310 109.589 114.636 115.310S=N 114.636 113.915 110.468 102.106 113.915 115.518 115.518 102.106 113.915 113.915 115.518 102.106S=N 115.310 115.518 113.454 103.925 110.468 113.454 110.468 113.454 103.925 113.454 103.925 110.468
Mean ineach level
113.178 110.513 109.282 105.206 113.006 114.760 111.858 110.065 111.05 112.319 111.359 109.294
Max-min 3.896 9.554 1.793 3.025Rank 2 1 4 3
Table 10. Analysis Of Variance (ANOVA) analysis results for all the parameters in the stir zone.
Factor DF SS MS Contribution (%)
TS 2 56363330959 28181665480 9.31
TA 2 515253000000 257626000000 85.11
WS 2 28132556258 14066278129 4.65
RS 2 5670556224 2835278112 0.94
Total 8 605419000000 100
Table 11. Analysis Of Variance (ANOVA) analysis results for all the parameters in the advancing side.
Factor DF SS MS Contribution (%)
TS 2 311113000000 155557000000 20.52
TA 2 1117130000000 558567000000 73.67
WS 2 41815115296 20907557648 2.76
RS 2 46269756983 23134878942 3.05
Total 8 1516330000000 100
Table 12. Analysis Of Variance (ANOVA) analysis results for all the parameters in the retreating side.
Factor DF SS MS Contribution (%)
TS 2 35767275380 17883637690 14.13
TA 2 202726000000 101363000000 80.08
WS 2 2086175712 1043087856 0.82
RS 2 12584597204 6292298602 4.97
Total 8 253164000000 100
R. Delir Nazarlou et al./Scientia Iranica, Transactions B: Mechanical Engineering 28 (2021) 2250{2258 2257
9.31%, 4.65%, and 0.94%, respectively. Also, the con-tribution parameters for the electrical conductivity inthe AS were 73.67%, 20.52%, 3.05%, 2.76% and on theRS were 80.08%, 14.13%, 4.97%, and 0.82% for tiltangle, tool shape, welding speed, and rotational speed,respectively.
4. Conclusion
This study investigated the e�ects of tool shape,tilt angle, rotational speed, and welding speed onthe electrical conductivity of Al-1080 joint by usingTaguchi method and Analysis Of Variance (ANOVA)analysis. Results of Signal-to-Noise (S=N) analysisindicated that the optimal condition could be achievedfor cylindrical pin and three-degree tilt angle. Onthe other hand, the optimum rotational speed andthe welding speed in the stir zone and AdvancingSide (AS) were 900 rpm and 100 mm/min. However,in the retreating side, the optimum condition wascharacterized by 900 rpm and 250 mm/min.
Based on S=N ratio results, the e�ectiveness ofparameters to achieve the maximum electrical con-ductivity in the stir zone was ordered as follows:tilt angle, tool shape, welding speed, and rotationalspeed. Moreover, in advancing and retreating sides,the e�ectiveness of parameters for maximum electricalconductivity was ordered as: tilt angle, tool shape,rotational speed and welding speed.
The main e�ective parameter for materials trans-fer mechanism under the pin was the welding speed;however, the main e�ective parameter for materialstransfer mechanism around the pin was the rotationalspeed.
Finally, ANOVA analysis indicated that the e�ec-tiveness of tool shape, tilt angle, rotational speed, andwelding speed parameters in the electrical conductivityof joint was 9.31%, 85.11%, 4.65%, and 0.95% in thestir zone as well as 20.52%, 73.67%, 2.76%, and 3.05%in the AS and 14.13%, 80.08%, 0.82%, and 4.97% inthe retreating side, respectively.
Nomenclature
TS Tool ShapeTA Tilt AngleWS Welding SpeedRS Rotational SpeedSZ Stir ZoneAS Advancing SideRS Retreating SideANOVA Analysis Of VarianceDOE Design Of ExperimentS/m Siemens per meter
S=N Signal-to-Noise ratioyi Electrical conductivity obtained from
the experimentsn The number of repetitionsDOF Degree of FreedomSS Sum of Squares of treatmentsMS Mean Square
References
1. Mishra, R.S. and Ma, Z.Y. \Friction stir weldingand processing", Materials Science and Engineering.,50(1{2), pp. 1{78 (2005).
2. Sato, Y.S., Urata, M., and Kokawa, H. \Param-eters controlling microstructure and hardness dur-ing friction-stir welding of precipitation-hardenablealuminum alloy 6063", Metallurgical and Materials,Transactions A., 33(3), pp. 625{635 (2002).
3. Colligan, K. \Material ow behavior during frictionwelding of aluminum", Weld J., 75(7), pp. 229s{237s(1999).
4. Malik, V., Sanjeev, N.K., and Hebbar, H.S. \Investiga-tions on the e�ect of various tool pin pro�les in frictionstir welding using �nite element simulations", ProcediaEngineering., 97, pp. 1060{1068 (2014).
5. Akinlabi, E.D. Madyira, D.M., and Akinlabi, S. \E�ectof heat input on the electrical resistivity of dissimilarfriction stir welded joints of aluminium and copper",AFRICON IEEE., pp. 1{4 (2011).
6. Darras, B.M., Khraisheh, M.K., and Abu-Farha, F.K.\Friction stir processing of commercial AZ31 magne-sium alloy", Journal of Materials Processing Technol-ogy., 191(1{3), pp. 77{81 (2007).
7. Avettand Feno�el, M.N., Taillard, R. Ji, G. and Goran,D. \Multiscale study of interfacial intermetallic com-pounds in a dissimilar Al 6082-T6/Cu friction-stirweld", Metallurgical and Materials, Transactions A.,43(12), pp. 4655{4666 (2012).
8. Yang, J., He, J., and Guan, X. \A probabilistic cracksize quanti�cation method using in-situ Lamb wavetest and Bayesian updating", Mechanical Systems andSignal Processing., 78, pp. 118{133 (2016).
9. Hou, J.H., Liu, H.J., and Zhao, Y. \In uences ofrotation speed on microstructures and mechanicalproperties of 6061-T6 aluminum alloy joints fabricatedby self-reacting friction stir welding tool", 73(5{8), pp.1073{1079 (2014).
10. Delir Nazarlou, R., Omidbakhsh, F., and MollaeiMilani, J. \E�ect of rotational speed in friction stirwelding on the material transfer mechanism in com-mercial pure aluminum", Journal of Welding Scienceand Technology of Iran, 6(1), pp. 9{17 (2020).
11. Anawa, E. and Olabi, A.G. \Using Taguchi methodto optimize welding pool of dissimilar laser-weldedcomponents", Optics & Laser Technology., 40(2), pp.379{388 (2008).
2258 R. Delir Nazarlou et al./Scientia Iranica, Transactions B: Mechanical Engineering 28 (2021) 2250{2258
12. Chien, C.H., Lin, W.B., and Chen, T. \Optimal FSWprocess parameters for aluminum alloys AA5083",Journal of the Chinese Institute of Engineers., 34(1),pp. 99{105 (2011).
13. Ugrasen, G., Bharath, G., and Kumar, G.K. \Op-timization of process parameters for Al6061-Al7075alloys in friction stir welding using Taguchi's tech-nique", Materials Today Proceedings., 5(1), pp. 3027{3035 (2018).
14. Sahu, P.K. and Pal, S. \Multi-response optimizationof process parameters in friction stir welded AM20magnesium alloy by Taguchi grey relational analysis",Journal of Magnesium and Alloys., 3(1), pp. 36{46(2015).
15. Shunmugasundaram, M., Kumar, A.P., Sankar, L.P.\Optimization of process parameters of friction stirwelded dissimilar AA6063 and AA5052 aluminum al-loys by Taguchi technique", Materials Today Proceed-ings (2020).
16. Panda, M.R., Mahapatraand, S.S., and Mohanty, C.P.\Parametric investigation of friction stir welding onAA6061 using Taguchi technique", Materials TodayProceedings, 2(4{5), pp. 2399{2406 (2015).
17. Goyal, A. and Garg, R.K. \Establishing mathematicalrelationships to study tensile behavior of friction stirwelded AA5086-H32 aluminium alloy joints", Silicon,11(1), pp. 51{65 (2019).
18. Akhgar, B.N., Pazouki, M., and Ranjbar, M. \Appli-cation of Taguchi method for optimization of syntheticrutile nano powder preparation from ilmenite concen-trate", Chemical Engineering Research and Design,90(2), pp. 220{228 (2012).
19. Kele�s, O. \An optimization study on the cementationof silver with copper in nitrate solutions by Taguchi de-sign", Hydrometallurgy, 95(3{4), pp. 333{336 (2009).
20. Akinlabi, E.T., Akinlabi, S.A., and Surekha, K. \E�ectof friction stir processing on the electrical resistivity ofAA 6082", African IEEE, pp. 1{4 (2011).
21. Sharma, N., Khan, Z.A., Siddiquee, A.N. \E�ect ofprocess parameters on microstructure and electricalconductivity during FSW of Al-6101 and pure copper",Materials Research Express., 5(4), p. 046519 (2018).
22. Kahl, S. \Fatigue strength of friction stir welds in alu-minium alloy AA6082-T6", TWI Friction Stir WeldingSymposium (2010).
23. Kafali, H. and Ay, N. \Mechanical properties of6013-T6 aluminium alloy friction stir welded plate",13th International Conference Aerospace Sciences &Aviation Technology (2009).
24. Wan, L., Huang, Y., and Wang, Y. \Friction stirwelding of aluminium hollow extrusion: weld forma-tion and mechanical properties", Materials Scienceand Technology, 31(12), pp. 1433{1442 (2015).
25. Lee, E.W., Oppenheim, T., and Robinson, K. \The ef-fect of thermal exposure on the electrical conductivityand static mechanical behavior of several age harden-able aluminum alloys", Engineering Failure Analysis,14(8), pp. 1538{1549 (2007).
26. Frigaard, �., Grong, �., and Midling, O. \A processmodel for friction stir welding of age hardening alu-minum alloys", Metallurgical and Materials Transac-tions A, 32(5), pp. 1189{1200 (2001).
27. Gu, J., Ding, J., and Williams, S.W. \The e�ectof inter-layer cold working and post-deposition heattreatment on porosity in additively manufacturedaluminum alloys", Journal of Materials ProcessingTechnology, 230, pp. 26{34 (2016).
28. Silva, M.R., Gouyon, R., and Lepoutre, F. \Hiddencorrosion detection in aircraft aluminum structuresusing laser ultrasonic and wavelet transform signalanalysis", Ultrasonics, 41(4), pp. 301{305 (2003).
29. Liu, H.J., Fujii, H., and Maeda, M. \Tensile propertiesand fracture locations of friction-stir-welded jointsof 2017-T351 aluminum alloy", Journal of MaterialsProcessing Technology, 142(3), pp. 692{696 (2003).
Biographies
Ramin Delir Nazarlou is an MSc student of Me-chanical Engineering at the Mechanical EngineeringDepartment of Islamic Azad University, Tabriz branch.He is an expert in the mechanical and physical behaviorof metallic materials. His main research interestsare the welding and joining technology, nondestruc-tive testing, and corrosion of the materials. He isparticularly interested in issues concerning friction stirwelding.
Behzad Nemati Akhgar is an Assistant Professorof Mining Science and Engineering at the MiningEngineering Department of the Engineering Faculty ofUrmia University. His main research interests are themining technology, nondestructive testing of materials,and surface mining.
Faraz Omidbakhsh is an Assistant Professor ofMaterial Science and Engineering at the MechanicalEngineering Department of the Islamic Azad Univer-sity, Tabriz branch. He is an expert in the mechanicaland physical behavior of metallic materials. Hismain research interests are the fatigue fracture andmicromechanics, oxidation of titanium alloys, FrictionStir Welding (FSW) of light alloys, and surface engi-neering.
Related Documents