Our Beliefs Respect Collaboration Excellence Integrity Community Robert D. Lotz, PHD BorgWarner Turbo Systems November, 2015 Optimization of a Turbo Charger Compressor using AxCent and modeFRONTIER

Welcome message from author
This document is posted to help you gain knowledge. Please leave a comment to let me know what you think about it! Share it to your friends and learn new things together.
Transcript
Our Beliefs
Respect
Collaboration
Excellence
Integrity
Community
Robert D. Lotz, PHD
BorgWarner Turbo Systems
November, 2015
Optimization of a Turbo Charger Compressor using AxCent and modeFRONTIER
Copyright © 2015 BorgWarner Inc.
Outline
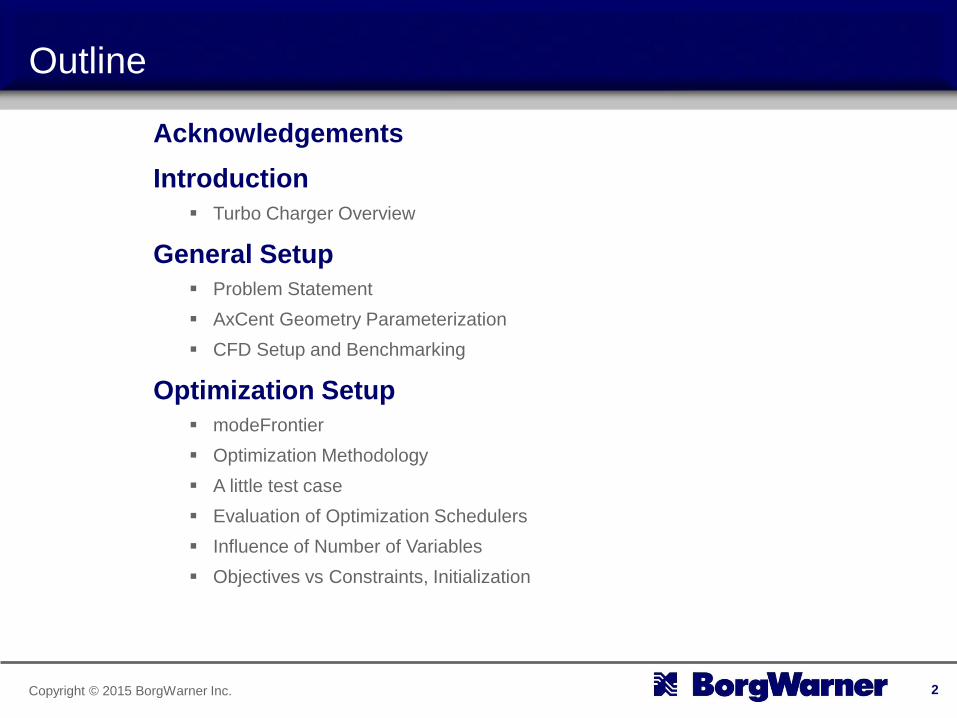
Acknowledgements
Introduction
Turbo Charger Overview
General Setup
Problem Statement
AxCent Geometry Parameterization
CFD Setup and Benchmarking
Optimization Setup
modeFrontier
Optimization Methodology
A little test case
Evaluation of Optimization Schedulers
Influence of Number of Variables
Objectives vs Constraints, Initialization
2
Copyright © 2015 BorgWarner Inc.
Outline
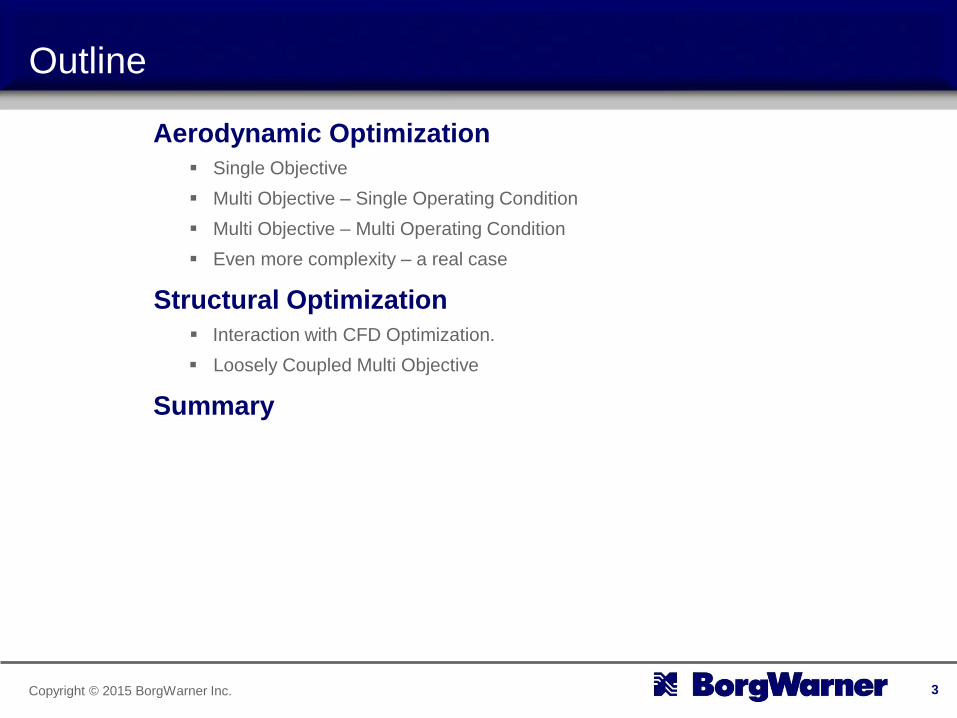
Aerodynamic Optimization
Single Objective
Multi Objective – Single Operating Condition
Multi Objective – Multi Operating Condition
Even more complexity – a real case
Structural Optimization
Interaction with CFD Optimization.
Loosely Coupled Multi Objective
Summary
3
Copyright © 2015 BorgWarner Inc.
Acknowledgements
I am very grateful to ESTECO for allowing me to participate in this User
Meeting.
I will try to present optimization and analysis of turbo machines from the
view point of an engineer/designer. My experience is based on
turbocharger compressors (i.e. small, low cost, wide map width radial
impellers).
This talk was adapted from a Seminar presentation. I will describe my
approach to using numerical and optimization methods to improve turbo
designs, but also the path I took in arriving at this methodology.
4

Copyright © 2015 BorgWarner Inc.
Approach
Design of turbocharger impellers is time and resource intensive. Current
designs are relatively close to optimal, the effort required to improve
performance is high.
Multiple iterations between design and gas stand testing are typically
required. We would like to replace some of the testing with numerical
simulations.
For a formal optimization (not just a DOE), typically hundreds to
thousands of designs need to be evaluated. This cannot possibly be
accomplished using testing alone.
My approach tries to combine a fast simplified 3D CFD analysis method
with a geometrically (somewhat) complex model. This has shown some
promising results in practice, but does have some known drawbacks as
well.
There are different philosophies how to balance accuracy and
complexity.
5

Copyright © 2015 BorgWarner Inc.
Introduction
6
Copyright © 2015 BorgWarner Inc.
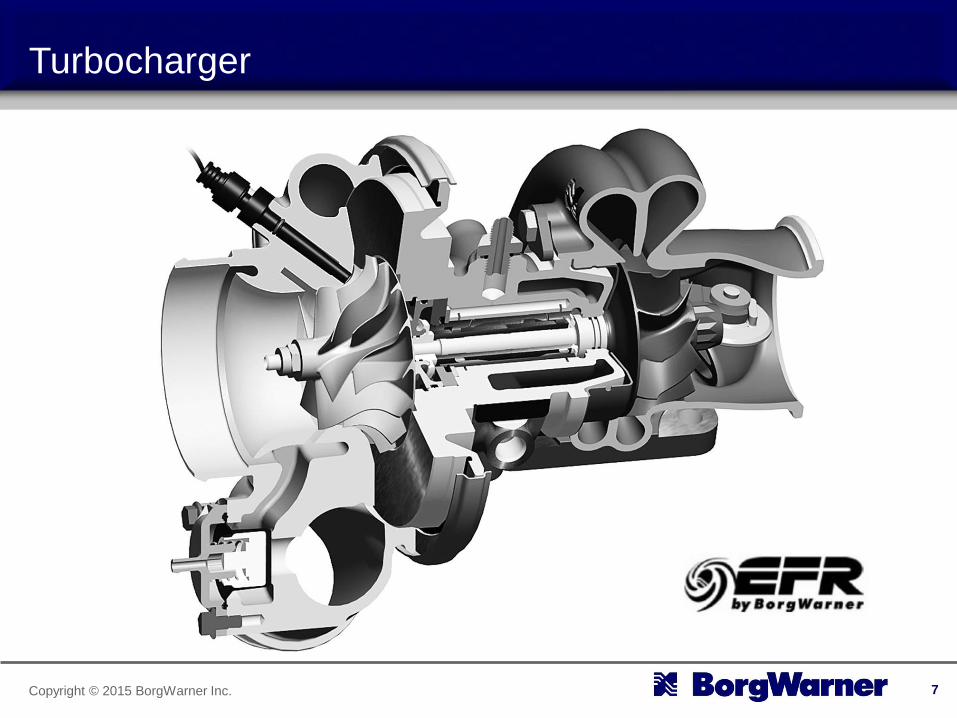
Turbocharger
7
Copyright © 2015 BorgWarner Inc.
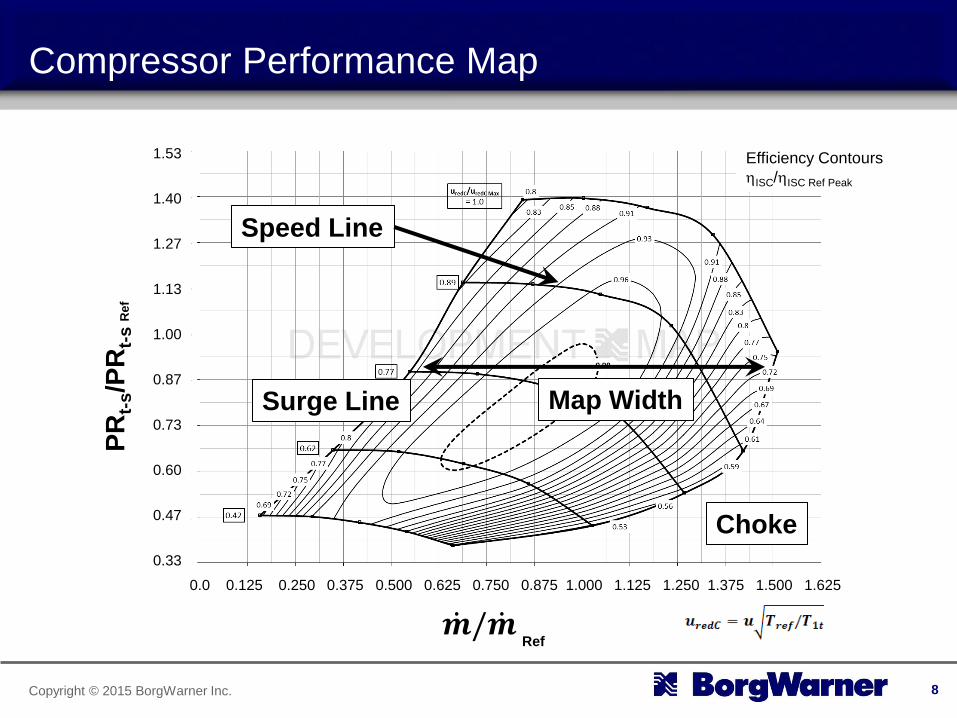
Compressor Performance Map
8
1.53
1.40
1.27
1.13
1.00
0.87
0.73
0.60
0.47
0.33
PR
t-s/P
Rt-
s R
ef
𝒎 /𝒎 Ref
0.0 0.125 0.250 0.375 0.500 0.625 0.750 0.875 1.000 1.125 1.250 1.375 1.500 1.625
Map Width
Efficiency Contours
hISC/hISC Ref Peak
Surge Line
Choke
Speed Line
Copyright © 2015 BorgWarner Inc.
General Setup
9
Copyright © 2015 BorgWarner Inc.
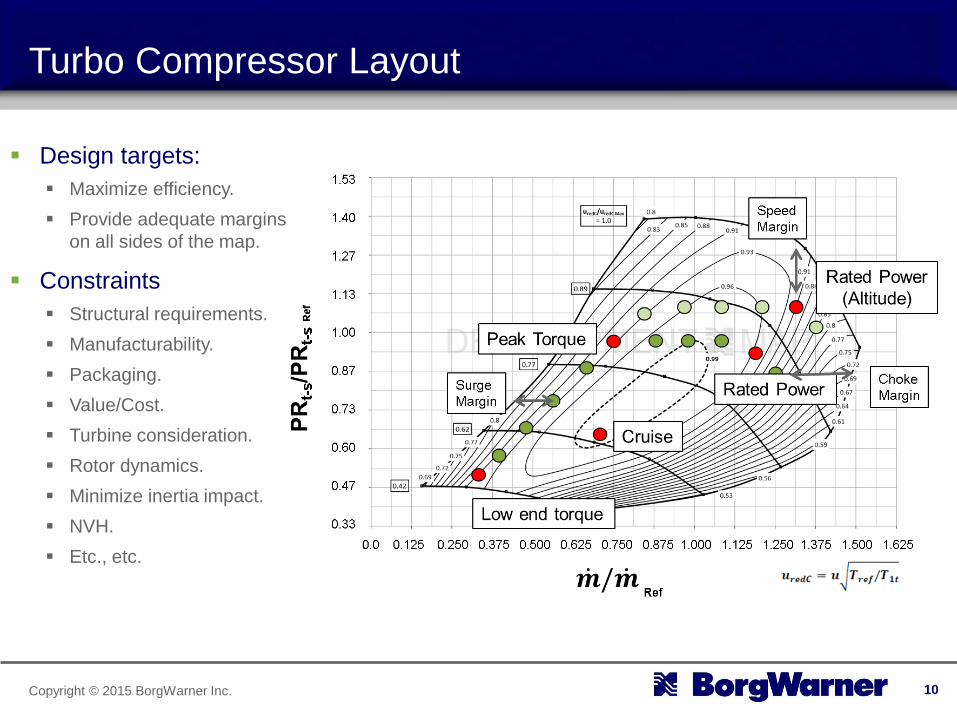
Turbo Compressor Layout
Design targets:
Maximize efficiency.
Provide adequate margins
on all sides of the map.
Constraints
Structural requirements.
Manufacturability.
Packaging.
Value/Cost.
Turbine consideration.
Rotor dynamics.
Minimize inertia impact.
NVH.
Etc., etc.
10
Copyright © 2015 BorgWarner Inc.
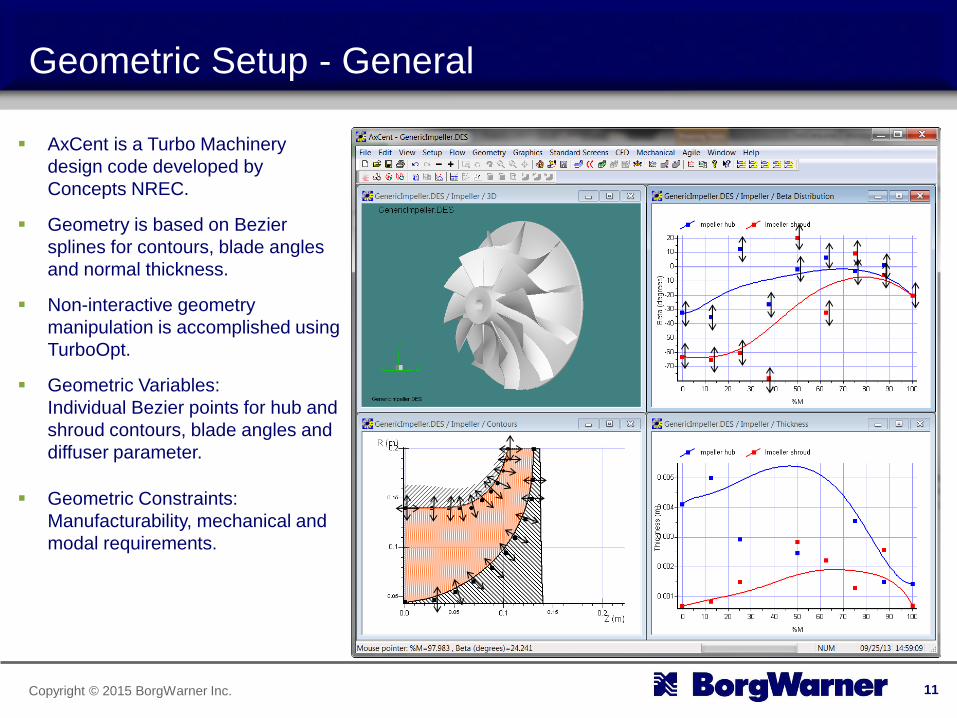
Geometric Setup - General
AxCent is a Turbo Machinery
design code developed by
Concepts NREC.
Geometry is based on Bezier
splines for contours, blade angles
and normal thickness.
Non-interactive geometry
manipulation is accomplished using
TurboOpt.
Geometric Variables:
Individual Bezier points for hub and
shroud contours, blade angles and
diffuser parameter.
Geometric Constraints:
Manufacturability, mechanical and
modal requirements.
11
Copyright © 2015 BorgWarner Inc.
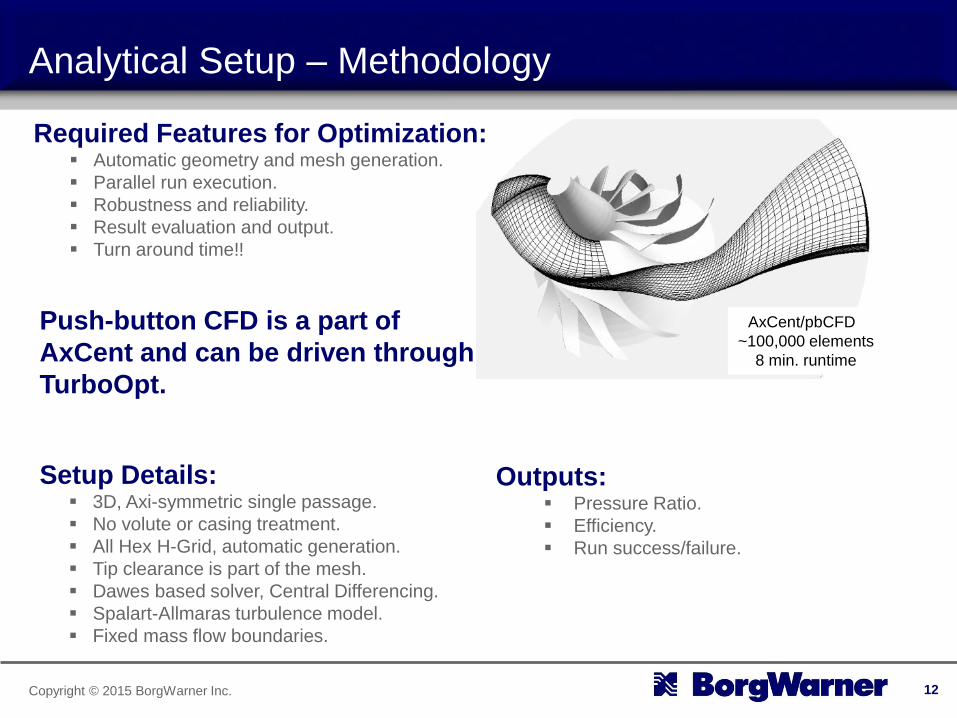
Analytical Setup – Methodology
12
AxCent/pbCFD
~100,000 elements
8 min. runtime
Outputs: Pressure Ratio.
Efficiency.
Run success/failure.
Required Features for Optimization: Automatic geometry and mesh generation.
Parallel run execution.
Robustness and reliability.
Result evaluation and output.
Turn around time!!
Push-button CFD is a part of
AxCent and can be driven through
TurboOpt.
Setup Details: 3D, Axi-symmetric single passage.
No volute or casing treatment.
All Hex H-Grid, automatic generation.
Tip clearance is part of the mesh.
Dawes based solver, Central Differencing.
Spalart-Allmaras turbulence model.
Fixed mass flow boundaries.
Copyright © 2015 BorgWarner Inc.
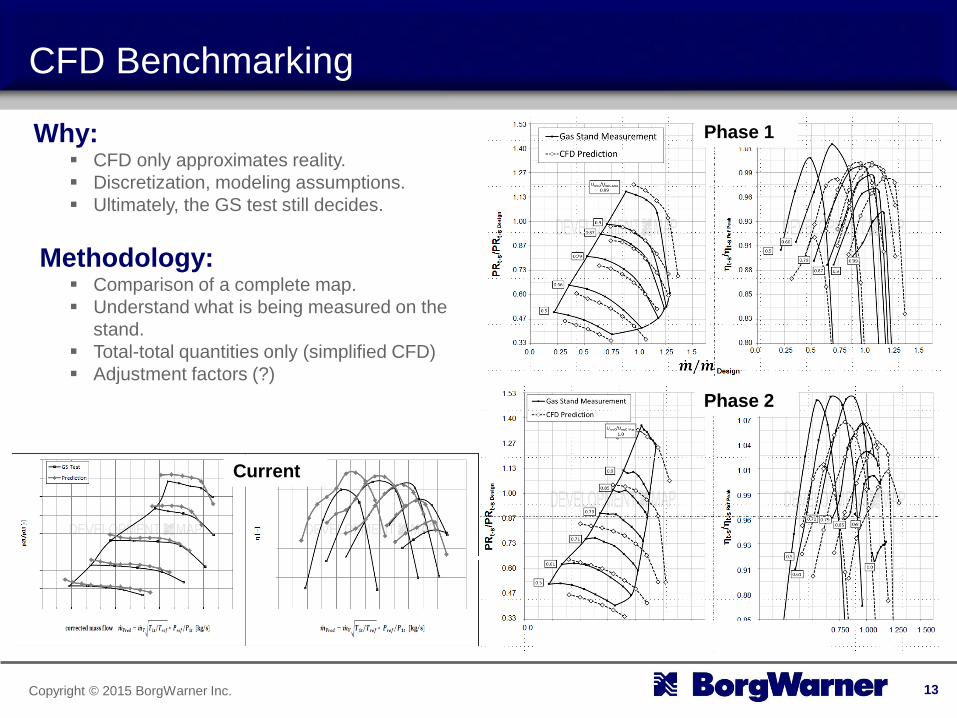
CFD Benchmarking
13
Why: CFD only approximates reality.
Discretization, modeling assumptions.
Ultimately, the GS test still decides.
Methodology: Comparison of a complete map.
Understand what is being measured on the
stand.
Total-total quantities only (simplified CFD)
Adjustment factors (?)
Phase 1
Phase 2
Current
Copyright © 2015 BorgWarner Inc.
CFD Benchmarking
pbCFD Predictions vs. Gas Stand Test.
After adjustment of mesh and physics settings, there is good
agreement with the test at the design point.
Efficiencies are also reasonable in the middle of the map, but there
are significant deviations at low and high speed.
Choke predictions are compromised by the lack of fillets in the
model.
Surge cannot be predicted reliably with a steady state method.
pbCFD gives reasonably reliable predictions. Turn around time are
adequate if design evaluations can be performed in parallel.
CFD predictions need to be continuously checked and methodology
adjusted.
14
Copyright © 2015 BorgWarner Inc.
Optimization Setup
15
Copyright © 2015 BorgWarner Inc.
Optimization Setup
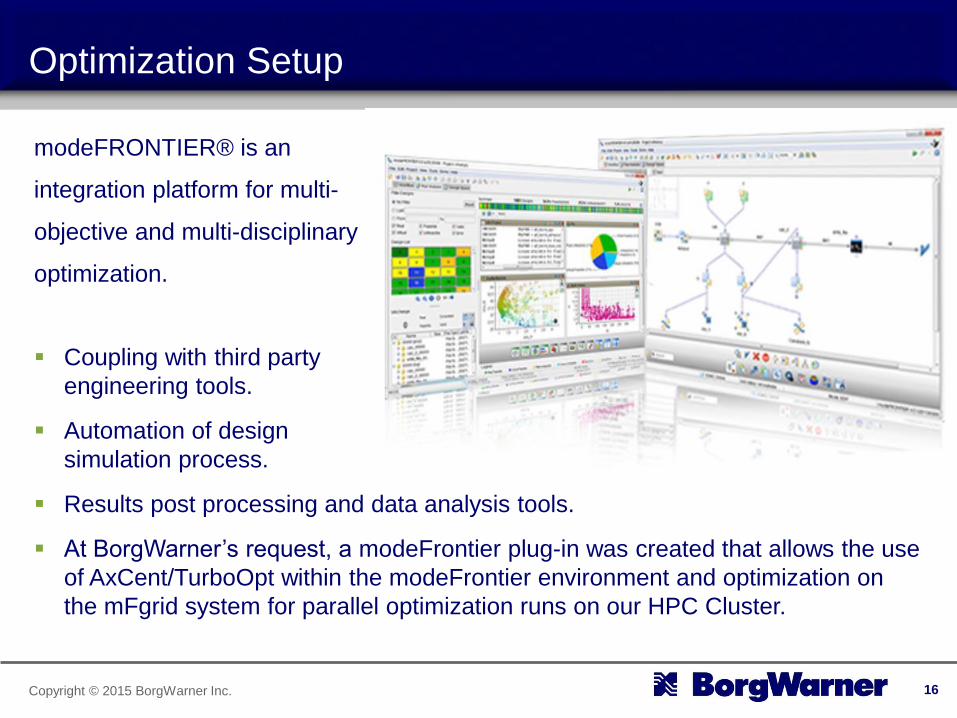
modeFRONTIER® is an
integration platform for multi-
objective and multi-disciplinary
optimization.
Coupling with third party
engineering tools.
Automation of design
simulation process.
Results post processing and data analysis tools.
At BorgWarner’s request, a modeFrontier plug-in was created that allows the use
of AxCent/TurboOpt within the modeFrontier environment and optimization on
the mFgrid system for parallel optimization runs on our HPC Cluster.
16
Copyright © 2015 BorgWarner Inc.
Optimization Setup
Typical questions encountered in setting up turbo
compressor optimizations Multiple conflicting requirements.
Large number of variables to consider.
Strongly non-linear response surface.
Restrictive constraints.
Uncertainty of predictions (fault tolerance).
Time and resource constraints.
How to choose an “optimal” design?
Specifically: Which optimization algorithm?
How many variables?
Constraints/Objectives.
Initialization (size of DOE, population size for GA).
Number of required designs.
A typical multi-objective Aero optimization takes many
days/weeks to run. How to choose the best algorithm?
17
Copyright © 2015 BorgWarner Inc.
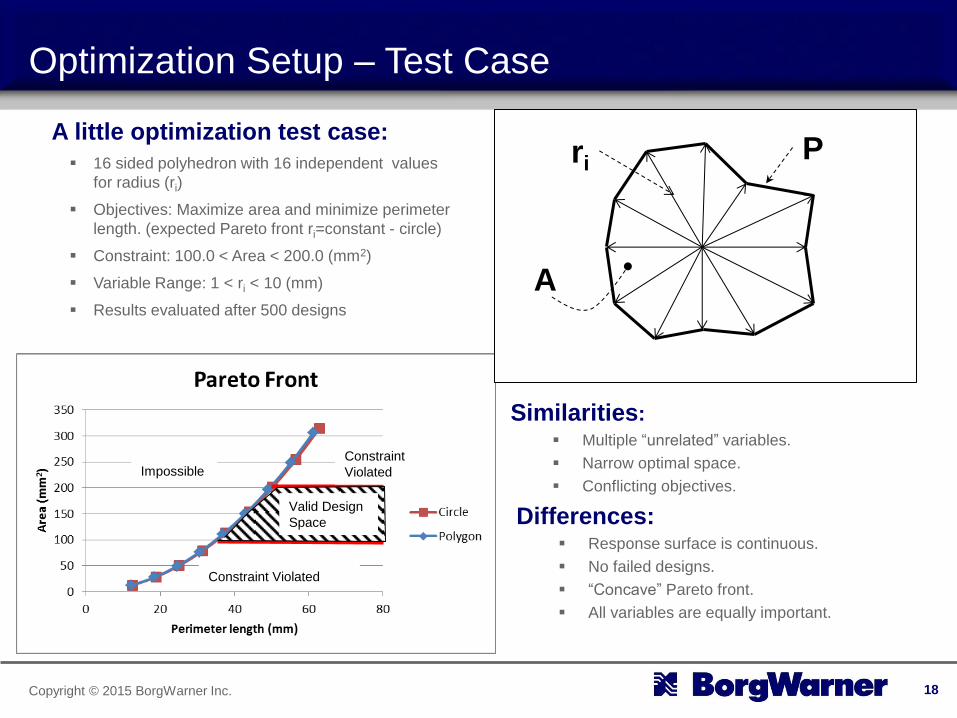
Similarities: Multiple “unrelated” variables.
Narrow optimal space.
Conflicting objectives.
Differences: Response surface is continuous.
No failed designs.
“Concave” Pareto front.
All variables are equally important.
Optimization Setup – Test Case
A little optimization test case:
16 sided polyhedron with 16 independent values
for radius (ri)
Objectives: Maximize area and minimize perimeter
length. (expected Pareto front ri=constant - circle)
Constraint: 100.0 < Area < 200.0 (mm2)
Variable Range: 1 < ri < 10 (mm)
Results evaluated after 500 designs
18
A
P ri
Valid Design
Space
Constraint Violated
Constraint
Violated Impossible

Copyright © 2015 BorgWarner Inc.
Optimization Setup – Test Case
19

Copyright © 2015 BorgWarner Inc.
Optimization Setup – Evaluation of Algorithms - DOE
500 points for 16 variables Design of Experiment using ULH.
Result of just using “Random” variable values.
20
Pareto Designs only
Copyright © 2015 BorgWarner Inc.
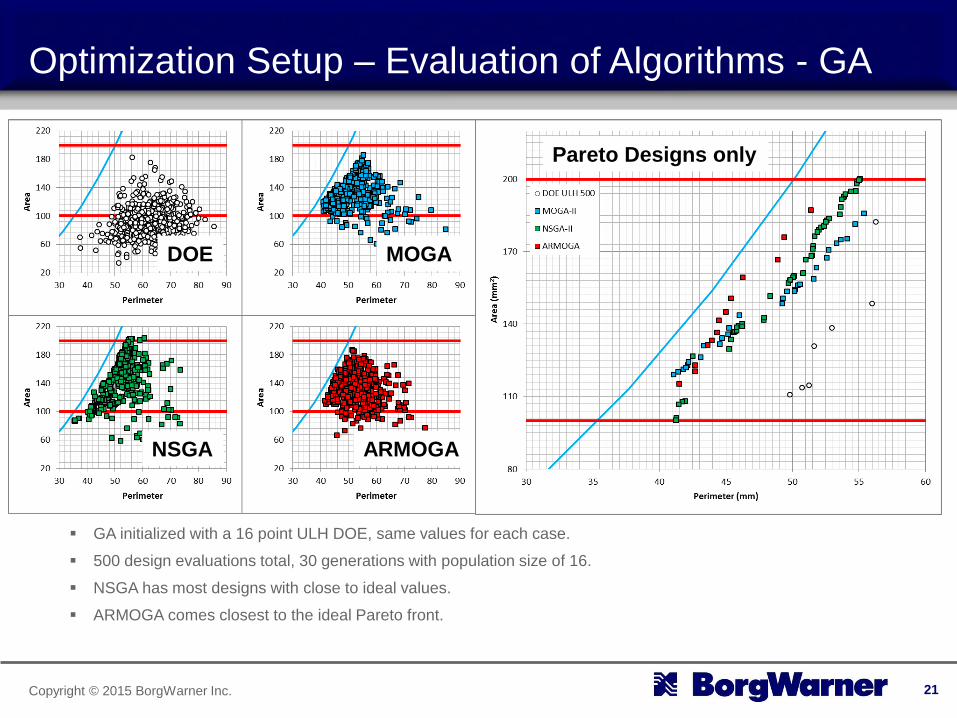
Optimization Setup – Evaluation of Algorithms - GA
GA initialized with a 16 point ULH DOE, same values for each case.
500 design evaluations total, 30 generations with population size of 16.
NSGA has most designs with close to ideal values.
ARMOGA comes closest to the ideal Pareto front.
21
Pareto Designs only
DOE MOGA
ARMOGA NSGA
Copyright © 2015 BorgWarner Inc.
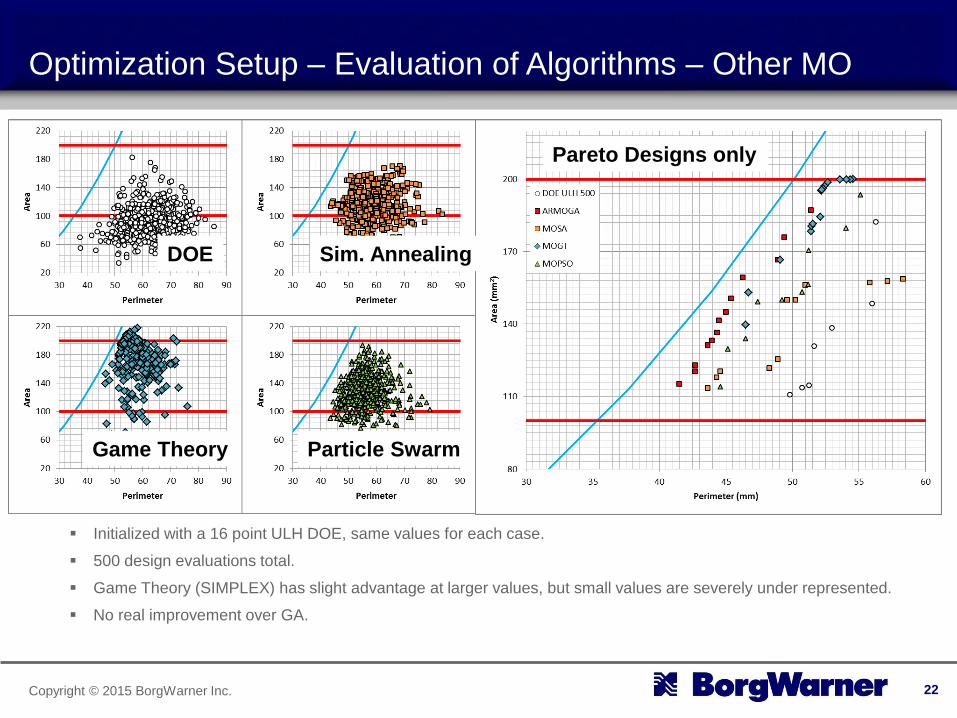
Optimization Setup – Evaluation of Algorithms – Other MO
Initialized with a 16 point ULH DOE, same values for each case.
500 design evaluations total.
Game Theory (SIMPLEX) has slight advantage at larger values, but small values are severely under represented.
No real improvement over GA.
22
Pareto Designs only
DOE Sim. Annealing
Particle Swarm Game Theory
Copyright © 2015 BorgWarner Inc.
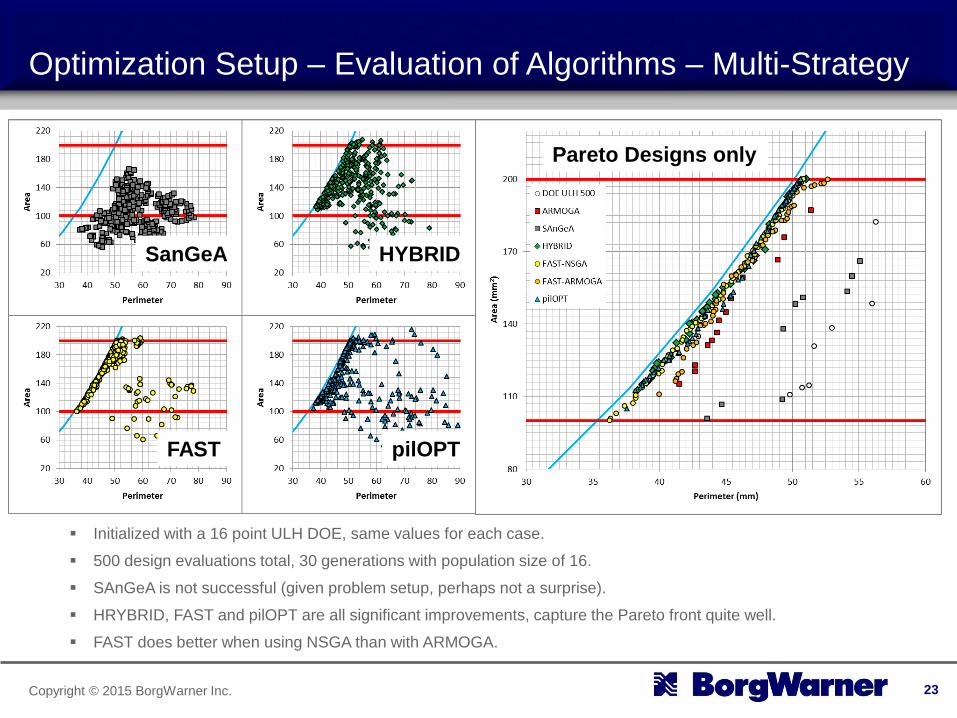
Optimization Setup – Evaluation of Algorithms – Multi-Strategy
Initialized with a 16 point ULH DOE, same values for each case.
500 design evaluations total, 30 generations with population size of 16.
SAnGeA is not successful (given problem setup, perhaps not a surprise).
HRYBRID, FAST and pilOPT are all significant improvements, capture the Pareto front quite well.
FAST does better when using NSGA than with ARMOGA.
23
Pareto Designs only
SanGeA HYBRID
pilOPT FAST
Copyright © 2015 BorgWarner Inc.
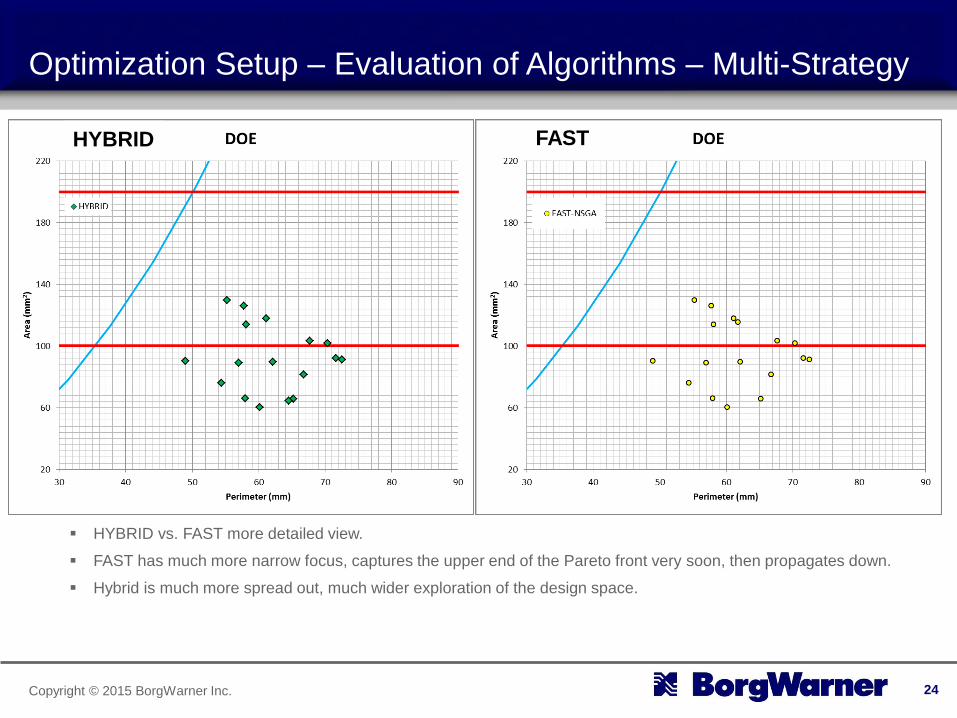
Optimization Setup – Evaluation of Algorithms – Multi-Strategy
HYBRID vs. FAST more detailed view.
FAST has much more narrow focus, captures the upper end of the Pareto front very soon, then propagates down.
Hybrid is much more spread out, much wider exploration of the design space.
24
FAST HYBRID

Copyright © 2015 BorgWarner Inc.
Optimization Setup – Population Size
Initialized with a 8, 16 and 32 point ULH DOE. (This also sets the size of each generation)
500 design evaluations total, 61, 30 and 14 generations each for the 8, 16 and 32 design/generation runs.
Best coverage of Pareto front with population = # of variables.
Small population provides closest approach to Pareto front, but only partial coverage.
Using number of variables as the a guide to set the size of the population of each generation appears to be a good
compromise.
25
Pareto Designs only
16
32 8
Copyright © 2015 BorgWarner Inc.
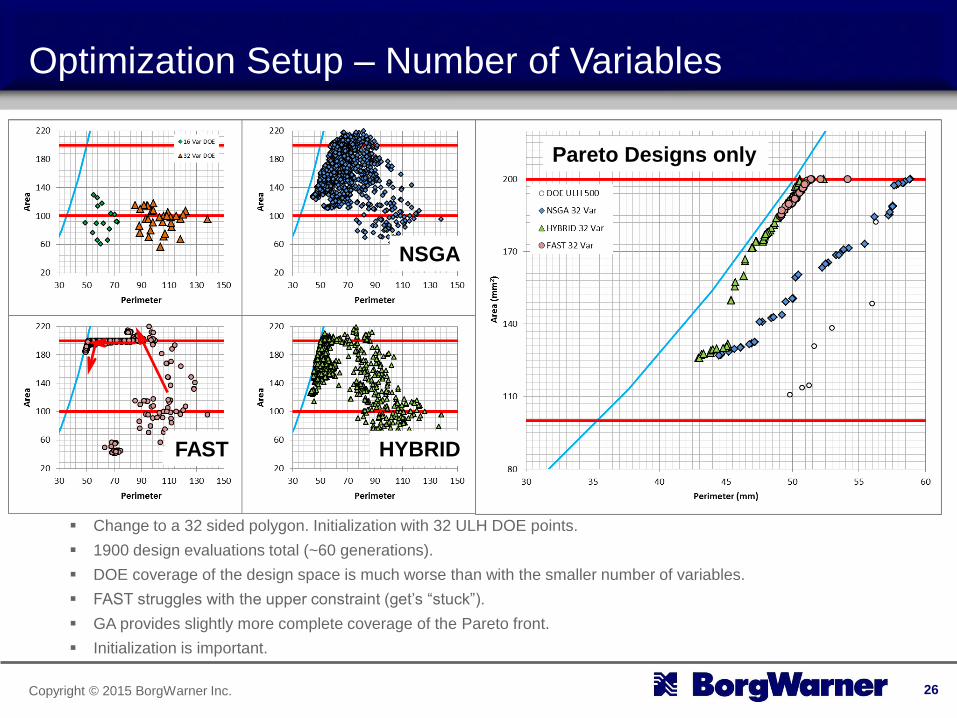
Optimization Setup – Number of Variables
Change to a 32 sided polygon. Initialization with 32 ULH DOE points.
1900 design evaluations total (~60 generations).
DOE coverage of the design space is much worse than with the smaller number of variables.
FAST struggles with the upper constraint (get’s “stuck”).
GA provides slightly more complete coverage of the Pareto front.
Initialization is important.
26
Pareto Designs only
NSGA
HYBRID FAST

Copyright © 2015 BorgWarner Inc.
Optimization Setup – Initialization
Initialization of multi-dimensional
problems DOE initialization for large number of variables decreases in
usefulness with increasing number of variables.
Highly constrained design space my preclude any valid designs
from a randomly seeded DOE data set.
Initialization options 1. Large DOE and then pick a selection of successful designs for
the first generation.
2. Use the Pareto front from a similar run.
3. Existing (legacy) designs as seeds.
Convergence to a true optimum (?)
27
Starting Design
Optimized Design
Copyright © 2015 BorgWarner Inc.
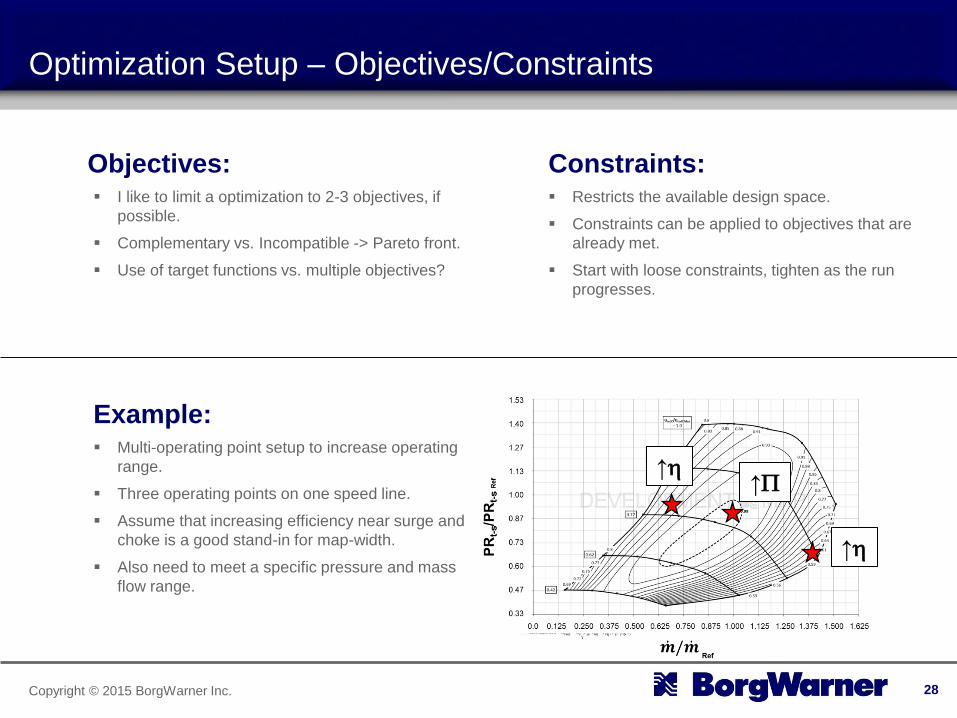
Optimization Setup – Objectives/Constraints
Objectives: I like to limit a optimization to 2-3 objectives, if
possible.
Complementary vs. Incompatible -> Pareto front.
Use of target functions vs. multiple objectives?
Example: Multi-operating point setup to increase operating
range.
Three operating points on one speed line.
Assume that increasing efficiency near surge and
choke is a good stand-in for map-width.
Also need to meet a specific pressure and mass
flow range.
28
Constraints: Restricts the available design space.
Constraints can be applied to objectives that are
already met.
Start with loose constraints, tighten as the run
progresses.
↑h ↑P
↑h
Copyright © 2015 BorgWarner Inc.
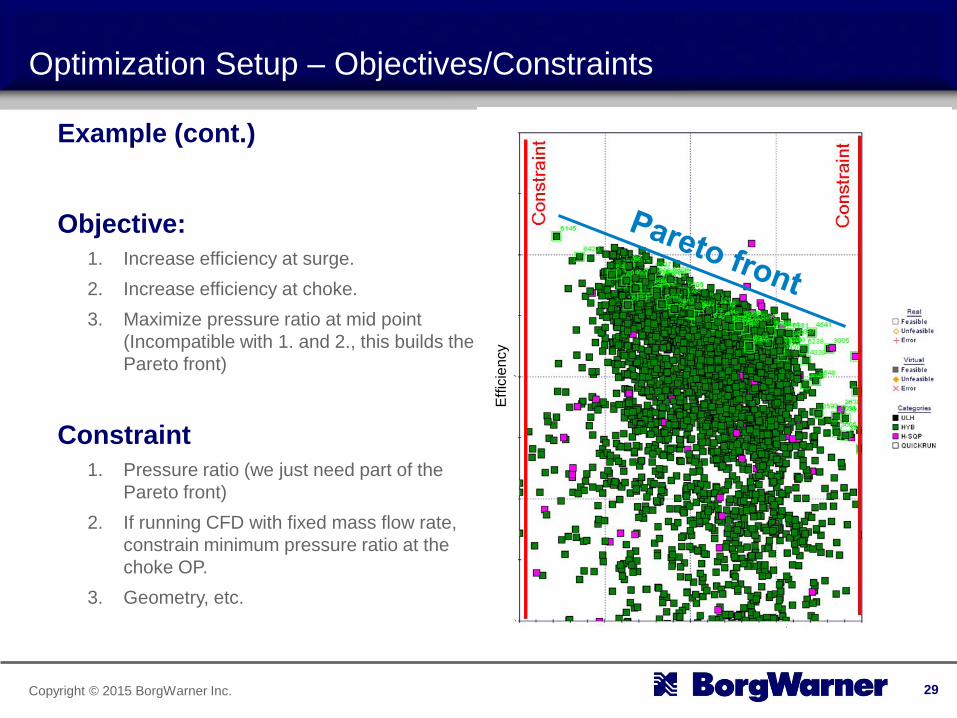
Optimization Setup – Objectives/Constraints
Example (cont.)
Objective:
1. Increase efficiency at surge.
2. Increase efficiency at choke.
3. Maximize pressure ratio at mid point
(Incompatible with 1. and 2., this builds the
Pareto front)
Constraint
1. Pressure ratio (we just need part of the
Pareto front)
2. If running CFD with fixed mass flow rate,
constrain minimum pressure ratio at the
choke OP.
3. Geometry, etc.
29
Eff
icie
ncy
Copyright © 2015 BorgWarner Inc.
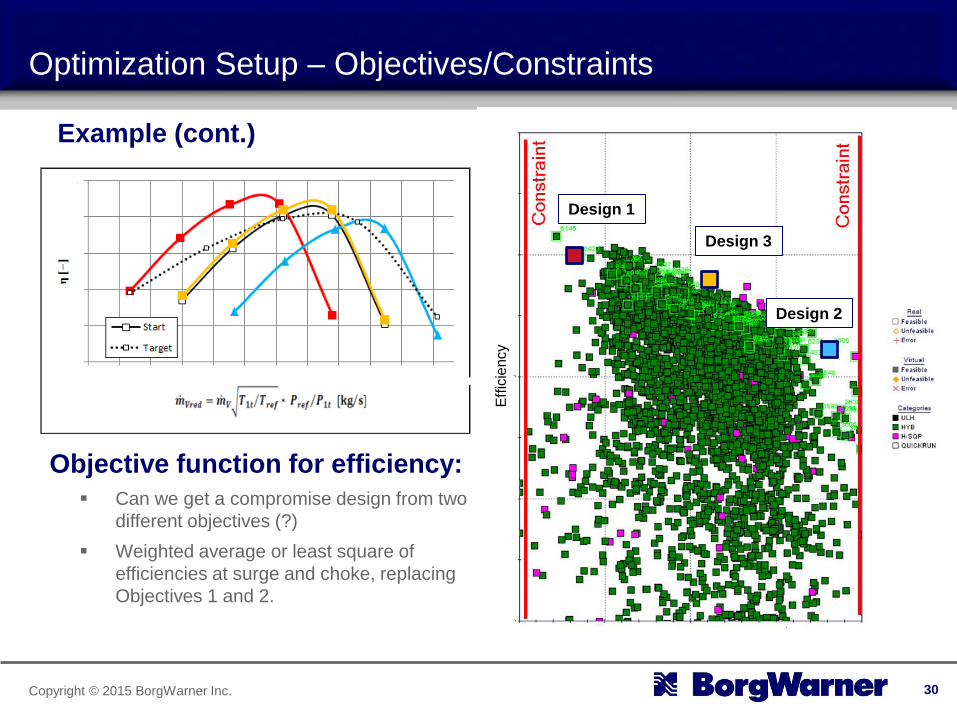
Example (cont.)
Optimization Setup – Objectives/Constraints
30
Eff
icie
ncy
Design 1
Design 2
Objective function for efficiency:
Can we get a compromise design from two
different objectives (?)
Weighted average or least square of
efficiencies at surge and choke, replacing
Objectives 1 and 2.
Design 3
Copyright © 2015 BorgWarner Inc.
Summary
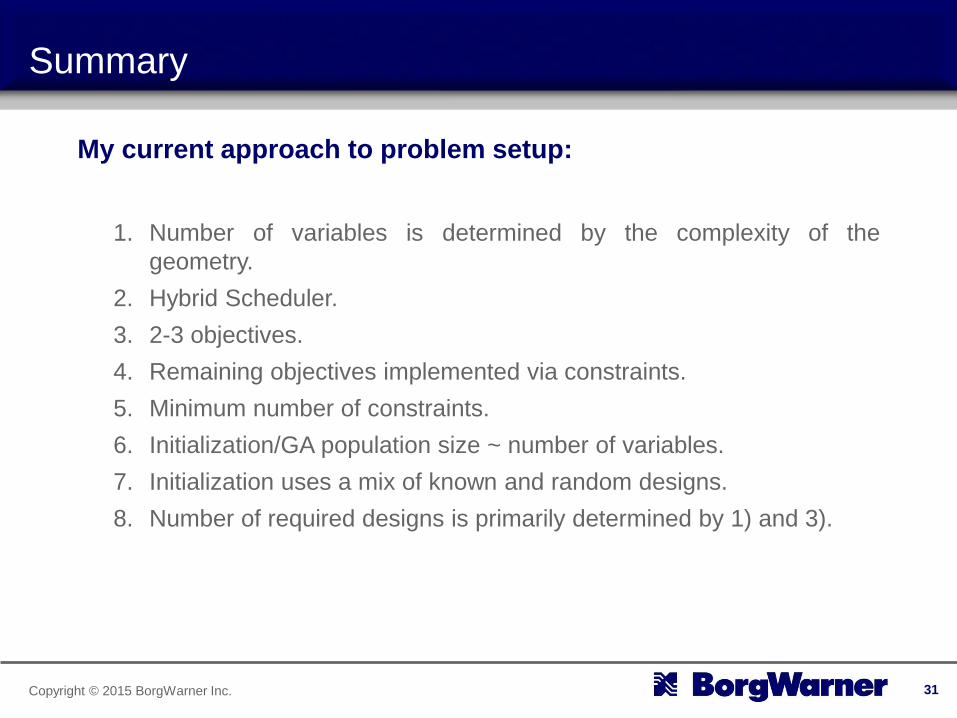
My current approach to problem setup:
1. Number of variables is determined by the complexity of the
geometry.
2. Hybrid Scheduler.
3. 2-3 objectives.
4. Remaining objectives implemented via constraints.
5. Minimum number of constraints.
6. Initialization/GA population size ~ number of variables.
7. Initialization uses a mix of known and random designs.
8. Number of required designs is primarily determined by 1) and 3).
31

Copyright © 2015 BorgWarner Inc.
Aerodynamic Optimization
32

Copyright © 2015 BorgWarner Inc.
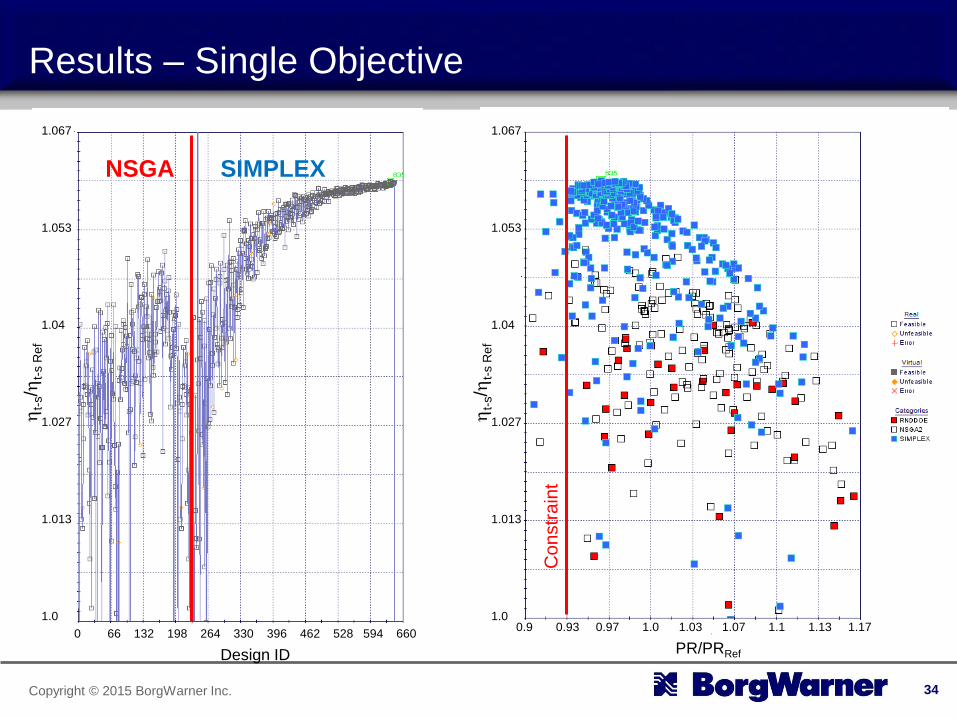
Setup – Single Objective
modeFRONTIER setup
Scheduler
NSGA/SIMPLEX.
Sequential evaluation.
Objectives:
Maximize Efficiency.
Input Constraints:
None.
Result Constraints:
Pressure Ratio Minimum.
33
Runs Statistics: 1 AxCent/pbCFD analysis per design.
640 design evaluations.
Run on 8 core workstation.
~5 days elapsed time.
↑h
Copyright © 2015 BorgWarner Inc.
PR/PRRef
0.9 0.93 0.97 1.0 1.03 1.07 1.1 1.13 1.17
ht-
s/h
t-s R
ef
1.067
1.053
1.04
1.027
1.013
1.0
Results – Single Objective
34
ht-
s/h
t-s R
ef
1.067
1.053
1.04
1.027
1.013
1.0
Design ID
0 66 132 198 264 330 396 462 528 594 660
Co
nstr
ain
t
NSGA SIMPLEX
Copyright © 2015 BorgWarner Inc.
Results – Single Objective
35
1.53
1.40
1.27
1.13
1.00
0.87
0.73
0.60
0.47
0.33
PR
t-s/P
Rt-
s R
ef
𝒎 /𝒎 Ref
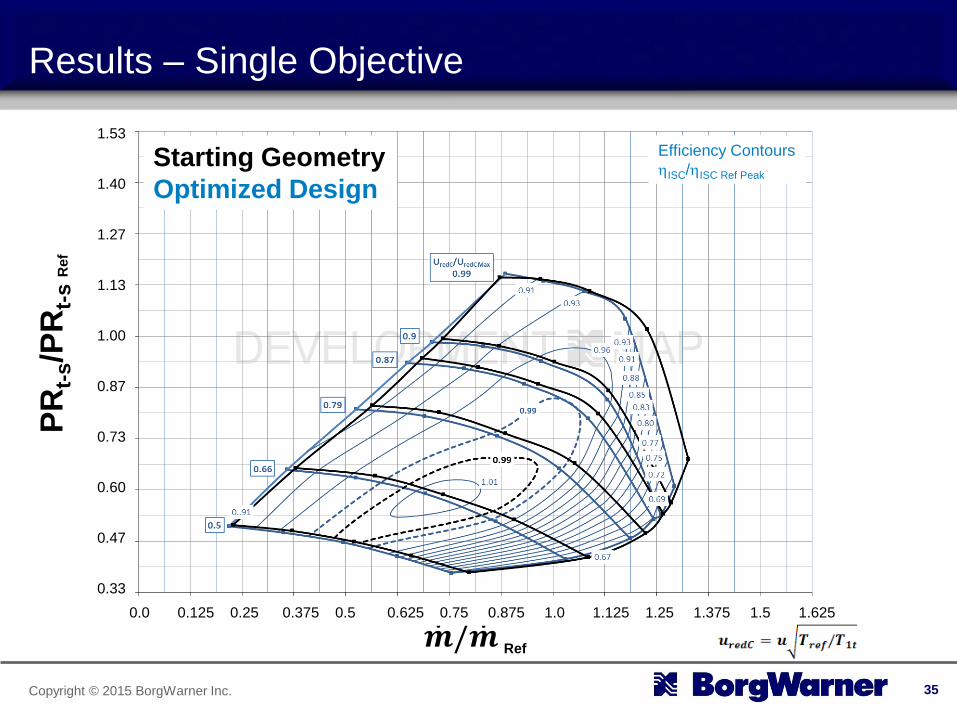
Starting Geometry
Optimized Design
Efficiency Contours
hISC/hISC Ref Peak
0.0 0.125 0.25 0.375 0.5 0.625 0.75 0.875 1.0 1.125 1.25 1.375 1.5 1.625
Copyright © 2015 BorgWarner Inc.
Results – Single Objective
36
1.53
1.40
1.27
1.13
1.00
0.87
0.73
0.60
0.47
0.33
PR
t-s/P
Rt-
s R
ef
𝒎 /𝒎 Ref
Starting Geometry
Optimized Design
Efficiency Contours
hISC/hISC Ref Peak
0.0 0.125 0.25 0.375 0.5 0.625 0.75 0.875 1.0 1.125 1.25 1.375 1.5 1.625
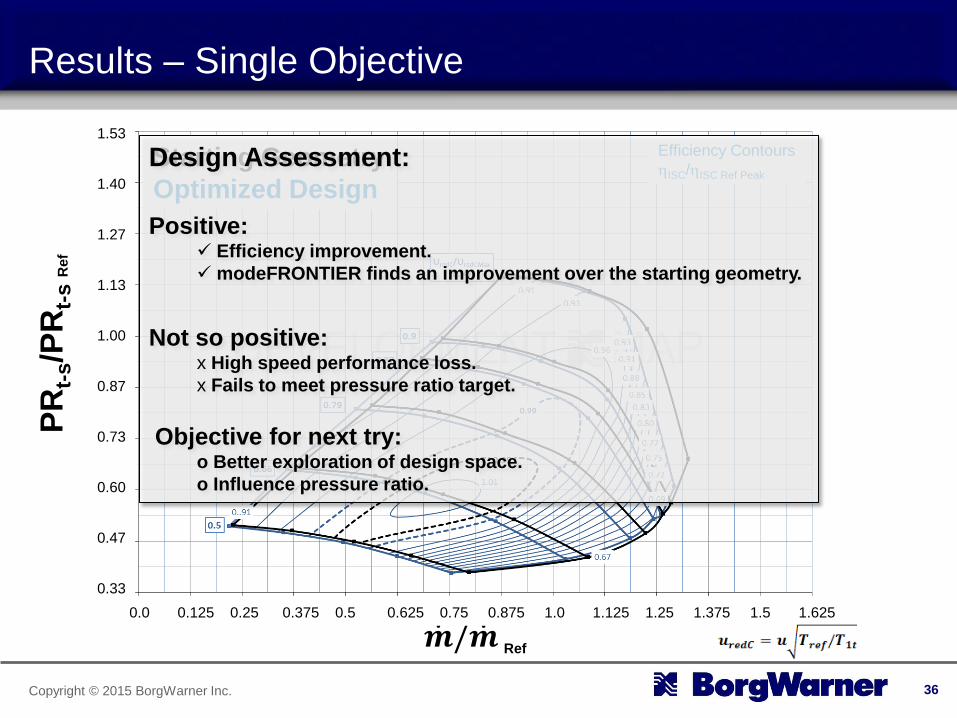
Design Assessment:
Positive:
Efficiency improvement.
modeFRONTIER finds an improvement over the starting geometry.
Not so positive:
x High speed performance loss.
x Fails to meet pressure ratio target.
Objective for next try: o Better exploration of design space.
o Influence pressure ratio.
Copyright © 2015 BorgWarner Inc.
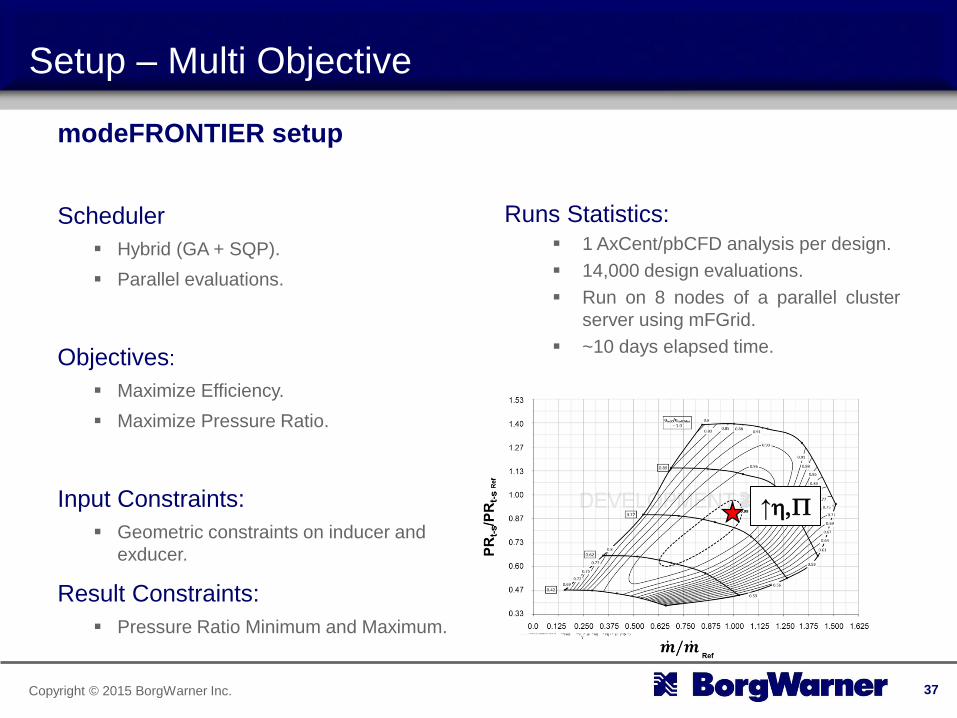
Setup – Multi Objective
modeFRONTIER setup
Scheduler
Hybrid (GA + SQP).
Parallel evaluations.
Objectives:
Maximize Efficiency.
Maximize Pressure Ratio.
Input Constraints:
Geometric constraints on inducer and
exducer.
Result Constraints:
Pressure Ratio Minimum and Maximum.
37
Runs Statistics: 1 AxCent/pbCFD analysis per design.
14,000 design evaluations.
Run on 8 nodes of a parallel cluster
server using mFGrid.
~10 days elapsed time.
↑h,P
Copyright © 2015 BorgWarner Inc.
1.027
1.013
1.0
0.987
PR/PRRef
0.97 1.0 1.03 1.06 1.09
ht-
s/h
t-s R
ef
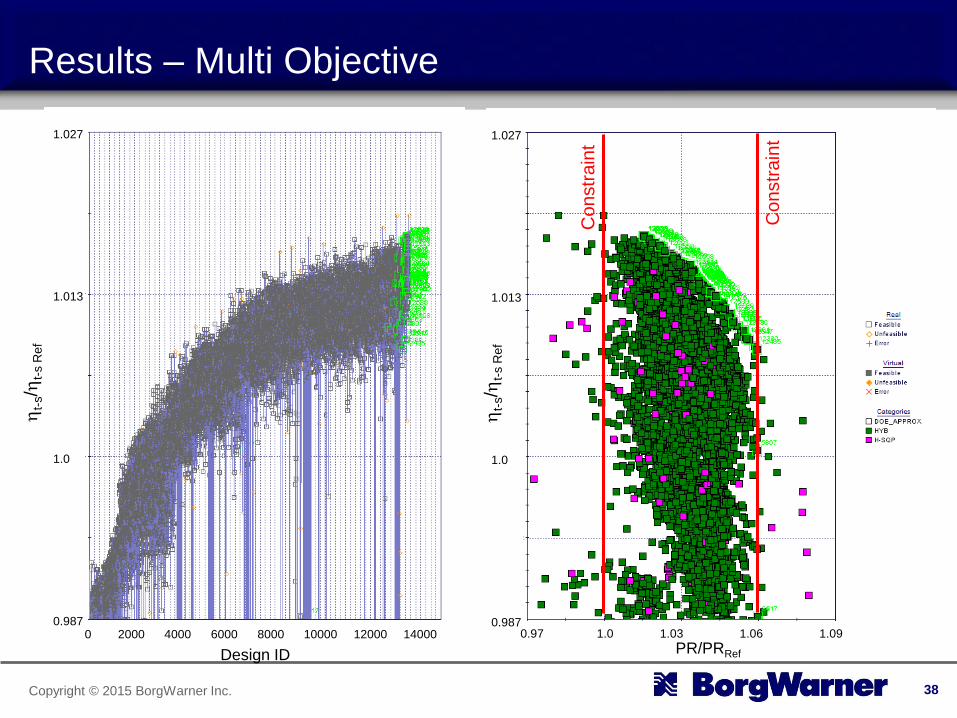
Results – Multi Objective
38
ht-
s/h
t-s R
ef
Design ID
0 2000 4000 6000 8000 10000 12000 14000
Co
nstr
ain
t
Co
nstr
ain
t 1.027
1.013
1.0
0.987
Copyright © 2015 BorgWarner Inc.
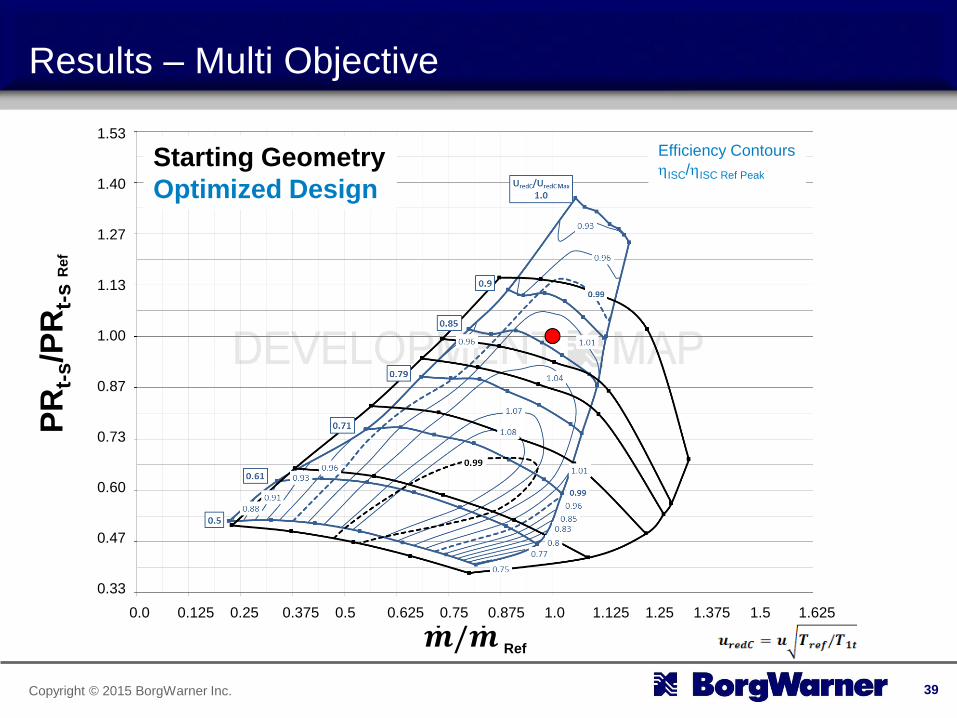
Results – Multi Objective
39
1.53
1.40
1.27
1.13
1.00
0.87
0.73
0.60
0.47
0.33
PR
t-s/P
Rt-
s R
ef
𝒎 /𝒎 Ref
Starting Geometry
Optimized Design
Efficiency Contours
hISC/hISC Ref Peak
0.0 0.125 0.25 0.375 0.5 0.625 0.75 0.875 1.0 1.125 1.25 1.375 1.5 1.625
Copyright © 2015 BorgWarner Inc.
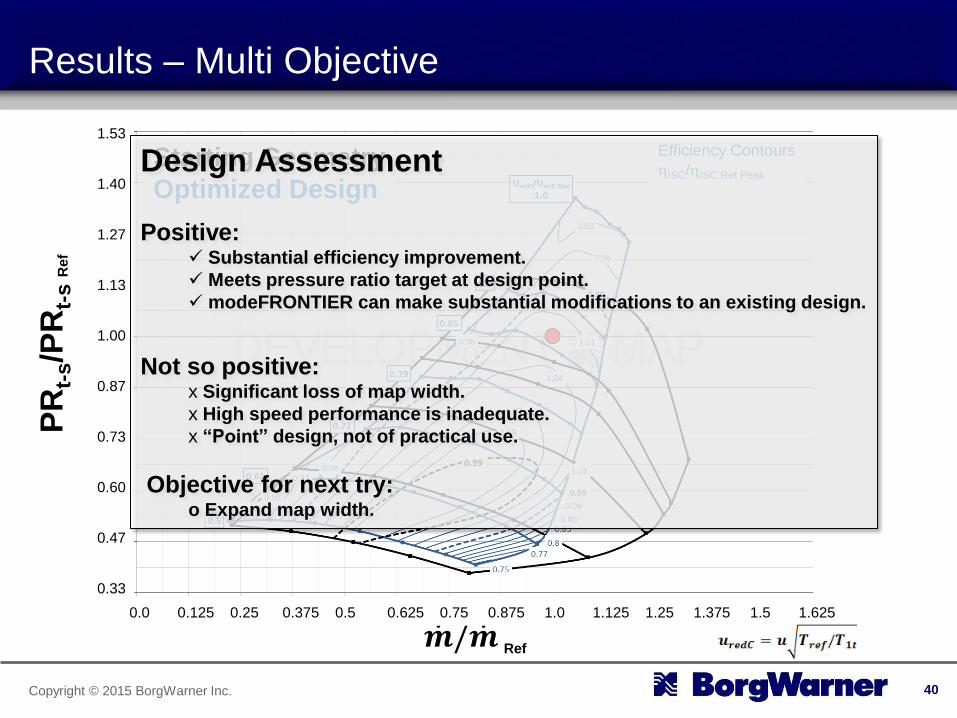
Results – Multi Objective
40
1.53
1.40
1.27
1.13
1.00
0.87
0.73
0.60
0.47
0.33
PR
t-s/P
Rt-
s R
ef
𝒎 /𝒎 Ref
Starting Geometry
Optimized Design
Efficiency Contours
hISC/hISC Ref Peak
0.0 0.125 0.25 0.375 0.5 0.625 0.75 0.875 1.0 1.125 1.25 1.375 1.5 1.625
Design Assessment
Positive:
Substantial efficiency improvement.
Meets pressure ratio target at design point.
modeFRONTIER can make substantial modifications to an existing design.
Not so positive:
x Significant loss of map width.
x High speed performance is inadequate.
x “Point” design, not of practical use.
Objective for next try: o Expand map width.

Copyright © 2015 BorgWarner Inc.
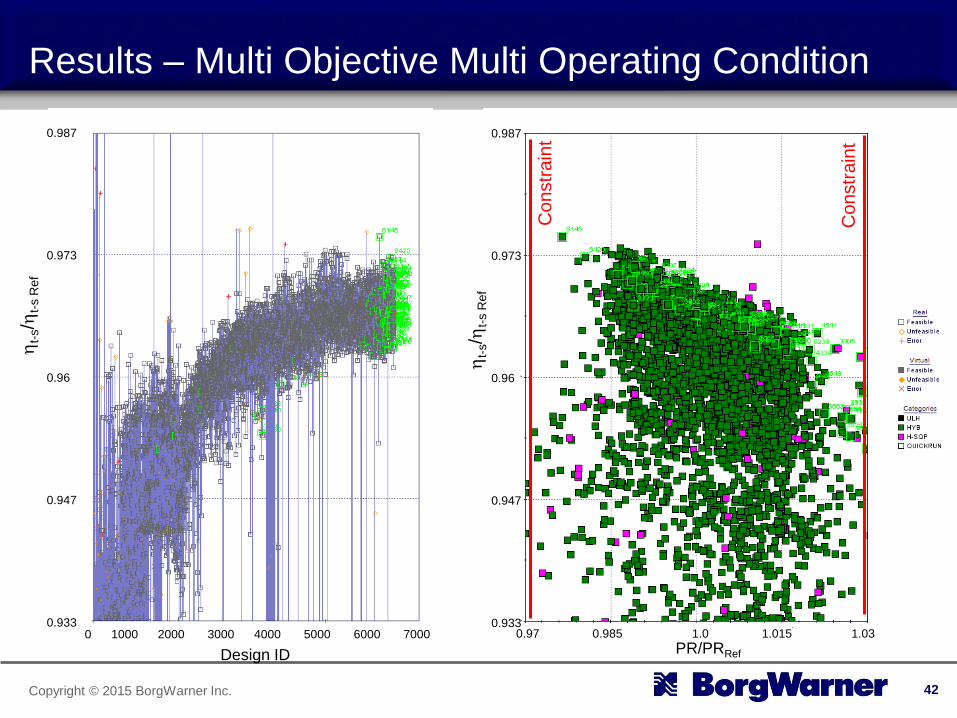
Setup – Multi Objective Multi Operating Condition
modeFRONTIER setup
Scheduler
Hybrid (GA + SQP).
Parallel evaluations.
Objectives:
Minimize Efficiency Target Function.
Maximize Pressure Ratio.
Input Constraints:
Geometric constraints on inducer and
exducer.
Fixed diffuser diameter.
Result Constraints:
Pressure Ratio Minimum and Maximum.
41
Runs Statistics: 3 AxCent/pbCFD analyses per design.
6,500 design evaluations.
Run on 8 nodes of a parallel cluster
server using mFGrid.
~14 days elapsed time.
↑h
↑h,P
↑h
Copyright © 2015 BorgWarner Inc.
0.987
0.973
0.96
0.947
0.933
PR/PRRef
0.97 0.985 1.0 1.015 1.03
ht-
s/h
t-s R
ef
Results – Multi Objective Multi Operating Condition
42
Design ID
0 1000 2000 3000 4000 5000 6000 7000
Co
nstr
ain
t
Co
nstr
ain
t
0.987
0.973
0.96
0.947
0.933
ht-
s/h
t-s R
ef
Copyright © 2015 BorgWarner Inc.
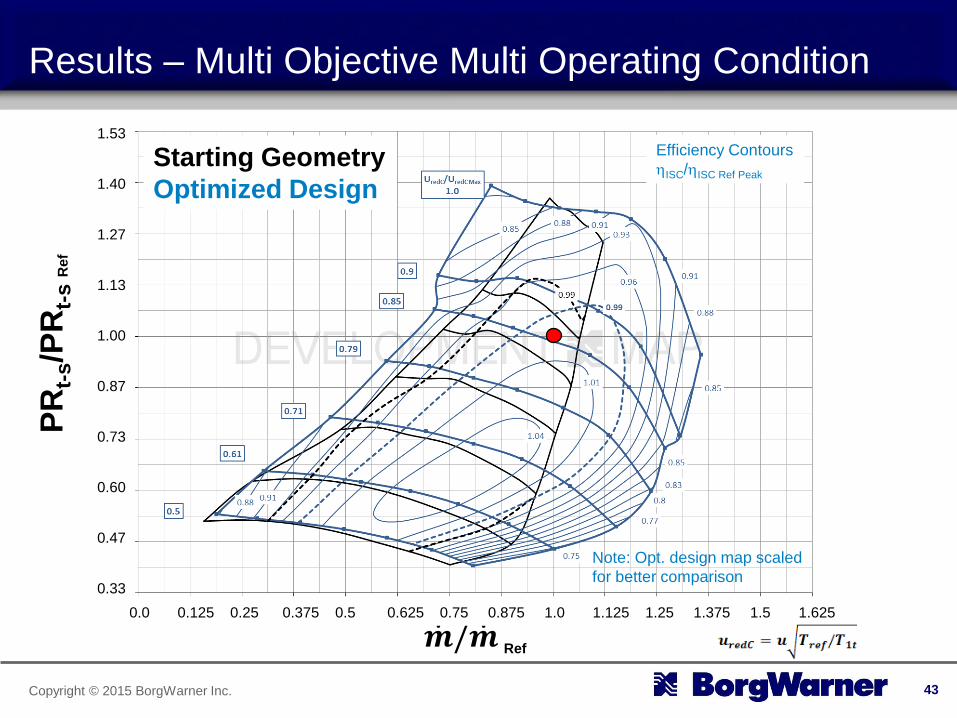
Results – Multi Objective Multi Operating Condition
43
1.53
1.40
1.27
1.13
1.00
0.87
0.73
0.60
0.47
0.33
PR
t-s/P
Rt-
s R
ef
𝒎 /𝒎 Ref
Starting Geometry
Optimized Design
0.0 0.125 0.25 0.375 0.5 0.625 0.75 0.875 1.0 1.125 1.25 1.375 1.5 1.625
Efficiency Contours
hISC/hISC Ref Peak
Note: Opt. design map scaled
for better comparison
Copyright © 2015 BorgWarner Inc.
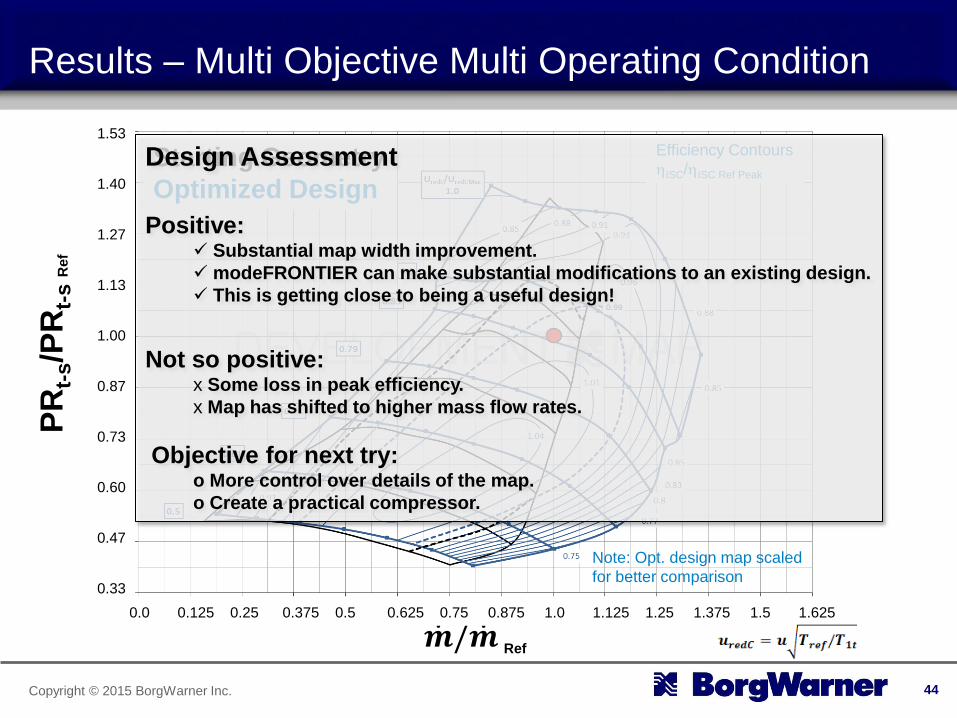
Results – Multi Objective Multi Operating Condition
44
1.53
1.40
1.27
1.13
1.00
0.87
0.73
0.60
0.47
0.33
PR
t-s/P
Rt-
s R
ef
𝒎 /𝒎 Ref
Starting Geometry
Optimized Design
0.0 0.125 0.25 0.375 0.5 0.625 0.75 0.875 1.0 1.125 1.25 1.375 1.5 1.625
Efficiency Contours
hISC/hISC Ref Peak
Note: Opt. design map scaled
for better comparison
Design Assessment
Positive:
Substantial map width improvement.
modeFRONTIER can make substantial modifications to an existing design.
This is getting close to being a useful design!
Not so positive:
x Some loss in peak efficiency.
x Map has shifted to higher mass flow rates.
Objective for next try: o More control over details of the map.
o Create a practical compressor.
Copyright © 2015 BorgWarner Inc.
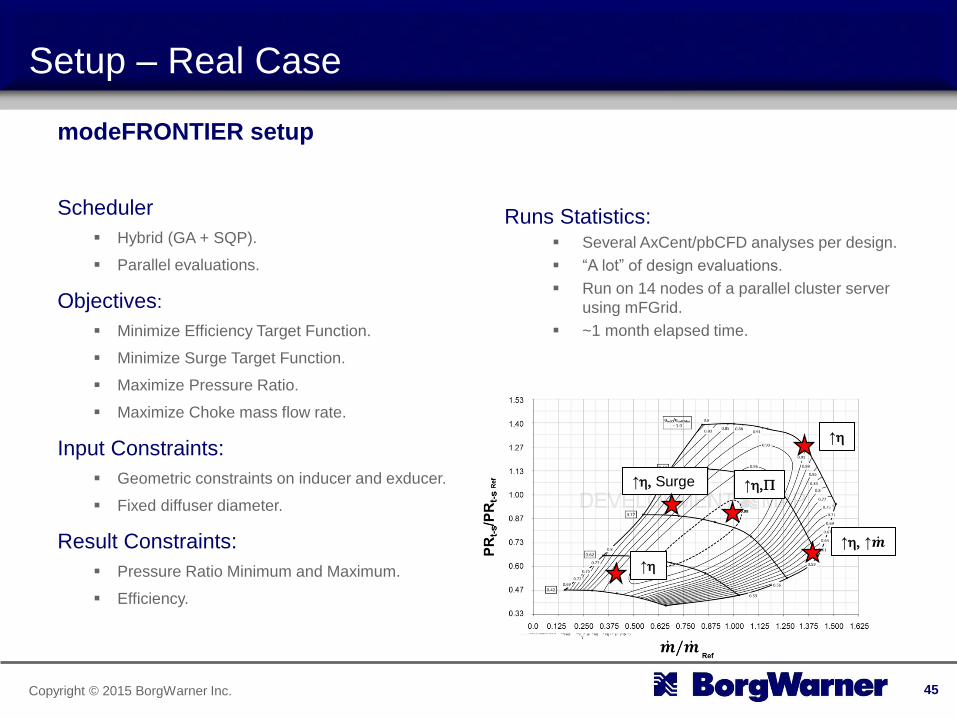
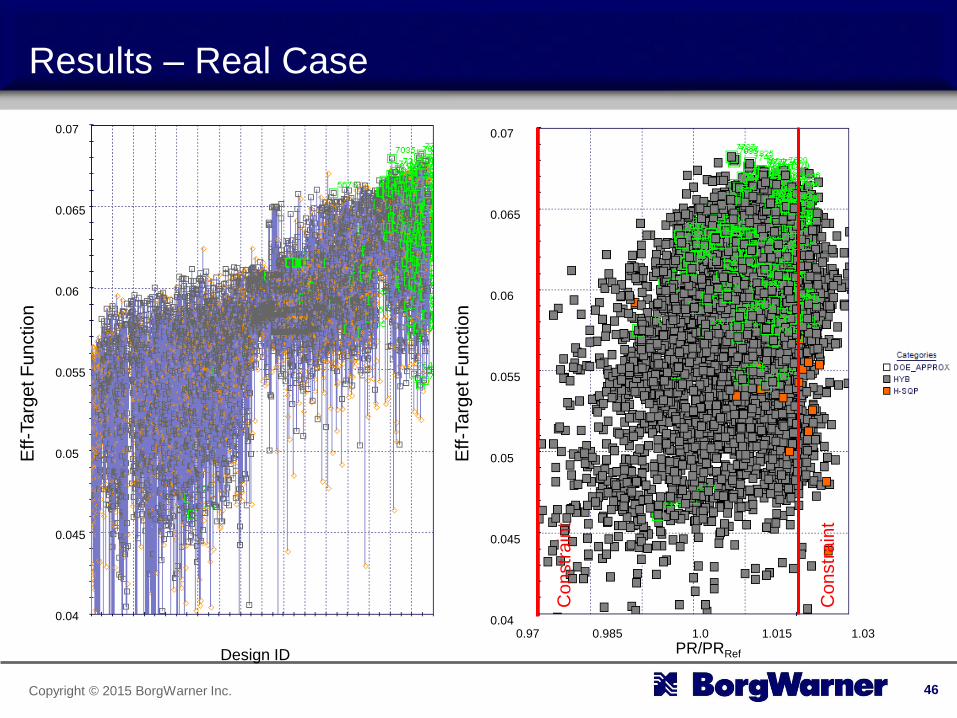
Setup – Real Case
modeFRONTIER setup
Scheduler
Hybrid (GA + SQP).
Parallel evaluations.
Objectives:
Minimize Efficiency Target Function.
Minimize Surge Target Function.
Maximize Pressure Ratio.
Maximize Choke mass flow rate.
Input Constraints:
Geometric constraints on inducer and exducer.
Fixed diffuser diameter.
Result Constraints:
Pressure Ratio Minimum and Maximum.
Efficiency.
45
Runs Statistics: Several AxCent/pbCFD analyses per design.
“A lot” of design evaluations.
Run on 14 nodes of a parallel cluster server
using mFGrid.
~1 month elapsed time.
↑h, Surge ↑h,P
↑h, ↑𝒎
↑h
↑h
Copyright © 2015 BorgWarner Inc.
PR/PRRef
Results – Real Case
46
Design ID
0 1000 2000 3000 4000 5000 6000 7000 8000
Eff-T
arg
et F
un
ctio
n
Eff-T
arg
et F
un
ctio
n
0.07
0.065
0.06
0.055
0.05
0.045
0.04
0.97 0.985 1.0 1.015 1.03
Co
nstr
ain
t
Co
nstr
ain
t
0.07
0.065
0.06
0.055
0.05
0.045
0.04
Copyright © 2015 BorgWarner Inc.
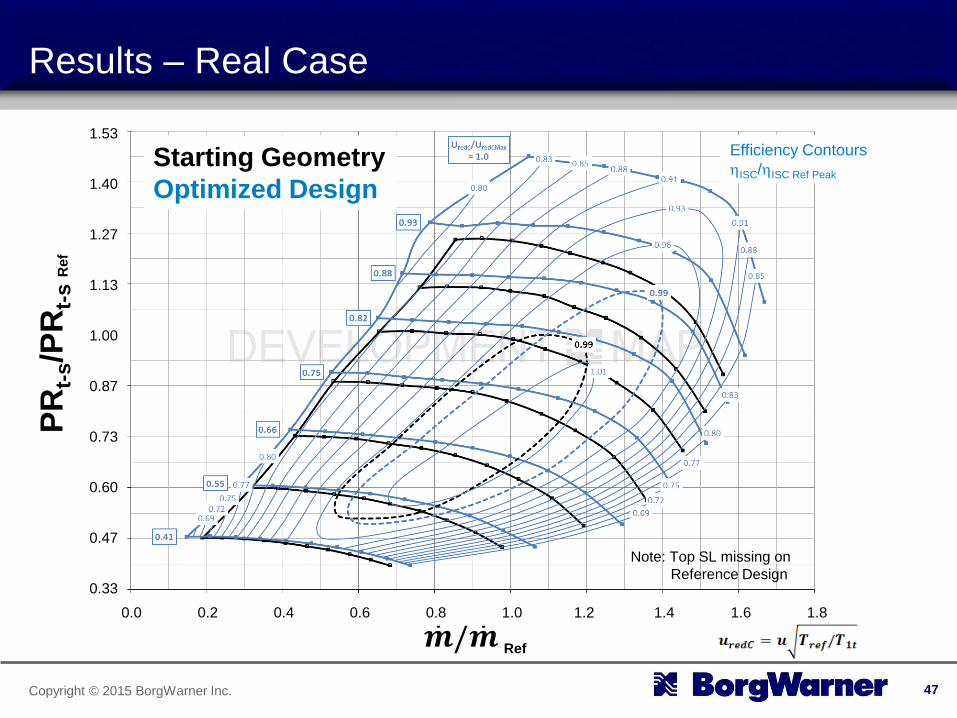
Results – Real Case
47
1.53
1.40
1.27
1.13
1.00
0.87
0.73
0.60
0.47
0.33
PR
t-s/P
Rt-
s R
ef
𝒎 /𝒎 Ref
Starting Geometry
Optimized Design
0.0 0.2 0.4 0.6 0.8 1.0 1.2 1.4 1.6 1.8
Efficiency Contours
hISC/hISC Ref Peak
Note: Top SL missing on
Reference Design
Copyright © 2015 BorgWarner Inc.
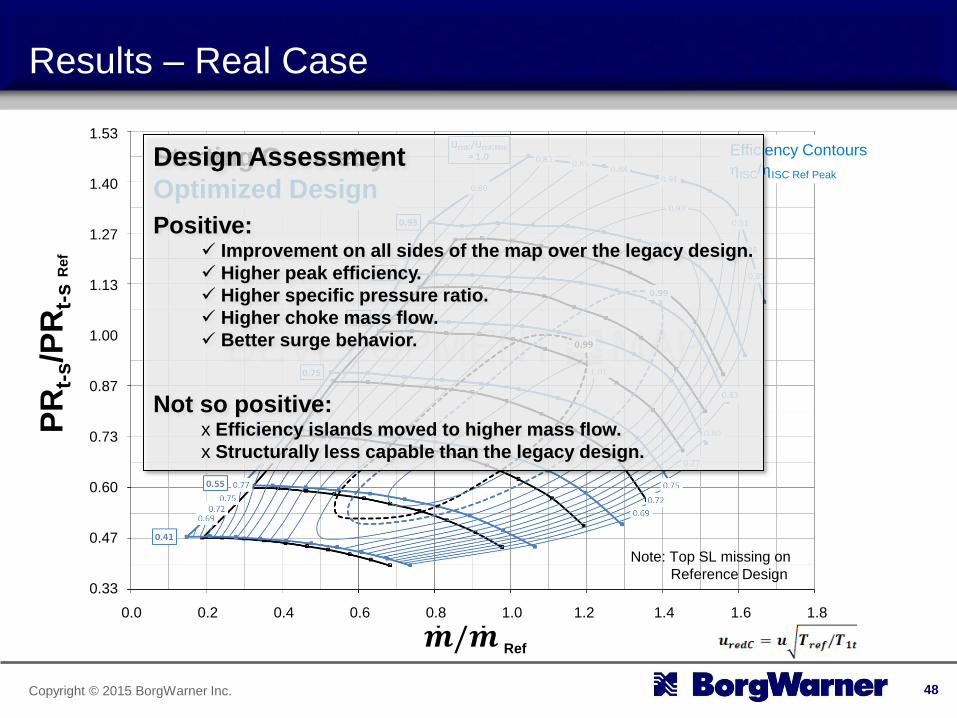
Results – Real Case
48
1.53
1.40
1.27
1.13
1.00
0.87
0.73
0.60
0.47
0.33
PR
t-s/P
Rt-
s R
ef
𝒎 /𝒎 Ref
Starting Geometry
Optimized Design
0.0 0.2 0.4 0.6 0.8 1.0 1.2 1.4 1.6 1.8
Efficiency Contours
hISC/hISC Ref Peak
Note: Top SL missing on
Reference Design
Design Assessment
Positive:
Improvement on all sides of the map over the legacy design.
Higher peak efficiency.
Higher specific pressure ratio.
Higher choke mass flow.
Better surge behavior.
Not so positive:
x Efficiency islands moved to higher mass flow.
x Structurally less capable than the legacy design.
Copyright © 2015 BorgWarner Inc.
Summary
A methodology was developed to improve turbo compressor designs.
3D CFD on a simplified geometry is used to evaluate design
performance.
modeFRONTIER optimization with Hybrid scheduler.
Results show the potential for creating higher performing stages.
Work on a optimization strategy for balancing on-design and off-design
performance is still a work in progress. (probably always will be)
49

Copyright © 2015 BorgWarner Inc.
Structural Optimization
50
Copyright © 2015 BorgWarner Inc.
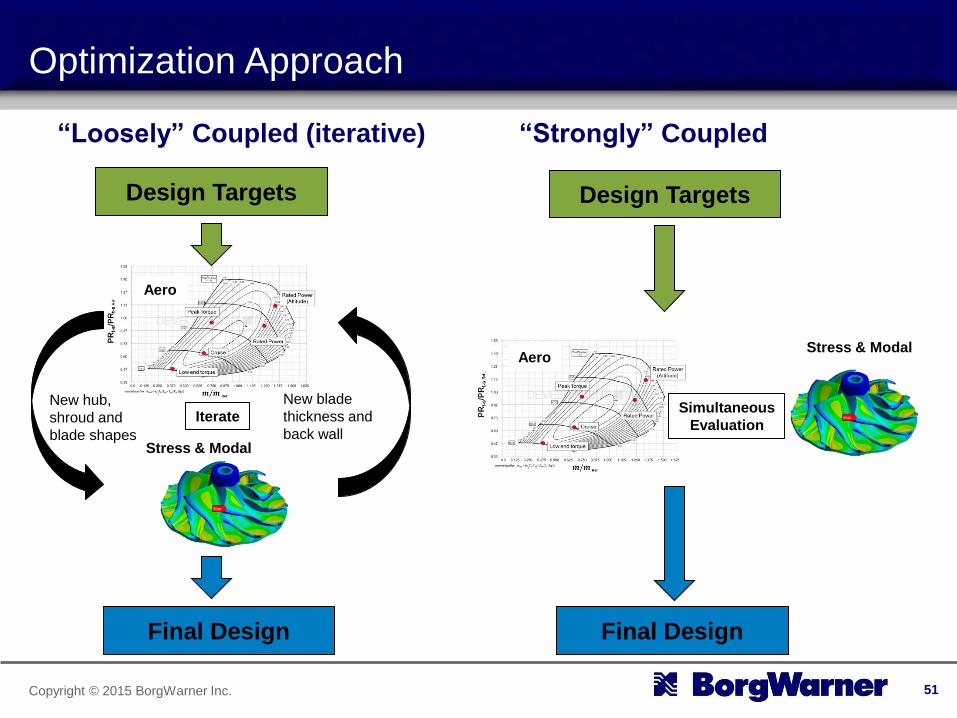
Optimization Approach
“Loosely” Coupled (iterative)
51
“Strongly” Coupled
Design Targets
Final Design
New hub,
shroud and
blade shapes
New blade
thickness and
back wall
Aero
Stress & Modal
Design Targets
Final Design
Aero Stress & Modal
Simultaneous
Evaluation Iterate
Copyright © 2015 BorgWarner Inc.
Optimization Approach
Loosely Coupled:
Advantages:
Speed, fewer variables.
Aero design is “unconstrained”.
Disadvantages
Potential of yielding a design that cannot be mechanically qualified.
Closely Coupled:
Advantages:
Interaction between structural and aerodynamic design trade-offs is captured.
Disadvantages
Number of variables to consider is overwhelming (especially if including modal).
Initialization and convergence is very difficult.
Simplification required may result in sub-optimal results as well.
52
Copyright © 2015 BorgWarner Inc.
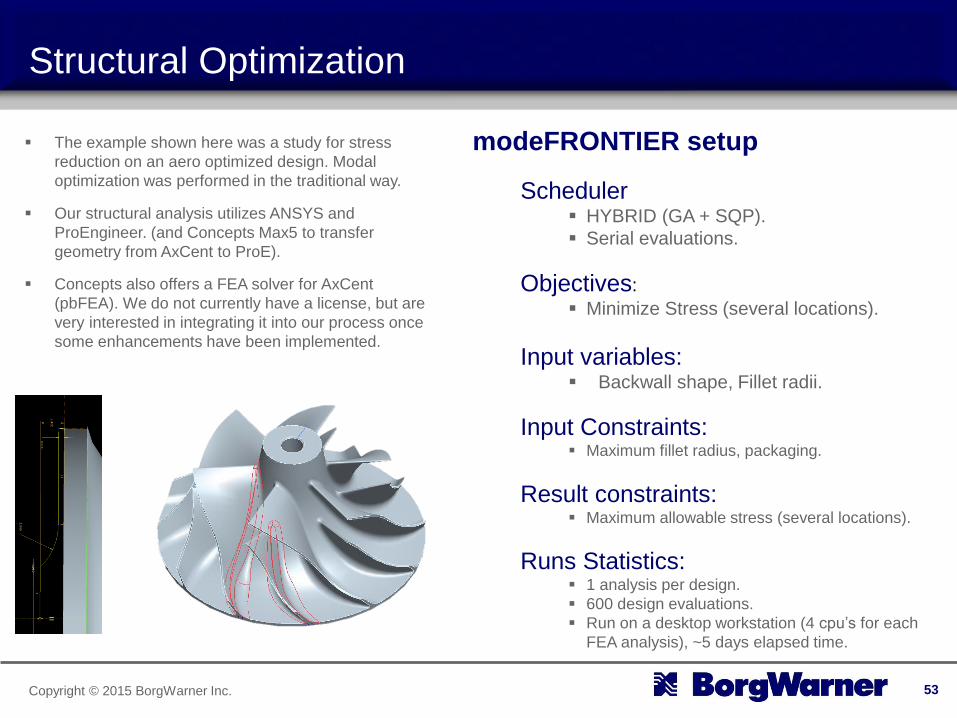
Structural Optimization
The example shown here was a study for stress
reduction on an aero optimized design. Modal
optimization was performed in the traditional way.
Our structural analysis utilizes ANSYS and
ProEngineer. (and Concepts Max5 to transfer
geometry from AxCent to ProE).
Concepts also offers a FEA solver for AxCent
(pbFEA). We do not currently have a license, but are
very interested in integrating it into our process once
some enhancements have been implemented.
53
modeFRONTIER setup
Scheduler HYBRID (GA + SQP).
Serial evaluations.
Objectives:
Minimize Stress (several locations).
Input variables: Backwall shape, Fillet radii.
Input Constraints: Maximum fillet radius, packaging.
Result constraints: Maximum allowable stress (several locations).
Runs Statistics: 1 analysis per design.
600 design evaluations.
Run on a desktop workstation (4 cpu’s for each
FEA analysis), ~5 days elapsed time.
Copyright © 2015 BorgWarner Inc.
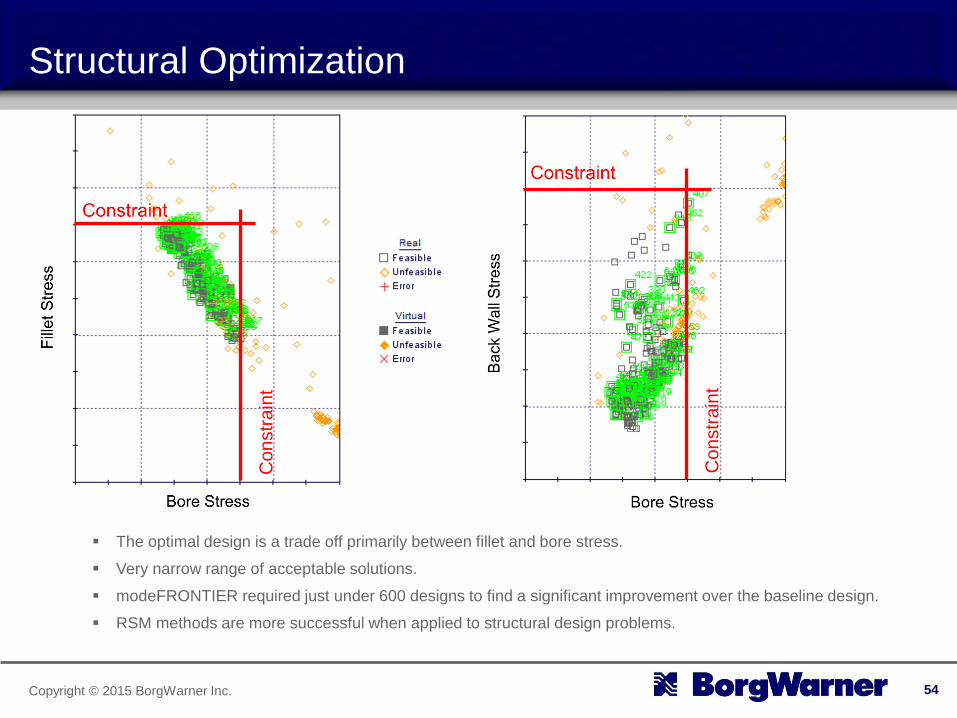
Structural Optimization
The optimal design is a trade off primarily between fillet and bore stress.
Very narrow range of acceptable solutions.
modeFRONTIER required just under 600 designs to find a significant improvement over the baseline design.
RSM methods are more successful when applied to structural design problems.
54
Co
nstr
ain
t
Co
nstr
ain
t
Copyright © 2015 BorgWarner Inc.
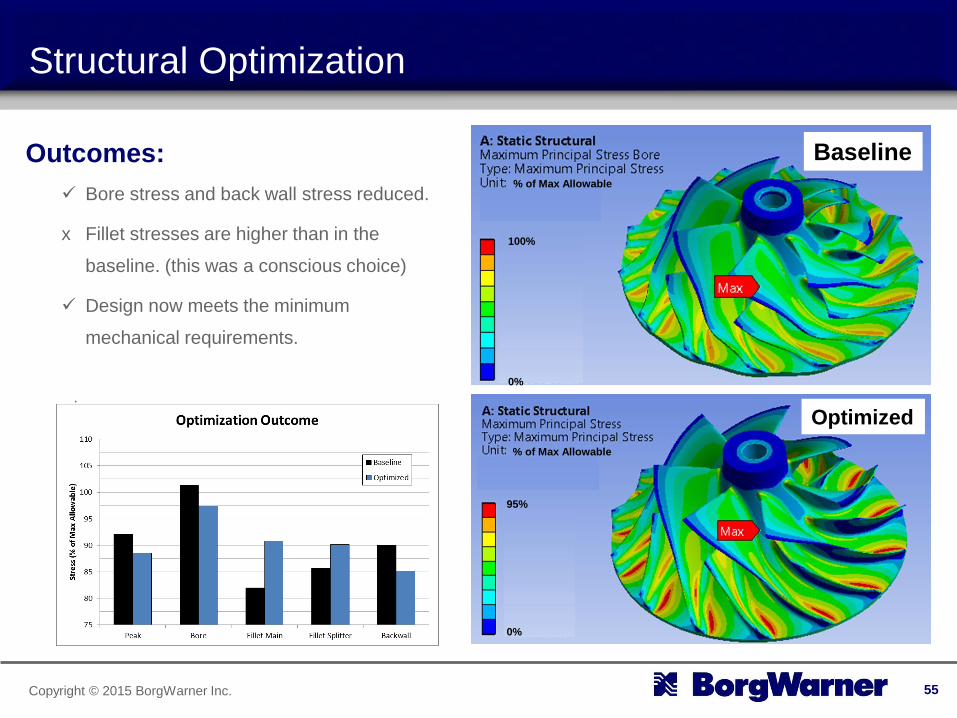
Structural Optimization
Outcomes:
Bore stress and back wall stress reduced.
x Fillet stresses are higher than in the
baseline. (this was a conscious choice)
Design now meets the minimum
mechanical requirements.
.
55
Baseline
Optimized
% of Max Allowable
% of Max Allowable
100%
0%
95%
0%
Copyright © 2015 BorgWarner Inc.
Summary
Similar methodology as was developed for aerodynamic design can also
be applied to structural optimization.
FEA methods are generally faster than CFD, but automatic geometry
generation is more challenging.
modeFRONTIER optimization with Hybrid or FAST scheduler.
RSM based schedulers are more successful with FEA than CFD.
Results show the potential for stress reduction.
56

Copyright © 2015 BorgWarner Inc.
Thank You
57
Related Documents