OPTIMISING THE REFRIGERATION AND COOLING SYSTEM OF A PLATINUM MINE J.L. BUYS 21163847 Dissertation submitted in partial fulfilment of the requirements for the degree Magister in Mechanical Engineering at the Potchefstroom Campus of the North-West University Supervisor: Prof M. Kleingeld November 2014 It all starts here TM

Welcome message from author
This document is posted to help you gain knowledge. Please leave a comment to let me know what you think about it! Share it to your friends and learn new things together.
Transcript
OPTIMISING THE REFRIGERATION AND COOLING
SYSTEM OF A PLATINUM MINE
J.L. BUYS
21163847
Dissertation submitted in partial fulfilment of the requirements for the
degree Magister in Mechanical Engineering at the
Potchefstroom Campus of the North-West University
Supervisor: Prof M. Kleingeld
November 2014
It all starts here TM

i
ABSTRACT
Title: Optimising the refrigeration and cooling system of a platinum mine
Author: Johan Leon Buys
Supervisor: Prof M. Kleingeld
The platinum mining sector of South Africa (SA) has been hit by the combined impacts of
falling Platinum Group Metals (PGM) prices, labour strikes and escalating production cost. The
main contributor pertaining to production cost rises is the increasing electricity tariffs. In order
for mines in the platinum sector to remain competitive, they need to reduce the energy
consumption of electrical intensive mining equipment.
Platinum mines in SA require large surface refrigeration systems due to the high underground
Virgin Rock Temperatures (VRT) gradients. Due to these high demands, refrigeration and
cooling systems are identified as one of the most intensive electricity consumers in the mining
process.
The need, therefore, exists to investigate optimisation strategies that can improve the Energy
Efficiency (EE) of platinum mines refrigeration and cooling system. The availability of Eskom’s
Energy Efficiency Demand-Side Management (EEDSM) incentives provides the opportunity to
optimise the electricity consumption with cost-effective strategies. The incentive will not only
reduce the demand of electricity, but also assist platinum mines on managing their production
cost increases more cost-effectively.
In this study, optimisation strategies were investigated that can be implemented on platinum
mines surface refrigeration and cooling system, along with underground water reticulation
systems. It was shown that through optimising both the service deliveries supply and demand,
larger saving can be realised.
Optimising strategies were identified to address possible inefficiencies in the refrigeration and
cooling system of platinum mines. The strategies entail water flow control to match the cooling
supply with the demand by means of implementing Variable Speed Drives (VSDs), and
equipment that will reduce the underground chilled water wastage of secondary spot coolers.
After implementation of proposed optimisation strategies on a case study, an average annual
power saving of R12.5-million was realised, without affecting the service deliveries thereof.
Potential results indicated that an additional annual saving of R0.8-million could be realised by
implementing the proposed optimising equipment on the underground spot coolers.

ii
ACKNOWLEDGEMENTS
Firstly, I would like to thank my Creator for blessing me with the ability and opportunity to
complete this study to the best of my ability.
TEMM International (Pty) Ltd. and HVAC International (Pty) Ltd. for providing me with the
opportunity, support and funding to complete this study.
Dr Deon Arndt for providing technical advice and assistance with the simulation model.
Dr Lodewyk van der Zee for his guidance and assistance during the study.
Colleagues Alistair Holman, Riaan Deysel and Janco Vermeulen for guidance and assistance
in case study project implementation.
My wife Michelle, for her endless love, support, and patience.
My parents for providing me with the best opportunities in life and supporting me throughout
my studies.
My parents-in-law for their encouragement and loving support.
My family and friends for their continued support.

iii
TABLE OF CONTENTS
Abstract ........................................................................................................................................ i
Acknowledgements .................................................................................................................... ii
Table of Contents ...................................................................................................................... iii
List of Figures ............................................................................................................................. v
List of Tables ........................................................................................................................... viii
Abbreviations ............................................................................................................................. ix
Nomenclature .............................................................................................................................. x
Chapter 1. Introduction ......................................................................................................... 1
1.1. Fragile economy on South African platinum mines ........................................................ 2
1.2. Platinum mine refrigeration and cooling systems ........................................................... 5
1.3. DSM supports both Eskom and mines .......................................................................... 9
1.4. Objective of this study ................................................................................................. 11
1.5. Overview of this dissertation ........................................................................................ 13
Chapter 2. Optimising platinum mine refrigeration and cooling systems ....................... 15
2.1. Introduction ................................................................................................................. 16
2.2. Typical large mine refrigeration and cooling system .................................................... 17
2.3. Background on mine refrigeration and cooling components ........................................ 21
2.4. Strategies and technologies for optimising refrigeration and cooling systems ............. 44
2.5. Obstacles for implementing EE technologies on mines ............................................... 61
2.6. Required alterations .................................................................................................... 62
2.7. Conclusion .................................................................................................................. 63
Chapter 3. Optimisation model development .................................................................... 64
3.1. Introduction ................................................................................................................. 65
3.2. Electricty load with baselines as referance .................................................................. 66
3.3. Refrigeration and cooling system constraints and variables ........................................ 69
3.4. Optimised solution on identified system inefficiencies ................................................. 75
3.5. Verification and simulation model ................................................................................ 90
3.6. Simulated savings ....................................................................................................... 92
3.7. Conclusion .................................................................................................................. 96

iv
Chapter 4. Case study: Implementation of proposed solution ......................................... 97
4.1. Introduction ................................................................................................................. 98
4.2. Contractor management .............................................................................................. 99
4.3. Optimisation strategy implemented on case study ..................................................... 101
4.4. System efficiencies ................................................................................................... 104
4.5. Electricity savings obtained through optimisation ...................................................... 106
4.6. Service delivery ......................................................................................................... 113
4.7. Conclusion ................................................................................................................ 117
Chapter 5. Conclusion ....................................................................................................... 118
5.1. Summary of Study ..................................................................................................... 119
5.2. Recommendations .................................................................................................... 121
References .............................................................................................................................. 122
Appendix A – Power data validation ..................................................................................... 131
Appendix B – HPE 3-way valve process and posible saving .............................................. 134
Appendix C – Simulation........................................................................................................ 138
Appendix D – Additional results ............................................................................................ 141
Appendix E – Additional images ........................................................................................... 143

v
LIST OF FIGURES
Figure 1: South African platinum mining labour productivity (kg produced per employee) and real labour
costs per kilogram of PGM produced, based indexed to 1990 (Chamber of Mines of South
Africa, 2013) ........................................................................................................................................... 2
Figure 2: Cost inflation affecting the South African mining sector, average annual for 2007 – 2012
(Chamber of Mines of South Africa, 2013). ........................................................................................... 3
Figure 3: Virgin underground rock temperatures – for South African regions (Nixon et al., 1992). ...................... 6
Figure 4: Underground worker performance as a function of environmental conditions (Le Roux, 1990). ........... 7
Figure 5: Megaflex weekday tariff structure (Transmission zone <300 km and voltage >500V & < 66kV)
(Eskom schedule of standard prices, 2014). ....................................................................................... 10
Figure 6: Simplified layout of a typical platinum mine cooling and water reticulation system. ............................ 18
Figure 7: Ideal vapour-compression refrigeration cycle as used for mine chillers. ............................................. 22
Figure 8: Illustration of a surface chiller screw compressor motor assembly. ..................................................... 23
Figure 9: Multi stage surface refrigeration system with back-pass valve control. ............................................... 26
Figure 10: Variable flow process design (Van der Walt & De Kock, 1984). .......................................................... 27
Figure 11: Variable temperature process design for centrifugal compressor refrigeration machines (Van
der Walt & De Kock, 1984). ................................................................................................................. 28
Figure 12: Variable temperature process design for screw compressor refrigeration machines (Van der
Walt & De Kock, 1984). ....................................................................................................................... 28
Figure 13: Variable flow and temperature process design (Van der Walt & De Kock, 1984). .............................. 29
Figure 14: Mine pre-cooling tower used to pre-cool hot water from underground. ............................................... 31
Figure 15: Typical heat rejection cooling tower layout. ......................................................................................... 31
Figure 16: Mine condenser cooling towers staged next to each other. ................................................................. 32
Figure 17: Schematic illustration of a vertical forced draft, counterflow BAC. ....................................................... 34
Figure 18: A multi-stage vertical BAC used on a platinum mine near Northam. ................................................... 34
Figure 19: Schematic illustration of a horizontal multi-stage forced draft, cross flow BAC. .................................. 35
Figure 20: A multi-stage horizontal BAC used on a platinum mine near Thabazimbi. .......................................... 35
Figure 21: Variation of water and air temperature through a cooling tower. ......................................................... 36
Figure 22: Schematic diagram of an in-line secondary heat exchanger used in underground mines. ................. 39
Figure 23: In-line type secondary ventilation air cooling car 1. .............................................................................. 39
Figure 24: Secondary ventilation cooler compact heat exchanger. ....................................................................... 40
Figure 25: In-line type secondary ventilation air spot cooler 2. .............................................................................. 40
Figure 26: Secondary air cooling spray chamber. ................................................................................................. 41
Figure 27: Surface chilled and hot water storage dams installed on a platinum mine near Thabazimbi. ............. 42
Figure 28: Typical centrifugal water pump and electric motor configuration. ........................................................ 43
Figure 29: Electric motor power consumption as a function of rated motor speed (Saidur et al., 2010) .............. 47
Figure 30: Relation between water pressure and flow (Vosloo et al., 2010). ........................................................ 54
Figure 31: Water supply valve configurations (Vosloo et al., 2010). ..................................................................... 54

vi
Figure 32: Maric 50mm x 3 orifice screwed brass constant water flow control valves adopted from (Maric
Flow Control, 2011).............................................................................................................................. 57
Figure 33: Schematic diagram of Maric cooling car valve assembly. .................................................................... 57
Figure 34: Typical performance of valve irrespective of body size or flow rate (Maric Flow Control, 2011). ........ 58
Figure 35: HPE constant water flow control valve (Hydro Power Equipment (Pty) Ltd, 2012).............................. 59
Figure 36: Schematic diagram of HPE cooling car valve assembly. ..................................................................... 59
Figure 37: Mine A surface refrigeration and cooling system total average electricity baselines. .......................... 67
Figure 38: Mine A refrigeration system prior to project implementation. ............................................................... 69
Figure 39: Mine A evaporator pump pipe configuration and design at BAC. ........................................................ 76
Figure 40: Inefficient evaporator water temperature control of Mine A. ................................................................ 77
Figure 41: Refrigeration system total power consumption. ................................................................................... 78
Figure 42: Mine A chill dam water supply and overflow pipe network. .................................................................. 79
Figure 43: Mine A average BAC sump and air temperatures for winter (July 2013) and summer
(November 2013). ................................................................................................................................ 81
Figure 44: Mine A BAC first stage spray pump water supply and delivery network. ............................................. 82
Figure 45: System layout with proposed infrastructure for Mine A. ....................................................................... 84
Figure 46: EMS control logic diagram adapted from Van Greunen (2014). .......................................................... 85
Figure 47: EMS to SCADA control communication diagram. ................................................................................ 86
Figure 48: BAC sump pre-cooling water flow control logic diagram for Mine A. ................................................... 87
Figure 49: Mine A evaporator water flow control logic diagram. ........................................................................... 87
Figure 50: BAC sump make-up water flow control logic diagram. ......................................................................... 88
Figure 51: Mine A condenser water flow control logic. .......................................................................................... 88
Figure 52: BAC water flow control logic diagram. .................................................................................................. 89
Figure 53: Validation of simulation model power profile with data measured on 2013/11/21 and
2013/07/18. .......................................................................................................................................... 90
Figure 54: Validation of simulation model BAC outlet temperature. ...................................................................... 91
Figure 55: Seasonal simulated total surface refrigeration and cooling system power profiles. ............................ 92
Figure 56: EMS print screen- main overview of chiller plant and auxiliaries. ...................................................... 101
Figure 57: Mine A average overall system pump power savings achieved during the assessment period
(July – September 2014). .................................................................................................................. 107
Figure 58: Mine A daily average evaporator pump power and water flow rate before and after
implementation. .................................................................................................................................. 108
Figure 59: Mine A daily average condenser pump power profile before and after implementation. ................... 108
Figure 60: Mine A daily average BAC spray pump power profile before and after implementation. ................... 109
Figure 61: Actual average weekday refrigeration, scaled baseline and saving achieved during the
assessment period. ............................................................................................................................ 110
Figure 62: Mine A daily profile of evaporator inlet and outlet temperatures measured during the
assessment months. .......................................................................................................................... 113
Figure 63: Mine A typical average daily profile of chill dam temperature and level measured during the
assessment months. .......................................................................................................................... 114

vii
Figure 64: Mine A typical daily profile of BAC water temperature measured during the assessment
months. .............................................................................................................................................. 115
Figure 65: Typical daily profile of BAC air temperature measured during the assessment months. .................. 115
Figure 66: Portable and permanent power meter data comparison. ................................................................... 131
Figure 67: Illustration of Dent logger and power meter installation. .................................................................... 132
Figure 68: Main incomer Dent logger calibration sheet. ...................................................................................... 133
Figure 69: HPE CC valve high flow illustration .................................................................................................... 134
Figure 70: Megaflex tariff structure vs. mining schedule (Transmission zone <300 km and voltage >500V
& < 66kV (Eskom schedule of standard prices, 2014) ...................................................................... 135
Figure 71: HPE CC valve low flow illustration ..................................................................................................... 135
Figure 72: Verification and baseline simulation model. ....................................................................................... 138
Figure 73: Proposed savings simulation model with VSD control. ...................................................................... 138
Figure 74: Average performance achieved as function of average ambient temperature for July 2014. ............ 141
Figure 75: Average performance achieved as function of average ambient temperature for August 2014. ....... 141
Figure 76: Average performance achieved as function of average ambient temperature for September
2014. .................................................................................................................................................. 142
Figure 77: EMS print screen – evaporator and BAC water network and respective VSD controllers ................. 143
Figure 78: EMS print screen – condenser water network and VSD controller .................................................... 143
Figure 79: EMS print screen – data logging, trending and power meter ............................................................. 144
Figure 80: VSD installed on the evaporator pumps. ............................................................................................ 144
Figure 81: VSDs installed on the BAC spray pumps. .......................................................................................... 145

viii
LIST OF TABLES
Table 1: Typical platinum mine electrical motor ratings. .................................................................................... 19
Table 2: Summary of refrigeration system process design proposed optimising strategy. ................................ 30
Table 3: Generic variable-flow control philosophy developed (Du Plessis, 2013). ............................................ 50
Table 4: Average savings achieved with the variable-flow strategy implemented on various gold mines
(2012/2013 Eskom tariffs) (Du Plessis, 2013; Van Greunen, 2014). .................................................. 50
Table 5: Typical VSD costs in South Africa (in South African Rand, November 2013 exchange rates). ........... 51
Table 6: VSD implementation on typical platinum mine refrigeration systems. ................................................. 51
Table 7: Chilled water demand savings with respective strategies (2014/2015 electricity tariff). ...................... 60
Table 8: Mine A surface chiller machines specifications. ................................................................................... 71
Table 9: Mine A surface condenser cooling tower specifications. ...................................................................... 71
Table 10: Mine A surface BAC specifications. ...................................................................................................... 71
Table 11: Mine A pre-cooling tower specifications. .............................................................................................. 72
Table 12: Mine A Chiller controllable water system ranges. ................................................................................ 73
Table 13: Mine A BAC system variable ranges .................................................................................................... 73
Table 14: Mine A chill dam system variable ranges ............................................................................................. 73
Table 15: Average weekday simulated VSD power and cost savings. ................................................................ 93
Table 16: Mine A expected annual average savings based on simulation model. ............................................... 93
Table 17: Mine A estimated pump motor savings calculated from Affinity Laws. ................................................ 94
Table 18: Expected annual savings based on CC calculations and assumptions ............................................... 95
Table 19: Subcontractor quotes comparison ........................................................................................................ 99
Table 20: Mine A Chiller evaporator pump VSDs control parameters................................................................ 102
Table 21: Mine A Chiller condenser pump motor VSD control parameters ....................................................... 103
Table 22: Mine A BAC pump motor VSD control parameters ............................................................................ 103
Table 23: Mine A average critical variables before and after implementation. ................................................... 104
Table 24: Mine A Chiller performances realised after project implementation. .................................................. 105
Table 25: Mine A actual measured pump motor savings realised with VSDs. ................................................... 106
Table 26: Mine A combined cooling system average electrical power saving summary. .................................. 111
Table 27: Mine A overall average annual cost saving. ....................................................................................... 112
Table 28: Mine A summary of project costs and relating expected payback period. ......................................... 112
Table 29: Summary of the effects on Mine A’s refrigeration and cooling system service deliveries. ................. 116
Table 30: Verification simulation model input variables. .................................................................................... 139

ix
ABBREVIATIONS
BAC Bulk Air Cooler
BIC Bushveld Igneous Complex
CC Cooling Car
CEP Capital Expansion Programme
COP Coefficient of Performance
DB Dry-Bulb
DSM Demand-Side Management
EE Energy Efficiency
EEDSM Energy Efficiency Demand-Side Management
EMS Energy Management System
ESCO Energy Service Company
GDP Gross Domestic Product
IDM Integrated Demand Management
M&V Measurement and Verification
MCU Mobile Cooling Unit
PBP Payback Period
PGM Platinum Group Metals
PID Proportional Integral Derivative
PLC Programmable Logic Controller
PTB Process Toolbox
RPM Revolutions per Minute
SA South Africa
SCADA Supervisory Control and Data Acquisition
TOU Time of Use
VRT Virgin Rock Temperature
VSD Variable Speed Drive
WB Wet-Bulb

x
NOMENCLATURE
Symbol Description Unit
°C Degrees Celsius (°C)
% Percentage (%)
Approach Temperature approach of contact heat exchanger (°C)
AEU Annual energy used (kWh)
CS Cost saving (R)
Cp Specific heat constant (kJ/kg.K)
ES Energy saving (kWh)
ET Electrical tariff (c/kWh)
g Gravity acceleration (m/s2)
GW Gigawatt (GW)
h Height (m)
hr Hour (hrs)
Hz Hertz (Hz)
kg Kilogram (kg)
kPa Kilo Pascal (kPa)
kW Kilowatt (kW)
kWA Actual capacity of an electrical motor (kW)
kWR Rated capacity of an electrical motor (kW)
L Load factor (%)
ℓ Litre (ℓ)
m Meter (m)
m Mass flow (kg/s)
Mℓ Mega litre (Mℓ)
MW Megawatt (MW)
P Power (kW)
PBP Payback period (years)
Q Flow rate (ℓ/s)
�̇� Thermal Energy (kJ)
Range Temperature range of contact heat exchanger (°C)
RFB Running feedback (-)
RH Relative Humidity (%)
S Motor speed reduction energy saving (%)

xi
T, Temp, temp. Temperature (°C)
W Electrical energy (kJ)
x Ambient dry-bulb temperature (°C)
y Electricity consumption per day kWh/day)
Δ Change (-)
η Efficiency (%)
r Density (kg/m3)

CHAPTER 1. INTRODUCTION
Ever increasing production costs and fragile labour relations are crippling the platinum mining
industry.

Chapter 1: Introduction
Optimising the refrigeration and cooling system of a platinum mine 2
1.1. FRAGILE ECONOMY ON SOUTH AFRICAN PLATINUM MINES
Mining companies around the world have been hit by slowing global demands, price
decreases and rapid escalations in domestic production costs. The mining industry has played
a key role in SA’s economic development for many years. SA’s mining industry is the fifth
largest in the world and accounts for 8.3% of SA’s Gross Domestic Product (GDP) on a direct
basis (Chamber of Mines of South Africa, 2013).
SA dominates the global production of PGM due to the large deposits located in the Bushveld
Igneous Complex (BIC) (Glaister & Mudd, 2010; Mudd, 2012; Cawthorn, 2010). SA holds over
80% of the world’s known PGM resources and reserves. Consequently, the country’s mining
industry accounted for 53.4% of global platinum supplies in 2013 (Baxter, 2014).
The impacts of global dynamics, despite the significant role and contribution of this sector to
the economy in SA, caused major crises for the industry. The platinum industry has been hit
by the combined impacts of falling PGM prices, escalating production cost and labour strikes
(Baxter, 2014).
Figure 1 depicts the downward trend of the total factor productivity of the platinum mining
industry from 1990 to 2012. Figure 1 illustrates how the labour costs increased through this
period and the productivity decreased for each worker per kilogram produced indexed. The
productivity, kilograms per worker indexed, in 2012 and 22 years back is almost identical,
although more efficient mining techniques are being used to date (Chamber of Mines of South
Africa, 2013).
Figure 1: South African platinum mining labour productivity (kg produced per employee) and real labour costs per
kilogram of PGM produced, based indexed to 1990 (Chamber of Mines of South Africa, 2013)
0
50
100
150
200
250
1990=
100
Labour cost per kg produced indexed Productivity, kgs per worker indexed

Chapter 1: Introduction
Optimising the refrigeration and cooling system of a platinum mine 3
Figure 1 shows that the industry nearly produced 40% less platinum output per worker in the
past 12 years presented. This while labour cost per kg produced indexed in 2012 is more than
double it was in 1990. The production costs have risen by a composite annual growth rate of
about 14% for the same period – contributing to the overall cost inflation mines experienced,
as shown in Figure 2 (Chamber of Mines of South Africa, 2013).
In Figure 2, the average annual inflation affecting the SA mining sector from 2007 to 2012 is
shown. It can be seen in Figure 2 why the production costs have increased so rapidly, with
electricity being the largest overall contributor to the production cost increases.
Figure 2: Cost inflation affecting the South African mining sector, average annual for 2007 – 2012 (Chamber of
Mines of South Africa, 2013).
The wage-related labour strikes the platinum sector experienced in SA caused a 60%
decrease in PGM supply, which affected 45% of the global platinum supply. The strikes
experienced in 2014 alone caused more than a 30% loss in the annual production of PGMs.
The employers have forfeited about R24 billion in revenue and employees around R10.6 billion
in wages and benefits for the five-month strike period (Russell, 2014).
When mines experience strikes there are still critical equipment, like dewatering and
ventilation systems, that need to operate continuously. An analysis was done on three mines
by Wannenburg et al. (2009), which indicated that 80% of the total monthly power
consumption was consumed by these base load systems (constant power consumers).
This means that roughly 20% of a mine’s monthly power consumption is production related
(Wannenburg et al., 2009). This contributes to the production losses platinum mines
experience during strikes, due to the constant high consumption of electricity.
26
18.115.7 15.3
1211.2
9.17.2
4.4
0
5
10
15
20
25
30
Cost in
flation [
%]
Electricity prices for mining PGM mining cash per 4e oz Diesel
Reinforcing steel Labour costs Structural steel
Cement Total producer price inflation rate Mining machinery

Chapter 1: Introduction
Optimising the refrigeration and cooling system of a platinum mine 4
It can be concluded that there is a proven need for platinum mines to manage their production
costs more effectively, to reduce costs where possible. With electricity price increases being
one of the largest contributor to production cost increases experienced in the past. The focus
will be to improve the EE on electrical energy intensive mining equipment, through the
implementation of optimisation strategies.
This will not only improve the rate at which production costs increases, but the success of
managing the energy consumption more effectively according to production demands as well.

Chapter 1: Introduction
Optimising the refrigeration and cooling system of a platinum mine 5
1.2. PLATINUM MINE REFRIGERATION AND COOLING SYSTEMS
Studies have shown that there is still significant scope for widespread EE improvements
(Inglesi-Lotz & Blignaut, 2011). This is especially true when focusing on high-demand sectors
(Du Plessis, 2013). In SA, the industrial and mining sectors combined use 38.4% of the
national electricity delivered, which makes it one of the largest electricity consumers in SA
(Eskom, 2013).
This large percentage can be expected from a country like SA, since the majority of its
economy relies on mineral extraction and processing (Schutte, 2007). Gold and platinum
mines lead the energy consumption in the industry with both consuming 47% and 33%
respectively (Eskom Demand Side Management Department, 2010).
SA deep level mines have unique refrigeration demands when considering the cooling
requirements that need to be satisfied. Most underground mines make use of chilled water and
cold ventilation air to satisfy these needs, generally defined as the underground service
deliveries. These cooling services ensure safe underground working conditions for both
employees and mining equipment at all times during mine production shifts (Du Plessis et al.,
2013). These energy intensive systems are shown to consume up to 25% of the total
electricity used on mines, depending on the depth of the mine (Schutte, 2007).
In Figure 3, it can be seen how the underground VRT increases with mining depth increases
for various mining areas in SA (Nixon et al., 1992). Platinum mines in SA are found in the BIC
due to the large PGM deposits (Mudd, 2012). Although platinum mines are not as deep as
gold mines, which relate to the remaining three regions shown in Figure 3, they definitely
require large refrigeration and cooling systems. Pertaining to platinum mines experiencing
underground VRTs most gold mines experience at almost double the depth than that of
platinum mines.
With these increasing VRTs, underground heat loads experienced are increasing in relation to
ever-increasing mining depths. Which actually causes refrigeration and cooling systems to
become more energy intensive (Zehir & Bagriyanik, 2012). As a result of the large and deep
areas, which need to be cooled, large cooling systems are essential on most deep mines in
SA (Du Plessis, 2013).

Chapter 1: Introduction
Optimising the refrigeration and cooling system of a platinum mine 6
Figure 3: Virgin underground rock temperatures – for South African regions (Nixon et al., 1992).
Additionally, refrigeration and cooling systems only form part of the overall mine water
reticulation system (Du Plessis et al., 2012; Vosloo et al., 2012). It is stated that greater
efficiencies can be obtained when the distribution system of service water is integrated with
the water reticulation system (Vosloo et al., 2012). When optimising both, the supply and
demand of the chilled services water – improving the EE potential of platinum mine
refrigeration and cooling systems, when considering both surface and underground inefficient
equipment.
This can potentially reduce the largest contributor to production cost increases experienced by
mines in general. It is shown that the unit cost for extracting platinum can be managed more
effectively when introducing optimisation strategies and equipment. The future of the deep
level mining for that reason increasingly depends on the industry’s ability to contend, in an
acceptable and cost-effective manner, to satisfy ventilation and cooling demands more
efficiently (Marx, 1990).
Figure 4 indicates the performance of underground mine workers in relation to the
underground WB temperature. From Figure 4 it is eminent that when the WB temperature
exceeds 31°C the worker performance drastically deteriorates. This shows the importance for
adequate supply of cooling and ventilation underground. Reduced production rates are likely if
the underground conditions exceed the approved limit. To ensure the productivity and safety
for all workers and machinery, the mining industry defined that the underground Wet-Bulb
(WB) temperature may not exceed 27.5°C (Vosloo et al., 2012).
10
20
30
40
50
60
70
80
90
0 1000 2000 3000 4000 5000
Tem
pera
ture
[°C
]
Depth below surface (m)
Bushveld Welkom Klerksdorp Carletonville
Chapter 1: Introduction
Optimising the refrigeration and cooling system of a platinum mine 7
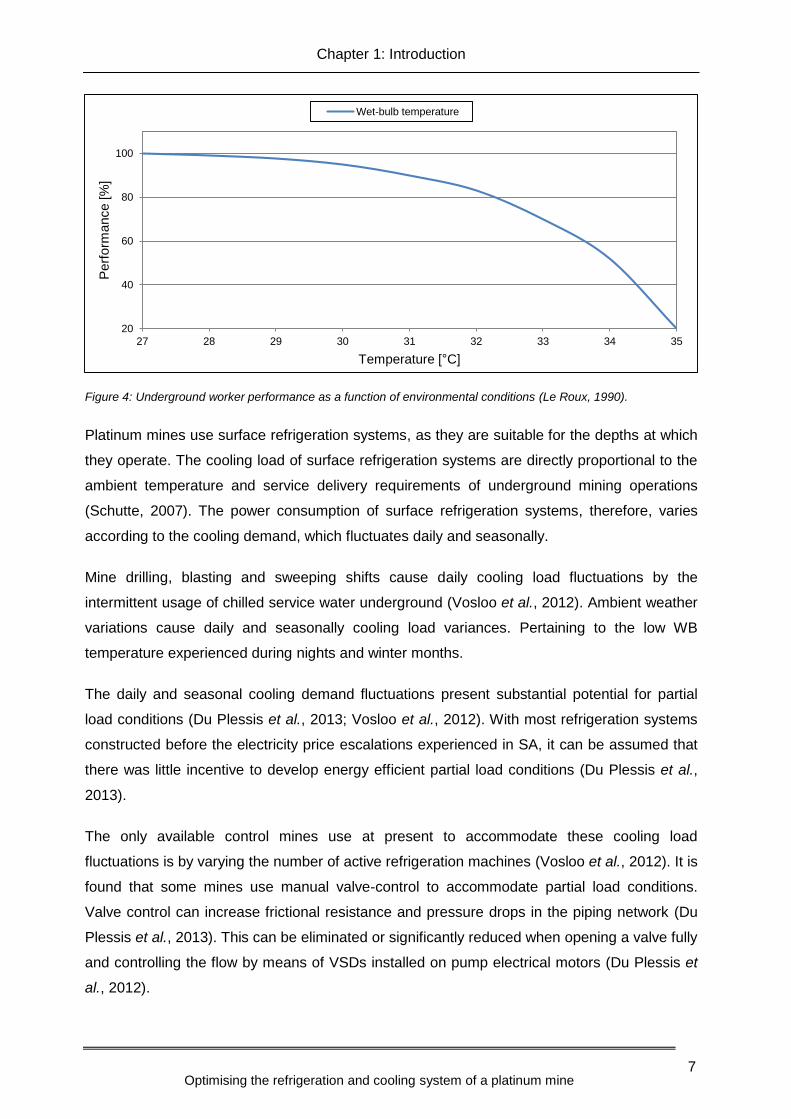
Figure 4: Underground worker performance as a function of environmental conditions (Le Roux, 1990).
Platinum mines use surface refrigeration systems, as they are suitable for the depths at which
they operate. The cooling load of surface refrigeration systems are directly proportional to the
ambient temperature and service delivery requirements of underground mining operations
(Schutte, 2007). The power consumption of surface refrigeration systems, therefore, varies
according to the cooling demand, which fluctuates daily and seasonally.
Mine drilling, blasting and sweeping shifts cause daily cooling load fluctuations by the
intermittent usage of chilled service water underground (Vosloo et al., 2012). Ambient weather
variations cause daily and seasonally cooling load variances. Pertaining to the low WB
temperature experienced during nights and winter months.
The daily and seasonal cooling demand fluctuations present substantial potential for partial
load conditions (Du Plessis et al., 2013; Vosloo et al., 2012). With most refrigeration systems
constructed before the electricity price escalations experienced in SA, it can be assumed that
there was little incentive to develop energy efficient partial load conditions (Du Plessis et al.,
2013).
The only available control mines use at present to accommodate these cooling load
fluctuations is by varying the number of active refrigeration machines (Vosloo et al., 2012). It is
found that some mines use manual valve-control to accommodate partial load conditions.
Valve control can increase frictional resistance and pressure drops in the piping network (Du
Plessis et al., 2013). This can be eliminated or significantly reduced when opening a valve fully
and controlling the flow by means of VSDs installed on pump electrical motors (Du Plessis et
al., 2012).
20
40
60
80
100
27 28 29 30 31 32 33 34 35
Perf
orm
ance [%
]
Temperature [°C]
Wet-bulb temperature

Chapter 1: Introduction
Optimising the refrigeration and cooling system of a platinum mine 8
In addition to the part-load conditions, most mine cooling systems in SA make use of
oversized and old equipment, which are poorly maintained, along with outdated control
systems and inefficient control strategies. These inefficient system operations make them
ideally suited for implementing new DSM projects (Du Plessis, 2013). In Chapter 2 of this
dissertation mine refrigeration systems, cooling strategies and inefficient equipment will be
discussed in more detail.
To summarise, the energy intensive refrigeration and cooling was identified as one of the
largest electrical energy consumers found on platinum mines. These systems greatly
contribute to the production costs increases through high electricity usage. It is found that
typical part-load conditions, inefficient operational methods and general lack of awareness of
EE technologies are prominent. Consequently, these systems present considerable potential
to optimise the electrical energy usage by introducing more efficient equipment and control
strategies (Grein & Pehnt, 2011).

Chapter 1: Introduction
Optimising the refrigeration and cooling system of a platinum mine 9
1.3. DSM SUPPORTS BOTH ESKOM AND MINES
The rising electricity tariffs and increasing pressure for mines to manage the electrical energy
consumption are leading mines to reconsider their stance for electricity saving initiatives, to
stay competitive. The difficulty platinum mines face is that there are little funds if any available
to implement EE projects themselves – pertaining to the volatile platinum prices, labour strikes
and production cost increases previously shown (Chamber of Mines of South Africa, 2013).
Eskom, as the main electricity supply utility of SA, manages both the supply and demand to
allow them to address the rising demands in electricity more efficiently. Despite this fact,
margins between demand and supply remain slim (Du Plessis, 2013; Eskom, 2013). Due to
the growing electricity demand, Eskom launched the Capital Expansion Programme (CEP) in
2005 to manage the supply of electricity (Eskom, 2013). With the CEP in place, Eskom
attempts to manage the supply of electricity by increasing the electricity generating capacity.
The construction of additional generation capacity/plants is extremely expensive and a lengthy
process, thus Eskom launched a national DSM programme (Singh, 2008). DSM can be
described as action taken to change the pattern or quantity of energy used by the consumers
(Pelzer et al., 2007). This approached involves implementing a combination of EE measures
and load management strategies (Schutte, 2007; Singh, 2008). This will assist Eskom in
postponing the predicted date when the electricity demand will reach the supply capacity
(Sebitosi, 2008).
DSM programmes have been used partially to fund EE projects on mines (Sebitosi, 2008).
This dramatically improves the financial aspect for all consumers, making DSM projects more
attractive and plausible for consumers to consider (Energy Research Centre: University of
Cape Town, 2004). DSM will not only benefit Eskom to reduce the demand of electricity, but
assist mines on managing their production cost increases too. The biggest contributor
identified for the production cost increases experienced by platinum mines are the electricity
costs.
Eskom’s Integrated Demand Management (IDM) business unit make use of several funding
opportunities to attract business owners to develop EE improvement programs (De la Rue du
Can et al., 2013). Eskom uses Energy Services Companies (ESCO) to implement DSM
projects (De la Rue du Can et al., 2013). The Time of Use (TOU) pricing structures was
introduced by Eskom, as one of the important approaches for DSM in SA.
The goal of this strategy is to persuade large industries to reduce their electricity usage during
Eskom peak demand periods (Vosloo et al., 2012). This is achieved by shifting load into off-

Chapter 1: Introduction
Optimising the refrigeration and cooling system of a platinum mine 10
peak periods, installing energy-efficient equipment and optimising strategies (Pelzer et al.,
2007). Most mines use the Megaflex tariff structure as shown in Figure 5. The energy tariff
structure for the different time periods and seasons are shown.
Figure 5: Megaflex weekday tariff structure (Transmission zone <300 km and voltage >500V & < 66kV) (Eskom
schedule of standard prices, 2014).
DSM is a feasible solution, which will, assist mines by reducing their electricity consumption.
The past success of DSM projects and increasing electricity tariffs provide enough suggestion
to justify further investigations for future EE projects (Eskom, 2013). As a result, Payback
Periods (PBPs) for implementing EEDSM projects are much shorter and the costs related
towards implementing these projects are significantly lower for the consumer than in the past.
0
20
40
60
80
100
120
140
160
180
200
220
Active e
nerg
y c
harg
e [
c/k
Wh]
Time of day [hour]
Low demand season [Sept - May] Low demand season average
High demand season [Jun - Aug] High demand season average
Standard
Off-peak
Off-peak
Peak Peak Standard
Standard

Chapter 1: Introduction
Optimising the refrigeration and cooling system of a platinum mine 11
1.4. OBJECTIVE OF THIS STUDY
From the preceding discussion, it is clear that a need exists for platinum mines in SA to reduce
production costs where possible, due to the increasing electricity costs, volatile platinum prices
and wage-related labour strikes. The EEDSM initiative from Eskom makes it more attractive
and feasible for consumers to reduce their demand through implementing EE initiatives. This
is realisable through introducing more energy efficient equipment and control strategies.
Du Plessis (2013) developed variable-flow optimisation strategies for large mine cooling
systems by introducing more efficient equipment. Du Plessis (2013) proved the effectiveness
and versatility of the variable water flow strategy, by implementing it on various large gold
mine cooling systems. By controlling the cooling supply to satisfy the demand accordingly,
electrical cost savings were realised. Large cost savings were obtained with the optimised
strategies, without adversely affecting the service delivery and system performances, with the
development of an energy management system that integrates these strategies in real-time
(Du Plessis et al., 2012; Du Plessis et al., 2013).
No results are documented to justify the feasibility and effects of adapting these strategies on
refrigeration and cooling systems of platinum mines in SA. This study will contribute to Du
Plessis' (2013) findings by adapting the developed strategies for platinum mines in SA.
This study will investigate the alternative EE possibilities on the energy intensive refrigeration
and cooling systems of mines in SA, with the focus remaining on platinum mines. Further
investigations will include the possibility of optimising a platinum mines’ chilled water demand
used in underground operations – showing what the impact will be of such a strategy on the
surface refrigeration demand and the overall mine’s water reticulation system.
To summarise, this study will focus on platinum mine’s surface refrigeration and cooling
systems with regards to the following:
Identify large energy consuming equipment within the platinum mine refrigeration and
cooling system that present opportunity for optimisation.
Identify refrigeration and cooling system inefficient control and equipment.
Investigate the possibility and feasibility of reducing underground chilled water demand
and the effects, thereof, on the mine water reticulation.
Develop and identify mathematical modelling to quantify the electricity saving achievable
through the utilisation of identified optimisation strategies.

Chapter 1: Introduction
Optimising the refrigeration and cooling system of a platinum mine 12
Develop a new control philosophy and specify new parameters that can be implemented
on the surface refrigeration system.
Simulate the new control philosophy to quantify the expected result to verify the feasibility
of proposed control strategies.
Implement and verify the new optimised control philosophy with a real-time energy
management system.

Chapter 1: Introduction
Optimising the refrigeration and cooling system of a platinum mine 13
1.5. OVERVIEW OF THIS DISSERTATION
Chapter 1
As introduction, a general background is provided regarding the need that presents itself for
platinum mines to implement DSM projects. The potential benefits of implementing DSM on a
platinum mine’s refrigeration and cooling system are discussed. The electricity tariff increases,
ever-decreasing generation plant availability and the financial pressure the platinum sector of
SA is undergoing, is identified as the research problem. The objective and scope for the study
are discussed and formulated.
Chapter 2
This chapter provides an overview of mine refrigeration and cooling systems and comparison
between other mining systems as found on deep level platinum mines. The overview includes
a description of mine surface refrigeration and the overall cooling system as used on platinum
mines. This will include detailed discussion on the subsequent system components, existing
EE equipment, optimisation strategies and service delivery requirements. The advantage of
implementing optimisation strategies on the water reticulation system in collaboration with
optimising the surface refrigeration system is investigated.
Chapter 3
In this chapter the refrigeration and cooling system of the case study platinum mine is
analysed. An energy audit is performed on the relevant system to quantify the electricity power
loads. From this audit, a baseline data set is compiled and verified by an independent party to
use as reference. Thereafter an optimised strategy is proposed to address identified system
inefficiencies. A simulation model designed in Process Toolbox and verification calculations
are used to quantify the proposed electricity savings. The feasibility of implementing the
proposed strategy is discussed in terms of project PBPs.
Chapter 4
This chapter focuses on the installation and implementation of proposed equipment and
resulting control strategies. A brief discussion of project management is provided with regards
to contractor selection and problems encountered. The electricity savings achieved with the
baseline data used as reference is presented.

Chapter 1: Introduction
Optimising the refrigeration and cooling system of a platinum mine 14
Chapter 5
The overall outcome of the project is summarised with relevant findings. The accuracy of
predicted potential for the implemented optimisation strategy is indicated. The overall
performance of the improvements and related efficiencies are quantified. Recommendations
are provided, highlighting the possibility for implementing other optimisation strategies on
platinum mine refrigeration and cooling systems.

CHAPTER 2. OPTIMISING PLATINUM MINE
REFRIGERATION AND COOLING SYSTEMS
Background toward identifying and customising the most appealing optimisation strategies to
implement on platinum mines’ refrigeration and cooling systems.

Chapter 2: Optimising platinum mine refrigeration and cooling systems
Optimising the refrigeration and cooling system of a platinum mine 16
2.1. INTRODUCTION
It can be concluded from the previous section that even though SA platinum mines operate at
much lower depths than gold mines, they still require large cooling systems – pertaining to the
high VRTs experienced in platinum mines at much lower depths.
There is an increasing need for SA mines, especially the platinum sector, to reduce production
costs where possible. This is caused by the increased awareness for optimising high electricity
consuming equipment and operations, in addition to high production cost increases and labour
strikes experienced.
The refrigeration and cooling systems of platinum mines are identified as worthy candidates to
investigate the potential for implementing optimisation strategies. These refrigeration systems
present opportunities to develop and implement DSM initiatives. This statement will be
explained more comprehensively in this section, focusing on the high electricity consuming
equipment.
Accordingly, a thorough literature review is necessary to understand and identify the relevant
system operations, constraints and considerations in more detail. It is important that the
identified factors are adhered to, when developing and implementing a new DSM strategy. Not
considering these factors can lead to production losses.
This chapter will provide background and explain the workings of refrigeration and cooling
systems as found on platinum mines. The focus is placed on large mine cooling systems and
more specifically on surface refrigeration systems, as these systems are prominently used
more on SA platinum mines. It is stated that cooling systems with one or more refrigeration
plant or chiller, with a cooling capacity of more than 1.05 MW, is categorised as “large”
(ASHRAE, 2001).
Background will be given on typical configurations of surface refrigeration systems and how
these systems form part of the overall water reticulation system as found on most platinum
mines. Attention is given to components in the refrigeration and cooling system that are high
electrical energy users.
Energy optimisation strategies and equipment relevant to the identified high electrical energy
consumers will be reviewed to identify possible optimisation solutions. EE initiatives on similar
systems and subsystems are discussed, to investigate the possibility of adapting existing
optimisation strategies.

Chapter 2: Optimising platinum mine refrigeration and cooling systems
Optimising the refrigeration and cooling system of a platinum mine 17
2.2. TYPICAL LARGE MINE REFRIGERATION AND COOLING SYSTEM
Heat stress administrative and management actions need to be taken when the underground
WB temperatures exceed 27.5°C (Venter, 2007). As a result large mine refrigeration and
cooling systems are introduced to uphold safe environmental condition for mining to continue
efficiently and safely. The three biggest sources of heat as defined by Van der Walt and
Whillier (1978) in underground mines are as follows:
Heat arising from rocks faces,
fissure water and
auto-compression from movement in the ventilation air down the shaft.
Further sources of heat are provided by Van der Walt and Whillier (1978).This all leads to
elevated temperatures that must be reduced by introducing artificial cooling.
The mining industry’s ability to stay competitive increasingly depends on its ability to maintain
acceptable environmental conditions underground in ever increasing mining depths, but doing
so in a cost-effective manner (Marx, 1990). Heat transfer networks used around the world are
mostly driven by electrical equipment, which is the case for SA mines as well (Swart, 2003).
The cooling required to maintain safe working temperatures has a direct relation to the depths
at which mining occurs. Therefore, mines’ electrical energy consumption increases in relation
to the mining depths and operations.
The required cooling capacity of a mine’s refrigeration system is depended on surface
conditions and underground depth of operations. The service delivery requirements and
operations of typical deep level mine cooling systems differ from that of building Heating
Ventilation and Air Conditioning (HVAC) systems (Du Plessis et al., 2013). Cooling systems on
mines do not only supply cold ventilation air, but large volumes of chilled mine water, which is
stored and then sent underground for an integrated network of end-users.
The water reticulation system on a mine is an integrated system, which comprise refrigeration
plants, together with underground water supply and dewatering systems (Vosloo et al., 2012).
These systems are installed on the surface and underground as part of typical semi-closed
loop mine water reticulation systems (Schutte, 2007). This integrated water reticulation system
extracts hot water from the mine, cools it down, then uses it for surface air-cooling and returns
cold service water to the various underground mining levels. This can be seen as a closed
system, due to external water sources like fissure water from underground rock faces, it is
described as semi-closed.

Chapter 2: Optimising platinum mine refrigeration and cooling systems
Optimising the refrigeration and cooling system of a platinum mine 18
The refrigeration machine (chiller) compressors together with the auxiliaries, which consist of
water pumps and air fans, are the highest electrical consumers in the refrigeration and cooling
system. The configuration, layout, control sequence and operation of the refrigeration system
vary according to mine-specific process constraints and distribution systems (Van der Walt &
De Kock, 1984). A simplified layout of a cooling system integrated with the reticulation system
is shown in Figure 6.
Chiller
Cold dam
Condenser
dam
Hot dam
Air and
water sent
underground
Storage dam
Surface cooling system
Underground water and
cooling network
To underground production areas,
cooling systems and spot coolers
Bulk air cooler
Condenser
cooling tower
Pre-cooling tower
2
1
8
7
5
4
3
26
Pre-cool
dam
LEGEND
Pump
Air flow
Valve
Electric motor
Condenser flow
Evaporator flow
Compressor De-watering pumps
BAC dam
Figure 6: Simplified layout of a typical platinum mine cooling and water reticulation system.
In Figure 6 the typical subsystem interaction, water flow and electrical energy input are
illustrated. The process is described briefly in the numbered items (note the numbers refer to
Figure 6) that follow:
1. Hot water storage: All the water from mining operations (chilled water sent underground
and fissure water) flows into underground hot water storage dams.
2. Dewatering system: Hot water from the underground dams are pumped to surface storage
dams.
3. Pre-cooling tower: The hot water then passes through a pre-cooling tower where it
accumulates in a pre-cooling dam. It is also known as the make-up water section, as this
is usually the part in the cooling process where the hot water re-enters the surface cooling
system. The pre-cooled water is then cooled as it is pumped through the evaporator heat
exchanger of the chiller.
4. Refrigeration machine/chiller: Chills the water by means of vapour compression or
ammonia absorption to the desired water outlet temperature. The specific layouts and

Chapter 2: Optimising platinum mine refrigeration and cooling systems
Optimising the refrigeration and cooling system of a platinum mine 19
location of mine chillers and pumps depend on application and underground water
requirements.
5. Chilled water storage: The chilled water usually flows into a surface chill dam where it is
stored. From here, chilled service water is supplied underground as needed. An actuating
valve that opens and closes as the demand varies throughout the day normally controls
the flow required underground.
6. Balk Air Cooler (BAC): The chilled water can also be supplied to a BAC that basically
supplies cold dehumidified ventilation air, that is forced by various ventilation fan
configurations, into the ventilation shaft. After the air is cooled, the water is returned to the
pre-cooling dam.
7. Condenser cooling tower: Serves as a heat rejection system to dissipate heat generated
in the refrigeration cycle to the atmosphere.
8. Underground chilled service water: After the chilled water is used for drilling, cleaning or
secondary cooling operations, such as in-stope Mobile Cooling Units (MCU), it flows into
underground storage dams.
Take note of the amount of electrical energy input required from electrical motors in this
simplified system. In reality a combination of chillers, fans and pumps are used depending on
the refrigeration requirements. The number of electrical motors usually in operation is
considerably more than illustrated in Figure 6.
Table 1 summarises the typical motor ratings of pumps, fans and chillers as found on platinum
mine refrigeration and cooling systems. It is shown that chiller compressor electrical motors
are individually the largest electrical consumer in the refrigeration system. It is reasonable to
assume that larger savings can be obtained from the chillers since they use larger electrical
motors.
Table 1: Typical platinum mine electrical motor ratings.
Mine Equipment rating [kW]
Pumps Qty Fans Qty Chillers Qty
A 30 - 330 8 90 - 160 7 1800 3
B 45 - 275 4 90 - 300 6 1800 2
C 75 - 400 8 90 4 1300 5
Water pumps and fans are in the range of 30 – 400 kW as shown in Table 1. Motor ratings and
quantity depends on application, air and water flow rates required for the respective systems.
Pump and fan electrical motors must not be undervalued since a significant amount of this
equipment are used in the refrigeration system. Therefore, savings that are possible from
pumps and fans, if looked at as a combined entity, can lead to substantial electricity savings.

Chapter 2: Optimising platinum mine refrigeration and cooling systems
Optimising the refrigeration and cooling system of a platinum mine 20
More detail of the above-mentioned refrigeration and cooling system components follow in
Section 2.3 and 2.4, explaining each component in more detail, mentioning the different
system configurations, technologies and control strategies available to reduce the electrical
power consumption on these electrical motors.

Chapter 2: Optimising platinum mine refrigeration and cooling systems
Optimising the refrigeration and cooling system of a platinum mine 21
2.3. BACKGROUND ON MINE REFRIGERATION AND COOLING COMPONENTS
2.3.1. Preamble
It is important to have an enhanced understanding of each component that makes up the
integrated refrigeration and cooling system. This is appropriate before proceeding with present
energy saving strategies implemented on similar systems. It is essential to understand the
principle of operation and performance considerations of each component and its subsystems,
before developing new optimisation strategies.
Refrigeration machine compressor motors are identified to be the single largest electricity
consumer in the refrigeration cycle. The subsystems of the refrigeration cycle also consume
considerable amounts of electrical energy if computed. It will be appropriate to investigate
these components in more detail, to identify possible electrical saving strategies more
effectively and safely. This will improve one’s knowledge to prevent that system constraints
are affected unintentionally.
Trends in SA’s mining industry show that surface refrigeration systems are used in preference
to similar underground systems. The main fact contributing to this trend is the poor and
uncertain nature of underground heat rejection systems. Heat rejection systems condense
heat from the refrigeration system to the atmosphere.
Owing to continuous mining operation advances and the nature of varying ventilation air,
underground condensing temperatures fluctuate throughout the mine’s life (see Section 2.3.3
and 2.3.4 for further detail). This makes it almost impossible to foresee the temperature of the
air available for heat rejection. Therefore, the focus of this dissertation will revolve around
surface refrigeration systems as mentioned previously.
Most platinum mines in SA use surface refrigeration installation as preference. In most cases,
these platinum mines reduce the cooling load required from their refrigeration machines during
winter months to reduce the electricity consumption – saving a substantial amount of money
as not all chiller machines are used during the expensive electricity tariff season (Holman et
al., 2013).
In the next sub-section the attention will be drawn to the chiller machines as it is identified as
the largest electricity consumer in the refrigeration system. Explaining the process in more
detail and mentioning where there may be opportunities to optimise the equipment according
to load conditions more effectively. The parameters in the refrigeration cycle that affect the
cooling load for the chillers will be highlighted and explained.

Chapter 2: Optimising platinum mine refrigeration and cooling systems
Optimising the refrigeration and cooling system of a platinum mine 22
2.3.2. Surface refrigeration chillers
Refrigeration machines found on mines usually operate according to the ammonia absorption
or the more common vapour-compression refrigeration cycle (Borgnakke & Sonntag, 2009).
The vapour-compression refrigeration cycle is used most commonly in the mining industry due
to its simplicity and relatively low maintenance compared to other processes (Schutte, 2007).
The vapour-compression refrigeration cycle works on a simple principle. When a working fluid
is heated to boiling point or saturation temperature (the point where the fluid turns to vapour), it
will do so at constant temperature if the applied pressure remains fixed. This pressure is called
the saturation pressure (Borgnakke & Sonntag, 2009). If the applied pressure increases, the
saturation temperature of the fluid will raise in relation and vice versa.
The fluid can be evaporated (vaporised) by either increasing the temperature above the
saturation temperature (at constant pressure) or decreasing the pressure (at constant
temperature). In the same manner, condensation from vapour to fluid may occur by
decreasing the temperature (at constant pressure) or increasing the pressure (at constant
temperature) (McPherson, 1993).
The relationship between the saturation pressure and temperatures for any given fluid differs,
refrigeration fluids are used according to these properties. Commonly used refrigerants are
R134a and ammonia (R717), because the fluid properties of these refrigerants are best suited
for chiller applications. Ammonia is a particularly efficient refrigerant which is ideal and only
used for surface chillers application due to its toxicity (McPherson, 1993).
Expansion
Valve
or
Capillary
Tube
Evaporator1
2 3 Condenser
Condenser
dam
Hot damCold dam
Pump
Valve
Electric motor
Condenser water
flow
Evaporator water
flow
Compressor
Refrigerant flow
Gearbox
Condenser
cooling tower
A
B
C
D
4
Figure 7: Ideal vapour-compression refrigeration cycle as used for mine chillers.

Chapter 2: Optimising platinum mine refrigeration and cooling systems
Optimising the refrigeration and cooling system of a platinum mine 23
Figure 7 illustrates a vapour-compression refrigeration system with the essential equipment.
The ideal cycle is explained briefly in the four steps that follow:
A. Compressor: The refrigerant is compressed adiabatically (irreversible) from stage 1 to a
superheated vapour at an elevated pressure at stage 2. When a vapour is at a
temperature greater than its saturation temperature it is a superheated vapour (Borgnakke
& Sonntag, 2009).
B. Condenser (heat rejection): The refrigerant is then condensed as heat is transferred to the
condenser water. The heat the condenser water collected is then rejected in the
condenser-cooling tower. The refrigerant leaves the condenser at stage 3 as a high-
pressure liquid.
C. Expansion valve: The refrigerant is flashed through an expansion valve, which reduces
the pressure of the refrigerant adiabatically. As a result, some of the liquid flashes to a
cold vapour. The temperature of the refrigerant decreases according to the basic principle
explained earlier. This is, when reducing the pressure of a refrigerant, the saturation
temperature will decrease accordingly. At stage 4, the refrigerant is now a mixture of
vapour and liquid (two-phase form).
D. Evaporator (heat absorption): The refrigerant then flows through the evaporator at
constant pressure, where the evaporator water in effect heats up the refrigerant, and as a
result, vaporises the refrigerant and the evaporator water is cooled. The refrigerant exits
the evaporative heat exchanger at stage 1, as a vapour before it re-enters the
compressor, thus closing the cycle.
Figure 8 illustrates an example of a surface screw compressor refrigeration machine
installation.
Figure 8: Illustration of a surface chiller screw compressor motor assembly.
Screw compressor Gearbox
Electric motor
Compressed refrigerant to condenser

Chapter 2: Optimising platinum mine refrigeration and cooling systems
Optimising the refrigeration and cooling system of a platinum mine 24
The only significant difference between the ammonia absorption and vapour-compression
cycle is in the method compression is achieved. The basic principle, described previously,
remains the same to achieve the cooling affect in both refrigeration cycles. The required
electrical energy input per cooling load output required to achieve compression in the
ammonia absorption cycle is less than that required in the vapour-compression cycle.
The most common compressors used in the vapour-compression and ammonia absorption
refrigeration cycles are centrifugal and screw types. It is important to note that centrifugal
compressor machines are sensitive to changes in the compression head, which is determined
by the condensing and evaporating temperatures. If these machines’ operating conditions
differ much from the design conditions, they became very inefficient. Screw compressors are
more widely used, due to their wide-ranging condensing temperatures and as a result are less
sensitive to these changes. For this reason, less electrical power is wasted if operation differs
from the design (Van der Walt & De Kock, 1984).
The cooling load of refrigeration machines are controlled by guide vanes in centrifugal
compressors and slide vanes in screw compressors (Widell & Eikevik, 2010). These control
methods adjust the refrigerant flow accordingly, to ensure a pre-determined outlet temperature
is achieved (McQuay International, 2005). The difference between the inlet and pre-set outlet
water temperature, determines the amount of compression needed in the refrigerant cycle
(Holman, 2013). This has a direct effect on the power consumption of the compressor’s
electric motor.
This can be explained with referring to Equation 2.1, which one can use to calculate the rate at
which thermal energy is absorbed by a refrigeration machine at any given moment.
�̇� = �̇�𝐶𝑝(∆𝑇) (2.1)
where,
�̇� = The rate of thermal energy transfer [kJ]
�̇� = Mass flow [kg/s]
𝐶𝑝 = Specific heat constant [kJ/kg.K]
∆𝑇 = Temperature difference [K]
From Equation 2.1 it eminent that for a set outlet temperature, the thermal load of a
refrigeration machine will depend on the inlet temperature, or the mass flow through the

Chapter 2: Optimising platinum mine refrigeration and cooling systems
Optimising the refrigeration and cooling system of a platinum mine 25
evaporator. By reducing any of the mentioned parameters, the compressor’s electrical energy
input can be reduced.
The efficiency of a refrigeration machine is defined by the Coefficient of Performance (COP),
which can be calculated for any given moment with Equation 2.2.
𝐶𝑂𝑃 =�̇�
𝑊𝐶𝑜𝑚𝑝 (2.2)
where,
�̇� = Thermal energy [kJ]
𝑊𝐶𝑜𝑚𝑝 = Compressor electrical energy [kJ]
The refrigeration machine’s COP is a ratio between thermal energy output and electrical
energy input. When the cooling load is reduced, due to lower inlet water temperatures or
reduced flow rates, the compressor will reduce the refrigerant flow and pressure by closing the
guide vanes or sliding valve accordingly. This will result in reduced compressor electrical
power usage. The COP of a large mine refrigeration machine can be expected to be between
3 and 6, with 6 being an energy efficient system and 3 an energy inefficient system
(Borgnakke & Sonntag, 2009).
Gorden et al. (2000) and Romero et al. (2011) showed that the COP of a refrigeration machine
increases at reduced evaporator flow rates and decreases with reduced condenser water flow
rates. When water flow rates are varied, compressor guide vanes or slide valves optimally
control the power consumption to match the varying load conditions. The effect on chiller
COPs, when varying the water flow, depends on the control strategy and how well the
compressor control manages the changing cooling load conditions (Bahnfleth & Peyer, 2004).
It is important to remember that the cooling load and consequently the electricity consumption
of surface refrigeration plants are directly related to ambient weather conditions, chilled water
temperatures and volumes required thereof.
Hence, mines implement different types of chiller machine configurations to accommodate
these changes. Each configuration working more efficiently to accommodate the varying
ambient and water temperatures, water flow required or even both. The following sub-section
will describe each of these configurations briefly by means of a visual illustration.

Chapter 2: Optimising platinum mine refrigeration and cooling systems
Optimising the refrigeration and cooling system of a platinum mine 26
2.3.3. Process layouts of mine refrigeration and cooling system
Before the discussion of the different refrigeration systems process design commences, a brief
background on back-pass valve control is necessary. Most of the refrigeration system process
designs described below make use of back-pass control to achieve improved chiller COPs.
Chiller back-pass valve control
Refrigeration systems on mines make use of this simple and cost effective control method to
operate the refrigeration machines at the highest level of efficiency. The back-pass valve
system consists of a pipe and control valve connection between the evaporator discharge and
inlet flow. The prime function of the back-pass valve control is to maintain a pre-determined
temperature for the water entering the evaporators. This ensures that the refrigeration
machine is operated near the design conditions and thereby, ensuring the least electrical
power is consumed for the most cooling, resulting in higher chiller COPs (Van der Walt & De
Kock, 1984).
A particular valued feature is that the bypass can be used to match the hydraulic characteristic
of the refrigeration installation with that of the cold water distribution system, enabling daily
temperature fluctuations to be accommodated accordingly (Van der Walt, 1979; Bailey-
McEwan & Penman, 1987). Meaning that the discharge water can be recirculated and in effect
reduce the overall system temperature and as a result reduce the workload of the refrigeration
machines.
Water pump
Bypass valve
Electric motor
Evaporator flow
Compressor
Cold dam 1
Cold dam 2
To underground
1
2
3
Pre-cool dam
Figure 9: Multi-stage surface refrigeration system with back-pass valve control.

Chapter 2: Optimising platinum mine refrigeration and cooling systems
Optimising the refrigeration and cooling system of a platinum mine 27
Figure 9 illustrates a simplified model of a multi-stage surface refrigeration system as installed
on a gold mine near Westonaria. Four vapour-compression cycle machines installed in parallel
are coupled in series to an ammonia absorption refrigeration machine. Water is pumped from
the surface hot dam to the pre-cooling tower and then to the first stage refrigeration before it
enters Cold dam 1. Thereafter, the water is cooled further before re-entering Cold dam 2 and
supplied to underground mining operations.
This gold mine refrigeration system is used as illustration to exemplify the means in which
back-pass valves can be implemented to optimise the overall system. Bypass valve 1 and 2 as
shown in Figure 9 is used, as explained earlier, to control the discharge evaporator water
temperature to a pre-determined set value. This will ensure that the machines operate more
efficiently. Bypass valve 3 is used in this case to control the overall system temperature and
reduce the system temperature.
Refrigeration process layouts
Major changes in water flow rates and temperatures are a result of the following:
Seasonal temperature changes caused by ambient WB temperatures fluctuations.
Daily ambient temperature variances.
Changes in underground chilled water requirements daily and seasonally.
As mentioned, these varying factors have an effect on the cooling load of the refrigeration and
cooling system. Different refrigeration layouts are used, each with a specific design to
accommodate site-specific variances as efficiently possible. This is performed with the existing
outdated equipment and control techniques. In the figures that follow, the basics of the
different process designs are given, clarifying the preferred application of each.
Pre-cool dam
Evaperator
Condenser
Cold dam
Heat
rejection
Hot dam
Water pump
Bypass valve
Electric motor
Condenser flow
Evaporator flow
Compressor
Evaperator
Condenser
Evaperator
Condenser
Evaperator
Condenser
Condenser dam
Figure 10: Variable flow process design (Van der Walt & De Kock, 1984).

Chapter 2: Optimising platinum mine refrigeration and cooling systems
Optimising the refrigeration and cooling system of a platinum mine 28
The variable flow process as shown in Figure 10 is appropriate when the cooling load is
primarily determined by changes in average chilled water demand requirements. The design is
typically used when underground chillers are linked to stope air coolers (MCU), which are
placed close to production areas and cools the surrounding air. The variable flow process
supplies chilled water at a relative constant temperature by varying the number of active
chillers according to water flow demands (Van der Walt & De Kock, 1984).
Condenser dam
Pre-cool dam
Cold dam
Heat rejection
Hot dam
Water pump
Bypass valve
Electric motor
Condenser flow
Evaporator flow
Compressor
Evaperator
Condenser
Evaperator
Condenser
Evaperator
Condenser
Figure 11: Variable temperature process design for centrifugal compressor refrigeration machines (Van der Walt &
De Kock, 1984).
The variable temperature process shown in Figure 11 and Figure 12 is primarily suitable for a
relative constant chilled water demand throughout the year. For this process the temperature
at which the water returns, determines the cooling load for the refrigeration machines (Van der
Walt & Whillier, 1978). The change in temperature is coupled to the varying ambient WB
temperature experienced because of fluctuating ambient conditions.
Condenser dam
Pre-cool dam
Cold dam
Heat
rejection
Hot dam
Water pump
Bypass valve
Electric motor
Condenser flow
Evaporator flow
Compressor
Evaperator
Condenser
Evaperator
Condenser
Evaperator
Condenser
Figure 12: Variable temperature process design for screw compressor refrigeration machines (Van der Walt & De
Kock, 1984).

Chapter 2: Optimising platinum mine refrigeration and cooling systems
Optimising the refrigeration and cooling system of a platinum mine 29
In the variable flow process, the evaporators of multiple chillers are placed in series. When
significant cooling load variances are experienced, a result of inlet water temperature changes,
chillers can be switched in or out of the system, doing so without affecting the water flow
through the evaporators. The variable temperature process designs are typically used for
surface refrigeration plants where pre-cooling is only used to cool service water.
The only significant difference between the process shown in Figure 11 and Figure 12 is the
condenser heat exchanger configuration. The condenser water circuit is coupled in parallel as
shown in Figure 12 when a screw compressor is used in the refrigeration cycle. For a
refrigeration cycle using a centrifugal compressor, the condenser circuit is connected in a
counter flow series configuration as shown in Figure 11.
Most mines experience the need for both variable flow and temperature control. This is typical
when the refrigeration plant installations provide chilled service water for underground mining
operations and bulk cooling of air on the surface. This is achieved by implementing a design
that combines both previously mentioned processes as shown in Figure 13.
Condenser dam
Pre-cool dam
Cold dam
Heat rejection
Hot dam
Water pump
Bypass valve
Electric motor
Condenser flow
Evaporator flow
Compressor
Evaperator
Condenser
Evaperator
Condenser
Evaperator
Condenser
Evaperator
Condenser
Figure 13: Variable flow and temperature process design (Van der Walt & De Kock, 1984).
It is found that most platinum mines in SA make use of the variable temperature process
configuration. Even though the last mentioned process design can accommodate more system
design changes. This can be a result pertaining to the initial capital needed for installing a
refrigeration plant, as the variable temperature process will require fewer control, piping and
pumping equipment.
Further, the variable flow process will be best suited for platinum mine in SA due to the large
ambient temperature differences experienced seasonally and daily in that region. Chillers can
be switched in or out of the system easily as needed during the varying ambient WB
temperatures without affecting the chilled water supply. It can be anticipated that process

Chapter 2: Optimising platinum mine refrigeration and cooling systems
Optimising the refrigeration and cooling system of a platinum mine 30
designs where the evaporative heat exchanger is coupled in series and pre-cooling only used
for cooling service water are used on platinum mines.
Table 2 indicates what energy reducing strategy can preferably be used on the various
refrigeration system process designs to achieve reduced electricity costs. It is important to
note that this only suggests what strategy can allegedly be implemented more effectively on
the different process designs. With few alterations, EE can most likely also be achieved on the
variable flow process and the same for the variable temperature design.
Table 2: Summary of refrigeration system process design proposed optimising strategy.
Process design Load shift Energy efficiency
Variable flow x
Variable temperature
x
Variable flow & temperature x x
In the refrigeration system as found on mines, they use wet heat rejection or absorption
cooling towers or chambers. Both of these methods make use of pumps to displace water
through the tower or chamber and fans to draw or force air through at the same time. The
motors electrical consumption has the potential to be reduced, to improve the overall running
cost of the refrigeration and cooling system. The following two sections will focus on whether
this can be achieved and if probable.
2.3.4. Heat rejection systems
Mines use heat rejection cooling towers to pre-cool underground return service water before it
re-enters the refrigeration system. An example thereof is shown in Figure 14. Heat rejection
cooling towers are also used to dissipate heat from the condensers of the refrigeration
machines to the atmosphere. Mines typically make use of induced draft cooling towers with
counter flowing water and air streams as shown in Figure 15.

Chapter 2: Optimising platinum mine refrigeration and cooling systems
Optimising the refrigeration and cooling system of a platinum mine 31
Figure 14: Mine pre-cooling tower used to pre-cool hot water from underground.
Pre-cooling and condenser towers use evaporative cooling and convection to realise the
available cooling from the ambient air, assuming that the ambient WB temperature is lower
than the temperature of the water (McPherson, 1993). In this case, evaporative cooling is the
effect when a portion of the water is evaporated into the atmosphere, because the moisture
content of the air is less. The evaporation process requires energy to change from liquid to
vapour, as a result the remaining water is cooled (Kröger, 1998).
Hot water
inlet
Cold water
outlet
Extraction fan
Mist eliminator
Water flow
Air flow
Heated air out
Inlet air flow
Packing
Cold water dam
Figure 15: Typical heat rejection cooling tower layout.

Chapter 2: Optimising platinum mine refrigeration and cooling systems
Optimising the refrigeration and cooling system of a platinum mine 32
A schematic layout of a condenser and pre-cool tower is shown in Figure 15 as used for
surface refrigeration systems. Condenser cooling towers are usually placed next to each other
as shown in Figure 16 to increase the cooling capacity. Warm water is sprayed from the top of
the tower, as the water is sprayed downward a mechanical fan draws air upwards. As warm air
is extracted from the tower, cold water is stored in a sump below the tower. The amount of
cooling depends on the contact time between the air and water (Holman, 2013).
Figure 16: Mine condenser cooling towers staged next to each other.
Factors that influence the amount of heat exchange that can occur in a cooling tower are the
counterflow velocities of the air and water, concentration and size of the water droplets.
Smaller water droplets expose a larger surface to the air, improving the rate of heat exchange.
These factors are influenced by changing the water supply pressure and flow, the size and
arrangement of spray nozzles or by increasing the exposure of the water surface to the air by
introducing splash bars, packing or fill in the heat exchanger (McPherson, 1993; Kröger,
1998).
The performance of a mine refrigeration heat exchanger can be calculated by using Equation
2.1 and 2.2. The COP of pre-cooling towers is significantly higher than mine refrigeration
machines due to the low work input required (Van der Walt & De Kock, 1984). The COP of
heat exchangers is directly related to the ambient WB temperature and performs very well in
the colder season (lower WB temperature).

Chapter 2: Optimising platinum mine refrigeration and cooling systems
Optimising the refrigeration and cooling system of a platinum mine 33
Cooling towers are designed on the average ambient temperature, water flow rates and water
temperature expected for the system. When lower WB temperatures are experienced during
operation than that of the design, over cooling can occur. The overall performance
experienced can result in unnecessary over cooling of the water. This presents the opportunity
to reduce the water flow and even air flow through the cooling tower by reducing pump and fan
speeds. Resulting in the potential energy reductions as mentioned possible earlier.
2.3.5. Heat absorption systems
Mines typically make use of the following heat absorption systems to provide the necessary
artificial cooling to sustain a productive working environment underground:
Surface or underground BACs depending on mine depths (direct contact system).
Mobile cooling units like Cooling Cars (CC).
Spray chambers (direct contact system).
The advantage of direct contact systems is that high thermal efficiencies can be reached, but a
significant amount of pumping is required. Close circuit systems require less pumping however
lower thermal efficiencies can be expected (Mackay et al., 2010).
Mines use BACs installed on surface or underground to provide cold dehumidified air for
underground ventilation. It is said that surface BACs is the least expensive method of cooling
air for underground mining operations and can reduce the amount of water to be circulated
underground (Van der Walt & De Kock, 1984).
Additionally, the water used for secondary cooling, such as CC and spot coolers, can also
contribute in reducing the electrical power consumption of mine refrigeration and dewatering
systems (Vosloo et al., 2012).
BACs, also known as evaporative spray chamber are the same as a heat rejecting cooling
tower, however the transfer of heat is directly opposite. The air is cooled to a lower WB
temperature while the water is heated when sprayed through the tower/camber.
Mines use either vertical towers or horizontal chambers, where the air draft through the
tower/chamber is mechanically forced. Hence called mechanical forced draft towers/chambers
(Kröger, 1998). Forced draft towers/chambers use fans to force air through the tower whilst
induced draft towers use fans to draw the air through the tower, see Figure 15 and Figure 17.

Chapter 2: Optimising platinum mine refrigeration and cooling systems
Optimising the refrigeration and cooling system of a platinum mine 34
Vertical forced draft tower
Water sump Water sump
Cold water in
Hot water
out
2 nd
Stage 1 st Stage
Mist eliminator
Warm air flow
Cold air flow
Warm inlet air
Cold outlet air
Air fan
Valve
Water pump
Figure 17: Schematic illustration of a vertical forced draft, counterflow BAC.
Figure 17 illustrates a multi-stage vertical forced draft cooling tower (multi-stage vertical BAC)
schematically. Chilled water at a temperature lower than the ambient WB temperature is
supplied to the spray nozzles situated at the top of the spray chambers. Ambient air is forced
through the spray chamber and chilled water supplied from the chillers cools the air before it is
forced to underground ventilations systems. In Figure 18 an example of an installed multi-
stage vertical BAC is shown – that is used to cool the ventilation air of mines on surface.
Figure 18: A multi-stage vertical BAC used on a platinum mine near Northam.

Chapter 2: Optimising platinum mine refrigeration and cooling systems
Optimising the refrigeration and cooling system of a platinum mine 35
Horizontal forced draft chamber
Horizontal BACs have limiting cooling capacities to that of vertical BACs (Holman, 2013).
Horizontal BACs can, however, be more easily used for underground cooling of ventilation air,
as it will not require extensive excavations (McPherson, 1993).
Water sump
Cold water inHot water out
1 st Stage2
nd Stage
Water sump
Mist eliminator
Warm air flow
Cold air flow
Warm inlet air
Cold outlet air
Air fan
Valve
Water pump
Figure 19: Schematic illustration of a horizontal multi-stage forced draft, cross flow BAC.
Figure 19 illustrates a horizontal multi-stage BAC. Ambient air is forced in to the spray
chamber as it flows across the spray water. The spray of the chilled water can be directed
either into or across the airflow. It is critical that the water spray and airflow is distributed
uniformly across the camber – therefore, the position of the nozzles and fans need to be
accurate to ensure optimal performance (McPherson, 1993). Figure 20 shows a multi-stage
horizontal BAC used to cool the ventilation air for a platinum mine on surface.
Figure 20: A multi-stage horizontal BAC used on a platinum mine near Thabazimbi.
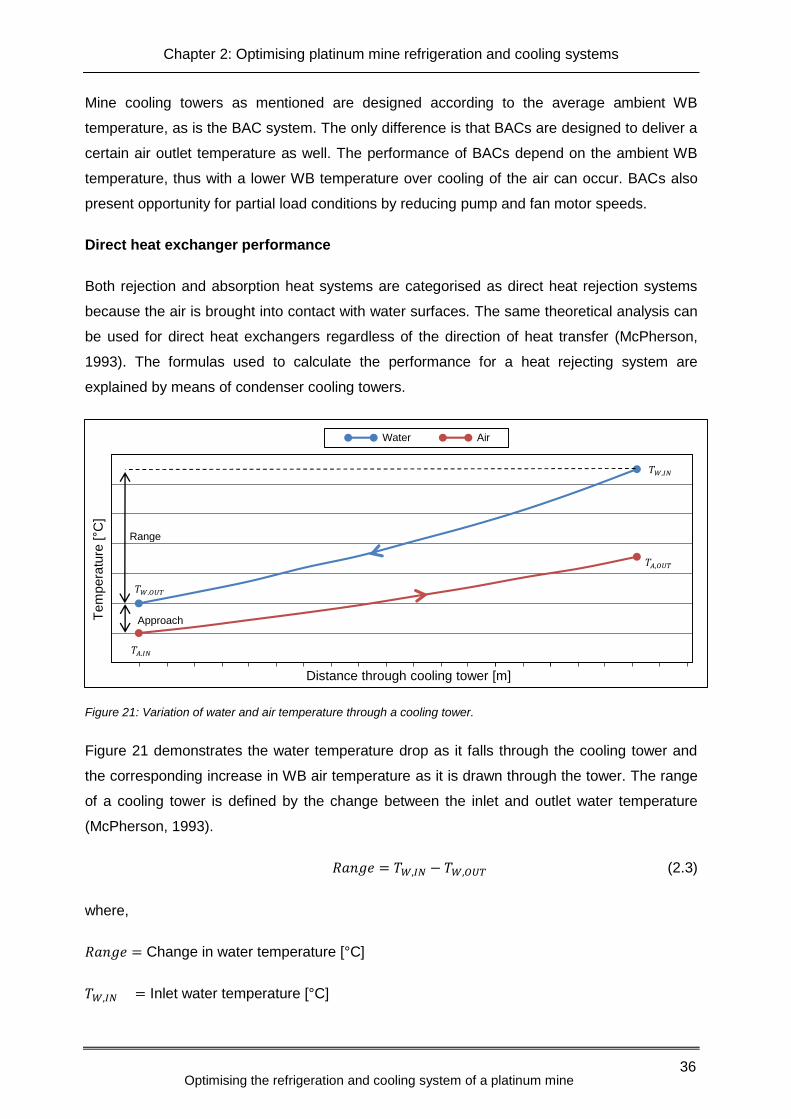
Chapter 2: Optimising platinum mine refrigeration and cooling systems
Optimising the refrigeration and cooling system of a platinum mine 36
Mine cooling towers as mentioned are designed according to the average ambient WB
temperature, as is the BAC system. The only difference is that BACs are designed to deliver a
certain air outlet temperature as well. The performance of BACs depend on the ambient WB
temperature, thus with a lower WB temperature over cooling of the air can occur. BACs also
present opportunity for partial load conditions by reducing pump and fan motor speeds.
Direct heat exchanger performance
Both rejection and absorption heat systems are categorised as direct heat rejection systems
because the air is brought into contact with water surfaces. The same theoretical analysis can
be used for direct heat exchangers regardless of the direction of heat transfer (McPherson,
1993). The formulas used to calculate the performance for a heat rejecting system are
explained by means of condenser cooling towers.
Figure 21: Variation of water and air temperature through a cooling tower.
Figure 21 demonstrates the water temperature drop as it falls through the cooling tower and
the corresponding increase in WB air temperature as it is drawn through the tower. The range
of a cooling tower is defined by the change between the inlet and outlet water temperature
(McPherson, 1993).
𝑅𝑎𝑛𝑔𝑒 = 𝑇𝑊,𝐼𝑁 − 𝑇𝑊,𝑂𝑈𝑇 (2.3)
where,
𝑅𝑎𝑛𝑔𝑒 = Change in water temperature [°C]
𝑇𝑊,𝐼𝑁 = Inlet water temperature [°C]
Tem
pera
ture
[°C
]
Distance through cooling tower [m]
Water Air
𝑇𝑊,𝐼𝑁
𝑇𝑊,𝑂𝑈𝑇
𝑇𝐴,𝐼𝑁
𝑇𝑊,𝐼𝑁 Approach
Range
𝑇𝑊,𝐼𝑁
𝑇𝐴,𝑂𝑈𝑇

Chapter 2: Optimising platinum mine refrigeration and cooling systems
Optimising the refrigeration and cooling system of a platinum mine 37
𝑇𝑊,𝑂𝑈𝑇 = Outlet water temperature [°C]
A cooling tower’s approach is defined by the difference between the outlet water temperature
and inlet airflow WB temperature.
𝐴𝑝𝑝𝑟𝑜𝑎𝑐ℎ = 𝑇𝐴,𝐼𝑁 − 𝑇𝐴,𝑂𝑈𝑇 (2.4)
where,
𝐴𝑝𝑝𝑟𝑜𝑎𝑐ℎ = Change in water temperature [°C]
𝑇𝐴,𝐼𝑁 = Inlet WB air temperature [°C]
𝑇𝐴,𝑂𝑈𝑇 = Outlet WB air temperature [°C]
Theoretically for a perfect cooling tower the two curves in Figure 21 representing the water
and air temperature would coincide. This means that the approach of the cooling tower will be
zero and the range will be equal to the difference in air inlet and outlet WB temperatures.
In practice, the inlet and outlet water temperature and ambient air temperature (inlet
temperature) conditions are available, thus meaning the simplest manner in which the
efficiency can be measure is by considering the range, approach and water-side efficiency
(McPherson, 1993).
𝜂𝑤 =�̇�𝑎𝑐𝑡𝑢𝑎𝑙
�̇�𝑡ℎ𝑒𝑜𝑟𝑒𝑡𝑖𝑐𝑎𝑙 (2.5)
𝜂𝑤 =𝑅𝑎𝑛𝑔𝑒
(𝑅𝑎𝑛𝑔𝑒+𝐴𝑝𝑝𝑟𝑜𝑎𝑐ℎ) (2.6)
where,
𝜂𝑤 = Water-side efficiency [%]
�̇�𝑎𝑐𝑡𝑢𝑎𝑙 = Actual heat lost from the water [kJ]
�̇�𝑡ℎ𝑒𝑜𝑟𝑒𝑡𝑖𝑐𝑎𝑙 = Theoretical maximum heat that can be gained by the air [kJ]
It is important to note that the performance of a cooling tower is indicated by a low approach
value and thus high water-side efficiency as well (Du Plessis, 2013).

Chapter 2: Optimising platinum mine refrigeration and cooling systems
Optimising the refrigeration and cooling system of a platinum mine 38
Mine secondary heat exchangers
Mining development is usually the activity with the highest heat loads relative to the amount of
ventilation air available. This often results in worksite temperatures being significantly higher
than that found with other mining activities in the same mine. Where the reach of cool surface
ventilation air is a borderline issue for a mine, secondary air-cooled heat exchangers can
specifically target development areas to supply adequate cool ventilation air (Howes, 1998).
Air-cooled heat exchangers (radiators) usually transfer heat from the process fluid to a cooling
air stream via surface or finned tubes (Kröger, 1998). In the case of mine secondary coolers
heat transfer is opposite to that of conventional air coolers. Mine secondary coolers transfer
heat from the air stream, via surface or finned tubes, to the process fluid (chilled water).The
cooling method of CC is based on the conduction and convection heat transfer between the
cold water and warm ventilation air (Van Eldik, 2006).
The performance of wet-cooling towers (BACs, condenser and pre-cooling cooling towers) is
primarily dependent on ambient WB temperatures. The performances of air-cooled heat
exchangers depend primarily on Dry-Bulb (DB) temperatures of air, which is usually higher
than the WB temperature (Kröger, 1998). The temperature of chilled service water determines
the base for the quantity of cooling that can be realised. Passing air cannot be cooled to a
lower DB temperature then that of the cooling water temperature.
For most platinum mines, the use of CC is subjected to seasonal changes, as cooler WB
temperatures are experienced through winter months less artificial cooling is required.
Basically two types of air coolers are used, in-line and spray types, to further reduce the
cooling load near mining stopes (Gunderson, 1990).
A. Secondary in-line cooler
Figure 22 shows a typical in-line secondary heat exchanger used for underground air cooling
in mines. Warm air from the surroundings is forced through the coils of a compact heat
exchanger (radiator) situated inside the CC using an electrical fan. The cold service water is
heated as it flows through the inside of the tubes, while the air is cooled as it flows over the fin-
tube assembly of the radiator. The warm water that exits the cooling car is then dumped into
mine trenches, which is a small channel that runs adjacent to the network tunnels that returns
hot fissure and service water to underground storage dams (Thein, 2007).

Chapter 2: Optimising platinum mine refrigeration and cooling systems
Optimising the refrigeration and cooling system of a platinum mine 39
Cold air out
From shaft
station
To stoping
area
Main cold
water supply
Manual
adjustable
valve
Fan
Compact heat exchanger
Warm air in
CC water
supply
Warm water
dumped into
trenches
Figure 22: Schematic diagram of an in-line secondary heat exchanger used in underground mines.
An example of the most commonly used CC is shown in Figure 23 with the air inlet at the left
and outlet to the right.
Figure 23: In-line type secondary ventilation air cooling car 1.
Figure 24 displays the inside of the CC shown in Figure 23, with the air inlet shown at the left
picture and outlet to the right. The pipes in the left picture are used to spray water into the
radiator to wash off any impurities, like mine dust. This is performed regularly to ensure that
the heat exchange rate between the air and water is not influenced.
1 Manos Engineering (Pty.) Ltd. 2013 Gallery. http://www.manos.co.za/gallery. (Date of access: 12 July. 2014).

Chapter 2: Optimising platinum mine refrigeration and cooling systems
Optimising the refrigeration and cooling system of a platinum mine 40
With the uses of CC being subjected to seasonal changes, winter months are ideally used to
do scheduled maintenance. It is required that CC is refurbished yearly to remove all impurities,
rust, fouling or any other reaction between the fluid and the wall material, to insure optimal
performance.
Figure 24: Secondary ventilation cooler compact heat exchanger.
Another in-line air cooler used in mines is place directly into ventilation ducts as shown by
Figure 25. The advantage with these air coolers, also known as spot coolers, is that the cooled
air can be focused to areas where cooling is needed with minimal heat gain.
Figure 25: In-line type secondary ventilation air spot cooler 2.
2 Manos Engineering (Pty.) Ltd. 2013. Gallery. http://www.manos.co.za/gallery. (Date of access: 12 July. 2014).

Chapter 2: Optimising platinum mine refrigeration and cooling systems
Optimising the refrigeration and cooling system of a platinum mine 41
B. Secondary spray chamber
Spray type secondary cooling equipment works on the same principle as BACs. Cold water is
sprayed in a chamber, while warm air is cooled as it passes through. Usually mine tunnels are
used as spray chambers as illustrated in Figure 26 below. The draft of the air flow through the
chamber is produced by extraction fans or secondary fans. In BACs water losses is kept to a
minimum with mist eliminators, but this is not the case with spray coolers. This is not the best
method for secondary cooling due to the high water wastage.
Main chill water supply
Manual
adjustable
valve
Return water trenches
To stoping
area
From shaft
station
Figure 26: Secondary air cooling spray chamber.
2.3.6. Water storage dams
Water is not only used as a working fluid in mines, but serves as thermal storage (hot or cold)
to provide a buffer in capacity (Schutte et al., 2008). The refrigeration and cooling system of a
mine is designed to deliver a constant supply of chilled water throughout the day (Vosloo et al.,
2012). The service water demand is intermittent as a result of the complex network of end
users and production shifts (Du Plessis et al., 2013). The primary purpose of storage dams,
temperatures and control bypass lines is to ensure that all safety regulations are fulfilled, so
that mining production can proceed with minimal disruptions (Bailey-McEwan & Penman,
1987; Jansen van Vuuren, 1983)
The varying chilled water demand of each mine has a direct effect on the size and location of
surface chilled water storage dams (Van der Walt & Whillier, 1978). Mine refrigeration systems
and storage dams are usually installed close to mineshafts, as shown in Figure 27. Chill dams
are closed off, all to keep temperature losses to the atmosphere at a minimum.

Chapter 2: Optimising platinum mine refrigeration and cooling systems
Optimising the refrigeration and cooling system of a platinum mine 42
Figure 27: Surface chilled and hot water storage dams installed on a platinum mine near Thabazimbi.
As mentioned, mine refrigeration systems supply a constant flow of chilled water to storage
dams. The storage dams then absorb the fluctuating chilled water demand experienced
throughout the day. If the refrigeration system, including the storage dams, is controlled
optimally according to Eskom’s TOU tariff structure, large savings can be achieved as shown
by Calitz (2006), Schutte (2007) and Van der Bijl (2007).
2.3.7. Water pumps and electric motors
Two types of water pumps commonly used are centrifugal and axial flow types. Both pump
designs work on the basic principle that energy of a liquid is increased by imparting
acceleration to it as it flows through the pump impeller. The impeller of a pump supplies the
energy (velocity) to the liquid, which in turn is driven by an electric motor. To recover the high
fluid discharge velocity (kinetic energy) it is converted to pressure energy. This energy
conversion efficiency depends largely on the impeller blade, diffuser and volute (casing)
design (Sayers, 1990).
Hot water dams
Chill water dams
Horizontal BAC
Pre-cooling tower

Chapter 2: Optimising platinum mine refrigeration and cooling systems
Optimising the refrigeration and cooling system of a platinum mine 43
Figure 28: Typical centrifugal water pump and electric motor configuration.
Figure 28 illustrate a typical centrifugal pump driven by fixed speed electric motor to distribute
water in the evaporator, condenser and BAC water circuits. Electrical motor size and pump
arrangements depend on the pressure and flow required for each different application. Table 1
shows typical motor ratings used in the refrigeration and cooling system. The designed
performance of a given pump or pump system is shown by a characteristic curve (Sayers,
1990). This curve usually illustrates delivered pump head, efficiency, power and required net
positive suction head as function of liquid flow rates. The operating point of the pumps should
be selected at the region of optimal pumping efficiency (BPMA, 2004).
It is important to note that pump impeller speed alterations will cause pump characteristic
curves to change (Sayers, 1990). Despite the fact, pumps should theoretically be well suited
for speed reduction (BPMA, 2004; Du Plessis, 2013). It remains eminent that all variables are
considered since reduced pump efficiencies can lead to increased breakdowns. Therefore,
energy savings achieved should be evaluated against pump deficiencies experienced from
reduced flow rates to ensure pumping efficiencies remain adequate.

Chapter 2: Optimising platinum mine refrigeration and cooling systems
Optimising the refrigeration and cooling system of a platinum mine 44
2.4. STRATEGIES AND TECHNOLOGIES FOR OPTIMISING REFRIGERATION AND
COOLING SYSTEMS
Understanding the function and working of refrigeration and cooling system components will
not result in optimisation strategies, but contribute to the knowledge and expertise for
implementing possible EE strategies more effectively and accurately. It is essential to
understand each component in the cooling systems to ensure that mine constraints are not
influenced negatively, all systems run efficiently and perform according to system
requirements.
Various studies have investigated the possibility of improving the energy and cost efficiency of
mine cooling systems. The following section will describe possible strategies that can be
adopted for optimising platinum mine refrigeration and cooling systems.
2.4.1. Variable flow control with VSDs
Overview
The term VSD can either refer to electrical or mechanical equipment that control the speed of
electrical motors or the equipment connected to the motors (Carrier, 2005). Electrical VSDs
have become very popular devices to regulate the speed and rotational forces of mechanical
equipment (Van Greunen, 2014; Saidur et al., 2012). Industrial and commercial applications
range from chillers used for HVAC purposes in large buildings to process plants. On mines,
their application varies across conveyors, hoists, draglines and shovels, grinding mills,
electrical motor driven pumps, fans and compressors (Yu & Chan, 2008). The wide use of
VSDs is proof enough to exemplify the reliability and effectiveness thereof.
Basically, VSDs operate by varying the frequency of the AC voltage supplied to the motor
using solid state electronic devices. The frequency range is anything between 1 and 50 Hertz
(Hz). VSDs control frequency and voltage simultaneously to maintain a constant ratio between
the volts (V) and hertz (Hz). When this Volts/Hertz (V/Hz) ratio is kept constant, the current
flow remains similar to full speed conditions and the torque delivered by the motor remains
unchanged. Motor torque is changed when the V/Hz ratio is not kept constant through the
frequency range (Saidur et al., 2012).
There are currently many motor applications that can be retrofitted to allow for VSD control, as
these systems are currently very inefficient. VSD technologies are being introduced in a wide
range of industries to reduce losses of mechanical equipment. Equipment is used more
efficiently by allowing for optimal speed control and motors to operate at ideal speeds for every

Chapter 2: Optimising platinum mine refrigeration and cooling systems
Optimising the refrigeration and cooling system of a platinum mine 45
load condition. Further advantages compared to other types of variable speed controls include
(Saidur et al., 2010):
Energy saving,
improved process control,
reduced voltage starting (smoother motor start-ups),
lower system maintenance (build-in diagnostics),
by-pass capability,
multi-motor control and
remote condition monitoring capabilities.
Methods for varying mechanical equipment rotational speeds
Many applications in the industry require the speed of a motor or its drive chain be varied to
enable a more efficient process and equipment control. Prior to the advent of electrical VSDs,
many technologies have been used to achieve variable speed control. Mechanical and
hydraulic VSDs have been used for many years, adapting to modernisation of technology and
need therefor. These include (Saidur et al., 2012):
Control valves, dampers and vanes,
fossil fuel engines,
hydraulic clutches,
belt or chain drives and
gearboxes.
VSDs can be used to save significant amounts of energy in process operations compared to
traditional control methods where the load or speed of the operation varies, adding to system
inefficiencies. When considering motor-pump assembly with flow control by means of an
actuating valve, throttling always occurs at full motor speeds resulting in full motor power
usage throughout the speed ranges. VSDs increase electrical efficiency by allowing motors to
run at ideal speeds with a benefit of reducing the electricity consumption while achieving the
reduced speeds.
Saidur et al. (2012) established that the simplicity and low costs mechanical VSDs are still
preferred. Variable speed controls through mechanical VSDs all exhibit similar characteristics.
Motors operate at constant speeds while the mechanical coupling ratio alters to achieve
varying speeds. The torque load on the coupling device output increase and as a result, the
motor torque load will increase in relation thereto (Saidur et al., 2012).

Chapter 2: Optimising platinum mine refrigeration and cooling systems
Optimising the refrigeration and cooling system of a platinum mine 46
Therefore, electrical VSD control still has a massive market to penetrate. Pertaining to the
general lack of awareness on this technology in the industry, the energy saving accompanied
thereby, the simplicity and proven effectiveness thereof.
Varying water flow with VSDs
Studies have shown that implementing VSDs to control electrical motors is one of the most
efficient and promising control methods to utilise partial load conditions (Mecrow & Jack,
2008).
Seasonal weather changes and daily temperature fluctuations have shown to have an effect
on mine refrigeration systems cooling demand and as a result partial load conditions exist as
explained earlier. Several studies found that cooling water and air is oversupplied during these
periods without considering the potential for optimising refrigeration and cooling components
accordingly (Du Plessis, 2013; Vosloo, 2008).
A solution would be to match the water and air temperature supply of the refrigeration and
cooling system according to demand requirements (Yu & Chan, 2013). The water flow through
each circuit (evaporator, condenser and BAC) within the refrigeration system can be varied to
achieve this (Du Plessis, 2013).
A generic variable flow control strategy was developed by Du Plessis (2013) to achieve the
desired variable control on mine surface refrigeration systems. This strategy was adjusted and
applied on gold mines’ surface refrigeration systems. It resulted in an average daily system
electrical energy consumption reduction of 35.4% during a three-month period.
Costs saving related toward implementing VSDs
Figure 29 is a visual representation of the theoretical cubic power-flow Affinity Law. This
shows that large electrical energy savings can be achieved with relatively small motor speed
and flow variations (Saidur et al., 2010). Figure 29 illustrates the relationship between speed
reduction and power consumption of an electric motor.

Chapter 2: Optimising platinum mine refrigeration and cooling systems
Optimising the refrigeration and cooling system of a platinum mine 47
Figure 29: Electric motor power consumption as a function of rated motor speed (Saidur et al., 2010)
For example when applying Equation 2.7, a 25% reduction in motor speed will result in a
42.2% motor power consumption of the full load (0.75)3 (Saidur et al., 2012). Therefore, the
power consumption of the motor will be reduced by 57.8%.
𝑆𝑆𝑅 = (1 − 𝐸𝑆𝑉𝑆𝐷)3 (2.7)
where,
𝑆𝑆𝑅 = New motor power usage with reduced speed [% of full load power]
𝐸𝑆𝑉𝑆𝐷 = VSD speed reduction [% of speed reduced]
The motor electrical energy usage and saving can be estimated with the following equations
(Thirugnanasambandam et al., 2011):
Electrical motor energy usage:
𝐴𝐸𝑈 = 𝜂 × 𝑃 × 𝐿 × ℎ𝑟 (2.8)
where,
𝐴𝐸𝑈 = Annual energy used [kWh]
𝜂 = Motor efficiency [%]
𝑃 = Power rating [kW]
ℎ𝑟 = Operating hours [hrs]
0
20
40
60
80
100
10 20 30 40 50 60 70 80 90 100
Pow
er
consum
ption [
%]
Rated speed [%]

Chapter 2: Optimising platinum mine refrigeration and cooling systems
Optimising the refrigeration and cooling system of a platinum mine 48
𝐿 = Load factor [-]
and
𝐿 =𝑘𝑊𝐴
𝑘𝑊𝑅 (2.9)
where,
𝑘𝑊𝐴 = Electrical motor actual capacity [kW]
𝑘𝑊𝑅 = Electric motor rated capacity [kW]
Now the VSD energy saving can be calculated by using Equation 2.10:
𝐴𝐸𝑈𝑉𝑆𝐷 = 𝐴𝐸𝑈 × 𝑆𝑆𝑅 (2.10)
The cost-effectiveness is commonly indicated by the PBP, which can be calculated by
Equation 2.11 (Saidur et al., 2012):
𝑃𝐵𝑃 = 𝐶𝑉𝑆𝐷
𝐶𝑆𝑉𝑆𝐷 (2.11)
where,
𝐶𝑉𝑆𝐷 = Cost of installing VSDs [kW]
𝐶𝑆𝑉𝑆𝐷 = Cost saving with VSDs [kW]
The cost saving of a VSD can be calculated with Equation 2.12 (Abdelaziz et al., 2011):
𝐶𝑆𝑉𝑆𝐷 = 𝐸𝑆𝑉𝑆𝐷 × 𝐸𝑇 (2.12)
where,
𝐸𝑇 = Electricity tariff [c/kWh]
The following simplified equation can be used during the investigation process to identify
possible pump electric motors for implementation of VSDs. An equation was developed to
estimate the potential VSD savings achievable from a flow reduction of between 0% and 30%
(Saidur, 2010). It is said that the condenser and evaporator flow rates will rarely be reduced
below 30% of the design flow during variable flow interventions (Van der Zee, 2013).

Chapter 2: Optimising platinum mine refrigeration and cooling systems
Optimising the refrigeration and cooling system of a platinum mine 49
𝑉𝑆𝐷𝑠𝑎𝑣𝑖𝑛𝑔 = (1 −𝑚𝑟𝑒𝑑𝑢𝑐𝑒𝑑
𝑚𝑚𝑒𝑎𝑠𝑢𝑟𝑒𝑑)𝑃𝑝𝑢𝑚𝑝 × 2 (2.13)
where,
𝑉𝑆𝐷𝑠𝑎𝑣𝑖𝑛𝑔 = Savings resulting VSD flow reduction [kW]
𝑚𝑚𝑒𝑎𝑠𝑢𝑟𝑒𝑑 = Measure flow before VSD implementation [ℓ/s]
𝑚𝑟𝑒𝑑𝑢𝑐𝑒𝑑 = Reduced flow with VSD implementation [ℓ/s]
𝑃𝑝𝑢𝑚𝑝 = Measure power usage of pump with 𝑚𝑚𝑒𝑎𝑠𝑢𝑟𝑒𝑑 [kW]
Control strategies implemented on mines
VSDs installed on chillier compressor motors alone can lead to a 12 – 24% energy saving
(Qureshi & Tassou, 1996). Implementing VSDs on chiller compressor electric motors have
shown to have poor PBP, pertaining to the high costs of medium-voltage VSDs in SA. A
potential PBP of 4.2 years exists when chiller loads can be reduces substantially. However, a
PBP of only 15.5 years with typical reduced loads can be achieved, due to the large cooling
requirements on mines (Du Plessis et al., 2013). From an economical view, this would not be
feasible pertaining to the long return on investment.
PBPs of less than one third of the expected electric motor life should be considered viable
(Abdelaziz et al., 2011). When considering low-voltage electrical motors instead where typical
feasible PBPs have been reported to be less than two years (Ozdemir, 2004). Pump and fan
motors are considered more viable with reported PBP of 1.3 years and less (Crowther &
Furlong, 2004; Du Plessis et al., 2013). Crowther and Furlong (2004) confirmed that energy
savings can be realised with variable speed control on cooling fans.
A 16.3% to 21% annual electricity consumption reduction was achieved on a case study with
air-cooled centrifugal chillers through optimised condensing temperature control and varied
evaporator chilled water flow. The ambient temperatures and chiller load conditions were used
to adjust the condensing temperatures accordingly (Yu & Chan, 2008). During this exercise, it
was noted that a minimum water flow rate should be set to prevent water from freezing in the
evaporator tubes and scale building up in both evaporator and condenser tubes.
Du Plessis et al. (2012, 2013) specifically developed a new variable-flow control strategy that
is versatile enough to implement on all large mine cooling systems. Table 3 is a short
summary of the generic variable-flow strategy developed that can be altered for site-specific
applications.

Chapter 2: Optimising platinum mine refrigeration and cooling systems
Optimising the refrigeration and cooling system of a platinum mine 50
Table 3: Generic variable-flow control philosophy developed (Du Plessis, 2013).
Pump set Variable water flow control philosophy
Evaporator pumps Modulate flow to maintain set chilled water dam level
Condenser pumps Modulate flow to maintain design condenser water temperature rise
BAC pumps Modulate supply flow in proportion to ambient enthalpy
Modulate return flow to maintain set BAC drainage dam level
Pre-cooling pumps Modulate supply flow to maintain set pre-cooling dam level
During this study the effects of the variable-flow strategy was analysed with a case study gold
mine used to verify the reported tendency of COP variances. It was shown that chiller COP will
increase at decreased evaporator water flow rates and decrease at decreased condenser
water flow rates (Yu & Chan, 2012; Navarro-Esbrì et al., 2010; Gordon et al., 2000).
A COP variance within 1.5% was maintained of the original value. It is important that both
evaporator and condenser water flow strategies are implemented simultaneously (Du Plessis
et al., 2012). After implementation, the combined cooling load remained the same, although
the combined plant COP increased by 33%.
This strategy was implemented on numerous gold mine refrigeration and cooling systems as
shown in Table 4 (Du Plessis, 2013; Van Greunen, 2014). The variable-flow strategy resulted
in an average daily power saving of 1 540 kW for the numerous gold mines. In other words,
the refrigeration systems electrical energy consumption was reduced by 35% on average. This
proved that the variable-flow strategy and energy management system could effectively be
customised for a diversity of cooling systems to realise cost-effective energy savings. This was
achieved without affecting critical service delivery requirements (Du Plessis, 2013).
Table 4: Average savings achieved with the variable-flow strategy implemented on various gold mines (2012/2013
Eskom tariffs) (Du Plessis, 2013; Van Greunen, 2014).
Gold mine
Average power saving [kW]
Measured saving [% of baseline]
Annual cost saving [R]
Implementation costs [R]
PBP [Months]
A 1 471 47 5 456 415 1 633 910 2.3
B 2 609 35 9 669 996 5 241 322 7.0
C 1 865 32 6 919 997 5 360 000 10.0
D 606 29 2 250 000 3 193 838 17.0
E 1 149 34 4 259 998 1 927 837 5.0
Average 1 540 35 5 711 281 3 471 381 8.3

Chapter 2: Optimising platinum mine refrigeration and cooling systems
Optimising the refrigeration and cooling system of a platinum mine 51
Implementation costs on platinum mine refrigeration systems
It is important to consider related costs when evaluating the feasibility of optimisation
strategies. These include capital expenditure required, return on investment and cost per
saving achievable with project implementation. Data obtained from Mine A, B and C is shown
in Table 5 and Table 6 respectively. Table 5 shows typical costs of low-voltage VSDs
applicable for most pumps in the refrigeration system on platinum mines in SA.
Supply and installation cost per VSD increase with decreasing pump motor power ratings (Du
Plessis, 2013). The benefit of pumps with smaller motor rating should be carefully considered
before purchase. A result caused by the decreasing motor electricity saving possible and the
increased cost per kW to implement (R/kW). Installation costs demonstrated in Table 5 include
typical cabling, harmonic protection units, Programmable Logic Controller (PLC) programming,
communication network equipment and the commissioning thereof.
Table 5: Typical VSD costs in South Africa (in South African Rand, November 2013 exchange rates).
Description Voltage
[V] 400 kW
[R] 330 kW
[R] 275 kW
[R] 250 kW
[R] 132 kW
[R]
Company A 525 318 483 231 552 223 900 190 516 134 300
Company B 525 540 080 471 310 405 124 340 564 236 761
Average [R/kW]
1 073 1 065 1 144 1 062 1 406
Installation cost 525 20 929 49 744 48 469 40 415 28 033
VSD R/kW cost
52 151 176 162 212
Total R/kW cost
1 126 1 216 1 320 1 224 1 618
Table 6 reflects the costs pertaining to the implementation of an optimisation strategy with the
installation of VSDs on refrigeration system auxiliary equipment. The proposed savings that
can be achieved is based on an energy audit that was done by an ESCO. The total project
cost is mostly related to pumping infrastructure installed on the mines, as more VSDs are
required to achieve variable-flow control. The required VSDs that need to be installed on
existing pumps to attain variable flow control are site-specific.
Table 6: VSD implementation on typical platinum mine refrigeration systems.
Mine Cooling
duty [MW] Proposed
saving [kW] Evaporator pumps [kW]
Condenser pumps [kW]
BAC pumps [kW]
Project costs (Excl VAT)
A 19 1150 2 x 300 4 x 275 3 x 132 R3 093 801
B 10 700 3 x 250 3 x 275 - R1 991 470
C 27 1440 2 x 400 5 x 400
- R3 443 816 1 x 200 2 x 250

Chapter 2: Optimising platinum mine refrigeration and cooling systems
Optimising the refrigeration and cooling system of a platinum mine 52
2.4.2. Chilled water demand management
Overview
There are various methods to improve water consumption and consequently the energy
consumption on mine water reticulation, dewatering and refrigeration systems (Vosloo et al.,
2010; Vosloo et al., 2012). Whilst most optimisation strategies focus on reducing the system’s
energy consumption, this section will focus on the factors causing the high-energy
consumption.
Improving water system design and practise are key strategic requirements in moving towards
a more sustainable mining industry (Gunson et al., 2012). Through variable-flow control, mine
refrigeration systems can be optimised by varying the water flow according to actual cooling
loads, which in effect depend on the ambient temperature and chilled water demand. Using
the identified variable-flow strategy one can optimise the supply-side of the chilled water.
When a strategy or technology can be incorporated to reduce the demand of the chilled water,
it will be possible to achieve even greater EE results.
It is shown that when service water distribution systems are incorporated with water
reticulation systems, which is used in various places for cooling of ventilation air, large savings
is possible (Gunderson, 1990; Whillier, 1980; Vosloo et al., 2012). Service water is mainly
distributed to production areas and the consumption, thereof, is approximately proportional to
the rate of production (Vosloo et al., 2010; Whillier & Van der Walt, 1977).
As stated earlier, due to limitations in underground heat rejection capacity and simplicity of
surface refrigeration plants, surface cooling systems are preferred. In addition to cool
ventilation air, chilled water is supplied underground by means thereof. This may be used in
air-cooling devices adjacent to the working areas or as service water used in drills, dust
suppression and sweeping (Howes, 2011). The cooling of service water as well as water used
for remote cooling, such as MCUs, can significantly reduce electrical power consumption on
mine refrigeration systems (Vosloo et al., 2012).
Water is gravity fed through a series of high pressure piping networks to the working areas,
the pressure increases by approximately 1000 kPa for every 100 m head. Hence, some form
of water reduction is necessary to reduce the water pressure to safer working pressures
(Vosloo et al., 2010). Combining this increased water pressure and increasing water quantities
required underground, saw the introduction of energy recovery devices to help improve the
electricity consumption (Gunderson, 1990; Van der Walt & De Kock, 1984):

Chapter 2: Optimising platinum mine refrigeration and cooling systems
Optimising the refrigeration and cooling system of a platinum mine 53
Usually water turbines coupled to pumps or generators,
3-CPS (Three Chamber Pipe System) and
underground refrigeration plants.
The 3-CPS and turbine systems are very efficient and practical alterations to the inefficient
dissipaters. The problem with these very effective techniques is with the initial cost and time
for implementation. The amount of water consumption underground must be of such quantity
that the energy recovery resulting therefrom justifies the initial implementation (Gunderson,
1990; Vosloo et al., 2010).
The used underground mine service and fissure water is channelled in trenches towards
settlers, where mud is separated from the water. The water then flows into hot storage dams
where it is pumped to the surface (dewatering system) (Thein, 2007). The hot water is then
filtered and re-cooled for reuse in the water cycle, where the excess water is dumped into the
environment, thus closing the reticulation system.
In this case, the objective is to reduce the amount of chilled water supplied underground,
which will reduce the load on the dewatering system. In effect, the amount of chilled water
required from the surface refrigeration plant will be reduced as well. This strategy will in effect
result in electrical energy savings on the refrigeration system and dewatering system. The
demand reduction in chilled water required underground will in effect reduce the cooling load
on the refrigeration machines. The dewatering system will extract less water and therefore,
pump cost savings can be achieved (Gunderson, 1990; Gunson et al., 2012; Vosloo et al.,
2010).
In the following sub-sections, possible chilled water DSM strategies will be described and
discussed. A viable solution for optimising platinum mines underground cooling system will be
considered in terms of PBP. Further techniques to reduce mine water uses are explained by
Gunson et al. (2012).
Water pressure control
Water leakages and wastage is a common occurrence in underground deep level mines. It is
found that mining levels or areas where production has ceased are still supplied with water.
The problem, even with pipes that are blanked off, is the water leaks that occur between the
shaft water column and the abandoned mining section (Vosloo et al., 2010). One technique
Vosloo et al. (2010) implemented is to control water pressure entering underground mining
levels to reduce this water wastage.

Chapter 2: Optimising platinum mine refrigeration and cooling systems
Optimising the refrigeration and cooling system of a platinum mine 54
Figure 30 shows the water pressure rate as a function of water flow downstream of a valve,
which is normally situated on each level near the shaft, and can be represented by a
logarithmic function. This trend is unique for each level and is dependent on the pipe size and
layout, valve specification and end users downstream of the valve (Vosloo et al., 2010). It is
important to realise that a downstream water leak at high pressure will cause increased chilled
water wastages.
Figure 30: Relation between water pressure and flow (Vosloo et al., 2010).
Briefly described, each level has a valve configuration near the shaft that can regulate water
flow and pressure. Figure 31 illustrates the simplified valve configuration with two pressure
control valves and one isolation valve.
Cold dam
Isolation valve
Pressure control valve
Back-up pressure control valve
Controlled flow to mining level
p
p
Pressure transmitter
Figure 31: Water supply valve configurations (Vosloo et al., 2010).
Depending on mine water flow and pressure requirements, these valves can be set to the
required pressure set point. Different mining shifts and production or non-production days will
determine the required pressure set point for the control and isolation valves, typically on non-
production days the isolation valve will be fully closed (Vosloo et al., 2010).
0
200
400
600
800
1000
1200
1400
1 2 3 4 5 6 7 8 9 10 11 12
Pre
ssure
[kP
a]
Flow [ℓ/s]

Chapter 2: Optimising platinum mine refrigeration and cooling systems
Optimising the refrigeration and cooling system of a platinum mine 55
The problem with this reticulation strategy is that it will have large implementation costs,
especially if there are no actuating valves installed initially. This strategy will be more feasible
where mining production occurs at greater depths. At increased depths, mines usually
consume more water and are more likely to have levels with no production. Increasing the
electrical energy savings possibility, as these mines have more than one pumping station,
which is usually not the case on platinum mines.
The supposition, therefore, can be made that this strategy requires higher initial pumping costs
for the dewatering system and more levels of production and non-production. As a result,
greater savings will be possible on the dewatering system and make the implementation
thereof more viable. See Table 7 for implementation costs of such a strategy implemented on
a gold mine.
Secondary cooling system optimisation
The primary ventilation distribution system delivers air to areas that need it rather than
ventilating the entire mine whether or not it is required. An energy-efficient distribution system
supplies the minimum quantity of ventilation air that is required, directly to each area
depending on the activity. This is somewhat impractical pertaining to the complex tunnel
networks and distances where ventilation is required. Mining also continuously advance further
from the ventilation shaft causing the ventilation sources to be reallocated and non-working
areas sealed off (Karsten & Mackay, 2012).
CC can then be used to provide secondary cooling near the stopes where primary ventilation
air cannot reach. The advantage of CC is that it can be moved relatively easy to keep up with
mining advances. The problem with using secondary cooling is the increase in chilled service
water required underground and the increasing water quantities to be pumped to surface.
Pertaining to that the volume of water that passes through CC varies according to the supply
line pressure, which in effect varies throughout the day, causing further water wastage.
Another fact to consider is the chilled water temperature increases that can be experienced as
soon as it leaves the chillers on surface and flows to the working areas. These temperature
increases are caused by a series of factors listed below (Rawlins, 2007):
Frictional losses,
flow rates through pipes,
increased geothermal gradient due to VRTs,
fluid compression and
specification and quality of pipe insulation.

Chapter 2: Optimising platinum mine refrigeration and cooling systems
Optimising the refrigeration and cooling system of a platinum mine 56
The effects of the increased water temperatures reaching the CC must therefore be taken into
consideration. This can be achieved by controlling the water flow through the CC that will
ensure optimal cooling performance and minimal water wastage. Mines experience fluctuating
pressures in the chilled water distribution piping underground and as a result, water flow rates
increase/decrease accordingly, as shown in Figure 30. When the water flow through the CC is
controlled, the cooling performance thereof will be maintained and the water wastage will be
kept to a minimum. Reducing the energy consumption of the refrigeration system and
dewatering system as result.
The simplest strategy to reduce unnecessary flow through CCs is by implementing either flow
restricting or flow regulating valves. The objective, therefore, exists to regulate the chilled
water flow entering the CC irrespective of the change in supply pressure and flow.
The problem with optimising the water flow through CC is that there usually is very little
infrastructure available at the point of application. Further, CC is moved regularly to keep up
with mining advances. The required infrastructure will need to allow for valve control that
needs to be mobile. Alternatively, a mechanical flow regulating valve can be installed that
requires no extra instrumentation. The obvious solution will be to use mechanical valves
instead, to keep the installation simple and the costs to a minimum.
Mineworkers regularly tamper with essential mining equipment to delay production. It is
important to provide a simple and cost effective solution that will be tamperproof and robust
enough to withstand the harsh mining conditions (Marè et al., 2014).
There are a few mechanical valves available to optimise the water usage of CC that will
comply with these identified constraints. Two of these identified valves are explained in the
following sub-sections.
A. Maric constant flow rate valve
Each CC has a designed water flow rate that allow for optimal cooling performance. When the
flow rate deviates from the design it can result in unnecessary water dumping or increased
outlet air temperatures. The mechanical valve shown in Figure 32 ensures a constant water
flow rate is maintained, regardless of upstream pressure differentials. The valve utilises a
flexible rubber control ring with an orifice, this orifice diameter open and closes
correspondingly to the pressure differential, to maintain the pre-set flow rate (Maric Flow
Control, 2011).

Chapter 2: Optimising platinum mine refrigeration and cooling systems
Optimising the refrigeration and cooling system of a platinum mine 57
This valve installation as shown in Figure 33 will make it possible to reduce the water wastage
through the CC, by maintaining a constant flow rate at all times regardless of the upstream
pressure inconsistencies.
Figure 32: Maric 50mm x 3 orifice screwed brass constant water flow control valves adopted from (Maric Flow
Control, 2011).
Cold air out
From shaft
station
To stoping
area
Main cold
water supply
Maric constant
flow mechanical
valve
Fan
Compact heat exchanger
Warm air in
CC water
supply
Warm water
dumped into
trenches
Figure 33: Schematic diagram of Maric cooling car valve assembly.
Figure 34 illustrates the typical range and accuracy of the Maric constant flow valve. It is
shown that the flow is maintained at the rated flow for a wide range of pressure differentials.
Theoretically, with the Maric valve fitted, regardless of upstream pressure deviations, the water
flow through the CC will remain relative constant. This of course causes the volume of water
dumped into the trenches to remain relatively constant throughout. Whereas before, the flow

Chapter 2: Optimising platinum mine refrigeration and cooling systems
Optimising the refrigeration and cooling system of a platinum mine 58
will increase in relation to the pressure increase as shown by Figure 30. Therefore, minimising
the water wastage caused by pressures increases.
Figure 34: Typical performance of valve irrespective of body size or flow rate (Maric Flow Control, 2011).
Marè et al. (2014) performed tests on a gold mines’ CC with a flow regulating and flow-
restricting valve. It was established that the flow-regulating valve was the best-fit valve to use
due to its ability to sustain a constant water flow. This regulating valve was a Maric constant
flow rate valve as shown in Figure 32.
An electrical saving of 37.5 kW was achieved with the flow-regulating valve per application.
This includes the savings due to less pumping and the chiller energy saving (Marè et al.,
2014). The summary of the cost savings is summarised in Table 7.
B. HPE constant flow rate valve
The mechanical HPE CC valve system ensures a constant flow through a CC irrespective of
the flow demand used for downstream operations. The valve reduces water wastage by only
dumping water to mining trenches when the downstream demands from operations are less
than the flow required through the CC. See Appendix B for a further detailed explanation, a
summary explanation will follow here.
If the demand from downstream operations is more than the CC flow requirement, the water
will be directed back into the main service water supply line, assuming that the pressure is
within the design range. The valve configuration and CC valve assembly is shown in Figure 35
with a schematic thereof shown in Figure 36.
60
70
80
90
100
110
120
130
140
50 100 150 200 250 300 350 400 450 500 550 600 650 700 750 800 850 900 950 1000 1050
Flo
w r
ate
[%
](a
s a
perc
enta
ge o
f ra
ted f
low
)
Pressure differential [kPa](across valve)
Measured flow Rated flow

Chapter 2: Optimising platinum mine refrigeration and cooling systems
Optimising the refrigeration and cooling system of a platinum mine 59
Figure 35: HPE constant water flow control valve (Hydro Power Equipment (Pty) Ltd, 2012).
Cold air out
From shaft
station
To stoping areaMain chill
water supply
Fan
Compact heat exchanger
Warm air in
CC water
supply
Warm water
dumped into
trenches
Mechanical
3-way valve
Figure 36: Schematic diagram of HPE cooling car valve assembly.
Even though both HPE and Maric valves ensures a constant flow rate through the CC, the
HPE have the advantage of returning used water to the service water line. Thus, the water
wastage expected from the HPE application show the potential to be less than that of the
Maric valve.
The disadvantage of the HPE valve is the fact that the working pressure of the valve must be
pre-set by the manufacturer to that of where it will be implemented, as the valve operation my
deviate from the design. The valve is installed into the main water supply line, which causes a
substantial pressure drop over the valve. It is essential for that reason to keep the pressure

Chapter 2: Optimising platinum mine refrigeration and cooling systems
Optimising the refrigeration and cooling system of a platinum mine 60
drop into consideration if there is more than one CC installed on the same main water line. It
should be verified that the pressure loses are acceptable before application. The Maric valve
should rather be considered when the pressure loses are significant.
Feasibility of chilled water demand management
Table 7 below summarises the savings achieved from implementing the different identified
chilled water DSM strategies or equipment. The savings achieved is updated with 2014/2015
Eskom Megaflex electricity tariff structure. The pressure control and Maric valve figures
illustrated in Table 7 were obtained from Vosloo et al. (2010) and Marè et al. (2014) finding’s.
The theoretical calculation made to determine the HPE valve savings are shown in Appendix
B.
Equipment costs for pressure the control strategy implemented by Vosloo et al (2010) includes
all project costs like PLC programming, supply and installation of all equipment,
commissioning and labour costs. The cost for the pressure control strategy includes the
control of numerous mining levels of the case study gold mine. Whereas the equipment costs
for the Maric and HPE valve only include the supply for a single valve respectively.
Table 7: Chilled water demand savings with respective strategies (2014/2015 electricity tariff).
Strategy / Equipment
Water saving [kl/day]
Average power saving [kW/day]
Annual cost saving [R]
Equipment cost [R]
PBP [Months]
Pressure control 1300 449 2 061 687 2 249 863 13
Maric valve 237 37.5 172 178 4 784 0.4
HPE valve (theoretical)
423 55.6 255 289 40 040 1.9
With the focus of the study on optimising the surface refrigeration system and budget
constraints, it is impossible to implement the variable flow control strategy with the
underground water pressure control strategy. The focus therefore placed on the management
of the CC water flow with the respective valves.
Even though the Maric valve shows the shortest PBP, it will be more sensible to implement the
HPE valve if one considers the savings achievable over a longer period. For that reason, it
was decided to install the HPE valve system on the case study platinum mine’s four CCs.

Chapter 2: Optimising platinum mine refrigeration and cooling systems
Optimising the refrigeration and cooling system of a platinum mine 61
2.5. OBSTACLES FOR IMPLEMENTING EE TECHNOLOGIES ON MINES
The significant awareness of safety around the underground environmental conditions in
underground mines caused it to become one of the biggest concerns for the mining industry.
When alterations are suggested to the cooling and refrigeration system of most mines, they
are very careful and in some cases, these systems are seen as inflexible (Calitz, 2006).
Research has shown that not many mines want to install DSM projects because of the
following reasons (Calitz, 2006):
Their mind-set is that they know how to run their equipment best.
Resistance to change, everything is going on very well; there can be no improvement.
Lack of capital to install equipment that is more efficient.
Uncertainty regarding the future, reluctant to commit recourses for long-term projects,
investors requires payback periods in months rather than years.
Failure of old DSM projects – making mines reluctant to implement new projects.
Mining personnel not showing the necessary interest and enthusiasm to maintain projects
and insure for suitable practical implementations.
To convince mines to implement DSM projects on their cooling system requires detailed
research, investigation and simulations. It is very important to understand mining equipment
operations thoroughly and insure that all system constraint and variable are considered in the
simulation model.
In some cases, mines request further detailed investigation on essential equipment as they are
sceptic about the imposed technology, equipment and control strategy. Thorough
investigations can improve the accuracy of the simulated results and resolve in accurate and
practical cost saving estimations (Holman et al., 2013). At the end, this will ensure for a
respectable practical project for the mine.

Chapter 2: Optimising platinum mine refrigeration and cooling systems
Optimising the refrigeration and cooling system of a platinum mine 62
2.6. REQUIRED ALTERATIONS
The refrigeration and cooling system configurations on mines is site specific and the existing
infrastructure differs accordingly. Each optimisation strategy will require different alterations
and equipment for successful implementation as a result. Again, placing the focus on how
important the investigation is to make certain on the required infrastructure, which will lead to
an accurate project implementation cost analysis and minimise project implementation delays.
This will improve the accuracy on the project cost estimation and therefore, the payback period
after implementation.
To implement Eskom EEDSM projects relevant data, like power and ambient temperature,
must be made available to measure the actual project savings achieved after implementation.
It will be desirable that all relevant data be logged onto servers that can be accessed remotely.
It is essential to automate equipment so that one can be view and control the system remotely
from a centralised point. Mines usually make use of a PLC that controls all equipment
automatically and SCADA systems that allow human interface with field equipment. The
mining equipment that controls equipment make use of a complex network of fibre, profibus,
modbus or a combination thereof for communicating with the PLC.
When adding equipment to the refrigeration and cooling system, it is mandatory to ad this
equipment to the PLC and SCADA interface. Changes to the infrastructure and communication
networks are required to make DSM possible.
Each refrigeration and cooling system has its own distinct control strategy to deliver mine
specific constraints and requirements. When developing a new separate overhead control
strategy it is essential to accommodate the complex system efficiently. This will ensure
reliability and optimal system control while adhering to the constraint while ensuring that DSM
takes place automatically.
It is mandatory to integrate new control strategies effectively to ensure control from the same
central point as the mine SCADA system. This will enable the collective energy management
of the new proposed optimisation strategy of the refrigeration and cooling system. To achieve
effective and automatic control a real-time energy management system (EMS) will be required.
Du Plessis et al. (2013) developed such a real-time energy management system with the
financial support of HVAC International (Pty) Ltd. (2012) to effectively implement, control,
monitor and report savings of the refrigeration and cooling auxiliaries.

Chapter 2: Optimising platinum mine refrigeration and cooling systems
Optimising the refrigeration and cooling system of a platinum mine 63
2.7. CONCLUSION
A need has been identified to reduce the electricity consumption on the large refrigeration and
cooling systems as found on platinum mines. The large electricity users within the refrigeration
and cooling system are identified so that the focus can be placed on identified equipment
when proposing an optimisation strategy.
Through the literature review, a better understanding is brought forward so that the relevant
system control operation and design can be identified. With this knowledge, the constraints
and considerations can be analysed in more detail to be able to propose a better system
optimising solution at the end.
The variable-flow strategy resulted in an average daily power saving of 1 540 kW for
respective gold mines. In other words, all of the refrigeration systems electrical energy
consumption was reduced by 35% on average. This shows that the variable-flow strategy
developed and energy management system can effectively be used for a variety of cooling
systems to realise cost-effective energy savings. This was achieved without affecting the mine
service deliveries.
The variable-flow strategy, therefore, is identified as the most effective optimisation strategy to
improve platinum mines refrigeration and cooling systems. The VSDs used to vary the pump
flows allow for automatic control from the current mine PLC and SCADA system that can
improve the proposed system redundancy as well.
The identified secondary cooling system contributing to the cooling load experienced by the
refrigeration system. A mechanical valve identified that shows the possibility of reducing the
water wastage of CC. Two types of valves were considered to implement on mine CC cars.
The HPE 3-way valve theoretically shows to have improved water wastage reducing
capabilities. This can reduce chiller and dewatering system electricity loads. Therefore, the
HPE valve system will be implemented on the case study.

CHAPTER 3. OPTIMISATION MODEL DEVELOPMENT
Setup and development of an optimal refrigeration and cooling system control strategy.

Chapter 3: Optimisation model development
Optimising the refrigeration and cooling system of a platinum mine
65
3.1. INTRODUCTION
The information provided in the literature provides a background understanding for the
relevant system components and principles used for operation. This platform improves the
quality of decision making when identifying and proposing optimisation strategies to implement
on the now familiar refrigeration and cooling systems.
It was identified that a variable-flow strategy with the use of VSDs show the most promising
potential to optimise mine refrigeration and cooling systems by controlling pump speeds, with
reduced pump power input as a result. The implementation of VSDs provides an extra benefit
of controlling the required cooling load according to the load demand, resulting in reduced
chiller compressor power.
The benefits of improving the chilled water demand underground provide the potential to
achieve greater electricity savings on multiple mining systems. A mechanical valve was
identified that has the potential to reduce the chilled water wastage on secondary cooling
equipment. This can result in reduced power consumption on both the dewatering and
refrigeration systems.
Throughout this chapter, the refrigeration and cooling system of a case study platinum mine
will be investigated and analysed. This will provide a reference point for the power
consumption and will highlight points were the system may have potential for optimisation.
Thereafter a solution will be proposed and simulated to quantify the feasibility of the strategy in
terms of project payback periods.

Chapter 3: Optimisation model development
Optimising the refrigeration and cooling system of a platinum mine
66
3.2. ELECTRICTY LOAD WITH BASELINES AS REFERANCE
3.2.1. Overview
The uncertainty about the effectiveness of industrial EE projects can be improved with the
accurate measurement of data and energy savings, which will improve the estimation of the
expected savings more accurately. Therefore, standard protocols have been developed to
quantify energy savings with accurate results obtained and verified to deliver successful
strategy implementation savings (ASHRAE, 2002; US Department of Energy, 1996). In SA
Measurement and Verification (M&V), guidelines for EEDSM projects and programmes are
published by Eskom’s Corporate Services Division Assurance and Forensic Department to
verify the energy saving results (Den Heijer, 2009).
Independent M&V teams are contracted by Eskom to ensure that energy savings realised with
DSM projects are measured and verified according to the mentioned standards (Xia & Zhang,
2012). This was also applied for the proposed optimisation strategy on Mine A, the case study
platinum mine. The independent M&V team was fully responsible for auditing the refrigeration
system and all measured data before and after implementation. Including the development
and verification of all electrical and system data used in this study (Eskom Corporate Service
Division, 2013).
3.2.2. Baseline development
To establish a power consumption baseline for the refrigeration system the daily consumption
thereof was measured and recorded. When there is no data available for the power
consumption of the refrigeration system, temporary data recording power meters can be
installed to obtain the power usage. The independent M&V team use this data to develop an
electrical baseline for the strategy. The daily electricity consumption of the total refrigeration
system prior to project implementation is reflected in the baseline shown in Figure 37.
Three summer months (January – March 2012) were used to develop the baseline profile. The
scaling of the baseline that is done according to ambient conditions will compensate for the
exclusion of winter months in the baseline. The verified baseline shown in Figure 37 is
categorised into weekdays, Saturdays and Sundays. The baseline is compiled in this manner
to accommodate the different tariff structures of Eskom’s Megaflex tariff structure (Eskom,
2013).

Chapter 3: Optimisation model development
Optimising the refrigeration and cooling system of a platinum mine
67
Figure 37: Mine A surface refrigeration and cooling system total average electricity baselines.
The lower chilled water demands experienced over weekends are due to mining production
decreases experienced, which contributes to a lower measured Saturday and Sunday
baseline.
The Sunday baseline is noticeably lower than the weekday baseline, especially in the morning
hours (6:00 – 12:00 am). The refrigeration system is usually switched off during these hours to
do regular maintenance. The morning hours is mostly used for maintenance as colder ambient
temperatures are experienced during these hours. The refrigeration system is started around
13:00 by mine personnel to allow the system to recover, before production commences again
on Monday. This mostly takes place on off-weekends, usually at the end of each month.
Data displayed in Appendix A, Figure 66, along with the calibration certificate shown in Figure
68, indicates the accuracy of the power (kW) data obtained for the refrigeration system before
and after project implementation. All other data was obtained from the on-site SCADA system.
3.2.3. Baseline scaling
Measuring and comparing energy consumption of pre- and post-implementation periods is a
method to quantify the energy savings achieved on the system. However, cooling system
electrical energy usage is typically found to be a function of ambient weather data and/or
production variables. These variables are prone to changes frequently observed between pre-
and post-implementations periods (Du Plessis, 2013). It is, therefore, important that these
changes be accounted for, to ensure accurate reported savings after implementation (Kissock
& Eger, 2008).
0
1 000
2 000
3 000
4 000
5 000
6 000
7 000
0 1 2 3 4 5 6 7 8 9 10 11 12 13 14 15 16 17 18 19 20 21 22 23
Tota
l pow
er
pro
file
s [
kW
]
Time of day [hour]
Weekday Saturday Sunday

Chapter 3: Optimisation model development
Optimising the refrigeration and cooling system of a platinum mine
68
Regression modelling is used in principle to measure savings included in all verification
standards (US Department of Energy, 1996; ASHRAE, 2002; Den Heijer, 2009). Pre-
implementation data is typically used to develop a weather and production-dependent
regression model. This model presents an accurate correlation between the system electrical
energy usages, weather and/or production verified data. This model can then be used to
calculate the daily energy consumption of the system from the weather and production data
daily (Du Plessis, 2013).
The model is then used post-implementation to calculate what the daily system energy
consumption would have been, had there been no system alteration. The reflecting measured
baseline data points are then scaled in relation to the calculated regression model. The
average scaled baseline is equal to the average calculated by the model. If there are no major
changes in the system, the daily energy savings can be calculated by subtracting the scaled
baseline with the post-implementation power profile (Du Plessis et al., 2013).
𝑃𝑠𝑎𝑣𝑖𝑛𝑔𝑠 = 𝑃𝑠𝑐𝑎𝑙𝑒𝑑 𝑏𝑎𝑠𝑒𝑙𝑖𝑛𝑒 − 𝑃𝑝𝑜𝑠𝑡 ̵𝑖𝑚𝑝𝑙𝑒𝑚𝑒𝑛𝑡𝑎𝑡𝑖𝑜𝑛 (3.1)
The case study mine, Mine A, has a variable temperature chiller installation, where the power
consumption of the refrigeration system will mainly depend on the daily ambient temperatures.
This was justified with the regression model, where an accurate model, which correlates
between the daily average electrical power usage and average ambient temperature, was
used. The regression model developed was verified by the contracted M&V team and
subsequently approved by Eskom (Eskom Corporate Service Division, 2013)
The equation, based on the daily data obtained during the baseline period (January 2012 to
March 2012), was averaged for each hour of the day. All weekend, public holidays and
condonable (data loss) days were excluded from the data set. The independent M&V team
was responsible for verifying all data used to measure the savings achieved and performance
is correct and accurate. The equation that was delivered is as follow:
𝑦 = 142.49𝑥 + 2485.5 (3.2)
𝑦 = Calculated daily average electricity consumption of the system [kWh/day]
𝑥 = Measured daily average ambient DB temperature [°C]
Equation 3.2 is used to calculate the scaled power baseline using the daily average weather
data. Equation 3.1 is then used to calculate the true daily energy saving. The importance of
comparing equivalent pre- and post-implementation data is emphasised from the energy
measuring standards. Data, therefore, is regarded as condonable when mine production
shutdowns and data loss occurs.

Chapter 3: Optimisation model development
Optimising the refrigeration and cooling system of a platinum mine
69
3.3. REFRIGERATION AND COOLING SYSTEM CONSTRAINTS AND VARIABLES
3.3.1. Refrigeration and cooling system background
Mine A, a platinum mine situated in the BIC with a surface refrigeration system and four
underground CC, is to be investigated. The mine was selected as a case study due to its large
contribution to PGM operations in SA. With the high mining production, increased cooling
loads are experienced which results in high cooling demands (Mudd, 2012).
Figure 38 illustrates the surface refrigeration and cooling system components with a simplified
connecting piping network layout.
Chiller 1
Bulk air cooler stage 2
Chiller 2 Chiller 3
Bulk air cooler stage 1
Ambient air in
Cold air for underground ventilation
Hot dam
Hot dam
Treatment
dam
Pre-cooling tower
Water flow to surface
Condenser dam
Water flow from underground operations
Water flow to underground operations
Water flow from underground
Evaporator pumps
BAC pumps
Condenser pumps
Pre-cooling pumps
Chill dam 1
Chill dam overflow return pipe
T
T
TL
L T
Pre-cool
TL TL
Chill dam 2
Condenser cooling towers
T
F F F
F
F
PLC
SCADA
FT T
T
L T
W
Evaporator water Condenser water Air flow
Control valve
Non return valve
Manual valve
Fan
Legend
L
T
Level transmitter
Temperature sensor
Water pump Backup
F Flow meter
Installed
W Weather stationCooling car
Coms network
1
1
2
34
56
78
9
Figure 38: Mine A refrigeration system prior to project implementation.

Chapter 3: Optimisation model development
Optimising the refrigeration and cooling system of a platinum mine
70
The general operating conditions of the refrigeration and cooling system are as follows:
1. Hot water is pumped from underground and enters the surface hot dam at a temperature
of 25°C.
2. From the hot dam, the water is pumped through the water treatment system and is stored
in a water treatment dam.
3. From the treatment dam, water is pumped through a pre-cooling tower and is stored in the
pre-cooling sump.
4. From here, the water is gravity-fed through an actuating valve that sustains a pre-set BAC
sump level. The average temperature in the BAC sump is 13°C.
5. The BAC sump water is then pumped at 330 ℓ/s through three fridge plants in series to
provide chilled water at 5°C in the chilled dam.
As explained during the literature review, chillers are connected in series to accommodate
varying water and ambient temperatures. This is achieved by switching chiller machines on or
off to accommodate temperature variances without having an effect on the water supply.
There are bypass valves at the inlet and outlet of the chiller machines, these valves are mainly
used when a chiller is taken offline – to ensure that the water flow to the mine is not
influenced. The combined nominal cooling capacity of the surface refrigeration system is 19
MW with a COP of 4.5 at a condenser water inlet temperature of 25°C and evaporator water
outlet temperature 6°C.
6. From the fridge plants, chilled water flows towards two 3 ML surface chill dams and a two
stage horizontal BAC.
7. A mixture of chilled and BAC sump water is then sprayed through the BAC nozzles with
one first stage pump and two second stage pumps.
8. The water can also flow by means of an actuating valve to the evaporator pump suction
pipe, where it mixes with the pre-cooled water in the BAC sump. This is done to maintain
a constant chiller evaporator water inlet temperature.
9. From the chilled water dams, water is supplied underground by demand for mining
activities. These activities include the operation of four secondary CC to provide
secondary ventilation air.
The surface refrigeration machines, condenser cooling tower, BAC and pre-cooling tower
specifications are displayed in Table 8 to Table 11 respectively.

Chapter 3: Optimisation model development
Optimising the refrigeration and cooling system of a platinum mine
71
Table 8: Mine A surface chiller machine specifications.
Description
Unit
Number of chillers 3 -
Make Howden -
Compressor type Screw -
Compressor motor rating 1 800 kW
Refrigerant Ammonia -
Voltage 11 000 V
Cooling capacity per chiller 6 450 kW
COP 4.5 -
Evaporator outlet temperature 5 °C
Condenser inlet temperature 24.6 °C
Evaporator water flow 350 kg/s
Condenser water flow 440 kg/s
Evaporator pump motor rating 330 kW
Number of evaporator pumps 2 -
Condenser pump motor rating 275 kW
Number of condenser pumps 4 -
Table 9: Mine A surface condenser cooling tower specifications.
Description
Unit
Number of cooling towers 3 -
Water inlet temperature 30 °C
Water outlet temperature 26 °C
Water Flow 440 kg/s
Air inlet WB temperature 22 °C
Number of cooling tower fans 3 -
Condenser fan motor rating 90 kW
Table 10: Mine A surface BAC specifications.
Description
Unit
Number of BACs 1 -
Water inlet temperature 6 °C
Water outlet temperature 13 °C
Water flow 240 kg/s
Air Flow 260 kg/s
Air inlet WB temperature 16 °C
Air outlet WB temperature 12 °C
Number of BAC fans 4 -
BAC fan motor rating 160 kW

Chapter 3: Optimisation model development
Optimising the refrigeration and cooling system of a platinum mine
72
Table 11: Mine A pre-cooling tower specifications.
Description
Unit
Number of cooling towers 1 -
Water inlet temperature 26 °C
Water outlet temperature 20 °C
Water flow 90 kg/s
Air inlet WB temperature 18 °C
Number of pumps 2 -
Pump motor rating 110 kW
3.3.2. Constraints and variables
With each refrigeration and cooling system, relevant constraints exist to deliver mine specific
requirements according to specified system control strategies. When implementing new
control strategies it is essential to understand the functionality, limits and constraints that exist.
This, to ensure the system is not affected negatively in any manner. Therefore, it remains
essential that these fixed constraints be adhered to during and after implementation of new
optimisation strategies.
To ensure that these constraints are adhered to, safety trips are programmed into the system
PLC. A typical built-in safety parameter that protects the chiller evaporators from freezing is
the evaporator water flow. If this flow is lower than the minimum trip value the water in the
evaporative heat exchanger can potentially freeze. Therefore, as a precautionary measure, the
chiller machines will trip automatically if the flow is too low to ensure that this does not occur.
Some of these important parameters listed in Table 12 to Table 14, allow the system and
relevant equipment to function safely within the pre-set operating conditions. These conditions
were set during the system design and installation to prevent permanent damage to
equipment. It is vital that all existing limits are considered when proposing system alterations.
The entire refrigeration and cooling system is fully automated and all relevant equipment can
be controlled from the SCADA system. This is also true for the chiller machines that have built-
in safe start-up and shutdown sequences to ensure the correct procedures are followed
throughout operation. The load control on the chiller machines are also done automatically by
the PLC.
The simplest way to distinguish between parameters that can be altered and constraint that
cannot be changed is by categorising them. Van Greunen (2014) categorised variables
according to controllable and uncontrollable variables. Uncontrollable variables cannot be

Chapter 3: Optimisation model development
Optimising the refrigeration and cooling system of a platinum mine
73
changed as they are set by design limitations. Controllable variables are ones that can be
changed within the pre-set limits.
Table 12 to Table 14 provide the system limits that needs to be taken into account when
implementing variable flow control by means of VSDs. Table 12 shows the three chiller
machines temperature and flow constraint ranges. Any of these constraints can cause the
chiller machine to shutdown/‘trip’, resulting in possible machine damage or production losses.
It is important to take note that there are more constraints (interlocks) built in the PLC that is
not relevant to the variable flow strategy and is controlled by the PLC. Nevertheless, it remains
important to be aware of this as the varying flow can cause chiller ‘trips’ as result of reduced
flow rates.
Table 12: Mine A Chiller controllable water system ranges.
Chiller 1 -3 limits Unit High high
alarm High alarm
Low alarm
Low low alarm
Condenser water dam temperature °C 30 25 11 10
Condenser water flow ℓ/s 450 440 300 280
Evaporator water in temperature °C 25 20 3 1
Evaporator water out temperature °C 15 10 0.7 0.1
Evaporator water flow ℓ/s 380 360 215 200
Table 13 shows the BAC system constraints. The air outlet temperature for the BAC is defined
by the underground ventilation requirements and is one of the refrigeration system
deliverables to ensure safe and productive mining operations underground.
Table 13: Mine A BAC system variable ranges
BAC Limits Unit High high
alarm High alarm
Low alarm
Low low alarm
BAC air outlet temperature °C 15 12 4 3
BAC dam level (% full) % 98 95 55 45
BAC dam water temperature °C 30 25 5 3
The second deliverable from the refrigeration system is the chilled water that needs to be
supplied at a set temperature range as shown in Table 14. It is important to maintain dam
levels within the limits to ensure sustainable chilled water supply for underground mining
operations to prevent mining operational loses.
Table 14: Mine A chill dam system variable ranges
Chill Dam Limits Unit High high
alarm High alarm
Low alarm
Low low alarm
Chill dam temperature °C 30 25 3 2
Chill dam level (% full) % 100 95 60 50

Chapter 3: Optimisation model development
Optimising the refrigeration and cooling system of a platinum mine
74
Variables that cannot be controlled are the ambient air temperature, underground water
requirements and hot dam temperatures. Even though the hot dam temperatures can be
reduced with the pre-cooling tower, the temperature drop achieved is still dependent on the
ambient air conditions.

Chapter 3: Optimisation model development
Optimising the refrigeration and cooling system of a platinum mine
75
3.4. OPTIMISED SOLUTION ON IDENTIFIED SYSTEM INEFFICIENCIES
3.4.1. Overview
It is important when proposing alterations to the refrigeration system that the service delivery
of the system is not affected negatively. It should rather be expected that the proposed
optimisation strategy improve the service delivery and efficiency thereof.
From the literature study, it was found that the variable flow control model was identified as the
most effective optimisation strategy to implement on a gold mine cooling system. Actual
results are presented to prove the accuracy and effectiveness thereof in Chapter 2. Now the
feasibility of adopting this model to implement it on platinum mines’ refrigeration and cooling
systems will be investigated. The case study platinum mine (Mine A) is identified as the best fit
application to prove the effectiveness and adaptability of the variable flow strategy developed
by Du Plessis et al. (2013).
Mine A’s refrigeration and cooling system control will be investigated to identify the possibility
of optimising the entire system. This will be achieved by incorporating a new variable flow
control strategy with the existing system. The first step was to investigate the system control
and identify control inefficiencies.
3.4.2. Present system inefficiencies
Pre-cooling water flow
Analysing the current refrigeration and cooling system control will provide insight to inefficient
system control and equipment that will lead to possible suggested improvements. The
refrigeration and cooling system automated control is programmed into the PLC controller to
allow reliable system control. Even though safety measures were taken, the general lack of
instrumentation and network link maintenance resulted in some controls to become redundant.
The WB temperature used for the pre-cooling tower control is calculated from the weather
station installed on-site. The PLC uses the DB temperature and Relative Humidity (RH)
measured by the weather station to calculate the respective WB temperature. This process
failed due to communication problems experienced between the weather station and PLC. As
a result, the technician forced a constant value of 14°C into the PLC. The problem with this is
that the pre-cooling tower fan and pump is controlled according to this WB temperature.
When the hot water temperature is higher than the ambient WB temperatures the pump and
fan will start to maintain a pre-set pre-cooled sump level. Otherwise, when the hot water

Chapter 3: Optimisation model development
Optimising the refrigeration and cooling system of a platinum mine
76
temperature is lower than the ambient WB temperature the water will bypass directly into the
pre-cool sump. The problem with the forced value is the water will be heated instead of cooled
when the measured ambient WB temperature is higher than the water temperature. This will
result in unnecessary chiller machine power consumption due to the elevated evaporator inlet
temperatures. Therefore, the chiller compressor will have to work harder to achieve the same
chilled water temperature.
Evaporator water flow
Figure 39 illustrates the evaporator pumps and make-up water pipe configuration and layout.
The make-up water pipe is not shown as it is inside the BAC spray chamber. The make-up
water flow to the BAC sump is controlled by means of a pneumatic automatic actuating valve
to maintain a BAC sump level of 98%.
Figure 39: Mine A evaporator pump pipe configuration and design at BAC.
Consequently, hot pre-cool water is dumped regularly into the BAC sump close to the
evaporator pumps suction pipe. This causes the BAC sump temperature to rise in
correspondence to the valve control. As a result, the chiller machines experience evaporator
water temperature fluctuations, as shown in Figure 40. In an attempt to reduce this effect,
chilled water is directed towards the evaporator pump suction pipe by means of a back-pass
pneumatic automatic actuating valve.
Figure 40 and Figure 41 represents a single day’s data (15:00 –18:00) acquired in November
2013 with 2 minute intervals. For this day, Chiller 1 and Chiller 3 were in operation. Chiller 1
Evaporator pumps
Chill dam over flow
Back-pass chill water to evaporator pump inlet
Evaporator water to chillers

Chapter 3: Optimisation model development
Optimising the refrigeration and cooling system of a platinum mine
77
inlet and Chiller 1 and Chiller 3’s outlet temperatures along with the BAC air outlet temperature
is illustrated graphically in Figure 40. It is reasonable to conclude that the control of the
actuating valve controlling the chilled water flow towards the evaporator pump suction, no
longer works or the control thereof is inefficient and inadequate.
Figure 40: Inefficient evaporator water temperature control of Mine A.
The effect of the intermittent opening and closing of the automatic actuating valve controlling
the warmer make-up flow into the BAC sump can be seen clearly. A varying chiller evaporator
outlet temperature of about 2°C is experienced throughout. If the valve opens, the evaporator
temperature increases as a result and vice-versa for when the valve closes again. The ripple
effect of this can be seen through to the BAC air outlet temperature as well, exemplifying the
negative effect of this inefficient control.
This is definitely not ideal for the chiller machines’ load control. This causes the sliding valve
on the compressor to open and close constantly to compensate for the varying cooling load
and as a result, the power usage of the compressor also fluctuates accordingly. It is shown
that the total power usage fluctuate up to 600 kW for the illustrated time. The varying power
load of the compressors can be seen on the total refrigeration system power consumption as
shown in Figure 41.
2
4
6
8
10
12
14
16
Tem
pera
ture
[°C
]
Time of day [hour]
BAC air outlet Chiller 1 inlet Chiller 1 outlet Chiller 3 outlet

Chapter 3: Optimisation model development
Optimising the refrigeration and cooling system of a platinum mine
78
Figure 41: Refrigeration system total power consumption.
Further, the chillers are installed in series to accommodate varying cooling loads throughout
and to maintain a constant water supply by doing so. Mine A, in fact experiences varying water
flow requirements as well. Secondary cooling is mostly performed during summer months and
not the winter months on Mine A. Secondary mine cooling is mostly achieved by four CC
installed underground. As a result, the varying cooling load experienced on the chillers is a
combining effect of the ambient temperature changes and chilled water requirements
experienced.
The evaporator pumps force water through the chillers at a constant water flow rate throughout
the year and cannot be adjusted for varying chilled water requirements. The only control that
exists in this system to accommodate the decreasing cooling load is to reduce the amount of
active chillers. Mostly three chillers are used in the summer months and two chillers during the
winter months to sustain the system cooling requirements. Therefore, the colder winter months
are used to perform yearly maintenance.
The chill dams overflow occasionally as a result of the constant evaporator pump flow rate and
decreased underground chilled water consumption. The chill dam water overflows and returns
to the BAC sump and is then recirculated through the chillers, resulting in unnecessary cooling
loads on the chillers. Figure 42 show the chill dam overflow and supply pipe network. It,
therefore, is suggested that control should be installed to monitor and control this more
efficiently.
There are no observed mine practises to throttle the evaporator flow to reduce the recycling of
chilled water from the chill dams back to the BAC sump. This presents the most probable
4.6
4.7
4.8
4.9
5
5.1
5.2
5.3
5.4
Pow
er
[MW
]
Time of day [hour]
Total refrigeration system

Chapter 3: Optimisation model development
Optimising the refrigeration and cooling system of a platinum mine
79
energy saving opportunity on the system. As both the evaporator pump and chillers present
the opportunity to reduce their power consumption by the reduced evaporator flow.
Figure 42: Mine A chill dam water supply and overflow pipe network.
Condenser water flow
The heat generated in the cooling proses of the chillers is dissipated to the atmosphere by
means of the condenser water circuit. The condenser water circuit entails condenser pumps
that force water at a constant flow rate through the chiller’s condenser heat exchanger, where
after the water is forced through the spray nozzles of the condenser cooling tower. The
amount of heat the water gains (difference between the condenser in and outlet temperatures)
when flowing through the condenser depends on the cooling load the chillers experience.
When high cooling loads are experienced, the water temperature difference will increase
accordingly, resulting in the cooling towers to dissipate more heat. This is pertaining to that the
cooling towers perform according to design performance to supply water at the required chiller
condenser inlet temperature. With increased average condenser temperature, the chiller COP
can decrease since higher condenser refrigerant temperatures are required (Du Plessis et al.,
2013).
The theoretical heat exchange through the condenser is given by Equation 3.3 (Borgnakke &
Sonntag, 2009).
Chill dam overflow
Chill dam water supply
Chilled water from chillers Chilled water to BAC
Over flow to BAC sump

Chapter 3: Optimisation model development
Optimising the refrigeration and cooling system of a platinum mine
80
�̇�𝑐 = �̇�𝐶𝑝𝑤(𝑇𝑤𝑜 − 𝑇𝑤𝑖) (3.3)
where,
�̇�𝑐 = Theoretical heat exchange in the condenser [kJ]
𝑚 ̇ = Mass flow of the water through the condenser [kg/s]
𝐶𝑝𝑤 = Specific heat coefficient of water [kJ/kg.K]
𝑇𝑤𝑜 = Condenser water outlet temperature [K]
𝑇𝑤𝑖 = Condenser water inlet temperature [K]
From Equation 3.3 it can be seen that if the mass flow is kept constant at the design point, but
the thermal load is lower than the design, the temperature rise in the condenser water will also
be lower than designed for. With low average condenser temperature, the chiller COP can
improve since it lowers the condenser refrigerant pressure required (Du Plessis, 2013).
The potential to save pumping energy by reducing the flow according to the temperature rise
design is apparent. This is of particular interest since it is shown in the literature review that
the COP of the chiller is not affected significantly if at all, when implementing variable flow on
both the condenser and evaporator circuit of the chiller simultaneously (Du Plessis, 2013).
BAC water and air flow
The data shown in Figure 43 is average hourly data for one summer month (November 2013)
and one winter month (July 2013). Mine A requires the BAC air outlet temperature not to
exceed 10°C throughout the year. As illustrated by Figure 43 this is not always achieved
during the summer months (September – April) as the temperature could only be maintained
at 12°C.
This proves that the chillers are not cooling the water enough to achieve the desired BAC
outlet temperature of 10°C during the summer. This can be a result of poor chiller performance
due to the lack of maintenance. These factors can cause the equipment’s performance to
deteriorate with time (Holman et al., 2013). Therefore, it is required that regular maintenance is
performed to clear all sediment build-up within the equipment.
Alternatively, this can be a result of outdated control strategies that are used with
underperforming equipment, which are no longer performing according to design
specifications. It is apparent to update the system control accordingly to achieve the required
design outputs like chill dam and BAC outlet temperatures.

Chapter 3: Optimisation model development
Optimising the refrigeration and cooling system of a platinum mine
81
Figure 43: Mine A average BAC sump and air temperatures for winter (July 2013) and summer (November 2013).
In the winter season (May – August) the pre-determined BAC air outlet temperature is
achieved. Further, it is shown that the air is over-cooled due to the reduced ambient
temperatures experienced during winter months. This over cooling suggests that the spray
water flow through the BAC can be reduced to lower the cooling achieved by the BAC. This
will resolve in pump savings if the flow is reduced by means of VSDs. The colder BAC air
outlet temperatures experienced late nights and early mornings suggest there is daily potential
for BAC water flow control.
It is important to notice that the BAC sump water temperature and air outlet temperature have
a correlation between them throughout operation. This is due to the first and second stage
BAC spray pumps that extract water from the sump. It is not illustrated in Figure 38, but the
first stage BAC pump extracts a mixture of chilled water and BAC sump water as shown in
Figure 44. Therefore, when the sump temperature is reduced, more heat extraction can take
place between the spray water and air, due to the increased delta temperature. As a result, the
air temperature can be reduced more effectively or the pump flow can be reduced accordingly.
It is evident when more pre-cooled water is dumped into the BAC sump, the BAC sump water
temperature will increase. Ultimately, the BAC air outlet will increase in correspondence
thereto. High evaporator flow rates will cause the pre-cool water flow to increase to maintain
the BAC sump level, this if the chill dams are not overflowing. This will in affect speed-up the
rate at which the BAC air temperature will increase. This is definably not favourable during the
warmer hours of the day.
2
4
6
8
10
12
14
0 1 2 3 4 5 6 7 8 9 10 11 12 13 14 15 16 17 18 19 20 21 22 23
Tem
pre
atu
re [°C
]
Time of day [hour]
BAC summer average air outlet BAC summer sump water
BAC winter average air outlet BAC winter sump water
Desired air outlet
Over cooling
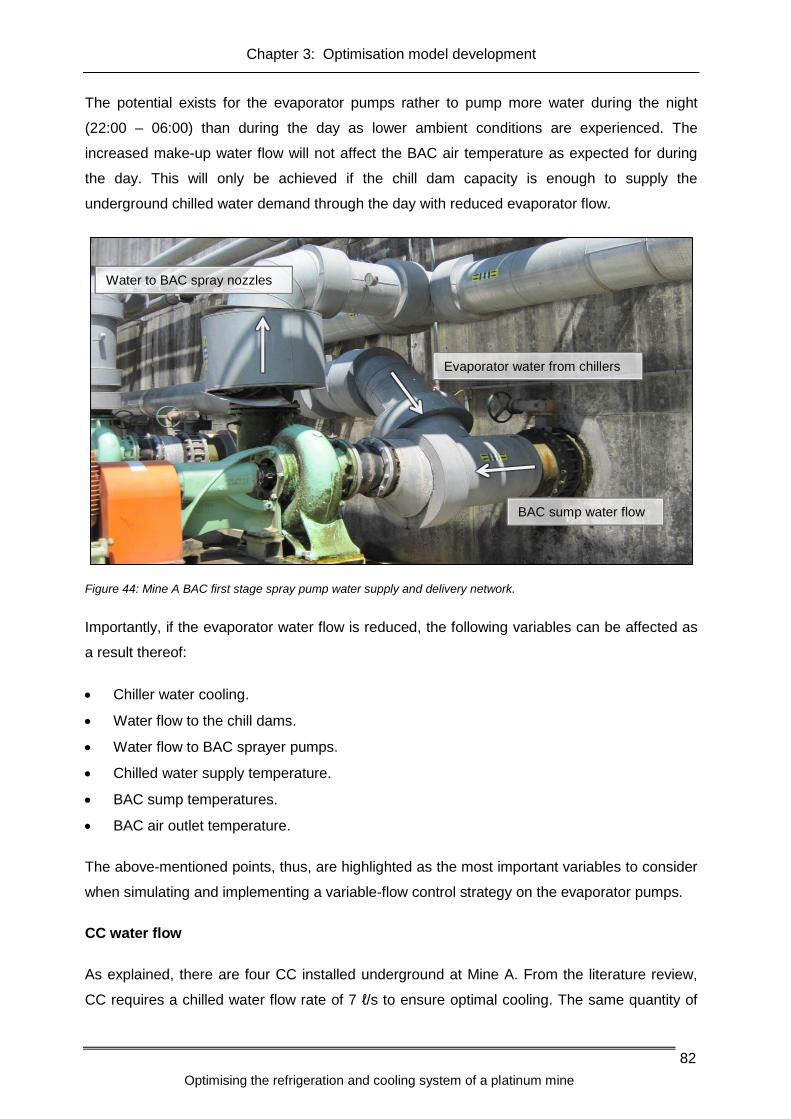
Chapter 3: Optimisation model development
Optimising the refrigeration and cooling system of a platinum mine
82
The potential exists for the evaporator pumps rather to pump more water during the night
(22:00 – 06:00) than during the day as lower ambient conditions are experienced. The
increased make-up water flow will not affect the BAC air temperature as expected for during
the day. This will only be achieved if the chill dam capacity is enough to supply the
underground chilled water demand through the day with reduced evaporator flow.
Figure 44: Mine A BAC first stage spray pump water supply and delivery network.
Importantly, if the evaporator water flow is reduced, the following variables can be affected as
a result thereof:
Chiller water cooling.
Water flow to the chill dams.
Water flow to BAC sprayer pumps.
Chilled water supply temperature.
BAC sump temperatures.
BAC air outlet temperature.
The above-mentioned points, thus, are highlighted as the most important variables to consider
when simulating and implementing a variable-flow control strategy on the evaporator pumps.
CC water flow
As explained, there are four CC installed underground at Mine A. From the literature review,
CC requires a chilled water flow rate of 7 ℓ/s to ensure optimal cooling. The same quantity of
Evaporator water from chillers
BAC sump water flow
Water to BAC spray nozzles

Chapter 3: Optimisation model development
Optimising the refrigeration and cooling system of a platinum mine
83
water that flows through the CC is dumped into the mining trenches. This result in constant
water wastage of about 7 ℓ/s daily for each CC installed. From the literature review, there are
mechanical valves that show the potential to reduce the amount of water wasted by a CC.
3.4.3. Proposed optimisation strategy
On Mine A’s refrigeration and cooling system potential for optimisation were identified. It was
concluded that a need exists to optimise the present control inefficiencies identified earlier on
the system, to improve the power consumption thereof. Considering the cooling load
fluctuations experienced by the refrigeration system and the fact that the controls to
accommodate these fluctuations are non-existing or neglected, there exists considerable
potential for optimising the present control strategies to realise electrical energy savings.
The daily varying evaporator inlet water and ambient weather temperatures cause the chiller
machines operation to deviate from the desired load conditions, resulting in reduced COP
values. Present chiller control only consists of switching a chiller machine in/out of operation
when cooling load deviances are experienced. Therefore, the time before a chiller is taken out
of operation, the chance of chillers not operating at desired loading conditions are eminent,
which result in reduced chiller COP values. This reduced cooling load conditions can be
controlled more effectively with the proposed variable flow strategy (Du Plessis et al., 2012).
It is shown that due to outdated control strategies and deteriorating equipment performances
the system was unable to achieve design chilled water and BAC air outlet temperatures.
Further, the unnecessary recirculation of chilled water due to the lack of water flow control
imposes the need to implement an optimised control strategy, to address this inefficient
control. VSDs are widely used in the industry to control the water flow of cooling equipment
(Van Greunen, 2014). VSDs regulate the speed of electrical motors driving pumps or fans by
controlling the frequency of the voltage delivered to the motors. In addition to the equipment
control capability, a measureable electrical saving is achieved with the reduced motor speeds.
CC used underground dump chilled water constantly into mine water trenches, causing
ineffective utilisation of chilled water. As a result, additional chilled water is required from the
surface refrigeration system. This additional water then has to be pumped back to surface.
Therefore, the relevant dewatering equipment consumes unnecessary additional electrical
power.
As discussed in the literature, mechanical valves exist that show the potential to reduce the
water wastage on mine secondary cooling systems. Thereby, this additional electrical power

Chapter 3: Optimisation model development
Optimising the refrigeration and cooling system of a platinum mine
84
usage can be condensed. These valves use differential pressures to adjust the water flow
accordingly, that ensures a constant water flow through the CC.
Figure 45 illustrates where the proposed equipment will be installed on Mine A’s refrigeration
and cooling system.
Chiller 1
Bulk air cooler stage 2
Chiller 2 Chiller 3
Bulk air cooler stage 1
Ambient air in Cold air for
underground ventilation
Hot dam
Hot dam
Treatment
dam
Pre-cooling tower
Water flow to surface
Condenser dam
Water flow from underground operations
Water flow to underground operations
Water flow from underground
Evaporator pumps
BAC pumps
Condenser pumps
Pre-cooling pumps
Chill dam 1
Chill dam overflow
return pipe
T
T
TL
L T
Pre-cool
TL TL
Chill dam 2
Condenser cooling towers
Evaporator water Condenser water Air flow
Control valve
Non return valve
Manual valve
Fan
Legend
L
T
Level transmitter
Temperature sensor
Water pump
VSD
VSD
VSD
T
F F F
F
F
Backup
Proposed F Flow meter
VSD
Installed
HPE valve
SCADA
PLC
SCADA
VSD
FT T
T
L T
W Weather station
Cooling car
Coms network
W VSD
VSD VSD VSD
:
Figure 45: System layout with proposed infrastructure for Mine A.
As the present control is out of date, inefficiency is evident with the following electric energy
wastages noted:
General lack of efficient chiller control to accommodate cooling load variances,
unnecessary chilled water recirculation through chillers,
not extracting the optimal delta temperature for chiller condenser, and

Chapter 3: Optimisation model development
Optimising the refrigeration and cooling system of a platinum mine
85
constant chilled water dumping by mine CC.
This creates the need for a modernised improved control strategy to implement on all relevant
auxiliaries. This control can be implemented by installing mechanical control valves on the CC
and VSDs for all relevant pumping equipment. This will allow for a reduction in chilled water
demand underground and enable the water flow control and automation needed for successful
control. It is vital that this control respond in real-time according to operational inefficiencies.
The EMS previously mentioned will be used to automatically control and optimise all
necessary auxiliary equipment. This system will allow for the implementation of suggested
optimisation strategy in order to achieve electrical energy savings. Figure 46 shows the control
communication diagram implemented with the EMS.
EMS
EMS
Auto/Manual
Send user specified
control output and/or
set point value to
SCADA
Send control output
value determined by
EMS controller to
SCADA
AutoManual
SCADA
PLC
All feedback and
viewing tags from
SCADA to EMS
Send min/max/failsafe/
set point as controller
input values to
SCADA
Use control
input set points or
control outputs
Control outputs
Control inputs
Figure 46: EMS control logic diagram adapted from Van Greunen (2014).
It will be essential to implement a redundant system to achieve constant optimal system
performance. Therefore, an extra failsafe is built into the refrigeration system PLC where users
can define safe control limits and parameters that will be used should the EMS fail. The
failsafe control logic diagram is shown in Figure 47.

Chapter 3: Optimisation model development
Optimising the refrigeration and cooling system of a platinum mine
86
EMS
EMS
On/Off
Send value’s
received from
EMS to PLC
OffOn
PLC
SCADA
Feedback
Send value’s
specified on
SCADA to PLC
- VSD frequency limits
- PID control set points
Figure 47: EMS to SCADA control communication diagram.
The general control logic implemented for the VSDs are simplified to improve the redundancy
of the EMS control. The VSDs will control the flow rates of each pumping system according to
set values laid out in the EMS. This includes the frequency limits that will be connected to the
relevant flow constraints of each individual system. System constraints and control limits will
typically be determined with the commissioning phase of the implementation.
The following sections will explain the proposed control for the evaporator, condenser, BAC,
pre-cooling and CC water flow.
Pre-cooling flow control
The proposed solution for the pre-cooling tower control is to restore the weather station WB
temperature reading on the SCADA. This will ensure that the existing pre-cooling tower
Proportional Integral Derivative (PID) controller functions according to the original design
specifications. Secondly, it is proposed to optimise the PID controller adjusting the make-up
water flow to the BAC to allow a more constant water supply to the BAC sump. This will
reduce the water temperature spikes experienced through the evaporators. The control logic
diagram is illustrated by Figure 48.

Chapter 3: Optimisation model development
Optimising the refrigeration and cooling system of a platinum mine
87
PLC(Auto, control activated, PID
control enabled)
BAC sumpPre-cooler
sump
BAC sump level:Set point = 95%
Control limits = 98 - 90%
Feedback
Figure 48: BAC sump pre-cooling water flow control logic diagram for Mine A.
Evaporator flow control
Dams serve as a storage medium to absorb the peak chilled water demands during mine
drilling shifts. Therefore, it is essential that the relevant chill dam levels are always maintained
between the specified levels.
It is proposed to install VSDs on the evaporator water pumps. The water flow will then
continuously be controlled by means of PID control logic. The PID controller will ensure that
the chill dam levels are maintained. Figure 49 shows the evaporator flow control diagram when
implementing VSDs. The VSDs will reduce the water flow if the BAC outlet temperature is
lower than the set point and if the chill dam levels are within the set dam level limits.
EMS BAC temperature /
chill dam set-point
(EMS Auto)
SCADA
(EMS Activated)
PLC(Auto, control activated,
PID control enabled)
VSD
BAC sump
Chill dam level:Set point: 80%
Control limits: 60 - 95%
BAC spray chamber
Chill dam level
Feedback
BAC air temperatureSet point: 10°C
Control limits: 9.5 - 10.5°C
Figure 49: Mine A evaporator water flow control logic diagram.
Further, it is proposed that the back-pass PID valve controller is switched back to auto and
optimised to reduce the evaporator inlet water temperature spikes experienced. The same PID

Chapter 3: Optimisation model development
Optimising the refrigeration and cooling system of a platinum mine
88
control logic is used for the actuating valve controlling the back-pass water flow to the
evaporator pump water suction pipe. This PID control logic controller is already built into the
refrigeration system PLC and can be altered on the SCADA system.
The evaporator water temperature is used as control feedback for the PID controller on the
chilled water back-pass actuating valve. In summary, the control will open the back-pass valve
according to the make-up water valve position. The control diagram is illustrated in Figure 50.
PLC(Auto, control activated,
PID control enabled)
Evaporator pump
suction
Chilled water
from chillers
Make-up water
valve position
Feedback
Figure 50: BAC sump make-up water flow control logic diagram.
Condenser flow control
It is proposed to install VSDs on all the condenser pumps. The condenser VSD speed will be
controlled by means of a PID control loop to maintain the design water temperature difference
across the condenser. Figure 51 shows the communication control diagram for the proposed
water flow control when implementing VSDs on the all condenser pumps.
EMS delta
temperature set point
(EMS Auto)
SCADA
(EMS Activated)
PLC(Auto, control activated,
PID control enabled)
VSD
Condenser
sumpTin
Tout
Feedback
Temperature delta:Set point: 4°C
Control limits: 3.8 - 4.2°C
Figure 51: Mine A condenser water flow control logic.

Chapter 3: Optimisation model development
Optimising the refrigeration and cooling system of a platinum mine
89
BAC flow control
The cooled ventilation air supplied by the BAC maintains underground temperature condition
and form part of the required service deliveries specified by Mine A’s staff. The specified DB
air temperature for the BAC to ensure and maintain the maximum allowable WB temperature
at or below 27.5°C is 10°C (Vosloo et al., 2012). It, therefore, is proposed to install VSDs on
the BAC spray pumps to control the water flow through the spray nozzles accordingly. PID
control logic will be used to adjust the VSD speeds to maintain the BAC air outlet temperature
at 10°C.
From knowledge gained in the literature review, it is noted that when water flow rates sprayed
through the nozzles are reduced, the air outlet temperature will increase as a result. Figure 52
shows the BAC spray water flow control communication diagram when implementing VSDs on
the pumps. With this proposal, a more constant BAC outlet air temperature supply is expected
along with reduced pump energy consumption.
EMS BAC
temperature set point
(EMS Auto)
SCADA
(EMS Activated)
PLC(Auto, control activated,
PID control enabled)
VSD
Spray chamberBAC sump
Feedback
BAC air temperatureSet point: 10°C
Control limits: 9.5 - 10.5°C
Figure 52: BAC water flow control logic diagram.
CC flow control
The HPE mechanical valve presents the best potential to implement on platinum mine CC to
reduce the chilled water wastage thereof. This valve will only dump water if the downstream
chilled water flow demand is lower than the required flow through the CC. It is expected that
the flow through the CC will be maintain at the design and average water dumped daily will be
reduced. Therefore, it is proposed to install HPE 3-way mechanical valve on all four mine CCs.

Chapter 3: Optimisation model development
Optimising the refrigeration and cooling system of a platinum mine
90
3.5. VERIFICATION AND SIMULATION MODEL
The refrigeration and cooling system of the case study was modelled using Process Toolbox
(PTB) 3. Two models were developed. Figure 72 and Figure 73 in Appendix C shows screen
shots of the two simulation models developed for Mine A. The first model was used to verify
the accuracy of the developed simulation model. This was achieved by simulating one random
winter (2013/07/18) and summer day (2013/11/21) respectively. These simulated results are
then compared to actual data acquired from the portable power logger and mine SCADA
system. This provides a measure to verify the accuracy of PTB and the developed simulation
model.
The utilised variables for the verification model for these simulated days, as measured on the
SCADA system and portable power meter are shown in Table 30 in Appendix C. These
variables include power data, chiller running statuses, ambient DB temperature, RH and pre-
cooling tower inlet water temperatures. The simulation model was validated by placing these
variables into the simulation model with the specified refrigeration system constraints as
explained in Section 3.3.2.
In Figure 53 the actual power profile as measured by the portable power meter is compared to
the power output profile achieved from the simulation model.
Figure 53: Validation of simulation model power profile with data measured on 2013/11/21 and 2013/07/18.
3 Process Toolbox Flow Solver is transient thermal hydraulic component bases simulation and optimisation tool.
0
1000
2000
3000
4000
5000
6000
0 2 4 6 8 10 12 14 16 18 20 22 0 2 4 6 8 10 12 14 16 18 20 22
Tota
l pow
er
pro
file
s [
kW
]
Time of day [hour]
Measured Simulated
2013/11/21 2013/07/18

Chapter 3: Optimisation model development
Optimising the refrigeration and cooling system of a platinum mine
91
The simulated power output had a correlation of 99% and an average percentage error of
5.5%, when comparing the two power profiles. The measured data incorporated all power
consumed by the refrigeration system. The simulation did not include the filtration plant and
the relevant transfer pumps. Thus, an average power difference between the simulated and
measured power was expected, pertaining to all refrigeration equipment that were excluded
from the simulation model.
The BAC air temperature output profile of the simulation is compared to the actual measured
temperature profile as shown in Figure 54. It is important that these temperatures correlate
accurately, as the evaporator and BAC pump VSDs are controlled according to this
temperature.
Figure 54: Validation of simulation model BAC outlet temperature.
The simulated BAC outlet temperature had a correlation of 97% and an average percentage
error of 0.02%, as compared to the actual temperature profile measure on the SCADA. This
proves that when simulating the VSD control in the second model the outcome is expected to
be accurate. This will result in a more accurate simulated potential savings as well for the
proposed optimisation strategy.
It is, therefore, reasonable to conclude that PTB is an accurate simulation packet to use. It is
shown that the model developed accurately represents the refrigeration system. The
developed model will be used to simulate the proposed variable flow control adapted for
Mine A.
0
2
4
6
8
10
12
14
0 2 4 6 8 10 12 14 16 18 20 22 0 2 4 6 8 10 12 14 16 18 20 22
Tem
pera
ture
[°C
]
Time of day [hour]
Measured Simulated
2013/11/21 2013/07/18

Chapter 3: Optimisation model development
Optimising the refrigeration and cooling system of a platinum mine
92
3.6. SIMULATED SAVINGS
3.6.1. Overview
The case study requires a large capital investment to install the proposed equipment to realise
the electricity savings. The potential return on investment must be set to determine the
feasibility of the case study.
3.6.2. Process Toolbox
The accuracy of the model was verified. The simulation model will be used with assurance to
simulate the potential savings with the proposed optimisation strategy. The second model
used to determine the potential savings is shown in Figure 73. This model was used to
determine a power baseline for the four seasons (summer to spring) before any variable flow
control was implemented.
Firstly, a baseline profile was simulated with relevant weather data measured for the four
consecutive seasons. Thereafter the same seasonal weather data were used along with the
proposed strategies identified, implemented into the model, were simulated to determine the
potential yearly savings. These simulated power profiles are shown in Figure 55.
Figure 55: Seasonal simulated total surface refrigeration and cooling system power profiles.
The average simulated weekday electricity consumption and potential savings are
summarised in Table 15. As shown an average daily saving of 1 294 kW can be expected
annually. This translates to a 29% reduction of the simulated power baseline, which converts
0
1000
2000
3000
4000
5000
6000
0 3 6 9 12 15 18 21 0 3 6 9 12 15 18 21 0 3 6 9 12 15 18 21 0 3 6 9 12 15 18 21
Sim
ula
ted p
ow
er
[kW
]
Time of day [hour]
Baseline Optimisation proposed control
Summer Spring Winter Autumn

Chapter 3: Optimisation model development
Optimising the refrigeration and cooling system of a platinum mine
93
to an average daily cost saving of R14 700 that can be expected on average throughout the
year.
Table 15: Average weekday simulated VSD power and cost savings.
Season Simulated power [kW] 2014/2015 tariff structure costs [R]
Baseline VSD Saving Baseline VSD Saving
Summer 5 027 3 991 1 035 55 186 43 493 11 693
Autumn 4 767 3 317 1 451 51 951 35 423 16 528
Winter 3 678 2 065 1 613 75 671 57 245 18 426
Spring 4 419 3 340 1 079 48 692 36 546 12 147
Average 4 473 3 178 1 294 57 875 43 176 14 698
The expected yearly savings are summarised in Table 16. The year was broken into two
seasons, low demand and high demand, according to the Eskom tariff structures (Eskom
schedule of standard prices, 2014). The weeks were broken down according to the Eskom
Megaflex tariff structure were different tariffs structures are applied to weekdays, Saturdays
and Sundays (Eskom schedule of standard prices, 2014).
Table 16: Mine A expected annual average savings based on simulation model.
Saving
2014/2015 tariff structure costs [R]
Low demand season (Sept – May)
High demand season (Jun – Aug)
Weekday 2 475 862 2 182 268
Saturday 442 608 259 206
Sunday 406 349 179 959
Annual weekday 4 658 130
Total annual 5 946 252.56
3.6.3. Verification of pump savings
An accurate and simplified measure to determine the potential electricity savings that can be
realised with reduced flows from the respective pumping equipment was with the use of the
Affinity Laws (Van Greunen, 2014). Equation 3.3 and Equation 3.4 were used to calculate the
power usage of the respective system pump motors when maintained at the minimum
allowable flow as stated in Table 12. The best-case savings that can be expected with the
implementation of VSDs can be calculated as follows:
𝑃1 = 𝑃𝑟𝑎𝑡𝑒𝑑 × 𝜂 × 𝐿 (3.3)
Where,
𝑃1 = Actual motor power consumption [kW]
𝜂 = Electric motor efficiency [%]

Chapter 3: Optimisation model development
Optimising the refrigeration and cooling system of a platinum mine
94
𝐿 = Electric motor load factor [-]
𝑃1
𝑃2= (
𝑄1
𝑄2)
3
(3.4)
Where,
𝑃2 = Calculated motor power consumption at reduced flow [kW]
𝑄1 = Measured water flow rate at full motor speed [ℓ/s]
𝑄2 = Reduced water flow rate [ℓ/s]
The combined pump motor electricity saving that can be realised for the BAC, evaporator and
condenser circuit pumps respectively with a motor efficiency of 95% and load factor of 90%
are shown in Table 17.
Table 17: Mine A estimated pump motor savings calculated from Affinity Laws.
Description Unit BAC Evaporator Condenser
Number of pumps - 3 1 3
Motor rated power kW 132 330 275
Motor power (P1) (η=0.95) (L=0.9) kW 113 282 235
Measured flow 1 (Q1) ℓ/s 175 330 350
Reduced flow 2 (Q2) ℓ/s 87 230 280
Power at reduced flow (P2) kW 16 112 141
Flow reduction % 50 30 20
Individual pump savings kW 97 170 94
Total Pump savings kW 290 170 283
Combined savings kW 743
It is calculated that a maximum pump power saving of 743 kW is possible with the reduced
flow rates specified in Section 3.3.2 for the respective pumping systems. The achievable pump
savings is, however, dependent on the chiller schedules and ambient weather conditions. This
provides a good benchmark though by means to verify the results attained from the simulation
model.
3.6.4. CC calculated savings
The calculation and assumptions used to calculate the proposed savings with the
implementation of the HPE mechanical valve on all four CC are shown in Appendix B. A brief
summary thereof will follow here.
Presently each CC dumps 18.4 Mℓ water per month, if assumed that each CC consumes a
constant flow of 7 ℓ/s. It is calculated that the HPE valve will only dump 6 Mℓ water per month.
This results to a reduction of 67% in water wastage that can be expected for each CC. This

Chapter 3: Optimisation model development
Optimising the refrigeration and cooling system of a platinum mine
95
translates to an average power reduction of 230 kW on the pumping system. Consequently, a
summer weekday saving of R2 630 and a winter weekday saving of R4 840 according to the
Eskom 2014/2015 Megaflex tariff structure can be expected. The calculated respective
weekday savings are summarised in Table 18.
Table 18: Expected annual savings based on CC calculations and assumptions
Saving
2014/2015 tariff structure costs [R]
Low demand season (Sept – May)
High demand season (Jun – Aug)
Weekday 483 884 309 889
Saturday 86 167 37 015
Sunday 78 913 25 758
Annual weekday 793 773
Total annual 1 021 625.47
Through the implementation of the HPE mechanical valves on all four CC it was calculated
that an average annual saving of R1 021 625 can be realised on Mine A. This will result in a
PBP of less than 2 months with the equipment cost provided in Table 7.

Chapter 3: Optimisation model development
Optimising the refrigeration and cooling system of a platinum mine
96
3.7. CONCLUSION
It was shown that the data acquired from the portable and permanent power meters are
accurate within acceptable limits. A verification simulation model of the surface refrigeration
and cooling system was then developed that accurately represented the measured power and
system temperatures. This verified model was used to simulate potential savings with the
proposed optimisation strategies. Data used pre- and post-implementation, along with the
method used to calculate the energy savings, were verified by an independent auditor as
accurate.
An overview of the inefficient equipment and control strategies on the case study platinum
mine’s refrigeration and cooling systems were identified. Optimisation strategies were
proposed to address these identified system inefficiencies. It was shown that the optimisation
strategies have control parameters to adhere to incorporate mine standards and system
constraints. By controlling according to the system constraints will ensure sustainability and
avoid production loses.
The proposed underground chilled water demand management equipment savings were
calculated to verify the feasibility of implementing this equipment on Mine A’s CC. It was
calculated that with the implementation of the HPE mechanical valves on all four CC an
average annual electricity cost saving of R1 021 625 could be realised. This will result in a
PBP of less than 2 months.
Electricity savings were verified for the variable-flow control strategies adapted for Mine A
refrigeration and cooling system through the use of simulations and calculations. The
simulations were modelled and the accuracy thereof verified, to present the expected savings
accurately.
The electricity savings expected from the simulated variable-flow control strategies will result
in an annual cost saving of R5 946 252. The PBP for the case study, therefore, is expected to
be 6.2 months based on Mine A’s installation costs shown in Table 6.
The expected PBP for the both proposed optimisation strategies are 6.2 and 2 months. It is
reasonable to conclude that it will be financially viable to implement both these strategies on
the case study platinum mine.

CHAPTER 4. CASE STUDY: IMPLEMENTATION OF
PROPOSED SOLUTION
Verification using a platinum mine refrigeration and cooling system as case study.

Chapter 4: Case study: Implementation of proposed solution
Optimising the refrigeration and cooling system of a platinum mine 98
4.1. INTRODUCTION
With the implementation of the optimisation strategy to improve the EE of the refrigeration and
cooling system, a detailed analysis is required to determine the results thereof. In this chapter,
the implementation of the proposed strategy will be discussed, along with the change in chiller
COP and the service delivery of the refrigeration and cooling system. The electricity saving
achieved are determined. These results will be used to indicate the feasibility of the case study
in terms of project payback periods.
The intervention findings will be discussed and presented in detail pertaining to all relevant
data acquired pre- and post-implementation. The discussion will include an analysis of new
data obtained and provide a comparison between inefficiencies identified in Chapter 3.
Through considering the inefficiencies identified the power consumption prior to the
intervention will be considered to provide the extent of project success achieved.

Chapter 4: Case study: Implementation of proposed solution
Optimising the refrigeration and cooling system of a platinum mine 99
4.2. CONTRACTOR MANAGEMENT
4.2.1. Contractor selection
Project management plays a key role in the successful implementation of such a large case
study. As the initiative is an Eskom funded DSM project, the allocation of funding is fixed and
implementation times usually limited. It is of utmost importance that the most important
components, namely time and the budget management be dealt with accordingly. The
managing components are considered as the constraints to determine the choice of equipment
and contractor selection.
Three contractors were invited to quote for the complete supply and installation of all required
infrastructure to allow complete automatic control and monitoring of the case study. The
quotes had to cover all required alterations needed to sustain effective savings and monitoring
of the system. All equipment needed was described by the contractor and had to comply with
mine standards and preferred equipment.
The delivery time of VSDs is considered as an important factor, considering that it can take up
to 12 weeks to be shipped to site. This time frame is largely dependent on whether or not it
has to be shipped from overseas. The quotes received are summarised in Table 19. The costs
shown include all project costs relating to the implementation. The implementation period
includes all respective components, shipping, installation and commissioning time thereof.
Table 19: Subcontractor quote comparison
Quoting Company
Cost of supply and installation (Excl VAT)
Implementation period (days)
Previous experience with ESCO
Subcontractor A R7 931 163 158 Yes
Subcontractor B R3 763 555 - Yes
Subcontractor C R3 093 801 98 Yes
Subcontractor C was chosen due to the engineering solution, equipment warranty and free
training they provided for mine personnel on the VSD. The unique engineering solution
resulted in their quote being the lowest along with the shortest installation time. In addition, all
relevant work required was within their capabilities, this simplified the management of the
project. With the lower costs more VSDs could be installed, which will result in more savings.
The implementation period specified by contractor C took longer than specified, due to
problems encountered during the commissioning of the VSDs. These problems will be
discussed in Section 4.2.2. The delays did not compromise the project since the platinum mine

Chapter 4: Case study: Implementation of proposed solution
Optimising the refrigeration and cooling system of a platinum mine 100
experienced strikes for most of the first half of 2014. This allowed the contractor to finish the
work, as the performance period could not commence during the labour strikes.
4.2.2. Problems encountered
When the commissioning commenced at the case study, the subcontractor encountered
problems with earth leakage tripping when any of the VSDs were started. The solution was to
install separate earth cables between each VSD and pump.
The reason for each motor requiring a separate earth cable between the VSD and electrical
motor are due to harmonic distortion caused by the VSDs. The harmonics are a result of the
non-linear load, which consumes power in pulses (Saidur et al., 2012). This causes harmonic
ripples to be fed back into the power grid. These ripples affect the equipment without harmonic
filters. In this case, it was all the equipment without VSDs installed on them.
This caused project to be delayed to allow for the installation of the additional cables. It is very
important to ensure that thorough on-site investigations are done to minimise project delays as
in this case.

Chapter 4: Case study: Implementation of proposed solution
Optimising the refrigeration and cooling system of a platinum mine 101
4.3. OPTIMISATION STRATEGY IMPLEMENTED ON CASE STUDY
4.3.1. Overview
As stated earlier an EMS program will be used to implement the resulting system control
parameters. Four viewing modes were created in the EMS setup presenting detailed control
and data logging pages. The overview page is shown in Figure 56 and the detailed condenser,
evaporator and BAC control overview pages, data logging and trending page are presented in
Appendix E by Figure 77 to Figure 79.
To ensure that the relevant system constraints for the chillers and auxiliaries are avoided at all
times, the EMS allows for safety parameters, which will ensure that control occurs within the
pre-set safe parameters. This will ensure that the automatic system control is maintained with
minimal need for manual alterations. This allows mine personnel only to change the required
VSD controller set points if alterations are required with the assurance that the system will not
be affected negatively.
Figure 56: EMS print screen- main overview of chiller plant and auxiliaries.
All system control parameters are controlled and trended by the system PLC and SCADA as
mentioned in Section 3.3. All critical and relevant parameters are shown on the EMS pages.
The EMS will monitor all controllable system operational parameters that can be affected with
the strategy implementation.

Chapter 4: Case study: Implementation of proposed solution
Optimising the refrigeration and cooling system of a platinum mine 102
Some of these include evaporator, condenser water flow and BAC air outlet temperatures. It is
important that these controllable operational limits are not exceeded. The following section will
provide all the flow versus frequency limits for the given water circuit control limits as
measured during the commissioning of the project.
4.3.2. Resulting chiller evaporator control
Table 20 and Table 21 show the set points for the chiller machine evaporator and condenser
water circuit VSD controllers respectively. The minimum and maximum frequency values were
determined with on-site testing pertaining to the respective flow rate constraints.
Table 20: Mine A Chiller evaporator pump VSDs control parameters.
Parameter Evaporator Pumps
Control Closed loop PID
Feedback input signal BAC outlet air temperature
Set-point 10°C
Minimum VSD frequency 31 Hz
Maximum VSD frequency 50 Hz
Minimum flow 230 ℓ/s
Maximum flow 360 ℓ/s
Low flow alarm 215 ℓ/s
Low flow trip 200 ℓ/s
The control description is to increase the pump speed when the BAC outlet air temperature
exceeds the temperature set point. When the temperature drops below the temperature set
point, decrease the pump speed utilising closed loop PID control logic.
4.3.3. Resulting chiller condenser control
Increase the condenser pump speed when the condenser water delta temperature difference
(condensers water temperature out minus condenser water temperature in) exceeds the
temperature set point. When the temperature drops below the temperature set point, decrease
the pump speed utilising closed loop PID control logic.
The average feedback signal is calculated as follows:
𝛻𝑇𝑎𝑣𝑔 =𝑅𝐹𝐵1(𝑇1𝑜−𝑇1𝑖)+𝑅𝐹𝐵2(𝑇2𝑜−𝑇2𝑖)+𝑅𝐹𝐵3(𝑇3𝑜−𝑇3𝑖)
𝑅𝐹𝐵1+𝑅𝐹𝐵2+𝑅𝐹𝐵3 (4.1)
where,
𝛻𝑇𝑎𝑣𝑔 = Condenser average delta water temperature [°C]

Chapter 4: Case study: Implementation of proposed solution
Optimising the refrigeration and cooling system of a platinum mine 103
𝑅𝐹𝐵 = Respective chiller running feedback status [-]
𝑇𝑜 = Respective chiller condenser outlet water temperature [°C]
𝑇𝑖 = Respective chiller condenser inlet water temperature [°C]
Table 21: Mine A Chiller condenser pump motor VSD control parameters
Parameter Condenser Pumps
Control Closed loop PID
Feedback input signal Average condenser delta water temperature
Set-point 3°C
Minimum VSD frequency 45 Hz
Maximum VSD frequency 50 Hz
Minimum flow 310 ℓ/s
Maximum flow 450 ℓ/s
Low flow alarm 300 ℓ/s
Low flow trip 280 ℓ/s
4.3.4. Resulting BAC control
Table 22 show the set points for the BAC first and second stage water pumps respectively.
More cooling is achieved by the first stage spray chamber as most of the spray water is
received directly from the chillers. Colder water is, thus used for cooling the air in the first
stage. Consequently, more cooling can be achieved with less pumping power as may be
expected from the second stage spray chambers.
Therefore, the resulting control description is to increase pump speed when the BAC outlet air
temperature exceeds the temperature set point. If the temperature drops below the
temperature set point, decrease the pump speed utilising closed loop PID control logic. The
VSDs will stop to reduce the pump speed at the minimum frequency and will speed-up again
when the control output is 5% above the minimum.
Table 22: Mine A BAC pump motor VSD control parameters
Parameter BAC stage 1 Pump BAC stage 2 Pumps
Control Closed loop PID Closed loop PID
Feedback input signal BAC outlet air temperature BAC outlet air temperature
Set-point 10°C 10°C
Minimum VSD frequency 25 Hz 25 Hz
Maximum VSD frequency 50 Hz 50 Hz

Chapter 4: Case study: Implementation of proposed solution
Optimising the refrigeration and cooling system of a platinum mine 104
4.4. SYSTEM EFFICIENCIES
The project was successfully implemented by March 2014. As a result of the labour strikes the
platinum mining sector experienced through until the end of June 2014, it was best practise to
exclude the data between these periods, as the refrigeration system did not operate as per
usual operating conditions.
Considerable data sets that illustrate the before and after implementation effects were
considered, in accordance with the M&V standards and procedures as discussed previously.
01 July 2014 to 30 September 2014 was used to analyse the effect of the resulting variable-
flow control strategy. Data for the same time frame in 2013 was used to compare the post-
implementation system operations. All data hereafter referring to before and after
implementation periods, therefore, refers to these months.
4.4.1. Pre-cooled water flow control
The evaporator water temperature fluctuates daily due to the make-up water flow actuating
valve control as explained previously. It was expected to be possible to improve the control of
the existing pneumatic actuating control valve to reduce the evaporator water temperature
spikes. It was proven not to be possible with the present control limitations and system design
4.4.2. Chiller COP
Before the discussion for the respective chiller COPs commence, it is important to note that
after implementation one chiller was sufficient to sustain the required processes sufficiently
throughout the assed period. This was prescribed to the 1 MW reduced cooling load that was
required from the chillers. This was caused by the decreased BAC sump temperature that
resulted in reduced evaporator temperatures and reduced evaporator water flows as shown in
Table 23.
Table 23: Mine A average critical variables before and after implementation.
Implementation Chillers inlet
water [°C] Chillers outlet
water [°C] Chiller
cooling [kW] BAC water
[°C] Evaporator flow [ℓ/s]
Before 10.32 5.65 6 697 8.43 343.18
After 8.89 3.28 5 660 7.15 241.34
Through the implementations of the resulting variable flow control strategy it was expected that
the respective COP would increase. An increase in COP is an indication of improved efficiency
for the respective systems. Table 24 shows the resulting average weekday power, cooling and
COPs attained before and after project implementation.

Chapter 4: Case study: Implementation of proposed solution
Optimising the refrigeration and cooling system of a platinum mine 105
Table 24: Mine A Chiller performances realised after project implementation.
Description Chiller 1 Chiller 2 Chiller 3
Before After Before After Before After
Power [kW] 1 074.5 1 325.3 1 015.8 1 097.6 - -
Cooling [kW] 4 542.3 6 466.2 5 240.1 4 904.6 - -
COP [-] 4.2 4.9 5.2 4.5 - -
Average [%] 14.7 -17.1
The change in COP of Chiller 3 could not be evaluated, as it was offline for maintenance
during the assessment period.
A partial increase in Chiller 1’s COP is the result of higher cooling that was achieved for a
small increase in compressor power. This increase can be prescribed as Chiller 1 that was
operated more effectively at the design cooling load. Chiller 1 was mostly used during
September 2014 and Chiller 2 during July and August 2014. Therefore, a decrease on the
cooling demand for Chiller 2 was to be expected, as colder ambient weather conditions were
present.
From the literature review, it was concluded that slide valves are used to control the variance
in cooling demands delivered by chillers. If the sliding valve closes, the cooling delivered by
the chiller is reduced along with the compressor power. When chillers do not operate at design
cooling loads, reduced COPs can be caused by the compressor load control. This explains
why Chiller 2’s COP decreased during the assessed period. The reduced cooling load caused
the chillers load control to reduce the cooling load delivered, but the subsequent compressor
power consumption did not decrease sufficiently to maintain a constant COP value.
It, however, resulted that the overall efficiency of the system was not affected by this decrease
in COP of Chiller 2 as the pump saving achieved outweighed the efficiency loss on Chiller 2.

Chapter 4: Case study: Implementation of proposed solution
Optimising the refrigeration and cooling system of a platinum mine 106
4.5. ELECTRICITY SAVINGS OBTAINED THROUGH OPTIMISATION
4.5.1. Overview
To evaluate the success of the optimisation strategy, it is evident that the energy saving
realised must be evaluated first.
In Section 3.6, the verified simulation model developed with actual system data for the four
seasons predicted a potential electrical saving of 1 294 kW. This translates to an average
reduction of 29% for the simulated power baseline on the case study platinum mine
refrigeration system.
In Section 3.6.3, the pump savings expected for the proposed reduced flow rates was
calculated with Equation 3.3 and 3.4. To verify the savings proposed by the simulation model.
Through these equations, it was calculated that a combined best-case pump saving of 743 kW
could be expected with a motor efficiency of 95% and motor load factor of 90% through the
implementation of VSDs.
In Table 25, it is shown that the actual best-case saving achievable with VSDs implemented
on the respective pumps to be 650 kW. The discrepancy between the calculated best-case
pump savings before and after implementation was due to the difference in load factor
assumed and measured. The actual motor load factors are illustrated in Table 25 below. It was
established that the actual motor load factor was 5% lower on average then first assumed.
Therefore, the actual motor power savings are lower than first calculated.
Table 25: Mine A actual measured pump best-case motor savings realised with VSDs.
Description Unit BAC Evaporator Condenser
Number of pumps - 3 1 3
Motor rated power kW 132 330 275
Actual motor power kW 108 273 215
Actual load factor (L) (η=0.95) % 86 87 82
Full motor speed / flow rate Hz / ℓ/s 50 / 175 50 / 330 50 / 350
Motor speed / flow rate reduced Hz / ℓ/s 25 / - 31 / 230 45 / 280
Power at reduced flow kW 14 70 160
Speed reduction % 50 38 10
Individual pump savings kW 94 203 55
Total pump savings kW 282 203 165
Combined savings kW 650
It remains eminent though that the Affinity Law is an effective tool to estimate the pump
savings that can be expected from reduced flow rates.
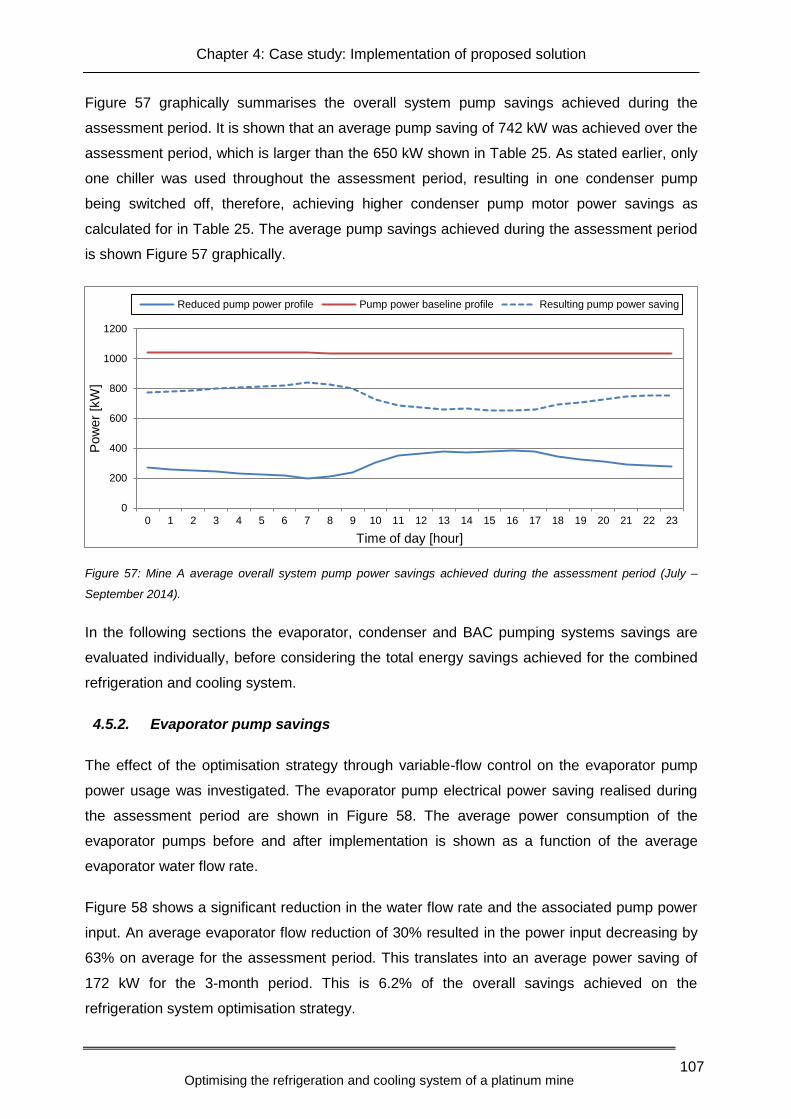
Chapter 4: Case study: Implementation of proposed solution
Optimising the refrigeration and cooling system of a platinum mine 107
Figure 57 graphically summarises the overall system pump savings achieved during the
assessment period. It is shown that an average pump saving of 742 kW was achieved over the
assessment period, which is larger than the 650 kW shown in Table 25. As stated earlier, only
one chiller was used throughout the assessment period, resulting in one condenser pump
being switched off, therefore, achieving higher condenser pump motor power savings as
calculated for in Table 25. The average pump savings achieved during the assessment period
is shown Figure 57 graphically.
Figure 57: Mine A average overall system pump power savings achieved during the assessment period (July –
September 2014).
In the following sections the evaporator, condenser and BAC pumping systems savings are
evaluated individually, before considering the total energy savings achieved for the combined
refrigeration and cooling system.
4.5.2. Evaporator pump savings
The effect of the optimisation strategy through variable-flow control on the evaporator pump
power usage was investigated. The evaporator pump electrical power saving realised during
the assessment period are shown in Figure 58. The average power consumption of the
evaporator pumps before and after implementation is shown as a function of the average
evaporator water flow rate.
Figure 58 shows a significant reduction in the water flow rate and the associated pump power
input. An average evaporator flow reduction of 30% resulted in the power input decreasing by
63% on average for the assessment period. This translates into an average power saving of
172 kW for the 3-month period. This is 6.2% of the overall savings achieved on the
refrigeration system optimisation strategy.
0
200
400
600
800
1000
1200
0 1 2 3 4 5 6 7 8 9 10 11 12 13 14 15 16 17 18 19 20 21 22 23
Pow
er
[kW
]
Time of day [hour]
Reduced pump power profile Pump power baseline profile Resulting pump power saving

Chapter 4: Case study: Implementation of proposed solution
Optimising the refrigeration and cooling system of a platinum mine 108
Figure 58: Mine A daily average evaporator pump power and water flow rate before and after implementation.
It is concluded from the post-implementation results shown in Figure 58 that the evaporator
flow rates were more accurately modulated to match the chilled water demand, while staying
within the prescribed system constraints. This is shown in Figure 62 through to Figure 65,
where it is illustrated that the service delivery of the system was maintained within the limits.
4.5.3. Condenser pump savings
The electrical energy savings realised by implementing the proposed variable-flow control on
the condenser water circuit are quantified in Figure 59. It was not possible to indicate the
respective pump power as a function of the flow, as the flow meters installed on the
refrigeration condenser water circuit were non-functional.
Figure 59: Mine A daily average condenser pump power profile before and after implementation.
100
150
200
250
300
350
400
50
100
150
200
250
300
350
0 1 2 3 4 5 6 7 8 9 10 11 12 13 14 15 16 17 18 19 20 21 22 23
Flo
w [
ℓ/s]
Pow
er
[kW
]
Time of day [hour]
Pump power after Pump power before Flow after Flow before
100
150
200
250
300
350
400
450
0 1 2 3 4 5 6 7 8 9 10 11 12 13 14 15 16 17 18 19 20 21 22 23
Pow
er
[kW
]
Time of day [hour]
Pump power before Pump power after

Chapter 4: Case study: Implementation of proposed solution
Optimising the refrigeration and cooling system of a platinum mine 109
Figure 59 shows a significant reduction in the associated pump power input. An average
decrease of 56% was realised for the condenser pump power during the assessment period.
This translates to an average power saving of 226 kW, where 89% of the saving achieved was
a result of one condenser pump that was switched off during the 3-month period. This
contributed 8.1% to the overall savings achieved for the refrigeration system.
4.5.4. BAC pump savings
The BAC spray pump savings realised by the implementation of the BAC air temperature
variable-flow control are shown in Figure 60. Only the respective spray pump electrical data
were considered here, the average BAC outlet air temperatures are shown in Figure 65.
Figure 60: Mine A daily average BAC spray pump power profile before and after implementation.
It is apparent from Figure 60 that there was a significant decrease in the average daily power
usage, which resulted in a decrease in chilled water consumption. The flow is not presented,
as no flow meters are installed on the respective pumps. The average power input of all three
spray pump chambers was reduced by 76%. This translates to an electrical power saving of
245 kW, which contributes 8.8% to the total savings achieved.
It is concluded from the post-implementation results shown in Figure 60, that the chilled water
flow through the spray chambers were more accurately controlled to match the ventilation air
cooling demand. This was achieved while remaining within the prescribed system constraints.
This is shown in Figure 65, where it is illustrated that the service ventilation air delivery of the
system was maintained within the limits.
0
20
40
60
80
100
120
0 1 2 3 4 5 6 7 8 9 10 11 12 13 14 15 16 17 18 19 20 21 22 23
Pow
er
[kW
]
Time of day [hour]
Stage 1 pump power before Stage 2 pump 1 power before Stage 2 pump 2 power before
Stage 1 pump power after Stage 2 pump 1 power after Stage 2 pump 2 power after

Chapter 4: Case study: Implementation of proposed solution
Optimising the refrigeration and cooling system of a platinum mine 110
4.5.5. CC savings
The platinum mining sector experienced the longest strike in the history of SA during the
implementation of the project (Chamber of Mines of South Africa, 2013). It was agreed upon
that Mine A was responsible to install the valves on all 4 CC. As a result of the strikes, Mine A
experienced significant amount of losses (Baxter, 2014). Therefore, when mining production
commenced after the 5-month strike period, mine personnel were not able to install the valves
in time. Consequently, no results have been measured to include the results thereof in the
proceedings.
4.5.6. Combined system
Figure 61 shows the integrated refrigeration system energy savings that were achieved during
the 3 months assessment period. The power usage measured and verified by the independent
M&V team for the entire system was monitored at the main electricity feeders (Eskom
Corporate Service Division, 2013) as shown by Figure 67 in Appendix A. The entire system
energy savings discussed here, therefore, include the savings achieved from the evaporator,
condenser and BAC water flow control as described separately. The entire system saving will
also illustrate the total effects of the average daily flow reduction on the corresponding chiller
machine power consumption.
Figure 61 shows the typical power profile before implementation of the combined refrigeration
system, as measure and calculated using Equation 3.2. The after implementation power profile
represents the actual average power consumed during the assessment period. Therefore, the
hourly average electrical power savings realised can be calculated with Equation 3.1.
Figure 61: Actual average weekday refrigeration, scaled baseline and saving achieved during the assessment
period.
1000
1500
2000
2500
3000
3500
4000
4500
5000
5500
0 1 2 3 4 5 6 7 8 9 10 11 12 13 14 15 16 17 18 19 20 21 22 23
Pow
er
[kW
]
Time of day [hour]
Before implementation After implementation Saving

Chapter 4: Case study: Implementation of proposed solution
Optimising the refrigeration and cooling system of a platinum mine 111
Table 26 shows that the average weekday electrical power consumption of the total
refrigeration system decreased by 2873 kW or 62% during the assessment period. It is shown
that the post-implementation period power consumption has the same power profile than the
pre-implementation scaled baseline profile. Average increases of power consumption during
the afternoons illustrate the increase in cooling demand experienced during the afternoon
hours. The substantial decrease in power consumption, therefore, illustrates that the
refrigeration system definitely is controlled more effectively according to the cooling demand.
4.5.7. Summary
A summary of the total average weekday power saving measured and discussed for the
assessed period, as well as the predicted saving by the simulation model, is given in Table 26.
Table 26: Mine A combined cooling system average electrical power saving summary.
2014 Baseline
power [kW] Actual
power [kW] Power
saving [kW] Measured saving [% of baseline]
Simulated saving [% of baseline]
July 3 743 1 373 2 523 67 43
August 4 719 1 925 2 794 59 23
September 5 432 2 130 3 302 61 20
Weekday 4 632 1 810 2 873 62 29
Average 4 161 1 467 2 712 65 32
Comparing the actual measured electricity savings with that simulated in Section 3.6, it is
apparent that the predicted savings are less than that measured after implementation. This
can be prescribed to the decrease in chilled service water demand for underground
operations. Unfortunately, the mine was installing new control equipment on the refrigeration
system piping network resulting in no underground flow data for comparison.
The factor that caused the higher electricity saving than first simulated for was contributed to
the reduced evaporator flow rates. It was shown that the whole system’s water temperature
was reduced more effectively than simulated for. It was that these reduced system
temperatures could be maintained effectively throughout the day. Therefore, reducing the
cooling loads experienced by the refrigeration machines more effectively. This resulted in one
chiller to be sufficient to sustain the cooling demand of the system throughout the assessment
period.
It can be concluded that the average electrical energy usage of the case study platinum mine
was reduced by 62% by implementing the proposed optimisation strategy, described and
simulated in this study. The saving achieved includes the following contributing system
optimisation achieved:

Chapter 4: Case study: Implementation of proposed solution
Optimising the refrigeration and cooling system of a platinum mine 112
Reduced pump power at part-load conditions.
Reduced chiller cooling loads.
Decreased water volumes handled by the chillers.
Increased effective control for part-load conditions.
No recycling of chilled water through the BAC sump.
Reduced ventilation air overcooling by the BAC.
The average weekday, Saturday and Sunday savings achieved are summarised in Table 27.
An average low demand season saving of R6.02-million and average high demand season
saving of 3.85-million is expected. The average weekday electrical power saving of 2 873 kW,
result to an average annual weekday saving of R9.88-million.
Table 27: Mine A overall average annual cost saving.
Saving Average
electrical power saving [kW]
2014/2015 tariff structure costs [R]
Low demand season (Sept – May)
High demand season (Jun – Aug)
Weekday 2 873 6 023 596 3 857 637
Saturday 2 804 1 046 831 449 692
Sunday 2 459 840 657 274 399
Annual weekday 2 873 9 881 232
Total annual 2 712 12 492 812
Table 28 summarises the total project cost, savings achieved and expected PBP after project
implementation. It is shown that the average electrical power saving of 2 712 kW will result in a
PBP of less than 3 months and a return on investment time of 10 months.
Table 28: Mine A summary of project costs and relating expected payback period.
Summary of case study results
Electrical energy savings 2 712 kW
Annual electricity cost savings R12 492 812
Installation cost R3 093 801
Duration of installations 7 months
Payback period (PBP) 3 months
Return on investment 10 months
To prove the savings achieved were attained without affecting the refrigeration system
negatively. It is important to demonstrate that service deliveries of the case study platinum
mine refrigeration system were unchanged or improved as a result of the implementation.

Chapter 4: Case study: Implementation of proposed solution
Optimising the refrigeration and cooling system of a platinum mine 113
4.6. SERVICE DELIVERY
The energy saving achieved by implementing the developed strategies cannot be considered
without representing the effects on the service delivery for the refrigeration and cooling
system. It remains important to measure and verify the effects after implementation even
though the strategies were developed specifically with mine service delivery as system design
control inputs.
The data used to verify the changes experienced after project implementation are the same 3
months (July – September) used for the assessment period the year before. Therefore, data
referring to before project implementation was measured during the same 3-month period in
2013 and after project implementation was measured during the assessment period in 2014.
4.6.1. Chilled water
The effects of the optimisation strategy on the respective mine chilled water service delivery
are shown in Figure 62 to Figure 64.
Figure 62: Mine A daily profile of evaporator inlet and outlet temperatures measured during the assessment
months.
It is shown by Figure 62 that the average chiller inlet and outlet evaporator water temperatures
were reduced after the implementation. It is important to note the magnitude of the reduced
average outlet and inlet temperature during the afternoon hours. This is important as higher
cooling loads are normally experienced during these hours, a result caused by elevated
ambient temperatures. These elevated ambient temperatures, therefore, caused the
evaporator temperatures to increase significantly before the implementation, as shown by the
red lines.
0
2
4
6
8
10
12
14
0 1 2 3 4 5 6 7 8 9 10 11 12 13 14 15 16 17 18 19 20 21 22 23
Tem
pera
ture
[°C
]
Time of day [hour]
Chiller inlet before implementation Chiller outlet before implementation
Chiller inlet after implementation Chiller outlet after implementation

Chapter 4: Case study: Implementation of proposed solution
Optimising the refrigeration and cooling system of a platinum mine 114
Thus, highlighting the positive result achieved with the proposed evaporator water flow control
strategy, not only was the outlet temperature reduced, but the average evaporator inlet
temperature as well. Resulting in reduced cooling loads experienced by the chillers,
consequently improving and reducing the chiller machine electrical power consumption.
Although it was shown that the average daily chilled water temperature requirements were not
affected negatively after implementation, it remains important to evaluate typical daily
operation profiles of the chill dam levels. This is eminent, to ensure that the system profiles
fluctuate within acceptable limits.
Figure 63: Mine A typical average daily profile of chill dam temperature and level measured during the assessment
months.
Figure 63 shows that average chill dam temperature after implementation was maintained at a
lower constant temperature then before. This was achieved while maintaining an average chill
dam level of about 80%, which was well within acceptable limits. However, this caused a
decrease in the amount of water overflowing back into the BAC sump, reducing the
recirculation of chilled water, previously recognised as inefficient water control. Consequently,
contributing to the overall refrigeration system power consumption decrease realised.
The evaporator water temperature decreases identified on the chiller inlet and outlet water
earlier are directly related to the decreases shown in Figure 64, which represents the average
BAC sump temperature. The decrease in BAC temperature caused the evaporator to
decrease correspondently, pertaining to the evaporator water pump, which draws water
directly out of the BAC sump. This is shown in Figure 39.
40
50
60
70
80
90
100
110
120
2
2.5
3
3.5
4
4.5
5
5.5
6
0 1 2 3 4 5 6 7 8 9 10 11 12 13 14 15 16 17 18 19 20 21 22 23
Level [%
full]
Tem
pera
ture
[°C
]
Time of day [hour]
Average chill dam temperature before implementation Average chill dam temperature after implementation
Chill dam level before implementation Chill dam level after implementation

Chapter 4: Case study: Implementation of proposed solution
Optimising the refrigeration and cooling system of a platinum mine 115
Figure 64: Mine A typical daily profile of BAC water temperature measured during the assessment months.
4.6.2. Ventilation air
The investigation of the effect of the BAC water flow control strategy on the cooling of the
ventilation air sent underground is demonstrated in Figure 65. An average increase in the BAC
air outlet temperature can be noted, a result of the BAC spray pumps controlling on a set point
of 10°C. Even though the BAC pumps reduced the chilled water flow sprayed through the
nozzles, which was established from the reduction in pump power usage as shown in Figure
60, the outlet air temperature was maintained.
Figure 65: Typical daily profile of BAC air temperature measured during the assessment months.
From the only practical possible comparative evaluation, the ventilation air condition after the
implementation remained within acceptable limits. Never reaching higher temperatures then
measured before implementation.
2
3
4
5
6
7
8
9
10
0 1 2 3 4 5 6 7 8 9 10 11 12 13 14 15 16 17 18 19 20 21 22 23
Tem
pera
ture
[°C
]
Time of day [hour]
BAC water temperature before implementation BAC water temperature after implementation
2
3
4
5
6
7
8
9
10
0 1 2 3 4 5 6 7 8 9 10 11 12 13 14 15 16 17 18 19 20 21 22 23
Tem
pera
ture
[°C
]
Time of day [hour]
BAC air temperature before implementation BAC air temperature after implementation

Chapter 4: Case study: Implementation of proposed solution
Optimising the refrigeration and cooling system of a platinum mine 116
4.6.3. Summary
Table 29 provides a summary of the results explained, in regards to the effects experienced on
the service delivery with the implementation of the optimisation strategies on the refrigeration
and cooling system.
Table 29: Summary of the effects on Mine A’s refrigeration and cooling system service deliveries.
Service variables Unit Before
implementation After
implementation Change
[%]
Evaporator water inlet °C 8.3 6.7 18.8
Evaporator water inlet °C 4.8 3.5 26.7
Chill dam temperature °C 4.6 3.5 25.2
Chill dam level % 100.0 80.9 -19.1
BAC water temperature °C 6.5 5.2 20.3
BAC outlet air temperature °C 6.5 7.6 -14.8
Table 29 shows that the mine service delivery requirements are achieved effectively
throughout and improved overall as a result. It is explained why negative percentages for the
chill dam level and BAC air temperature attained, actually contributed to deliver a more
efficient overall refrigeration system. The only negative result is the average increase in
ventilation air temperature, but this was shown too remained within the controllable limits.
It is preeminent that the implementation did not only maintain the service delivery
requirements, but improved the overall efficiency and output of the relevant systems and
equipment.

Chapter 4: Case study: Implementation of proposed solution
Optimising the refrigeration and cooling system of a platinum mine 117
4.7. CONCLUSION
The proposed optimisation strategy implemented on the case study platinum mine refrigeration
and cooling system showed to have improved the overall energy consumption significantly.
For the 3-month assessment period, an average daily electrical energy saving of 2.7 MW or
65% of the baseline power was realised. This extrapolated an annual energy cost saving of
R12.5-million, resulting in a PBP of 3 months. Unfortunately, the combined savings of the
dewatering system could not be verified, as the valves were not installed in time on the
underground CC.
The total savings achieved are a direct result of the evaporator, condenser and BAC pump
savings along with the savings achieved on the chillers since the overall system was controlled
more efficiently. The savings on the chillers resulted from the evaporator water flow control
that reduced the back-pass of chilled water from the overflow of the chill dams, effectively the
overall systems water temperature was reduced as a result of the combined water flow control
strategies.
It is showed that the overall performance of the refrigeration and cooling system was not
adversely affected by the implemented optimisation control strategies. The COP of the chillers
and performances of the subsystems did not vary significantly after the strategies were
implemented. It is concluded that the implementation did not only maintain the service delivery
requirements, but improved the overall output of the relevant systems and equipment.

CHAPTER 5. CONCLUSION
The overall summary and success of the dissertation pertaining to the optimisation strategy
developed and implemented on the case study mine follows. Suggested solutions and
recommendations are highlighted for future research.

Chapter 5: Conclusion
Optimising the refrigeration and cooling system of a platinum mine 119
5.1. SUMMARY OF STUDY
The platinum industry has been hit by the combined impacts of falling PGM prices, escalating
production costs and labour strikes. It is shown that while mines experience strikes there is still
critical equipment that need to operate on a continuous basis. This contributing to the fact that
platinum mines do not only lose production during strikes, but the consumption of the ever-
increasing electricity remains high as well. The potential, therefore, existed to match the
supply to the demand of identified energy intensive mining operations.
Refrigeration and cooling systems where identified as one of these energy intensive
operations that presented potential for optimisation. The availability of Eskom EEDSM funded
projects made the implementation of optimisation strategies on refrigeration and cooling
systems more attractive. The DSM strategy will not only help Eskom to reduce the demand of
electricity, but also assist mines on managing their production cost increases. The biggest
contributor for the production cost increases experienced by mines is shown to be electricity
costs.
Through the literature review, thorough knowledge of typical large mine refrigeration and
cooling systems operation and performances were congregated. This provided the foundation
to be able to identify possible energy saving opportunities on these systems, with provided
insight on unique operational requirements and limitations. Existing optimisation strategies
developed were identified. It was shown that through combining the distribution system of
service water with the water reticulation system large savings could be achieved. It, therefore,
was decided not only to optimise the supply of the service delivery, but the demand thereof as
well.
Inefficiencies were identified on the surface and secondary underground cooling equipment of
the case study platinum mine. The proposed optimisation strategies and equipment were both
evaluated by a simulation model and verification calculations. It was indicated that through
these evaluation strategies a daily average electricity demand of 1.3 MW could be realised on
the surface refrigeration system. The potential savings calculated for the optimised CC flow
control valve could result into an electrical saving of 230 kW on the dewatering pumping
system. These strategies showed an average daily saving potential of R14 590 and R2 607,
resulting in a PBP of 6.2 and 1.9 months distinctively.
Subsequent system constraints identified during the optimisation model development were
incorporated into the EMS with project commissioning, assigning relevant VSD frequency

Chapter 5: Conclusion
Optimising the refrigeration and cooling system of a platinum mine 120
limits according to the known restrictions. Safe control parameters were inserted into the
SCADA system to maintain the resulting savings more effectively.
The average annual power savings realised after project implementation during the 3-month
assessment period resulted to an EE of 2.7 MW (65%). This translated to an annual cost
saving of R12.5-million, while the implementation costs amounted to R3.1 million. The
predicted PBP, therefore, was shown to be 3 months, with a return on investment period of 10
months.
The effects of the proposed strategies on the refrigeration and cooling system service
deliveries were compared. Data measured for the same three months before and after
implementation were used to verify the effect of the implemented strategies.
These results provide sufficient evidence to prove the feasibility of adapting the variable-flow
strategies developed by Du Plessis et al. (2013) on a case study platinum mine. Through
implementing VSDs on the case study platinum mine variable-water flow control was achieved
on the platinum mine refrigeration and cooling systems.
Unfortunately, the mechanical valves could not be installed in time on the secondary CC, due
to the platinum strikes experienced during project implementation. Consequently, no results
have been measured to include in the conclusion.
The case study, therefore, proved that the generic variable flow strategy identified is versatile
enough to optimise platinum mines refrigeration and cooling systems.

Chapter 5: Conclusion
Optimising the refrigeration and cooling system of a platinum mine 121
5.2. RECOMMENDATIONS
It is shown that the proposed optimisation strategy implemented on the case study platinum
mine reduced the electricity costs thereof significantly. The potential to optimise the case study
refrigeration and cooling system to achieve even greater cost savings, the following additional
opportunities can be investigated:
Firstly, it is proposed to rectify the pre-cooling water flow control valve. To maintain a
more constant supply of pre-cooled water into the BAC sump, this to reduce the
evaporator water temperature spikes shown in Figure 40. This will possibly not reduce the
electricity costs, but allegedly reduce the maintenance costs of the chillers, especially the
load control equipment.
Secondly, the extent of installing VSDs on the relevant equipment fans, especially the
BAC fans.
Thirdly, it will be eminent to investigate the potential to implement optimised load-shifting
refrigeration system control. With optimal chiller and auxiliaries schedules, the electricity
consumption can be reduced in the morning and evening peak periods. Thus further
investigation should include the capacity to which extent this can be achieved during the
peak periods.
It is presented that with the integration of various cooling systems and the combined water
reticulation, increased electrical savings potential can be realised. Therefore, the focus of this
study was to optimise the supply and demand of the refrigeration and cooling systems. It was
shown in this study that reduced chilled service water wastage underground theoretically
presents potential EE on both the dewatering and refrigeration system.
This could, however, not be confirmed with actual measured findings. Therefore, the combined
effect on the dewatering and surface refrigeration systems must be investigated when
optimising the chilled water demand and supply. This will justify the theoretical savings
presented in the proceeding discussed.

REFERENCES
References used and work sited during the dissertation.

Appendixes
123
Abdelaziz, E. A., Saidur, R. & Mekhilef, S. 2011. A review on energy saving strategies in
industrial sector. Renewable and Sustainable Energy Reviews:15, 150-168.
ASHRAE. 2001. Fundamentals Handbook. Atlanta: American Society of Heating,
Refrigeration and Air conditioning Engineers.
ASHRAE. 2002. Measurement of Energy and Demand Savings: Guideline 14. Atlanta:
American Society of Heating, Refrigeration and Air conditioning Engineers.
Bahnfleth, William. P. & Peyer, Eric. B. 2004. Variable primary flow chilled water systems:
potential benefits and application issues. Pennsylvania: Department of Architectural
Engineering.: Pennsylvania State University.
Bailey-McEwan, M. & Penman, J. C. 1987. An interactive computer program for simulating
the performance of water chilling installations on mines. Proceedings of the 20th international
symposium on the application of computers and mathematics in the mineral
industries, Johannesburg. 1:291-305.
Baxter, R. 2014. Platinum: State of the nation - PGMS in South Africa. Available from:
Chamber of Mines of South Africa, PO Box 61809, Marshalltown, 2107.
Borgnakke, Claus. & Sonntag, Richard. E. 2009. Fundamentals of Thermodynamics. 7th
Edition ed. Michigan: John Wiley & Sons.
Borgnakke, C. & Sonntag, R. E. 2009. Fundementals of Thermodynamics. 7th ed. New
Jersy: John Wiley and Sons.
BPMA. 2004. Variable speed driven pumps:best practise guide. Birmingham: British Pump
Manufactures' Association.
Calitz, Jan-Johan. 2006. Research and implementation of a load reduction system for a mine
refrigeration system. Pretoria: Faculty of Mechanical Engineering.: North-West
University. (Master's dissertation).
Carrier. 2005. Operation and aplication of variable frequency drive (VFD) technology. New
York: Carrier Coperation Syracuse.
Cawthorn, R. G. 2010. The Platinum Group Element Deposits of the Bushveld Complex in
South Africa. Platinum Metals Review, 54(4):205-215.

Appendixes
124
Chamber of Mines of South Africa. 2013. Annual Report 2012/13. Available from: Chamber
of Mines of South africa, PO Box 61809, Marshalltown, 2107.
Crowther, H. & Furlong, J. 2004. Optimising Chillers and Towers. AHRAE Journal, 46(7):34-
40.
De la Rue du Can, S., Letschert, V., Leventis, G., Covary, T. & Xia. 2013. Energy Efficiency
Country Study : Republic Of South Africa. Berkely: Environmental Energy Technologies
Division.: Lawrence Berkeley National Laboratory.
Den Heijer, W. 2009. The measurement and verification guideline for Energy Efficiency and
Demand-Side Management (EEDSM) projects and programmes. Available from: Eskom, PO
Box 1091, Johannesburg, 2000.
Du Plessis, G. E. 2013. A variable water flow strategy of energy savings in large cooling
systems. Pretoria: Faculty of Mechanical Engineering.: North-West University. (PhD thesis).
Du Plessis, G. E., Liebenberg, L. & Mathews, E. H. 2012. Case study: The effects of a
variable flow energy saving strategy on a deep-mine cooling system. Applied
Energy, 102:700-709.
Du Plessis, G. E., Liebenberg, L. & Mathews, E. H. 2013. The use of variable speed drives
for cost-effective energy savings in South African mine cooling systems. Applied
Energy, 111:16-27.
Du Plessis, G. E., Liebenberg, L., Mathews, E. H. & Du Plessis, J. N. 2013. A versatile
energy management system for large integrated cooling systems. Energy Conversion and
Management, 66:312-325.
Du Plessis, G. E., Liebenberg, L., Mathews, E. H. & Du Plessis, J. N. 2013. A versatile
energy management system for large integrated cooling systems. Energy Conversion and
Management, 66:312-325.
Energy Research Centre: University of Cape Town. 2004. Eskom's DSM programme offers
greater financial support to businesses and municipalities. Energy Management
News, 10(4) December. Available from: University of Cape Town, Private Bag, Rondebosch
7701.
Eskom. 2013. Integrated annual report. Available from: Eskom, PO Box 1091,
Johannesburg, 2000.

Appendixes
125
Eskom. 2013. Integrated interim report. Available from: Eskom, PO Box 1091,
Johannesburg, 2000.
Eskom Corporate Service Division. 2013. Measurement and Verification Baseline Report:
Dishaba Cooling Auxiliaries Project 2011229. Available from: Eskom Assurance and Forensic
Department, Megawatt Park,2 Maxwell Drive,Sandton, Johannesburg.
Eskom Demand Side Management Department. 2010. Eskom Mining Brochure. Available
from: Eskom, PO Box 1091, Johannesburg, 2000.
Eskom schedule of standard prices. 2014. Schedule of Standard Prices 2014/15 (Rev 00 1
April 2014). Available from: Eskom, PO Box 1091, Johannesburg, 2000.
Glaister, B. J. & Mudd, G. M. 2010. The environmental costs of platinum–PGM mining and
sustainability: Is the glass half-full or half-empty? Minerals Engineering, 23:438-450.
Gordon, J. M., Ng, K. C., Chua, H. T. & Lim, C. K. 2000. How varying condenser coolant flow
rate affects chiller performance: thermodynamic modeling and experimental
confirmation. Applied Thermal Engineering, 20:1149-1159.
Grein, A. & Pehnt, M. 2011. Load management for refrigeration systems: Potential and
barriers. Energy Policy, 39:5598-5608.
Gunderson, R. E. 1990. Hydro-power-extracting the coolth. Journal of the South African
Institute of Mining and Metallurgy, 90(5):103-109.
Gunson, A. J., Klein, B., Veiga, M. & Dunbar, S. 2012. Reducing mine water
requirements. Journal of Cleaner Production, 21:71-82.
Holman, Alistair. M. 2013. Benefits of improved performance monitoring of mine cooling
systems. Pretoria: Faculty of Mechanical Engineering.: North-West University. (Master's
dissertation).
Holman, A. M., Van Rensburg, J. & Arndt, D. 2013. Benefits of site specific simulation
models for asessing electrical energy saving potenial on mine cooling systems. (In
Proceedings: Industrial and commercial use of energy (ICUE) conference).
Howes, M. J. 1998. Encyclopaedia of Occupational Health and Safety: Industries and
occupations. 3 vols. Geneva: International Labour Organization.
Howes, M. J. 2011. Ventilation and Cooling in Underground Mines.

Appendixes
126
Hydro Power Equipment (Pty) Ltd. 2012. Equipment: Energy Saving
Solutions. http://www.hpesa.com.
Inglesi-Lotz, R. & Blignaut, J. N. 2011. South Africa’s electricity consumption: A sectoral
decomposition analysis. Applied Energy, 128:4780. J.
Jansen van Vuuren, S. P. 1983. A thermal storage system for surface refrigeration
plants. Journal of the Mine Ventilation Society, 36:45-52.
Karsten, M. & Mackay, L. 2012. Underground environmental challenges in deep platinum
mining and some suggested solutions. The Southern African Institute of Mining and
Metallurgy:177-192.
Kissock, J. K. & Eger, C. 2008. Measure industrial energy savings. Applied
Energy, 85(5):347-361.
Kröger, D. G. 1998. Air-cooled heat exhangers and cooling towers: Thermal-flow
performance evaluation and design. Faculty of Mechanical Engineering: University of
Stellenbosch.
Le Roux, W. L. 1990. Notes on mine ventilation control. 4 ed. Johannesburg: Mine
Ventilation Society of South Africa.
Mackay, L., Bluhm, S. & Van Rensburg, J. 2010. Refrigeration and cooling concepts for ultra-
deep platinum mining. The Southern African Institute of Mining and Metallurgy.
Marè, P., Marais, J. H. & Kriel, C. J R. 2014. Reducing energy consumption of mine cooling
systems by controlling chilled water demand of mobile cooling units.
Maric Flow Control. 2011. Maric Flow Control Valves Product Data - Screwed Valve
Bodies. Available from: Ultra Control Valves, PO Box 3604, Edenvale, Johannesburg, 1610.
Marx, W. M. 1990. Providing acceptable working environment in ultra-deep mines. Journal of
the Mine ventilation Society of South Africa.
McPherson, Malcolm. J. 1993. Subsurface ventilation and environmental
engineering. London: Chapman and Hall.
McQuay International. 2005. WSC/WDC-4 Centrifugal Compressor Water Chiller
Catalogue. Available from: http://www.mcquay.com, Date of access: 25 June. 2014.

Appendixes
127
Mecrow, B. C. & Jack, A. G. 2008. Efficiency trends in electric machines and drives. Energy
Policy, 36:4336-4341.
Mudd, G. M. 2012. Key trends in the resource sustainability of platinum group elements. Ore
Geology Reviews, 46:106-117.
Navarro-Esbrì, J., Ginestar, D., Belman, J. M., Miliàn, V. & Verdu, G. 2010. Application of a
lumped model for predicting energy performance of a variable-speed vapour compression
system. Applied Thermal Energy, 30:286-294.
Nixon, C. A., Gillies, A. D.S. & Howes, M. J. 1992. Analysis of heat sources in a large
mechanised development. (In Proceedings of the 5th International Mine Ventilation
Congress).
Ozdemir, E. 2004. Energy conservation oppertunities with a variable speed controller in a
boiler house. Applied Thermal Engineering, 24(7):981-993.
Pelzer, R., Mathews, E. H., Le Roux, D. F. & Kleingeld, M. 2007. A new approach to ensure
successful implementation of sustainable demand side management (DSM) in South African
mines. Energy journal, 33:1254-1263.
Qureshi, T. Q. & Tassou, S. A. 1996. Variable-spee capacity control in refrigeration
systems. Applied Thermal Energy, 16(2):103-113.
Rawlins, C. 2007. Mine cooling and insulation of chilled water transport pipes. Journal of the
South African Institute of Mining and Metallurgy, 107(10).
Romero, J. A., Navarro-Esbrì, J. & Belman-Flores, J. M. 2011. A simplified black-box model
oriented to chilled water temperature control in a variable speed vapour compression
system. Applied Thermal Engineering, 31:329-335.
Russell, C. 2014. Producers reach agreement with AMCU. Available from: Russell and
Associates, PO Box 1457, Parklands 2121, Johannesburg.
Saidur, R. 2010. A review on electrical motors energy use and energy savings. Renewable
and Sustainable Energy Reviews, 14(3):887-898.
Saidur, R., Mekhilef, S., Ali, M. B., Safari, A. & Mohammed, H. A. 2012. Applications of
variable speed drive (VSD) in electrical motors energy savings. Renewable and Sustainable
Energy Reviews, 16:543-550.

Appendixes
128
Saidur, R., Rahim, N. & Hasanuzzaman, M. 2010. A review on compressed-air energy use
and energy savings. Renewable and Sustainable Energy Reviews, 14:1135-1153.
Sayers, A. T. 1990. Hydraulic and compressible flow turbomachines. Cape Town: Faculty of
Mechanical Engineering.:University of Cape Town.
Schutte, A. J. 2007. Demand-Side energy management of a cascade mine surface
refrigeration system. Pretoria: Faculty of Mechanical Engineering.: North-West
University. (Master's dissertation).
Schutte, A. J., Pelzer, R. & Kleingeld, M. 2008. Demand-side management of a cascade
mine surface refrigeration system.
Sebitosi, A. B. 2008. Energy efficiency, security of supply and the environment in South
Africa: Moving beyond the strategy documents. Energy, 33(11):1591-1596.
Singh, V. 2008. DSM Strategy Overview - ESLC Update. Available from: Eskom, PO Box
1091, Johannesburg, 2000. Date of access: 12 May. 2014.
Swart, C. 2003. Optimising the operations of underground mine refrigeration plants and
ventilation fans for minimum electricity cost. Pretoria: Faculty of Mechanical Engineering.:
North-West University. (PhD thesis).
Thein, S. 2007. Demand Side Management on an Intricate Multi-Shaft Pumping System from
a Single Point of Control. Pretoria: Faculty of Electrical Engineering.: North-West
University. (Master's dissertation).
Thirugnanasambandam, M., Hasanuzzaman, M., Saidur, R., Ali, M. B., Rajakarunakaran, S.,
Devaraj, D. & Rahim, N. A. 2011. Analysis of electrical motors load actors and energy
savings in an Indian cement industry. Energy, 36:4307-4314.
US Department of Energy. 1996. Measurement and verification guidelines for federal energy
projects. http://www.eia.doe.gov Date of access: 2 Oct. 2014.
Van der Bijl, J. 2007. Sustainable DSM on deep mine refrigeration systems - a noval
approach. Pretoria: Faculty of Mechanical Engineering.: North-West University. (PhD thesis).
Van der Walt, J. 1979. Engineering of refrigeration installations for cooling mine. Journal of
South African Mechanical Engineering, 29(10):360-372.

Appendixes
129
Van der Walt, J. & De Kock, E. M. 1984. Developments in the engineering of refrigeration
installations for cooling mines. International Journal of Refrigeration, 7(1):27-40.
Van der Walt, J. & Whillier, A. 1978. Considerations in the design of integrated systems for
distributing refrigeration in deep mines. Journal of the South African Institute of Minerals and
Metallurgy:109-124.
Van der Zee, L. 2013. Modelling of electricity cost risks and opportunities in the gold mining
industry. Pretoria: Faculty of Electronic Engineering.: North-West University. (PhD thesis).
Van Eldik, M. 2006. An investigation into the DSM and energy-efficiency potential of a
modular underground air cooling unit applied in the South African mining
industry. Potchefstroom: Faculty of Mechanical Engineering.: North-West
University. (Master's dissertation).
Van Greunen, D. 2014. Energy efficiency through varaible speed drive control on a
cascading mine cooling system. Pretoria: Faculty of Mechanical Engineering.: North-West
University. (Master's dissertation).
Venter. 2007. Miners dig to record depht to find more gold. Mining Weekly, Available from:
Creamer Medias, PO Box 75316, Garden View, South Africa, 2047.
Vosloo, J. C. 2008. A new minimum cost model for water reticulation systems on deep
mines. Pretoria: Faculty of Mechanical Engineering.: North-West University. (PhD thesis).
Vosloo, J., Liebenberg, L. & Velleman, D. 2012. Case study: Energy savings for a deep-mine
water reticulation system. Applied Energy, 92:328-335.
Vosloo, J., Van Rensburg, J. & Botha, A. 2010. Optimising the demand of a mine water
reticulation system to reduce electricity consumption. (In Proceedings: Industrial and
commercial use of energy (ICUE) conference. Cape Town).
Wannenburg, J., Booysen, W., Kleingeld, M. & Mathews, E. H. 2009. Measuring the actual
impact of DSM projects. (In Proceedings: Industrial and commercial use of energy (ICUE)
conference. Cape Town).
Whillier, A. 1980. Refrigeration applied in the cooling of mines. International Journal of
Refrigeration, 3(6):341-345.

Appendixes
130
Whillier, A. & Van der Walt, J. 1977. Grafity-fed water systems in mines. Journal of the South
African Institute of Mining and Metallurgy:187-192.
Widell, K. N. & Eikevik, T. 2010. Reducing power consumption in multi-compressor cooling
systems. International Journal of Refrigeration, 33:88-94.
Xia, X. & Zhang, J. Z. 2012. Energy Efficiency Measurement and Verification
Practices. Cape Town: Media in Africa.
Yu, F. W. & Chan, K. T. 2008. Improved energy performance of air cooled centrifugal chillers
with variable chilled water flow. Energy Conversion & Management, 49:1595-1611.
Yu, F. W. & Chan, K. T. 2012. Assessment of operating performances of chiller systems
using cluster analysis. International Journal of Thermal Science, 53:148-155.
Yu, F. W. & Chan, K. T. 2013. Economic benefits of optimal control for water-cooled chiller
systems serving hotels in a subtropical climate. Energy and Buildings, 42(2):203-209.
Zehir, M. A. & Bargriyanik, M. 2012. Demand Side Management by controlling refrigerators
and its effects on consumers. Energy Conversion and Management, 64:238-244.
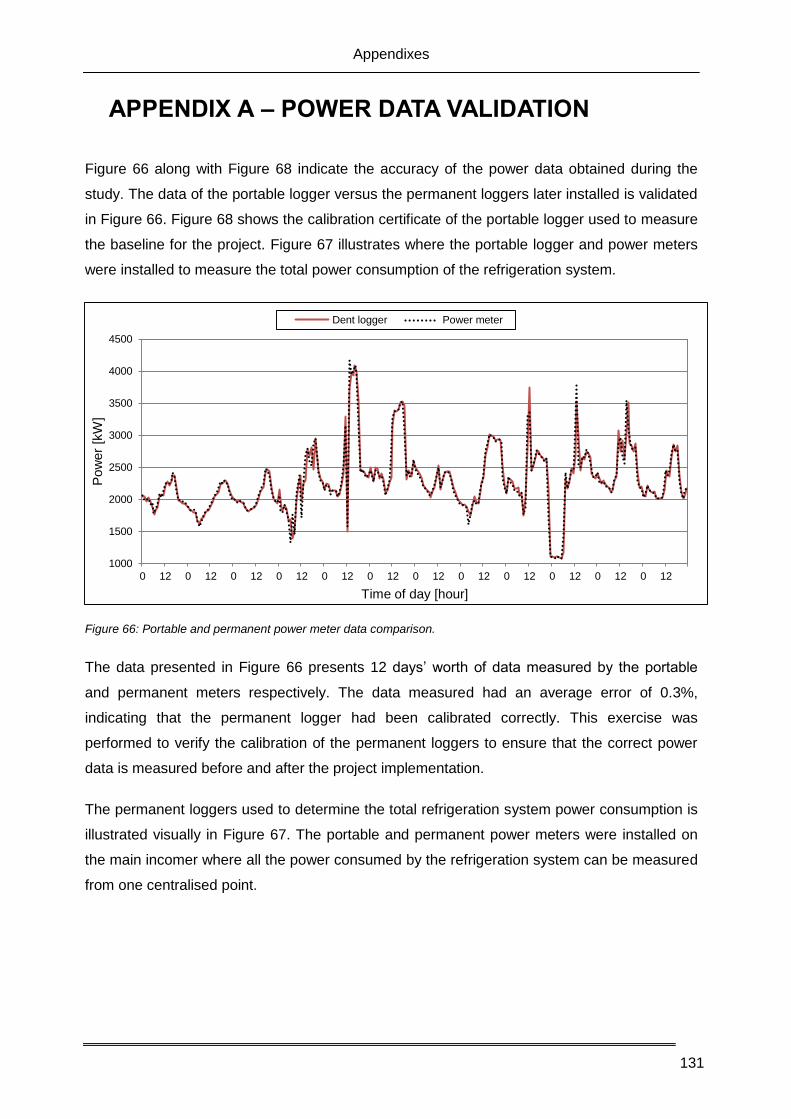
Appendixes
131
APPENDIX A – POWER DATA VALIDATION
Figure 66 along with Figure 68 indicate the accuracy of the power data obtained during the
study. The data of the portable logger versus the permanent loggers later installed is validated
in Figure 66. Figure 68 shows the calibration certificate of the portable logger used to measure
the baseline for the project. Figure 67 illustrates where the portable logger and power meters
were installed to measure the total power consumption of the refrigeration system.
Figure 66: Portable and permanent power meter data comparison.
The data presented in Figure 66 presents 12 days’ worth of data measured by the portable
and permanent meters respectively. The data measured had an average error of 0.3%,
indicating that the permanent logger had been calibrated correctly. This exercise was
performed to verify the calibration of the permanent loggers to ensure that the correct power
data is measured before and after the project implementation.
The permanent loggers used to determine the total refrigeration system power consumption is
illustrated visually in Figure 67. The portable and permanent power meters were installed on
the main incomer where all the power consumed by the refrigeration system can be measured
from one centralised point.
1000
1500
2000
2500
3000
3500
4000
4500
0 12 0 12 0 12 0 12 0 12 0 12 0 12 0 12 0 12 0 12 0 12 0 12
Pow
er
[kW
]
Time of day [hour]
Dent logger Power meter

Appendixes
132
HT SUB
Main Incomers
LT SUB
MCC Substation
Sp
are
11 000 V
525 V
SCADA
Dent
Logger
11 000 V
Electrical panel
Chiller machines
Electric cable
Communication cable
Dent
Logger Portable power loggerPM Permanent power meter
PM
Figure 67: Illustration of Dent logger and power meter installation.

Appendixes
133
Figure 68: Main incomer Dent logger calibration sheet.

Appendixes
134
APPENDIX B – HPE 3-WAY VALVE PROCESS AND
POSIBLE SAVING
HPE CC valve system operation
As mentioned in Chapter 2 the mechanical HPE CC valve system ensures a constant flow
through a CC irrespective of the flow demand used for downstream operations. If the demand
from downstream operations is more than the CC flow requirement, the water will be directed
back into the main service water supply line, assuming that the supply line pressure is within
the design range of the valve. This is illustrated graphically in Figure 69.
CCs have a chilled water design flow rate of about 7 ℓ/s that is required through the compact
heat exchanger for optimal cooling. As a result of the relative high water flow and inefficiencies
experienced in the heat transfer rate between the water and air in the compact heat
exchanger, the water can be used again for further downstream cooling operations.
Cold air out
From shaft
stationWater required
by stoping area
Main chill
water supply
Fan
Compact heat exchanger
Warm air in
CC water
supply required
Warm water
dumped into
a trench
Mechanical
3-way valve
10 [ℓ/s]
7 [ℓ/s]
0 [ℓ/s] CC return water
to main supply
7 [ℓ/s]
Figure 69: HPE CC valve high flow illustration
This is typically the case with mine drilling shifts where the downstream water usage is higher
than the water required by the CC. This is when water is used in the stope to cool drilling
equipment. Figure 70 illustrates the different mining schedules during a 24-hour period and the
different TOU billing schedules of Eskom.

Appendixes
135
Figure 70: Megaflex tariff structure vs. mining schedule (Transmission zone <300 km and voltage >500V & < 66kV
(Eskom schedule of standard prices, 2014)
The valve will reduce water wastage by only dumping water when the downstream demand
from operations is less than the flow required through the CC. As a result, water will only be
dumped in the sweeping and blasting shifts. This is illustrated in Figure 71, where the
downstream pressure is assumed to be 3 ℓ/s. This will result in the valve only dumping the
difference between the downstream flow and CC flow requirement.
Cold air out
From shaft
stationWater required
by stoping area
Main chill
water supply
Fan
Compact heat exchanger
Warm air in
CC water
supply required
Warm water
dumped into
a trench
Mechanical
3-way valve
3 [ℓ/s]
7 [ℓ/s]
4 [ℓ/s] CC return water
to main supply
7 [ℓ/s]
Figure 71: HPE CC valve low flow illustration
0
20
40
60
80
100
120
140
160
180
200
220
Active e
nerg
y c
harg
e [
c/k
Wh]
Time of day [hour]
Low demand season [Sept - May] Low demand season average
High demand season [Jun - Aug] High demand season average
Off-peak
Off-peak
Standard
Standard
Standard
Peak Peak
Sweeping shift
Drilling shift
Sweeping shift
Blasting shift

Appendixes
136
HPE CC valve system saving calculations
The theoretical savings achievable from a HPE valve will be calculated below with the
following assumptions:
Assume a mine uses 4 CC throughout the year.
CC each consumes a constant flow of 7 ℓ/s.
365 days per year.
168 hours per week.
24 hours in a week.
CC downstream flow rises during production periods is more than 7 ℓ/s. During this
time, the CC will use production water without dumping to the mining trenches.
The flow raise is experienced for 5 days a week and 8 hours per day (drilling shift).
Downstream flow during non-production period is 3 ℓ/s. This flow can be a result of pipe
leaks and the sweeping shift consuming water.
The water consumed per CC can be calculated as follows:
𝑊𝑎𝑡𝑒𝑟 𝑐𝑜𝑛𝑠𝑢𝑚𝑒𝑑 𝑝𝑒𝑟 𝐶𝐶 = 7 [ℓ/𝑠] ×365
12 [𝑑𝑎𝑦𝑠/𝑚𝑜𝑛𝑡ℎ] × 24 [ℎ𝑜𝑢𝑟𝑠/𝑑𝑎𝑦] × 3600 [𝑠/ℎ]
= 18.4 [Mℓ/month]
The hour per week a CC will use and not dump water is calculated as follows:
𝐻𝑜𝑢𝑟𝑠 𝐶𝐶 𝑖𝑠 𝑛𝑜𝑡 𝑑𝑢𝑚𝑝𝑖𝑛𝑔 𝑤𝑎𝑡𝑒𝑟 = 5 × 8
= 40 [h/week]
Therefore, the hours per week the CC will dump 3 ℓ/s water is:
𝐻𝑜𝑢𝑟𝑠 𝐶𝐶 𝑖𝑠 𝑑𝑢𝑚𝑝𝑖𝑛𝑔 𝑤𝑎𝑡𝑒𝑟 = 168 − 40
= 128 [h/week]
Now the mean flow each CC will dump per month is:
𝑀𝑒𝑎𝑛 𝑓𝑙𝑜𝑤 𝑝𝑒𝑟 𝐶𝐶 = (0 × 40 + (7 − 3) × 128)/168
= 3.05 [ℓ/s]
= 6 [Mℓ/month]
If there was no intervention with the valve, each CC would have dumped 18.4 Mℓ /month. With
the valve, only 6 Mℓ /month is dumped, therefore resulting in a saving of:

Appendixes
137
𝐻𝑃𝐸 𝑣𝑎𝑙𝑣𝑒 𝑠𝑎𝑣𝑖𝑛𝑔 𝑝𝑒𝑟 𝐶𝐶 = 18.4 − 6
= 12.4 [𝑀ℓ 𝑚𝑜𝑛𝑡ℎ⁄ ]
= 4.7 [ℓ 𝑠⁄ ]
= 4.7 × 10⁻³ [m3 𝑠⁄ ]
= 17 [m3 ℎ⁄ ]
And,
Reduction in water wastage = 12.4/18.4
= 67 %
Cost savings
The theoretical power consumption that is expected from a pumping system, related to the
static head and the delivered flow, can be calculated from the equation below (Van der Zee,
2013).
𝑃𝑇ℎ𝑒𝑜𝑟𝑒𝑡𝑖𝑐𝑎𝑙 =𝑄×𝜌×𝑔×ℎ
3.6×10³ (B.1)
where,
PTheoretical = Theoretical pumping system energy [kW]
𝑄 = Flow rate [ℓ/s]
�̇� = Mass flow [m3/h]
𝜌 = Density of the fluid [kg/m3]
𝑔 = Gravity acceleration constant [m/s2]
From this equation, the theoretical cost saving relating to the pumps can be calculated with the
realised reduced flow rate.
𝐻𝑃𝐸 𝑣𝑎𝑙𝑣𝑒 𝑝𝑢𝑚𝑝 𝑐𝑜𝑠𝑡 𝑠𝑎𝑣𝑖𝑛𝑔 𝑝𝑒𝑟 𝐶𝐶 =17.64 × 999.97 × 9.81 × 1200
3600
= 57.7 [kWh]
This will result in an EE of 230 kWh on the pumping system when installed on all four mine
CCs. A daily average summer weekday saving of R2 630 and a winter weekday saving of
R4 840, therefore, can be expected. This will lead to an annual average weekday saving of
R793 773. All cost savings are calculated according to the Eskom 2014/2015 Megaflex tariff
structure (Eskom schedule of standard prices, 2014).

Appendixes
138
APPENDIX C – SIMULATION
Figure 72: Verification and baseline simulation model.
Figure 73: Proposed savings simulation model with VSD control.
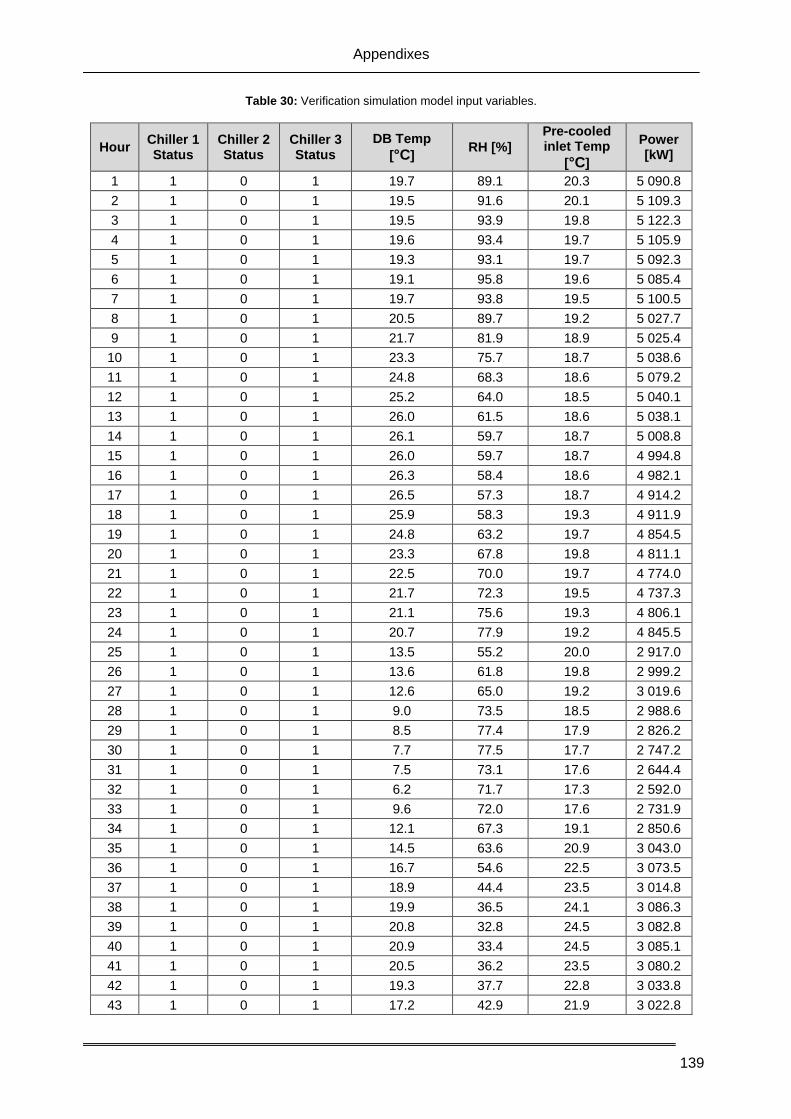
Appendixes
139
Table 30: Verification simulation model input variables.
Hour Chiller 1 Status
Chiller 2 Status
Chiller 3 Status
DB Temp
[°C] RH [%]
Pre-cooled inlet Temp
[°C]
Power [kW]
1 1 0 1 19.7 89.1 20.3 5 090.8
2 1 0 1 19.5 91.6 20.1 5 109.3
3 1 0 1 19.5 93.9 19.8 5 122.3
4 1 0 1 19.6 93.4 19.7 5 105.9
5 1 0 1 19.3 93.1 19.7 5 092.3
6 1 0 1 19.1 95.8 19.6 5 085.4
7 1 0 1 19.7 93.8 19.5 5 100.5
8 1 0 1 20.5 89.7 19.2 5 027.7
9 1 0 1 21.7 81.9 18.9 5 025.4
10 1 0 1 23.3 75.7 18.7 5 038.6
11 1 0 1 24.8 68.3 18.6 5 079.2
12 1 0 1 25.2 64.0 18.5 5 040.1
13 1 0 1 26.0 61.5 18.6 5 038.1
14 1 0 1 26.1 59.7 18.7 5 008.8
15 1 0 1 26.0 59.7 18.7 4 994.8
16 1 0 1 26.3 58.4 18.6 4 982.1
17 1 0 1 26.5 57.3 18.7 4 914.2
18 1 0 1 25.9 58.3 19.3 4 911.9
19 1 0 1 24.8 63.2 19.7 4 854.5
20 1 0 1 23.3 67.8 19.8 4 811.1
21 1 0 1 22.5 70.0 19.7 4 774.0
22 1 0 1 21.7 72.3 19.5 4 737.3
23 1 0 1 21.1 75.6 19.3 4 806.1
24 1 0 1 20.7 77.9 19.2 4 845.5
25 1 0 1 13.5 55.2 20.0 2 917.0
26 1 0 1 13.6 61.8 19.8 2 999.2
27 1 0 1 12.6 65.0 19.2 3 019.6
28 1 0 1 9.0 73.5 18.5 2 988.6
29 1 0 1 8.5 77.4 17.9 2 826.2
30 1 0 1 7.7 77.5 17.7 2 747.2
31 1 0 1 7.5 73.1 17.6 2 644.4
32 1 0 1 6.2 71.7 17.3 2 592.0
33 1 0 1 9.6 72.0 17.6 2 731.9
34 1 0 1 12.1 67.3 19.1 2 850.6
35 1 0 1 14.5 63.6 20.9 3 043.0
36 1 0 1 16.7 54.6 22.5 3 073.5
37 1 0 1 18.9 44.4 23.5 3 014.8
38 1 0 1 19.9 36.5 24.1 3 086.3
39 1 0 1 20.8 32.8 24.5 3 082.8
40 1 0 1 20.9 33.4 24.5 3 085.1
41 1 0 1 20.5 36.2 23.5 3 080.2
42 1 0 1 19.3 37.7 22.8 3 033.8
43 1 0 1 17.2 42.9 21.9 3 022.8

Appendixes
140
44 1 0 1 15.9 47.6 20.7 3 012.4
45 1 0 1 15.3 50.3 20.0 2 910.3
46 1 0 1 15.2 50.3 20.6 2 920.2
47 1 0 1 14.8 52.2 21.1 3 009.7
48 1 0 1 13.9 56.4 20.5 3 005.9

Appendixes
141
APPENDIX D – ADDITIONAL RESULTS
Figure 74: Average performance achieved as function of average ambient temperature for July 2014.
Figure 75: Average performance achieved as function of average ambient temperature for August 2014.
0
5
10
15
20
0
1
2
3
4
Tem
pera
ture
[°C
]
Pow
er
[MW
]
Day of month
Weekday saving Weekend saving Ambient temperature
0
5
10
15
20
0
1
2
3
4
Tem
pera
ture
[°C
]
Pow
er
[MW
]
Day of month
Weekday saving Weekend saving Ambient temperature

Appendixes
142
Figure 76: Average performance achieved as function of average ambient temperature for September 2014.
0
7
14
21
28
0
1
2
3
4
Tem
pera
ture
[°C
]
Pow
er
[MW
]
Day of month
Weekday saving Weekend saving Ambient temperature

Appendixes
143
APPENDIX E – ADDITIONAL IMAGES
Figure 77: EMS print screen – evaporator and BAC water network and respective VSD controllers
Figure 78: EMS print screen – condenser water network and VSD controller

Appendixes
144
Figure 79: EMS print screen – data logging, trending and power meter
Figure 80: VSD installed on the evaporator pumps.

Appendixes
145
Figure 81: VSDs installed on the BAC spray pumps.
Related Documents