OPTIMAL SIZING OF A COUNTERFLOW COOLER FOR FEED PELLETS By: STEVEN LITTLETON FOWLER B.S. Biosystems Engineering Oklahoma State University Stillwater, Oklahoma 2004 Submitted to the Faculty of the Graduate College of the Oklahoma State University in partial fulfillment of the requirements for the Degree of MASTER OF SCIENCE July, 2008 CORE Metadata, citation and similar papers at core.ac.uk Provided by SHAREOK repository

Welcome message from author
This document is posted to help you gain knowledge. Please leave a comment to let me know what you think about it! Share it to your friends and learn new things together.
Transcript
OPTIMAL SIZING OF A COUNTERFLOW
COOLER FOR FEED PELLETS
By:
STEVEN LITTLETON FOWLER
B.S. Biosystems Engineering
Oklahoma State University
Stillwater, Oklahoma
2004
Submitted to the Faculty of the Graduate College of the
Oklahoma State University in partial fulfillment of the requirements for
the Degree of MASTER OF SCIENCE
July, 2008
CORE Metadata, citation and similar papers at core.ac.uk
Provided by SHAREOK repository
ii
OPTIMAL SIZING OF A COUNTERFLOW
COOLER FOR FEED PELLETS
Thesis Approved:
Dr. Timothy Bowser
Thesis Adviser
Dr. Danielle Bellmer
Dr. Ray Huhnke
Dr. A. Gordon Emslie
Dean of the Graduate College
iii
Acknowledgments
The author would like to thank the following people: his advisor, Dr. Tim
Bowser, for his help, support, and patience during the duration of the project, the
members of the author’s graduate committee, Drs Raymond Huhnke and Danielle
Bellmer for their input and recommendations as the author progressed through
development of the model included in this research, the personnel currently and formerly
employed at Bliss Industries that assisted the author throughout this research, Dr. John te
Velde and Miss Carla Beckmann for their assistance in translating a research article
originally published in German, and the author’s family and fiancé for their invaluable
support, assistance, and patience.
iv
Table of Contents Chapter Page
1) Introduction .................................................................................................................... 1
2) Objectives ....................................................................................................................... 5
3) Literature Review ........................................................................................................... 6
3.1) Livestock Feed......................................................................................................... 6
3.2) The Pelleting Process .............................................................................................. 7
3.3) Mathematical and Computer Models .................................................................... 12
4) The Computer Model.................................................................................................... 15
5) Debugging the Model ................................................................................................... 32
5.1) Stabilizing the Model ............................................................................................ 32
5.2) Calibrating the Model............................................................................................ 33
5.3) Validating the Model............................................................................................. 43
6) Conclusions .................................................................................................................. 44
7) Recommendations ........................................................................................................ 46
References......................................................................................................................... 47
Appendix A....................................................................................................................... 49
Appendix B ....................................................................................................................... 51
Appendix C ....................................................................................................................... 57
v
List of Tables Table Page
Table A – 1 ........................................................................................................................49 Table A – 2 ........................................................................................................................49 Table A – 3 ........................................................................................................................50
vi
List of Figures Figure Page
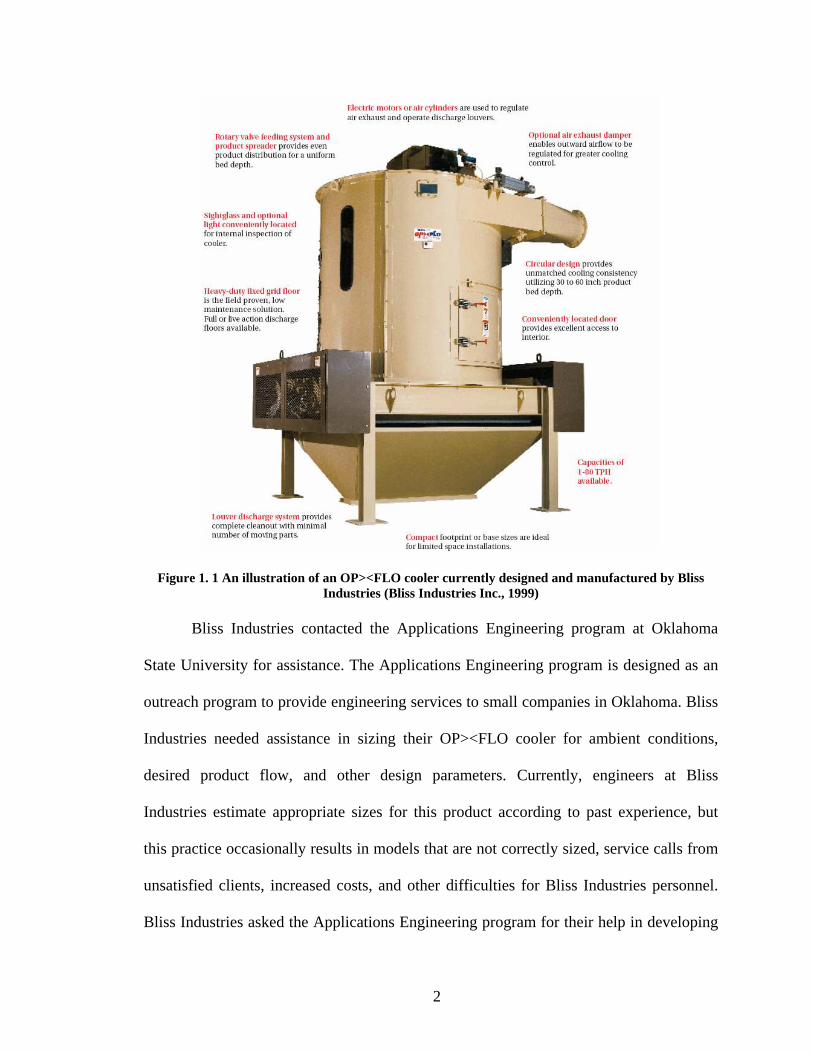
Figure 1. 1 An illustration of an OP><FLO cooler currently designed and manufactured by Bliss Industries (Bliss Industries Inc., 1999) ........................ 2
Figure 2. 1 The four major grain drying methods (Brooker et al. 1992) ............................ 9 Figure 2. 2 Cross Flow methods of grain and pellet drying and cooling.......................... 10 Figure 2. 3 A cross sectional representation of an operating OP><FLO cooler
which incorporates a counter flow design (Bliss Industries Inc., 1999)......... 12 Figure 4. 1 A comparison of sorption isotherms of livestock feed pellets and
equilibrium moisture content equations (Maier, 1988)................................... 24 Figure 4. 2 Flow Schematic of the Model Program.......................................................... 30 Figure 5. 1 Final moisture content for various drying coefficients and different
ambient temperatures................................................................................... 35 Figure 5. 2 Final moisture content for various drying coefficients and different
ambient humidity conditions........................................................................ 36 Figure 5. 3 Final moisture content for various drying coefficients and different
bed depth values........................................................................................... 36 Figure 5. 4 Final moisture content for various drying coefficients and different
cooler diameters........................................................................................... 37 Figure 5. 5 Final moisture content for various drying coefficients and different
pellet diameters ............................................................................................ 37 Figure 5. 6 Final moisture content for various drying coefficients and different
pellet lengths ................................................................................................ 38 Figure 5. 7 Final moisture content for various drying coefficients and different
pellet flow rates............................................................................................ 38
vii
Figure 5. 8 Final moisture content for various drying coefficients and different air flow rates ................................................................................................ 39
Figure 5. 9 Final moisture content for various drying coefficients and different
initial pellet temperatures............................................................................. 39 Figure 5. 10 Final moisture content for various drying coefficients and different
initial pellet moisture contents..................................................................... 40 Figure 5. 11 Estimated cooler profiles using data from Table A – 2, an ambient
temperature of 85 oF (29.4 oC), an initial relative humidity of 49%, and a total airflow rate of 6000 CFM........................................................... 42
Figure 5. 12 Estimated cooler profiles using data from Table A – 2, an ambient
temperature of 85 oF (29.4 oC), an initial relative humidity of 49%, and a total airflow rate of 9700 CFM........................................................... 42
Figure B - 1 ...................................................................................................................... 51 Figure B - 2 ...................................................................................................................... 52 Figure B - 3 ...................................................................................................................... 52 Figure B - 4 ...................................................................................................................... 53 Figure B - 5 ...................................................................................................................... 53 Figure B - 6 ...................................................................................................................... 54 Figure B - 7 ...................................................................................................................... 54 Figure B - 8 ...................................................................................................................... 55 Figure B - 9 ...................................................................................................................... 55 Figure B - 10 ..................................................................................................................... 56
viii
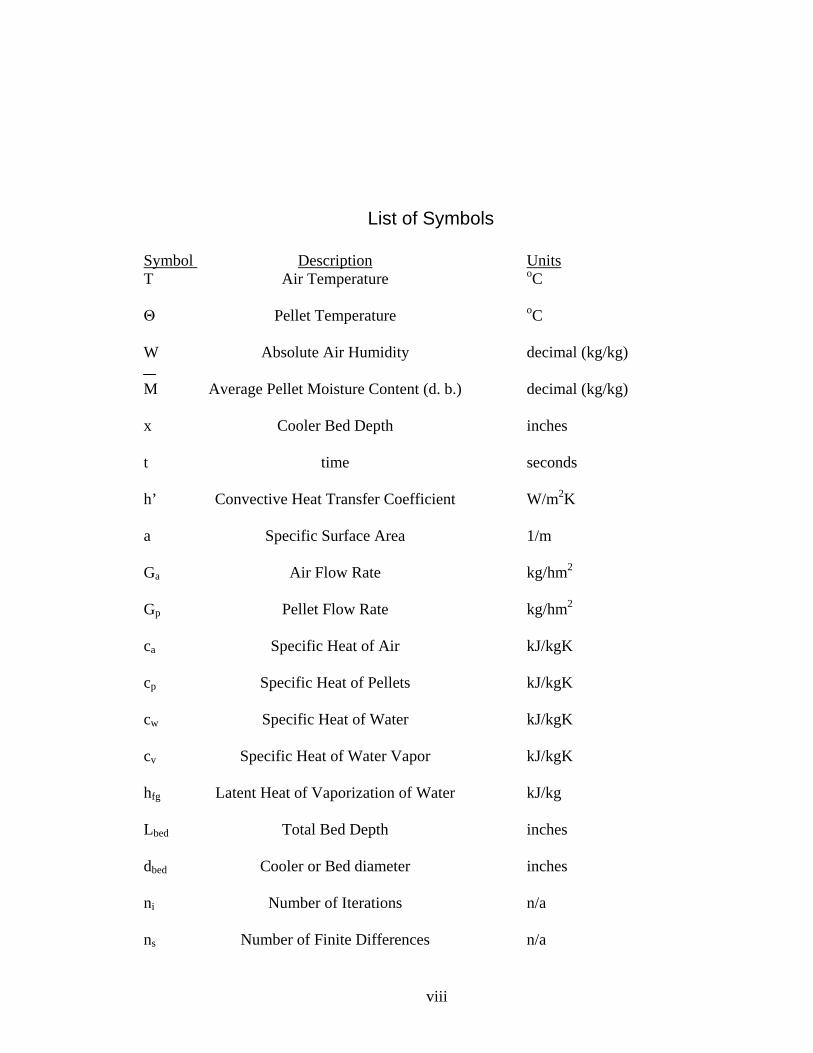
List of Symbols Symbol Description Units T Air Temperature oC
Θ Pellet Temperature oC
W Absolute Air Humidity decimal (kg/kg)
M Average Pellet Moisture Content (d. b.) decimal (kg/kg)
x Cooler Bed Depth inches
t time seconds
h’ Convective Heat Transfer Coefficient W/m2K
a Specific Surface Area 1/m
Ga Air Flow Rate kg/hm2
Gp Pellet Flow Rate kg/hm2
ca Specific Heat of Air kJ/kgK
cp Specific Heat of Pellets kJ/kgK
cw Specific Heat of Water kJ/kgK
cv Specific Heat of Water Vapor kJ/kgK
hfg Latent Heat of Vaporization of Water kJ/kg
Lbed Total Bed Depth inches
dbed Cooler or Bed diameter inches
ni Number of Iterations n/a
ns Number of Finite Differences n/a
ix
Symbol Description Units Meq Moisture Equilibrium Content (d. b.) decimal (kg/kg)
D Diffusivity m2/s
F Linearization Factor s/in
rh Relative Humidity decimal
Pv Vapor Pressure N/m2
Ps Saturation Pressure N/m2
Rv Ideal Gas Constant for Water J/kg K
µa Air Viscosity kg/m s
ρb Bulk Density kg/m3
ρp Pellet Density kg/m3
dp Pellet Diameter inches
Lp Pellet Length inches
rp Pellet Radius inches
1
1) Introduction
Bliss Industries Inc. currently manufactures and sells a product they call
OP><FLO coolers, shown in Figure 1. 1. The OP><FLO coolers use a counter flow
process to cool and dry livestock feed pellets immediately after they have been extruded.
Warm, high moisture content pellets enter the cooler from above while ambient air is
pulled into the cooler from below. The ambient air is gradually warmed as it moves up
through the falling product stream. Therefore, when the product enters the cooling
chamber it is exposed to the warmest air in the cooler that has the highest moisture
carrying capacity. The product is then exposed to gradually cooler air as it makes its way
down the cooler. (Bliss Industries Inc., 1999).
2
Figure 1. 1 An illustration of an OP><FLO cooler currently designed and manufactured by Bliss Industries (Bliss Industries Inc., 1999)
Bliss Industries contacted the Applications Engineering program at Oklahoma
State University for assistance. The Applications Engineering program is designed as an
outreach program to provide engineering services to small companies in Oklahoma. Bliss
Industries needed assistance in sizing their OP><FLO cooler for ambient conditions,
desired product flow, and other design parameters. Currently, engineers at Bliss
Industries estimate appropriate sizes for this product according to past experience, but
this practice occasionally results in models that are not correctly sized, service calls from
unsatisfied clients, increased costs, and other difficulties for Bliss Industries personnel.
Bliss Industries asked the Applications Engineering program for their help in developing
3
a system to more effectively determine an appropriate size of an OP><FLO cooler for
particular installations.
The Applications Engineer, Mr. Clay Buford, contacted the author’s advisor, Dr.
Tim Bowser, for help in developing an OP><FLO cooler sizing system. The need for
such a system was then presented to the author as a potential topic of research. The
author’s interest in computer programming, mathematics, and the livestock and feed
industries made the decision to pursue this research a simple one.
Dr. Bowser, Mr. Buford, and the author traveled to Bliss Industries on October 6,
2005 and met with Bliss Industries engineers, Patrick Hensley and David Holt, and
owner, Bill Bliss. The need for better tools to help optimally size OP><FLO coolers was
the main topic of discussion. Bliss Industries had not been able to allocate the time and
resources necessary to develop such tools and has requested assistance in this matter. The
author agreed to develop a tool to help Bliss Industries determine the optimal size of an
OP><FLO cooler.
Mathematically describing what occurs in the OP><FLO cooler and how ambient
conditions affect the cooler’s operation would be beneficial to Bliss Industries when
determining the appropriate cooler size for a client. Estimates of the moisture and
temperature profiles of air and pellets inside a cooler would assist Bliss Industries in
determining the ability of a cooler to meet the final moisture content and temperature
specifications of a client. Development of a model to estimate the heat and moisture
transfer that occurs in an OP><FLO cooler would likely involve gradients with respect to
multiple parameters. A computer program or model to estimate an appropriate cooler size
4
based on ambient conditions of operation, type of product being cooled and conditioned,
and desired production capacity would meet the needs of Bliss Industries.
In this research the author has combined the efforts of other engineers, modern
computer processing capability, simple numerical integration techniques, and easily
accessible software to develop a tool to meet the needs of Bliss Industries. This research
uses models developed to describe the cooling and drying of grains which have been
modified to describe feed pellets. Using these models, the author has developed and
tested a system that can be used to estimate the temperature and moisture profiles for feed
pellets in an OP><FLO cooler with any given cooler diameter, bed depth, pellet size, air
flow, product capacity, input temperature, input moisture content, and ambient
conditions.
5
2) Objectives
The primary objective of this research is to develop a tool that will help Bliss
Industries determine the appropriate size for an OP><FLO cooler based on ambient
conditions of operation, products to be conditioned (livestock feed pellets ranging from
11/64” to 3/4” in diameter), and desired production measured in tons of product per hour.
The tool must be useful, inexpensive, and easily accessible for Bliss Industries. The other
main objective of this research is to validate the ability of the tool to accurately describe
the cooling process of feed pellets using data from current OP><FLO cooler installations.
6
3) Literature Review
3.1) Livestock Feed
The feeding of livestock is a large and diverse industry in the United States and
worldwide. On average, about 250 million tons of materials are fed to livestock animals
each year in the US, and about 600 million tons are fed to livestock worldwide. This
includes material fed to cattle, pigs, chickens, sheep, and goats (USDA, 2005).
Most livestock feed is in the form of grains, roughages, compound feed, and
additives. Whole grains often include corn, oats, wheat, and barley. Roughages are often
celluloid material ranging from hay to cotton seed hulls. Compound feeds are
combinations of various processed grains, roughages, and additives that are processed
and blended together for optimum nutrition. Compound feed is often fed in the form of
meal, crumbles, or pellets. Additives often include protein supplements, trace minerals,
oils, or other concentrated nutrients specific to the species and environment.
Feed pellets, the main focus of this research, encompass a significant portion of
the livestock feed industry. The United States Department of Agriculture (USDA)
conducted a survey of agricultural cooperatives in 2004, and found an estimated 7 billion
dollars of livestock feed was sold in the US in 2004. At least 14% of the feed sold was in
the form of pellets. This translates into at least one billion dollars of pellets sold in the
US. Additionally, these statistics do not account for pellets produced on site at large
livestock producers and not sold (Eversull, 2005).
7
3.2) The Pelleting Process
The purpose of pelletizing grains and roughages for livestock feed is to increase
the efficiency, digestibility, and palatability of these foodstuffs. Pellet shaped feed allows
for easier and more efficient consumption by the animal. Additionally the process
through which the material is steamed, heated, and formed into pellets breaks down the
contents of the pellet for palatability and digestion purposes (Harper, 1998).
Producing pellets from feedstuffs is an integral system combining steps of size
reduction, conditioning, pelleting, and cooling (Thomas, 1997). During the conditioning
step materials are treated with heat, steam, binders, and other additives that allow smaller
particles to combine into larger ones. Once the material is conditioned, it passes into a
pelletizing mill where it is extruded into cylindrical particles. After the pellets have been
extruded they pass into a cooler where the pellets are simultaneously cooled and dried
(Robinson, 1983).
The cooling and drying process is a crucial step in the production of feed pellet
products. Large amounts of energy and cost have been added to pellets prior to the
cooling and drying process (Harper, 1998). Using a dryer that requires a minimal amount
of energy input is desirable to keep the production costs of pellets as low as possible.
Additionally, when pellets are properly cooled and dried, they are less likely to produce
dust, commonly called fines, or spoil from microbial and fungal growth. Fines are
undesirable since they require more effort for the animal to consume and are more likely
to be wasted. Fines also pose both safety and management issues in handling of the
8
pellets. Fines and spoilage are both problems that can be minimized through proper
cooling and drying of pellets.
Various factors affect the cooling and drying process of feed pellets. Very little
research appears in the literature specifically on the cooling and drying of feed pellets.
However, the studies that can be found in the literature conclude that the behavior of feed
pellets can often be closely approximated with expressions developed for grains and
oilseeds: Robinson (1983); Biagi (1986); Maier (1988), and the cooling and drying
process of grains and other food products is essentially a mass and energy balance
(Brooker et al. 1992). Therefore the amount of energy in the air and pellets as well as the
amount of moisture in both the pellets and the air directly affect the cooling and drying
process. Also the method(s) of heat and mass transfer being employed: conduction,
convection, absorption, adsorption, etc. significantly affects the cooling and drying
process in foods and grains (Heldman and Lund, 2007). Thus the type of cooler being
used and the methods of heat and mass transfer the cooler design employs will impact the
cooling and drying process of feed pellets. Finally, if the pellets are cooled too quickly, a
dry crust will form on the surface of the pellet that will hinder moisture migration out of
the pellet and leave the pellet core soft and moist. Once a pellet with this soft moist core
is allowed to reach equilibrium, the pellet will become brittle and produce excess fines
(Hensley, 2006). Thus, factors that affect the performance of a pellet cooler can be
summarized as: cooler type, air flow rate, air temperature, air humidity, pellet flow rate,
pellet temperature, pellet moisture content, and pellet size (Maier, 1988).
There are various types of coolers that can be used to cool and dry pellets once
they leave the mill. Some of the classic designs include: vertical style cooler, horizontal
9
or belt style cooler, mixed rotary style cooler, and counter flow cooler (Maier, 1988). All
of these designs use air as a convection and advection medium, but each design uses
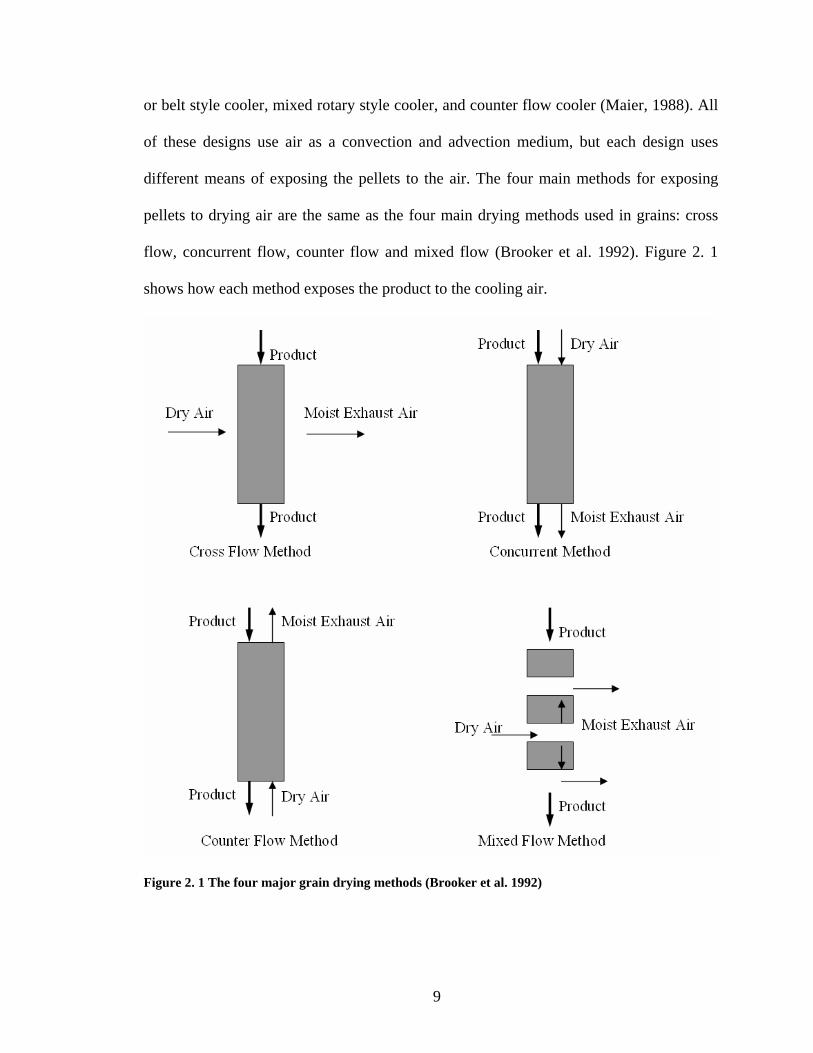
different means of exposing the pellets to the air. The four main methods for exposing
pellets to drying air are the same as the four main drying methods used in grains: cross
flow, concurrent flow, counter flow and mixed flow (Brooker et al. 1992). Figure 2. 1
shows how each method exposes the product to the cooling air.
Figure 2. 1 The four major grain drying methods (Brooker et al. 1992)
10
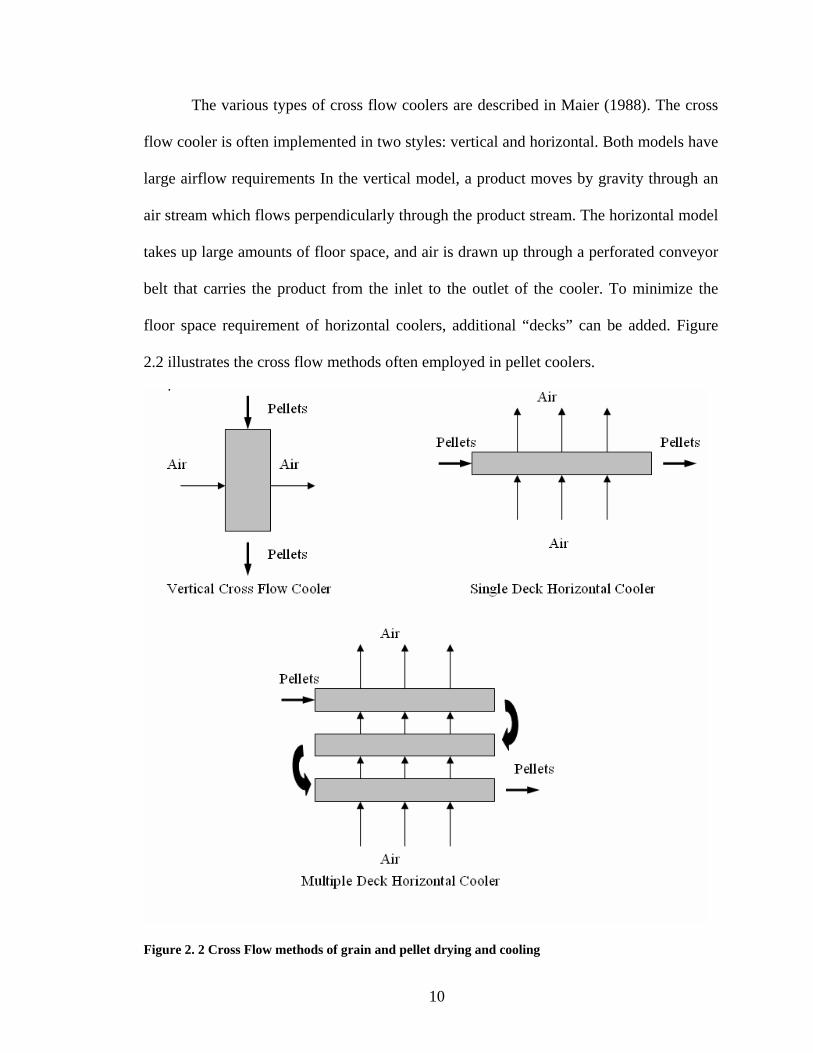
The various types of cross flow coolers are described in Maier (1988). The cross
flow cooler is often implemented in two styles: vertical and horizontal. Both models have
large airflow requirements In the vertical model, a product moves by gravity through an
air stream which flows perpendicularly through the product stream. The horizontal model
takes up large amounts of floor space, and air is drawn up through a perforated conveyor
belt that carries the product from the inlet to the outlet of the cooler. To minimize the
floor space requirement of horizontal coolers, additional “decks” can be added. Figure
2.2 illustrates the cross flow methods often employed in pellet coolers.
Figure 2. 2 Cross Flow methods of grain and pellet drying and cooling
11
The concurrent cooler method is used in grain drying and requires a heated air
stream to dry the product and a cool air stream to lower the final temperature of the
product. Initially the product is conveyed horizontally and heated with high temperature
air stream that flows in the same direction as the product stream. After the product has
been dried it is then exposed to a stream of cold air to cool the product. This method does
require additional energy to increase the temperature of the air, but it does provide
excellent uniformity in the drying of the product (Brooker et al. 1992).
The mixed rotary style cooler provides some of the advantages of both horizontal
and vertical cross flow coolers. Similar to a horizontal cross flow cooler, control of bed
depth and residence time of the pellets in the cooler can be achieved by adjusting the
speed of the cooler. However the space requirement of the mixed flow cooler is small
similar to the vertical cross flow cooler (Maier, 1988).
The OP><FLO cooler, the topic of this research, incorporates a counter flow
design. Maier (1988) and Bliss Industries Inc. (1999) both cite the advantages of counter
flow coolers to include: small space, low energy, and low maintenance requirements. An
illustration of an OP><FLO cooler is seen in Figure 2. 3:
12
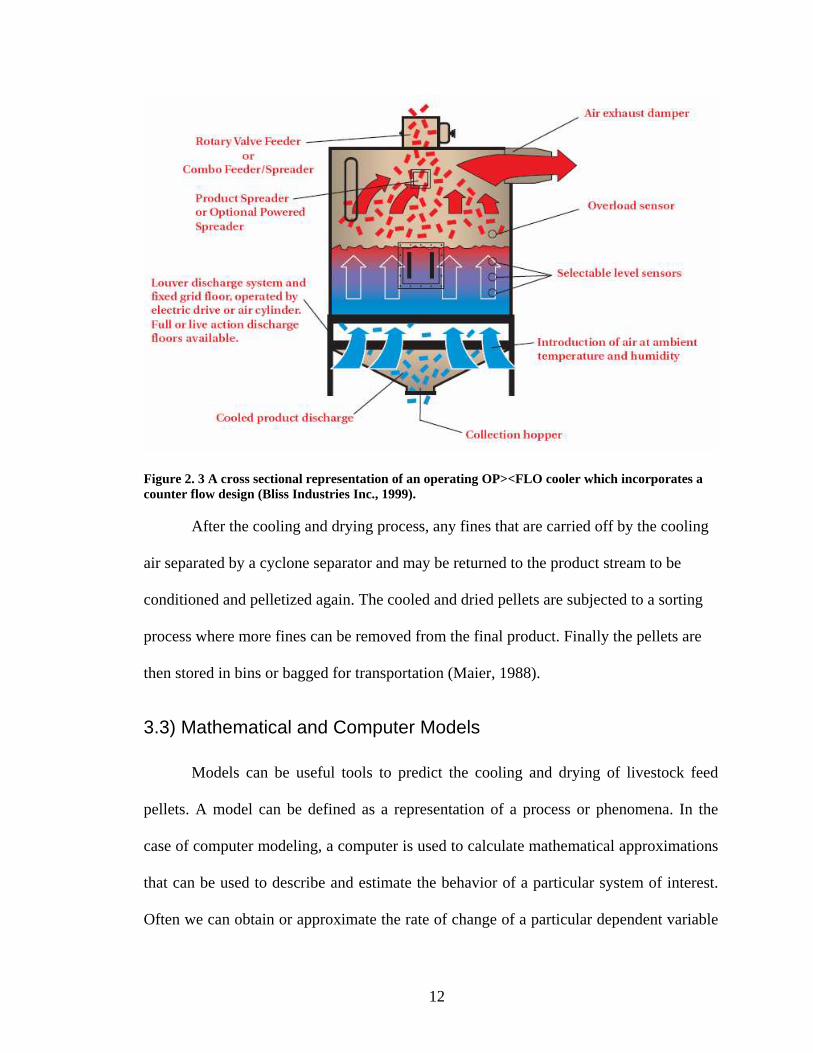
Figure 2. 3 A cross sectional representation of an operating OP><FLO cooler which incorporates a counter flow design (Bliss Industries Inc., 1999). After the cooling and drying process, any fines that are carried off by the cooling
air separated by a cyclone separator and may be returned to the product stream to be
conditioned and pelletized again. The cooled and dried pellets are subjected to a sorting
process where more fines can be removed from the final product. Finally the pellets are
then stored in bins or bagged for transportation (Maier, 1988).
3.3) Mathematical and Computer Models
Models can be useful tools to predict the cooling and drying of livestock feed
pellets. A model can be defined as a representation of a process or phenomena. In the
case of computer modeling, a computer is used to calculate mathematical approximations
that can be used to describe and estimate the behavior of a particular system of interest.
Often we can obtain or approximate the rate of change of a particular dependent variable
13
(temperature, concentration, velocity, etc.) with respect to some independent variable
(time, distance, etc.). Numerical integration methods, such as the Euler method, can then
be used to approximate values for the dependent variable with respect to the independent
variable (Davis and Rabinowitz, 1984). Numerical integration computer models can be
used in various facets of agricultural and biological engineering such as the heat and mass
transport that takes place in a feed pellet cooler.
Mathematical models for counter flow coolers exist in the literature. Some models
describe counter flow water cooling towers used in power generation and refrigeration
(Ren, 2006; Kloppers and Kröger, 2005), but these models do not address the issue of
drying biological material. Other models deal with counter flow cooling of biological
material, but do not use air as the cooling medium (Chern, 1989) or do not consider feed
pellets (Bruce and Giner, 1993). However, one model in particular focuses specifically on
the counter flow cooling and drying of feed pellets. This model was developed to
determine the factors that may influence the design of counter flow feed pellet coolers
(Maier, 1988). Maier (1988) developed a counter flow computer model almost twenty
years prior to this project, but the processing capability of most computers has increased
significantly during that time period (Morley and Parker, 2006). The complexity of
Maier’s (1988) model was limited by the large execution time that would be required on
the microcomputers available at that time. However, the work done by Maier (1988)
provides an incredible foundation for the development of a model to describe the counter
flow cooling and drying process of livestock pellets.
Maier (1988) was able to conclude that the bed depth and residence time are “the
most significant design parameters” for a counter flow cooler. Maier (1988) also
14
concluded that initial cooling temperature has a significant impact on the heat and mass
transfer phenomena occurring in the cooler, but the initial relative humidity of the cooling
air is of “minor importance in the design of a counter flow pellet cooler”(Maier, 1988).
The OP><FLO coolers have sensors that determine the bed depth inside the cooler and
control systems that keep the bed depth constant (Bliss Industries Inc., 1999). The
constant bed depth provides a significant amount of control on the cooling and drying
process by regulating the residence time of the pellets in the cooler.
15
4) The Computer Model
The model developed in this research is designed to operate in Microsoft Excel
2003, simply referred to as Excel. The model used advanced, custom programmed
macros and custom programmed functions written in Visual Basic for Applications or
VBA. The decision to use Excel and VBA was based on several factors: many small
businesses currently use this software for other everyday purposes (Morley and Parker,
2006), Excel and VBA are capable of complex calculations, Excel is capable of
displaying information graphically to allow simple interpretation of the modeling
process, the use of Excel would prevent the need to purchase costly specialized data
analysis software, and the author has considerable experience in custom macro
programming in VBA and Excel.
The model developed in this research uses a set of input variables to estimate the
temperature and moisture profiles of the air and pellets in the OP><FLO cooler. These
input variables are dependent on the need of the client considering the purchase of an
OP><FLO cooler and their geographic location. These input variables include desired
production capacity, air flow in the cooler, initial temperature and moisture content of the
newly formed pellets, pellet dimensions and density, ambient air temperature and relative
humidity, and the amount of space available for the cooler in the form of bin diameter
and bed depth.
16
Bliss Industries personnel can assign values for the client’s desired production
capacity, pellet dimensions, initial pellet moisture content, and initial pellet
temperature in appropriate fields in the model. Then they will select an OP><FLO cooler
model based on space that a client has available and the client’s budget. Values for bin
diameter, bed depth, and airflow specific to the selected OP><FLO model will be placed
into the model. Finally, appropriate values for average ambient temperature and relative
humidity must be determined for the client’s geographic location. The model can then
provide information about the moisture and temperature profiles of the pellets and the air
inside the cooler. Most importantly, the model will provide estimates of the final
moisture content and temperature of the pellets as they exit the cooler. Bliss Industries
will then be able to adjust values of bed depth, bin diameter, and air flow to determine the
optimal size of a cooler to meet the needs of a client.
After an approximate cooler size has been determined for the average ambient
conditions of a client’s geographic location, the temperature and relative humidity values
can be adjusted to determine how well a cooler will perform in extreme, less than ideal
conditions such as high humidity or sub-zero temperatures. A client will adjust the
airflow in a working OP><FLO cooler to control the final moisture content and
temperature of the pellets in varying ambient conditions (Locke, 2008). Therefore, Bliss
Industries personnel will be able to adjust the airflow value and use the model to estimate
how a cooler will perform in a wide variety of conditions. If the cooler does not perform
at an acceptable level in less than ideal conditions, a larger cooler model may be needed.
17
The calculations in this research are carried out in SI units with the exceptions of
bed depth which will be measured in inches and the input variables will use American
customary units. These exceptions are for the convenience of Bliss Industries since their
literature and equipment are specified in the American customary system.
Bliss Industries provided the author with data from OP><FLO coolers currently in
use at various geographic locations. Unfortunately, most of the information was for
OP><FLO coolers used to process wood pellets. Since the focus of this research is
OP><FLO coolers used for livestock feed pellets, most of the information was not useful.
The information that was provided for coolers used on livestock feed pellets can be seen
in Appendix A. This information not only provides example values for all input variables
for the model, but also provides calibration and validation data.
While the information in Appendix A will be useful for this study, the data
provided by Bliss Industries is limited. Information was only provided for three
OP><FLO coolers that process feed pellets. Additionally, the data for final moisture
content and temperature of the product are based on “customer feedback” (Locke, 2008),
and no further information was provided regarding how the data was measured or
obtained.
The equations for counter flow cooling of grains and oilseeds can be found in
Brooker et al. (1992). These equations use thermodynamic principles to describe the rate
of heat and water vapor transport out of the grain particles and into the cooling air.
However several studies in the literature conclude that the behavior of livestock feed
pellets can be adequately described using approximations developed for grains and
oilseeds (Robinson, 1983; Biagi, 1986; Maier, 1988). These conclusions are supported
18
_
intuitively by the fact that feed pellets are primarily composed of grains and oilseeds.
These equations have been successfully implemented in previous computer models for
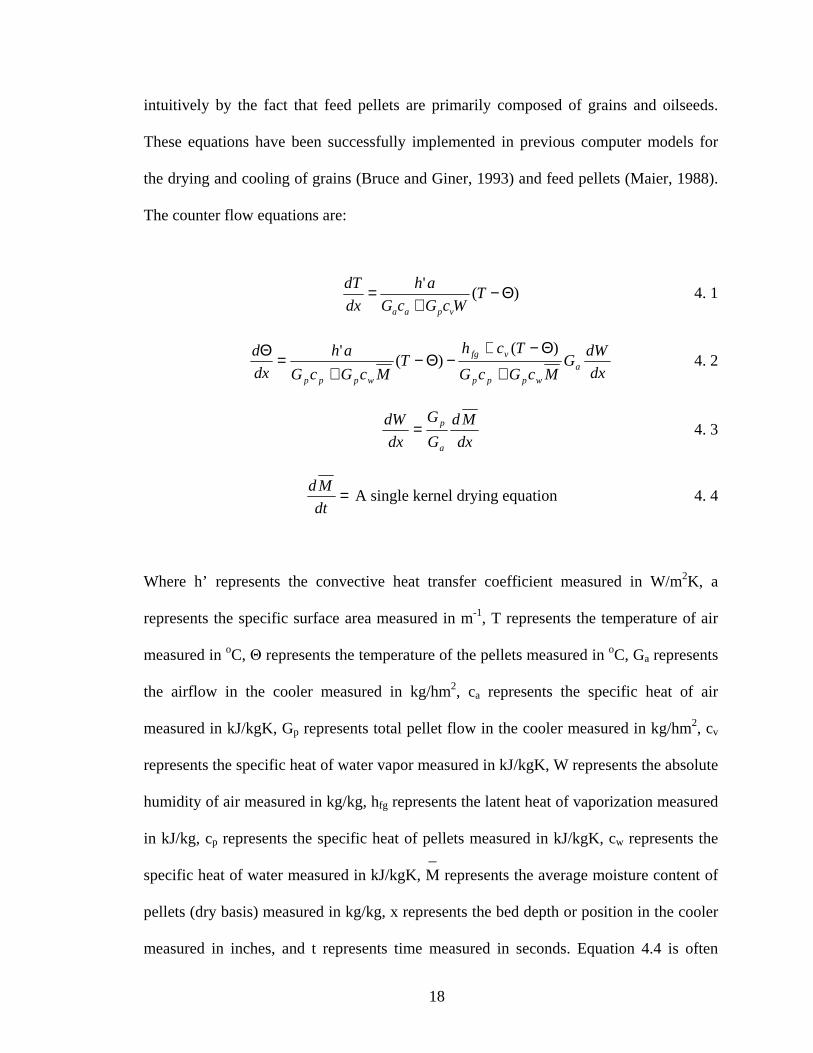
the drying and cooling of grains (Bruce and Giner, 1993) and feed pellets (Maier, 1988).
The counter flow equations are:
)(' Θ−
+= T
WcGcG
ah
dx
dT
vpaa
4. 1
dx
dWG
McGcG
TchT
McGcG
ah
dx
da
wppp
vfg
wppp +
Θ−+−Θ−
+=Θ )(
)('
4. 2
dx
Md
G
G
dx
dW
a
p= 4. 3
=dt
Md A single kernel drying equation 4. 4
Where h’ represents the convective heat transfer coefficient measured in W/m2K, a
represents the specific surface area measured in m-1, T represents the temperature of air
measured in oC, Θ represents the temperature of the pellets measured in oC, Ga represents
the airflow in the cooler measured in kg/hm2, ca represents the specific heat of air
measured in kJ/kgK, Gp represents total pellet flow in the cooler measured in kg/hm2, cv
represents the specific heat of water vapor measured in kJ/kgK, W represents the absolute
humidity of air measured in kg/kg, hfg represents the latent heat of vaporization measured
in kJ/kg, cp represents the specific heat of pellets measured in kJ/kgK, cw represents the
specific heat of water measured in kJ/kgK, M represents the average moisture content of
pellets (dry basis) measured in kg/kg, x represents the bed depth or position in the cooler
measured in inches, and t represents time measured in seconds. Equation 4.4 is often
19
_
presented this way in the literature and defined later since every product will have a
different drying equation (Brooker et al. 1992). Since the OP><FLO coolers operate at
steady state, it can be assumed that time, t, can be linearly related to position, x. It is also
assumed that all four dependent variables of the major dependent variables: T, Θ, W, and
M are dependent only on x, and are therefore constant across the entire area of the cooler
for any value of x.
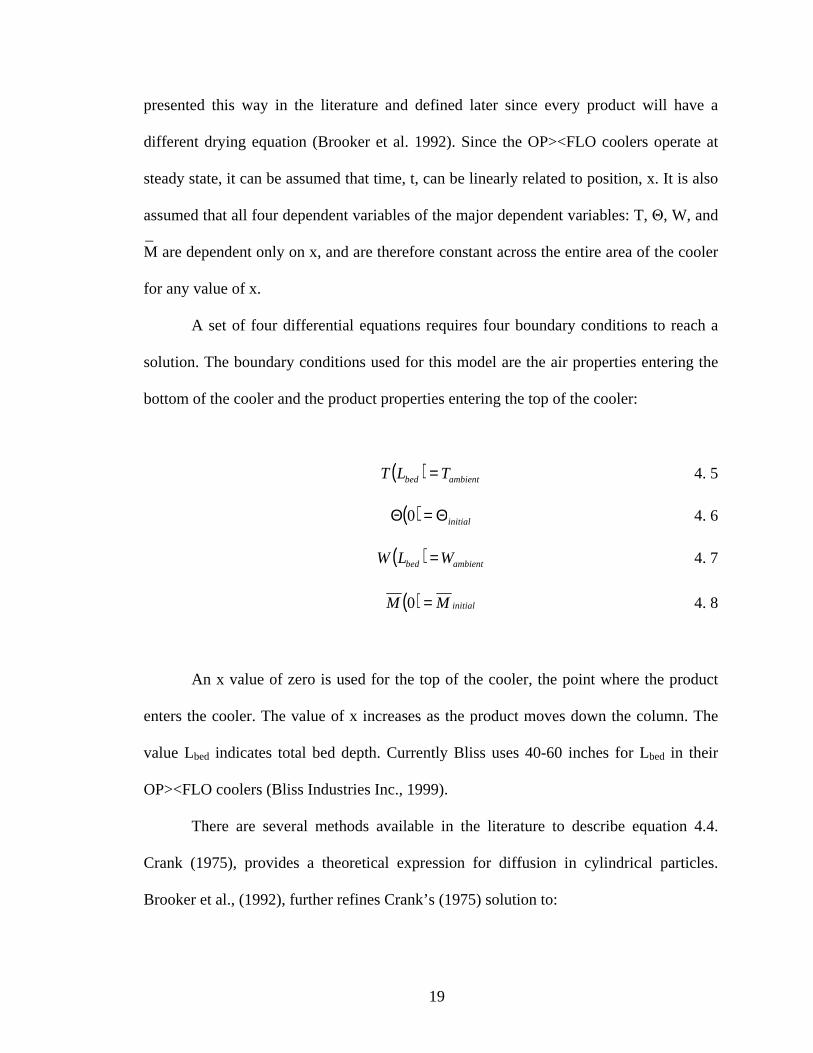
A set of four differential equations requires four boundary conditions to reach a
solution. The boundary conditions used for this model are the air properties entering the
bottom of the cooler and the product properties entering the top of the cooler:
( ) ambientbed TLT = 4. 5
( ) initialΘ=Θ 0 4. 6
( ) ambientbed WLW = 4. 7
( ) initialMM =0 4. 8
An x value of zero is used for the top of the cooler, the point where the product
enters the cooler. The value of x increases as the product moves down the column. The
value Lbed indicates total bed depth. Currently Bliss uses 40-60 inches for Lbed in their
OP><FLO coolers (Bliss Industries Inc., 1999).
There are several methods available in the literature to describe equation 4.4.
Crank (1975), provides a theoretical expression for diffusion in cylindrical particles.
Brooker et al., (1992), further refines Crank’s (1975) solution to:
20
( ) [ ]
−−+= ∑
∞
=1
22 exp
4)0()(
nn
neqeq DtMMMtM λ
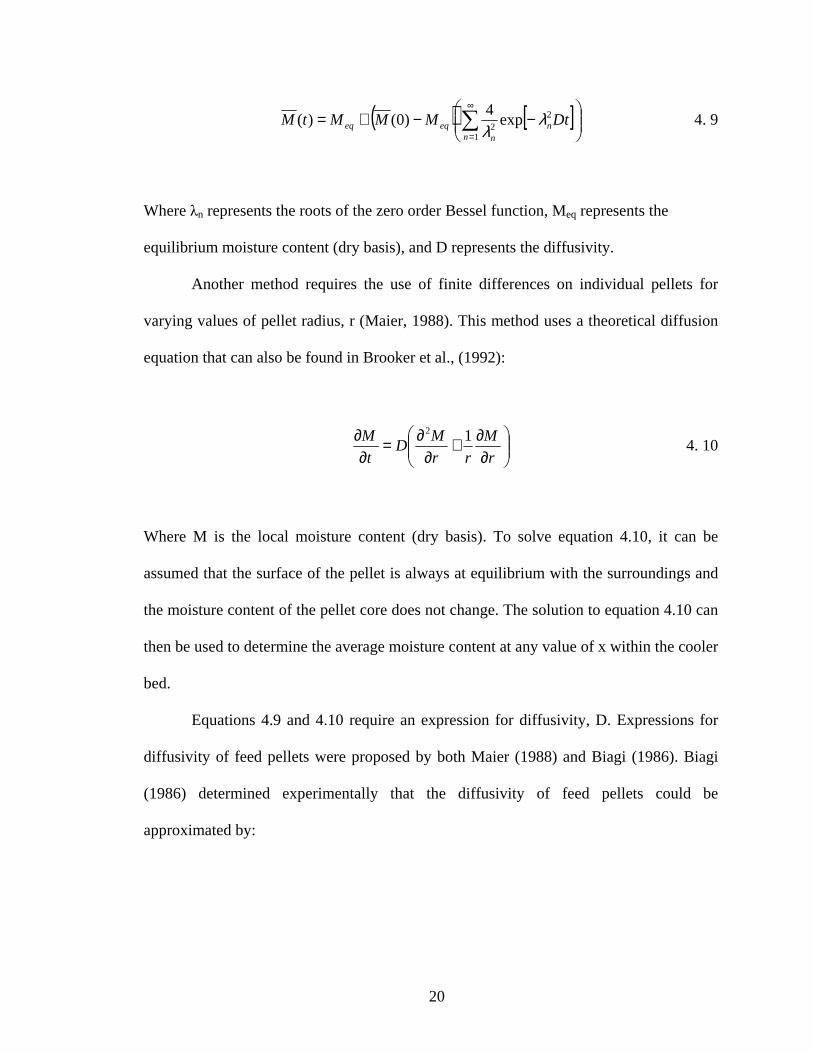
λ 4. 9
Where λn represents the roots of the zero order Bessel function, Meq represents the
equilibrium moisture content (dry basis), and D represents the diffusivity.
Another method requires the use of finite differences on individual pellets for
varying values of pellet radius, r (Maier, 1988). This method uses a theoretical diffusion
equation that can also be found in Brooker et al., (1992):
∂∂+
∂∂=
∂∂
r
M
rr
MD
t
M 12
4. 10
Where M is the local moisture content (dry basis). To solve equation 4.10, it can be
assumed that the surface of the pellet is always at equilibrium with the surroundings and
the moisture content of the pellet core does not change. The solution to equation 4.10 can
then be used to determine the average moisture content at any value of x within the cooler
bed.
Equations 4.9 and 4.10 require an expression for diffusivity, D. Expressions for
diffusivity of feed pellets were proposed by both Maier (1988) and Biagi (1986). Biagi
(1986) determined experimentally that the diffusivity of feed pellets could be
approximated by:

21
Θ−
×= −
abs
K
h
mD
547exp10015.1
25 4. 11
Maier (1988) concluded a more appropriate diffusivity approximation could be obtained
by modifying an expression developed for corn by Chu and Hustrulid (1968):
( )
Θ−Θ+−
×= −
absabs
KM
h
mCD
251345.047.5exp10513.1
24 4. 12
Maier (1988) proposed using a value of C = 3 for feed pellets.
Both of these methods for estimating drying rates were determined infeasible for
this research. Results of numerical integration experiments using equation 4.9 yielded
slow drying rates and did not support data provided by Bliss describing the input and
output conditions of OP><FLO coolers currently in use. Implementing equation 4.10
would further increase the complexity and run time of the model. A simple drying
equation that more closely matched the data provided by Bliss was desired for this
research.
Brooker et al., (1992), offers an expression that “is often used in grain drying
analysis” and is “analogous to Newton’s Law of Cooling”:
( )eqMMkdt
Md −= 4. 13
where:
22
Θ−=
abs
RAk
5023exp 4. 14
The drying constant, k, has units of s-1 and Θabs has units of R. The recommended value
of the drying coefficient, A, for corn is 0.54 (Pabis and Henderson, 1961).
A more commonly used and simpler form of equation 4.13 can be obtained by
assuming that equilibrium moisture content is a constant value (Brooker et al., 1992):
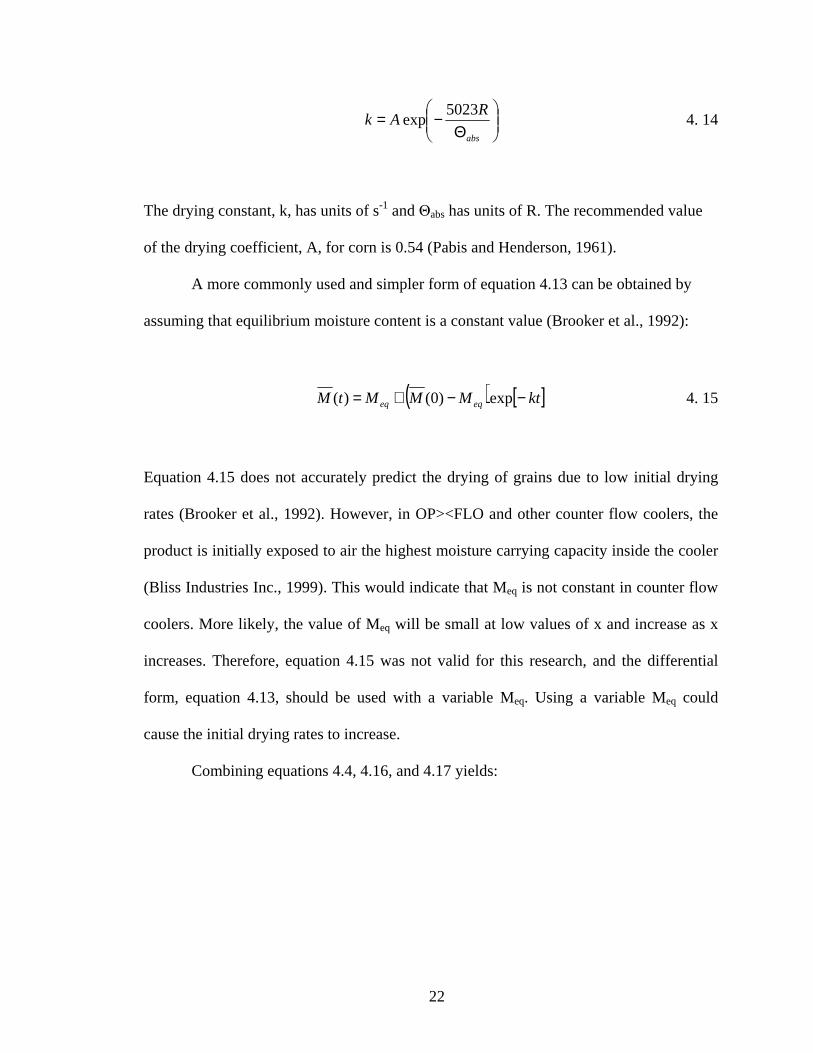
( ) [ ]ktMMMtM eqeq −−+= exp)0()( 4. 15
Equation 4.15 does not accurately predict the drying of grains due to low initial drying
rates (Brooker et al., 1992). However, in OP><FLO and other counter flow coolers, the
product is initially exposed to air the highest moisture carrying capacity inside the cooler
(Bliss Industries Inc., 1999). This would indicate that Meq is not constant in counter flow
coolers. More likely, the value of Meq will be small at low values of x and increase as x
increases. Therefore, equation 4.15 was not valid for this research, and the differential
form, equation 4.13, should be used with a variable Meq. Using a variable Meq could
cause the initial drying rates to increase.
Combining equations 4.4, 4.16, and 4.17 yields:
23
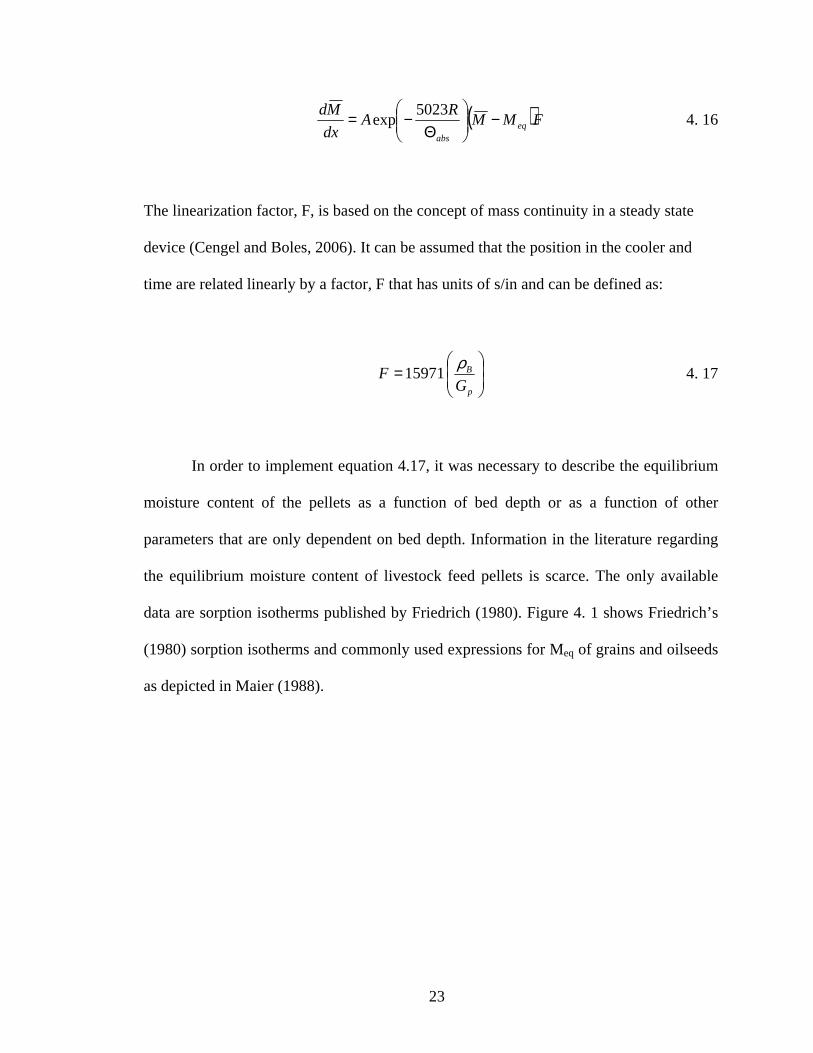
( )FMMR
Adx
Mdeq
abs
−
Θ−= 5023
exp 4. 16
The linearization factor, F, is based on the concept of mass continuity in a steady state
device (Cengel and Boles, 2006). It can be assumed that the position in the cooler and
time are related linearly by a factor, F that has units of s/in and can be defined as:
=
p
B
GF
ρ15971 4. 17
In order to implement equation 4.17, it was necessary to describe the equilibrium
moisture content of the pellets as a function of bed depth or as a function of other
parameters that are only dependent on bed depth. Information in the literature regarding
the equilibrium moisture content of livestock feed pellets is scarce. The only available
data are sorption isotherms published by Friedrich (1980). Figure 4. 1 shows Friedrich’s
(1980) sorption isotherms and commonly used expressions for Meq of grains and oilseeds
as depicted in Maier (1988).
24
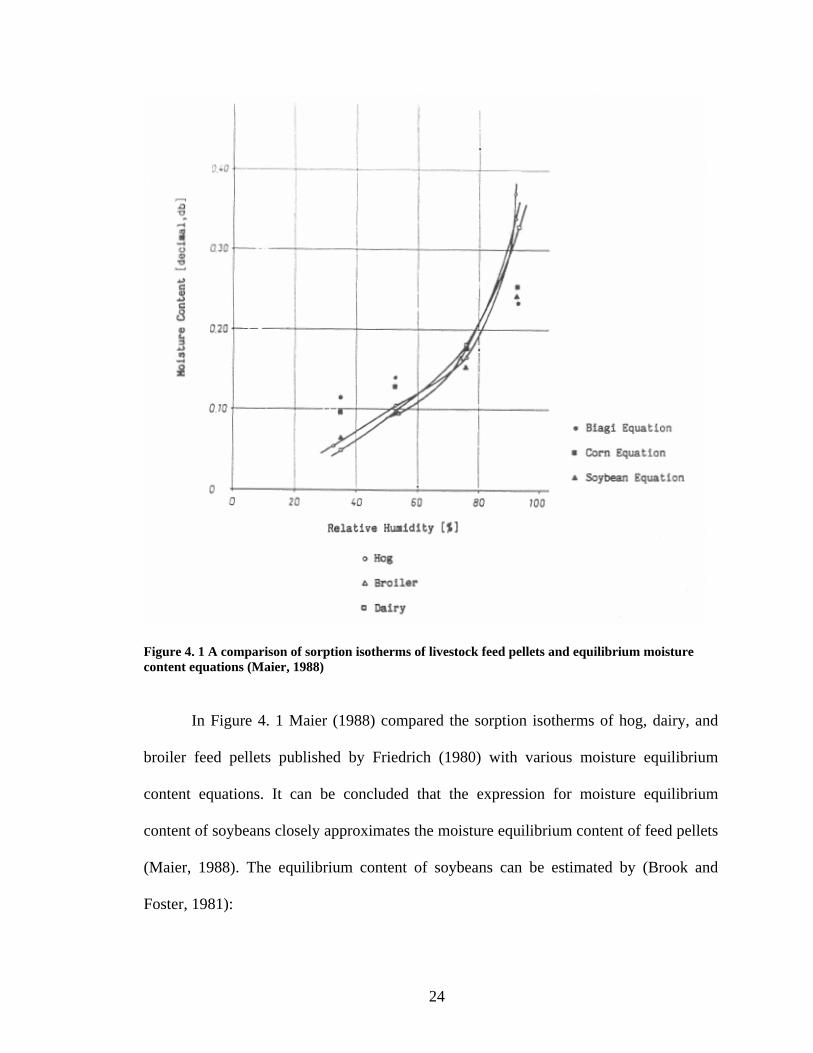
Figure 4. 1 A comparison of sorption isotherms of livestock feed pellets and equilibrium moisture content equations (Maier, 1988)
In Figure 4. 1 Maier (1988) compared the sorption isotherms of hog, dairy, and
broiler feed pellets published by Friedrich (1980) with various moisture equilibrium
content equations. It can be concluded that the expression for moisture equilibrium
content of soybeans closely approximates the moisture equilibrium content of feed pellets
(Maier, 1988). The equilibrium content of soybeans can be estimated by (Brook and
Foster, 1981):
25
))ln()576.24(98.1ln(066816.0375314.0 rhTM eq +−−= 4. 18
Relative humidity, rh, can be defined as the ratio of the amount of water being
carried by the air and the total amount of water that the air can carry (Ramaswami et al.
2005). It can also be defined as (ASABE, 2005):
s
v
P
Prh = 4. 19
Where Pv , represents the vapor pressure and Ps represents the saturation pressure. The
vapor pressure can be defined as:
v
vatmv RW
RWPP
+=
287 4. 20
Where the atmospheric pressure, Patm, is in Pa, and Rv is the ideal gas constant for water
vapor and has a value of 416.95 J/kgK. The saturation pressure, Ps, can be estimated by
(ASABE, 2005):
−+++++=
2
432
exp25.649,105,22GTFT
ETDTCTBTAPs 4. 21
Where A = -27,405.526, B = 97.5413, C = -0.146244, D = 0.12558x10⁻³ ,
E = -0.48502x10⁻⁷, F = 4.34903, and G = 0.39381x10⁻² (ASABE, 2005).
26
After obtaining a complete expression for equation 4.4, it was now necessary to
define other parameters in the model equations. Values for the specific heat of air, water,
and water vapor were readily available in a Thermodynamic text. Since the temperature
change of the pellets and air is small in an OP><FLO cooler, constant values for the
specific heats of air, water, and water vapor were appropriate. Specific heat values used
in this research have units of kJ/kg oC and were approximated numerically as: ca = 1.0057
cv = 1.889 and cw = 4.186 (Cengel and Boles, 2006).
The specific heat of grains is a function of moisture content, and it seems
reasonable that the specific heat of feed pellets is dependent on moisture content as well.
It can be assumed that the specific heat of corn kernels will be similar to the specific heat
of feed pellets (Maier, 1988). In units of kJ/kg oC, an appropriate expression for the
specific heat of pellets is (Brook and Foster, 1981):
Mcp 559.3465.1 += 4. 22
The latent heat of vaporization in grains refers to the amount of energy necessary
to vaporize water so that it can be carried out of the grain. The latent heat of vaporization
for grains was estimated by (Brook and Foster, 1981):
)exp(1)(384.21.2542( MBATh fg −+−= 4. 23
The latent heat of vaporization is measured in units of kJ/kg, T is in Celsius and the
average moisture content is a dry basis decimal. Values for the constants, A and B, are
27
not available for feed pellets, but it can be assumed that pellets will behave similar to
corn (Maier, 1988). Thus A = 1.2925 and B = 19.961 (Brook and Foster, 1981).
An expression for the convective heat transfer coefficient, h’, in packed beds of
cylinders was determined by Barker (1965). A version of Barker’s (1965) equation
appropriate for grains is (Brooker et al., 1992):
B
a
apaa
GdGACh
=
µ' 4. 24
Where the air viscosity, µa, can be calculated as (Brooker et al., 1992):
DTCa +=µ 4. 25
For SI units, the coefficients for grains are as follows: A = 0.2755, B = -0.34,
C = 0.06175, and D = 0.000165.
The specific surface area, a, is defined as the amount of surface area per unit
volume of the cooling bed. For cylindrical pellets the specific surface area can be
approximated as (Maier, 1988):
+
−=
pp
pp
p
b
lr
lra
)(21
ρρ
4. 26
The model developed in this research uses an iterative process to estimate the
temperature and moisture profiles inside the OP><FLO coolers. First the bed of feed
pellets is divided into a number of equally sized slices, ns. Then an initial estimate must
28
be made for the temperature and moisture profiles. Values for T and Θ are initialized as
the line between Θinitial and Tambient using:
ambientbed
ambientinitial TxL
TxandxT +
−Θ=Θ )()( 4. 27
Values for the average pellet moisture content and absolute humidity profiles are
initialized as constant values of Minitial and Wambient respectively. Finally derivatives for all
moisture and temperature profiles are initialized as a negative 0.1 as an initial estimate
since the temperature and moisture of both pellets and air temperature should decrease as
x increases (Bliss Industries Inc., 1999).
After defining an initial estimate for the temperature and moisture content
profiles, the iterative process can begin. Estimations are calculated for air and pellet
properties such as: relative humidity, specific heat, and latent heat of vaporization that are
dependent on temperature and moisture content. These properties and the initial values
for temperature and moisture can then be used in equations 4.1 – 4.4 to calculate better
estimates for the changes in temperature and moisture for both the air and pellets.
Numerical integration methods can then be used to obtain new estimates of the
temperature and moisture profiles in the cooler. The iterative loop is completed when
new estimates of air and pellet properties are calculated from the new estimates of the
moisture and temperature profiles.
Convergence for this model is evaluated in two ways: the values for the
temperature and moisture content of the product and air do not change between iterations,
or the estimated amount of water entering the air is approximately equal to the estimated
29
amount of water entering the product. The iterative loop is repeated a number of times, ni,
that is greater than or equal to the number of bed slices, ns. Repeating the process until ni
is 250% of ns will allow the model to approach convergence. Numerical integration
experiments using the data in Appendix A indicate an ns value of 200 is appropriate for
most OP><FLO coolers, and the percent difference between the amount of moisture
leaving the product and the amount of moisture entering the air will typically range from
1 – 5% for a maximum ni value of 500 if ns is 200. Additional iterations will decrease the
percent difference between the amount of moisture leaving the product and the amount of
moisture entering the air, but to minimize run time of the model a maximum value of ni =
2.5ns will be used in this research. Therefore, an ns value of 200 and a maximum ni value
of 500 will be the default values for the model, but the user will have the option of using
a more or less slices at their discretion. If the user wishes to use an ns value other than
200, the value maximum value of ni will automatically be adjusted accordingly.
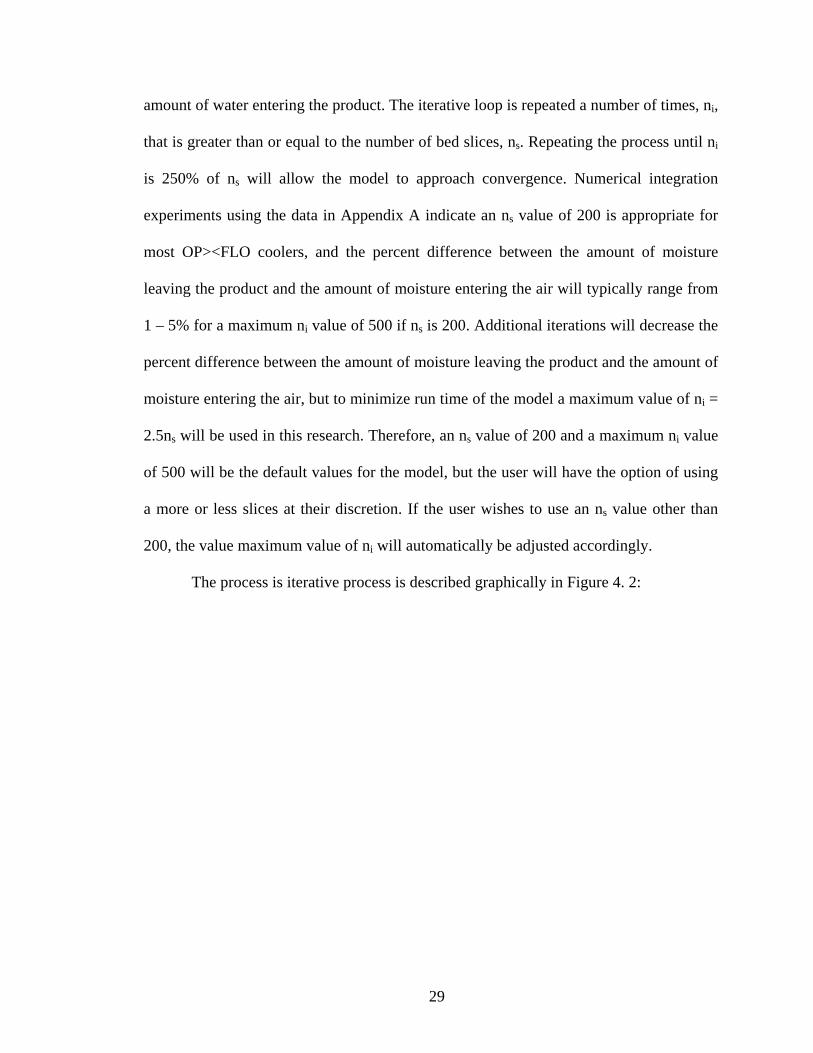
The process is iterative process is described graphically in Figure 4. 2:
30
Figure 4. 2 Flow Schematic of the Model Program
31
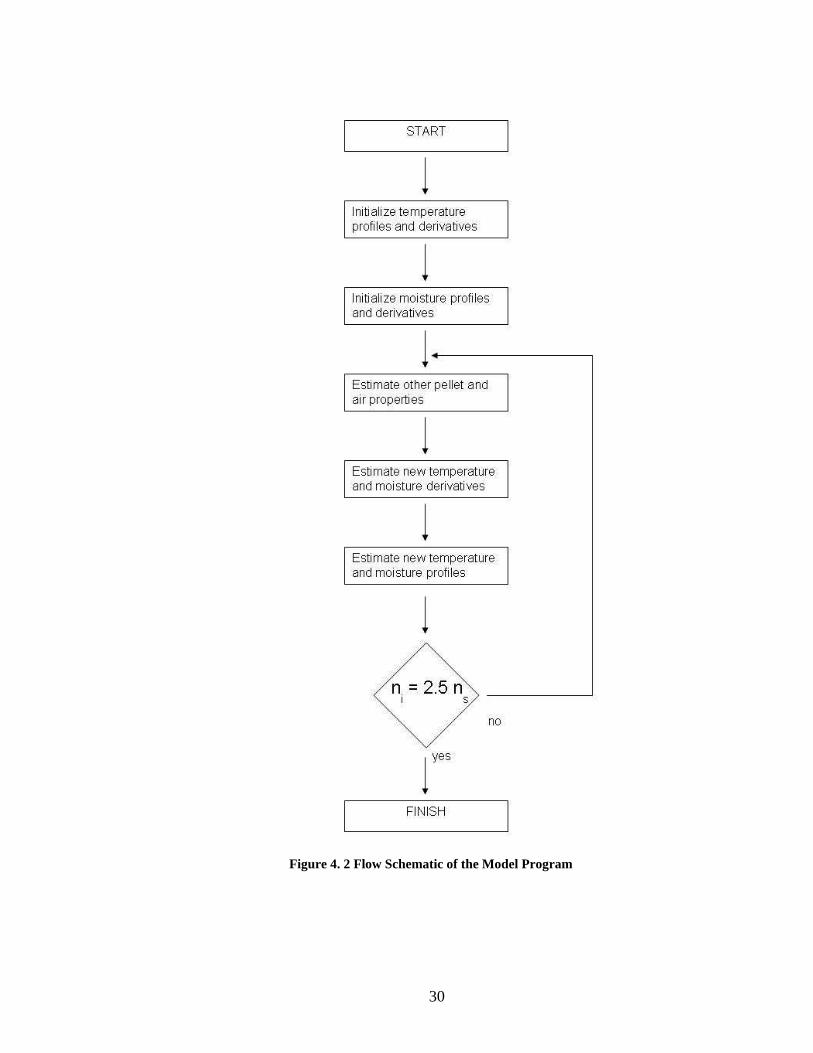
This model will require the use of numerical integration techniques. During the
iterative loop, equations 4.1, 4.2, 4.3, and 4.4 are used to calculate the derivatives of the
dependent variables, air and product temperature and moisture, with respect to the
independent variable, bed depth. These derivatives can be used to estimate values for the
dependent variables via numerical integration. One simple method for numerical
integration is the Euler’s method (Ramaswami et al. 2005):
( )12112 xxdyyy −+= 4. 28
Where y represents the dependent variable, x represents the independent variable, and dy
represents the derivative of y. For small step sizes, Euler’s Method will yield reasonable
approximations for integration (Davis and Rabinowitz, 1984).
32
5) Debugging the Model
5.1) Stabilizing the Model
Once expressions and values had been identified for all parameters in the model
equations, the model was programmed into an Excel and VBA format. A macro was
written to carry out the iterative process discussed previously in Figure 4. 2 and values
from Appendix A were placed into the model for testing.
The initial model exhibited one major flaw: the temperature profiles would
become unstable and exhibit a diverging sinusoidal response before the model could
converge. The pellet temperature, Θ, would show an increase at some point in the cooler,
nj, and then immediately decreased at the next point in the cooler, nj+1. In the next
iteration, the next point, nj+2, would show an increase and point nj+3 would show a
decrease. This divergent phenomenon would proliferate with each iteration until the
entire profile for Θ exhibited a sinusoidal pattern. Also, the magnitude of the difference
between the increases and decreases would escalate as the value of ni increased. A
comparison of equations 4.1 and 4.2 shows that the values of the air and pellet
temperatures are closely linked. So as the pellet temperature values diverged, the air
temperature values behaved similarly.
This divergent phenomenon violates the Second Law of Thermodynamics.
Specifically the Clausius statement, a significant basis of the Second Law of
Thermodynamics, is violated. The Clausius statement infers that heat cannot flow
33
spontaneously from a low temperature body to a higher temperature body without
additional work being done to the system (Cengel and Boles, 2006). Once the pellets
enter the OP><FLO cooler, no significant work occurs until the pellets exit the cooler.
The pellets are exposed to continuously cooler air as they move down the cooler (Bliss
Industries Inc., 1999). Therefore, limits were placed on the values of Θ and T in the
model to prevent the values of those variables from increasing as the value of x increases.
Thus, the model was constrained to obey the Second Law of Thermodynamics.
5.2) Calibrating the Model
The next task in this research was to determine if the model would provide
reasonable estimates of the heat and mass transfer occurring in the OP><FLO cooler.
Once the model was stabilized, data from Table A-1 was put into the model. The model
carried out the iterative process as expected, and estimates of the temperature and
moisture profiles were calculated. Unfortunately, this initial numerical integration
experiment did not support the data in Table A-1. The estimated moisture loss was
approximately 1-2% instead of the 3-4% expected moisture loss reported by Bliss
Industries. The process was repeated for data for the information in tables A-2, and A-3.
In all cases the model estimated a final moisture content of the pellets that was higher
than the expected final moisture content provided by Bliss Industries.
An examination of the model equations and expressions for all of the parameters
was conducted. It was determined that the only expression that had not been used in the
literature to describe the cooling and drying of feed pellets was equation 4.16, the
derivative of moisture content of the pellets with respect to bed depth. All other
34
expressions and equations were derived from thermodynamic principles or were used in
computer models describing pellet cooling and drying (Maier, 1988; Biagi, 1986).
The change in moisture content, calculated by equation 4.16, used an empirical
drying coefficient, A. Initially a value for whole corn was used for this coefficient.
However, the drying rate of whole corn is affected by the presence or absence of the tip
cap, pericarp, and hull (Brooker et al., 1992). However, feed pellets are composed of
particles of corn and other grains, roughages, and additives. If the tip cap, pericarp, and
hull of the corn and other grains are present in pellets, they will likely not have the same
effect on drying that is observed in whole kernels. For this research, it was assumed that
feed pellets and whole corn have different values for the drying coefficient, A, in
equation 4.16.
A simple sensitivity analysis was conducted to determine how changing the value
of the drying coefficient would affect the model. Since the OP><FLO cooler in location 1
is operating close to the average capacity for a cooler of comparable size (Bliss Industries
Inc., 1999), the model was used to estimate temperature and moisture profiles for location
1 using the values in Table A-1. Since an average pellet length was not provided by Bliss
Industries, an average pellet length of 0.75 inches was assumed for location 1 from the
author’s experience in feeding livestock. An initial pellet temperature of 180 oF and an
initial pellet moisture content of 12% were used. Also the following values were used:
the drying coefficient, A = 0.5, ambient air temperature, T(Lbed) = 50 oF, and ambient
absolute humidity, W(Lbed) = 0.006917 kg/kg (which yields the specified relative
humidity of 92 % at 50 oF). Once the model had finished, values for final average
moisture content and final product temperature were recorded. The process was repeated
35
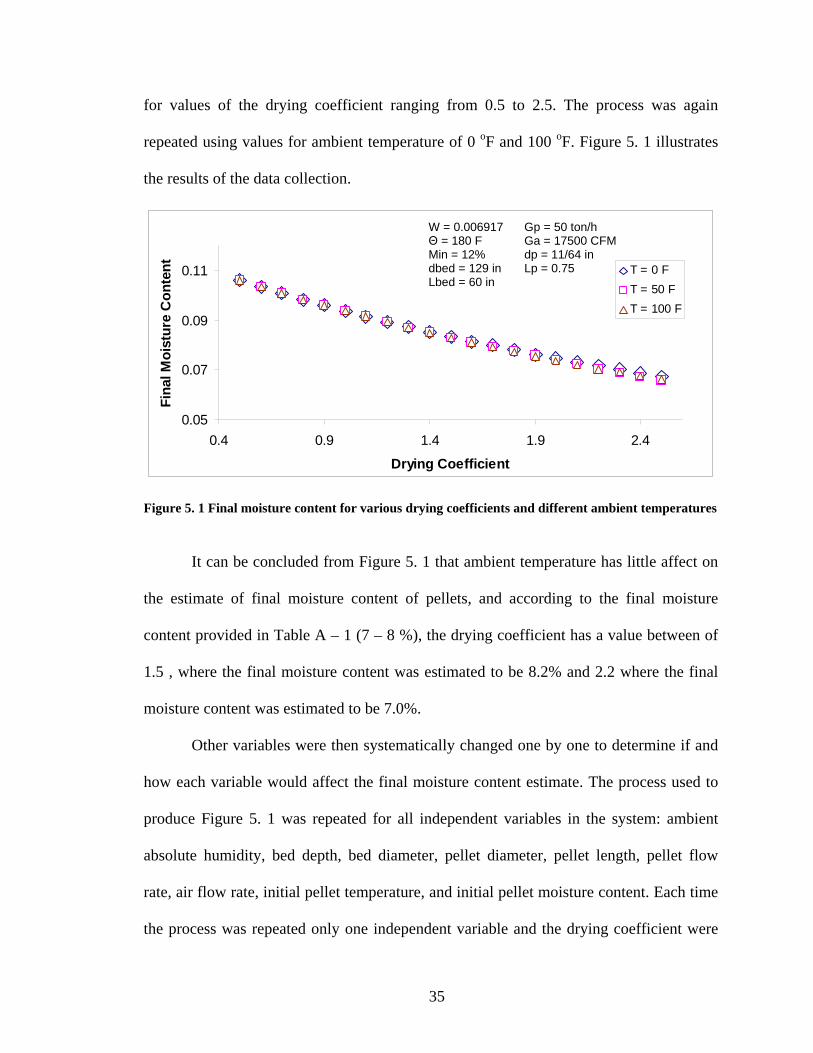
for values of the drying coefficient ranging from 0.5 to 2.5. The process was again
repeated using values for ambient temperature of 0 oF and 100 oF. Figure 5. 1 illustrates
the results of the data collection.
0.05
0.07
0.09
0.11
0.4 0.9 1.4 1.9 2.4
Drying Coefficient
Fin
al M
oist
ure
Con
tent T = 0 F
T = 50 F
T = 100 F
Figure 5. 1 Final moisture content for various drying coefficients and different ambient temperatures
It can be concluded from Figure 5. 1 that ambient temperature has little affect on
the estimate of final moisture content of pellets, and according to the final moisture
content provided in Table A – 1 (7 – 8 %), the drying coefficient has a value between of
1.5 , where the final moisture content was estimated to be 8.2% and 2.2 where the final
moisture content was estimated to be 7.0%.
Other variables were then systematically changed one by one to determine if and
how each variable would affect the final moisture content estimate. The process used to
produce Figure 5. 1 was repeated for all independent variables in the system: ambient
absolute humidity, bed depth, bed diameter, pellet diameter, pellet length, pellet flow
rate, air flow rate, initial pellet temperature, and initial pellet moisture content. Each time
the process was repeated only one independent variable and the drying coefficient were
W = 0.006917 Θ = 180 F Min = 12% dbed = 129 in Lbed = 60 in
Gp = 50 ton/h Ga = 17500 CFM dp = 11/64 in Lp = 0.75
36
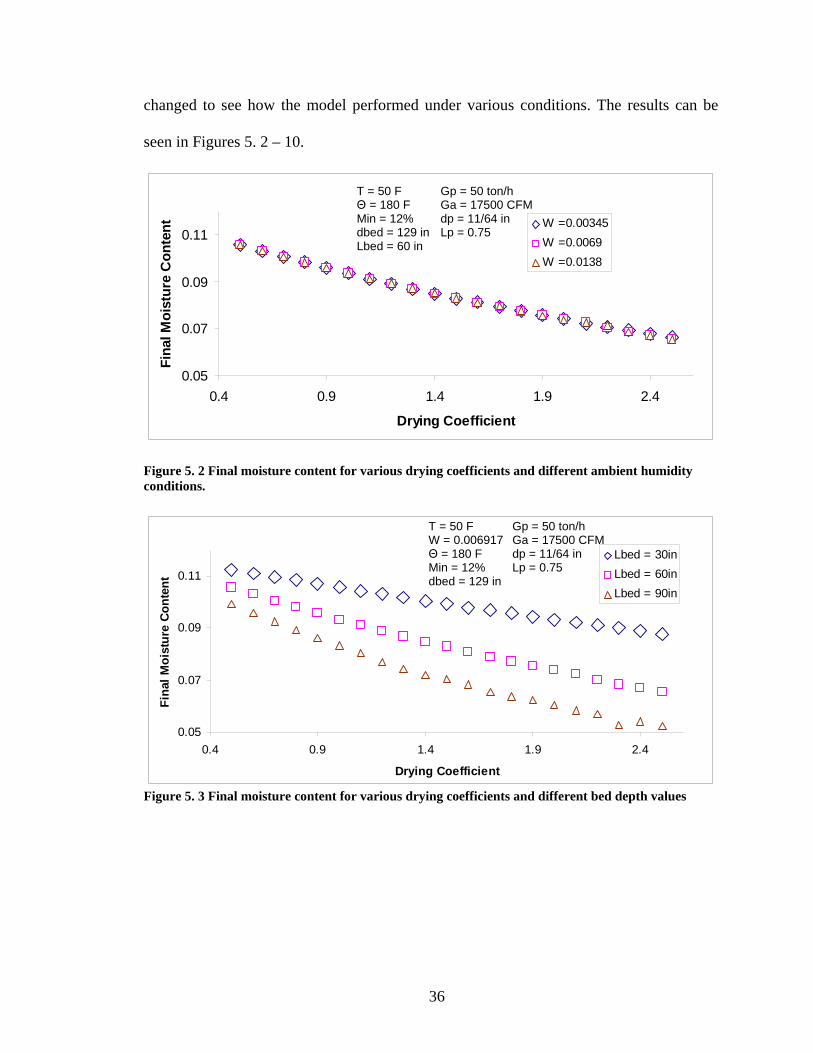
changed to see how the model performed under various conditions. The results can be
seen in Figures 5. 2 – 10.
0.05
0.07
0.09
0.11
0.4 0.9 1.4 1.9 2.4
Drying Coefficient
Fin
al M
oist
ure
Con
tent
W =0.00345
W =0.0069
W =0.0138
Figure 5. 2 Final moisture content for various drying coefficients and different ambient humidity conditions.
0.05
0.07
0.09
0.11
0.4 0.9 1.4 1.9 2.4
Drying Coefficient
Fin
al M
oist
ure
Con
tent
Lbed = 30in
Lbed = 60in
Lbed = 90in
Figure 5. 3 Final moisture content for various drying coefficients and different bed depth values
T = 50 F Θ = 180 F Min = 12% dbed = 129 in Lbed = 60 in
T = 50 F W = 0.006917 Θ = 180 F Min = 12% dbed = 129 in
Gp = 50 ton/h Ga = 17500 CFM dp = 11/64 in Lp = 0.75
Gp = 50 ton/h Ga = 17500 CFM dp = 11/64 in Lp = 0.75
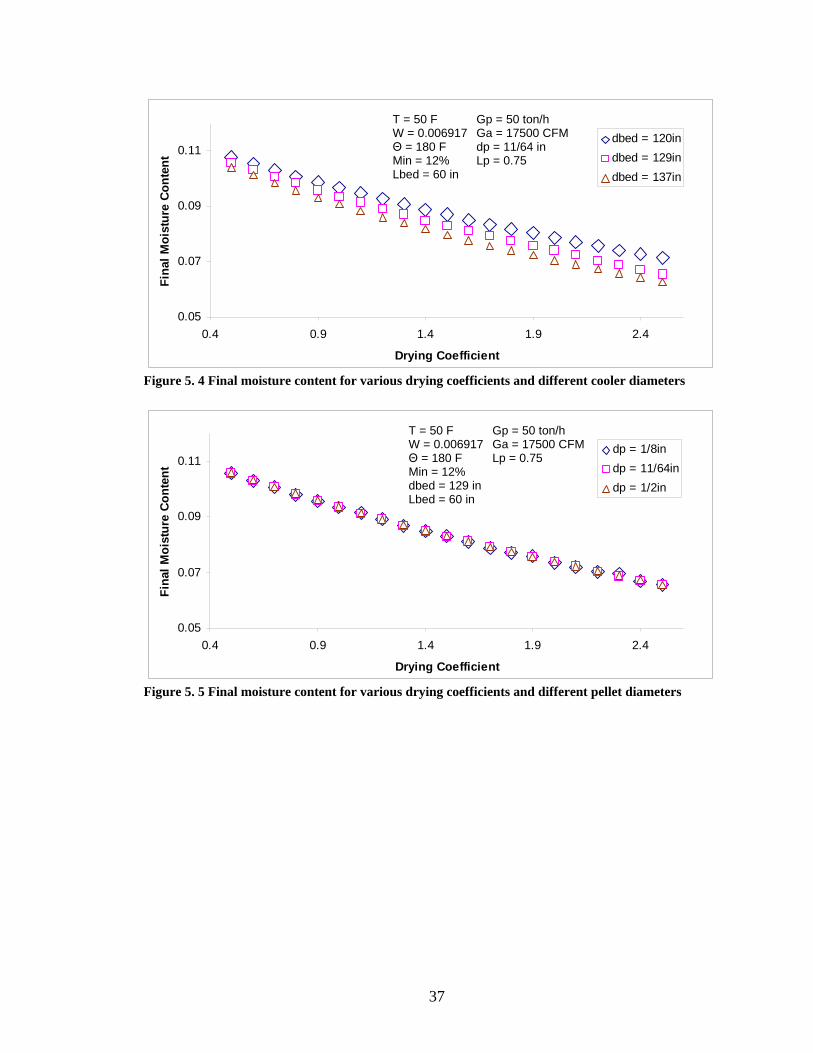
37
0.05
0.07
0.09
0.11
0.4 0.9 1.4 1.9 2.4
Drying Coefficient
Fin
al M
oist
ure
Con
tent
dbed = 120in
dbed = 129in
dbed = 137in
Figure 5. 4 Final moisture content for various drying coefficients and different cooler diameters
0.05
0.07
0.09
0.11
0.4 0.9 1.4 1.9 2.4
Drying Coefficient
Fin
al M
oist
ure
Con
tent
dp = 1/8in
dp = 11/64in
dp = 1/2in
Figure 5. 5 Final moisture content for various drying coefficients and different pellet diameters
T = 50 F W = 0.006917 Θ = 180 F Min = 12% Lbed = 60 in
Gp = 50 ton/h Ga = 17500 CFM dp = 11/64 in Lp = 0.75
T = 50 F W = 0.006917 Θ = 180 F Min = 12% dbed = 129 in Lbed = 60 in
Gp = 50 ton/h Ga = 17500 CFM Lp = 0.75
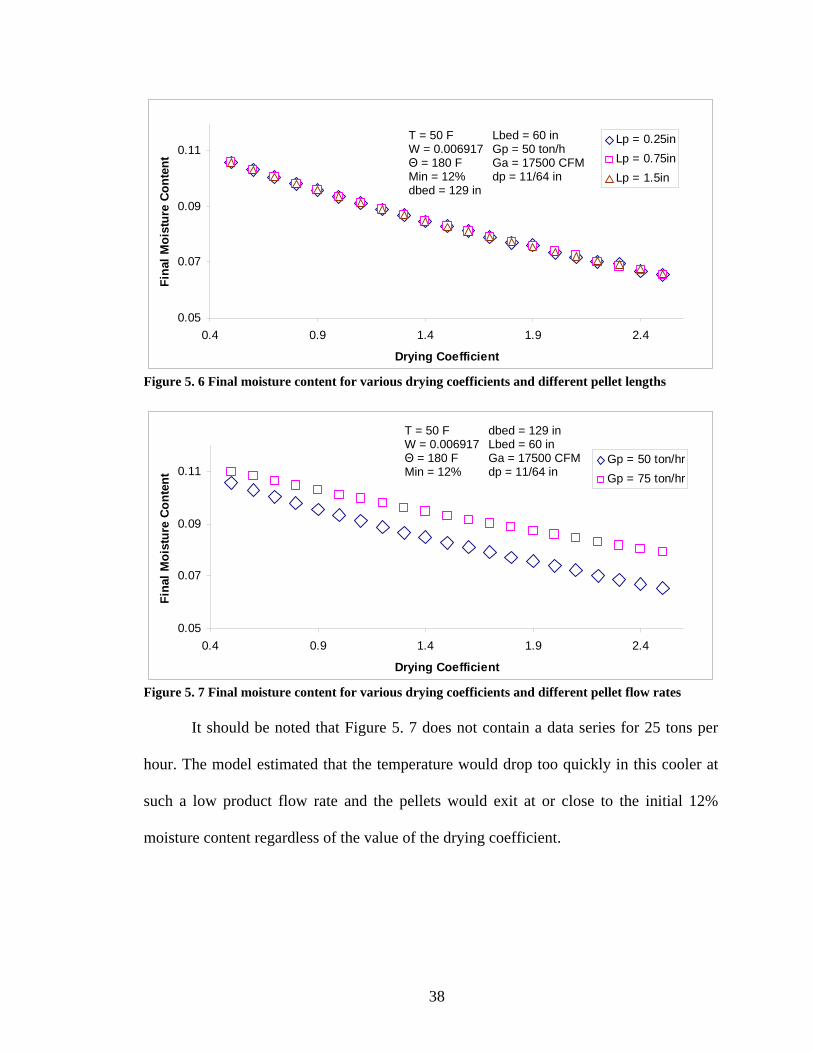
38
0.05
0.07
0.09
0.11
0.4 0.9 1.4 1.9 2.4
Drying Coefficient
Fin
al M
oist
ure
Con
tent
Lp = 0.25in
Lp = 0.75in
Lp = 1.5in
Figure 5. 6 Final moisture content for various drying coefficients and different pellet lengths
0.05
0.07
0.09
0.11
0.4 0.9 1.4 1.9 2.4
Drying Coefficient
Fin
al M
oist
ure
Con
tent
Gp = 50 ton/hr
Gp = 75 ton/hr
Figure 5. 7 Final moisture content for various drying coefficients and different pellet flow rates
It should be noted that Figure 5. 7 does not contain a data series for 25 tons per
hour. The model estimated that the temperature would drop too quickly in this cooler at
such a low product flow rate and the pellets would exit at or close to the initial 12%
moisture content regardless of the value of the drying coefficient.
T = 50 F W = 0.006917 Θ = 180 F Min = 12% dbed = 129 in
Lbed = 60 in Gp = 50 ton/h Ga = 17500 CFM dp = 11/64 in
T = 50 F W = 0.006917 Θ = 180 F Min = 12%
dbed = 129 in Lbed = 60 in Ga = 17500 CFM dp = 11/64 in
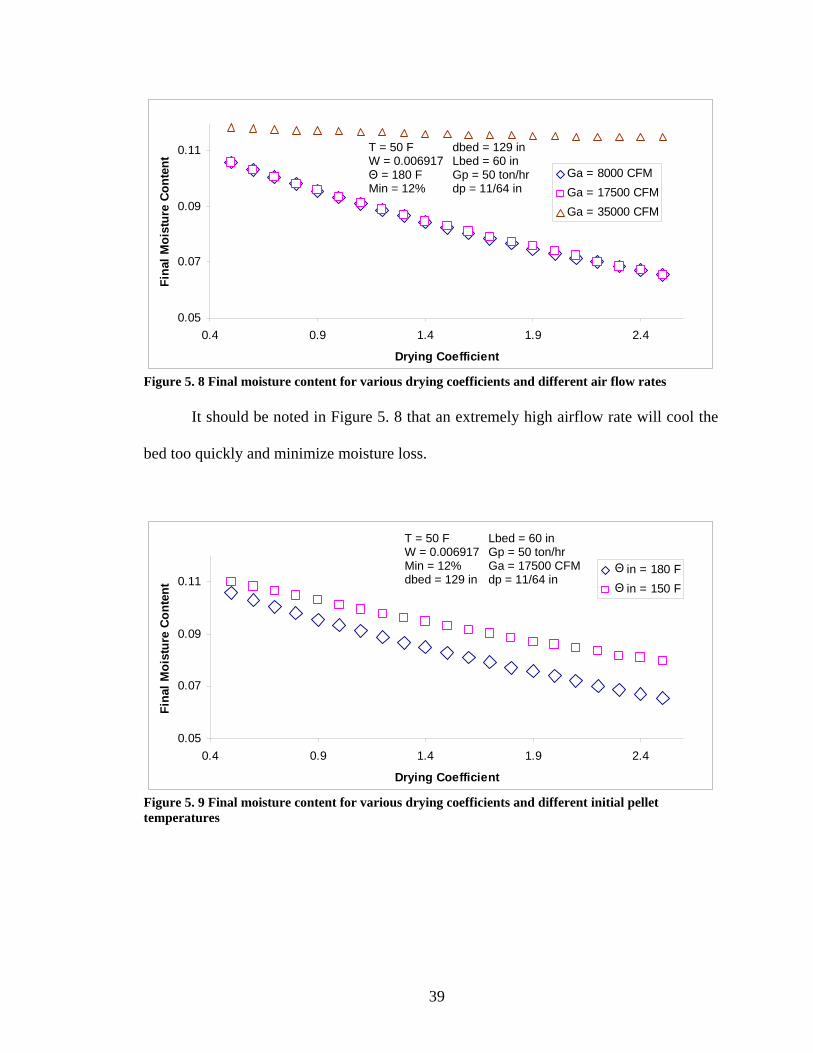
39
0.05
0.07
0.09
0.11
0.4 0.9 1.4 1.9 2.4
Drying Coefficient
Fin
al M
oist
ure
Con
tent Ga = 8000 CFM
Ga = 17500 CFM
Ga = 35000 CFM
Figure 5. 8 Final moisture content for various drying coefficients and different air flow rates
It should be noted in Figure 5. 8 that an extremely high airflow rate will cool the
bed too quickly and minimize moisture loss.
0.05
0.07
0.09
0.11
0.4 0.9 1.4 1.9 2.4
Drying Coefficient
Fin
al M
oist
ure
Con
tent
in = 180 F
in = 150 F
Figure 5. 9 Final moisture content for various drying coefficients and different initial pellet temperatures
Θ
Θ
T = 50 F W = 0.006917 Θ = 180 F Min = 12%
dbed = 129 in Lbed = 60 in Gp = 50 ton/hr dp = 11/64 in
T = 50 F W = 0.006917 Min = 12% dbed = 129 in
Lbed = 60 in Gp = 50 ton/hr Ga = 17500 CFM dp = 11/64 in
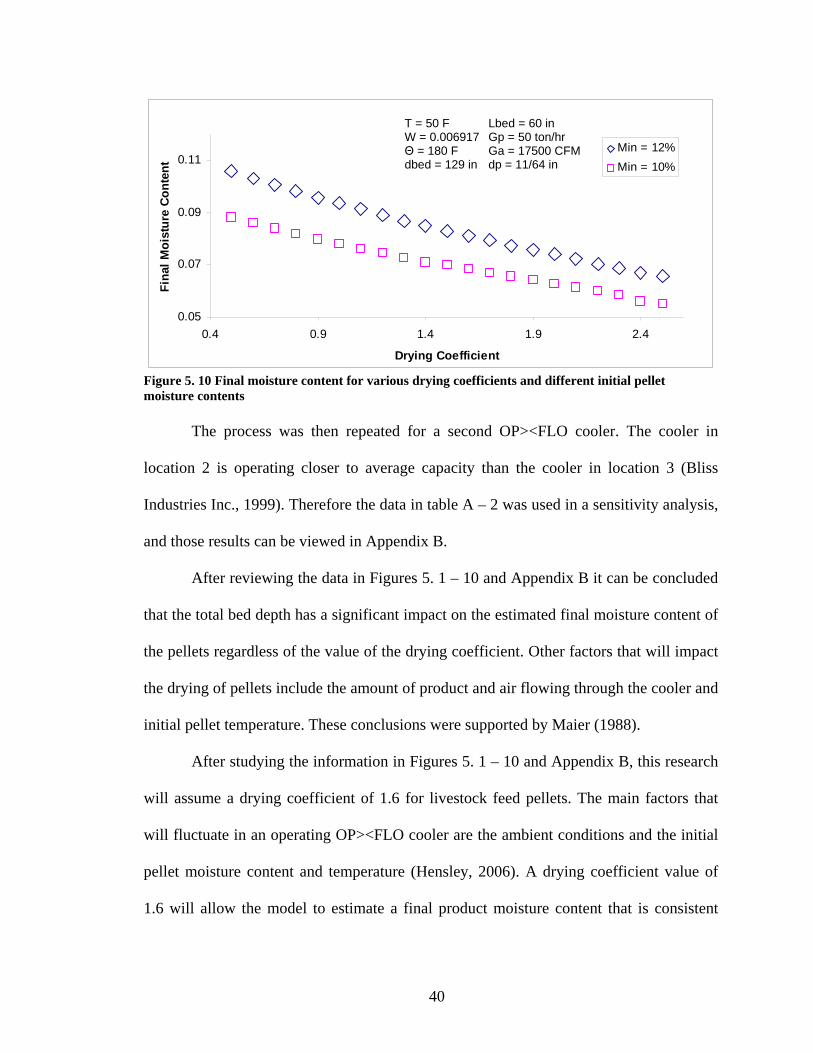
40
0.05
0.07
0.09
0.11
0.4 0.9 1.4 1.9 2.4
Drying Coefficient
Fin
al M
oist
ure
Con
tent
Min = 12%
Min = 10%
Figure 5. 10 Final moisture content for various drying coefficients and different initial pellet moisture contents
The process was then repeated for a second OP><FLO cooler. The cooler in
location 2 is operating closer to average capacity than the cooler in location 3 (Bliss
Industries Inc., 1999). Therefore the data in table A – 2 was used in a sensitivity analysis,
and those results can be viewed in Appendix B.
After reviewing the data in Figures 5. 1 – 10 and Appendix B it can be concluded
that the total bed depth has a significant impact on the estimated final moisture content of
the pellets regardless of the value of the drying coefficient. Other factors that will impact
the drying of pellets include the amount of product and air flowing through the cooler and
initial pellet temperature. These conclusions were supported by Maier (1988).
After studying the information in Figures 5. 1 – 10 and Appendix B, this research
will assume a drying coefficient of 1.6 for livestock feed pellets. The main factors that
will fluctuate in an operating OP><FLO cooler are the ambient conditions and the initial
pellet moisture content and temperature (Hensley, 2006). A drying coefficient value of
1.6 will allow the model to estimate a final product moisture content that is consistent
T = 50 F W = 0.006917 Θ = 180 F dbed = 129 in
Lbed = 60 in Gp = 50 ton/hr Ga = 17500 CFM dp = 11/64 in
41
with the 7 – 8% range that is provided by the data in Appendix A for the given ranges of
initial temperature and moisture values of product and air.
It should also be noted that Maier (1988) concluded from experimental data
collected by Biagi (1986) that the diffusivity of feed pellets is approximately three times
that of corn. This conclusion supports the use of a drying coefficient of 1.6 which is
approximately three times the value of the drying coefficient proposed by Pabis and
Henderson (1961) for corn of 0.54.
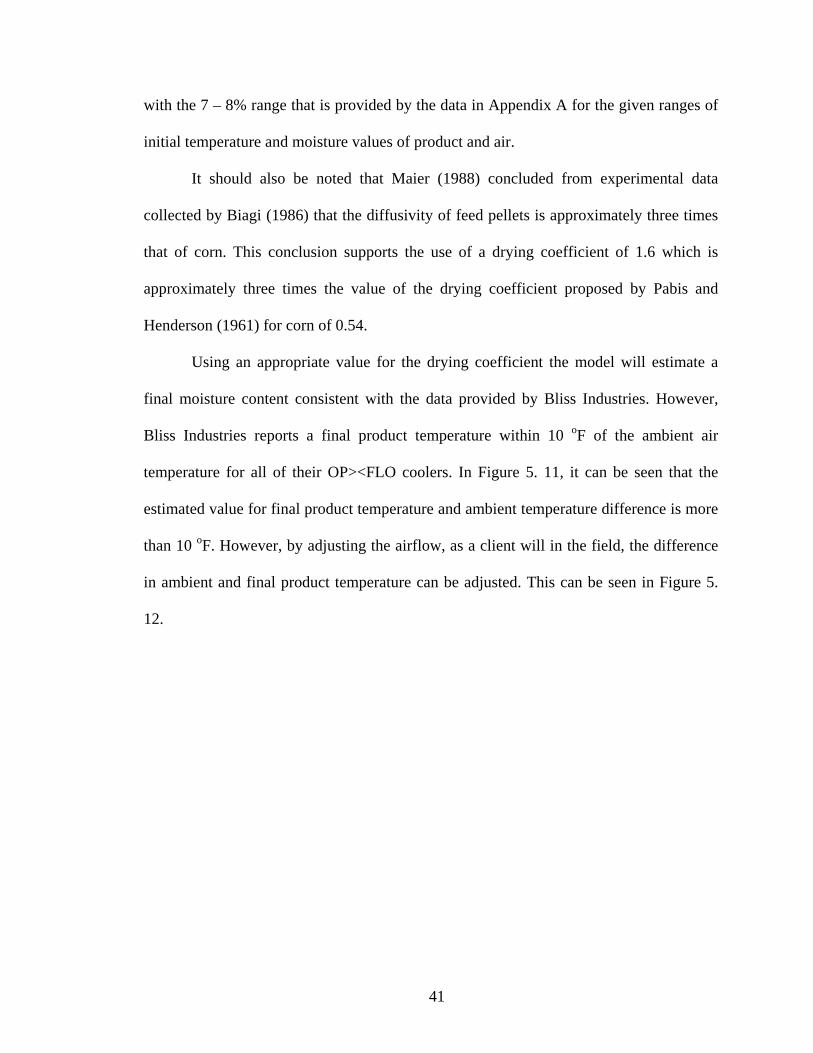
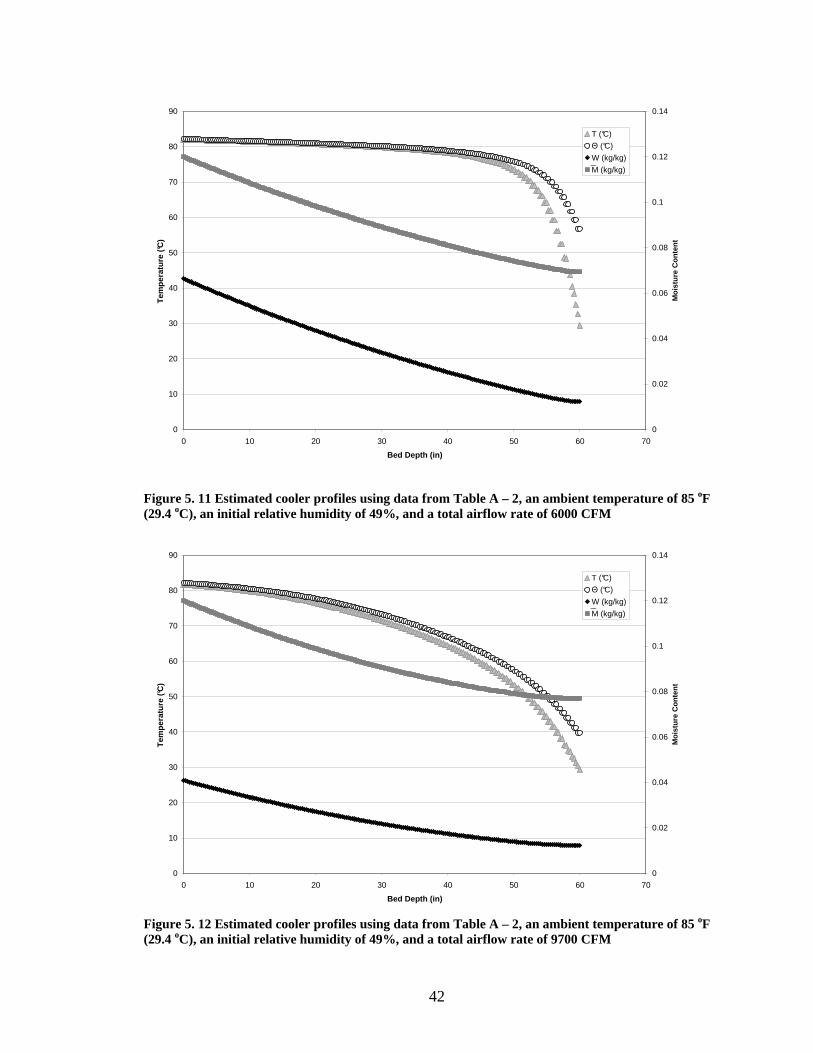
Using an appropriate value for the drying coefficient the model will estimate a
final moisture content consistent with the data provided by Bliss Industries. However,
Bliss Industries reports a final product temperature within 10 oF of the ambient air
temperature for all of their OP><FLO coolers. In Figure 5. 11, it can be seen that the
estimated value for final product temperature and ambient temperature difference is more
than 10 oF. However, by adjusting the airflow, as a client will in the field, the difference
in ambient and final product temperature can be adjusted. This can be seen in Figure 5.
12.
42
0
10
20
30
40
50
60
70
80
90
0 10 20 30 40 50 60 70
Bed Depth (in)
Tem
pera
ture
(°C
)
0
0.02
0.04
0.06
0.08
0.1
0.12
0.14
Moi
stur
e C
onte
nt
T (°C)
Θ (°C)
W (kg/kg)
M (kg/kg)
Figure 5. 11 Estimated cooler profiles using data from Table A – 2, an ambient temperature of 85 oF (29.4 oC), an initial relative humidity of 49%, and a total airflow rate of 6000 CFM
0
10
20
30
40
50
60
70
80
90
0 10 20 30 40 50 60 70
Bed Depth (in)
Tem
pera
ture
(°C
)
0
0.02
0.04
0.06
0.08
0.1
0.12
0.14
Moi
stur
e C
onte
nt
T (°C)
Θ (°C)
W (kg/kg)
M (kg/kg)
Figure 5. 12 Estimated cooler profiles using data from Table A – 2, an ambient temperature of 85 oF (29.4 oC), an initial relative humidity of 49%, and a total airflow rate of 9700 CFM
_
_
43
5.3) Validating the Model
As a validation process, the model was used to estimate the temperature and
moisture profiles for the data in Table A – 3. The model estimated a final moisture
content of 5 – 6% for location 3, lower than the reported 7 – 8% final moisture content.
The information in Table A – 3 was then compared to the other information provided in
Appendix A. A comparison of the information in Table A – 2 and A – 3 reveals that both
coolers are used for similar product streams (15 tons per hour of ¾” pellets), but a larger
cooler was selected for Location 3. Location 3 had a listed relative humidity of 32% and
is more arid than Location 2 with a relative humidity of 49%. After a discussion with
Bliss Industries personnel, a possible reason was identified for the low final moisture
content estimation: the cooler in Location 3 may have been oversized. This can be
supported by the fact that Bliss Industries literature indicates that a model of these
dimensions could process an average of about 35 tons per hour of product (Bliss
Industries Inc., 1999). There are several reasons why an oversized cooler may have been
selected for this location. A few of them include: a client with plans to increase
production in the future, a more appropriately sized cooler may not have been compatible
with the client’s other pelletizing equipment, or an appropriately sized cooler may not
have been immediately available (Edens, 2008). However, it is unclear why this
particular unit was selected for Location 3, but with the use of the model developed in
this research, Bliss Industries may not install oversized OP><FLO coolers in the future.
44
6) Conclusions
The goal of this research was to develop a tool that would assist Bliss Industries
personnel in determining the appropriate size of a counter flow style, OP><FLO livestock
feed pellet cooler. The result of this research is a computer model that will provide an
estimate of the moisture and temperature profiles inside a counter flow feed pellet cooler
given: cooler diameter, cooler bed depth, initial pellet temperature, ambient air
temperature, initial pellet moisture content, ambient relative humidity, pellet flow rate, air
flow rate, pellet diameter, average pellet length, pellet density, and bulk density. The
model will allow Bliss Industries to estimate how an OP><FLO cooler will perform
under varying operating and ambient conditions. They will then be able to use these
estimates to aid in the selection of on an appropriate cooler size for a given client and
location.
The model was designed to run in Microsoft Excel and uses VBA for custom
functions and macros. The model is compatible with all versions of Excel that are
currently available (Excel 2007 through Excel XP). Therefore, the model will be easily
accessible and usable by Bliss Industries without purchase of specialized software. A
portion of the code used in the model can be seen in Appendix C, but the portion of the
code that designed to facilitate the iterative loop will not be published to protect the
interests of Bliss Industries Inc.
45
For this research, only a limited amount of data was available to calibrate and test
the model. Much of the data originally provided by Bliss Industries is for OP><FLO
coolers that are used to dry and cool wood pellets. Only three of the provided information
sets were for livestock feed pellets. Data from two of those locations, Table A – 1 and
Table A – 2, was used to calibrate the model. This left only one data set, Table A – 3, to
validate the model, and the model indicates that the cooler described in Table A – 3 may
be oversized. Additional data should be collected to further validate the model.
This model should be used as one of many tools that Bliss Industries personnel
can use to determine appropriate size for an OP><FLO cooler. The model does provide
an estimate of the moisture content and temperature of feed pellets and air in an
OP><FLO cooler. The data provided by Bliss Industries does support the estimations
provided by the model for final moisture content of the pellets, but the estimated final
temperature values are higher than the values reported by Bliss Industries. However, the
model will provide an indication of how variations in product size, product flow, air flow,
cooler size, bed depth, ambient conditions, and properties of the product upon entry will
affect the performance of an OP><FLO cooler.
46
7) Recommendations The author recommends that future research in this area should include:
1) Additional data on operating OP><FLO coolers to further validate the model.
2) An investigation of the model’s ability to accurately describe the cooling and
drying of wood pellets in an OP><FLO cooler.
3) An in depth investigation to determine the most appropriate expressions for the
drying rate, Equation 4. 4, and moisture equilibrium content, Equation 4. 18, for
livestock feed pellets and wood pellets.
4) An investigation to determine an expression for the most appropriate number of
finite differences, ns, necessary for the model to describe any OP><FLO cooler.
47
References American Society of Agricultural and Biological Engineers. 2005. Psychrometric Data,
American National Standards Institute Standard and Engineering Practice. St. Joseph, MI. ASAE D271.2 APR1979 (R2005)
Barker. J.J. 1965. Heat Transfer in Packed Beds. Ind. Chem. Eng. 57: 43 – 51. Biagi, J.D. 1986. Modeling of the Feed-Pellet Cooling Process. Ph.D. Thesis. Michigan
State University. East Lansing, MI. Bliss Industries Inc.1999. OP><FLO Coolers The Circular Solution to Counterflow
Cooling. Advertising Brochure. Brook, R. C. and G. H. Foster. 1981. Drying, Cleaning, and Conditioning. In Handbook
of Transportation and Handling in Agriculture. Volume II: Field Crops. E. E. Finney, ed. CRC Press, Boca Raton, FL.
Brooker, D.B., F.W. Bakker-Arkema, and C. W. Hall. 1992. Drying and Storage of
Grains and Oilseeds. Van Nostrand Reinhold. New York, NY. Bruce, D. M., and S. A. Giner. 1993. .Mathematical Modeling of Grain Drying in
Counter-Flow Beds: Investigation of Crossover of Air and Grain Temperatures. Journal of Agricultural Engineering Research. 55: 143-161.
Cengel, Y.A. and M. A. Boles. 2006. Thermodynamics An Engineering Approach. Sixth
Edition. McGraw Hill Science Engineering and Math. Columbus, OH. Chern, S. J. 1989. Experimental Design and Modeling of a Continuous Counterflow
Solid-Solid Heat Transfer Process. Ph.D. Thesis. Oklahoma State University. Stillwater, OK.
Chu, S.T. and A. Hustrulid. 1968. Numerical Solution of Diffusion Equations.
Transactions of the ASAE. 11:705-709. Crank, J. 1975. Mathematics of Diffusion. Second Edition. J.W. Arrowsmith LTD.
Bristol, England. Davis, P. J. and P. Rabinowitz. 1984. Methods of Numerical Integration. Orlando
Academic Press. St. Louis, MO.
48
Edens, S. 2008. Personal Communication. Bliss Industries Inc. Ponca City, OK. Eversull, E. 2005. Consolidation, Expansion Spark Growth in Cooperative Feed Sales.
USDA Rural Development. Available at: www.rurdev.usda.gov/rbs/pub/jul05/expansion.htm.
Friedrich, W. 1980. Der Kühlvorgang von Mischfutterpellets und sien Einfluβ auf die
Pelletfestigkeit. Die Mühle und Mischfuttertechnik. 117. 20. 268 - 281 Harper, Allen. 1998. The Importance of Pellet Quality in Hog Feeding. Livestock
Update. Available at: http://www.ext.vt.edu/news/periodicals/livestock/aps-98_09/aps-969.html Heldman, D.R. and D.B. Lund. 2007. Handbook of Food Engineering. Second Edition.
CRC Press. Boca Raton, FL. Hensley P. 2006. Personal Communication. Bliss Industries Inc. Ponca City, OK. Kloppers, J. C., and Kröger, D. G., 2005, “A Critical Investigation Into the Heat and
Mass Transfer Analysis of Counterflow Wet-Cooling Towers,” Journal of Heat Mass Transfer, 48: 765–777.
Locke J. 2008. Personal Communication. Bliss Industries Inc. Ponca City, OK. Maier, D.E. 1988. The Counterflow Cooling of Feed Pellets. M.S. Thesis. Michigan State
University. East Lansing, MI. Morley, D., C. S. Parker. 2006. Understanding Computers: Today and Tomorrow. Tenth
Edition. Thomson Course Technology. Boston, MA Pabis, S. and S. M. Henderson. 1961. Grain Drying Theory: II. A Critical Analysis of the
Drying Curve of Shelled Maize. Journal of Agricultural Engineering Research. 6: 272-277
Ramaswami, A., J. B. Milford., and M. J. Small. 2005. Integrated Environmental
Modeling: Pollutant Transport, Fate, and Risk in the Environment. John Wiley & Sons, Inc. Hoboken, NJ.
Ren, C. 2006. An Analytical Approach to the Heat and Mass Transfer Processes in
Counterflow Cooling Towers. Journal of Heat Transfer. 128:1142-1148. Robinson, R.A. 1983. Pellet Cooling. Feed Compounding. Milling.12:26-27 United State Department of Agriculture. 2005. National Agricultural Statistic Service.
Agricultural Statistics. Statistics of Grain and Feed. Available at: http://www.usda.gov/nass/pubs/agr05/05_ch1.PDF
49
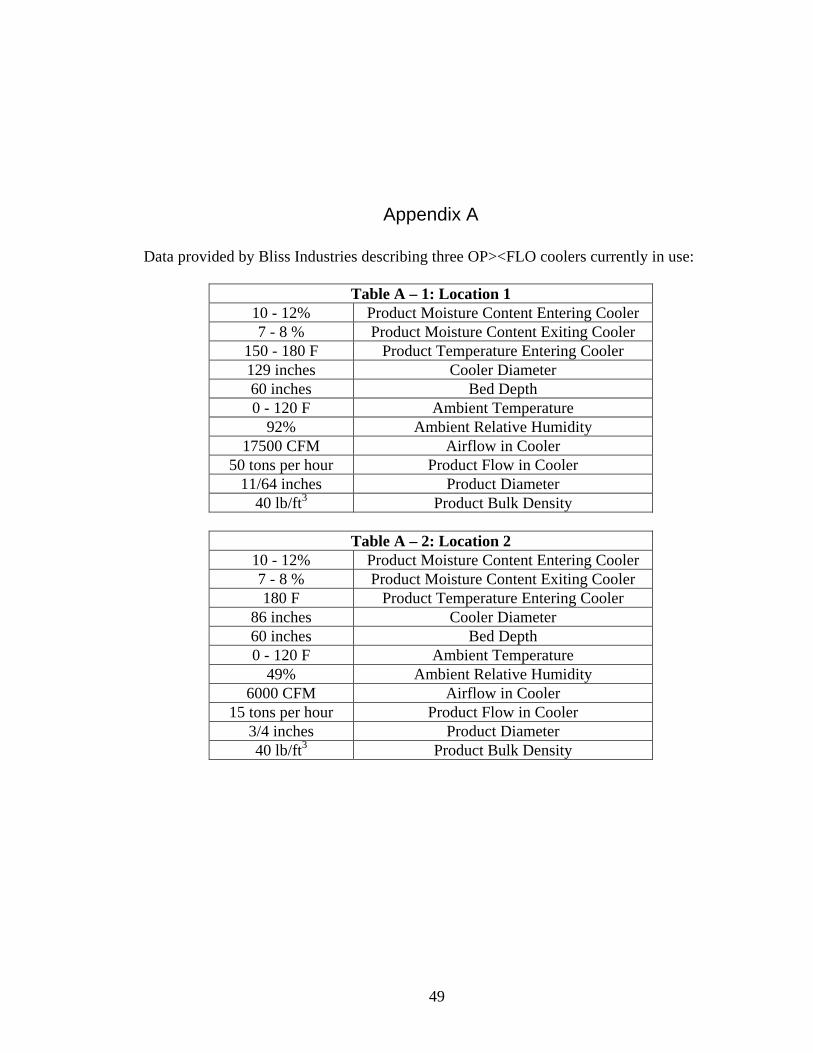
Appendix A Data provided by Bliss Industries describing three OP><FLO coolers currently in use:
Table A – 1: Location 1 10 - 12% Product Moisture Content Entering Cooler 7 - 8 % Product Moisture Content Exiting Cooler
150 - 180 F Product Temperature Entering Cooler 129 inches Cooler Diameter 60 inches Bed Depth 0 - 120 F Ambient Temperature
92% Ambient Relative Humidity 17500 CFM Airflow in Cooler
50 tons per hour Product Flow in Cooler 11/64 inches Product Diameter
40 lb/ft3 Product Bulk Density
Table A – 2: Location 2 10 - 12% Product Moisture Content Entering Cooler 7 - 8 % Product Moisture Content Exiting Cooler 180 F Product Temperature Entering Cooler
86 inches Cooler Diameter 60 inches Bed Depth 0 - 120 F Ambient Temperature
49% Ambient Relative Humidity 6000 CFM Airflow in Cooler
15 tons per hour Product Flow in Cooler 3/4 inches Product Diameter 40 lb/ft3 Product Bulk Density
50
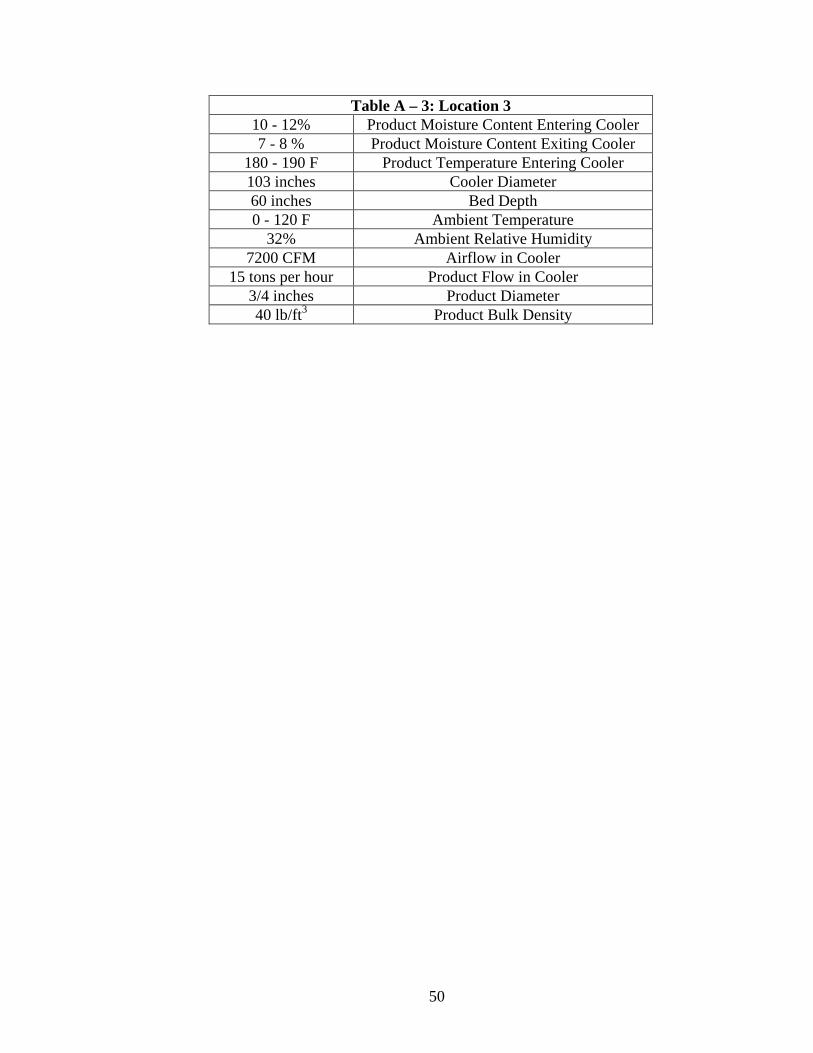
Table A – 3: Location 3 10 - 12% Product Moisture Content Entering Cooler 7 - 8 % Product Moisture Content Exiting Cooler
180 - 190 F Product Temperature Entering Cooler 103 inches Cooler Diameter 60 inches Bed Depth 0 - 120 F Ambient Temperature
32% Ambient Relative Humidity 7200 CFM Airflow in Cooler
15 tons per hour Product Flow in Cooler 3/4 inches Product Diameter 40 lb/ft3 Product Bulk Density
51
_
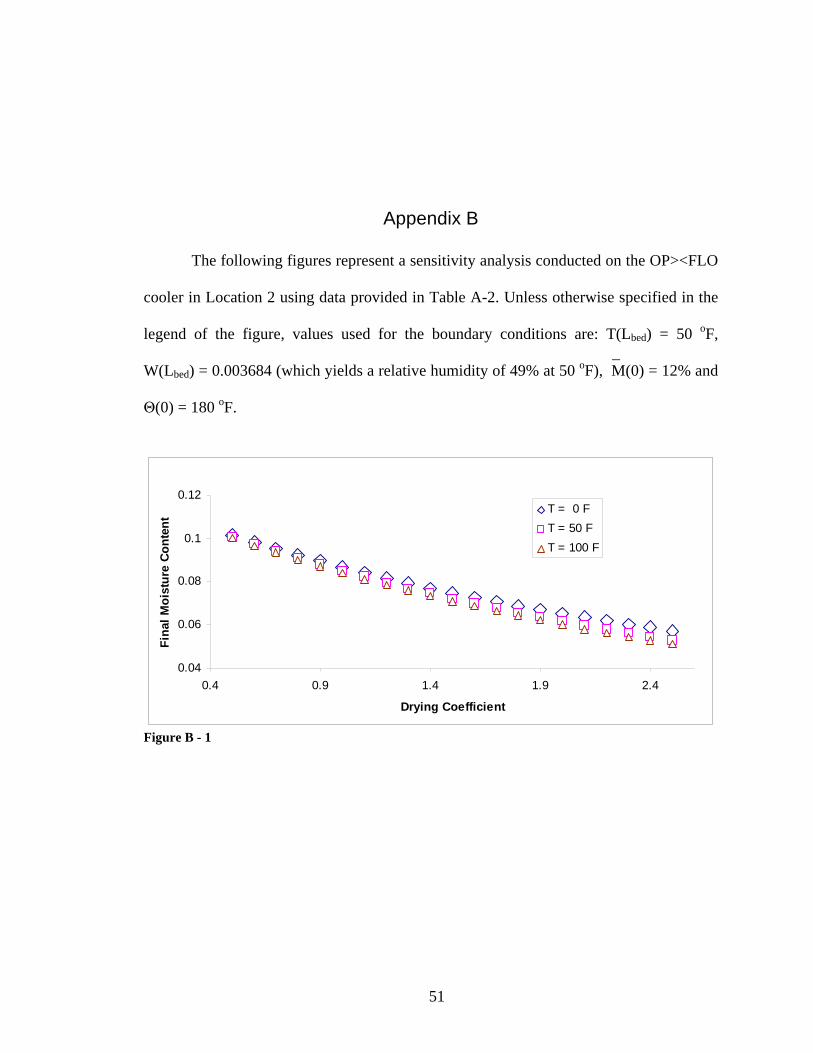
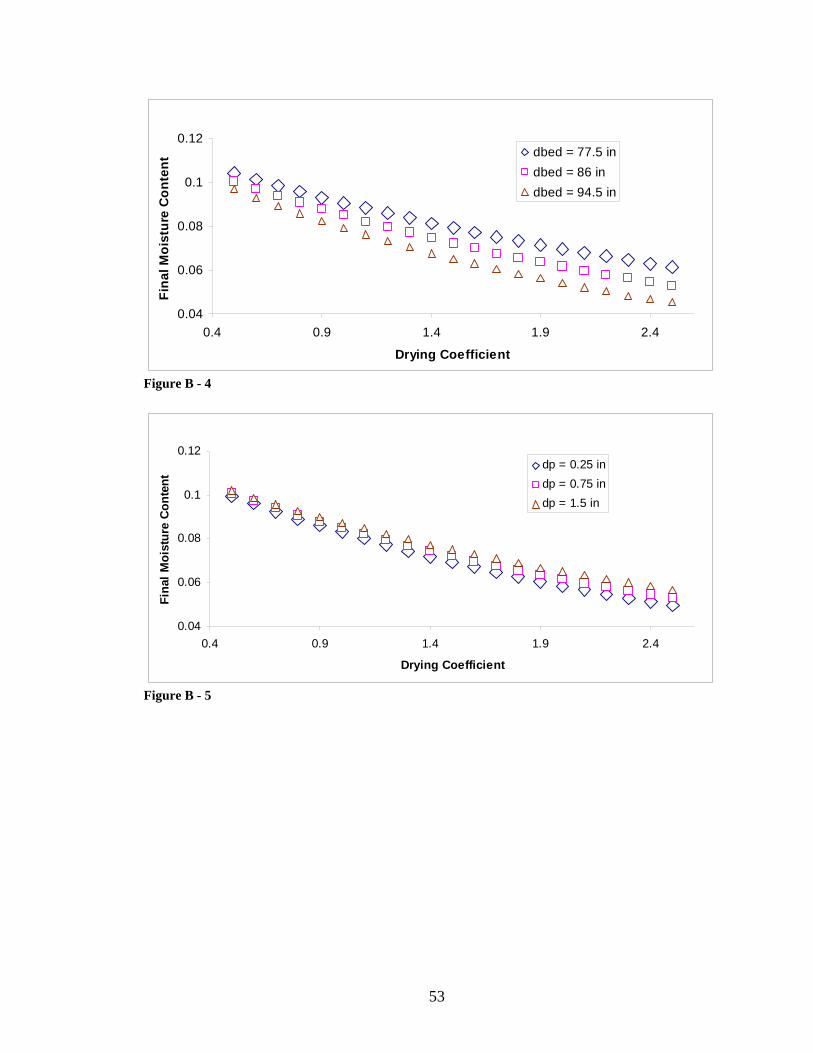
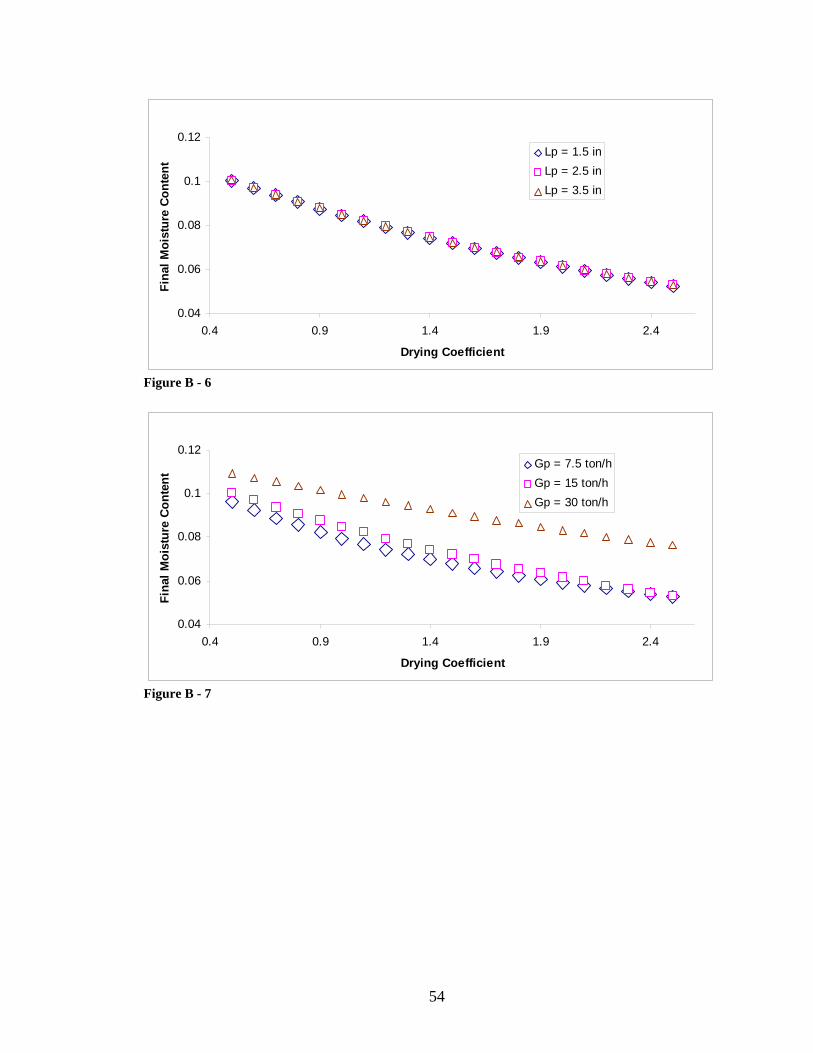
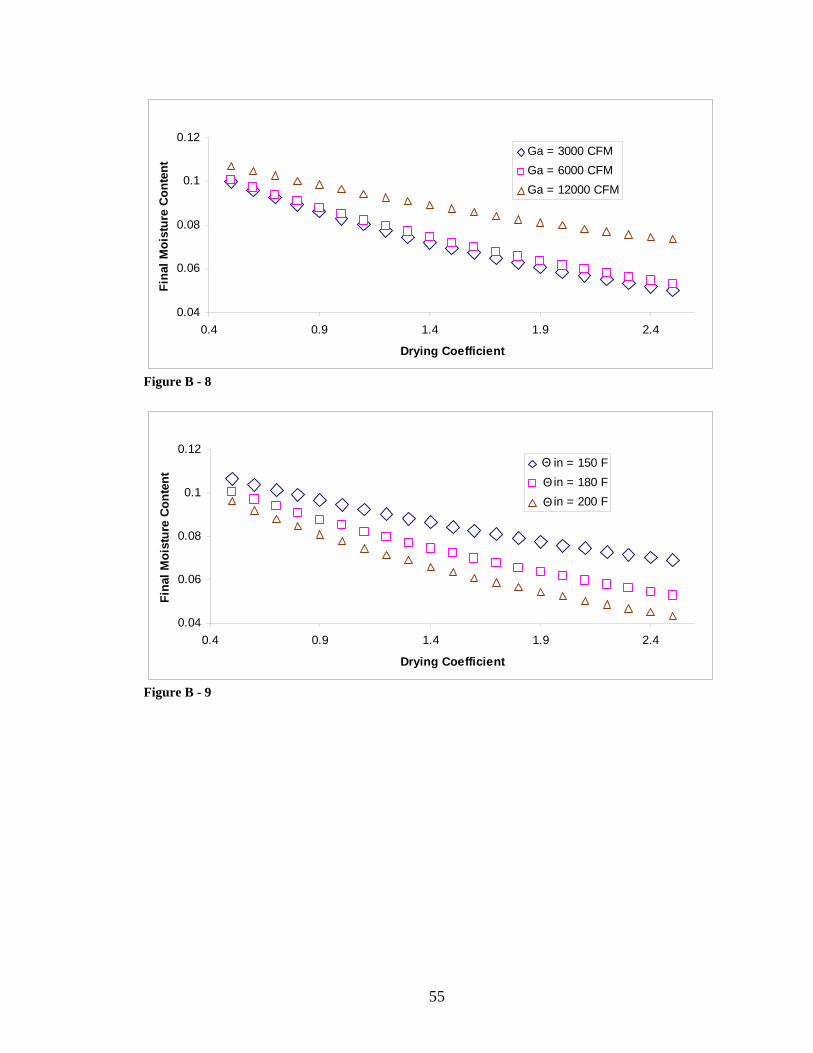
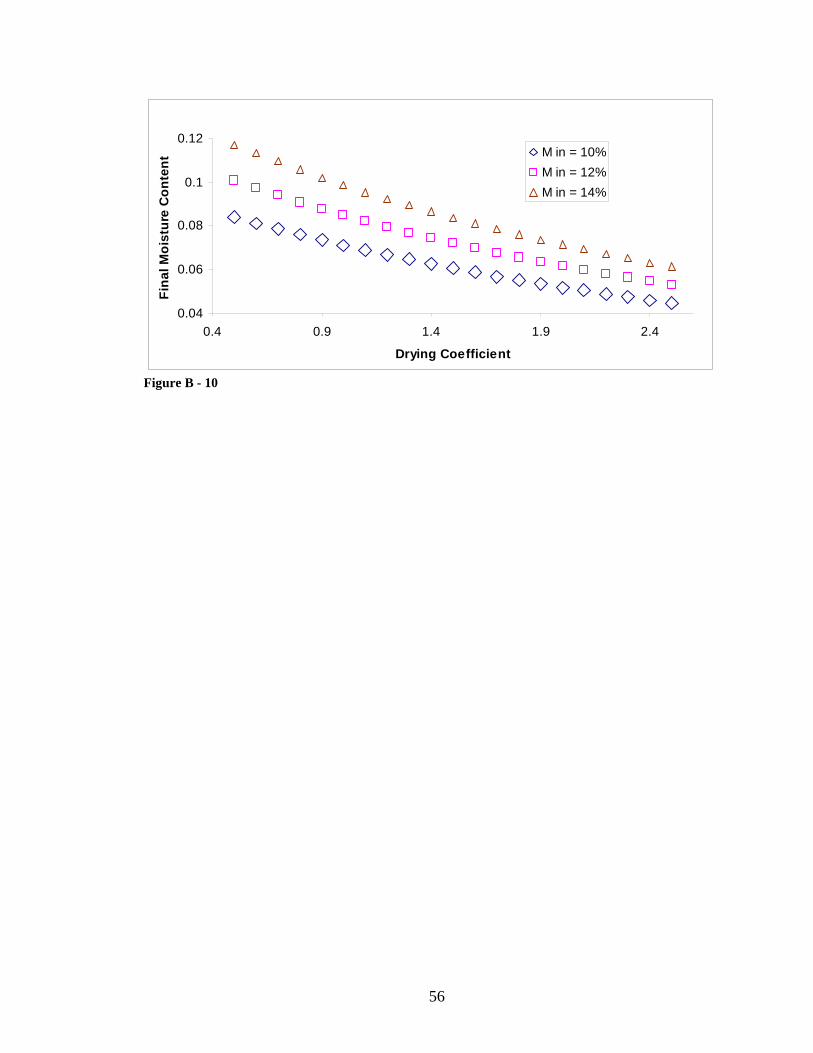
Appendix B
The following figures represent a sensitivity analysis conducted on the OP><FLO
cooler in Location 2 using data provided in Table A-2. Unless otherwise specified in the
legend of the figure, values used for the boundary conditions are: T(Lbed) = 50 oF,
W(Lbed) = 0.003684 (which yields a relative humidity of 49% at 50 oF), M(0) = 12% and
Θ(0) = 180 oF.
0.04
0.06
0.08
0.1
0.12
0.4 0.9 1.4 1.9 2.4
Drying Coefficient
Fin
al M
oist
ure
Con
tent
T = 0 F
T = 50 F
T = 100 F
Figure B - 1
52
0.04
0.06
0.08
0.1
0.12
0.4 0.9 1.4 1.9 2.4
Drying Coefficient
Fin
al M
oist
ure
Con
tent
W =0.001842
W = 0.003684
W = 0.007369
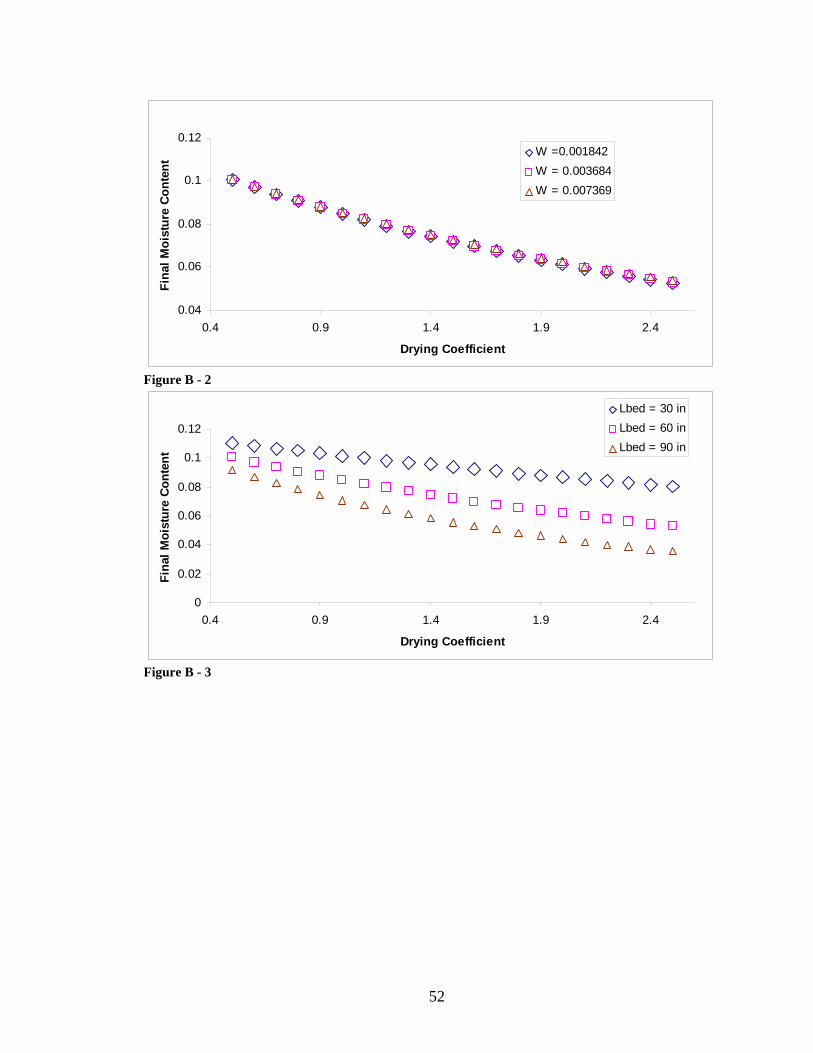
Figure B - 2
0
0.02
0.04
0.06
0.08
0.1
0.12
0.4 0.9 1.4 1.9 2.4
Drying Coefficient
Fin
al M
oist
ure
Con
tent
Lbed = 30 in
Lbed = 60 in
Lbed = 90 in
Figure B - 3
53
0.04
0.06
0.08
0.1
0.12
0.4 0.9 1.4 1.9 2.4
Drying Coefficient
Fin
al M
oist
ure
Con
tent
dbed = 77.5 in
dbed = 86 in
dbed = 94.5 in
Figure B - 4
0.04
0.06
0.08
0.1
0.12
0.4 0.9 1.4 1.9 2.4
Drying Coefficient
Fin
al M
oist
ure
Con
tent
dp = 0.25 in
dp = 0.75 in
dp = 1.5 in
Figure B - 5
54
0.04
0.06
0.08
0.1
0.12
0.4 0.9 1.4 1.9 2.4
Drying Coefficient
Fin
al M
oist
ure
Con
tent
Lp = 1.5 in
Lp = 2.5 in
Lp = 3.5 in
Figure B - 6
0.04
0.06
0.08
0.1
0.12
0.4 0.9 1.4 1.9 2.4
Drying Coefficient
Fin
al M
oist
ure
Con
tent
Gp = 7.5 ton/h
Gp = 15 ton/h
Gp = 30 ton/h
Figure B - 7
55
0.04
0.06
0.08
0.1
0.12
0.4 0.9 1.4 1.9 2.4
Drying Coefficient
Fin
al M
oist
ure
Con
tent
Ga = 3000 CFM
Ga = 6000 CFM
Ga = 12000 CFM
Figure B - 8
0.04
0.06
0.08
0.1
0.12
0.4 0.9 1.4 1.9 2.4
Drying Coefficient
Fin
al M
oist
ure
Con
tent
in = 150 F
in = 180 F
in = 200 F
Figure B - 9
Θ
Θ
Θ
56
0.04
0.06
0.08
0.1
0.12
0.4 0.9 1.4 1.9 2.4
Drying Coefficient
Fin
al M
oist
ure
Con
tent
M in = 10%
M in = 12%
M in = 14%
Figure B - 10
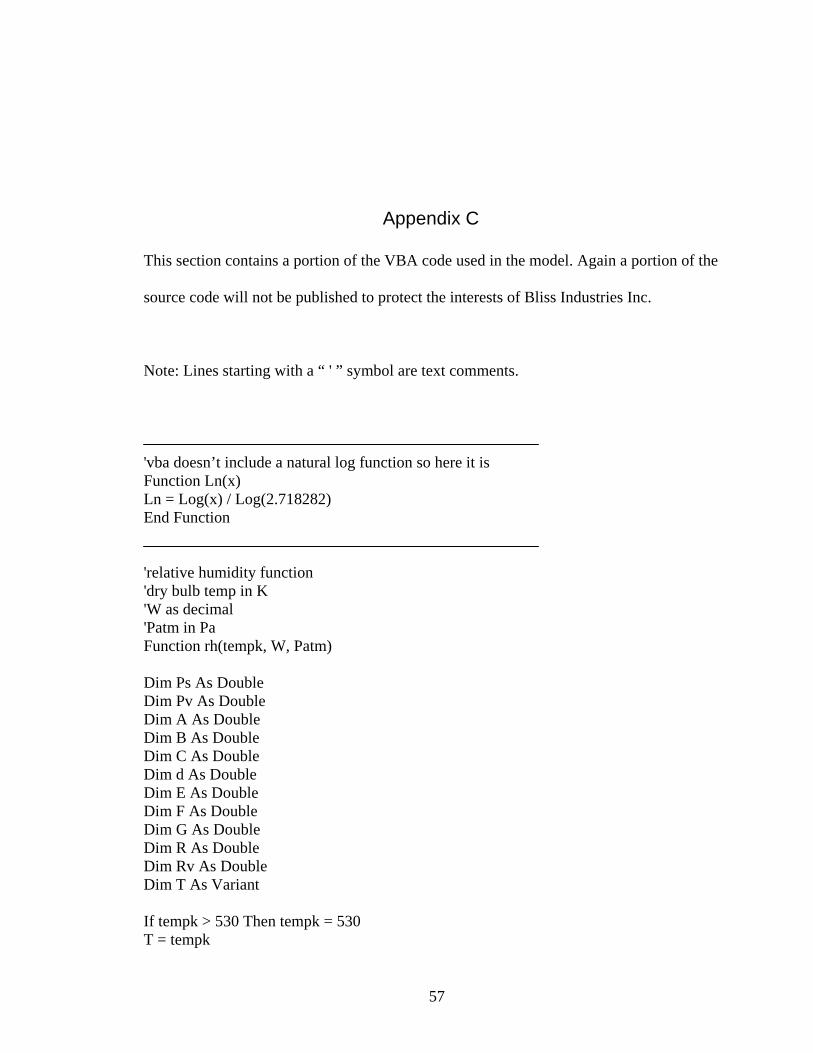
57
Appendix C This section contains a portion of the VBA code used in the model. Again a portion of the
source code will not be published to protect the interests of Bliss Industries Inc.
Note: Lines starting with a “ ' ” symbol are text comments.
'vba doesn’t include a natural log function so here it is Function Ln(x) Ln = Log(x) / Log(2.718282) End Function 'relative humidity function 'dry bulb temp in K 'W as decimal 'Patm in Pa Function rh(tempk, W, Patm) Dim Ps As Double Dim Pv As Double Dim A As Double Dim B As Double Dim C As Double Dim d As Double Dim E As Double Dim F As Double Dim G As Double Dim R As Double Dim Rv As Double Dim T As Variant If tempk > 530 Then tempk = 530 T = tempk
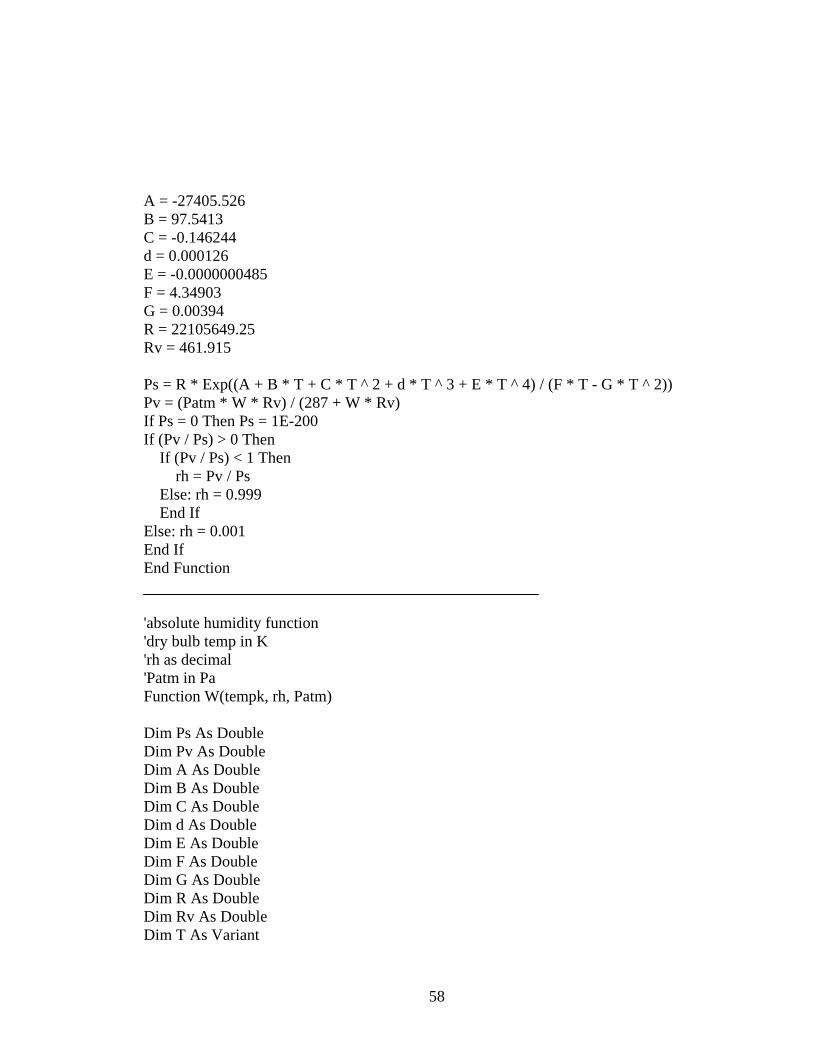
58
A = -27405.526 B = 97.5413 C = -0.146244 d = 0.000126 E = -0.0000000485 F = 4.34903 G = 0.00394 R = 22105649.25 Rv = 461.915 Ps = R * Exp((A + B * T + C * T ^ 2 + d * T ^ 3 + E * T ^ 4) / (F * T - G * T ^ 2)) Pv = (Patm * W * Rv) / (287 + W * Rv) If Ps = 0 Then Ps = 1E-200 If (Pv / Ps) > 0 Then If (Pv / Ps) < 1 Then rh = Pv / Ps Else: rh = 0.999 End If Else: rh = 0.001 End If End Function 'absolute humidity function 'dry bulb temp in K 'rh as decimal 'Patm in Pa Function W(tempk, rh, Patm) Dim Ps As Double Dim Pv As Double Dim A As Double Dim B As Double Dim C As Double Dim d As Double Dim E As Double Dim F As Double Dim G As Double Dim R As Double Dim Rv As Double Dim T As Variant
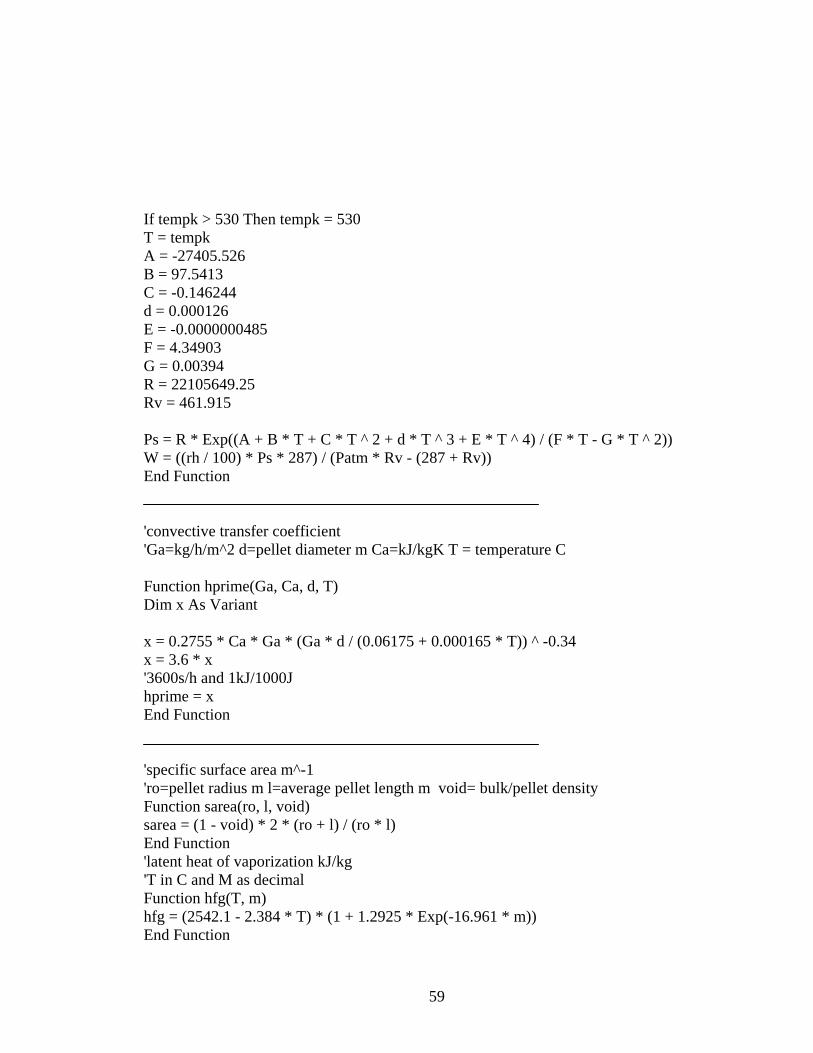
59
If tempk > 530 Then tempk = 530 T = tempk A = -27405.526 B = 97.5413 C = -0.146244 d = 0.000126 E = -0.0000000485 F = 4.34903 G = 0.00394 R = 22105649.25 Rv = 461.915 Ps = R * Exp((A + B * T + C * T ^ 2 + d * T ^ 3 + E * T ^ 4) / (F * T - G * T ^ 2)) W = ((rh / 100) * Ps * 287) / (Patm * Rv - (287 + Rv)) End Function 'convective transfer coefficient 'Ga=kg/h/m^2 d=pellet diameter m Ca=kJ/kgK T = temperature C Function hprime(Ga, Ca, d, T) Dim x As Variant x = 0.2755 * Ca * Ga * (Ga * d / (0.06175 + 0.000165 * T)) ^ -0.34 x = 3.6 * x '3600s/h and 1kJ/1000J hprime = x End Function 'specific surface area m^-1 'ro=pellet radius m l=average pellet length m void= bulk/pellet density Function sarea(ro, l, void) sarea = (1 - void) * 2 * (ro + l) / (ro * l) End Function 'latent heat of vaporization kJ/kg 'T in C and M as decimal Function hfg(T, m) hfg = (2542.1 - 2.384 * T) * (1 + 1.2925 * Exp(-16.961 * m)) End Function
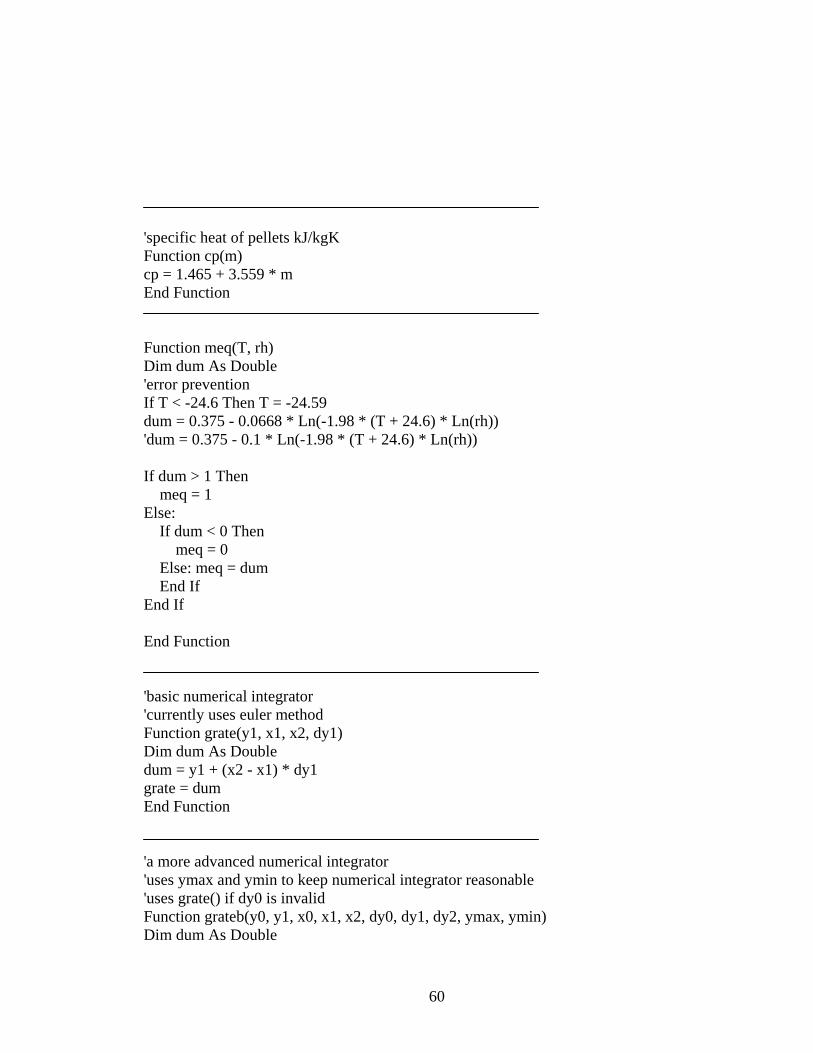
60
'specific heat of pellets kJ/kgK Function cp(m) cp = 1.465 + 3.559 * m End Function Function meq(T, rh) Dim dum As Double 'error prevention If T < -24.6 Then T = -24.59 dum = 0.375 - 0.0668 * Ln(-1.98 * (T + 24.6) * Ln(rh)) 'dum = 0.375 - 0.1 * Ln(-1.98 * (T + 24.6) * Ln(rh)) If dum > 1 Then meq = 1 Else: If dum < 0 Then meq = 0 Else: meq = dum End If End If End Function 'basic numerical integrator 'currently uses euler method Function grate(y1, x1, x2, dy1) Dim dum As Double dum = y1 + (x2 - x1) * dy1 grate = dum End Function 'a more advanced numerical integrator 'uses ymax and ymin to keep numerical integrator reasonable 'uses grate() if dy0 is invalid Function grateb(y0, y1, x0, x1, x2, dy0, dy1, dy2, ymax, ymin) Dim dum As Double
61
' the next statement can be removed to use Simpson's method of integration if desired dy0 = "a" If IsNumeric(dy0) = False Then dum = grate(y1, x1, x2, dy1) Else: dum = y0 + ((x2 - x0) * (dy0 + 4 * dy1 + dy2) / 6) End If If dum < ymin Then dum = ymin If dum > ymax Then dum = ymax grateb = dum End Function
VITA
Steven Littleton Fowler
Candidate for the Degree of
Master of Science Thesis: OPTIMAL SIZING OF A COUNTERFLOW COOLER FOR FEED PELLETS Major Field: Biosystems Engineering Biographical:
Personal Data: The author was born and raised in Oklahoma. The author is passionate about
agricultural engineering, teaching, and music Education: B. S. Biosystems Engineering, Oklahoma State University, May 2004 Completed the requirements for the Master of Science in Biosystems
Engineering at Oklahoma State University, Stillwater, Oklahoma in July, 2008.
Experience: The author has worked in multiple facets of the beef industry including:
breeding, raising, feeding, managing, and meat processing. The author also has four years of teaching experience in higher education Professional Memberships: American Society of Agricultural and Biological Engineers Tau Beta Pi Alpha Epsilon
Name: Steven Littleton Fowler Date of Degree: July 2008 Institution: Oklahoma State University Location: Stillwater, OK Title of Study: OPTIMAL SIZING OF A COUNTERFLOW COOLER FOR FEED
PELLETS Pages in Study: 61 Candidate for the Degree of Master of Science Major Field: Biosystems Engineering Scope and Method of Study: The goal of this research is to develop a tool to assist in the
selection of an appropriately sized counter flow cooler for feed pellets. Of primary concern is the OP><FLO cooler manufactured and sold by Bliss Industries Inc. A computer model was developed to estimate the temperature and moisture content of the feed pellets and cooling air throughout a working cooler, and calibrated using data from operational OP><FLO coolers.
Findings and Conclusions: A stable model was developed in a Microsoft Excel workbook
containing functions and macros written in VBA. This workbook was provided to Bliss Industries as a tool for selecting an appropriate size for an OP><FLO cooler. The model provides reasonable estimates of final moisture content of feed pellets, and an estimate of how a cooler operates under varying conditions. Additional data may be needed to further validate the model.
Advisor’s Approval Timothy Bowser
Related Documents