IOVS 17-21832-R2 Accepted version Optical Coherence Tomography Analysis Based Prediction of Humphrey 24-2 Visual Field Thresholds in Patients with Glaucoma [OCT based prediction of visual fields] Precis (35 words) We validated the performance of prediction of individual Humphrey 24-2 visual field thresholds from 9-field OCT analysis on patients with early to severe glaucoma. Zhihui Guo 6 Young H. Kwon, MD, PhD 2,3 Kyungmoo Lee, PhD 1 Kai Wang, PhD 4 Andreas Wahle 1 Wallace L.M. Alward 2,3 John H. Fingert 2,3 Daniel I. Bettis 3 Chris A. Johnson, PhD 3 Mona K. Garvin, PhD 1,5 Milan Sonka, PhD 1,3 Michael D. Abramoff, MD, PhD 1,2,3,5,6* 1 Department of Electrical and Computer Engineering, University of Iowa 2 Stephen A. Wynn Institute for Vision Research, University of Iowa 3 Department of Ophthalmology and Visual Sciences, University of Iowa 4 Department of Biostatistics, College of Public Health, University of Iowa 5 Iowa City VA Health Care System 6 Department of Biomedical Engineering, University of Iowa *Corresponding author: [email protected], The University of Iowa, 11205 Pomerantz Family Pavilion, Iowa City, IA 52242, USA, phone: 319-384-5833. Financial support: This work was partially supported by NIH grants R01 EY019112, R01 EY018853 and R01 EB004640; the Department of Veterans Affairs; the Marlene S. and Leonard A. Hadley Glaucoma Research Fund.

Welcome message from author
This document is posted to help you gain knowledge. Please leave a comment to let me know what you think about it! Share it to your friends and learn new things together.
Transcript
IOVS 17-21832-R2 Accepted version
Optical Coherence Tomography Analysis Based Prediction of
Humphrey 24-2 Visual Field Thresholds in Patients with Glaucoma
[OCT based prediction of visual fields]
Precis (35 words) We validated the performance of prediction of individual Humphrey 24-2 visual field
thresholds from 9-field OCT analysis on patients with early to severe glaucoma. Zhihui Guo6
Young H. Kwon, MD, PhD2,3 Kyungmoo Lee, PhD1
Kai Wang, PhD4 Andreas Wahle1 Wallace L.M. Alward2,3 John H. Fingert2,3 Daniel I. Bettis3 Chris A. Johnson, PhD3 Mona K. Garvin, PhD1,5 Milan Sonka, PhD1,3 Michael D. Abramoff, MD, PhD1,2,3,5,6*
1 Department of Electrical and Computer Engineering, University of Iowa 2 Stephen A. Wynn Institute for Vision Research, University of Iowa 3 Department of Ophthalmology and Visual Sciences, University of Iowa 4 Department of Biostatistics, College of Public Health, University of Iowa 5 Iowa City VA Health Care System 6 Department of Biomedical Engineering, University of Iowa *Corresponding author: [email protected], The University of Iowa, 11205 Pomerantz Family Pavilion, Iowa City, IA 52242, USA, phone: 319-384-5833.
Financial support: This work was partially supported by NIH grants R01 EY019112, R01 EY018853 and R01
EB004640; the Department of Veterans Affairs; the Marlene S. and Leonard A. Hadley Glaucoma Research Fund.
Dr. Kwon is supported by the Clifford M. & Ruth M. Altermatt Professorship. Dr. Alward is supported by the
Frederick C. Blodi Chair. Dr. Abramoff is supported by the Robert C. Watzke MD Professorship.
Financial disclosures: Abramoff (P), Sonka (P), Garvin (P)
Word Count:
Keywords: perimetry, visual field, image analysis, OCT, ganglion cell
Abstract
(250 words, 300 actual)
Purpose: A pilot study showed that prediction of individual Humphrey 24-2 visual field (HVF 24-2) sensitivity
thresholds from Optical Coherence Tomography (OCT) image analysis is possible. We evaluate performance of
an improved approach as well as 3 other predictive algorithms on a new, fully independent, set of glaucoma
subjects.
Methods: Subjects underwent HVF 24-2 and 9-field OCT (Heidelberg Spectralis). Nerve fiber (NFL), and ganglion
cell and inner plexiform layer (GCL+IPL) were co-segmented and partitioned into 52 sectors matching HVF 24-2
test locations. Average Pearson correlation of actual and predicted thresholds was determined on four
prediction models (using different, physiologically plausible, combinations of GCL+IPL and NFL sectorial
thicknesses). Wilcoxon rank sum test was applied to test correlation R, root mean square error (RMSE) and limits
of agreement (LoA) between actual and predicted thresholds for different models. The training data consisted of
the 9-field OCT and HVF 24-2 thresholds of 111 glaucoma patients from our pilot study.
Results: 112 subjects (112 eyes) with early, moderate or advanced primary and secondary open angle glaucoma
were included. Subjects with less than 9 scans (15/112) or insufficient quality segmentations (11/97) were
excluded. RGC-AC optimized had superior average R (95% CI)=0.74 (0.67-0.76) and RMSE (95% CI) =5.42 (3.4-7.5)
dB, significantly better (p <0.05/3) than the other three models: Naïve (R=0.49, 95% CI: 0.44-0.54; RMSE=7.24
dB, 95% CI: 3.1-11.4 dB), Garway-Heath (R=0.66, 95% CI: 0.60-0.68; RMSE=6.07 dB, 95% CI: 3.4-8.8 dB), Donut
(R=0.67, 95% CI: 0.61-0.69; RMSE=6.08 dB, 95% CI: 3.8-8.3 dB).
Conclusions: The proposed RGC-AC optimized predictive algorithm based on 9-field OCT image analysis and the
RGC-AC concept to predict all individual HVF 24-2 test locations sensitivity thresholds is superior to previous
methods and its performance is close to the reproducibility of HVF 24-2.
Introduction
The limitations of reliability and reproducibility of visual field (VF) testing, as the main parameter in assessing
glaucoma damage, inhibit optimal patient care and research for improved outcome. The clinical standard for VF
testing in glaucoma is automated perimetry, and the Humphrey 24-2 SITA Standard visual field (HVF 24-2) is the
most widely used. However, once moderate VF loss occurs, 12-15 dB mean deviation (MD) loss or more, VF test-
retest variability rises substantially1-4 and limits a reliable determination of change.
Optical Coherence Tomography (OCT) can quantify glaucomatous damage through nerve fiber layer thickness
and cup-to-disc estimates in a patient-friendly, robust and reproducible fashion. 5-7 However, OCT derived
measurements of glaucoma damage correlate poorly with visual field thresholds. 8-11 We have previously shown
that OCT based image analysis in glaucoma patients allows loss to be quantified from the retinal ganglion cell
body to the optic nerve head, 12 suggesting that damage to the retinal ganglion cell—axonal complex occurs
simultaneously along this entire path. We proposed the term Retinal-Ganglion-Cell Axonal Complex (RGC-AC) to
stress the distributed nature of this loss in multiple neighboring ganglion cells and corresponding axons, which
leads to characteristic glaucomatous visual field loss, while damage to the part of the RGC-AC within the optic
nerve head leads to characteristic cupping.
We also demonstrated that retinal anatomy-based analysis of multi-field SD-OCT can predict the thresholds at
all 52 test locations of the most widely used Humphrey 24-2 VF with an average correlation of 0.68, 13 in a leave-
one-out test design. In a pilot study, average correlation between repeat Humphrey 24-2 thresholds in
established glaucoma patients proficient in perimetry is 0.83, (Abramoff MD , IOVS, 2015, 56, ARVO E-abstract
1696) which allows additional improvements in the image analysis and predictive algorithm up to that
performance limit to be measured. Improvements in the predictive algorithm make it of interest to compare
these to our previously published approach, as well as the widely used peripapillary nerve fiber layer thickness
assessment. In addition, an independent test population of patients with a wide range of glaucoma severity,
allows a better assessment of external validity.
Thus, the purpose of this study is to a) demonstrate the performance improvement by more sophisticated OCT
image analysis and b) validate this performance on an independent test set of glaucoma subjects.
Methods
Subjects
In this prospective study, inclusion criteria were as reported previously and summarized here13: age 18–85,
diagnosed with glaucoma suspect or open-angle glaucoma according to the following definitions:
• Glaucoma suspect: suspicious optic nerve appearance (enlarged cupping on clinical examination) with
normal visual field and intraocular pressure (IOP ≤ 21 mmHg) or normal optic disc appearance on
biomicroscopy and normal visual field, but with elevated IOP (> 21 mmHg).
• Open-angle glaucoma: primary or secondary open-angle glaucoma (e.g. exfoliative or pigmentary) with
an open iridocorneal angle, glaucomatous optic disc and/or nerve fiber layer defects on biomicroscopy,
and visual field changes (regardless of IOP level). Glaucomatous optic discs were identified as those with
either diffuse or focal thinning of the neuroretinal rim. Visual field abnormalities were considered to be
glaucomatous if they were consistent with the optic nerve examination and had either (i) a typical nerve
fiber layer distribution, or (ii) a glaucoma hemifield test outside the normal limits. This diagnosis was
made by fellowship trained glaucoma specialists according to the above definitions.
Subject’s fundus visualization sufficient on indirect ophthalmoscopy to allow OCT; able to undergo perimetry
Humphrey 24-2 VF SITA Standard with sufficient reliability (FP error<15% and FN error <25%, FL <33%);
perimetry obtained within a 3-month period of SD-OCT imaging; perimetry free of artifacts, such as lens rim
effects. Exclusion criteria were a history of angle closure or combined mechanism glaucoma, or any non-
glaucomatous optic neuropathy, corneal or retinal diseases that can affect visual field, cataracts or any other
disease with visual acuity < 20/40 and OCT of unsuitable quality determined by visual observation. Subjects were
recruited matching age and disease severity in one of three approximately equally sized severity groups, based
on the mean deviation of the 24-2 HVF threshold testing:
• early glaucoma (including glaucoma suspects) < 6 dB loss
• moderate glaucoma 6-12 dB loss
• advanced glaucoma > 12 dB loss.
One eye of each subject was studied. When both eyes were eligible, the study eye was chosen to reflect
adequate representation of each of the three severity groups.
Data Collection
As previously stated, 13 standardized automated perimetry based on SITA Standard 24-2 VF protocol was
performed with the Humphrey Field Analyzer (HFA II, Carl Zeiss Meditec, Inc., Dublin, CA, USA), which evaluates
the VF as threshold assessments at 52 different retinal locations (the two locations corresponding to the blind
spot were subtracted from the total of 54 locations). For OCT image acquisition, a 9-field per eye protocol was
used, where a subject sequentially fixates on a spot 12.5o apart in a 3×3 grid pattern. This protocol takes
approximately 5 min per eye and covers 60o on the retina, sufficiently large enough to include the 60o area
probed with 24-2 VF test. Each field is imaged with SD-OCT (Spectralis; Heidelberg Engineering, Inc., Heidelberg,
Germany, 768×61×496 voxels, 9.53×8.07×1.92 mm3, with a voxel size of 12.41×132.22×3.87 µm3) using eye
tracking mode. The device additionally acquires a 2D scanning laser ophthalmoscopy (SLO) fundus image
(768×768 pixels, 9.5×9.5 mm2 with a pixel size of 12.41×12.41 µm2), automatically co-registered with the OCT
image by the device. Both the raw VF data, exported from the Humphrey Field Analyzer as integer threshold
data, as well as the raw OCT volumes, exported as .vol format, were de-identified, and stored in our XNAT
ophthalmology research database. 14 The study protocol was approved by the Institutional Review Board of the
University of Iowa and adhered to the tenets of the Declaration of Helsinki; written informed consent was
obtained from all participants, and HIPAA compliance was adhered to.
Multi-Field Registration and Intraretinal Layer Segmentation
We have previously described how the 9-field OCT volumes are registered, and regional nerve fiber layer and
ganglion cell layer thickness is quantified. 13 In summary, all 9 individual SLO images are automatically registered,
and the resulting affine (i.e. only including scaling, rotation, and translation) transformations are then applied to
the corresponding OCT volumes, so that their relative positions, scales and rotations are known. The retinal
layers (nerve fiber (NFL), ganglion cell and inner plexiform layer (GCL+IPL)) of all OCT volumes thus aligned, are
co-segmented, taking into account the possible mutual displacements along the z-axis, using an extension of the
Iowa Reference Algorithms. 15-17 After co-segmentation, the volumes and segmented surfaces are stitched
together to obtain a wide-field composite OCT (Figure 1) and the corresponding layer thicknesses (Figure 2). As
we did previously, we partition the wide field composite OCT into 54 sectors that correspond to the HVF 24-2
SAP matrix, called Structure-Grid (S-Grid) where the automatically identified fovea and optic nerve head (ONH)
center are co-registered to the fixation and the center of sector 26 respectively. 13,18,19 Thus, essentially all A-
scans in the wide field composite OCT are assigned to a corresponding S-Grid sector, and the average GCL+IPL
and NFL thickness values are computed as the mean layer thickness from all A-scans in that sector, from a total
of approximately 2000 A-scans per sector. Any missing thickness information of a sector, is bilinearly
interpolated from the four neighboring sectors.
Prediction of VF threshold for each sector from NFL and GCL+IPL thicknesses
As we did previously, 13 we built independent predictive models for each sector threshold, except for sectors 26
and 35 which cover the ONH area. These models only use the NFL and GCL+IPL thicknesses for one or more
(structural) sectors, so no functional information is used as input to the model. In order to study the effect of the
contribution of a structural sector, i.e. the contribution of a sector’s regional NFL and GCL+IPL thickness, four
models were compared for each sector threshold prediction, using four different approaches for model inputs,
with their descriptors in italics, as follows:
• Naive: GCL+IPL and NFL thickness for the predicted sector only.
• Donut: NFL thickness of 10 sectors that form a donut centered on the optic nerve head. This is the
approach that most closely approximates the use of peripapillary nerve fiber layer thickness
measurements that is widely available in, for example, the Zeiss Cirrus SD-OCT20.
• Garway-Heath: GCL+IPL thickness for the predicted sector, as well as all NFL sectors that fall within the
Garway-Heath nerve fiber bundle distribution. 21 This is the approach we have published previously. 13
See Figure 3 for additional insight.
• RGC-AC optimized: GCL+IPL thickness for the predicted sector, as well as NFL thicknesses for a set of
between 1-10 sectors following the so-called Retinal Ganglion Cell-Axonal Complex (RGC-AC) optimized
regional path. These sets are optimized for performance on the training set and approximate the nerve
fiber bundles as much as possible, by iteratively adding a sector using sequential floating forward sector
search,22 if the marginal improvement in correlation ΔR > 0.01. See Figure 4 and 5.
All sectors of which NFL and / or GCL+IPL are used to predict the HVF 24-2 threshold for sector 14 (as an
example) for RGC-AC optimized are shown in Figure 4, and examples of the sectors used for a single sector
prediction for the other three approaches are shown in Figure 3.
Each of these four approaches creates a feature vector that is then used to train the predictive model,
implemented as a support vector regression machine (SVM)23 with a radial basis function kernel. As previously,
to account for the slight rotation between the OCT imaging and actual perimetry, the S-Grid and the 24-2 VF grid
are aligned by similarity transform between two pairs of points, the center of the fovea on OCT and the fixation
center and the ONH center and blind spot center. Then a thin plate spline transform is used to interpolate the
actual measured thresholds on the S-Grid. Obviously this interpolation is only required when the predicted
sensitivity threshold needs to be associated with the measured sensitivity in a specific location. Each sector-
specific SVM is then trained using the sector NFL and GCL+IPL thicknesses in the corresponding feature vector
as described above, as well as using as the reference standard the corresponding interpolated VF thresholds for
the sector.
For training the predictive algorithms we used the data collected for our previous study, 13 as follows. We had
collected HVF 24-2 and 9-field OCT with exactly the same protocol and inclusion and exclusion criteria on 142
subjects from the Glaucoma Service at the University of Iowa. Among these 142 subjects, 20 had incomplete
imaging, 4 had no composite OCT volume and 7 had layer segmentation failure, and thus the data of 111
subjects could be used. A random eye from each of the remaining 111 subjects was selected the training set
(111 eyes, 999 scans), of which 59 were OD and 52 were OS. 39 had early, 36 had moderate, and 36 had
advanced glaucoma. Thus there were 111 (subjects) x 52 (sectors) training vectors used for training the four
approaches.
All other parameters for the SVM were the same for all sectors, and no other training data was used. Once
trained, each sector’s predictive model, given a corresponding previously unseen feature vector, produces a
predicted threshold at that sector. To make comparison to the familiar HVF 24-2 printout easier, we simulate
our result output as a grayscale map.
Statistical analysis
All left eye scans were mirrored to conform to the scans of the right eye. Primary outcome was the performance
improvement, measured by Pearson correlation R between the actual and predicted HVF 24-2 thresholds,
averaged over all 52 sectors, of the RGC-AC optimized approach over the other three approaches, on the
independent test set of newly recruited subjects with glaucoma. Average R and RMSE were calculated by
averaging the Pearson correlation coefficient (R) and RMSE between predicted and actual thresholds for all
subjects for each sector, and hypotheses were tested using the Wilcoxon rank sum test. We compared the LoA
between the measured and predicted HVF 24-2 by stratifying at 10 dB, 20 dB and 30 dB, for each model. For
each sector, a linear regression of all subjects predicted the difference between the predicted and measured
HVF 24-2, from the mean of the predicted and measured HVF 24-2 on the Bland-Altman plots.24 The LoA and its
95% confidence interval were calculated from the regression line.25 The Wilcoxon test was applied to 2
categories, the prediction error on the regression line (called bias) to test the bias from 0, and the width of the
LoA to test the range of agreements for the prediction error. These were also calculated for the repeat HVF 24-2.
Significance was set at the 0.05/3 level, with Bonferroni correction. For qualitative evaluation, grayscale maps of
the actual and predicted HVF 24-2 were created.
Results
We recruited 112 new consecutive participants from the Glaucoma Service at the University of Iowa. Of these
112 participants, 15/112 subjects were excluded due to incomplete imaging, and 11/97 (11%) subjects were
excluded because of complete layer segmentation failure (i.e. undetectable NFL/GCL layer and/or shift of NFL
lower boundary to GCL lower boundary), leaving 86 subjects for the study, and we used 48 OD & 38 OS. Thus
about 15% of the total number of potential subjects had to be excluded because of segmentation failures. One
eye from each of the remaining subjects formed the independent test set to evaluate the performance of the
four models. An independent test set was thus collected. Demographics of the 86 subjects were mean age, 65.3
years, 38 (44.2%) were male. 30 had early, 24 had moderate, and 32 had advanced glaucoma. The cohort
included 79 (self-identified) Caucasian subjects, 3 African-American, 1 Asian-American, 0 Native American
subjects, and 1 Native Hawaiian/Pacific Islander (race was unknown or undisclosed for remaining 2). Among the
79 Caucasian subjects, 0 subjects identified as Hispanic, and among the 7 non-Caucasian, one identified as
Hispanic.
The average Pearson correlation R (RMSE) between the interpolated, actual HFA 24-2 thresholds and OCT
predicted VF thresholds for RGC-AC optimized, was 0.74 (5.42 dB), averaged over all severity groups, and this
correlation was significantly higher than the average R achieved by the other three approaches, Naïve, Donut
and Garway-Heath, on this dataset (Table 1). Figure 6 shows the correlation R for each sector, and for each
approach, and RGC-AC optimized has significantly higher performance than all other models.
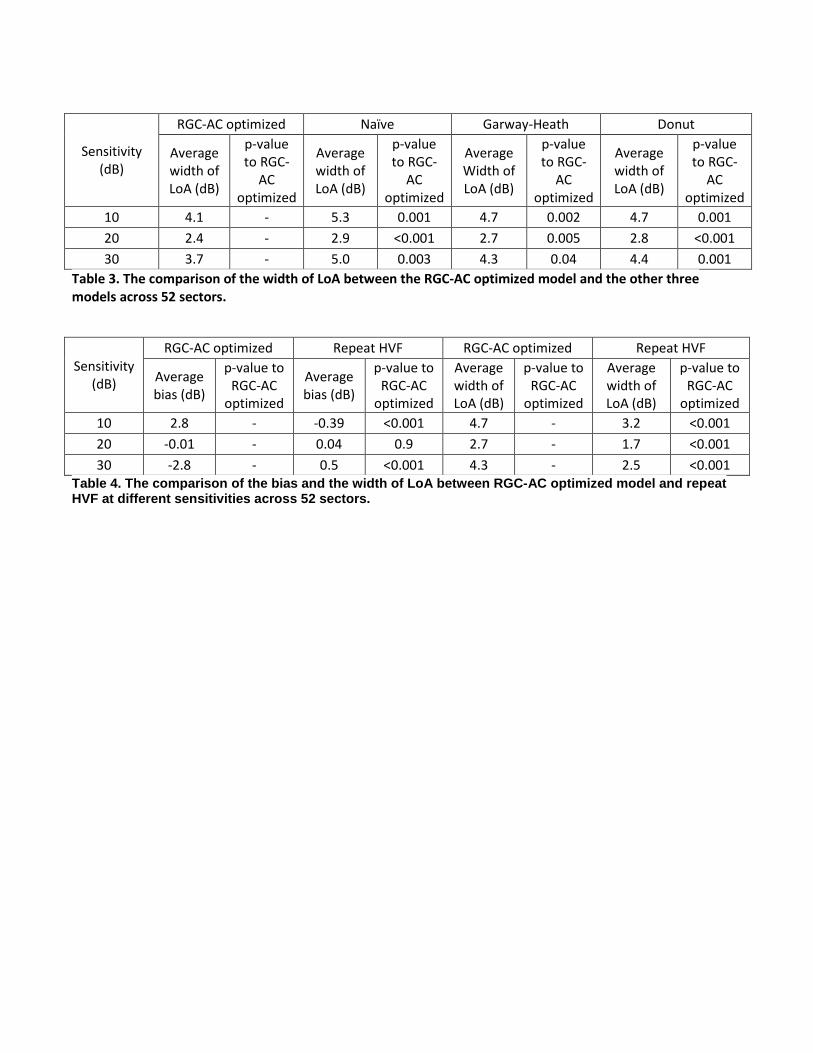
From Table 2 and 3, we conclude that the RGC-AC optimized model is significantly better than the other three
over the entire range. Table 4 shows that repeat HVF in a highly select sample of good test-takers still performs
better than the RGC-AC optimized model.
For qualitative evaluation, the grayscale maps that simulate the HVF 24-2 printout were generated for actual
and RGC-AC optimized predicted thresholds, grouped by glaucoma severity, as shown in Figure 7, while a
detailed comparison for a specific subject with advanced glaucoma is shown in Figure 8. Figure 9 compares the
predictive performance of all 86 subjects for the four models for a single HVF 24-2 sector (sector 11), which
shows the higher performance of the RGC-AC optimized model in the entire range of threshold values. For
comparison purposes, Figure 10 shows the predictive performance of HVF 24-2 sensitivity across all sectors for
RGC-AC optimized using the same box-whisker plot as used by Zhu et al., 26showing superior predictive
performance of the RGC-AC Optimized approach compared to their approach at thresholds less than 20 dB.
Average signed error from measured thresholds was -0.05dB, and average unsigned error was 4.19dB.27
If we included the 11 participants that had inadequate NFL and GCL+IPL segmentation (Figure 11), and thus did
not use the inclusion criteria, the RGC-AC Optimized prediction reached a lower average correlation R over all 97
subjects of 0.66 (95% CI 0.63-0.69). This clearly shows the importance of accurate layer segmentation as well as
the influence of correct NFL and GCL+IPL layer thickness values on the prediction outcome.
Discussion
The results of this study show the high predictive performance of the RGC-AC optimized approach to predict
visual field thresholds from 9-field OCT image analysis, with an average correlation R of 0.74 to the actual HVF
24-2 thresholds. This performance was achieved on a newly recruited, independent population of glaucoma
subjects with a wide distribution of glaucoma severity, using the RGC-AC Optimized approach trained on a
separate training set. Thus, no OCT images or HVF 24-2 thresholds of the subjects recruited for this study were
ever used to train the machine learning prediction algorithms. In addition, the performance of the newly
developed RGC-AC optimized approach was significantly better than three alternative approaches:
• Naïve, where only the nerve fiber layer, ganglion cell layer and inner plexiform layer thickness of the
predicted sector are used for prediction;
• Garway-Heath, our previously published, and so far best approach, using both GCL+IPL thickness of the
predicted sector as well as NFL thicknesses of the sectors in the presumed nerve fiber bundle paths as
determined by Garway Heath, et al.; 13
• and Donut, the approach that uses peripapillary NFL thickness only, to mimic as close as possible this
metric that is widely available on commercially available OCT devices, 20 even though Donut is a 2-D ring
incorporating many more A-scans than the commercially available, 1-D “peripapillary circle.”
Based on our results, we make several observations:
1) While present, there is only a limited amount of “plateau”, or leveling off of predictive performance, at
increasing severity of glaucoma. Compared to Zhu et al.’s 2010 work there is less of a plateau. We expect to
continue improving prediction performance and decrease the plateau in future studies.
2) Contrary to our expectations, the performance improvement of the RGC-AC optimized approach over the
peripapillary Donut approach is seen across the entire range of glaucoma severity, see Table 2 and 3, and as
illustrated for a single sector in the scatter plot in Figure 9. This is somewhat surprising as several studies have
shown a saturation effect for structure-function correlation at advanced glaucoma. 5,8,9,28,29 The difference here
is that we averaged the correlation values from each of the 52 sectors to calculate a final average R value for
each eye, as opposed to correlating mean NFL thickness with global HVF MD, i.e. using the average of only 2
numbers from each eye. As pointed out, Donut incorporates far more A-scans than the 1-D circle that is
commercially used. It is possible that these differences account for at least part of the much more robust
correlation between structure and function across all severity levels.
3) Substantial predictive performance can be obtained assuming that actual visual field threshold sensitivity
values are directly related to layer thicknesses, as a proxy of the number of axons or ganglion cells as measured
with OCT. Our premise thus remains that HVF 24-2 threshold is only related to the number of RGC and their
axons (i.e. the amount of RGC-AC remaining), and in fact we and others have shown age related loss of RGC-AC
in normal subjects.30,31 Confirmation of this hypothesis was beyond the scope of the present study but should be
investigated in the future.
4) Significantly better performance was reached by the RGC-AC optimized predictive model. This uses RGC-AC
bundle paths which are similar, but not identical, to the functionally derived bundle paths that were originally
described by Garway-Heath, et al. 21 As can be seen in Figure 4, the RGC-AC Optimized bundle paths, and
thereby the underlying ganglion cell axons, display substantial overlap. In some sectors, RGC-AC Optimized paths
include NFL sectors temporal of the sector to be predicted, which is unlikely to be anatomically correct. Rather
this is caused by the loss of axons in the more temporal sector covarying substantially with the loss in the
predicted sector. Refinement of the paths by making the structural sectors smaller, rather than being
determined by the spacing between HVF-24-2 test locations may further elucidate the population derived RGC-
AC bundle paths.
5) Accurate automated segmentation of the NFL and GCL+IPL layers is a pre-requisite to achieving the reported
prediction performance. Even though our NLF and GCL+IPL segmentation has matured, we excluded 11
participants (approximately 11%), because their segmentations were clearly insufficient. If included these as
subjects, predictive performance was substantially lower. Though we have developed automated segmentation
quality methods, 32 segmentation performance clearly needs to be improved, 33before our approach can be
considered for use on glaucoma patients.
6) We also replicated our second initial finding, that the correlation between structure and function is higher in
the superior than in the inferior retina. The correlations of the RGC-AC optimized model over the entire field
thus calculated for the superior hemifield, and the inferior hemifield were 0.82, 0.83, and 0.85 respectively. This
again raises the question whether this is the consequence of an evolutionary adaptation to the inferior hemifield
being more important for survival in primates.
In addition to the requirement for better segmentation, there are some additional issues: though patients with
glaucoma anecdotally prefer 9-field OCT to HVF 24-2, it can still be cumbersome. Hopefully, additional
improvements in wide field swept source OCT will allow the entire 60° of the posterior pole to be image with
fewer fields. Currently, co-registration, co-segmentation and prediction take about 15’ minutes, and use in a
busy glaucoma clinic may require faster processing times which are achievable by using Graphics Processing
Units.
The average correlation R of predicted to actual sensitivity thresholds is now close to that obtained by repeat
HVF 24-2. This is caused by the substantial intra-subject variability of 24-2 perimetry29,34 35,36when estimating the
‘true’ threshold, the implication is that potential improvements in prediction become harder and harder to
measure – the likelihood that the predicted and actual threshold differ because the prediction was incorrect is
more and more similar to the difference being caused by noise in the actual measured threshold. In other
words, a more noisy reference standard necessarily negatively affects the actual performance that can be
measured.37 This is a challenge because one alternative, repeat visual fields, is patient unfriendly, and in our
experience makes it hard to recruit a sufficient number of subjects. The repeat HVF 24-2s were obtained in a
number of extremely good and motivated test takers, and thus this sample may represent the
maximum obtainable repeatability of HVF 24-2. Unfortunately, no studies of the repeatability of
individual testpoints in HVF 24-2 are currently available to us, so until we have finalized a formal study
this is the only datapoint we have – as mentioned we feel r=0.83 does not adequately represent the

HVF 24-2 variability in glaucoma patients. Potentially, adding Pattern Electroretinogram (PERG) or Frequency
Doubling Technology perimetry may allow the reference standard to be improved.36,38
Much effort has been devoted to studying the structural-functional (S-F) correlation in glaucoma. Studies10 have
shown a curvilinear relationship between peripapillary retinal nerve fiber layer (PP-NFL) thickness and global VF
index , such as mean deviation. Below approximately -10dB loss, the PP-NFL thickness reaches a “floor,” thus
limiting its dynamic range. A similar curvilinear relationship was found between macular GCL thickness and VF
with a dynamic range limited to VF better than -10dB. 9 Given the nonlinear correlation between OCT and VF
correlation thus established, some have advocated a combined structure–function index (CSFI) to estimate the
number of retinal ganglion cells in the retina to improve early detection of glaucoma. 31 Others have advocated
careful examination of 2 joint OCT scans , i.e. optic nerve head NFL and macular GCL thicknesses, for localized
correlation with VF thresholds, paying particular attention to the so-called “macular vulnerability zone. 39,40
More recently, Hood et al. has shown how single wide-field (9x12mm) swept source OCT, thus encompassing
both optic nerve head and macula, can be used to detect early glaucoma.41 Our results confirm that wide-field
OCT spanning both the optic nerve and macula provides a more robust and accurate picture of the retinal
structure and should improve correlation with visual function. In fact, our 9-field co-registered 9-field OCT
covers approximately 60° degree view of the posterior pole, matching the same area as the HVF 24-2 grid. This
allows us to estimate the structure-function correlations, and thereby sensitivity thresholds, for all HVF 24-2 test
locations, at substantial higher correlation than the circumpapillary circle scan and global VF indices. Finally, the
present results demonstrate how more sophisticated models for integrating OCT structural information, what
we call RGC-AC Optimized, further improved the correlation to an average 0.74, and even higher in some
individual, clinically relevant test locations.
In summary, our results show a high predictive performance of individual visual field thresholds predicted from
OCT image analysis using the RGC-AC concept and the RGC-AC optimized approach, with an average correlation
R of 0.74 to actual HFA 24-2 perimetry. This performance was obtained on a newly recruited, independent
population of glaucoma subjects with a wide distribution of glaucoma severity. We believe we have laid the
foundation to accurately predict visual function based on OCT structural information, using more of available
information and smart algorithms. Potentially, predicted function derived objectively from OCT structure in
patients with glaucoma may complement subjective visual field testing in clinical management.
Acknowledgements
The research subjects were generously provided with the help of Ms. Teresa Kopel.
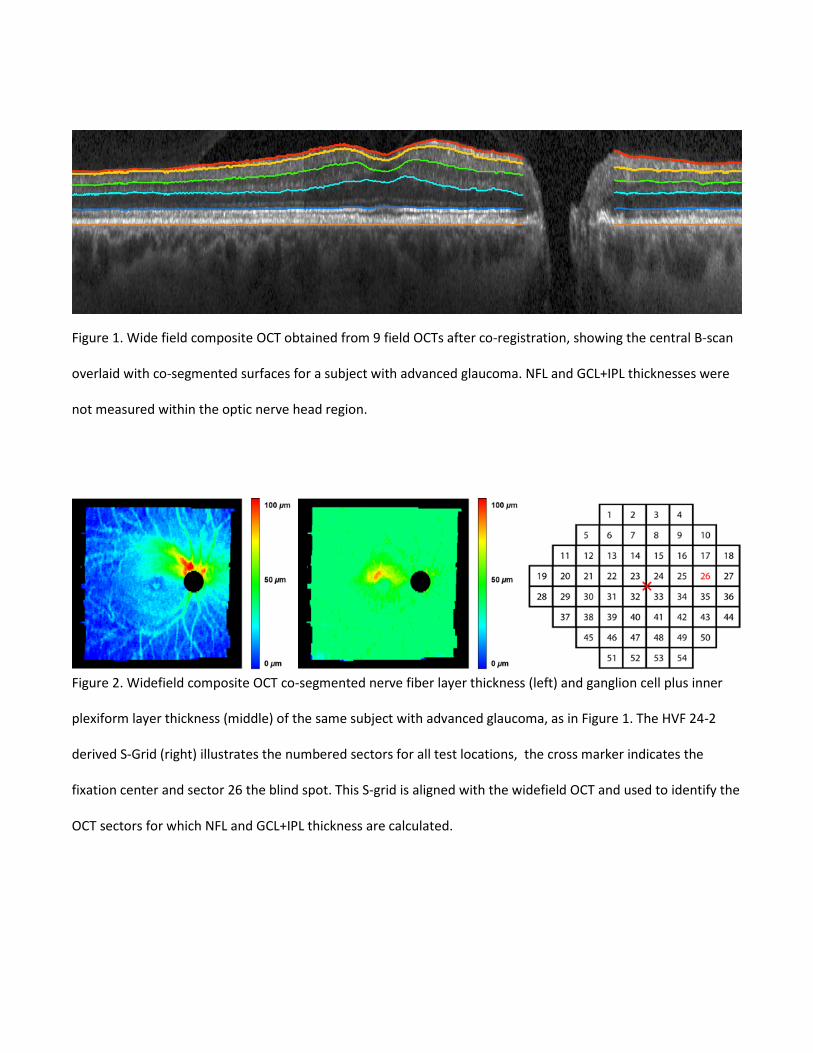
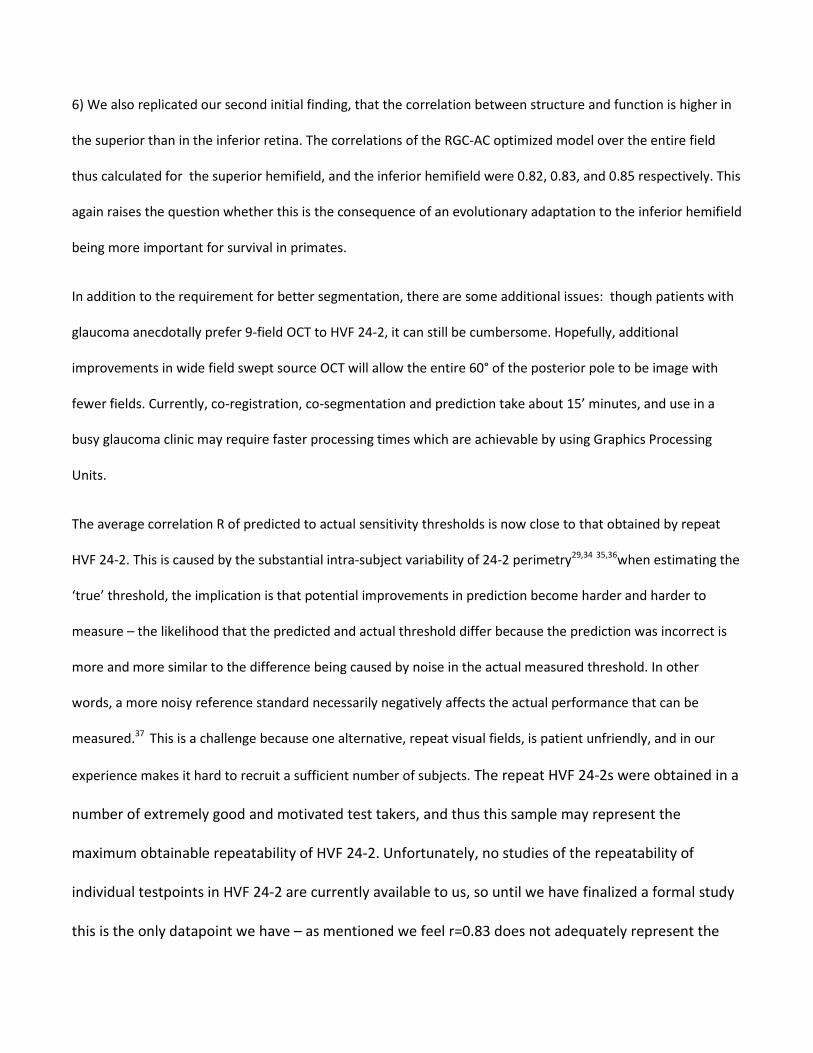
Figure 1. Wide field composite OCT obtained from 9 field OCTs after co-registration, showing the central B-scan
overlaid with co-segmented surfaces for a subject with advanced glaucoma. NFL and GCL+IPL thicknesses were
not measured within the optic nerve head region.
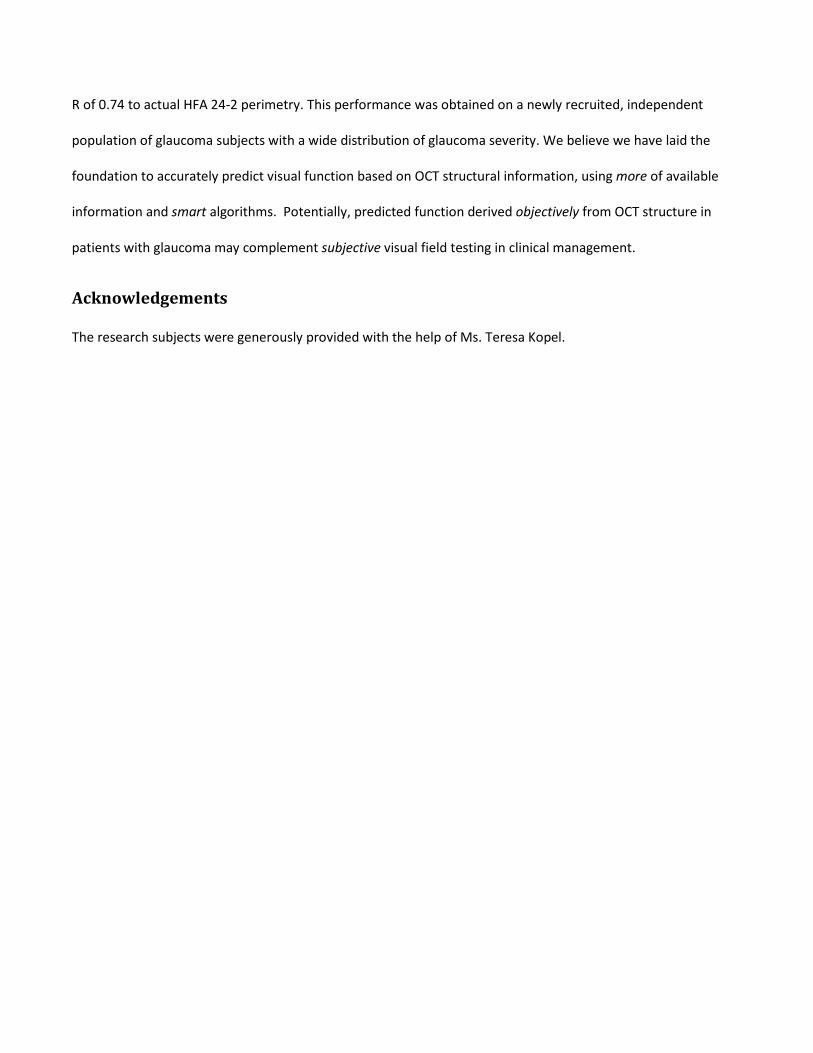
Figure 2. Widefield composite OCT co-segmented nerve fiber layer thickness (left) and ganglion cell plus inner
plexiform layer thickness (middle) of the same subject with advanced glaucoma, as in Figure 1. The HVF 24-2
derived S-Grid (right) illustrates the numbered sectors for all test locations, the cross marker indicates the
fixation center and sector 26 the blind spot. This S-grid is aligned with the widefield OCT and used to identify the
OCT sectors for which NFL and GCL+IPL thickness are calculated.
Figure 3. Sectors used for Naive, Donut and Garway-Heath predictive models, to predict the HVF 24-2 threshold
for Sector 14. The predicted sector 14 is shown in red, the sectors of which NFL thickness is used are in green. If
a sector’s NFL and GCL+IPL are both used, it is shown in orange.
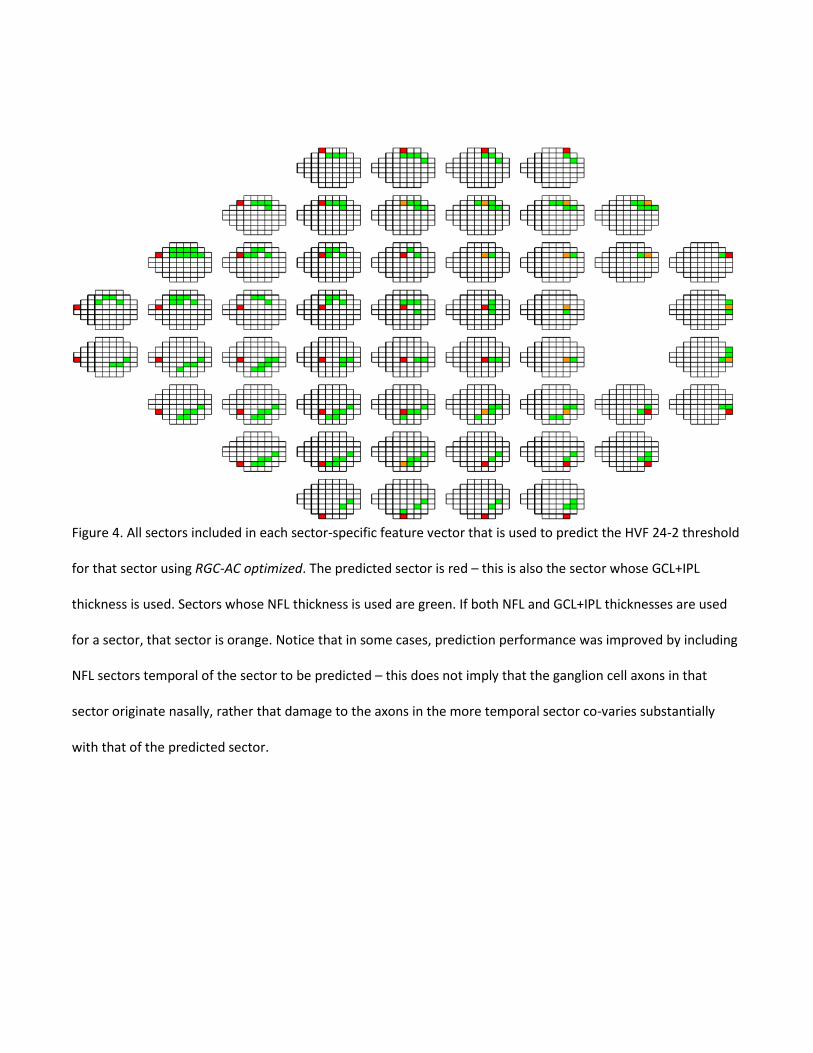
Figure 4. All sectors included in each sector-specific feature vector that is used to predict the HVF 24-2 threshold
for that sector using RGC-AC optimized. The predicted sector is red – this is also the sector whose GCL+IPL
thickness is used. Sectors whose NFL thickness is used are green. If both NFL and GCL+IPL thicknesses are used
for a sector, that sector is orange. Notice that in some cases, prediction performance was improved by including
NFL sectors temporal of the sector to be predicted – this does not imply that the ganglion cell axons in that
sector originate nasally, rather that damage to the axons in the more temporal sector co-varies substantially
with that of the predicted sector.
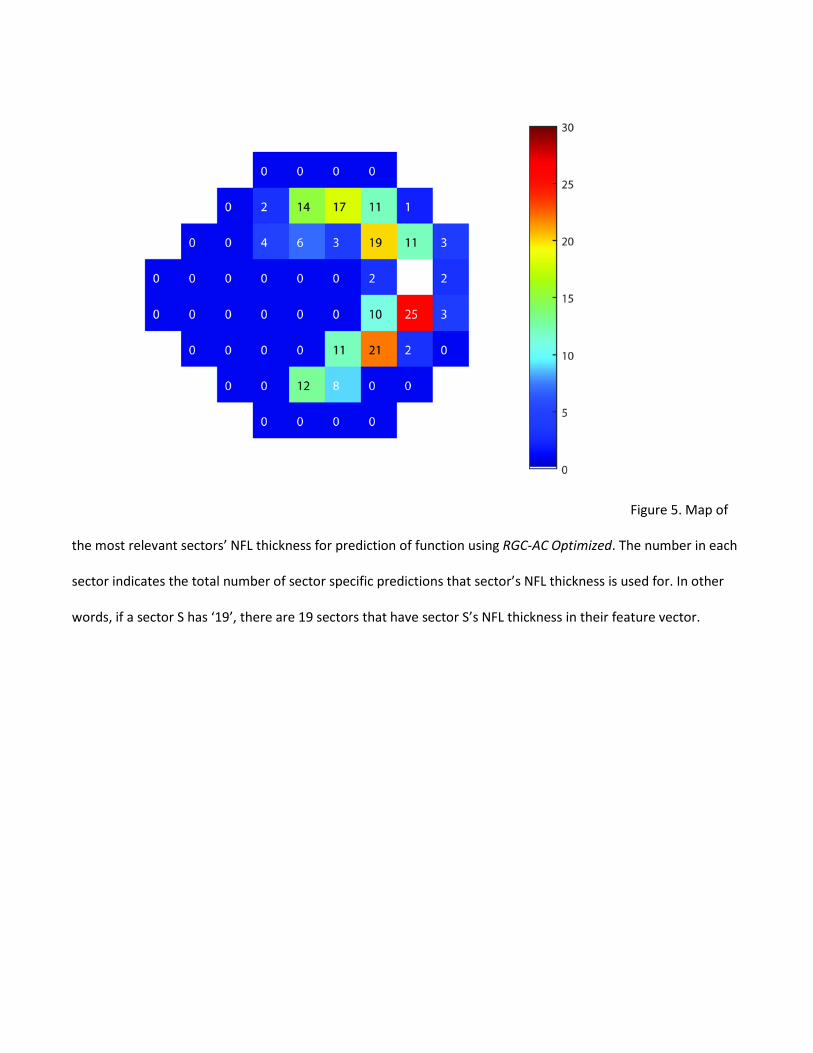
Figure 5. Map of
the most relevant sectors’ NFL thickness for prediction of function using RGC-AC Optimized. The number in each
sector indicates the total number of sector specific predictions that sector’s NFL thickness is used for. In other
words, if a sector S has ‘19’, there are 19 sectors that have sector S’s NFL thickness in their feature vector.

Figure 6. Sector-specific predictive performance R for each approach as well as average R over all sectors. The
differences between R for RGC-AC optimized and the other approaches are all significant.
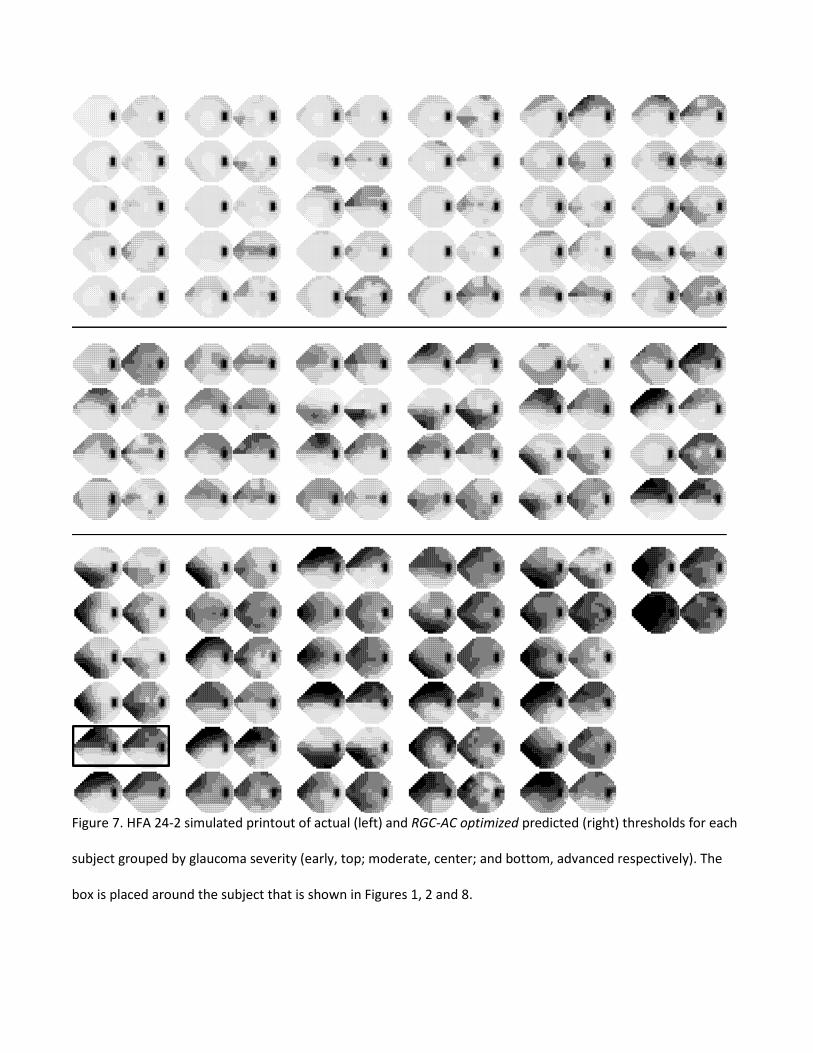
Figure 7. HFA 24-2 simulated printout of actual (left) and RGC-AC optimized predicted (right) thresholds for each
subject grouped by glaucoma severity (early, top; moderate, center; and bottom, advanced respectively). The
box is placed around the subject that is shown in Figures 1, 2 and 8.
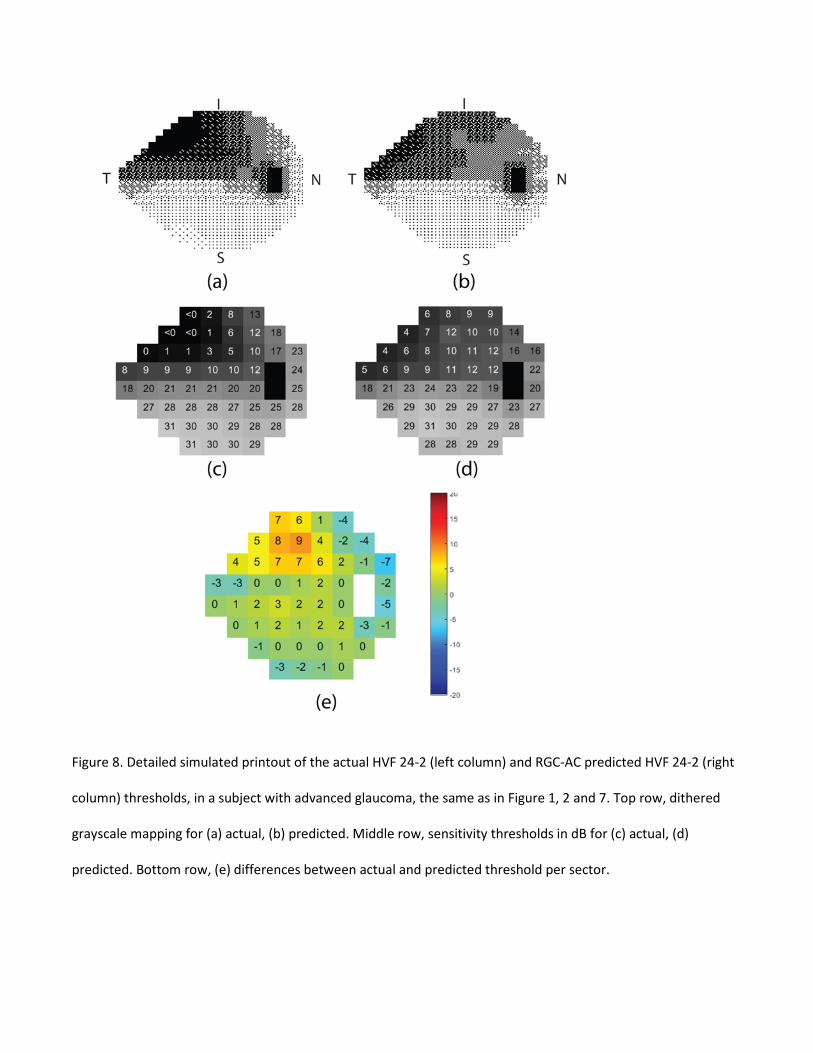
Figure 8. Detailed simulated printout of the actual HVF 24-2 (left column) and RGC-AC predicted HVF 24-2 (right
column) thresholds, in a subject with advanced glaucoma, the same as in Figure 1, 2 and 7. Top row, dithered
grayscale mapping for (a) actual, (b) predicted. Middle row, sensitivity thresholds in dB for (c) actual, (d)
predicted. Bottom row, (e) differences between actual and predicted threshold per sector.
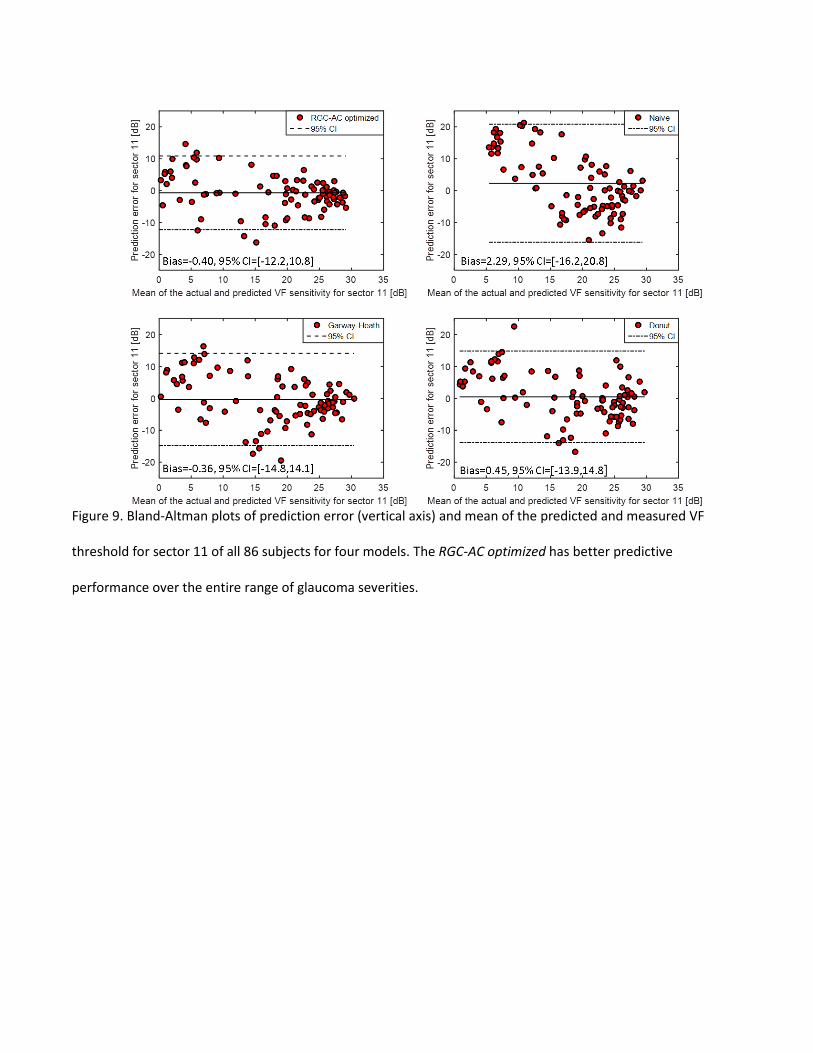
Figure 9. Bland-Altman plots of prediction error (vertical axis) and mean of the predicted and measured VF
threshold for sector 11 of all 86 subjects for four models. The RGC-AC optimized has better predictive
performance over the entire range of glaucoma severities.
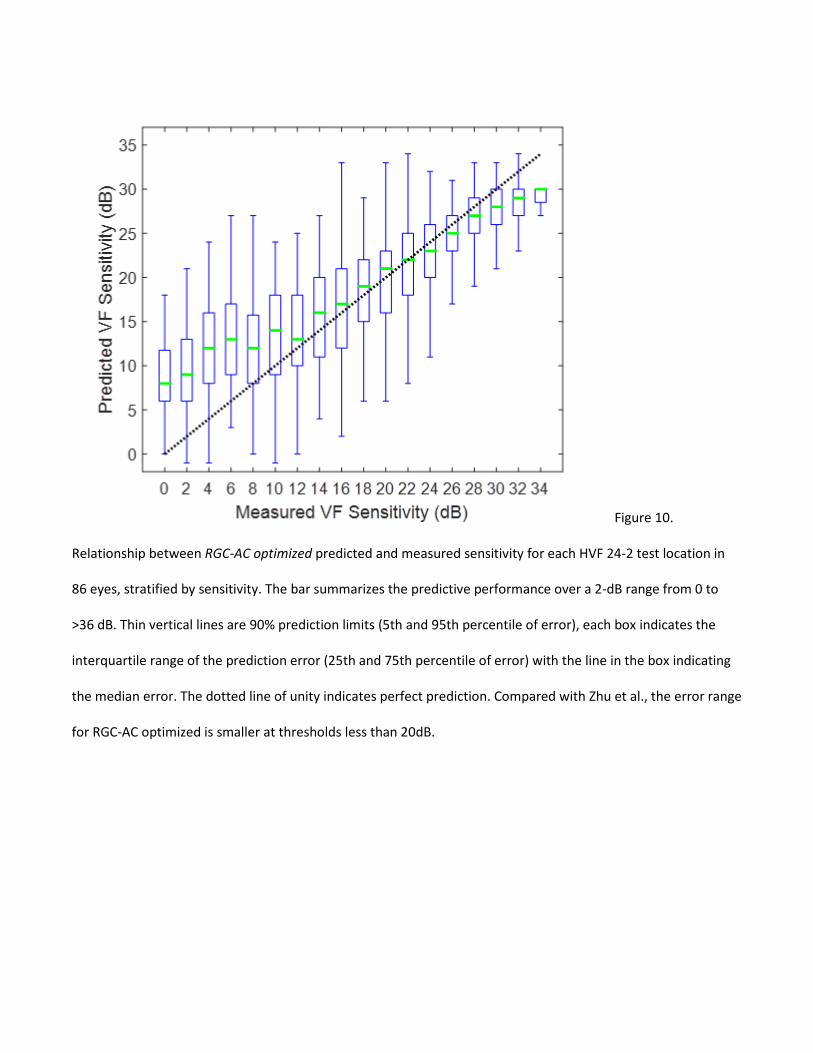
Figure 10.
Relationship between RGC-AC optimized predicted and measured sensitivity for each HVF 24-2 test location in
86 eyes, stratified by sensitivity. The bar summarizes the predictive performance over a 2-dB range from 0 to
>36 dB. Thin vertical lines are 90% prediction limits (5th and 95th percentile of error), each box indicates the
interquartile range of the prediction error (25th and 75th percentile of error) with the line in the box indicating
the median error. The dotted line of unity indicates perfect prediction. Compared with Zhu et al., the error range
for RGC-AC optimized is smaller at thresholds less than 20dB.
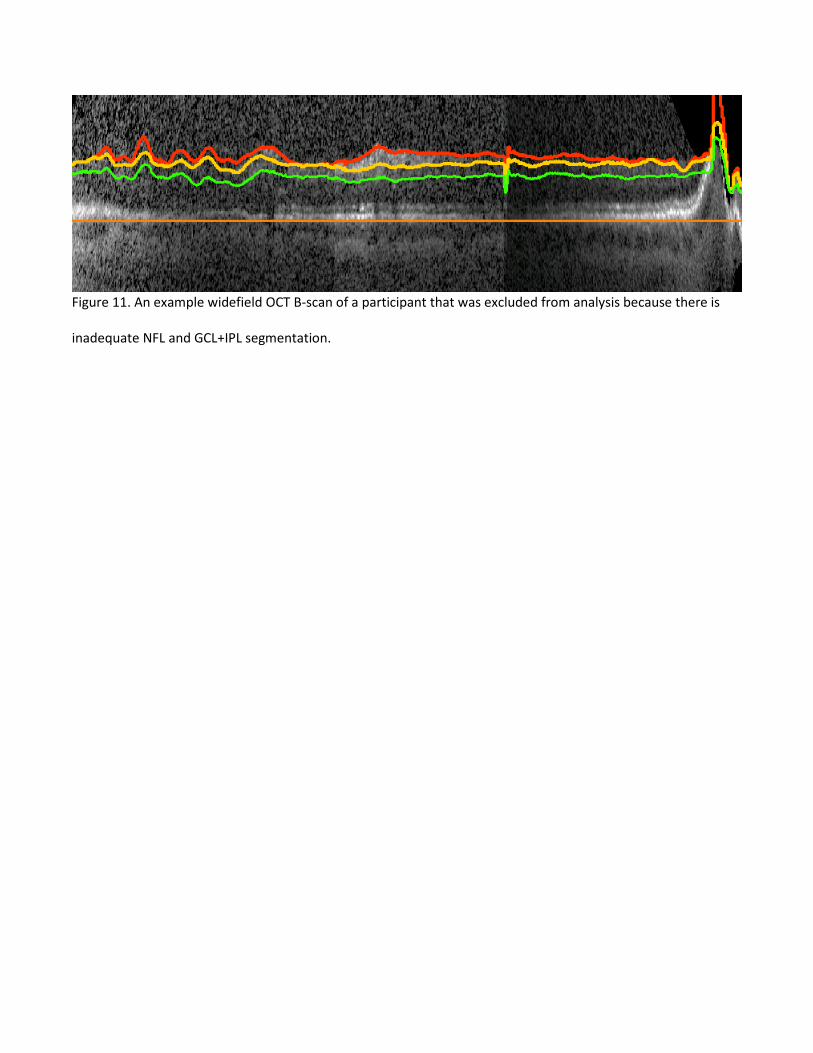
Figure 11. An example widefield OCT B-scan of a participant that was excluded from analysis because there is
inadequate NFL and GCL+IPL segmentation.
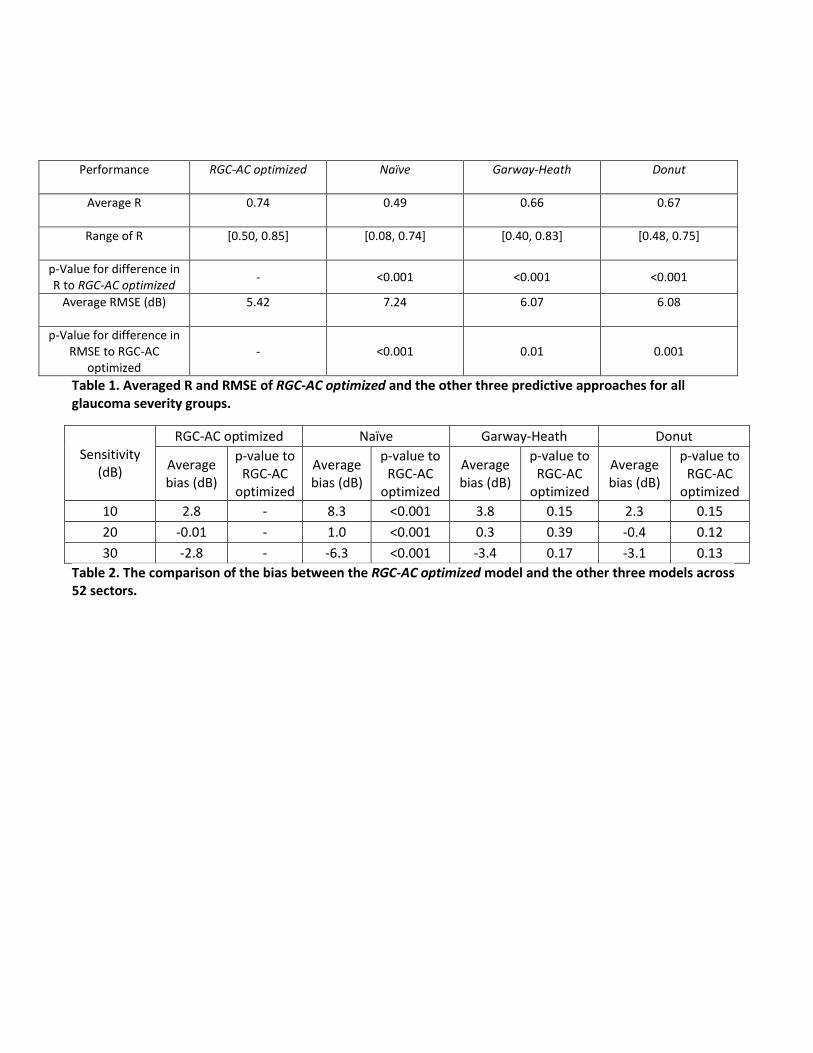
Performance RGC-AC optimized Naïve Garway-Heath Donut
Average R 0.74 0.49 0.66 0.67
Range of R [0.50, 0.85] [0.08, 0.74] [0.40, 0.83] [0.48, 0.75]
p-Value for difference in R to RGC-AC optimized - <0.001 <0.001 <0.001
Average RMSE (dB) 5.42 7.24 6.07 6.08
p-Value for difference in RMSE to RGC-AC
optimized - <0.001 0.01 0.001
Table 1. Averaged R and RMSE of RGC-AC optimized and the other three predictive approaches for all glaucoma severity groups.
Sensitivity (dB)
RGC-AC optimized Naïve Garway-Heath Donut
Average bias (dB)
p-value to RGC-AC
optimized
Average bias (dB)
p-value to RGC-AC
optimized
Average bias (dB)
p-value to RGC-AC
optimized
Average bias (dB)
p-value to RGC-AC
optimized 10 2.8 - 8.3 <0.001 3.8 0.15 2.3 0.15 20 -0.01 - 1.0 <0.001 0.3 0.39 -0.4 0.12 30 -2.8 - -6.3 <0.001 -3.4 0.17 -3.1 0.13
Table 2. The comparison of the bias between the RGC-AC optimized model and the other three models across 52 sectors.
Sensitivity (dB)
RGC-AC optimized Naïve Garway-Heath Donut
Average width of LoA (dB)
p-value to RGC-
AC optimized
Average width of LoA (dB)
p-value to RGC-
AC optimized
Average Width of LoA (dB)
p-value to RGC-
AC optimized
Average width of LoA (dB)
p-value to RGC-
AC optimized
10 4.1 - 5.3 0.001 4.7 0.002 4.7 0.001 20 2.4 - 2.9 <0.001 2.7 0.005 2.8 <0.001 30 3.7 - 5.0 0.003 4.3 0.04 4.4 0.001
Table 3. The comparison of the width of LoA between the RGC-AC optimized model and the other three models across 52 sectors.
Sensitivity (dB)
RGC-AC optimized Repeat HVF RGC-AC optimized Repeat HVF
Average bias (dB)
p-value to RGC-AC
optimized
Average bias (dB)
p-value to RGC-AC
optimized
Average width of LoA (dB)
p-value to RGC-AC
optimized
Average width of LoA (dB)
p-value to RGC-AC
optimized 10 2.8 - -0.39 <0.001 4.7 - 3.2 <0.001 20 -0.01 - 0.04 0.9 2.7 - 1.7 <0.001 30 -2.8 - 0.5 <0.001 4.3 - 2.5 <0.001
Table 4. The comparison of the bias and the width of LoA between RGC-AC optimized model and repeat HVF at different sensitivities across 52 sectors.
References
1. Heijl A, Lindgren A, Lindgren G. Test-retest variability in glaucomatous visual fields. Am J Ophthalmol. Aug 15 1989;108(2):130-135.
2. Henson DB, Chaudry S, Artes PH, Faragher EB, Ansons A. Response variability in the visual field: comparison of optic neuritis, glaucoma, ocular hypertension, and normal eyes. Invest Ophthalmol Vis Sci. Feb 2000;41(2):417-421.
3. Wall M, Johnson CA, Kutzko KE, Nguyen R, Brito C, Keltner JL. Long- and short-term variability of automated perimetry results in patients with optic neuritis and healthy subjects. Arch Ophthalmol. Jan 1998;116(1):53-61.
4. Werner EB, Petrig B, Krupin T, Bishop KI. Variability of automated visual fields in clinically stable glaucoma patients. Invest Ophthalmol Vis Sci. Jun 1989;30(6):1083-1089.
5. Mwanza JC, Budenz DL, Godfrey DG, et al. Diagnostic performance of optical coherence tomography ganglion cell--inner plexiform layer thickness measurements in early glaucoma. Ophthalmology. Apr 2014;121(4):849-854.
6. Mwanza JC, Gendy MG, Feuer WJ, Shi W, Budenz DL. Effects of changing operators and instruments on time-domain and spectral-domain OCT measurements of retinal nerve fiber layer thickness. Ophthalmic Surg Lasers Imaging. Jul-Aug 2011;42(4):328-337.
7. Mwanza JC, Oakley JD, Budenz DL, Chang RT, Knight OJ, Feuer WJ. Macular ganglion cell-inner plexiform layer: automated detection and thickness reproducibility with spectral domain-optical coherence tomography in glaucoma. Invest Ophthalmol Vis Sci. 2011;52(11):8323-8329.
8. Hood DC, Anderson SC, Wall M, Raza AS, Kardon RH. A test of a linear model of glaucomatous structure-function loss reveals sources of variability in retinal nerve fiber and visual field measurements. Invest Ophthalmol Vis Sci. Sep 2009;50(9):4254-4266.
9. Raza AS, Cho J, de Moraes CG, et al. Retinal ganglion cell layer thickness and local visual field sensitivity in glaucoma. Archives of ophthalmology. Dec 2011;129(12):1529-1536.
10. Leite MT, Zangwill LM, Weinreb RN, Rao HL, Alencar LM, Medeiros FA. Structure-function relationships using the Cirrus spectral domain optical coherence tomograph and standard automated perimetry. J Glaucoma. Jan 2012;21(1):49-54.
11. Hood DC, Raza AS. Method for comparing visual field defects to local RNFL and RGC damage seen on frequency domain OCT in patients with glaucoma. Biomed Opt Express. 2011;2(5):1097-1105.
12. Lee K, Kwon YH, Garvin MK, Niemeijer M, Sonka M, Abramoff MD. Distribution of damage to the entire retinal ganglion cell pathway: quantified using spectral-domain optical coherence tomography analysis in patients with glaucoma. Arch Ophthalmol. Sep 2012;130(9):1118-1126.
13. Bogunovic H, Kwon YH, Rashid A, et al. Relationships of retinal structure and humphrey 24-2 visual field thresholds in patients with glaucoma. Invest Ophthalmol Vis Sci. Jan 2015;56(1):259-271.
14. Wahle A, Lee K, Harding AT, et al. Extending the XNAT archive tool for image and analysis management in ophthalmology research. Paper presented at: SPIE Medical Imaging 20132013.
15. Garvin MK, Abramoff MD, Wu X, Russell SR, Burns TL, Sonka M. Automated 3-D intraretinal layer segmentation of macular spectral-domain optical coherence tomography images. IEEE Trans Med Imaging. 2009;28(9):1436-1447.
16. Quellec G, Lee K, Dolejsi M, Garvin MK, Abramoff MD, Sonka M. Three-dimensional analysis of retinal layer texture: identification of fluid-filled regions in SD-OCT of the macula. IEEE Trans Med Imaging. Jun 2010;29(6):1321-1330.
17. Bogunovic H, Sonka M, Kwon YH, Kemp P, Abramoff MD, Wu X. Multi-surface and multi-field co-segmentation of 3-D retinal optical coherence tomography. IEEE Trans Med Imaging. Dec 2014;33(12):2242-2253.
18. Garvin MK, Abramoff MD, Lee K, Niemeijer M, Sonka M, Kwon YH. 2-D pattern of nerve fiber bundles in glaucoma emerging from spectral-domain optical coherence tomography. Invest Ophthalmol Vis Sci. Jan 2012;53(1):483-489.
19. Lee K, Niemeijer M, Garvin MK, Kwon YH, Sonka M, Abramoff MD. Segmentation of the optic disc in 3-D OCT scans of the optic nerve head. IEEE Trans Med Imaging. Jan 2010;29(1):159-168.
20. Mwanza JC, Durbin MK, Budenz DL, Cirrus OCTNDSG. Interocular symmetry in peripapillary retinal nerve fiber layer thickness measured with the Cirrus HD-OCT in healthy eyes. Am J Ophthalmol. Mar 2011;151(3):514-521 e511.
21. Garway-Heath DF, Poinoosawmy D, Fitzke FW, Hitchings RA. Mapping the visual field to the optic disc in normal tension glaucoma eyes. Ophthalmology. Oct 2000;107(10):1809-1815.
22. Abramoff MD, Alward WL, Greenlee EC, et al. Automated segmentation of the optic disc from stereo color photographs using physiologically plausible features. Invest Ophthalmol Vis Sci. 2007;48(4):1665-1673.
23. Cortes C, Vapnik V. Support-vector networks. Machine Learning. 1995;20(3):273-297. 24. Bland JM, Altman DG. Measuring agreement in method comparison studies. Statistical methods in
medical research. 1999;8(2):135-160. 25. Kleinbaum D, Kupper L, Nizam A, Rosenberg EI. Applied regression analysis and other multivariable
methods. Nelson Education; 2013. 26. Zhu H, Crabb DP, Schlottmann PG, et al. Predicting visual function from the measurements of retinal
nerve fiber layer structure. Invest Ophthalmol Vis Sci. Nov 2010;51(11):5657-5666. 27. Sonka M, Hlavac V, Boyle R. Image processing, analysis, and machine vision. Thompson Learning;
2008. 28. Zhang X, Bregman CJ, Raza AS, De Moraes G, Hood DC. Deriving visual field loss based upon OCT of
inner retinal thicknesses of the macula. Biomed Opt Express. Jun 1 2011;2(6):1734-1742. 29. Zhang X, Raza AS, Hood DC. Detecting glaucoma with visual fields derived from frequency-domain
optical coherence tomography. Invest Ophthalmol Vis Sci. May 2013;54(5):3289-3296. 30. Demirkaya N, van Dijk HW, van Schuppen SM, et al. Effect of age on individual retinal layer thickness
in normal eyes as measured with spectral-domain optical coherence tomography. Invest Ophthalmol Vis Sci. Jul 2013;54(7):4934-4940.
31. Tatham AJ, Weinreb RN, Medeiros FA. Strategies for improving early detection of glaucoma: the combined structure-function index. Clin Ophthalmol. 2014;8:611-621.
32. Lee K, Buitendijk GH, Bogunovic H, et al. Automated Segmentability Index for Layer Segmentation of Macular SD-OCT Images. Translational vision science & technology. Mar 2016;5(2):14.
33. Abramoff MD, Wu X, Lee K, Tang L. Subvoxel accurate graph search using non-Euclidean graph space. PLoS One. 2014;9(10):e107763.
34. Gillespie BW, Musch DC, Guire KE, et al. The collaborative initial glaucoma treatment study: baseline visual field and test-retest variability. Invest Ophthalmol Vis Sci. Jun 2003;44(6):2613-2620.
35. Delgado MF, Nguyen NT, Cox TA, et al. Automated perimetry: a report by the American Academy of Ophthalmology. Ophthalmology. Dec 2002;109(12):2362-2374.
36. Wall M, Woodward KR, Doyle CK, Artes PH. Repeatability of automated perimetry: a comparison between standard automated perimetry with stimulus size III and V, matrix, and motion perimetry. Invest Ophthalmol Vis Sci. Feb 2009;50(2):974-979.
37. Quellec G, Abramoff MD. Estimating maximal measurable performance for automated decision systems from the characteristics of the reference standard. application to diabetic retinopathy screening. Conf Proc IEEE Eng Med Biol Soc. 2014;2014:154-157.

38. Bayer AU, Erb C. Short wavelength automated perimetry, frequency doubling technology perimetry, and pattern electroretinography for prediction of progressive glaucomatous standard visual field defects. Ophthalmology. May 2002;109(5):1009-1017.
39. Hood DC, Raza AS, de Moraes CG, Liebmann JM, Ritch R. Glaucomatous damage of the macula. Prog Retin Eye Res. Jan 2013;32:1-21.
40. Hood DC, Raza AS. On improving the use of OCT imaging for detecting glaucomatous damage. Br J Ophthalmol. Jul 2014;98 Suppl 2:ii1-9.
41. Hood DC, De Cuir N, Blumberg DM, et al. A Single Wide-Field OCT Protocol Can Provide Compelling Information for the Diagnosis of Early Glaucoma. Translational vision science & technology. Nov 2016;5(6):4.
Related Documents