OPM3 ® Portugal Project – Information Systems and Technologies Organizations – Outcome Analysis David Silva 1 , Anabela Tereso 1 , Gabriela Fernandes 1 , Isabel Loureiro 1 and José Ângelo Pinto 2 , 1 Department of Production and Systems Engineering, Algoritmi Centre, University of Minho, 4800-058 Guimarães, Portugal 2 Ambithus, 1600-546 Lisboa, Portugal [email protected], {anabelat, g.fernandes, ifloureiro}@dps.uminho.pt, [email protected] Abstract. Increasing the maturity in Project Management (PM) has become a goal for many organizations, leading them to adopt maturity models to assess the current state of its PM practices and compare them with the best practices in the industry where the organization is inserted. One of the main PM maturity models is the Organizational Project Management Maturity Model (OPM3 ® ), developed by the Project Management Institute. This paper presents the Information Systems and Technologies organizations outcome analysis, of the assesses made by the OPM3 ® Portugal Project, identifying the PM processes that are “best” implemented in this particular industry and those in which it is urgent to improve. Additionally, a comparison between the different organizations’ size analyzed is presented. Keywords: Project Management; OPM3 ® ; Maturity Models; Best Practices; Processes. 1 Introduction Over the years, all kinds of organizations have attempted to define with precision their goals and objectives for short and long term and at the same time project strategies to achieve them. However, very often the strategies outlined do not allow to reach the results for which they were designed [1]. In order to address this problem, Project Management (PM) emerged as a powerful management solution, which is increasingly popular in several industries [2], as the Information Systems and Technologies (IST) industry. The concept of maturity, when applied to organizations, might refer to a state where organizations are in a perfect condition to achieve their objectives. Project maturity would then mean that organizations are perfectly conditioned to deal with their projects [3]. To improve their PM maturity, organizations need to obtain a total control and measurability of their PM processes, using maturity models to test and compare their current performance against Best Practices (BP) [4, 5]. One of these models is the Organizational Project Management Maturity Model (OPM3 ® ), proposed by the Project Management Institute (PMI), that joins together not only the standards for managing projects, programs and portfolios, but also the necessary organizational conditions that enable organizational PM to function efficiently and effectively [6]. brought to you by CORE View metadata, citation and similar papers at core.ac.uk provided by Universidade do Minho: RepositoriUM

Welcome message from author
This document is posted to help you gain knowledge. Please leave a comment to let me know what you think about it! Share it to your friends and learn new things together.
Transcript
OPM3® Portugal Project – Information Systems and
Technologies Organizations – Outcome Analysis
David Silva1, Anabela Tereso
1, Gabriela Fernandes
1, Isabel Loureiro1 and
José Ângelo Pinto2,
1 Department of Production and Systems Engineering,
Algoritmi Centre, University of Minho, 4800-058 Guimarães, Portugal 2 Ambithus, 1600-546 Lisboa, Portugal
[email protected], {anabelat, g.fernandes, ifloureiro}@dps.uminho.pt,
Abstract. Increasing the maturity in Project Management (PM) has become a
goal for many organizations, leading them to adopt maturity models to assess
the current state of its PM practices and compare them with the best practices in
the industry where the organization is inserted. One of the main PM maturity
models is the Organizational Project Management Maturity Model (OPM3®),
developed by the Project Management Institute. This paper presents the
Information Systems and Technologies organizations outcome analysis, of the
assesses made by the OPM3® Portugal Project, identifying the PM processes
that are “best” implemented in this particular industry and those in which it is
urgent to improve. Additionally, a comparison between the different
organizations’ size analyzed is presented.
Keywords: Project Management; OPM3®; Maturity Models; Best Practices;
Processes.
1 Introduction
Over the years, all kinds of organizations have attempted to define with precision
their goals and objectives for short and long term and at the same time project
strategies to achieve them. However, very often the strategies outlined do not allow to
reach the results for which they were designed [1]. In order to address this problem,
Project Management (PM) emerged as a powerful management solution, which is
increasingly popular in several industries [2], as the Information Systems and
Technologies (IST) industry.
The concept of maturity, when applied to organizations, might refer to a state
where organizations are in a perfect condition to achieve their objectives. Project
maturity would then mean that organizations are perfectly conditioned to deal with
their projects [3]. To improve their PM maturity, organizations need to obtain a total
control and measurability of their PM processes, using maturity models to test and
compare their current performance against Best Practices (BP) [4, 5]. One of these
models is the Organizational Project Management Maturity Model (OPM3®),
proposed by the Project Management Institute (PMI), that joins together not only the
standards for managing projects, programs and portfolios, but also the necessary
organizational conditions that enable organizational PM to function efficiently and
effectively [6].
brought to you by COREView metadata, citation and similar papers at core.ac.uk
provided by Universidade do Minho: RepositoriUM
The main goal of this paper is to perform an analysis of the state of IST Portuguese
organizations maturity in the adoption of project management practices, and present
PM and Portfolio Management processes, and Organizational Enablers (OE) areas
that are “best” implemented by these organizations, identifying for each process and
area if there are statistically significant differences between different organizations’
size. First the main characteristics of the OPM3® model are explained. Next the
OPM3® Portugal Project and the research methodology used are presented. Then the
results obtained for the IST organizations are exhibited and discussed. Finally, the
main findings that emerged from this study are presented, as well as suggestions for
future research.
2 OPM3® Model
OPM3® is a model that helps organizations to develop capabilities that underpin
the management processes of all their projects, connecting them with the corporate
strategy. PMI released the first edition of OPM3® in 2003 [7]. In 2008, the model has
been updated with the publication of the second edition [8] and in 2013 the third and
latest edition was published [9].
One of the main characteristics of OPM3® is the assessment of PM maturity,
through the existence of a standardized set of BP [10]. According to PMI [9 p.238],
BP “refer to the methods, currently recognized within a given industry or discipline,
to achieve a stated goal or objective”. In OPM3® context, each BP is dependent on a
set of Capabilities (specific competency that must exist in an organization to perform
PM processes and deliver PM products and services) that need to be developed for a
BP to be recognized as implemented [9, 10]. The existence of a Capability is
demonstrated by the existence of one or more Outcomes, which are tangible or
intangible results of performing a Capability [9, 10].
One of the main differences of the OPM3® compared to other maturity models is
the fact that it is a multidimensional model, being possible to determine the maturity
of an organization under different perspectives [11]. One of these perspectives is the
exhibition of BP and respective Capabilities through the progression in four stages of
processes maturity: Standardize, Measure, Control and continuously Improve (SMCI).
Another perspective is associated with the progression of the BP and respective
Capabilities within three domains: PM, Program Management (set of projects with
common goal) and Portfolio Management (group of projects and/or programs and
operational activities which share common resources). In addition to these two
dimensions, OPM3® incorporates the five PM process groups (Initiating, Planning,
Executing, Monitoring and Controlling, and Closing), designated by the PMBoK
Guide®, and identifies the Capabilities and the BP regarding its association with these
five processes [9, 11, 12].
There is also another BP category in OPM3®, the OE. The OE are “practices that
can be leveraged to support the implementation of Best Practices in portfolios,
programs, and projects in support of strategic goals” [9 p.240]. The presence of an
OE indicates that an organization has matured to the point of establishing a stable
organizational PM practice environment and has adopted the disciplines of project,
program and portfolio management, to achieve this [9].
In summary, OPM3® was created for organizations of any size, geographical
location or sector of activity, which aim to identify the maturity in the management of
their projects, programs, portfolios, and the practices established by their project
managers, possessing a set of BP as a basis of comparison, recognized and accepted
throughout the world [11].
3 OPM3® Portugal Project and Research Methodology
Ambithus, a Portuguese organization of PM consulting, training, research and
development, settled the OPM3® Portugal Project. This project seeks to perform a
comprehensive analysis of the state of Portuguese industry with regard to the degree
of maturity in the adoption of project, program, and portfolio management
methodology. The project was chartered because of the need felt by the organization
and other project initiators and mentors to improve the way Portuguese industries
initiate, choose, manage, control and close their projects. The understanding of this
need was very helpful to taking the proper actions and taking advantage of an
established funding system for research incentives for these kinds of projects,
supported by the European Union Government but managed by the state authorities.
The main objective of the project is to evaluate 100 organizations, from various
sectors of activity, and perform an analysis of organizational PM maturity, presenting
an improvement plan for each sector of activity.
The project started in 2011, was financed by European Union research founding,
which means that the individual results for each participating organization – the
assessment of PM maturity and the Improvement Plan – did not represent a cost for
the participating organizations [13].
OPM3® Portugal Project is based on the second edition of the OPM3
® model,
which is aligned with the fourth edition of PMBoK Guide® and with the second
edition of The Standard of Program Management and The Standard for Portfolio
Management, because at the OPM3® Portugal Project starting date, these were the
latest versions of the standards.
This project is following an approach divided into four steps: Planning and
Organizing, Company Assessment, Sectorial Assessment and Country Level
Assessment. In the first step, all generic procedures, management structures and
control processes were defined for the project, as well as more detailed planning
activities and processes [14]. In addition, it was created a management information
system, designed by Ambithus researchers with the contribution of the academic
partners, for the organizations’ assessment work and data analysis. This information
system is complementary with PMI’s OPM3® ProductSuite (the information system
certified by PMI) and overcomes some of its limitations, such as, it can be only used
by OPM3®
certified consultants, or only allowing the introduction of the overall result
of the organization for each OPM3® question, instead of the response of each person
interviewed [14].
The second step begins with the signing of a cooperation protocol, between the
organization that will be assessed and Ambithus. The initial process of intervention
includes meetings and a series of interviews with different people from different roles
within the organization. Being concluded this phase, data gathering was accomplished
to assess the current maturity of organizations in PM. Two documents are produced:
the Assessment Report and the Improvement Plan. In the first one, the organization
maturity results in PM are expressed in several ways, such as the overall maturity or
the relative maturity by BP category (Project, Program, and Portfolio Management
and OE) and SMCI stages. The Improvement Plan intends to give the
organizations an indication of the path to increase their maturity.
The third step is related to the Sectorial Assessment. The results of the various
assessments performed in the organizations are summarized to create measures of
sectorial capacity in PM. After the analysis and validation of the obtained results, an
Improvement Plan for the industry sector will be presented and discussed [14].
In the final step, the results of the sectorial assessments will be compared, to
identify areas of strengths and weaknesses, and the final result in each sector will be
used to create general indicators on the Portugal’s country capacity in PM [14].
In summary, this project will create several benefits for the Portuguese
organizations, such as identify the BP that can support the organizational strategy for
the implementation of projects with success and identify specific Capabilities that can
give rise to BP for the organization [14].
Currently OPM3® Portugal Project is in the second step, Company Assessment.
This paper analyses the interim results of this project. In July 2014, thirty three
organizations have already fully concluded their assessment in OPM3® Portugal
Project, which means that a presentation and validation of their Improvement Plans
were already presented to each organization assessed [15]. From these thirty three
organizations, eighteen are from IST, and this paper focus on the results obtained
from these eighteen IST organizations.
In step two of the OPM3® Portugal Project execution, the OPM3
® consultants
collected information about the organizations namely, the Industry Type, the Annual
Turnover and the Number of Employees. In order to classify the eighteen
organizations according to their organizational size, European Commission criteria
were used [16]. The organizations can be classified as Micro, Small, Medium and
Large. This classification takes into account the framework of each organization
within the limits of the following criteria:
- Number of permanent Employees of the organization.
- Annual Turnover or Annual Balance Sheet Total.
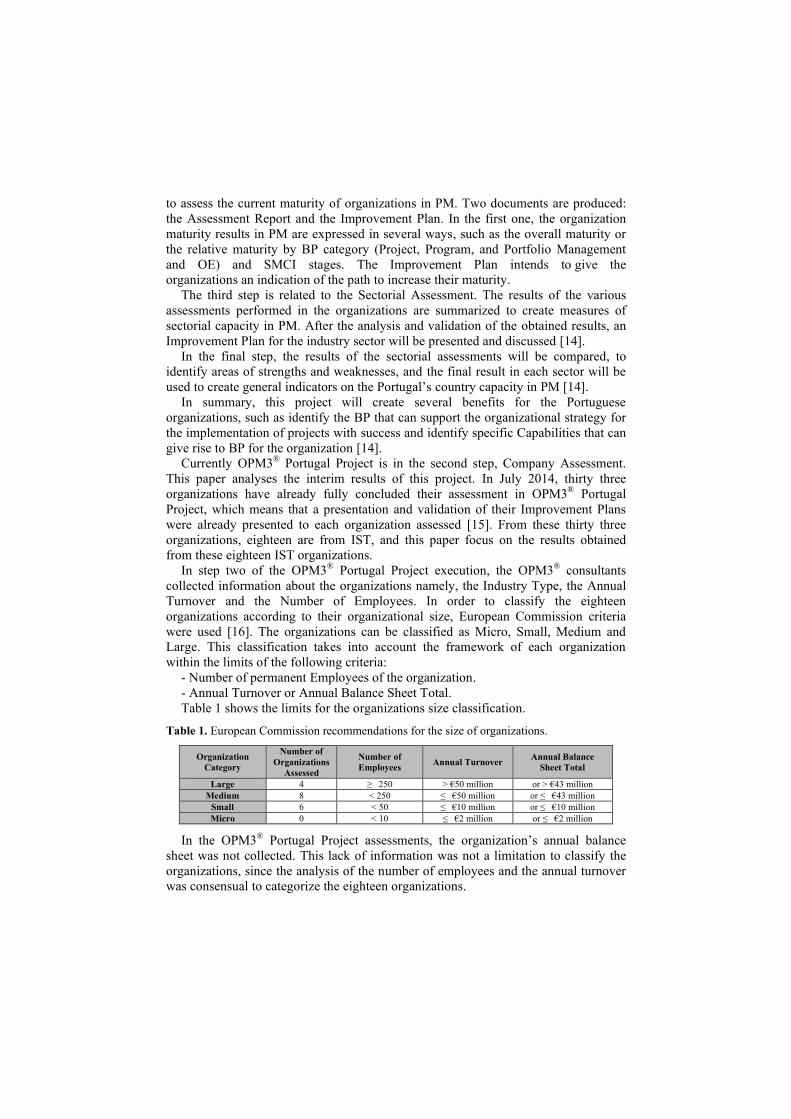
Table 1 shows the limits for the organizations size classification.
Table 1. European Commission recommendations for the size of organizations.
Organization
Category
Number of
Organizations
Assessed
Number of
Employees Annual Turnover
Annual Balance
Sheet Total
Large 4 ≥ 250 > €50 million or > €43 million
Medium 8 < 250 ≤ €50 million or ≤ €43 million
Small 6 < 50 ≤ €10 million or ≤ €10 million
Micro 0 < 10 ≤ €2 million or ≤ €2 million
In the OPM3® Portugal Project assessments, the organization’s annual balance
sheet was not collected. This lack of information was not a limitation to classify the
organizations, since the analysis of the number of employees and the annual turnover
was consensual to categorize the eighteen organizations.
A descriptive analysis was performed with the Statistical Product and Service
Solutions (SPSS) [17] in order to categorize the organizations according to their size.
Afterwards, an identification of the PM and Portfolio Management processes, and OE
areas that are “best” implemented and those that are urgent to improve, regarding
organizations’ size, was made. Finally, to test whether there was a relation between
the organization size and the use of the identified processes, a non-parametric analysis
was conducted.
4 Results Analysis
Tables 2, 3 and 4 present, for the IST organizations assessed in the OPM3®
Portugal Project, the average percentage and ranking of PM and Portfolio
Management processes and OE areas, organized by size. The Program Management
processes were excluded from the data analysis as the organizations under study did
not present processes for programs different than those they have for projects. Results
of the top five processes or areas per organization size are highlighted in bold and
grey in the three tables.
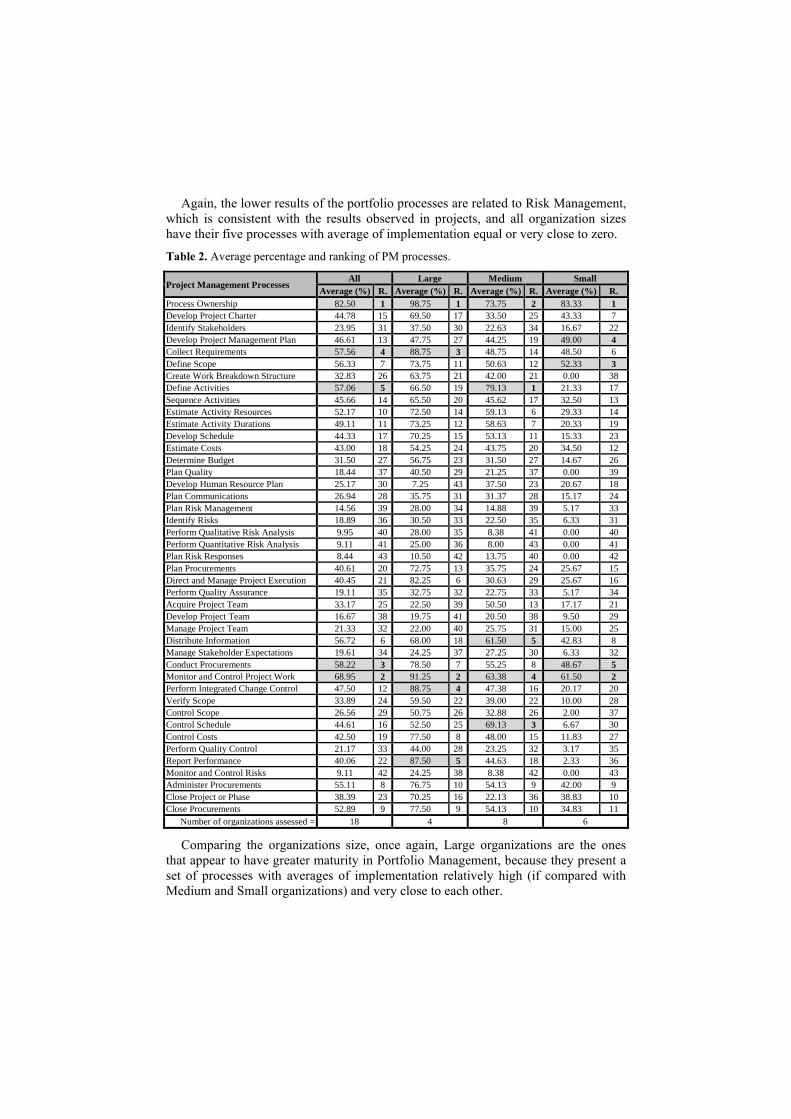
Table 2 shows that on average, Process Ownership is the process with the higher
percentage of implementation. Notice that it appears in first position in the Large and
Small size organizations and in second position in Medium size. The processes
Monitor and Control Project Work, Conduct Procurements, Collect Requirements and
Define Activities, are also present in the overall top five. In addition, the other
processes that appear in the top five should also be stressed: Perform Integrated
Change Control and Report Performance in Large organizations, Distribute
Information and Control Schedule in Medium organizations and Develop Project
Management Plan and Define Scope in Small organizations.
The five PM processes with lower average percentage of implementation are
related to Risk Management. Furthermore, it should be noted that for Small IST
organizations, the five processes with a lower average of implementation present the
value zero, which means that these processes are not simply implemented in any
Small organization!
Comparing the three different organizations size, clearly Large organizations were
those who obtained better results in PM processes, with averages above 87% in the
five processes with higher average of implementation, and above 7% in the five
processes with lower average of implementation. On the contrary, Small
organizations obtained the lowest results for PM processes, with only three processes
with averages above 50% and with six processes with average of 0%.
Table 3 shows the results for Portfolio Management per organization size. Process
Ownership, as in PM processes, is the process that most stands out because it
occupies the first position for all types of organization sizes. It should also be stressed
that the processes involving the components of portfolios (projects and programs)
namely Authorize Components, Identify Components, Categorize Components,
Prioritize Components, Evaluate Components and Select Components, in one way or
another are presented in the top five of the three organization sizes, although their
overall averages are low (below 18%).
Again, the lower results of the portfolio processes are related to Risk Management,
which is consistent with the results observed in projects, and all organization sizes
have their five processes with average of implementation equal or very close to zero.
Table 2. Average percentage and ranking of PM processes.
Project Management Processes All Large Medium Small
Average (%) R. Average (%) R. Average (%) R. Average (%) R.
Process Ownership 82.50 1 98.75 1 73.75 2 83.33 1
Develop Project Charter 44.78 15 69.50 17 33.50 25 43.33 7
Identify Stakeholders 23.95 31 37.50 30 22.63 34 16.67 22
Develop Project Management Plan 46.61 13 47.75 27 44.25 19 49.00 4
Collect Requirements 57.56 4 88.75 3 48.75 14 48.50 6
Define Scope 56.33 7 73.75 11 50.63 12 52.33 3
Create Work Breakdown Structure 32.83 26 63.75 21 42.00 21 0.00 38
Define Activities 57.06 5 66.50 19 79.13 1 21.33 17
Sequence Activities 45.66 14 65.50 20 45.62 17 32.50 13
Estimate Activity Resources 52.17 10 72.50 14 59.13 6 29.33 14
Estimate Activity Durations 49.11 11 73.25 12 58.63 7 20.33 19
Develop Schedule 44.33 17 70.25 15 53.13 11 15.33 23
Estimate Costs 43.00 18 54.25 24 43.75 20 34.50 12
Determine Budget 31.50 27 56.75 23 31.50 27 14.67 26
Plan Quality 18.44 37 40.50 29 21.25 37 0.00 39
Develop Human Resource Plan 25.17 30 7.25 43 37.50 23 20.67 18
Plan Communications 26.94 28 35.75 31 31.37 28 15.17 24
Plan Risk Management 14.56 39 28.00 34 14.88 39 5.17 33
Identify Risks 18.89 36 30.50 33 22.50 35 6.33 31
Perform Qualitative Risk Analysis 9.95 40 28.00 35 8.38 41 0.00 40
Perform Quantitative Risk Analysis 9.11 41 25.00 36 8.00 43 0.00 41
Plan Risk Responses 8.44 43 10.50 42 13.75 40 0.00 42
Plan Procurements 40.61 20 72.75 13 35.75 24 25.67 15
Direct and Manage Project Execution 40.45 21 82.25 6 30.63 29 25.67 16
Perform Quality Assurance 19.11 35 32.75 32 22.75 33 5.17 34
Acquire Project Team 33.17 25 22.50 39 50.50 13 17.17 21
Develop Project Team 16.67 38 19.75 41 20.50 38 9.50 29
Manage Project Team 21.33 32 22.00 40 25.75 31 15.00 25
Distribute Information 56.72 6 68.00 18 61.50 5 42.83 8
Manage Stakeholder Expectations 19.61 34 24.25 37 27.25 30 6.33 32
Conduct Procurements 58.22 3 78.50 7 55.25 8 48.67 5
Monitor and Control Project Work 68.95 2 91.25 2 63.38 4 61.50 2
Perform Integrated Change Control 47.50 12 88.75 4 47.38 16 20.17 20
Verify Scope 33.89 24 59.50 22 39.00 22 10.00 28
Control Scope 26.56 29 50.75 26 32.88 26 2.00 37
Control Schedule 44.61 16 52.50 25 69.13 3 6.67 30
Control Costs 42.50 19 77.50 8 48.00 15 11.83 27
Perform Quality Control 21.17 33 44.00 28 23.25 32 3.17 35
Report Performance 40.06 22 87.50 5 44.63 18 2.33 36
Monitor and Control Risks 9.11 42 24.25 38 8.38 42 0.00 43
Administer Procurements 55.11 8 76.75 10 54.13 9 42.00 9
Close Project or Phase 38.39 23 70.25 16 22.13 36 38.83 10
Close Procurements 52.89 9 77.50 9 54.13 10 34.83 11
Number of organizations assessed = 18 4 8 6
Comparing the organizations size, once again, Large organizations are the ones
that appear to have greater maturity in Portfolio Management, because they present a
set of processes with averages of implementation relatively high (if compared with
Medium and Small organizations) and very close to each other.
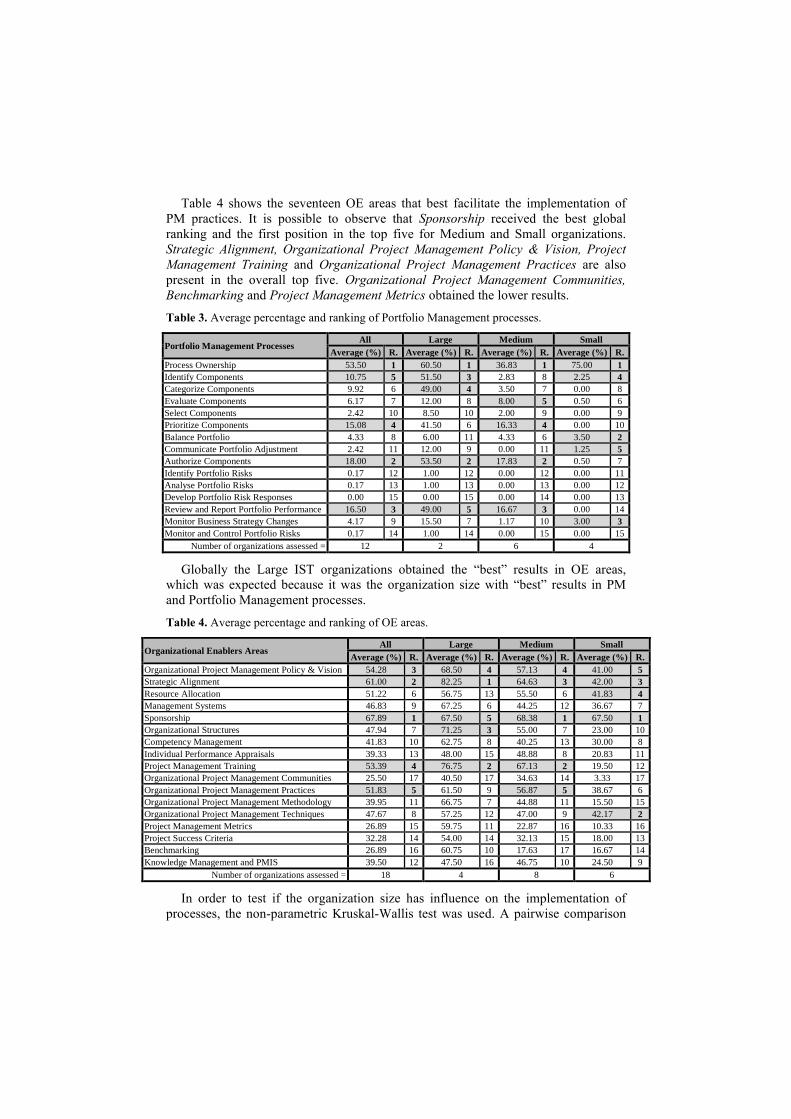
Table 4 shows the seventeen OE areas that best facilitate the implementation of
PM practices. It is possible to observe that Sponsorship received the best global
ranking and the first position in the top five for Medium and Small organizations.
Strategic Alignment, Organizational Project Management Policy & Vision, Project
Management Training and Organizational Project Management Practices are also
present in the overall top five. Organizational Project Management Communities,
Benchmarking and Project Management Metrics obtained the lower results.
Table 3. Average percentage and ranking of Portfolio Management processes.
Portfolio Management Processes All Large Medium Small
Average (%) R. Average (%) R. Average (%) R. Average (%) R.
Process Ownership 53.50 1 60.50 1 36.83 1 75.00 1
Identify Components 10.75 5 51.50 3 2.83 8 2.25 4
Categorize Components 9.92 6 49.00 4 3.50 7 0.00 8
Evaluate Components 6.17 7 12.00 8 8.00 5 0.50 6
Select Components 2.42 10 8.50 10 2.00 9 0.00 9
Prioritize Components 15.08 4 41.50 6 16.33 4 0.00 10
Balance Portfolio 4.33 8 6.00 11 4.33 6 3.50 2
Communicate Portfolio Adjustment 2.42 11 12.00 9 0.00 11 1.25 5
Authorize Components 18.00 2 53.50 2 17.83 2 0.50 7
Identify Portfolio Risks 0.17 12 1.00 12 0.00 12 0.00 11
Analyse Portfolio Risks 0.17 13 1.00 13 0.00 13 0.00 12
Develop Portfolio Risk Responses 0.00 15 0.00 15 0.00 14 0.00 13
Review and Report Portfolio Performance 16.50 3 49.00 5 16.67 3 0.00 14
Monitor Business Strategy Changes 4.17 9 15.50 7 1.17 10 3.00 3
Monitor and Control Portfolio Risks 0.17 14 1.00 14 0.00 15 0.00 15
Number of organizations assessed = 12 2 6 4
Globally the Large IST organizations obtained the “best” results in OE areas,
which was expected because it was the organization size with “best” results in PM
and Portfolio Management processes.
Table 4. Average percentage and ranking of OE areas.
Organizational Enablers Areas All Large Medium Small
Average (%) R. Average (%) R. Average (%) R. Average (%) R.
Organizational Project Management Policy & Vision 54.28 3 68.50 4 57.13 4 41.00 5
Strategic Alignment 61.00 2 82.25 1 64.63 3 42.00 3
Resource Allocation 51.22 6 56.75 13 55.50 6 41.83 4
Management Systems 46.83 9 67.25 6 44.25 12 36.67 7
Sponsorship 67.89 1 67.50 5 68.38 1 67.50 1
Organizational Structures 47.94 7 71.25 3 55.00 7 23.00 10
Competency Management 41.83 10 62.75 8 40.25 13 30.00 8
Individual Performance Appraisals 39.33 13 48.00 15 48.88 8 20.83 11
Project Management Training 53.39 4 76.75 2 67.13 2 19.50 12
Organizational Project Management Communities 25.50 17 40.50 17 34.63 14 3.33 17
Organizational Project Management Practices 51.83 5 61.50 9 56.87 5 38.67 6
Organizational Project Management Methodology 39.95 11 66.75 7 44.88 11 15.50 15
Organizational Project Management Techniques 47.67 8 57.25 12 47.00 9 42.17 2
Project Management Metrics 26.89 15 59.75 11 22.87 16 10.33 16
Project Success Criteria 32.28 14 54.00 14 32.13 15 18.00 13
Benchmarking 26.89 16 60.75 10 17.63 17 16.67 14
Knowledge Management and PMIS 39.50 12 47.50 16 46.75 10 24.50 9
Number of organizations assessed = 18 4 8 6
In order to test if the organization size has influence on the implementation of
processes, the non-parametric Kruskal-Wallis test was used. A pairwise comparison
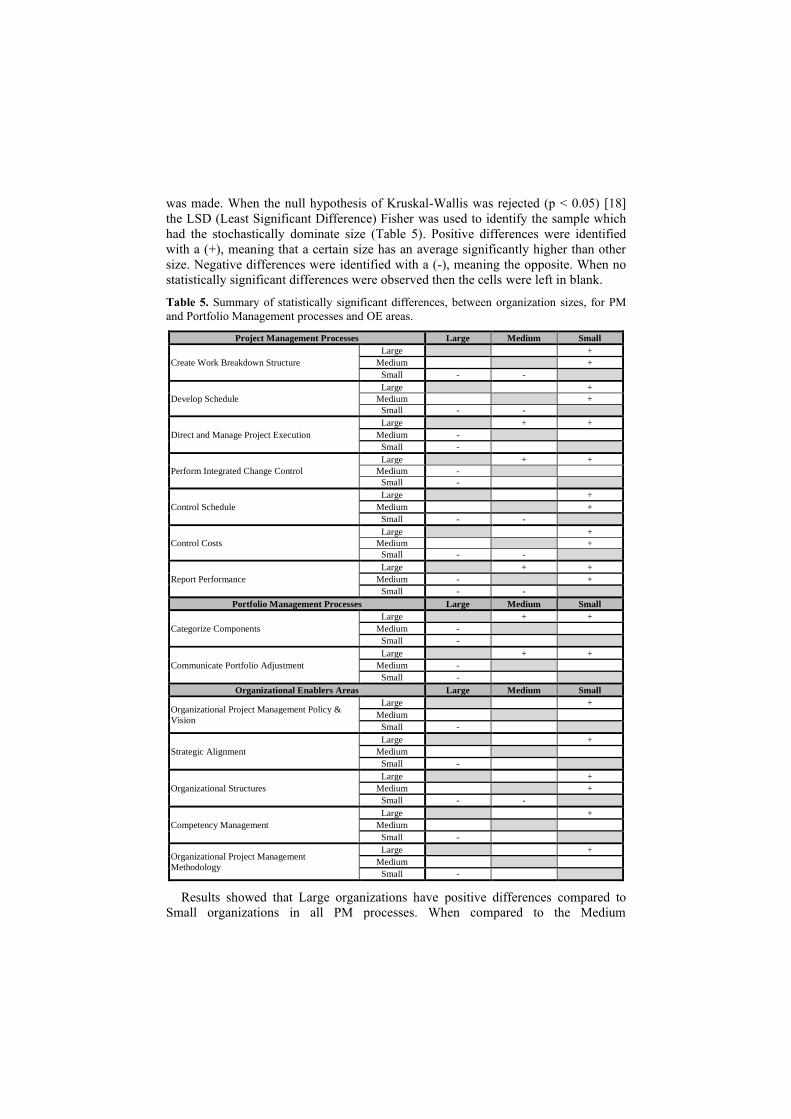
was made. When the null hypothesis of Kruskal-Wallis was rejected (p < 0.05) [18]
the LSD (Least Significant Difference) Fisher was used to identify the sample which
had the stochastically dominate size (Table 5). Positive differences were identified
with a (+), meaning that a certain size has an average significantly higher than other
size. Negative differences were identified with a (-), meaning the opposite. When no
statistically significant differences were observed then the cells were left in blank.
Table 5. Summary of statistically significant differences, between organization sizes, for PM
and Portfolio Management processes and OE areas.
Project Management Processes Large Medium Small
Create Work Breakdown Structure
Large +
Medium +
Small - -
Develop Schedule
Large +
Medium +
Small - -
Direct and Manage Project Execution
Large + +
Medium -
Small -
Perform Integrated Change Control
Large + +
Medium -
Small -
Control Schedule
Large +
Medium +
Small - -
Control Costs
Large +
Medium +
Small - -
Report Performance
Large + +
Medium - +
Small - -
Portfolio Management Processes Large Medium Small
Categorize Components
Large + +
Medium -
Small -
Communicate Portfolio Adjustment
Large + +
Medium -
Small -
Organizational Enablers Areas Large Medium Small
Organizational Project Management Policy &
Vision
Large +
Medium
Small -
Strategic Alignment
Large +
Medium
Small -
Organizational Structures
Large +
Medium +
Small - -
Competency Management
Large +
Medium
Small -
Organizational Project Management
Methodology
Large +
Medium
Small -
Results showed that Large organizations have positive differences compared to
Small organizations in all PM processes. When compared to the Medium
organizations, only three of the seven processes have positive differences. Medium
organizations show positive differences compared to Small organizations in five of
the seven processes. The results suggest that the maturity of the implementation of the
processes signalled in Table 5 is dependent of the IST organizations’ size.
Regarding the analysis of the Portfolio Management processes, and based on the
results presented on Table 5, Large organizations show positive differences compared
to Medium and Small organizations. Thus, it seems that as in PM processes, the Large
organizations are the ones that present a greater maturity in the implementation of
Portfolio Management processes.
In OE areas, Large organizations show positive differences in the five areas when
compared to Small organizations. Medium organizations show positive differences
only in the Organizational Structures when compared to Small
organizations. Curiously, for OE areas, there are no statistically significant differences
between Large and Medium organizations, unlike PM and Portfolio Management
processes.
5 Conclusions and Future Research
The main objectives of this study were to examine the state of PM maturity of IST
Portuguese organizations, and also to identify and compare the PM and Portfolio
Management processes and OE areas, for different organization sizes.
An important limitation of this study was the sample size. Indeed, only eighteen
organizations were analysed making hard the discussion of the results and not
allowing the generalization to other IST organizations. However, results may be used
as a guide, for the IST organizations. That is, according to their size, organizations
can have an idea of which of the PM and Portfolio Management processes and OE
areas are mostly implemented. This knowledge can help organizations to improve
their PM maturity.
Large IST organizations stand out from Medium and Small organizations, since
they globally presented the best results. Deepening in the results, there are positive
differences for Small organizations in 7 PM processes (Create Work Breakdown
Structure, Develop Schedule, Direct and Manage Project Execution, Perform
Integrated Change Control, Control Schedule, Control Costs and Report
Performance), 2 Portfolio Management processes (Categorize Components and
Communicate Portfolio Adjustment) and 5 OE areas (Organizational Project
Management Policy & Vision, Strategic Alignment, Organizational Structures,
Competency Management and Organizational Project Management Methodology).
Regarding the Medium organizations, the differences observed are related to 3 PM
processes (Direct and Manage Project Execution, Perform Integrated Change
Control and Report Performance) and 2 Portfolio Management processes (Categorize
Components and Communicate Portfolio Adjustment). Therefore, the referred
processes are those that effectively differentiate the Large IST organizations, from
Medium and Small sizes. Despite these processes and areas are not the most
implemented in the eighteen organizations, they allow Large organizations to be more
mature than the others.
Being a pioneer study in this area in the world, it is not possible to compare the
results and conclude whether these Portuguese organizations present a good or bad
PM maturity. Taking into account the results, we can only conclude that there is a
significant opportunity to improve the implementation of PM practices in IST
Portuguese organizations. For future work, it would be interesting, in parallel with a
more representative study of the population, i.e., using a larger sample, to create a
model that would simplify the selection of priority PM practices to be implemented
by the different types of organization, serving as a benchmarking tool.
References
1. Demir, C., Kocabas, I.: Project Management Maturity Model (PMMM) in educational
organizations. World Conference on Learning, Teaching and Administration Papers. 9,
(2010)
2. Shi, Q.: Rethinking the implementation of project management: A Value Adding Path Map
approach. International Journal of Project Management. 29(3), 295--302 (2011)
3. Andersen, E.S., Jessen, S.A.: Project maturity in organisations. International Journal of
Project Management. 21(6), 457--461 (2003)
4. Jugdev, K., Thomas, J.: Project management maturity models: The silver bullets of
competitive advantage. Project Management Journal, (2002)
5. Pazderka, M., Grechenig, T.: Project Management Maturity Models: Towards Best Practices
for Virtual Teams. In: 2007 IEEE International Engineering Management Conference. pp.
83--88. Lost Pines, TX. (2007)
6. Schlichter, J., Tamimi, A., Cooke-Davies, T.J.: Linking Project Management Practice to
Organizational Strategy in a Saudi Arabian Government Department. In: PMI Global
Congress Proceedings. Orlando, Florida. (2009)
7. Cooke-Davies, T.J., Schlichter, J., Bredillet, C.: Beyond the PMBOK guide. In: Proceedings
of the 32nd Annual Project Management Institute 2001 Seminars and Symposium.
Nashville, TN. (2001)
8. Berssaneti, F.T., Carvalho, M.M.d., Muscat, A.R.N.: Impacto dos modelos de referência e
maturidade no gerenciamento de projetos: estudo exploratório em projetos de tecnologia da
informação. Production, 22(3). pp. 404--435. (2012)
9. PMI: Organizational Project Management Maturity Model (OPM3) - Third Edition.
Knowledge Foundation. Project Management Institute, Inc. Pennsylvania - USA. (2013)
10. Lima, R.R., Anselmo, J.L.: Gerenciamento de Projetos com OPM3™: O caso Promon. In:
PMI Global Congress Proceedings. Buenos Aires, Argentina. (2004)
11. Jia, G., Cao, L., Chen, J., Zhou, S., Wang, J.: Application of Organizational Project
Management Maturity Model (OPM3) to Construction in China: An Empirical Study. In:
Proceedings of the International Conference on Information Management, Innovation
Management and Industrial Engineering. Taiwan. (2008)
12. Zaguir, N.A., Martins, M.R.: Revisão Critica do OPM3: um estudo de redundâncias. Revista
Gestão Industrial. 3(1). (2007)
13. Pinto, J.A.: 100 Organizational Improvements using OPM3®. In: 2013 PMI Global Congress
Proceedings. New Orleans, Louisiana – USA. (2013)
14. Pinto, J.A., Williams, N.: Country Project Management Maturity. In: 2013 PMI Global
Congress Proceedings. Istanbul – Turkey. (2013)
15. Silva, D., Tereso, A., Fernandes, G., Pinto, J.A.: OPM3® Portugal Project: Analysis of
Preliminary Results. Procedia Technology, 16, 1027--1036. (2014)
16. EC: Annual Report on European SMEs 2012/2013. (2013)
17. IBM: IBM SPSS Statistics for Windows. IBM Corp. Armonk, NY. (2013)

18. Field, A.: Discovering statistics using SPSS. SAGE. Los Angeles. (2009)
Related Documents


![OPM3 N2C2M2 Slides[1]](https://static.cupdf.com/doc/110x72/577d22881a28ab4e1e97a1e5/opm3-n2c2m2-slides1.jpg)