HAL Id: insu-02157512 https://hal-insu.archives-ouvertes.fr/insu-02157512 Submitted on 18 Jun 2019 HAL is a multi-disciplinary open access archive for the deposit and dissemination of sci- entific research documents, whether they are pub- lished or not. The documents may come from teaching and research institutions in France or abroad, or from public or private research centers. L’archive ouverte pluridisciplinaire HAL, est destinée au dépôt et à la diffusion de documents scientifiques de niveau recherche, publiés ou non, émanant des établissements d’enseignement et de recherche français ou étrangers, des laboratoires publics ou privés. Distributed under a Creative Commons Attribution - NonCommercial - NoDerivatives| 4.0 International License On the relationship between oxidation state and temperature of volcanic gas emissions Yves Moussallam, Clive Oppenheimer, Bruno Scaillet To cite this version: Yves Moussallam, Clive Oppenheimer, Bruno Scaillet. On the relationship between oxidation state and temperature of volcanic gas emissions. Earth and Planetary Science Letters, Elsevier, 2019, 520, pp.260-267. 10.1016/j.epsl.2019.05.036. insu-02157512

Welcome message from author
This document is posted to help you gain knowledge. Please leave a comment to let me know what you think about it! Share it to your friends and learn new things together.
Transcript
HAL Id: insu-02157512https://hal-insu.archives-ouvertes.fr/insu-02157512
Submitted on 18 Jun 2019
HAL is a multi-disciplinary open accessarchive for the deposit and dissemination of sci-entific research documents, whether they are pub-lished or not. The documents may come fromteaching and research institutions in France orabroad, or from public or private research centers.
L’archive ouverte pluridisciplinaire HAL, estdestinée au dépôt et à la diffusion de documentsscientifiques de niveau recherche, publiés ou non,émanant des établissements d’enseignement et derecherche français ou étrangers, des laboratoirespublics ou privés.
Distributed under a Creative Commons Attribution - NonCommercial - NoDerivatives| 4.0International License
On the relationship between oxidation state andtemperature of volcanic gas emissionsYves Moussallam, Clive Oppenheimer, Bruno Scaillet
To cite this version:Yves Moussallam, Clive Oppenheimer, Bruno Scaillet. On the relationship between oxidation stateand temperature of volcanic gas emissions. Earth and Planetary Science Letters, Elsevier, 2019, 520,pp.260-267. �10.1016/j.epsl.2019.05.036�. �insu-02157512�
1
On the relationship between oxidation state and temperature of 1
volcanic gas emissions 2
Yves Moussallam1,2, Clive Oppenheimer1, Bruno Scaillet3. 3
1 Department of Geography, University of Cambridge, Downing Place, Cambridge, CB2 3EN, UK 4
2 Laboratoire Magmas et Volcans, Univ. Blaise Pascale – CNRS – IRD, OPGC, 63000 Clermont-Ferrand, France 5
3ISTO, 7327 Université d’Orléans-CNRS-BRGM, 1A rue de la Férollerie, 45071 Orléans cedex 2, France 6
7
Corresponding author: Yves Moussallam; [email protected] 8
Keywords: oxygen fugacity; volcanic degassing; early Earth; redox; great oxidation event. 9
10
ABSTRACT 11
The oxidation state of volcanic gas emissions influences the composition of the exosphere and 12
planetary habitability. It is widely considered to be associated with the oxidation state of the 13
melt from which volatiles exsolve. Here, we present a global synthesis of volcanic gas 14
measurements. We define the mean oxidation state of volcanic gas emissions on Earth today 15
and show that, globally, gas oxidation state, relative to rock buffers, is a strong function of 16
emission temperature, increasing by several orders of magnitude as temperature decreases. The 17
trend is independent of melt composition and geodynamic setting. This observation may 18
explain why the mean oxidation state of volcanic gas emissions on Earth has apparently 19
increased since the Archean, without a corresponding shift in melt oxidation state. We argue 20
that progressive cooling of the mantle and the cessation of komatiite generation should have 21
been accompanied by a substantial increase of the oxidation state of volcanic gases around the 22
onset of the Great Oxidation Event. This may have accelerated or facilitated the transition to 23
an oxygen-rich atmosphere. Overall, our data, along with previous work, show that there is no 24
single nor simple relationships between mantle, magmas and volcanic gas redox states. 25
2
I. INTRODUCTION 26
The secondary atmospheres of planetary bodies form and evolve by degassing of volatiles from 27
their interiors (e.g., Kasting, 1993; Elkins-Tanton, 2008; Hirschmann and Dasgupta, 2009). 28
The oxidation state of these emissions strongly influences that of the planet’s exosphere, 29
dictating its habitability (e.g., Gaillard and Scaillet, 2014; Kasting et al., 2003). On Earth, 30
several lines of evidence suggest that both atmosphere and ocean were oxygen poor during the 31
Archean (e.g., Bekker et al., 2004; Canfield et al., 2000; Farquhar et al., 2007), prior to the 32
Great Oxidation Event (between 2.45 and 2.22 Ga ago) (e.g., Canfield, 2005). It has been 33
argued that a change in the oxidation state of volcanic gas emissions during this period might 34
have played a role in the rapid oxidation of the atmosphere (e.g., Kasting et al., 1993; Holland, 35
2002; Kump and Barley, 2007; Halevy et al., 2010; Gaillard et al., 2011). The underlying 36
processes for such a change remain unclear, however, especially given the lack of evidence for 37
more reducing conditions in the Archean mantle (e.g., Berry et al., 2008; Canil, 1997, 2002; 38
Rollinson et al., 2017). 39
A first step towards understanding the evolution of volcanic gas oxidation state through time 40
is to constrain the oxidation state of volcanic gas emissions on Earth today. Surprisingly, this 41
quantity and its associated natural variability, have not hitherto been constrained. Direct 42
sampling of volcanic gases has been practised for more than a century, often using tubing 43
inserted into vents to avoid or limit air contamination. Much of the resulting analytical data 44
pertains to point-source fumarole emissions (e.g., Symonds et al., 1994). Latterly, field 45
spectroscopy (e.g., Mori et al., 1993) and electrochemical sensing (e.g., Shinohara, 2005) have 46
facilitated measurement of emissions, notably from open vents (characterized by a magma-air 47
interface), where the volcanic gases are already substantially diluted in air. The wealth of data 48
now available permits investigation of the distribution of oxidation state of volcanic gases 49
emitted to the global atmosphere. 50
3
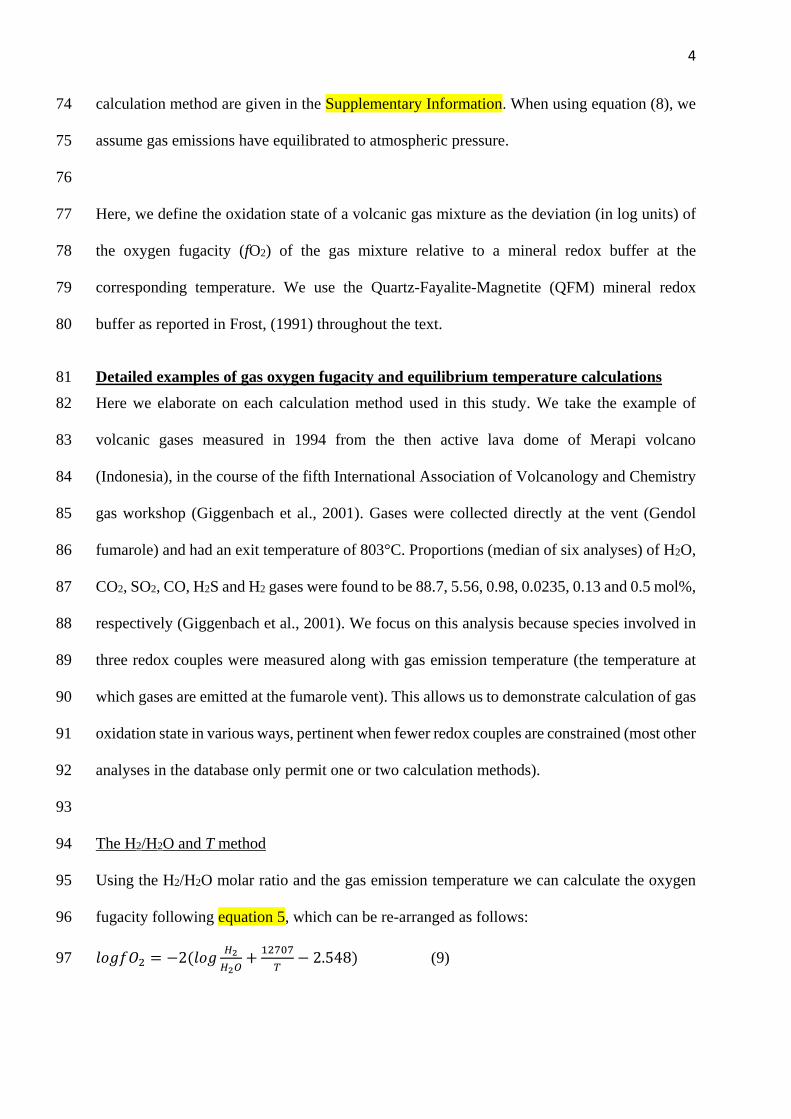
II. METHOD 51
We compiled a global dataset of high temperature (≥600°C) volcanic gases, for which gas-rock 52
or gas-fluid interactions are minimal (Giggenbach, 1996; Symonds et al., 2001). Data presented 53
in this paper are provided in the Supplementary Information (Tables S1 and S2 together with 54
references). Following established methodology (e.g., Giggenbach, 1980, 1987; 1996; Ohba et 55
al., 1994; Chiodini and Marini, 1998; Moretti et al., 2003; Moretti and Papale, 2004; Aiuppa 56
et al., 2011), the oxygen fugacity (fO2) of volcanic gases was calculated using gas-phase redox 57
couples that can be expressed by reactions involving oxygen such as: 58
H2 + ½O2 = H2O (1) 59
CO2 = CO + ½O2 (2) 60
H2S + 3/2O2 = SO2 + H2O (3) 61
3CO + SO2 = 2CO2 + OCS (4) 62
Those can then be translated in terms of fO2 by introducing the equilibrium constant K, 63
considering that, at near atmospheric pressure, the fugacity of a gas is equal to its partial 64
pressure and using published thermodynamic constants (Chase 1998; Stull et al., 1969): 65
𝑙𝑜𝑔𝐻2
𝐻2𝑂= −
12707
𝑇+ 2.548 −
1
2𝑙𝑜𝑔𝑓𝑂2 (5) 66
𝑙𝑜𝑔𝐶𝑂2
𝐶𝑂=
14775
𝑇− 4.544 +
1
2𝑙𝑜𝑔𝑓𝑂2 (6) 67
𝑙𝑜𝑔𝑆𝑂2
𝐻2𝑆=
27377
𝑇− 3.986 +
3
2𝑙𝑜𝑔𝑓𝑂2 − 𝑙𝑜𝑔𝑓𝐻2𝑂 (7) 68
(8) 69
Where the pressure (P) and fugacities (f) are in bars and the temperature (T) is in Kelvin. Given 70
two redox couples, the oxygen fugacity and equilibrium temperature can be calculated. 71
Alternatively, if the gas temperature is known (i.e. measured by thermocouple at the vent) the 72
oxygen fugacity can be determined with only one redox couple. Detailed examples of each 73
2
2
2
log24403.945.15386
log SO
OCS
CO
CO
CO xx
x
x
x
TP
4
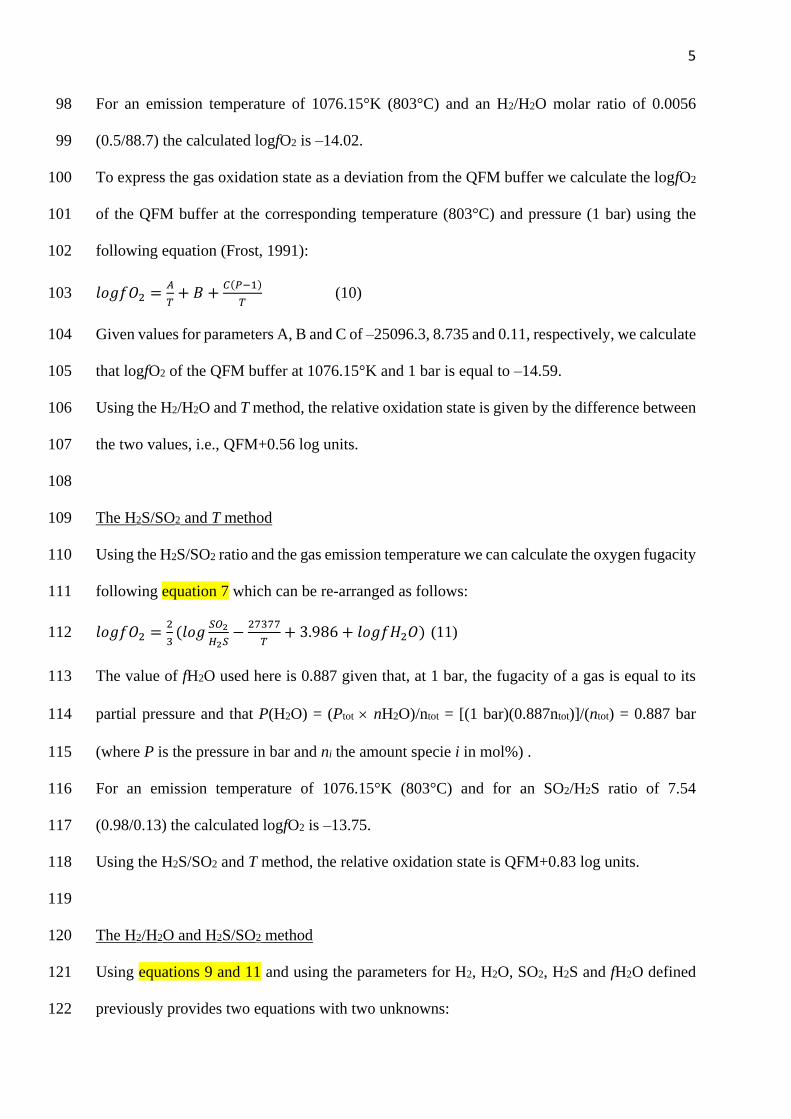
calculation method are given in the Supplementary Information. When using equation (8), we 74
assume gas emissions have equilibrated to atmospheric pressure. 75
76
Here, we define the oxidation state of a volcanic gas mixture as the deviation (in log units) of 77
the oxygen fugacity (fO2) of the gas mixture relative to a mineral redox buffer at the 78
corresponding temperature. We use the Quartz-Fayalite-Magnetite (QFM) mineral redox 79
buffer as reported in Frost, (1991) throughout the text. 80
Detailed examples of gas oxygen fugacity and equilibrium temperature calculations 81
Here we elaborate on each calculation method used in this study. We take the example of 82
volcanic gases measured in 1994 from the then active lava dome of Merapi volcano 83
(Indonesia), in the course of the fifth International Association of Volcanology and Chemistry 84
gas workshop (Giggenbach et al., 2001). Gases were collected directly at the vent (Gendol 85
fumarole) and had an exit temperature of 803°C. Proportions (median of six analyses) of H2O, 86
CO2, SO2, CO, H2S and H2 gases were found to be 88.7, 5.56, 0.98, 0.0235, 0.13 and 0.5 mol%, 87
respectively (Giggenbach et al., 2001). We focus on this analysis because species involved in 88
three redox couples were measured along with gas emission temperature (the temperature at 89
which gases are emitted at the fumarole vent). This allows us to demonstrate calculation of gas 90
oxidation state in various ways, pertinent when fewer redox couples are constrained (most other 91
analyses in the database only permit one or two calculation methods). 92
93
The H2/H2O and T method 94
Using the H2/H2O molar ratio and the gas emission temperature we can calculate the oxygen 95
fugacity following equation 5, which can be re-arranged as follows: 96
𝑙𝑜𝑔𝑓𝑂2 = −2(𝑙𝑜𝑔𝐻2
𝐻2𝑂+
12707
𝑇− 2.548) (9) 97
5
For an emission temperature of 1076.15°K (803°C) and an H2/H2O molar ratio of 0.0056 98
(0.5/88.7) the calculated logfO2 is –14.02. 99
To express the gas oxidation state as a deviation from the QFM buffer we calculate the logfO2 100
of the QFM buffer at the corresponding temperature (803°C) and pressure (1 bar) using the 101
following equation (Frost, 1991): 102
𝑙𝑜𝑔𝑓𝑂2 =𝐴
𝑇+ 𝐵 +
𝐶(𝑃−1)
𝑇 (10) 103
Given values for parameters A, B and C of –25096.3, 8.735 and 0.11, respectively, we calculate 104
that logfO2 of the QFM buffer at 1076.15°K and 1 bar is equal to –14.59. 105
Using the H2/H2O and T method, the relative oxidation state is given by the difference between 106
the two values, i.e., QFM+0.56 log units. 107
108
The H2S/SO2 and T method 109
Using the H2S/SO2 ratio and the gas emission temperature we can calculate the oxygen fugacity 110
following equation 7 which can be re-arranged as follows: 111
𝑙𝑜𝑔𝑓𝑂2 =2
3(𝑙𝑜𝑔
𝑆𝑂2
𝐻2𝑆−
27377
𝑇+ 3.986 + 𝑙𝑜𝑔𝑓𝐻2𝑂) (11) 112
The value of fH2O used here is 0.887 given that, at 1 bar, the fugacity of a gas is equal to its 113
partial pressure and that P(H2O) = (Ptot nH2O)/ntot = [(1 bar)(0.887ntot)]/(ntot) = 0.887 bar 114
(where P is the pressure in bar and ni the amount specie i in mol%) . 115
For an emission temperature of 1076.15°K (803°C) and for an SO2/H2S ratio of 7.54 116
(0.98/0.13) the calculated logfO2 is –13.75. 117
Using the H2S/SO2 and T method, the relative oxidation state is QFM+0.83 log units. 118
119
The H2/H2O and H2S/SO2 method 120
Using equations 9 and 11 and using the parameters for H2, H2O, SO2, H2S and fH2O defined 121
previously provides two equations with two unknowns: 122
6
𝑙𝑜𝑔𝑓𝑂2 = −2(−2.248 +12707
𝑇− 2.548) (12) 123
and 124
𝑙𝑜𝑔𝑓𝑂2 =2
3(0.877 −
27377
𝑇+ 3.986 − 0.052) (13) 125
Solving these equations yields an equilibrium temperature of 1122°K (849°C) for a logfO2 of 126
–13.06. Using equation 10 to calculate the logfO2 of the QFM buffer at the corresponding 127
temperature gives a logfO2 of –13.64 for QFM. Hence combining H2/H2O and H2S/SO2 yields 128
an oxidation state of QFM+0.57 log units. 129
130
The H2S/SO2 and CO/CO2 method 131
Using equation 11, and re-arranging equation 6 as follows: 132
𝑙𝑜𝑔𝑓𝑂2 = 2(𝑙𝑜𝑔𝐶𝑂2
𝐶𝑂−
14775
𝑇+ 4.544) (14) 133
We can then use the parameters for CO2, CO, SO2, H2S and fH2O defined previously to write 134
two equations with two unknowns: 135
𝑙𝑜𝑔𝑓𝑂2 =2
3(0.877 −
27377
𝑇+ 3.986 − 0.052) (15) 136
and 137
𝑙𝑜𝑔𝑓𝑂2 = 2(2.3739 −14775
𝑇+ 4.544) (16) 138
Solving these equations yields an equilibrium temperature of 1063°K (790°C) for a logfO2 of 139
–13.96. Using equation 10 to calculate the logfO2 of the QFM buffer at the corresponding 140
temperature gives a logfO2 of –14.87 for QFM. Hence using the CO/CO2 and H2S/SO2 method 141
the oxidation state is QFM+0.56 log units. 142
143
The CO2-CO-OCS-SO2 method 144
For this example, we cannot use the Merapi gas composition as OCS was not reported. We use 145
instead the composition of the gas emitted during passive degassing from the lava lake of 146
7
Erebus volcano (Antarctica) (Peters et al., 2014). In this case, neither H2 nor H2S were 147
measured, but equilibrium conditions can still be constrained owing to measurement of OCS. 148
Molar proportions of H2O, CO2, SO2, CO, HCl, HF, OCS were 58, 38.4, 1, 1.7, 0.7, 1.3 and 149
0.009 mol%, respectively. 150
151
Using the CO/CO2 and CO/OCS mixing ratios we can calculate the equilibrium temperature 152
following equation 8, rearranging as follows: 153
𝑇 =−15386.45
𝑙𝑜𝑔𝑃−9.24403+𝑙𝑜𝑔((𝑥𝐶𝑂𝑥𝐶𝑂2
)
2
(𝑥𝐶𝑂𝑥𝑂𝐶𝑆
)𝑥𝑆𝑂2)
(16) 154
Given a XSO2 of 0.01, a CO/CO2 molar ratio of 0.043, a CO/OCS molar ratio of 192 and 155
assuming equilibration at atmospheric pressure (~0.6 bar at Erebus) yields an equilibrium 156
temperature of 1292 K (1019 °C). 157
To determine the oxygen fugacity, we then use equation 16. Given a CO2/CO ratio of 22.9 and 158
an equilibrium temperature of 1292 K yields a logfO2 of –11.13. Using equation 3 to calculate 159
the logfO2 of the QFM buffer at the corresponding temperature gives a logfO2 of –10.69 for 160
QFM. Hence using the CO2-CO-OCS method the oxidation state is QFM–0.44 log units. 161
162
Sensitivity of oxygen fugacity and equilibrium temperature determinations to 163
instrumental and calculation methods 164
In cases where two redox couples and the emission temperature have been measured, we can 165
calculate the equilibrium temperature (the temperature at which the gas mixture was last in 166
equilibrium) as recorded by the gas redox couples and compare it with the emission 167
temperature (the temperature at which gases are emitted from the vent) as measured in the field 168
by thermocouples (Fig. S1). This shows that gas equilibrium and emission temperatures are 169
correlated and that, in most cases, the gas last equilibrated at the temperature at which it entered 170
8
the atmosphere. Fig. S2 shows that the differences between computed gas oxidation state made 171
using either the calculated equilibrium temperature (based on two redox couples) or the 172
measured emission temperature (and one redox couple) are negligible. 173
174
As shown above, the choice of calculation method can affect the calculated value of logfO2. 175
Using the Merapi gas example, the calculated oxygen fugacity varies from QFM+0.56 to 176
QFM+0.83 while the calculated equilibrium temperature varies from 790 to 849°C (compared 177
with a measured emission temperature of 803°C). A very conservative estimate of the error 178
associated with the calculation method would therefore be of ±0.3 log units of the calculated 179
logfO2 and of ±50°C on the calculated equilibrium temperature. If we consider, too, that the 180
gas ratio measurements themselves have reported errors typically of ±10% this contributes an 181
error of about ±0.15 log units on the calculated logfO2 (e.g., Moussallam et al., 2017, 2018). 182
Treating these errors sources as independent (a conservative assumption) yields our confidence 183
interval of ±0.45 log units on the computed logfO2. 184
185
One assumption made in all presented calculation is that the oxidation state of the volcanic 186
gases has equilibrated to atmospheric pressure. This is reasonable given that hot volcanic gases 187
will equilibrate very rapidly, at least at temperatures above 800 °C (Gerlach, 2004; Martin et 188
al., 2006). 189
190
III. RESULTS 191
Two broad types of observations were used in this study: sensing of the airborne emissions 192
from open-vent volcanoes, and samples collected directly at fumarole vents. We first consider 193
measurements of air-diluted plumes by calculating the equilibrium conditions for reported 194
compositions (Fig. 1A). Persistent degassing dominates the total volcanic volatile flux to the 195
9
atmosphere (Shinohara, 2013) but detailed gas composition measurements remain sparse, with 196
volcanoes shown in Fig. 1A contributing about a third of the estimated global total volcanic 197
SO2 outgassing on Earth over the period 2005–2015 (Carn et al., 2017). We identify a strong 198
correlation between the equilibrium temperature – the final temperature at which the gases 199
were equilibrated (Giggenbach, 1987), unperturbed by mixing with the atmosphere (Aiuppa et 200
al., 2011; Martin et al., 2009) – and gas oxidation state (expressed here as the difference, in log 201
units, from the QFM redox buffer (Frost, 1991). A striking pattern emerges: globally, gases 202
recording high equilibrium temperature are more reduced relative to the buffer, while gases 203
with lower equilibrium temperature are more oxidized. Such a pattern is to be expected if 204
considering a single gas mixture (e.g., Giggenbach, 1987; Ohba et al., 1994) as high 205
temperature will favour the reduced state in most redox reactions (e.g., Ottonello et al., 2001; 206
Moretti and Ottonello, 2005), but the fact that globally, unrelated volcanic gases – emitted by 207
volcanoes in distinct geodynamic settings and with distinct melt composition – conform to a 208
single trend is surprising. 209
210
We consider next high-temperature volcanic gases sampled directly, at fumaroles or via 211
skylights in lava tubes close to the vent, and analysed in the laboratory (e.g., Symonds et al., 212
1994) (Fig. 1B). In this case, emission temperatures were measured in situ by thermocouples, 213
and we have calculated corresponding oxidation states from the reported gas compositions. 214
Despite the marked differences in measurement techniques compared with the air-diluted 215
plume dataset (Fig. 1A), we identify a very similar relationship between gas temperature and 216
oxidation state. Worldwide, gases emitted at high temperatures are more reduced relative to the 217
QFM redox buffer than gases emitted at lower temperatures. That two independent datasets 218
display the same trend suggests a fundamental global relationship between the oxidation state 219
and temperature of volcanic gases. 220
10
221
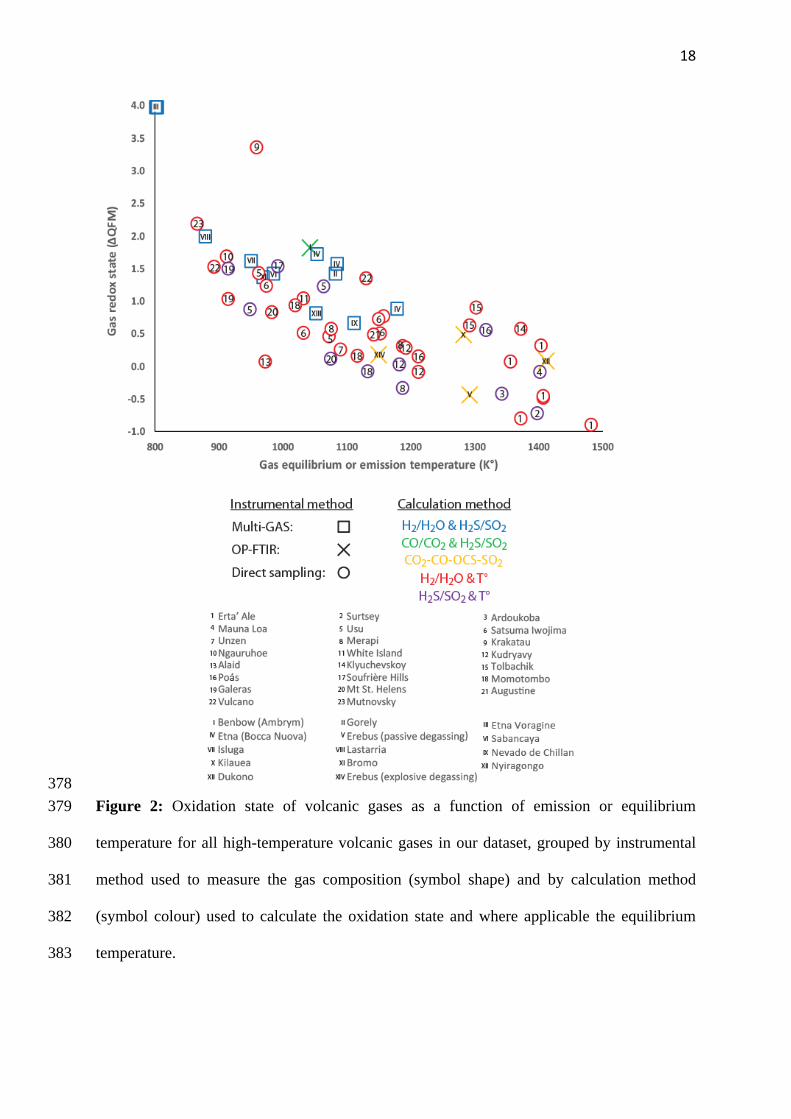
Fig. 2 shows the same data as Fig. 1 but classed according to the instrumental method and to 222
the method used to calculate the oxygen fugacity and, where applicable, the equilibrium 223
temperature. It is clear from these figures that the inverse correlation observed between the gas 224
oxidation state and emission or equilibrium temperature is well-defined regardless of the 225
methodology used to acquire the gas compositional data or the computation method used. 226
227
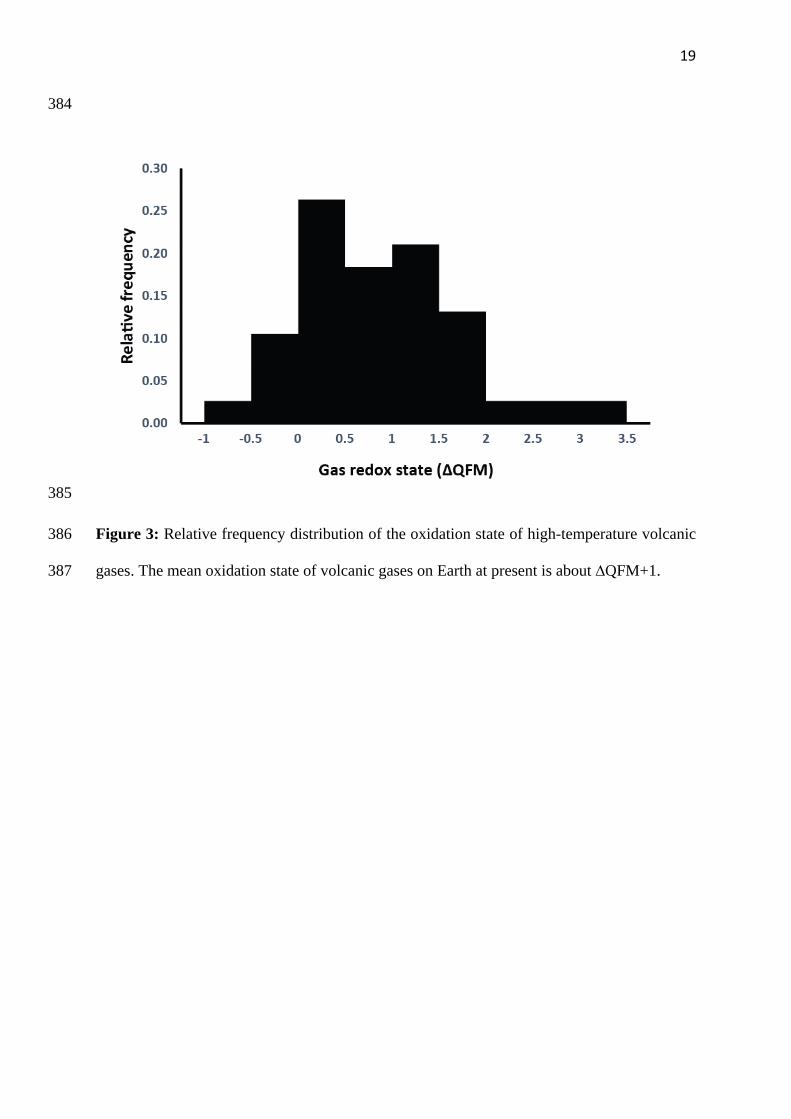
To estimate the mean oxidation state of volcanic gases on Earth at present, we draw on a 228
synthesis of a decade of satellite measurements of SO2 emissions (Carn et al., 2017). For each 229
volcano represented both in this dataset and our own, we ascribe a mean oxidation state to the 230
gas. We then weight each volcano’s output to the atmosphere according to its SO2 flux, leading 231
to an estimate of the mean relative oxidation state of volcanic gas emissions on Earth today of 232
QFM+1.0 (Fig. 3). About 80% of observed high-temperature gases fall within one log unit of 233
this value. 234
235
IV. DISCUSSION 236
Further inspection of Fig. 1 reveals a lack of any systematic differences between arc, rift and 237
hot-spot volcanoes at comparable temperature (notwithstanding limited overlap). This is in 238
stark contrast to the observed variation in the oxidation state of the corresponding lavas, and 239
inferred oxidation states of their mantle sources: arc volcanoes are associated with more 240
oxidised lavas sourced from more oxidised regions of the mantle than hotspot and rift 241
volcanoes (e.g., Carmichael, 1991; Frost and McCammon, 2008). We also find no relationship 242
between gas oxidation state and composition (mafic-intermediate-silicic) of the associated 243
magma. 244
245
11
For as long as they remain in the magma, in direct equilibrium with the melt, volcanic gases 246
will have an oxidation state at equilibrium with that melt (e.g., Moretti et al., 2003; Moretti and 247
Papale, 2004). Our observations, however, imply that, to first order, the oxidation state of 248
volcanic gases is mostly decoupled from that of the melts from which they originate. Further, 249
neither the oxidation state of the mantle source region nor the melts produced determines the 250
oxidation state of the associated volcanic gas emissions to the atmosphere. 251
252
The global relationship between gas temperature and oxygen fugacity (fO2) is shown in Fig. 253
4A. It appears that volcanic gases do not follow a rock redox buffer involving Fe as previously 254
suggested based on data from Kīlauea (Gerlach, 1993). Instead, the global temperature 255
dependence follows the empirical relation: 256
log(𝑓𝑂2) = −19100 (1
𝑇) + 4 (17) 257
(where T is the temperature in K). 258
We hypothesize that the underlying mechanism is closed-system cooling of the gas, a process 259
invoked from consideration of gas analyses made at Erebus and Kilauea volcanoes (Burgisser 260
et al., 2012; Oppenheimer et al., 2018). As magmatic gas ascends to the surface and expands it 261
cools unless heat is transferred rapidly enough from melt to gas. Accordingly, the gas mixture 262
will re-equilibrate so that its oxidation state is consistent with its internal temperature. The 263
magmatic gas no longer maintains chemical or thermal equilibrium with the surrounding melt. 264
265
Fig. 4A shows the computed oxidation state for closed-system (gas-only) cooling of three 266
representative gas mixtures, indicating a close fit to the observations. In order to assess how 267
much cooling of the volcanic gases has taken place between their escape from the melt and 268
their last retained equilibrium temperature we conducted a review of melt temperature 269
estimates from the literature. The dataset is presented in the supplementary information, Table 270
12
S4 and in Fig. 5. Where melt temperature was not reported, we estimated it from the melt 271
composition (e.g., 950°C for andesitic magmas). Fig. 5 shows a strong relationship between 272
the amount of cooling and re-equilibration a gas has undergone and its oxidation state. 273
274
The observed decoupling between the oxidation states of volcanic gases and their melts 275
undermines the underlying assumption of gas-melt equilibrium in previous estimates of the 276
oxidation state of volcanic gases emitted in Earth’s past or on other planets (e.g., Arculus and 277
Delano, 1980; Gaillard and Scaillet, 2014). It follows that variations in the oxidation state of 278
the Earth’s mantle through time need not influence the oxidation state of volcanic gases emitted 279
to the atmosphere. Similarly, our observations imply that changes in geodynamic environment 280
on a global scale, such as from hotspot-dominated to arc-dominated volcanism, will not affect 281
the oxidation state of the volcanic gases emitted. Surficial processes, such as eruption style 282
should, however, influence the equilibrium and emission temperature of volcanic gases. 283
Explosive activity should always be associated with the emission of gases at lower temperature 284
and hence more oxidized gases as more closed-system cooling and expansion of the gas would 285
have taken place than during passive degassing. This can be seen, for instance, when comparing 286
passive and explosive gas emissions from Erebus volcano (Fig. 1 A) (Oppenheimer et al., 2011; 287
Burgisser et al., 2012). 288
289
The dependence of volcanic gas oxidation state on emission temperature helps to reconcile an 290
old paradox. Earth’s atmosphere during the Archean was reduced (Bekker et al., 2004; Canfield 291
et al., 2000; Farquhar et al., 2007), and it has therefore been assumed that volcanic outgassing 292
was correspondingly more reduced (Holland, 2002; Kasting et al., 1993). Yet multiple lines of 293
evidence suggest that the Archean upper mantle and the melts it produced were as oxidised as 294
at present (e.g., Berry et al., 2008; Canil, 1997; Delano, 2001; Li and Lee, 2004) although this 295
13
conclusion has been disputed (e.g., Aulbach and Stagno, 2016; Nicklas et al., 2016)). 296
Considering that the Archean was characterised by the eruption of komatiitic lava flows erupted 297
at high temperatures of up to 1700°C (e.g., Huppert et al., 1984), the emission temperature of 298
volcanic gases should have been considerably higher than at present. Extrapolating the data 299
trend in Fig. 4 A and B, we suggest that volcanic gases emitted at ∼1600 °C should have 300
oxidation states between QFM–1 and QFM–2.5, even if the associated melt was more oxidized. 301
These estimates are about one log unit more reduced than the average value of the hottest and 302
most reduced gases emitted today, and at least two to three log units more reduced than the 303
average volcanic gas emitted on Earth today (about QFM+1). We also note that the composition 304
of these high-temperature gases should have been much richer in SO2, H2 and CO than today’s 305
volcanic emissions, e.g., SO2/H2S, H2O/H2 and CO2/CO molar ratios of about 200, 20 and 2.5 306
respectively at 1600°C, and 40, 120 and 60 at 1000°C (Fig. 6). The effect of these changes in 307
gas composition on the oxidation state of the atmosphere can then be considered using 308
Holland’s criterion (f, defined as the fraction of sulfur in the initial volatiles that is converted 309
to FeS2, (Holland, 2002)): 310
𝑓 =𝑚𝐻2+0.6𝑚𝐶𝑂−0.4𝑚𝐶𝑂2+3𝑚𝐻2𝑆
3.5(𝑚𝑆𝑂2+𝑚𝐻2𝑆)+
1
3.5 (18) 311
Where mi is the mole fraction of species i in the volcanic gas. If f exceeds 1 then the gas 312
contains sufficient H2 to reduce 20% of carbon gases to organic matter, and all sulfur to FeS2. 313
In other words, according to this criterion, a value of f > 1 corresponds to volcanic gases with 314
the capacity to limit the accumulation of O2 produced by oxygenic photosynthesis. Fig. 7 shows 315
the relationship between f and gas equilibrium temperature for four starting gas compositions 316
representing Erta ‘Ale, Bromo, Satsuma Iwojima and Sabancaya volcanoes. Depending on the 317
gas composition, the effect of emitting gases last equilibrated at 1400°C rather than 1000°C is 318
equivalent to a 40–170% increase in f. Given that volcanic gases at present have average f 319
values of 0.5 (Holland, 2002), f values of ~1 might have prevailed during the Archean. Similar 320
14
calculations for f based on the inferred gas composition for Mauna Kea (Brounce et al., 2017) 321
suggest that f > 1 would be attained for gas emitted at QFM−2.3, in broad agreement with our 322
calculations. 323
324
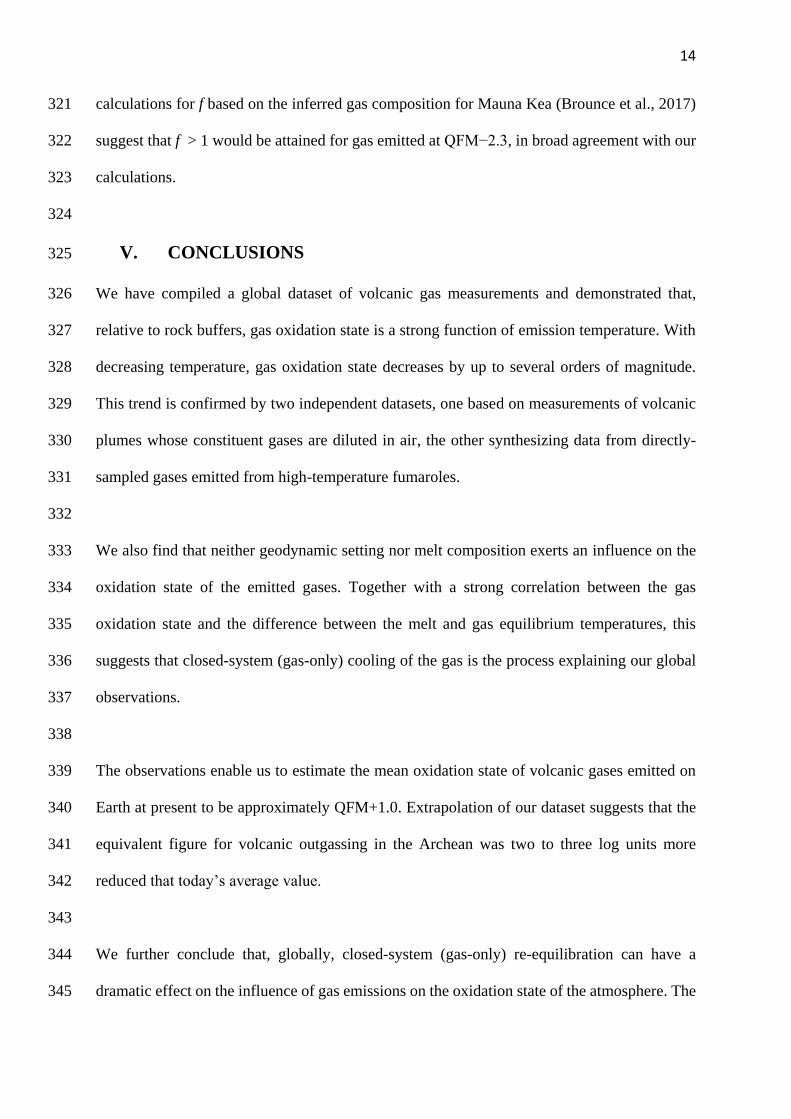
V. CONCLUSIONS 325
We have compiled a global dataset of volcanic gas measurements and demonstrated that, 326
relative to rock buffers, gas oxidation state is a strong function of emission temperature. With 327
decreasing temperature, gas oxidation state decreases by up to several orders of magnitude. 328
This trend is confirmed by two independent datasets, one based on measurements of volcanic 329
plumes whose constituent gases are diluted in air, the other synthesizing data from directly-330
sampled gases emitted from high-temperature fumaroles. 331
332
We also find that neither geodynamic setting nor melt composition exerts an influence on the 333
oxidation state of the emitted gases. Together with a strong correlation between the gas 334
oxidation state and the difference between the melt and gas equilibrium temperatures, this 335
suggests that closed-system (gas-only) cooling of the gas is the process explaining our global 336
observations. 337
338
The observations enable us to estimate the mean oxidation state of volcanic gases emitted on 339
Earth at present to be approximately QFM+1.0. Extrapolation of our dataset suggests that the 340
equivalent figure for volcanic outgassing in the Archean was two to three log units more 341
reduced that today’s average value. 342
343
We further conclude that, globally, closed-system (gas-only) re-equilibration can have a 344
dramatic effect on the influence of gas emissions on the oxidation state of the atmosphere. The 345
15
cessation of widespread komatiitic volcanism between 2.5 and 2.0 Ga ago (e.g., Dostal, 2008) 346
should therefore have been accompanied by a shift towards more oxidised volcanic gas 347
emissions to the atmosphere, affecting the oxygen abundance in the atmosphere and oceans. 348
This evolution coincides with the major change in the oxidation state of the atmosphere during 349
the Paleo-Proterozoic, i.e., the Great Oxidation Event, 2.4 to 2.2 Ga ago (e.g., Canfield, 2005). 350
We suggest that decline of komatiitic volcanism likely facilitated this transition to an oxygen-351
rich atmosphere, along with other proposed factors (Gaillard et al., 2011; Kump and Barley, 352
2007). Our results also show that relating volcanic gas redox states to their mantle source 353
cannot be made in any straightforward manner. Previous work has already shown that 354
decompression alone can significantly alter the redox signature of a magma relative to its 355
source (Moretti and Papale, 2004; Burgisser and Scaillet, 2007; Oppenheimer et al., 2011; 356
Gaillard and Scaillet, 2014; Moussallam et al., 2014, 2016). Our findings suggest further 357
complexity in this relationship by revealing a global relationship between gas emission 358
temperature and disequilibrium with respect to melt redox conditions. 359
16
FIGURES 360
361
17
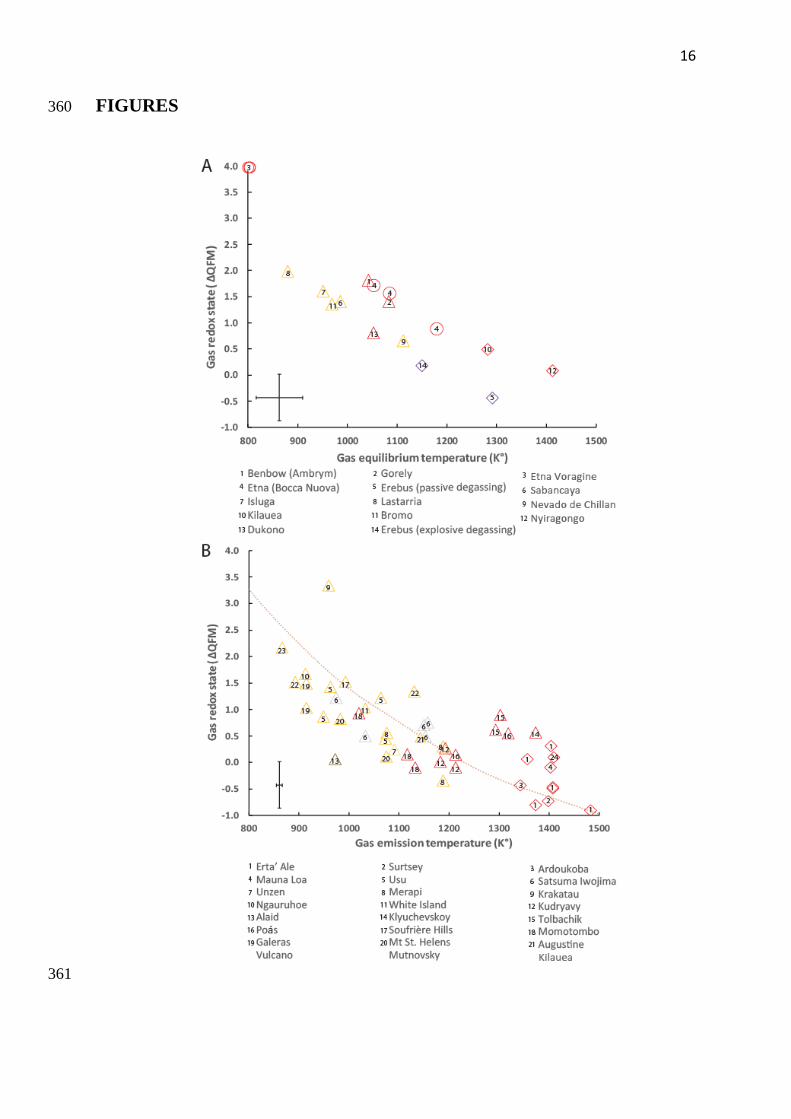
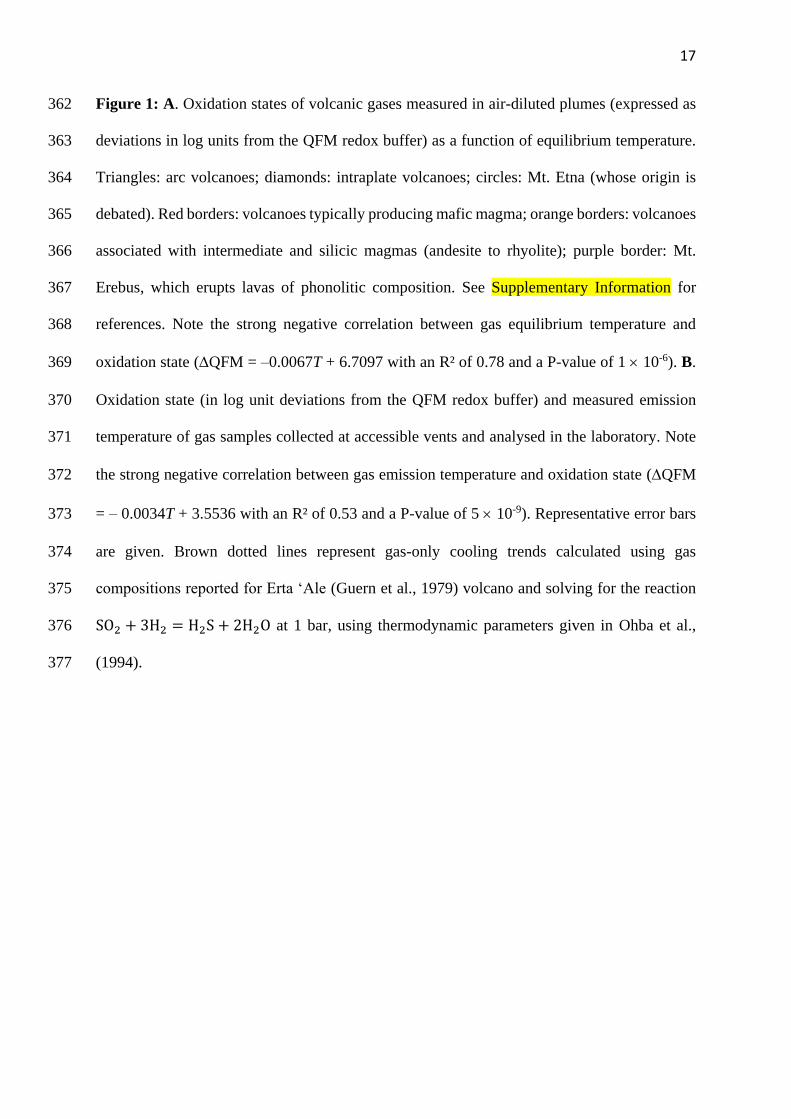
Figure 1: A. Oxidation states of volcanic gases measured in air-diluted plumes (expressed as 362
deviations in log units from the QFM redox buffer) as a function of equilibrium temperature. 363
Triangles: arc volcanoes; diamonds: intraplate volcanoes; circles: Mt. Etna (whose origin is 364
debated). Red borders: volcanoes typically producing mafic magma; orange borders: volcanoes 365
associated with intermediate and silicic magmas (andesite to rhyolite); purple border: Mt. 366
Erebus, which erupts lavas of phonolitic composition. See Supplementary Information for 367
references. Note the strong negative correlation between gas equilibrium temperature and 368
oxidation state (QFM = –0.0067T + 6.7097 with an R² of 0.78 and a P-value of 1 10-6). B. 369
Oxidation state (in log unit deviations from the QFM redox buffer) and measured emission 370
temperature of gas samples collected at accessible vents and analysed in the laboratory. Note 371
the strong negative correlation between gas emission temperature and oxidation state (QFM 372
= – 0.0034T + 3.5536 with an R² of 0.53 and a P-value of 5 10-9). Representative error bars 373
are given. Brown dotted lines represent gas-only cooling trends calculated using gas 374
compositions reported for Erta ‘Ale (Guern et al., 1979) volcano and solving for the reaction 375
SO2 + 3H2 = H2S + 2H2O at 1 bar, using thermodynamic parameters given in Ohba et al., 376
(1994). 377
18
378
Figure 2: Oxidation state of volcanic gases as a function of emission or equilibrium 379
temperature for all high-temperature volcanic gases in our dataset, grouped by instrumental 380
method used to measure the gas composition (symbol shape) and by calculation method 381
(symbol colour) used to calculate the oxidation state and where applicable the equilibrium 382
temperature. 383
19
384
385
Figure 3: Relative frequency distribution of the oxidation state of high-temperature volcanic 386
gases. The mean oxidation state of volcanic gases on Earth at present is about ∆QFM+1. 387
20
388
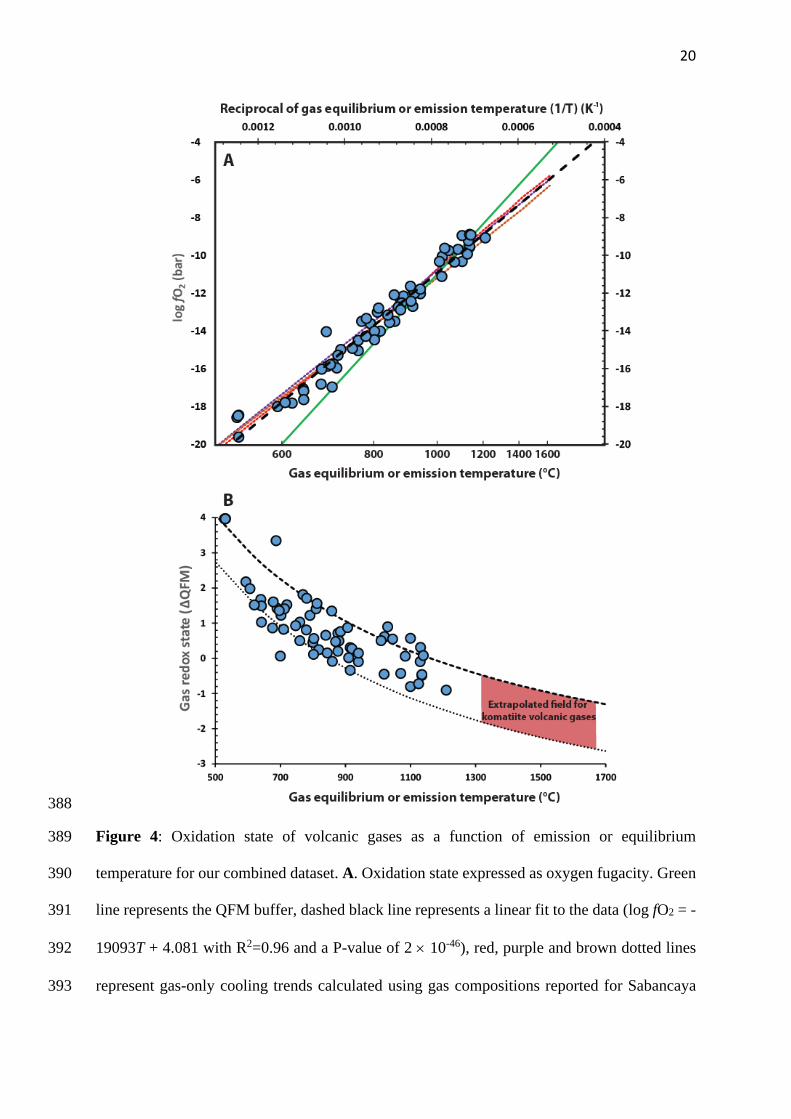
Figure 4: Oxidation state of volcanic gases as a function of emission or equilibrium 389
temperature for our combined dataset. A. Oxidation state expressed as oxygen fugacity. Green 390
line represents the QFM buffer, dashed black line represents a linear fit to the data (log fO2 = -391
19093T + 4.081 with R2=0.96 and a P-value of 2 10-46), red, purple and brown dotted lines 392
represent gas-only cooling trends calculated using gas compositions reported for Sabancaya 393
21
(Moussallam et al., 2017), Satsuma Iwojima (Goff and McMurtry, 2000) and Erta ‘Ale (Guern 394
et al., 1979) volcanoes, respectively and solving for the reaction SO2 + 3H2 = H2S + 2H2O at 395
1 bar, using thermodynamic parameters given in Ohba et al., (1994). Note the difference in 396
slope and intercept between the rock buffer and gas trend, and the close agreement between 397
global observations and closed-system cooling trends for three representative gas 398
compositions. B. Oxidation state expressed as deviation from the QFM buffer and temperature. 399
Dashed and dotted curves show the calculated relationship for a pure SO2-H2S gas mixture 400
with SO2/H2S ratio of 100 and 1, respectively. Trends are extrapolated to the higher 401
temperatures of komatiite lavas erupted during the Archean, suggesting even more reduced 402
conditions of the associated gas emissions to the atmosphere. Representative error bars are 403
given in Fig. 1. 404
22
405
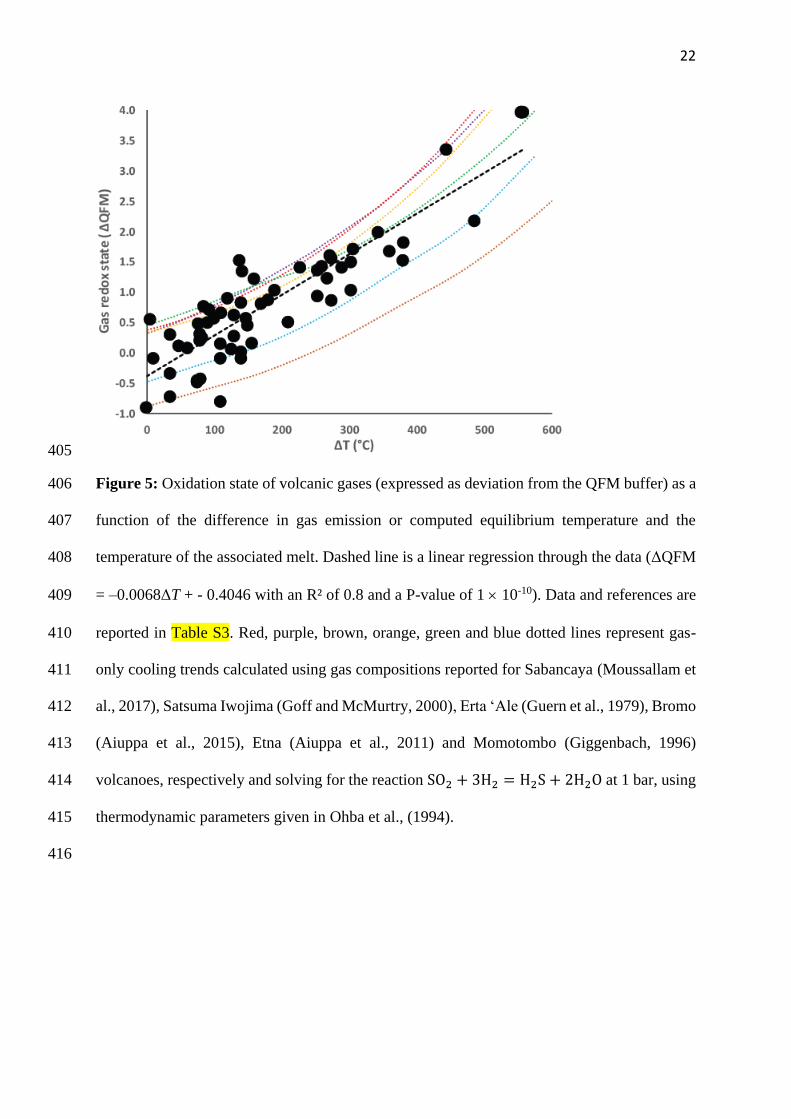
Figure 5: Oxidation state of volcanic gases (expressed as deviation from the QFM buffer) as a 406
function of the difference in gas emission or computed equilibrium temperature and the 407
temperature of the associated melt. Dashed line is a linear regression through the data (ΔQFM 408
= –0.0068ΔT + - 0.4046 with an R² of 0.8 and a P-value of 1 10-10). Data and references are 409
reported in Table S3. Red, purple, brown, orange, green and blue dotted lines represent gas-410
only cooling trends calculated using gas compositions reported for Sabancaya (Moussallam et 411
al., 2017), Satsuma Iwojima (Goff and McMurtry, 2000), Erta ‘Ale (Guern et al., 1979), Bromo 412
(Aiuppa et al., 2015), Etna (Aiuppa et al., 2011) and Momotombo (Giggenbach, 1996) 413
volcanoes, respectively and solving for the reaction SO2 + 3H2 = H2S + 2H2O at 1 bar, using 414
thermodynamic parameters given in Ohba et al., (1994). 415
416
23
417
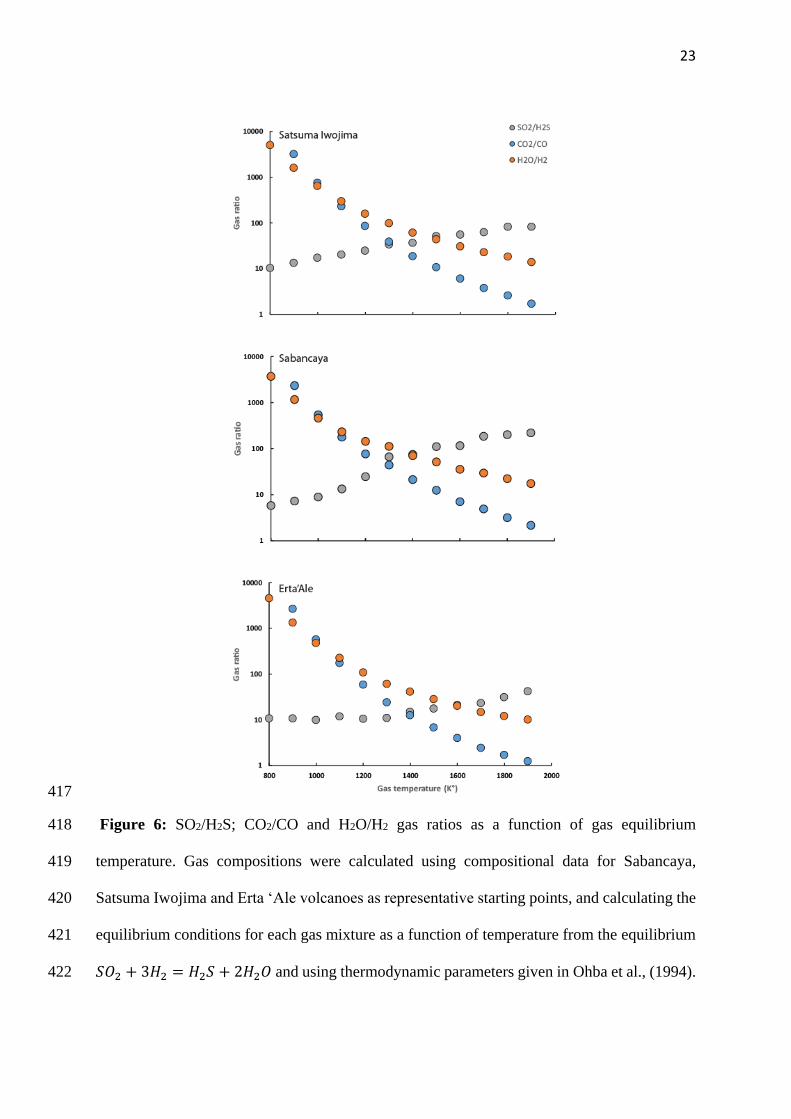
Figure 6: SO2/H2S; CO2/CO and H2O/H2 gas ratios as a function of gas equilibrium 418
temperature. Gas compositions were calculated using compositional data for Sabancaya, 419
Satsuma Iwojima and Erta ‘Ale volcanoes as representative starting points, and calculating the 420
equilibrium conditions for each gas mixture as a function of temperature from the equilibrium 421
𝑆𝑂2 + 3𝐻2 = 𝐻2𝑆 + 2𝐻2𝑂 and using thermodynamic parameters given in Ohba et al., (1994).422
24
423
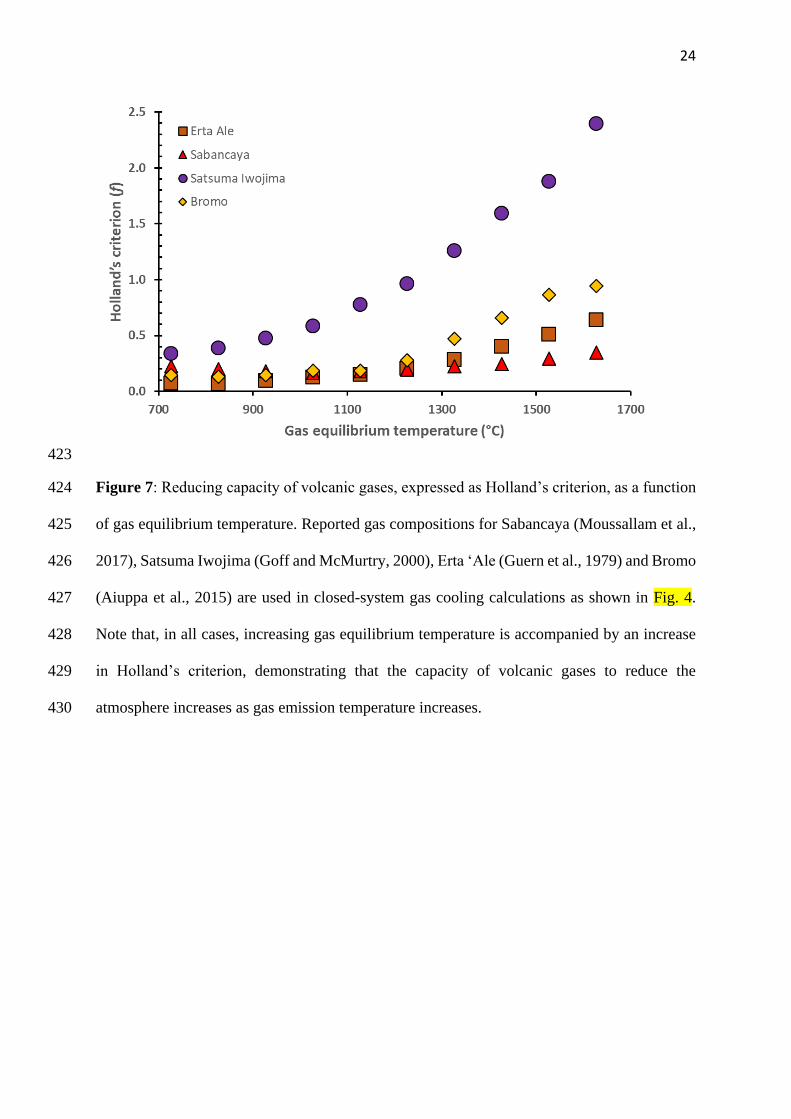
Figure 7: Reducing capacity of volcanic gases, expressed as Holland’s criterion, as a function 424
of gas equilibrium temperature. Reported gas compositions for Sabancaya (Moussallam et al., 425
2017), Satsuma Iwojima (Goff and McMurtry, 2000), Erta ‘Ale (Guern et al., 1979) and Bromo 426
(Aiuppa et al., 2015) are used in closed-system gas cooling calculations as shown in Fig. 4. 427
Note that, in all cases, increasing gas equilibrium temperature is accompanied by an increase 428
in Holland’s criterion, demonstrating that the capacity of volcanic gases to reduce the 429
atmosphere increases as gas emission temperature increases. 430
25
REFERENCES 431
Aiuppa, A., Bani, P., Moussallam, Y., Di Napoli, R., Allard, P., Gunawan, H., Hendrasto, M., 432
Tamburello, G., 2015. First determination of magma-derived gas emissions from 433
Bromo volcano, eastern Java (Indonesia). J. Volcanol. Geotherm. Res. 304, 206–213. 434
https://doi.org/10.1016/j.jvolgeores.2015.09.008 435
Aiuppa, A., Shinohara, H., Tamburello, G., Giudice, G., Liuzzo, M., Moretti, R., 2011. 436
Hydrogen in the gas plume of an open-vent volcano, Mount Etna, Italy. J. Geophys. 437
Res. 116, 8 PP. https://doi.org/201110.1029/2011JB008461 438
Arculus, R.J., Delano, J.W., 1980. Implications for the primitive atmosphere of the oxidation 439
state of Earth’s upper mantle. Nature 288, 72–74. https://doi.org/10.1038/288072a0 440
Aulbach, S., Stagno, V., 2016. Evidence for a reducing Archean ambient mantle and its effects 441
on the carbon cycle. Geology 44, 751–754. https://doi.org/10.1130/G38070.1 442
Bekker, A., Holland, H.D., Wang, P.-L., Rumble, D., Stein, H.J., Hannah, J.L., Coetzee, L.L., 443
Beukes, N.J., 2004. Dating the rise of atmospheric oxygen. Nature 427, 117–120. 444
https://doi.org/10.1038/nature02260 445
Berry, A.J., Danyushevsky, L.V., O’Neill, H.S.C., Newville, M., Sutton, S.R., 2008. Oxidation 446
state of iron in komatiitic melt inclusions indicates hot Archaean mantle. Nature 455, 447
960–963. https://doi.org/10.1038/nature07377 448
Brounce, M., Stolper, E., Eiler, J., 2017. Redox variations in Mauna Kea lavas, the oxygen 449
fugacity of the Hawaiian plume, and the role of volcanic gases in Earth’s oxygenation. 450
Proc. Natl. Acad. Sci. 114, 8997–9002. https://doi.org/10.1073/pnas.1619527114 451
Burgisser, A., Oppenheimer, C., Alletti, M., Kyle, P., Scaillet, B., Carroll, M., 2012. Backward 452
tracking of gas chemistry measurements at Erebus volcano. Geochem. Geophys. 453
Geosystems 13. 454
Burgisser, A., Scaillet, B., 2007. Redox evolution of a degassing magma rising to the surface. 455
Nature 445, 194–197. 456
Canfield, D.E., 2005. The early history of atmospheric oxygen: Homage to Robert M. Garrels. 457
Annu. Rev. Earth Planet. Sci. 33, 1–36. 458
https://doi.org/10.1146/annurev.earth.33.092203.122711 459
Canfield, D.E., Habicht, K.S., Thamdrup, B., 2000. The Archean Sulfur Cycle and the Early 460
History of Atmospheric Oxygen. Science 288, 658–661. 461
https://doi.org/10.1126/science.288.5466.658 462
Canil, D., 2002. Vanadium in peridotites, mantle redox and tectonic environments: Archean to 463
present. Earth Planet. Sci. Lett. 195, 75–90. https://doi.org/10.1016/S0012-464
821X(01)00582-9 465
Canil, D., 1997. Vanadium partitioning and the oxidation state of Archaean komatiite magmas. 466
Nature 389, 842–845. https://doi.org/10.1038/39860 467
Carmichael, I.S.., 1991. The redox states of basic and silicic magmas: a reflection of their 468
source regions? Contrib. Mineral. Petrol. 106, 129–141. 469
https://doi.org/10.1007/BF00306429 470
Carn, S.A., Fioletov, V.E., McLinden, C.A., Li, C., Krotkov, N.A., 2017. A decade of global 471
volcanic SO2 emissions measured from space. Sci. Rep. 7, 44095. 472
https://doi.org/10.1038/srep44095 473
Chase, M.W., National Institute of Standards and Technology (U.S.), 1998. NIST-JANAF 474
thermochemical tables. American Chemical Society ; American Institute of Physics for 475
the National Institute of Standards and Technology, Washington, D.C.]; Woodbury, 476
N.Y. 477
26
Chiodini, G., Marini, L., 1998. Hydrothermal gas equilibria: the H2O-H2-CO2-CO-CH4 478
system. Geochim. Cosmochim. Acta 62, 2673–2687. https://doi.org/10.1016/S0016-479
7037(98)00181-1 480
Delano, J.W., 2001. Redox history of the Earth’s interior since approximately 3900 Ma: 481
implications for prebiotic molecules. Orig. Life Evol. Biosphere J. Int. Soc. Study Orig. 482
Life 31, 311–341. 483
Dostal, J., 2008. Igneous Rock Associations 10. Komatiites. Geosci. Can. 35. 484
Elkins-Tanton, L.T., 2008. Linked magma ocean solidification and atmospheric growth for 485
Earth and Mars. Earth Planet. Sci. Lett. 271, 181–191. 486
https://doi.org/10.1016/j.epsl.2008.03.062 487
Farquhar, J., Peters, M., Johnston, D.T., Strauss, H., Masterson, A., Wiechert, U., Kaufman, 488
A.J., 2007. Isotopic evidence for Mesoarchaean anoxia and changing atmospheric 489
sulphur chemistry. Nature 449, 706–709. https://doi.org/10.1038/nature06202 490
Frost, B.R., 1991. Introduction to oxygen fugacity and its petrologic importance. Rev. Mineral. 491
Geochem. 25, 1–9. 492
Frost, D.J., McCammon, C.A., 2008. The Redox State of Earth’s Mantle. Annu. Rev. Earth 493
Planet. Sci. 36, 389–420. https://doi.org/10.1146/annurev.earth.36.031207.124322 494
Gaillard, F., Scaillet, B., 2014. A theoretical framework for volcanic degassing chemistry in a 495
comparative planetology perspective and implications for planetary atmospheres. Earth 496
Planet. Sci. Lett. 403, 307–316. https://doi.org/10.1016/j.epsl.2014.07.009 497
Gaillard, F., Scaillet, B., Arndt, N.T., 2011. Atmospheric oxygenation caused by a change in 498
volcanic degassing pressure. Nature 478, 229–232. 499
https://doi.org/10.1038/nature10460 500
Gerlach, T.M., 2004. Volcanic sources of tropospheric ozone-depleting trace gases. Geochem. 501
Geophys. Geosystems 5, n/a–n/a. https://doi.org/10.1029/2004GC000747 502
Gerlach, T.M., 1993. Oxygen buffering of Kilauea volcanic gases and the oxygen fugacity of 503
Kilauea basalt 795–814. 504
Giggenbach, W.., 1996. Chemical composition of volcanic gases. Scarpa R Tilling RI Eds 505
Monit. Mitig. Volcano Hazards 202–226. 506
Giggenbach, W.F., 1996. Chemical Composition of Volcanic Gases, in: Monitoring and 507
Mitigation of Volcano Hazards. Springer Berlin Heidelberg, pp. 221–256. 508
https://doi.org/10.1007/978-3-642-80087-0_7 509
Giggenbach, W.F., 1987. Redox processes governing the chemistry of fumarolic gas discharges 510
from White Island, New Zealand. Appl. Geochem. 2, 143–161. 511
https://doi.org/10.1016/0883-2927(87)90030-8 512
Giggenbach, W.F., 1980. Geothermal gas equilibria. Geochim. Cosmochim. Acta 44, 2021–513
2032. https://doi.org/10.1016/0016-7037(80)90200-8 514
Giggenbach, W.F., Tedesco, D., Sulistiyo, Y., Caprai, A., Cioni, R., Favara, R., Fischer, T.P., 515
Hirabayashi, J.-I., Korzhinsky, M., Martini, M., Menyailov, I., Shinohara, H., 2001. 516
Evaluation of results from the fourth and fifth IAVCEI field workshops on volcanic 517
gases, Vulcano island, Italy and Java, Indonesia. J. Volcanol. Geotherm. Res. 108, 157–518
172. https://doi.org/10.1016/S0377-0273(00)00283-3 519
Goff, F., McMurtry, G.M., 2000. Tritium and stable isotopes of magmatic waters. J. Volcanol. 520
Geotherm. Res. 97, 347–396. https://doi.org/10.1016/S0377-0273(99)00177-8 521
Guern, F.L., Carbonnelle, J., Tazieff, H., 1979. Erta’ale lava lake: heat and gas transfer to the 522
atmosphere. J. Volcanol. Geotherm. Res. 6, 27–48. https://doi.org/10.1016/0377-523
0273(79)90045-3 524
Halevy, I., Johnston, D.T., Schrag, D.P., 2010. Explaining the Structure of the Archean Mass-525
Independent Sulfur Isotope Record. Science 329, 204–207. 526
https://doi.org/10.1126/science.1190298 527
27
Hirschmann, M.M., Dasgupta, R., 2009. The H/C ratios of Earth’s near-surface and deep 528
reservoirs, and consequences for deep Earth volatile cycles. Chem. Geol., Volatiles and 529
Volatile-Bearing Melts in the Earth’s Interior 262, 4–16. 530
https://doi.org/10.1016/j.chemgeo.2009.02.008 531
Holland, H.., 2002. Volcanic gases, black smokers, and the great oxidation event. Geochim. 532
Cosmochim. Acta 66, 3811–3826. https://doi.org/10.1016/S0016-7037(02)00950-X 533
Huppert, H.E., Sparks, R.S.J., Turner, J.S., Arndt, N.T., 1984. Emplacement and cooling of 534
komatiite lavas. Nature 309, 19–22. https://doi.org/10.1038/309019a0 535
Kasting, J.., Eggler, D.., Raeburn, S.., 1993. Mantle Redox Evolution and the Oxidation State 536
of the Archean Atmosphere. J. Geol. 101, 245–257. 537
Kasting, J.F., 1993. Earth’s early atmosphere. Science 259, 920–926. 538
Kasting, J.F., and, Catling, D., 2003. Evolution of a Habitable Planet. Annu. Rev. Astron. 539
Astrophys. 41, 429–463. https://doi.org/10.1146/annurev.astro.41.071601.170049 540
Kump, L.R., Barley, M.E., 2007. Increased subaerial volcanism and the rise of atmospheric 541
oxygen 2.5 billion years ago. Nature 448, 1033–1036. 542
https://doi.org/10.1038/nature06058 543
Li, Z., Lee, C., 2004. The constancy of upper mantle fO2 through time inferred from V/Sc 544
ratios in basalts. Earth Planet. Sci. Lett. 228, 483–493. 545
https://doi.org/10.1016/j.epsl.2004.10.006 546
Martin, R.S., Mather, T.A., Pyle, D.M., 2006. High-temperature mixtures of magmatic and 547
atmospheric gases. Geochem. Geophys. Geosystems 7. 548
Martin, R.S., Roberts, T.J., Mather, T.A., Pyle, D.M., 2009. The implications of H2S and H2 549
kinetic stability in high-T mixtures of magmatic and atmospheric gases for the 550
production of oxidized trace species (e.g., BrO and NOx). Chem. Geol. 263, 143–150. 551
https://doi.org/16/j.chemgeo.2008.12.028 552
Moretti, R., Ottonello, G., 2005. Solubility and speciation of sulfur in silicate melts: The 553
Conjugated Toop-Samis-Flood-Grjotheim (CTSFG) model. Geochim. Cosmochim. 554
Acta 69, 801–823. https://doi.org/10.1016/j.gca.2004.09.006 555
Moretti, R., Papale, P., 2004. On the oxidation state and volatile behavior in multicomponent 556
gas-melt equilibria. Chem. Geol. 213, 265–280. 557
https://doi.org/10.1016/j.chemgeo.2004.08.048 558
Moretti, R., Papale, P., Ottonello, G., 2003. A model for the saturation of C-O-H-S fluids in 559
silicate melts. Geol. Soc. Lond. Spec. Publ. 213, 81–101. 560
https://doi.org/10.1144/GSL.SP.2003.213.01.06 561
Mori, T., Notsu, K., Tohjima, Y., Wakita, H., 1993. Remote detection of HCl and SO2 in 562
volcanic gas from Unzen volcano, Japan. Geophys. Res. Lett. 20, 1355–1358. 563
https://doi.org/10.1029/93GL01065 564
Moussallam, Y., Bani, P., Schipper, C.I., Cardona, C., Franco, L., Barnie, T., Amigo, Á., 565
Curtis, A., Peters, N., Aiuppa, A., Giudice, G., Oppenheimer, C., 2018. Unrest at the 566
Nevados de Chillán volcanic complex: a failed or yet to unfold magmatic eruption? 567
Volcanica 1, 19–32. https://doi.org/10.30909/vol.01.01.1932 568
Moussallam, Y., Edmonds, M., Scaillet, B., Peters, N., Gennaro, E., Sides, I., Oppenheimer, 569
C., 2016. The impact of degassing on the oxidation state of basaltic magmas: A case 570
study of Kīlauea volcano. Earth Planet. Sci. Lett. 450, 317–325. 571
https://doi.org/10.1016/j.epsl.2016.06.031 572
Moussallam, Y., Oppenheimer, C., Scaillet, B., Gaillard, F., Kyle, P., Peters, N., Hartley, M., 573
Berlo, K., Donovan, A., 2014. Tracking the changing oxidation state of Erebus 574
magmas, from mantle to surface, driven by magma ascent and degassing. Earth Planet. 575
Sci. Lett. 393, 200–209. https://doi.org/10.1016/j.epsl.2014.02.055 576
28
Moussallam, Y., Tamburello, G., Peters, N., Apaza, F., Schipper, C.I., Curtis, A., Aiuppa, A., 577
Masias, P., Boichu, M., Bauduin, S., Barnie, T., Bani, P., Giudice, G., Moussallam, M., 578
2017. Volcanic gas emissions and degassing dynamics at Ubinas and Sabancaya 579
volcanoes; implications for the volatile budget of the central volcanic zone. J. Volcanol. 580
Geotherm. Res. https://doi.org/10.1016/j.jvolgeores.2017.06.027 581
Nicklas, R.W., Puchtel, I.S., Ash, R.D., 2016. High-precision determination of the oxidation 582
state of komatiite lavas using vanadium liquid-mineral partitioning. Chem. Geol. 433, 583
36–45. https://doi.org/10.1016/j.chemgeo.2016.04.011 584
Ohba, T., Hirabayashi, J., Yoshida, M., 1994. Equilibrium temperature and redox state of 585
volcanic gas at Unzen volcano, Japan. J. Volcanol. Geotherm. Res. 60, 263–272. 586
https://doi.org/10.1016/0377-0273(94)90055-8 587
Oppenheimer, C., Moretti, R., Kyle, P.R., Eschenbacher, A., Lowenstern, J.B., Hervig, R.L., 588
Dunbar, N.W., 2011. Mantle to surface degassing of alkalic magmas at Erebus volcano, 589
Antarctica. Earth Planet. Sci. Lett. 306, 261–271. 590
https://doi.org/10.1016/j.epsl.2011.04.005 591
Oppenheimer, C., Scaillet, B., Woods, A., Sutton, A.J., Elias, T., Moussallam, Y., 2018. 592
Influence of eruptive style on volcanic gas emission chemistry and temperature. Nat. 593
Geosci. 1. https://doi.org/10.1038/s41561-018-0194-5 594
Ottonello, G., Moretti, R., Marini, L., Vetuschi Zuccolini, M., 2001. Oxidation state of iron in 595
silicate glasses and melts: a thermochemical model. Chem. Geol., 6th International 596
Silicate Melt Workshop 174, 157–179. https://doi.org/10.1016/S0009-2541(00)00314-597
4 598
Peters, N., Oppenheimer, C., Killingsworth, D.R., Frechette, J., Kyle, P., 2014. Correlation of 599
cycles in Lava Lake motion and degassing at Erebus Volcano, Antarctica. Geochem. 600
Geophys. Geosystems 15, 3244–3257. https://doi.org/10.1002/2014GC005399 601
Rollinson, H., Adetunji, J., Lenaz, D., Szilas, K., 2017. Archaean chromitites show constant 602
Fe3+/ΣFe in Earth’s asthenospheric mantle since 3.8Ga. Lithos 282, 316–325. 603
https://doi.org/10.1016/j.lithos.2017.03.020 604
Shinohara, H., 2013. Volatile flux from subduction zone volcanoes: Insights from a detailed 605
evaluation of the fluxes from volcanoes in Japan. J. Volcanol. Geotherm. Res. 268, 46–606
63. https://doi.org/10.1016/j.jvolgeores.2013.10.007 607
Shinohara, H., 2005. A new technique to estimate volcanic gas composition: plume 608
measurements with a portable multi-sensor system. J. Volcanol. Geotherm. Res. 143, 609
319–333. https://doi.org/16/j.jvolgeores.2004.12.004 610
Stull, D.R., Westrum, E.F., Sinke, G.C., 1969. The chemical thermodynamics of organic 611
compounds. J. Wiley. 612
Symonds, R.B., Gerlach, T.M., Reed, M.H., 2001. Magmatic gas scrubbing: implications for 613
volcano monitoring. J. Volcanol. Geotherm. Res. 108, 303–341. 614
https://doi.org/10.1016/S0377-0273(00)00292-4 615
Symonds, R.B., Rose, W.I., Bluth, G.J.S., Gerlach, T.M., 1994. Volcanic-gas studies; methods, 616
results, and applications. Rev. Mineral. Geochem. 30, 1–66. https://doi.org/<p></p> 617
ACKNOWLEDGEMENTS 618
Y.M. acknowledges support from the Leverhulme Trust. CO receives support from the NERC 619
Centre for Observation and Modelling of Earthquakes, Volcanoes and Tectonics and NERC 620

29
grant NE/N009312/1. We thank Dr. Roberto Moretti and anonymous referees for constructive 621
and beneficial comments on the original manuscript. 622
Related Documents