Delft University of Technology Initial High-Temperature Oxidation Behavior of Fe–Mn Binaries in Air The Kinetics and Mechanism of Oxidation Aghaeian, S.; Sloof, W. G.; Mol, J. M.C.; Böttger, A. J. DOI 10.1007/s11085-022-10115-5 Publication date 2022 Document Version Final published version Published in Oxidation of Metals Citation (APA) Aghaeian, S., Sloof, W. G., Mol, J. M. C., & Böttger, A. J. (2022). Initial High-Temperature Oxidation Behavior of Fe–Mn Binaries in Air: The Kinetics and Mechanism of Oxidation. Oxidation of Metals, 98(1-2), 217-237. https://doi.org/10.1007/s11085-022-10115-5 Important note To cite this publication, please use the final published version (if applicable). Please check the document version above. Copyright Other than for strictly personal use, it is not permitted to download, forward or distribute the text or part of it, without the consent of the author(s) and/or copyright holder(s), unless the work is under an open content license such as Creative Commons. Takedown policy Please contact us and provide details if you believe this document breaches copyrights. We will remove access to the work immediately and investigate your claim. This work is downloaded from Delft University of Technology. For technical reasons the number of authors shown on this cover page is limited to a maximum of 10.

Welcome message from author
This document is posted to help you gain knowledge. Please leave a comment to let me know what you think about it! Share it to your friends and learn new things together.
Transcript

Delft University of Technology
Initial High-Temperature Oxidation Behavior of Fe–Mn Binaries in AirThe Kinetics and Mechanism of OxidationAghaeian, S.; Sloof, W. G.; Mol, J. M.C.; Böttger, A. J.
DOI10.1007/s11085-022-10115-5Publication date2022Document VersionFinal published versionPublished inOxidation of Metals
Citation (APA)Aghaeian, S., Sloof, W. G., Mol, J. M. C., & Böttger, A. J. (2022). Initial High-Temperature OxidationBehavior of Fe–Mn Binaries in Air: The Kinetics and Mechanism of Oxidation. Oxidation of Metals, 98(1-2),217-237. https://doi.org/10.1007/s11085-022-10115-5
Important noteTo cite this publication, please use the final published version (if applicable).Please check the document version above.
CopyrightOther than for strictly personal use, it is not permitted to download, forward or distribute the text or part of it, without the consentof the author(s) and/or copyright holder(s), unless the work is under an open content license such as Creative Commons.
Takedown policyPlease contact us and provide details if you believe this document breaches copyrights.We will remove access to the work immediately and investigate your claim.
This work is downloaded from Delft University of Technology.For technical reasons the number of authors shown on this cover page is limited to a maximum of 10.

Vol.:(0123456789)
Oxidation of Metals (2022) 98:217–237https://doi.org/10.1007/s11085-022-10115-5
1 3
ORIGINAL PAPER
Initial High‑Temperature Oxidation Behavior of Fe–Mn Binaries in Air: The Kinetics and Mechanism of Oxidation
S. Aghaeian1 · W. G. Sloof1 · J. M. C. Mol1 · A. J. Böttger1
Received: 19 January 2022 / Revised: 24 March 2022 / Accepted: 12 May 2022 / Published online: 17 June 2022 © The Author(s) 2022
AbstractHigh-temperature oxidation of steels can be relatively fast when exposed to air. Con-sequently, elucidating the effect of different parameters on the oxidation mechanism and kinetics is challenging. In this study, short-time oxidation was investigated to determine the oxidation mechanism, the affecting parameters, and the linear-to-para-bolic growth transition of different Fe–Mn alloys in various oxygen partial pressures (10–30 kPa) and gas flow rates (26.6 and 53.3 sccm) in a temperature range of 950–1150 °C. Oxidation kinetics was investigated using a thermogravimetric analyzer (TGA) under controlled atmosphere. Linear oxide growth was observed within the first 20 minutes of oxidation. The linear rate constant was significantly increased by increasing the oxygen partial pressure or the flow rate of the oxidizing gas. The mor-phology of the oxide layer was determined by scanning electron microscopy (SEM). The crystal structure of the oxides formed was followed by in-situ X-ray diffraction (XRD), confirming that the growing layer consists of wustite mainly, which upon slow cooling to room temperature, transformed into magnetite. Energy-dispersive X-ray spectroscopy (EDS) showed that the atomic ratio of Fe+Mn to O was ~ 1.03:1 in the oxide scale, corresponding to Fe(Mn)O formation. Based on the characteriza-tion and a model for linear growth kinetics, it is concluded that the oxidation rate is controlled by the diffusion of oxidizing molecules through the gas layer to the sam-ple’s surface. The findings led to a better understanding of initial oxidation behavior and provided a pathway for improved insight into the high-temperature oxidation behavior for more complex alloys.
Keywords Oxidation · Mechanism · Kinetics · TGA · Gas phase diffusion
* S. Aghaeian [email protected]
Extended author information available on the last page of the article

218 Oxidation of Metals (2022) 98:217–237
1 3
Introduction
Oxidation at high temperatures is a critical topic in metallurgical processes such as steelmaking. The steel is often hot at various processing stages during produc-tion, and if oxygen is present, oxidation can start. For example during hot rolling the steel sheets are heated up for better formability. Consequently, fast oxidation is inevitable since the sheets are in contact with oxidizing gases such as air and water vapor at high temperatures (around 1000 °C).
This oxidation reaction can change the substrate alloy composition and affect some properties which depend on the alloying element content. Furthermore, the oxide scale’s characteristics such as thickness can vary depending on the oxida-tion condition. This would lead to different kinds of defects on the sheets’ sur-faces at further steps in production, such as coating. For example the presence of oxide scale at surface can reduce the wettability of liquid zinc [1], and decrease the adhesion between zinc coating and steel substrate. Therefore, understanding and predicting the initial oxidation stage at different conditions is essential.
The progress of oxidation of metals, is commonly measured through the mass change or scale thickness per unit surface area of the sample. There are two main regimes in mass change versus time plots: linear and parabolic [2]. Oxidation typ-ically begins with rapid linear growth of the oxide scale. Then, after reaching a specific scale thickness the oxide grows parabolically [3, 4].
At the beginning of oxidation the diffusion through the oxide layer is, in gen-eral, not the rate-limiting step because the species diffuse rapidly through the thin scale. Therefore, two other phenomena could control the process: (a) The surface reactions [5–9], and (b) the diffusion of the oxidizing molecules in the gas phase [9–12]. In both cases, the oxide growth is linear. In oxidation of iron, wüstite is the only oxide phase that can form within the linear regime [2]. As the oxide scale gets thicker, the diffusion of species in the metal phase becomes slower and limits the oxidation rate. This means that the other iron oxide phases, such as magnetite and hematite, start forming, [13–15].
The oxygen partial pressure of the atmosphere can significantly influence the reaction kinetics. Lashgari et al. [16, 17] showed that oxidation of Mn-steel alloys at low dew point (− 45 °C to +10 °C) and a temperature of 950 °C led to the formation of only manganese oxide (MnO). Oxidation for more than 4 hours in such conditions, followed a parabolic growth and was dependent on the diffusion of the species through the matrix. In such case, the concentration of manganese in the alloy affects the kinetics. Mayer and Smeltzer [18] exposed Fe-Mn alloys to carbon dioxide-carbon monoxide atmospheres with equilibrium oxygen par-tial pressures of between 8 × 10⁻¹⁵ and 8 × 10⁻¹¹ atm. for more than 10 hours. They also observed a parabolic growth based on the mass-gain data during the oxidation.
Wikström et al. [12] studied the effect of oxygen content and temperature on the initial high-temperature oxidation behavior of different steels. They showed that increasing the amount of oxygen in the furnace chamber resulted in higher linear growth-rate constants, while the effect of temperature was negligible.
219
1 3
Oxidation of Metals (2022) 98:217–237
Finally, they concluded that the oxidation at the initial stage is controlled by the mass transfer in the gas phase. However, they did not consider the effect of gas flow rate nor the dwell time of the gas on the metal’s surface. For low alloyed steels, Yin et al. [9] observed that at 800 °C, the oxidation rate is initially limited by the mass transfer in the gas phase. The effect of different parameters such as the oxidizing gas flow rate were considered, and the experiments were conducted at low oxygen partial pressures where only wüstite is stable to form within the oxide layer.
Extensive research has been carried out on high-temperature oxidation of steels during annealing where the oxygen partial pressure is low, and the exposure time is long. However, only a few studies have investigated the short-time high-temper-ature oxidation behavior of pure Fe-Mn binaries in gases with variable oxygen par-tial pressures. It has been done mostly on complex steels in air, making it difficult to separate the effect of different alloying elements and parameters such as oxygen partial pressure and gas flow rate. Therefore, the initial oxidation of pure binaries at different conditions is still not fully understood.
In this paper the initial high-temperature oxidation behavior of iron-manganese alloys is investigated. In particular, the effect of different parameters are separated and the rate-limiting steps and oxidation mechanism in the early oxidation stage are determined. The process starts with the diffusion of the oxidizing molecules to the alloy surface and ends with the reaction between species. The high-temperature oxi-dation experiments were conducted in a TGA (thermogravimetric analyzer) to obtain the mass gain data. Gas mixtures containing high amounts of oxygen with different flow rates were applied. The oxide layer’s morphology and composition was stud-ied using scanning electron microscopy (SEM), combined with X-ray microanalysis using energy-dispersive spectroscopy (EDS) and X-ray diffractometry (XRD).
Experimental Procedures
Samples and Preparation
Alloys with different concentrations of Mn as the main alloying element were pro-vided by ChemPur (Karlsruhe, Germany). Table 1 shows the chemical composition of the pure iron and alloys with 1, 3, and 5 percent manganese as obtained with inductive coupled plasma - optical emission spectrometry (ICP-OES). Samples
Table 1 Chemical composition of the alloys obtained with ICP-OES
Sample Elements (wt.%)
Mn Si Al C Cr
Pure Fe 0.0011 0.0002 0.0003 0.0055 0.0001Fe-1Mn 1.03 0.001 0.0012 0.0157 0.0026Fe-3Mn 2.845 0.0014 0.0002 0.0002 0.0002Fe-5Mn 5.32 0.002 0.0003 0.0031 0.011

220 Oxidation of Metals (2022) 98:217–237
1 3
were cut into pieces of 2 × 8 × 15 mm with a hole of 2.2 mm diameter by electric discharge machining (EDM). All the surfaces were ground using SiC emery paper and then cleaned ultrasonically in isopropanol. Finally, the specimens were dried with a flow of pure nitrogen and stored in airtight membrane boxes (Agar Scientific, G3319, Essex, UK).
Oxidation Process and Analyses
The experiments were carried out in a symmetrical thermogravimetric analyzer (TGA, Setaram TAG 16/18, Caluire, France) to get continuous mass-gain data. The specimen was hanging through its hole in the first furnace chamber. Additionally, there was a dummy sample of alumina in the second furnace to eliminate the buoy-ancy effect. The furnace chamber was a tube with 280 mm length and the diameter of 18 mm. To start, the TGA system was pumped to vacuum (< 50 Pa), then the gas lines, balance, and the furnace were flushed with pure nitrogen. The purity of nitrogen was 5N vol.%, and was filtered to remove any residual hydrocarbons, mois-ture and oxygen, with Accosorb (< 10 ppb H2O) and Oxysorb (< 5 ppb O2) filters (Messer Griesheim, Germany), respectively.
Next, the dual furnaces were heated up with a rate of 10 °C min−1 in pure nitro-gen again. 5 target temperatures were chosen between 950 and 1150 °C. After reach-ing the target temperature, the chamber’s atmosphere was switched to oxidizing by introducing an oxygen / nitrogen gas mixture. Different flow rates of 26.6 and 53.3 sccm (Standard Cubic Centimeters per Minute at standard condition of 0 °C and pressure of 1.01 bar) and oxygen partial pressures (10 to 30 kPa) were applied by changing the ratio between O2 and N2 gases, while the total chamber pressure was kept at 101 kPa (1 atm). After an exposure time of 20 minutes, the furnace tube was flushed with pure N2 and cooled down to room temperature with a rate of 10 °C min−1.
Figure 1 shows the temperature profile and the mass gain per unit area for an oxi-dation experiment in the TGA system. The mass gain data is assumed to correspond to the total weight of oxygen consumed by the metal to form the oxide scale, and is used to determine the thickness of the oxide scale.
Fig. 1 The mass gain data and temperature profile for oxidation of Fe-5Mn at 1000 °C at oxygen partial pressure of 20 kPa with a gas flow rate of 53.3 sccm

221
1 3
Oxidation of Metals (2022) 98:217–237
X-ray diffraction, on oxidized samples, was conducted to identify the oxide phases that were formed during the oxidation experiments. The XRD patterns were recorded with a D8 Advance diffractometer (Bruker, USA) in the Bragg-Brentano geometry using Cu Kα radiation and a Lynxeye position-sensitive detector. A 2θ region between 20 to 100 °C with a step size of 0.030 °C 2θ and a dwell time of 2 s was applied.
The surface and cross-section of the oxidized alloys were observed using a Helios UXe Dual Beam G4 PFIB SEM (Thermo fisher Scientific, USA). Energy Disper-sive Spectroscopy (EDS) was performed with a JSM-6500F (JEOL, Japan) oper-ated with an accelarating voltage of 15 kV and equipped with an UltraDry 30 mm2 detector (Thermo Fisher Scientific, USA) to determine the chemical composition of oxides qualitatively. To prepare the cross-section, the oxide surface was embedded in an epoxy resin (G2 epoxy resin, Gatan 601.07270, UK) and covered with a sili-con wafer. Then, the specimens were embedded in fast curing acrylic cold mounting resin (ClaroCit Kit, Struers, Denmark) -to protect the scale- and ground using SiC emery paper and then cleaned ultrasonically in isopropanol.
In-situ high-temperature XRD experiment was performed to follow the phases formed during oxidation upon heating and cooling. The sample for this experiment was a sheet of 7.2 × 8 mm and thickness of 1 mm. Then it was clamped in the Anton-Paar DHS1100 high-temperature stage and measured at the center position. The experiments were carried out using a D8 Discover diffractometer (Bruker, USA) using Cu Kα and Eiger-2 500k 2D-detector radiation. The 2θ region was chosen to be between 22 to 55° with a step size of 0.05° 2θ and a dwell time of 1 s. The oxi-dizing condition was the same as in the TGA. The alloy was heated up in nitrogen, and at the desired temperature the oxygen partial pressure of the chamber increased to 20 kPa for 20 minutes. Finally, the sample was cooled down in pure nitrogen. Scans were recorded at set temperatures: room temperature, 500, 900 and 1000 °C during heating as well as cooling.
Results
The alloys were oxidized in a TGA with a controlled atmosphere where the mass change was measured continuously. Figure 2 shows the mass gain per unit area ∆m/A (surface area was 3.32 cm2) as a function of time. The growth was mostly linear (R2 > 0.99 for all the lines) within the first 20 minutes of oxidation in 10 to 30 kPa oxygen with the gas linear flow rates of 26.6 and 53.3 sccm. The slope of the line in this linear part was measured to be the linear kinetic constant kl . The initial curve in the mass gain is related to switching the atmosphere from pure N2 to the mixture of N2 and O2. Therefore, the time zero for Fig. 2 is determined when the first signs of mass gain were observed. However, to get more precise linear rate constants, the initial part of the mass gain data was not considered. Furthermore, an increase in the gas linear flow rate or oxygen partial pressure increased the mass gain during oxidation. This means a higher linear rate constant which led to the tran-sition to parabolic growth in some cases.

222 Oxidation of Metals (2022) 98:217–237
1 3
The samples with 5 wt% Mn were oxidized in 20 kPa oxygen with a gas linear flow rate of 53.3 sccm at different temperatures (between 950 and 1150 °C) to determine the activation energy. Figure 3 shows the logarithm of the measured linear rate constant versus the reciprocal of the absolute temperature, approxi-mated by a straight line. The activation energy of 2 kJ mol−1 ± 1 kJ mol−1 was obtained, which is a typical value for an oxidation process controlled by the gas phase diffusion [12].
To study the effect of the alloy composition on the oxidation kinetics, pure iron, and samples with 1, 3, and 5 %wt Mn were used. The specimens were oxi-dized at 1000 °C for 20 minutes in 20 kPa oxygen with the gas linear flow rate of 53.3 sccm. The linear rate constants were measured 2.75 × 10⁻⁵, 2.73 × 10⁻⁵, 2.73 × 10⁻⁵, and 2.72 × 10⁻⁵ ± 0.1 g cm−2 s−1, respectively for pure iron and alloys with 1, 3, and 5 wt% of Mn. Therefore, the effect of the alloy composition was found to be negligible.
The oxidized samples were analyzed with XRD and SEM. The XRD patterns obtained at room temperature after the TGA experiments, showed the presence of all iron oxide phases (wüstite, magnetite, and hematite), with magnetite as the
Fig. 2 The mass gain data for 20 minutes of oxidation of Fe-5Mn binary alloys at 1000 °C in 10 to 30 kPa oxygen with the total gas linear flow rate of a 53.3 sccm and b 26.6 sccm
Fig. 3 Dependence of the linear rate constant on the tempera-ture for oxidation of Fe-5Mn in 20 kPa at constant gas linear flow rate of 53.3 sccm. The calculated activation energy is approximately 2 kJ mol−1 ± 1 kJ mol−1
223
1 3
Oxidation of Metals (2022) 98:217–237
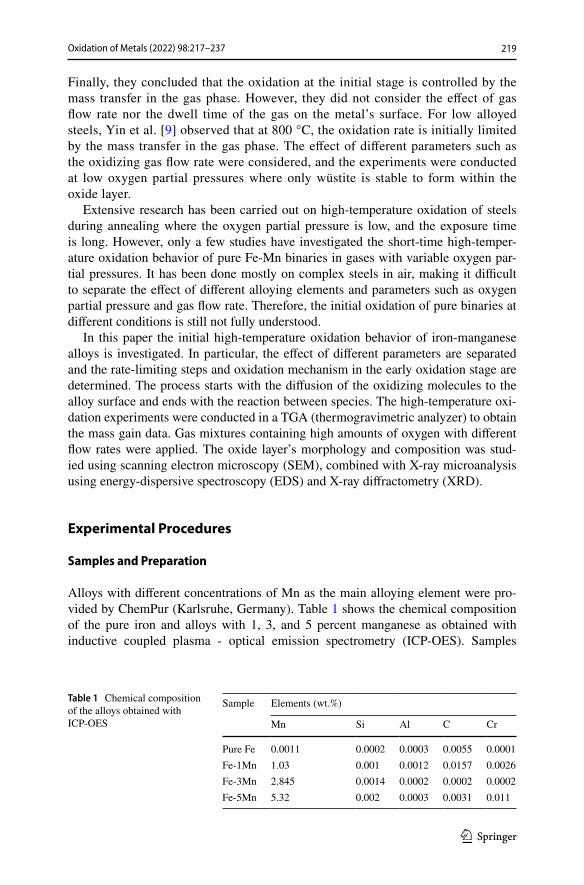
main oxide phase present. Moreover, most of the oxidized samples showed a non-uniform surface, varying from the top to the bottom. This is related to the laminar boundary layer’s width formed on the surface of the sample which causes differ-ent roughnesses on the sample and is discussed in more details in Sect. 4 (see Fig. 4).
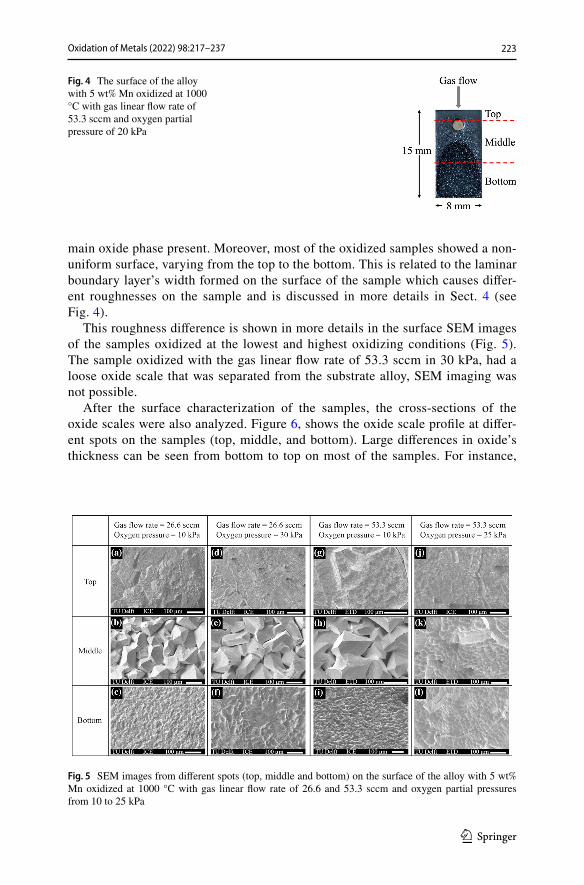
This roughness difference is shown in more details in the surface SEM images of the samples oxidized at the lowest and highest oxidizing conditions (Fig. 5). The sample oxidized with the gas linear flow rate of 53.3 sccm in 30 kPa, had a loose oxide scale that was separated from the substrate alloy, SEM imaging was not possible.
After the surface characterization of the samples, the cross-sections of the oxide scales were also analyzed. Figure 6, shows the oxide scale profile at differ-ent spots on the samples (top, middle, and bottom). Large differences in oxide’s thickness can be seen from bottom to top on most of the samples. For instance,
Fig. 4 The surface of the alloy with 5 wt% Mn oxidized at 1000 °C with gas linear flow rate of 53.3 sccm and oxygen partial pressure of 20 kPa
Fig. 5 SEM images from different spots (top, middle and bottom) on the surface of the alloy with 5 wt% Mn oxidized at 1000 °C with gas linear flow rate of 26.6 and 53.3 sccm and oxygen partial pressures from 10 to 25 kPa

224 Oxidation of Metals (2022) 98:217–237
1 3
the average oxide thickness ratio for the alloy shown in Fig. 6a, b, and c was 10.6 : 2.4 : 1, for top to middle to bottom.
Figure 7 is a phase diagram, obtained by using Factsage software [19], showing the thermodynamically stable phases possible to form in the current work’s exper-imental condition. The thermodynamic data corresponds to oxidation at 1000 °C. All in all, the phase diagram shows that all the oxide phases are thermodynamically
Fig. 6 Cross-section SEM images from the different spots (top, middle and bottom) of the alloy with 5 wt% manganese oxidized at 1000 °C with gas linear flow rate of 26.6 and 53.3 sccm and oxygen partial pressures from 10 to 30 kPa
Fig. 7 Stability regions of different iron and manganese oxide phases as a function of Mn mole fraction and oxygen partial pressure at 1000 °C, obtained by using Factsage software [19]. The red marks show the experimental condition of this work

225
1 3
Oxidation of Metals (2022) 98:217–237
stable in the experimental conditions applied in this work. In addition, it shows that FeO and MnO are the most stable ones, and are the first ones to form. It means that these two oxide phases are at the metal / oxide interface. Additionally, it shows that FeO and MnO are entirely miscible and could form a continuous solid solution with the rock salt cubic structure.
An in-situ XRD experiment was conducted to identify the oxide phases forming at each stage of the oxidation. Figure 8 shows the XRD patterns at different times and temperatures. At room temperature, only ferrite was observed. Then, the sam-ple was heated in nitrogen with only small amounts of impurities such as oxygen. Accordingly, at 500 °C, there were traces of oxide phases. At 900 °C during heat-ing, the ferrite to austenite transformation occurred and diffraction peaks of wüstite were detected. Then, at 1000 °C, the metal substrate was entirely austenite, and no peaks for magnetite and hematite could be observed. After 20 minutes of oxidation, when cooling down in nitrogen, the XRD pattern at 900 °C showed wüstite still as the only oxide phase. It also showed the austenite to ferrite transformation in the substrate. Since wüstite is not thermodynamically stable below 570 °C, by reaching
Fig. 8 In-situ XRD results for the alloy with 5 wt% Mn during heating from room temperature to,500,900,1000 °C and during cooling at 900 °C, 500 °C, and room temperature. Oxidation occurs at 1000 °C for 20 min-utes in presence of a gas mixture including oxygen and nitrogen with partial pressures of 20 kPa and 80 kPa, respectively
226 Oxidation of Metals (2022) 98:217–237
1 3
500 °C, the pattern showed the partial transformation of wüstite into magnetite and ferrite. Finally, at room temperature, the oxide scale consisted mainly of magnetite, and only little peaks of wüstite were seen.
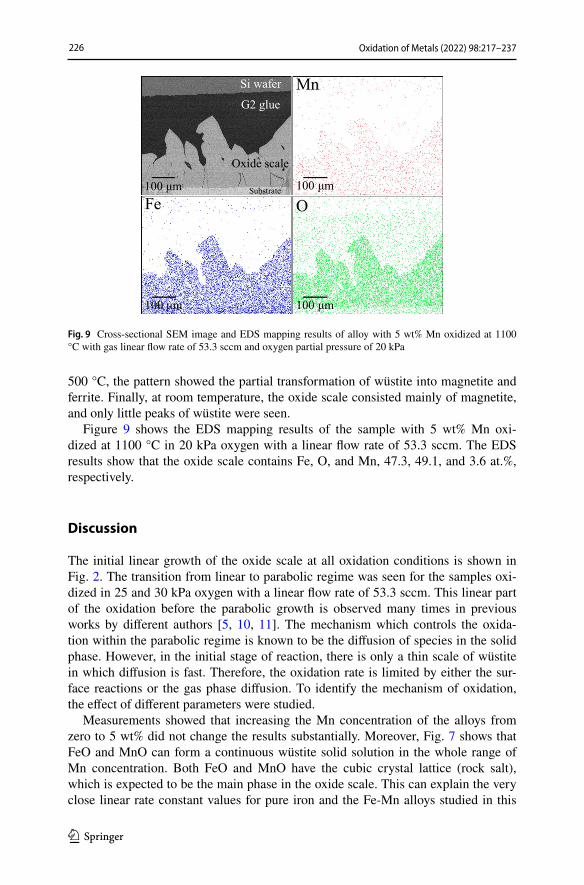
Figure 9 shows the EDS mapping results of the sample with 5 wt% Mn oxi-dized at 1100 °C in 20 kPa oxygen with a linear flow rate of 53.3 sccm. The EDS results show that the oxide scale contains Fe, O, and Mn, 47.3, 49.1, and 3.6 at.%, respectively.
Discussion
The initial linear growth of the oxide scale at all oxidation conditions is shown in Fig. 2. The transition from linear to parabolic regime was seen for the samples oxi-dized in 25 and 30 kPa oxygen with a linear flow rate of 53.3 sccm. This linear part of the oxidation before the parabolic growth is observed many times in previous works by different authors [5, 10, 11]. The mechanism which controls the oxida-tion within the parabolic regime is known to be the diffusion of species in the solid phase. However, in the initial stage of reaction, there is only a thin scale of wüstite in which diffusion is fast. Therefore, the oxidation rate is limited by either the sur-face reactions or the gas phase diffusion. To identify the mechanism of oxidation, the effect of different parameters were studied.
Measurements showed that increasing the Mn concentration of the alloys from zero to 5 wt% did not change the results substantially. Moreover, Fig. 7 shows that FeO and MnO can form a continuous wüstite solid solution in the whole range of Mn concentration. Both FeO and MnO have the cubic crystal lattice (rock salt), which is expected to be the main phase in the oxide scale. This can explain the very close linear rate constant values for pure iron and the Fe-Mn alloys studied in this
Fig. 9 Cross-sectional SEM image and EDS mapping results of alloy with 5 wt% Mn oxidized at 1100 °C with gas linear flow rate of 53.3 sccm and oxygen partial pressure of 20 kPa

227
1 3
Oxidation of Metals (2022) 98:217–237
work. It is shown in [20] that increasing the amount of oxygen in the chamber causes the Fe/Mn ratio in the oxide layer to increase. Hence, this explains the negligible effect of Mn concentration on oxidation of alloys at high oxygen partial pressures and is in agreement with previous findings in the literature [21, 22].
The oxidation kinetics was also unaffected by the temperatures applied in this work (between 950 and 1150 °C) (Fig. 3). An activation energy of around 2 kJ mol−1 was measured, which is comparable to values found in literature [5, 10–12]. When the oxide growth follows a linear regime, a low activation energy (between zero and 20 kJ) indicates that gas phase diffusion is the rate-controlling step. But, when surface reactions control the oxidation, the activation energy is found to be larger than 80 kJ [9, 23]. Furthermore, higher activation energies (> 140 kJ) relate to solid-phase diffusion control [24]. Accordingly, the low temperature-sensitivity of the activation energy supports the idea of an oxidation process controlled by the gaseous mass transfer.
All in all, the amount of oxygen in contact with the sample’s surface was the most influential parameter on the oxidation kinetics. That can be controlled by changing the oxygen partial pressure and/or the oxidizing gas linear flow rate in the chamber. Increasing any of those parameters led to an increase in the linear rate constant. If the oxidation process was limited by the diffusion rate of the species within the solid or if the reaction rate between iron/manganese and oxygen was slow, neither oxy-gen partial pressure of the bulk gas nor the gas linear flow rate could play a role in the kinetics. This also points to oxygen diffusion through the gas layer as the rate controlling step. The same pattern was seen in the literature on linear growth of the oxide layer for low-carbon steels when gas diffusion was the controlling step during oxidation [4, 11].
The roughness of the oxide scale reflects the mechanism of oxidation [5, 10]. Fig-ure 5 shows the SEM images taken from different spots on the surface of samples oxidized at different conditions. It can be seen in the images from the top part of the samples (Fig. 5a, d, g, and j) that the surface is more smooth compared to the other ones. Whereas, in the first three images from the middle part, massive grains are observed and the surfaces are extremely rough; see Fig. 5(b, e, and h). The first three images from the bottom part (Fig. 5c, d, and i) also show rough surfaces but not as rough as those from the middle. Furthermore, Figure 6 shows the SEM images on the cross-sections of the samples on different spots from top to the bottom. It can be seen that for all the oxidizing conditions, the oxide scale on top is between 7 to 10 times thicker compared to it on the bottom, and the oxide on the middle is between 1.5 to 3 times thicker than on the bottom. Therefore, it can be concluded that the rough surface pertains to a thinner oxide scale and the smooth surface to the thicker scales.
During the first 20 minutes of oxidation, when the oxide scale is following a lin-ear growth regime (see Fig. 2), the amount of oxygen consumed by the alloy is con-stant during time. It means that the oxidation rate is independent of the thickness of the oxide scale. Local thickness variations are related to the grain orientations, which leads to a rough surface. Furthermore, when there is a laminar flow over a flat surface, a boundary layer forms which has a width of almost zero at the leading edge and it is wider at the trailing edge [4]. So, diffusion of gas through this layer is

228 Oxidation of Metals (2022) 98:217–237
1 3
easier at the leading edge. Therefore, different thicknesses and roughnesses on dif-ferent spots (top, middle, bottom) of the oxidized samples are related to the width of the laminar boundary layer formed across the surface of the sample, when gaseous diffusion is the controlling step. Also after the set time of 20 minutes of oxidation, it took some time for the chamber’s atmosphere to switch back to pure nitrogen. This caused further oxidation. Figure 10 shows the mass gain data and indicates when the gas atmosphere was switched from inert to oxidizing and vice versa .
Moreover, the samples which were oxidized in 25 and 30 kPa oxygen with a linear flow rate of 53.3 sccm, showed parabolic growth during the last minutes of oxidation (Fig. 2). It can be seen in the SEM images of the surface (Fig. 5k and l) that the oxide scale is not as rough as in the other images. This is also an indica-tor of parabolic growth of the oxide scale. Additionally, in the images of the cross-section of the same sample it can be seen that the oxide thickness on the bottom is almost equal to that at middle part (see Fig. 6k and l). This is due to the parabolic growth of the oxide layer on this sample which was seen in the mass-gain data. So, SEM images from the surface and the cross-section showed a thick and smooth scale which indicates the parabolic growth regime and solid-phase diffusion mechanism.
However, the kinetic data from the first 20 minutes of oxidation shows that the gas phase diffusion controls the oxide scale growth. High-temperature in-situ XRD measurement (See Fig. 8) showed wüstite as the only oxide phase present at 1000 °C during oxidation. The formation of magnetite only occurred during cooling down and at temperatures where wüstite is not thermodynamically stable. Moreover, the EDS analysis showed that the atomic ratio of Fe + Mn to O within the oxide layer was around 1.03 : 1, corresponding to Fe(Mn)O formation (see
Fig. 10 The total mass gain data for oxidation of Fe-5Mn binary alloy at 1000 °C in presence of 10 kPa oxygen partial pressure with a gas linear flow rate of 26.6 sccm. The vertical dotted lines show the 20 minutes of isothermal oxidation, and indicate when the gas atmosphere is switched from inert to oxidiz-ing and vice versa
229
1 3
Oxidation of Metals (2022) 98:217–237
Fig. 9). The weight fraction of Mn within the oxide layer was almost the same as it in the substrate alloy (around 5 wt%).
All in all, wüstite was the main oxide phase present in the oxide scale dur-ing the first 20 minutes of oxidation. Moreover, based on the previously shown results, it is concluded that the gas-phase diffusion is the controlling mechanism. Also the gas-phase diffusion is considered for the model in the work by Abulu-wefa [11]. Next, the kinetic constants measured in this work were compared with the ones calculated via this model. If the gaseous mass transfer limits the oxida-tion rate, then the linear rate constant kl (g cm−2 s−1) can be calculated through Eq. 1.
MO is the molar mass of atomic oxygen (g/g-mol). CGO2
and C∗O2
are the molar con-centrations of oxygen in the gas mixture at the bulk of the gas and at the sample’s surface, respectively. kMTC is the mass transfer coefficient (cm s−1) and can be obtained from Eq. 2, which is the convective mass-diffusion equation across a lami-nar boundary layer to a flat surface with a known bulk gas velocity [25].
Re and Sc are the Reynolds number (ul∕�) and Schmidt number (�∕DN2−O2) ,
respectively. u is the velocity of the gas mixture above the sample’s surface (cm s−1), l is the sample’s length (cm), and � is the kinematic viscosity of the gas (g cm−1 s−1). DN2−O2
is the diffusion coefficient in the binary gas layer (cm2 s−1), and can be calculated via the Chapman-Enskog formulation of the kinetic theory of gases [26].
T is the temperature (K), p is the pressure (atm.), MN2 and MO2
are the molecular weights of nitrogen and oxygen (g mol−1). �N2−O2
is the average collision diameter (in Å) in the N2–O2 gas mixture, and can be estimated by the average of individual collision diameters of oxygen and nitrogen ( �N2
and �O2 ). ΩN2−O2
is the collisional integral for diffusion, which is dimensionless and a function of a dimensionless tem-perature parameter kT
�N2−O2
, where k is the Boltzmann constant, and �N2−O2 is the inter-
action energy between oxygen and nitrogen molecules. �N2 , �O2
, �N2∕k and �O2
∕k are the Lennard-Jones parameters. These parameters as well as the collisional integral for diffusion for oxygen and nitrogen are obtained from [27].
In order to calculate the kinematic viscosities (given by � = �∕� , where � is abso-lute viscosity and � is density), the absolute viscosities ( � ) for the two gases have to be calculated [26].
(1)kl = MOkMTC
(
CGO2
− C∗O2
)
(2)kMTC =4
3
DN2−O2
l(Re)
1
2 (Sc)1
3
(3)DN2−O2=
1.858 × 10⁻³√
T3 (1∕MN2+ 1∕MO2
)
p �2N2−O2
ΩN2−O2
230 Oxidation of Metals (2022) 98:217–237
1 3
M is the molecular weight of the species. In order to calculate the viscosity for a mixture of gases, the method given by [26] is used.
XN2 and XO2
are the mole fractions of nitrogen and oxygen in the gas mixture, �N2
and �N2 are the absolute viscosities of each gas at the system temperature and pres-
sure. The densities of each gas and the binary mixture of gases at the different tem-peratures were calculated (see Table 3). Therefore, the dimensionless Reynolds and Schmidt numbers are calculated as required for having the mass transfer coefficient kMTC.
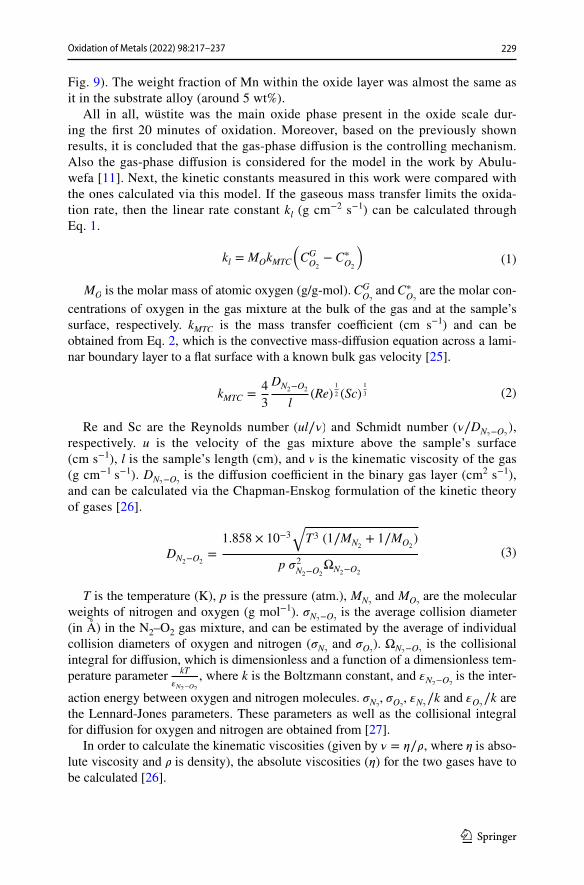
Finally, the linear rate constants calculated using Eqs.1–5 were compared with the ones measured in the experiments. The calculated values were not sensitive to small changes of a few percents in the parameters. The discrepancy between the model and the experiments can be due to the assumption that all the oxygen mole-cules diffused to the alloy’s surface are consumed. In other words, the sticking prob-ability was neglected in the model. By considering sticking probabilities of 0.3 for oxidation with gas linear flow rate of 26.6 sccm, and 0.4 for 53.3 sccm, the discrep-ancy between the model and the experiments was below 6 percents, for both the low and high flow rates (See Fig. 11). These sticking probabilities are very close to the values found previously in the literature [28].
Based on all the data and calculations, it was concluded that gas-phase mass transfer is the controlling step in the high-temperature oxidation of iron-manga-nese alloys within the mentioned experimental condition. It means that species
(4)� =2.669 × 10⁻⁵
√
MT
�2Ω
(5)�N2−O2=
XN2M
1∕2
N2�N2
+ XO2M
1∕2
O2�O2
XN2M
1∕2
N2+ XO2
M1∕2
O2
Fig. 11 Comparison between measured and calculated linear rate constants for oxidation at 1000 °C with considering the sticking probabilities of 0.3 and 0.4, respectively for low and high linear flow rates

231
1 3
Oxidation of Metals (2022) 98:217–237
diffusion through the oxide scale was fast enough and is not controlling the oxida-tion rate. Knowing the diffusion coefficient of iron cations in the oxide scale [29] (which is fully wüstite; see Fig. 8), the total flux of iron species to the scale-gas interface can be calculated. So, it can be confirmed via calculations that the diffu-sion within the oxide scale has been quick enough and it was not the controlling step.
In the short-time oxidation experiments done in this work, the growth of the oxide layer was linear, which means that the amount of iron cations needed at the surface to form a new layer of oxide is constant during the time. Using Eq. 6, the total mass gain caused by oxygen entering the oxide layer from the gas environ-ment can be calculated.
where Δm is the oxygen mass-gain (g), A is the oxidized area of the sample (cm2), and t is the time (s). Having the linear rate constant from the experiments, the mass of oxygen per unit area per second can be calculated and translated to the number of moles of oxygen. Assuming wüstite (FeO) as the only oxide phase present in the oxide scale, the number of moles of oxygen and wüstite would be equal. Therefore, the average thickness of the oxide scale as a function of time can be calculated from the experimental data.
Then, the flux of iron that can diffuse through the growing oxide layer at each time step and unit area is calculated. Since the thickness of the oxide layer is growing over time, it is expected to see a decreasing flux of iron diffused through the oxide layer, which in the end leads to parabolic growth. A coupled linear-par-abolic kinetic model was implemented to find the flux of iron that is diffused from the substrate to the scale-gas interface. Then the incorporation rate of oxygen can be related to the outward flux of iron ions [3].
where 𝛿 is the average iron deficiency in the wüstite scale ( Fe1−𝛿O ), moreover, the outward flux of iron can be calculated as followed.
where �∗ and �Fe∕FeO are the iron deficiency at the scale-gas and the scale-alloy inter-face, respectively. D is the diffusion coefficient of iron in the wüstite scale and is assumed to be only a function of temperature [29]. x and V are the thickness and the molar volume of the oxide scale, respectively. Due to the high oxygen partial pressure, based on the phase diagram, it is expected that a thin layer of magnetite is formed on top of wüstite (Fig. 7). Then local thermodynamic equilibrium is estab-lished at the magnetite-wüstite interface, and �∗ can be taken as the iron deficiency of wüstite at that interface ( �FeO∕Fe3O4 ). Moreover, the equilibrium iron deficiency of wüstite ( � ) is a function of oxygen partial pressure [30].
(6)Δm
A= kl × t
(7)JO =JFe
1 − 𝛿
(8)JFe =D�Fe∕FeO
xV
(
�∗
�Fe∕FeO− 1
)

232 Oxidation of Metals (2022) 98:217–237
1 3
where B and M are temperature-dependent constants that were experimentally eval-uated for the temperature range of 700 to 1300 °C [30].
and
Then the iron deficiency of wüstite at both wüstite-alloy and wüstite-magnetite interfaces can be obtained simply by putting equilibrium oxygen partial pressures at wüstite-alloy and wüstite-magnetite interfaces in Eq. 9. Therefore, assuming that all the iron species diffused through the oxide layer would immediately react with the oxygen at the surface, the oxide layer thickness as a function of time can be calcu-lated assuming that solid-phase diffusion is the rate-controlling step.
Figure 12 shows both the linear and parabolic growth regimes. At each moment, the slower one would be controlling the oxidation rate. In Fig. 12a, for 30 kPa oxy-gen partial pressure the transition time from linear to parabolic occurred after around 10 minutes in the experiment in agreement with the calculated transition time. On the other hand, for 15 kPa oxygen partial pressure Fig. 12b, the transition time is beyond the 20 minutes of oxidation. Gas-phase diffusion is slower and controls the oxidation. It shows that the experimental results of this work are in agreement with the proposed mechanism for oxidation.
Similar calculations were done for all the experimental oxidation conditions used. In most cases within the first 20 minutes, the solid-phase diffusion was predicted to be faster. Exceptions were the alloys oxidized at 1000 °C in the presence of 25
(9)log(pO2) = M(
1
1 − �
)
+ B
(10)M = −7765.6
T+ 29.4
(11)B = −19475.1
T− 24.1
Fig. 12 Calculated oxide scale thickness as a function of time for gas-phase mass transfer as the rate controlling step (linear) and for solid-phase diffusion as the rate controlling step (parabolic) compared to the experimental result. The oxidation experiment is conducted for 20 minutes at 1000 °C with a gas linear flow rate of 53.3 sccm a in presence of 30 kPa oxygen partial pressure, and b in presence of 15 kPa oxygen partial pressure

233
1 3
Oxidation of Metals (2022) 98:217–237
and 30 kPa oxygen with a linear flow rate of 53.3 sccm. Those showed a parabolic growth already before the 20 min. The transition times obtained from the calcula-tions are close (average deviation of around 10 %) to those determined from the experiments.
Furthermore, the difference between the thickness of the oxide scale on differ-ent spots of the specimens, can be explained by the diffusion of oxygen through the laminar boundary layer. The parts of the sample which are close to the leading edge (which means smaller l in Eq. 2) will get more oxidizing gas diffused to the surface. Therefore, the oxidation is faster on top of the sample which causes the oxide scale on top of the sample to be substantially thicker than the bottom.
Figure 13 schematically shows all the stages from the beginning of the oxidation experiment until the end. It starts when the sample is at the required temperature and the atmosphere is switched from inert to oxidizing gas (Fig. 13a). A gas mixture of oxygen and nitrogen flows over the sample’s surface. The oxygen molecules are in contact with the sample’s surface and the oxidation starts with formation of a thin oxide layer on the surface (Fig. 13b). A laminar boundary layer is formed on the sur-face of the specimen because of the gas flow, and the diffusion of oxygen molecules through this layer becomes the rate-determining step for the oxidation (Fig. 13c). After 20 minutes of oxidation, the atmosphere is switched back to inert gas. Due to the thinner boundary layer and therefore faster diffusion to the leading edge, the scale is much thicker than at the trailing edge (bottom) (Fig.13d).
Fig. 13 Schematic illustration of the alloy’s surface at different stages during high-temperature oxidation of Fe-Mn samples in N2-O2 atmosphere. From a the start of the oxidation when the oxidizing gas flows over the sample, to b formation of the oxide scale, and c the formation of the boundary layer and diffu-sion of gas through this layer, and finally, d formation of a thicker and less rough oxide on the top part of the sample
234 Oxidation of Metals (2022) 98:217–237
1 3
Conclusions
To study the kinetics and the mechanism of high-temperature oxidation of Fe-Mn binaries, a series of experiments were conducted. The samples of pure iron and iron with 1, 3, and 5 wt% Mn were oxidized at 950–1150 °C in gas mixtures with 10-30 kPa oxygen and linear flow rates of 26.6 and 53.3 sccm. The following conclusions can be drawn.
1. In all of the oxidizing conditions, the oxidation kinetics of the samples showed a lin-ear growth rate in the beginning. Only the samples oxidized in 25 and 30kPa oxygen partial pressures with the linear flow rate of 53.3 sccm experienced the transition to parabolic growth within the first 20 minutes of oxidation. Oxygen partial pressure and gas linear flow rate were the only parameters influencing the oxidation kinet-ics. Temperature and Mn content had no significant effect on the growth rates. An activation energy of around 2 kJ mol−1 was obtained from the experiments.
2. Wüstite was the only oxide phase present in the scale during oxidation at high temperature. But it was transformed to magnetite due to a low cooling rate (10 °C min−1).
3. Within the 20 minutes of oxidation, the gas-phase mass transfer through a laminar boundary layer was the rate controlling step for the oxidation reaction. On the leading and trailing edge of the sample the oxidation rate was different, due to the substantial difference in the boundary layer thickness at different lengths. It led to thicker oxide layers on top, and thinner ones at the bottom of the sample.
4. The measured linear rate constants were compared with the ones calculated via a model based on gas diffusion to the sample surface. The measured and calcu-lated values agreed when taking into account the sticking probability (0.3–0.4) of oxygen molecules on the surface.
Understanding the kinetics and mechanism of initial high-temperature oxidation of alloys in various oxidizing conditions can significantly help to develop new steel grades. Further study on other iron binary or ternary alloys will be necessary, in order to give more insights regarding the role of different alloying elements on the oxidizing behavior of the alloys.
Appendix
To show the consumption rate of oxygen in the high-temperature oxidation experi-ments of this work, a series of calculations are conducted (Eqs. 12 and 13).
(12)Supply rate of oxygen(
mol O2 s−1)
=Flow rate
(
ml s−1)
× pO2(atm)
22.4 × 1000

235
1 3
Oxidation of Metals (2022) 98:217–237
The supply and consumption rates are calculated in moles per second and are shown in Table 2.
Figure 14 shows the supply and consumption of oxygen in each experiment.
(13)Consumption rate of oxygen(
mol O2 s−1)
=kl(
g cm−2 s−1)
× A(
cm2)
MO2
(
g mol−1)
Table 2 The calculated amount of oxygen supplied and consumed for the experiments in this work
Flow rate (ml min−1)
pO2 (atm) kl (g cm−2 s−1) Supplied oxygen (mol s−1) Consumed
oxygen (mol s−1)
26.6 0.1 6.88 × 10⁻⁶ 1.98 × 10⁻⁶ 7.14 × 10⁻⁷
26.6 0.15 1.01 × 10⁻⁵ 2.97 × 10⁻⁶ 1.0 × 10⁻⁶
26.6 0.2 1.37 × 10⁻⁵ 3.96 × 10⁻⁶ 1.42 × 10⁻⁶
26.6 0.25 1.74 × 10⁻⁵ 4.95 × 10⁻⁶ 1.81 × 10⁻⁶
26.6 0.3 2.14 × 10⁻⁵ 5.94 × 10⁻⁶ 2.22 × 10⁻⁶
53.3 0.1 1.34 × 10⁻⁵ 3.97 × 10⁻⁶ 1.39 × 10⁻⁶
53.3 0.15 2.06 × 10⁻⁵ 5.95 × 10⁻⁶ 2.14 × 10⁻⁶
53.3 0.2 2.72 × 10⁻⁵ 7.93 × 10⁻⁶ 2.82 × 10⁻⁶
53.3 0.25 3.39 × 10⁻⁵ 9.91 × 10⁻⁶ 3.52 × 10⁻⁶
53.3 0.3 4.02 × 10⁻⁵ 1.19 × 10⁻⁵ 4.17 × 10⁻⁶
Fig. 14 The calculated supply and consumption of oxygen for the high-temperature oxidation experi-ments with two flow rates of a 26.6 sccm, and b 53.3 sccm

236 Oxidation of Metals (2022) 98:217–237
1 3
Acknowledgements This research was carried out under project number T17019p in the framework of the research program of the Materials innovation institute (M2i, www.m2i.nl) supported by the Dutch government. The authors are indebted to Dr. W. Melfo of Tata Steel (IJmuiden, The Netherlands) for the valuable discussions. The authors thank Ing. J.C. Brouwer and Ing. R.W.A. Hendrikx for technical sup-port and assistance with experiments and analysis.
Declarations
Conflict of interest The authors declare that they have no conflict of interest.Not applicable.
Consent to Participate All authors have made substantial contributions to the manuscript.
Consent for Publication All authors have approved the manuscript for publication.
Ethical Approval No ethical approval is required for the current study.
Open Access This article is licensed under a Creative Commons Attribution 4.0 International License, which permits use, sharing, adaptation, distribution and reproduction in any medium or format, as long as you give appropriate credit to the original author(s) and the source, provide a link to the Creative Com-mons licence, and indicate if changes were made. The images or other third party material in this article are included in the article’s Creative Commons licence, unless indicated otherwise in a credit line to the material. If material is not included in the article’s Creative Commons licence and your intended use is not permitted by statutory regulation or exceeds the permitted use, you will need to obtain permission directly from the copyright holder. To view a copy of this licence, visit http:// creat iveco mmons. org/ licen ses/ by/4. 0/.
Table 3 Relevant parameters for calculation of the linear rate constant for oxidation of the iron-manga-nese alloys in binary O2-N2 gas mixtures with a linear flow rate of 53.3 sccm and oxygen partial pressure of 20 kPa at various temperatures
Temperature (°C) 950 1000 1050 1100 1150
kT∕�N2
13.366 13.913 14.459 15.005 15.552Ω
N20.797 0.792 0.788 0.784 0.779
�N2
(g cm−1 s−1) 4.30 × 10⁻⁴ 4.41 × 10⁻⁴ 4.52 × 10⁻⁴ 4.63 × 10⁻⁴ 4.74 × 10⁻⁴
�N2
(g cm−3) 2.79 × 10⁻⁴ 2.68 × 10⁻⁴ 2.58 × 10⁻⁴ 2.48 × 10⁻⁴ 2.40 × 10⁻⁴
�N2
(cm −2 s-1) 1.541 1.646 1.754 1.864 1.978kT∕�
O210.823 11.265 11.708 12.150 12.593
ΩO2
0.818 0.814 0.810 0.807 0.803�O2
(g cm−1 s-1) 5.38 × 10⁻⁴ 5.51 × 10⁻⁴ 5.64 × 10−45.77 × 10−4 5.90 × 10⁻⁴
�O2
(g cm −3) 3.19 × 10⁻⁴ 3.06 × 10⁻⁴ 2.95 × 10⁻⁴ 2.84 × 10⁻⁴ 2.74 × 10⁻⁴
�O2
(cm2 s-1) 1.687 1.799 1.914 2.033 2.155kT∕�
N2−O212.027 12.519 13.011 13.502 13.995
ΩN2−O2
0.808 0.804 0.800 0.796 0.792�N2−O2
(g cm−1 s-1) 4.52 × 10⁻⁴ 4.64 × 10⁻⁴ 4.76 × 10⁻⁴ 4.87 × 10⁻⁴ 4.99 × 10⁻⁴
�N2−O2
(g cm−3) 2.87 × 10⁻⁴ 2.86 × 10⁻⁴ 2.65 × 10⁻⁴ 2.56 × 10⁻⁴ 2.46 × 10⁻⁴
�N2−O2
(cm2 s-1) 1.578 1.684 1.794 1.907 2.023D
O2 (cm2 s−1) 2.452 2.630 2.813 3.002 3.196
237
1 3
Oxidation of Metals (2022) 98:217–237
References
1. G. Song, T. Vystavel, N. Van Der Pers, J. T. M. De Hosson, W. Sloof, Acta Materialia, 60, 2973 (2012).
2. D. J. Young, High temperature oxidation and corrosion of metals, Vol. 1 (Elsevier, Amsterdam, 2008).
3. F. Pettit, J. Wagner Jr, Acta Metallurgica, 12, 35 (1964). 4. R.Y. Chen, W. Yuen, Oxidation of Metals 73, 353 (2010) . 5. V. Lee, B. Gleeson, D. Young, Oxidation of Metals, 63, 15 (2005). 6. W. Smeltzer. Acta Metallurgica 8, 377 (1960). 7. F. Pettit, R. Yinger, J. Wagner Jr, Acta Metallurgica, 8, 617 (1960). 8. R. Bredesen, P. Kofstad. Oxidation of Metals 35, 107 (1991). 9. H. Yin, S. Chan, W. Yuen D. Young, Oxidation of Metals, 77, 305 (2012). 10. R.Y. Chen, W. Yuen. Oxidation of Metals, 70, 39 (2008). 11. H. Abuluwefa, R. Guthrie, F. Ajersch, Oxidation of Metals, 46, 423 (1996). 12. P. Wikström, W. Blasiak, S. Du, Ironmaking & Steelmaking, 35, 621 (2008). 13. D. Young, F. Viani, F. Gesmundo, Oxidation of Metals, 30, 391 (1988). 14. R. Chen, W. Yuen, Oxidation of Metals, 85, 489 (2016). 15. D.J. Young, H. Yin, Oxidation of Metals, 79, 445 (2013). 16. V.A. Lashgari, G. Zimbitas, C. Kwakernaak, W. Sloof, Oxidation of Metals, 82, 249 (2014). 17. V.A. Lashgari, C. Kwakernaak, W. Sloof, W. Oxidation of Metals, 81, 435 (2014). 18. P. Mayer, W. Smeltzer. Journal of the Electrochemical Society, 119, 626 (1972). 19. C. W. Bale, et al. Calphad 26, 189–228 (2002). 20. V. A. Lashgari, Internal and External Oxidation of Manganese in Advanced High Strength Steels.
Ph.D. thesis, Delft University of Technology (2014). 21. S. Yoneda, S. Hayashi, Y. Kondo, H. Tanei, S. Ukai. Oxidation of Metals 87, 125 (2017). 22. O. Kubaschewski, B.E. Hopkins, Oxidation of Metals and Alloys (Butterworths, London, 1967). 23. H. Abuluwefa, R. Guthrie, F. Ajersch. Metallurgical and Materials Transactions A 28, 1633 (1997) . 24. S. Chandra-ambhorn, A. Jutilarptavorn, T. Rojhirunsakool, Corrosion Science 148, 355 (2019) . 25. V.G. Levich, Physicochemical hydrodynamics (Prentice-Hall Inc., 1962). 26. D. R. Poirier, G. Geiger, Transport phenomena in materials processing (Springer 2016). 27. Gaskell, D. An introduction to transport phenomena in materials engineering (Momentum Press 2012). 28. A. Hodgson, A. Wight, G. Worthy, Surface Science, 319, 119 (1994). 29. L. Himmel, R. Mehl, C.E. Birchenall, JOM, 5, 827 (1953). 30. R. A. Giddings, R. S. Gordon, Journal of the American Ceramic Society, 56, 111 (1973).
Publisher’s Note Springer Nature remains neutral with regard to jurisdictional claims in published maps and institutional affiliations.
Authors and Affiliations
S. Aghaeian1 · W. G. Sloof1 · J. M. C. Mol1 · A. J. Böttger1
W. G. Sloof [email protected]
J. M. C. Mol [email protected]
A. J. Böttger [email protected]
1 Department of Materials Science and Engineering, Faculty of Mechanical, Maritime and Materials, Delft University of Technology, Mekelweg 2, 2628 CD Delft, Zuid Holland, The Netherlands
Related Documents