On the decomposition of life expectancy and limits to life Les Mayhew and David Smith Faculty of Actuarial Science Cass Business School Longevity 10 September 2014 Santiago Chile

Welcome message from author
This document is posted to help you gain knowledge. Please leave a comment to let me know what you think about it! Share it to your friends and learn new things together.
Transcript
On the decomposition of life expectancy and limits to life
Les Mayhew and David SmithFaculty of Actuarial Science
Cass Business SchoolLongevity 10
September 2014Santiago
Chile

Some key demographic issues
• What do trends in life expectancy in different countries tell us about limits to life expectancy?
• Are there alternatives to the use of mortality as a basis for forecasting life expectancy?
• Why does life expectancy in some countries go down as well as up?
• Why is the US falling behind other major countries?

36
38
40
42
44
46
48
50
52
1965 1970 1975 1980 1985 1990 1995 2000 2005 2010
year
life
exp
ecta
ncy a
t a
ge
30
Japan
E&W
Poland
Comparative trends in life expectancy in three countries
Male trends in life expectancy at age 30 in Japan, England and Wales and Poland using quadratic functions (Source – HMD)

Is there evidence for convergence in England and Wales data?
life expectancy at 30
age t
o w
hic
h g
iven %
surv
ive
100
90
80
70
60
50
40
30
20
10
0
In the convergent case life expectancy proceeds to a maximum. If we take the period 1840 to 1939 there is clear evidence for life expectancy to be on a convergent track although it has a long way to run. In both male and female cases this is 67.5 at age 30.
30
40
50
60
70
80
90
100
30 35 40 45 50 55 60 65 70
life expectancy at age 30
ag
e b
y w
hic
h g
ievn
pe
rce
nta
ge
are
de
ad
95th Percentile
90th Percentile
80th Percentile
70th Percentile
60th Percentile
50th Percentile
40th Percentile
30th Percentile
20th Percentile
10th Percentile

Is there evidence for convergence in England and Wales data?
life expectancy at 30
age t
o w
hic
h g
iven %
surv
ive
100
90
80
70
60
50
40
30
20
10
0
In the convergent case life expectancy proceeds to a maximum. If we take the period 1840 to 1939 there is clear evidence for life expectancy to be on a convergent track although it has a long way to run. In both male and female cases this is 67.5 at age 30.
After 1939 there was a clear change
of trend

Forecasting life expectancy based on pre-war convergent trend
30
35
40
45
50
55
60
65
70
1825 1850 1875 1900 1925 1950 1975 2000 2025 2050 2075 2100
year
life
exp
ecta
ncy a
t a
ge
30
(m
ale
)
male actual 1941 to 1939
forecast
The trend predicted from 1939 suggests that a maximum would be approach from about 2050 when progress would level out
30
35
40
45
50
55
60
65
70
1825 1850 1875 1900 1925 1950 1975 2000 2025 2050 2075 2100
yearlife
exp
ecta
ncy a
t a
ge
30
(m
ale
)
male actual 1941 to 1939
male actual 1950 to 2009
forecast
In fact, the actual trend is severely retarded from about 1950 to 1975 before resuming its steep climb. However, convergent behaviour is replaced by parallel behaviour. The same occurs in females but the retardation effect is less. So harder to estimate upper limit.

Alternative method based on partial life expectancy
Motivation
• Create known limits by dividing life course into age intervals
• Identity trends within each based on known upper limits
• Aggregate age intervals to obtain life expectancy between any desired age interval (e.g. 30-100)
• Isolate and focus attention on age intervals where trend are harder to establish (e.g. >100)

Partial life expectancy
age
po
pula
tio
n
1lx
2lx
3lx
4lx
1x2x
3x 4x5x
age
po
pula
tio
n
1lx
2lx
3lx
4lx
1x2x
3x 4x5x
age
po
pula
tio
n
1lx
2lx
3lx
4lx
1x2x
3x 4x5x
Partial Life Expectancy
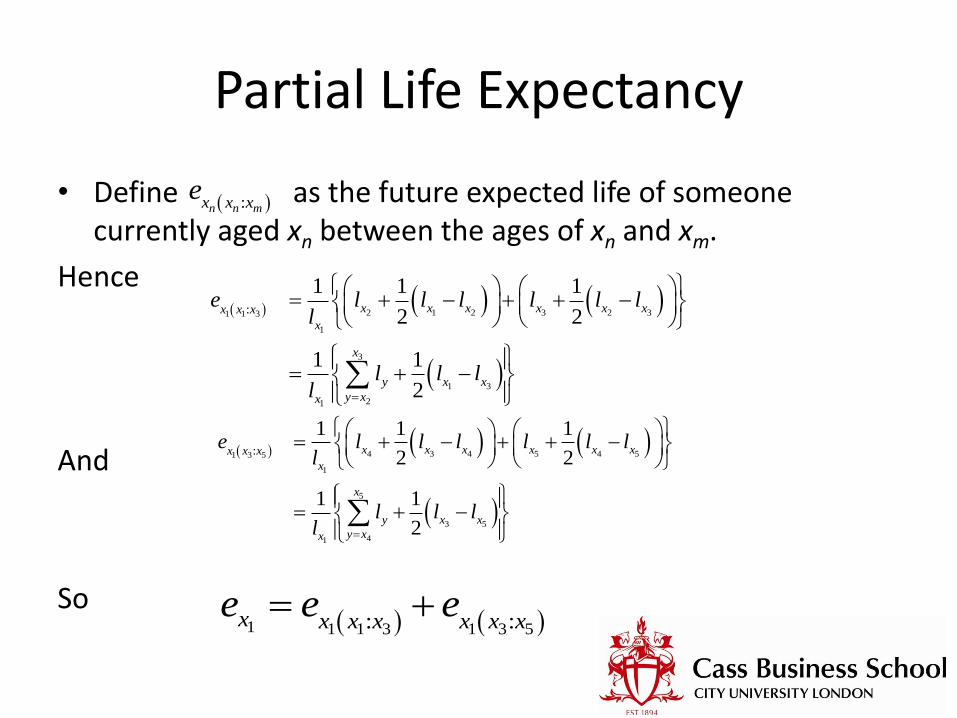
• Define as the future expected life of someone currently aged xn between the ages of xn and xm.
Hence
And
So
:n n mx x xe
2 1 2 3 2 31 1 3
1
3
1 3
21
:
1 1 1
2 2
1 1
2
x x x x x xx x x
x
x
y x x
y xx
e l l l l l ll
l l ll
4 3 4 5 4 51 3 5
1
5
3 5
41
:
1 1 1
2 2
1 1
2
x x x x x xx x x
x
x
y x x
y xx
e l l l l l ll
l l ll
1 1 1 3 1 3 5: :x x x x x x xe e e
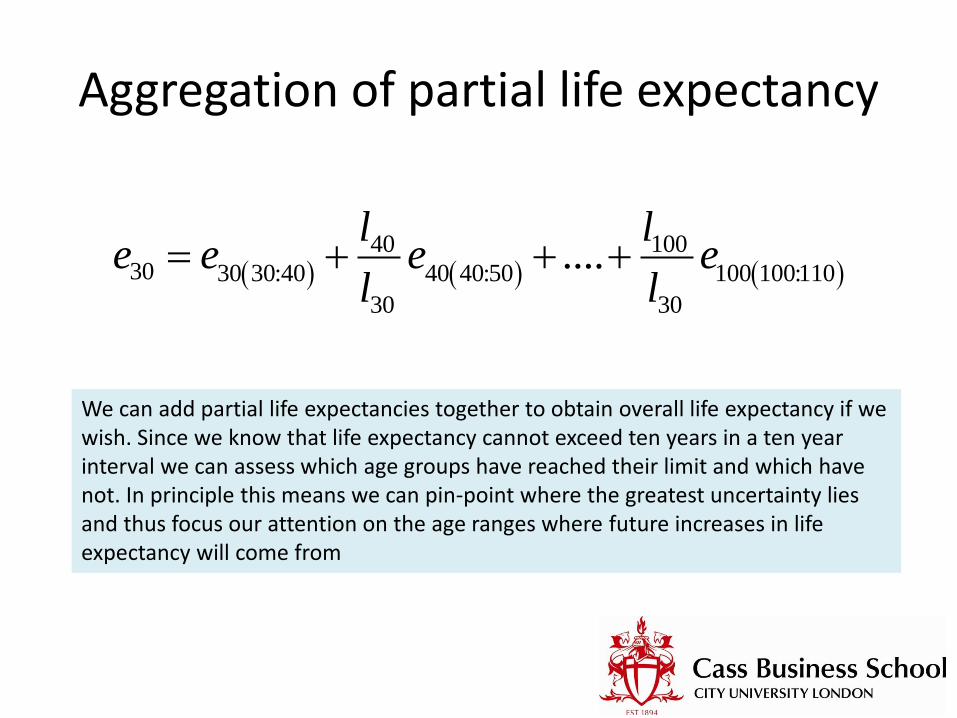
Aggregation of partial life expectancy
40 100
30 30 30:40 40 40:50 100 100:110
30 30
....l l
e e e el l
We can add partial life expectancies together to obtain overall life expectancy if we wish. Since we know that life expectancy cannot exceed ten years in a ten year interval we can assess which age groups have reached their limit and which have not. In principle this means we can pin-point where the greatest uncertainty lies and thus focus our attention on the age ranges where future increases in life expectancy will come from
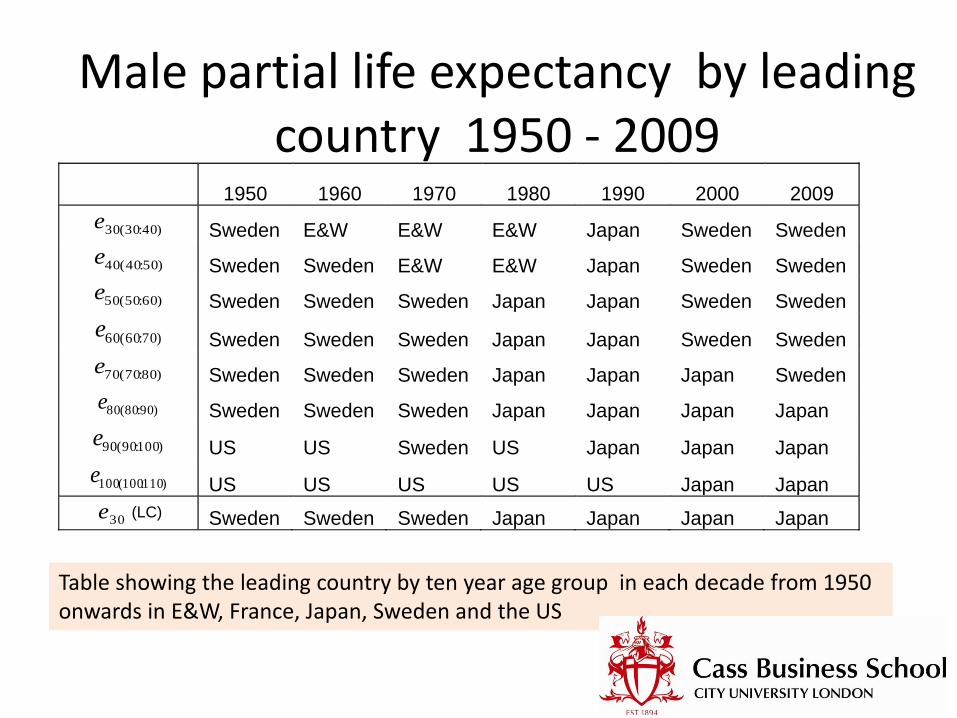
Male partial life expectancy by leading country 1950 - 2009
Table showing the leading country by ten year age group in each decade from 1950 onwards in E&W, France, Japan, Sweden and the US
1950 1960 1970 1980 1990 2000 2009
)40:30(30e Sweden E&W E&W E&W Japan Sweden Sweden
)50:40(40e Sweden Sweden E&W E&W Japan Sweden Sweden
)60:50(50e Sweden Sweden Sweden Japan Japan Sweden Sweden
)70:60(60e Sweden Sweden Sweden Japan Japan Sweden Sweden
)80:70(70e Sweden Sweden Sweden Japan Japan Japan Sweden
)90:80(80e Sweden Sweden Sweden Japan Japan Japan Japan
)100:90(90e US US Sweden US Japan Japan Japan
)110:100(100e US US US US US Japan Japan
30e (LC) Sweden Sweden Sweden Japan Japan Japan Japan
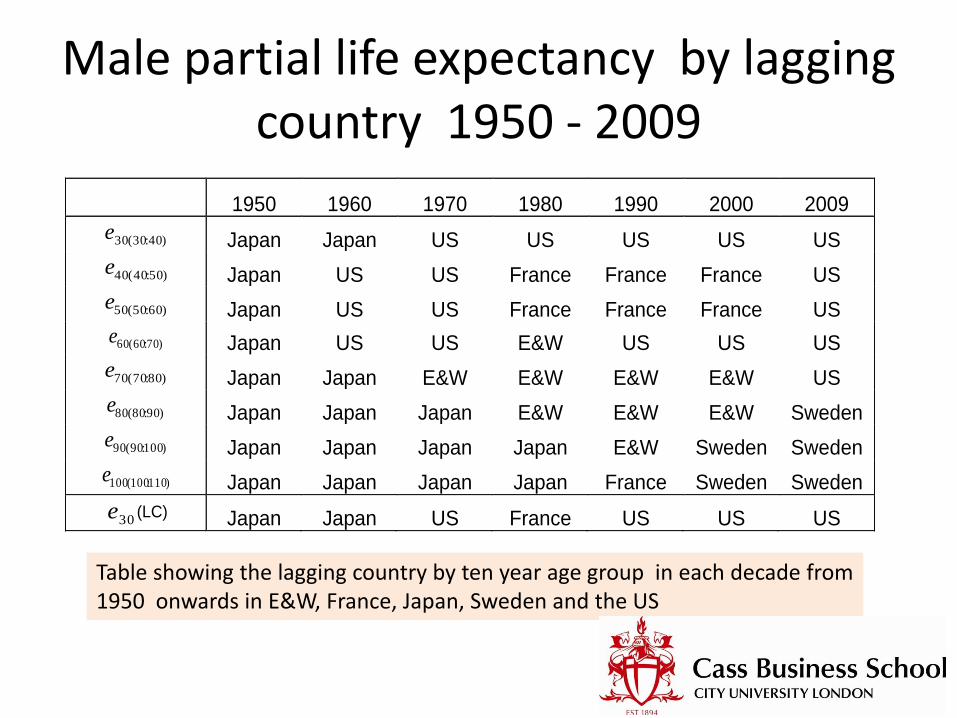
Male partial life expectancy by lagging country 1950 - 2009
Table showing the lagging country by ten year age group in each decade from 1950 onwards in E&W, France, Japan, Sweden and the US
1950 1960 1970 1980 1990 2000 2009
)40:30(30e Japan Japan US US US US US
)50:40(40e Japan US US France France France US
)60:50(50e Japan US US France France France US
)70:60(60e Japan US US E&W US US US
)80:70(70e Japan Japan E&W E&W E&W E&W US
)90:80(80e Japan Japan Japan E&W E&W E&W Sweden
)100:90(90e Japan Japan Japan Japan E&W Sweden Sweden
)110:100(100e Japan Japan Japan Japan France Sweden Sweden
30e (LC) Japan Japan US France US US US
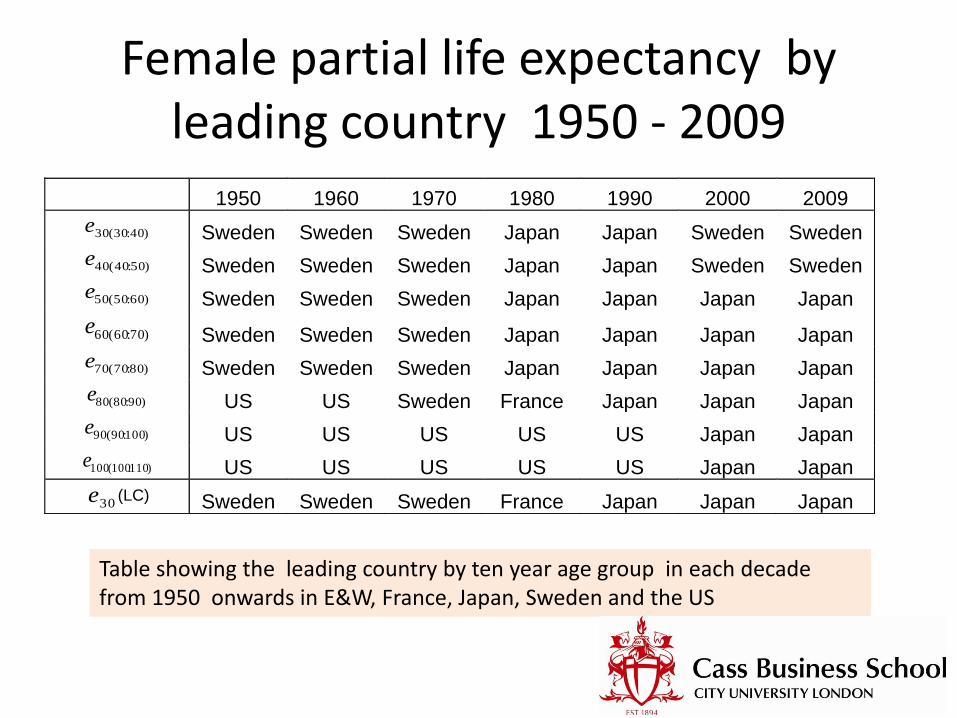
Female partial life expectancy by leading country 1950 - 2009
Table showing the leading country by ten year age group in each decade from 1950 onwards in E&W, France, Japan, Sweden and the US
1950 1960 1970 1980 1990 2000 2009
)40:30(30e Sweden Sweden Sweden Japan Japan Sweden Sweden
)50:40(40e Sweden Sweden Sweden Japan Japan Sweden Sweden
)60:50(50e Sweden Sweden Sweden Japan Japan Japan Japan
)70:60(60e Sweden Sweden Sweden Japan Japan Japan Japan
)80:70(70e Sweden Sweden Sweden Japan Japan Japan Japan
)90:80(80e US US Sweden France Japan Japan Japan
)100:90(90e US US US US US Japan Japan
)110:100(100e US US US US US Japan Japan
30e (LC) Sweden Sweden Sweden France Japan Japan Japan
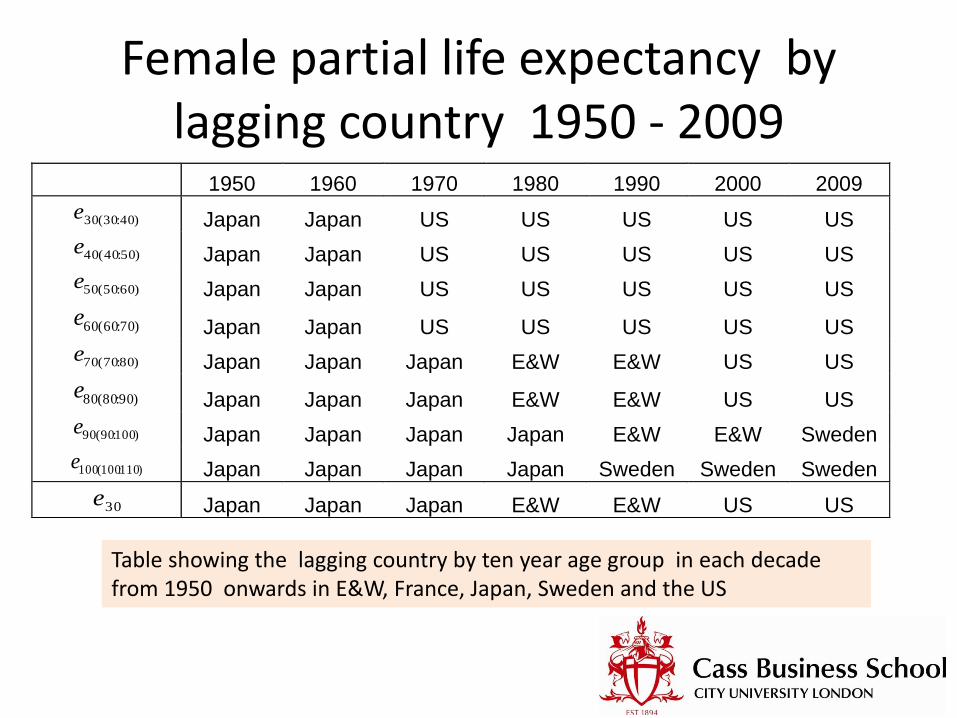
Female partial life expectancy by lagging country 1950 - 2009
Table showing the lagging country by ten year age group in each decade from 1950 onwards in E&W, France, Japan, Sweden and the US
1950 1960 1970 1980 1990 2000 2009
)40:30(30e Japan Japan US US US US US
)50:40(40e Japan Japan US US US US US
)60:50(50e Japan Japan US US US US US
)70:60(60e Japan Japan US US US US US
)80:70(70e Japan Japan Japan E&W E&W US US
)90:80(80e Japan Japan Japan E&W E&W US US
)100:90(90e Japan Japan Japan Japan E&W E&W Sweden
)110:100(100e Japan Japan Japan Japan Sweden Sweden Sweden
30e Japan Japan Japan E&W E&W US US
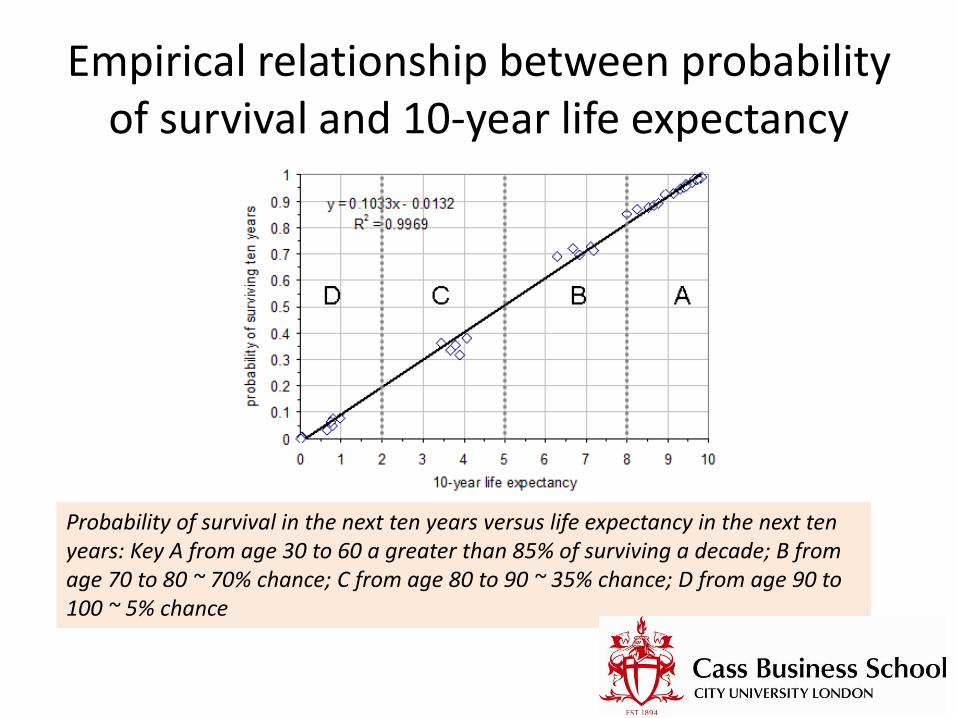
Empirical relationship between probability of survival and 10-year life expectancy
Probability of survival in the next ten years versus life expectancy in the next ten years: Key A from age 30 to 60 a greater than 85% of surviving a decade; B from age 70 to 80 ~ 70% chance; C from age 80 to 90 ~ 35% chance; D from age 90 to 100 ~ 5% chance
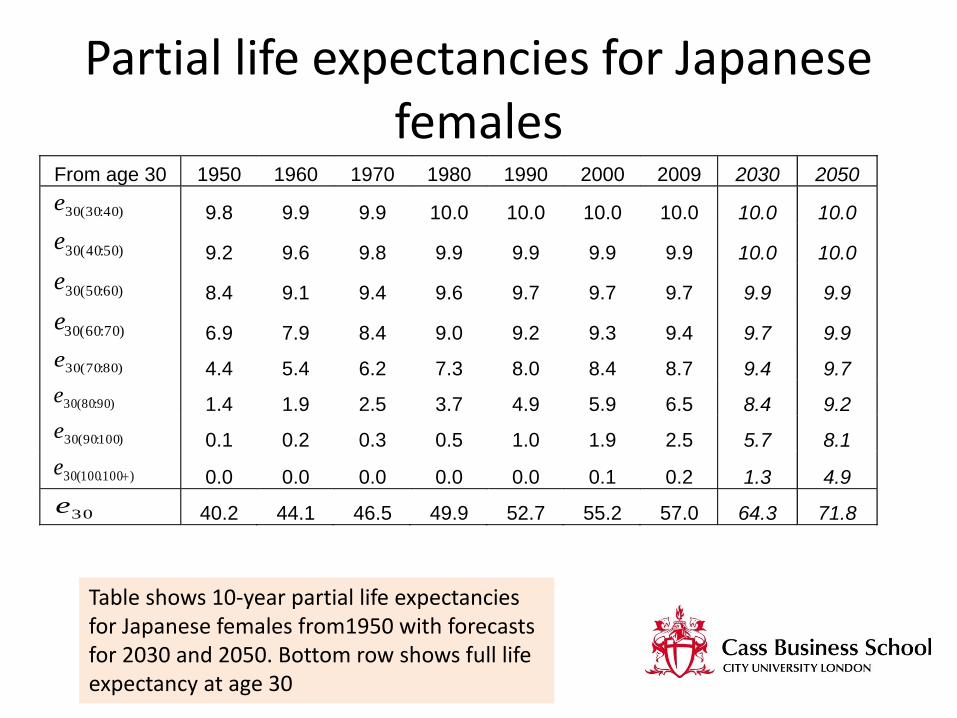
Partial life expectancies for Japanese females
Table shows 10-year partial life expectancies for Japanese females from1950 with forecasts for 2030 and 2050. Bottom row shows full life expectancy at age 30
From age 30 1950 1960 1970 1980 1990 2000 2009 2030 2050
)40:30(30e 9.8 9.9 9.9 10.0 10.0 10.0 10.0 10.0 10.0
)50:40(30e 9.2 9.6 9.8 9.9 9.9 9.9 9.9 10.0 10.0
)60:50(30e 8.4 9.1 9.4 9.6 9.7 9.7 9.7 9.9 9.9
)70:60(30e 6.9 7.9 8.4 9.0 9.2 9.3 9.4 9.7 9.9
)80:70(30e 4.4 5.4 6.2 7.3 8.0 8.4 8.7 9.4 9.7
)90:80(30e 1.4 1.9 2.5 3.7 4.9 5.9 6.5 8.4 9.2
)100:90(30e 0.1 0.2 0.3 0.5 1.0 1.9 2.5 5.7 8.1
)100.100(30 e 0.0 0.0 0.0 0.0 0.0 0.1 0.2 1.3 4.9
30e 40.2 44.1 46.5 49.9 52.7 55.2 57.0 64.3 71.8

The trend lines for Japanese females are based on the following equations:
The equation fits most of the series considered very accurately although this is not the only variant
Fitting trend lines to partial life expectancies
)(
)(
1tf
tf
ii
i
e
Aey
tbatf iii )(

Contribution from each decade of life to Japanese female life expectancy at 30
0
10
20
30
40
50
60
70
80
1950 1960 1970 1980 1990 2000 2009 2030 2050
Year
s
Calendar Year
100-110
90-100
80-90
70-80
60-70
50-60
40-50
30-40

How trend lines compare
30
40
50
60
70
80
90
100
1950 1960 1970 1980 1990 2000 2010 2020 2030 2040 2050 2060 2070 2080 2090 2100
year
life
exp
ecta
ncy a
t 3
0 (
fem
ale
s)
D
A
B C
A comparison of trends in Japanese female life expectancy at age 30 based on three forecasting approaches: the quadratic, straight line and limiting models.
Key: A quadratic trend; B based on limiting model with upper limit of D; C based on a straight line trend.

Conclusions
• Life expectancy is a crucial measure of human development but when making forecasts trend lines are unbounded and can become unrealistic
• Partial life expectancies offer a way around this, at least in part
• Retrospective analysis of trends in partial life expectancy show important strategic shifts with the US falling to the bottom and Japan rising to the top
Related Documents