© 2012 Boise State University Marcia Belcheir, Ph.D. Robert Anson, Ph.D. James A. Goodman, Ph.D. Boise State University On-line Course Evaluation Implementation and Improvement of Response Rates

On-line Course Evaluation Implementation and Improvement of Response Rates
Dec 30, 2015
On-line Course Evaluation Implementation and Improvement of Response Rates. Marcia Belcheir, Ph.D. Robert Anson, Ph.D. James A. Goodman, Ph.D. Boise State University. Goals of the Session. Offer suggestions for implementing on-line course evaluations - PowerPoint PPT Presentation
Welcome message from author
This document is posted to help you gain knowledge. Please leave a comment to let me know what you think about it! Share it to your friends and learn new things together.
Transcript

© 2012 Boise State University
Marcia Belcheir, Ph.D.Robert Anson, Ph.D.
James A. Goodman, Ph.D.Boise State University
On-line Course Evaluation Implementation and Improvement of Response Rates

© 2012 Boise State University
Goals of the Session• Offer suggestions for implementing on-line
course evaluations• Report research results of how faculty can
improve response rates in their courses
© 2012 Boise State University
A short history on implementing on-line course evaluations at Boise State
• Diffused ownership – collaboration of stakeholders from all parts of campus examined viability of the move
• Most departments wanted to participate; some skeptical, needed to see it work on campus
• No university-wide question set; instead, from college, department, and a variety of academic support programs
• Purchased CollegeNet, “WDYT” product

© 2012 Boise State University
Academic-Oriented Team Led by Institutional Research
• Teamed with 2 faculty—one in Center for Teaching and Learning, one teaches IT
• Minimized OIT involvement (only prepare data source and set up user authentication)
• Implementation required:– No new FTE resources (“other duties as assigned”)– Need “sensitive touch” for faculty buy-in and participation
• To Opt-In• To encourage student involvement• To trust data for annual performance evaluations

© 2012 Boise State University
• Coordinated many hands (and no FTE body) to run on-line evaluations– Developed upload files and checked for accuracy– Handled help questions – Prepared survey calendar each semester
• Recommendations– Reduce # of sessions = more sessions = more cycles to
support– Don’t assume course registration data is accurate– Communication is key
Implementing On-Line Evaluations in a Streamlined Environment

© 2012 Boise State University
• Opt-In for colleges, departments (down to course level) created challenges to selectively load course enrollment data
• Also opt-in for trans-departmental academic programs--“matrix university”
• Solution– Developed MS Access Database to check, filter and restructure data
flexibly and systematically• Recommendation
– Overcomes potential faculty and department resistance to how teaching is evaluated
– (Optional) University-wide question set should be universally adopted early in the process
Implementing On-Line Evaluations in a Voluntary Environment

© 2012 Boise State University
Implementing On-Line Evaluations in a Decentralized Environment
• Questions controlled by colleges, departments, and academic support programs; no required university question-set
• Solution– Vendor (CollegeNet, WDYT) selected for flexibility to create and bind
specific question sets to type of course– Centralized question review, assistance, creation in Center for Teaching
and Learning• Recommendations
– Decentralized requires centralized editing & question support– Helps to incorporate academic support programs (Honors? On-line
programs? SL?) in on-line evaluations to reduce extra survey demands
© 2012 Boise State University
Part 2: Improving response ratesThe key to good student response rates for on-line evaluations often lie with the faculty
➢What does the literature say?➢What do our faculty do?➢How well do different tactics work to raise
response rates?➢Are there other factors?

© 2012 Boise State University
Background and literature review• Response rates for online evaluations tend to be
lower than of pen/paper evaluations (~70-80%/~50-60%) (Avery et al, 2006; Dommeyer 2002; many others)
• Likert-type quantitative ratings remain constant even with lower response rates (Anderson et al, 2005; Dommeyer, 2004; many others)

© 2012 Boise State University
Background and literature review
• Qualitative responses tend to increase (Handwerk, 2000; Heath, et al, 2007)
• Institutions and instructors that do something tend increase response rates (Nulty, 2008)
• The more tactics an institution and/or instructor uses, the higher the response rate (Nulty, 2008)

© 2012 Boise State University
Response Rates and Adoption of On-line Evaluations
* Estimate based on literature

© 2012 Boise State University
➢Online Evaluations– 76,172 enrollments (88% of total were online evaluations)
• 1,134 instructors• 3,213 classes
➢ Response Rates– Overall: 54.9%– Colleges
• High: 73% in Engineering• Low: 52% in Arts & Sciences
– Departments• High: 82% in Construction Mgmt• Low: 31% in Respiratory Care
– Classes: 0% to 100%
Fall 2012

© 2012 Boise State University
University Measures/Tactics• No iPad lotteries, web advertising, or grade hooks• Sent 5 student emails
– Start– Reminders (3)– End
• Sent 5 instructor emails– Pre-eval (enter custom questions)– Start– Reminder – End– Results available

© 2012 Boise State University
1. Studied Fall 2012 evaluation – Used individual response rate data– Received anonymous data set from vendor
2. Surveyed all 1,134 instructors– 678 (60%) instructors responded about tactics used in
1 or 2 classes taught that Fall– 1,128 (35%) classes studied– Survey asked
• Tactics used to increase student response rates or otherwise obtain student feedback
• Basic demographic questions
Research Methods: Data

© 2012 Boise State University
• Applied series of t-tests and ANOVAS on individual variables for statistical differences
• Applied regression for modeling the best set of factors for predicting response rates
Research Methods: Analysis
© 2012 Boise State University
Research Questions Addressed• What tactics do instructors use to improve
their response rates?• Does it help to use more tactics?• What is the impact of course and instructor
characteristics?• What is the best model for explaining
variation in response rates?• Are there interactions between tactics used
and course or faculty characteristics?
© 2012 Boise State University
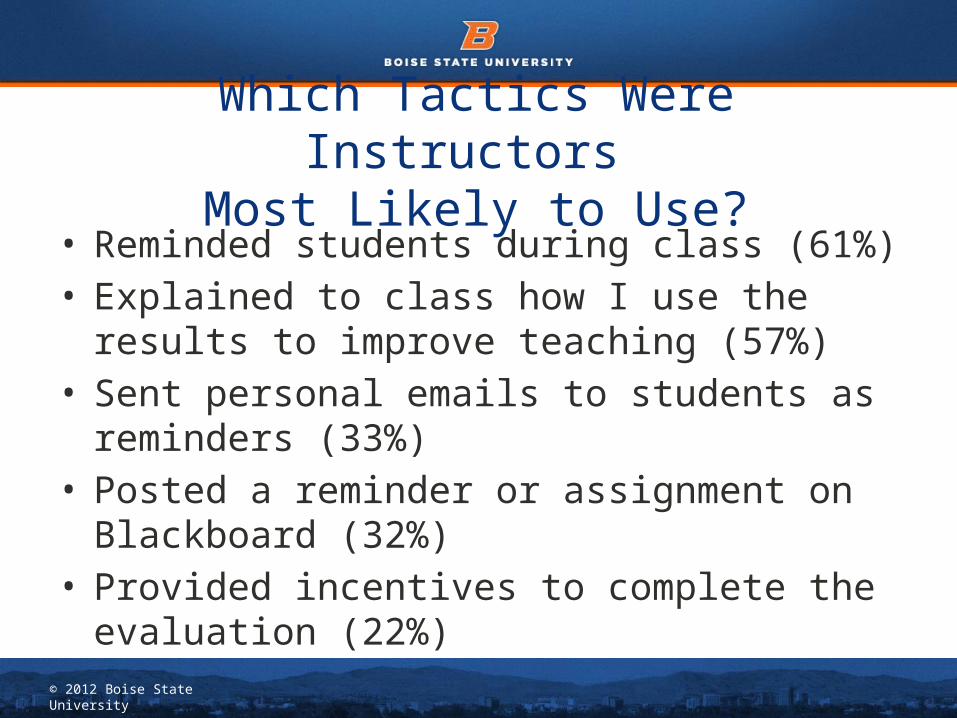
Which Tactics Were Instructors Most Likely to Use?
• Reminded students during class (61%)• Explained to class how I use the results to improve
teaching (57%)• Sent personal emails to students as reminders (33%)• Posted a reminder or assignment on Blackboard
(32%)• Provided incentives to complete the evaluation (22%)

© 2012 Boise State University
What instructor tactics improved response rates?
Tactics
Used tacticResponse
rate
Didn’t use
Response rate
Provided incentives 79% 57%
Provided time in class to complete 70% 61%
Sent personal e-mails as reminders 66% 60%
Reminded students during class time 65% 57%
Explained to class how I use the results 65% 57%
Posted reminder/assignment on BlackBoard 64% 61%I did nothing 50% 63%

© 2012 Boise State University
Incentives: Does the kind of incentive and approach affect response rates?
Basis for Awarding Incentive
Type of
Incen-tive
Individual
% of class
Total
Points 78%(n=62)
79%(n=156)
79%(n=218)
Other incentive 77%(n=15)
82%(n=18)
80%(n=33)
Total 78%(n=77)
79%(n=174)
79%(n=251)

© 2012 Boise State University
• Point-based class-wide rewards – If 80% complete the eval, everyone gets 1 point
added to final grade– If 90% complete eval, all students gain back all
participation points• Non-Point-based class-wide rewards
– If 70% complete eval, instructor will bring cupcakes to final
– If 90% complete eval, everyone can bring a 3 X 5 notecard to the final
Class-based Incentive Examples

© 2012 Boise State University
Impact of threshold on response rateIncentive threshold
N who used that threshold
Average response rate
100% 8 89%
90%+ 10 87%
80%+ 22 86%
Sliding scale 8 73%
70%+ 12 68%
60%+ 3 62%
Unknown 9 74%

© 2012 Boise State University
Did using more tactics improve response rates?
0%
10%
20%
30%
40%
50%
60%
70%
80%
50%54%
60%64%
71%74%
0 1 2 3 4 5 or more

© 2012 Boise State University
Course and instructor characteristics:
Response Rate
N
Small courses (<20) vs larger (>40)
64% vs 59%
477 vs 154
In-person courses vs On-Line
63% vs 50%
955 vs 119
Graduate courses vs Undergraduate
65% vs 61%
153 vs 974
Tenure/tenure-track faculty vs Adjunct
64% vs 57%
748 vs 379
Higher response rates were associated with:

© 2012 Boise State University
Final model (R2=.32):Variable Standardized
estimate
Provided incentives 0.41
Number of tactics used 0.43
Took class time to complete evaluation
0.07
Small class 0.09
Taught on-line -0.09
Undergraduate course 0.04
Taught by adjunct -0.12
Interaction: Number of tactics & undergraduate course level
-0.32

© 2012 Boise State University
Response rates based on number of tactics and course level
0 1 2 3 4 50.00
0.10
0.20
0.30
0.40
0.50
0.60
0.70
0.80
0.90
Graduate course
Undergraduate course
Number of tactics employed to increase response rates
Res
po
nse
rat
e
© 2012 Boise State University
Conclusions• Incentives provide the biggest boost
– If you use incentives, set the threshold for the class (not individual) and set it at 80% or more
– If using incentives, best to set high threshold (80% or greater) for class as a whole
• Use multiple tactics• On-line and large section classes have a built
in disadvantage—use even more tactics
© 2012 Boise State University
Future Changes• Institutionalize small core set of university-
wide questions to enable comparisons• Pushing grade hook proposal• Keep expanding use (now 91.5%)• Explore means to impact response rates for
on-line courses

© 2012 Boise State University
Questions?
• Marcia Belcheir - [email protected] • Robert Anson – [email protected] • James A. Goodman –
Related Documents


![Direct Mail Response Rates DMA 2015 Report [infographic]](https://static.cupdf.com/doc/110x72/58ad01231a28abca0c8b6991/direct-mail-response-rates-dma-2015-report-infographic.jpg)