Corporate Presentation Oil-Weighted Growth Engine January 2018

Welcome message from author
This document is posted to help you gain knowledge. Please leave a comment to let me know what you think about it! Share it to your friends and learn new things together.
Transcript

Corporate Presentation
Oil-Weighted Growth Engine
January 2018

2
AboutPRAIRIE PROVIDENT
• Oil and liquids focused E&P company operating primarily in Alberta
• Low-decline production generates attractive operating netbacks* in current environment
- ~70% liquids (62% light oil) and ~20% base decline
- > 5 years of low cost drilling locations* drives long-term growth engine
• Balance sheet well supported by reserves, cash flow and active hedging program
- Debt to EBITDAX* currently 1.7x; target of 1x on a rolling 12 month basis
• High working interests and operatorship allows control over pace of development- Competition for capital allocation drives enhanced capital efficiencies and IRRs
* Note: See Oil and Gas Metrics and Non-IFRS Measures Advisories on slide 24

3
• Focus on development of conventional western Canadian oil and liquids plays that offer compelling economics in a low price environment
• Maintain high working interests and operatorship• Maintain and grow production through waterflood and light oil focused development
• Deliver accretive growth through exploitation plus opportunistic acquisitions• Competition for capital across areas improves IRRs
• Maintain strong balance sheet through capital discipline and robust hedging program
STRATEGY

4
Operational Summary
Current Production ~5,000 boe/d
2017 Oil & liquids weighting ~70%
Base decline rate ~20%
Reserves (YE2017)
P+P Reserves(*) 20,677 Mboe
Reserve Life Index (P+P)(*) 11.3 years
P+P Reserves NPV10(*) $298 MM
PDP Reserves(*) 9,386 Mboe
PDP Reserves NPV10(*) $150 MM
As at January 22, 2018 Market and Financial Summary
Shares Outstanding 115.9 MM
Management & Board Equity Ownership 3%
Market Capitalization $57 MM
Total Debt Net of Cash $52 MM
Credit Capacity(1) $70 MM
2018 Forecast Adjusted EBITDAX(*) $27 - 30 MM
CompanyOVERVIEW
(*) See Oil and Gas Metrics and Non-IFRS Measures Advisories on slide 24 and Reserves Data Disclosure Advisories on slide 25
(1) Applying a USD/CAD exchange rate of $0.80 per US$1.00

5
773,238PPR Total Net Acres
PrincessMulti-zone potentialLithic Glauc & Detrital75 sectionsHz and Vt development
WheatlandLower cretaceous oil/gas116 sections; year round accessHz development
EviSlave Point light oil – low riskGranite Wash light oil play 121 sectionsEmerging waterflood; initial reserves booked
EVI
PRINCESS
WHEATLAND
KEY FOCUS AREAS
ALBERTA
20.7 MMboeProved + Probable
Reserves(1)
$298.5MMProved + Probable
NPV10 Value(1)
~2,200 boe/d
~1,600 boe/d
~600 boe/d
Other~600 boe/d
(1) See Reserves Data Disclosure Advisories on slide 25
FOCUSEDASSET BASE

6
MANAGEMENT TEAM AND BOARDManagementTim S. Granger, President & CEO CEO at Molopo Energy Limited, President and CEO at Compton Petroleum Corporation, COO at Paramount Energy, Managing Director at TAQA North, COOat PrimeWest Energy
Mimi M. Lai, VP Finance and CFOVice President, Finance & Controller, Manager, Financial Reporting at Harvest Operations Corp, Sr. Manager at Financial Accounting Advisory Services Ernst & Young LLP
Robert Guy, VP OperationsVice President, Production Operations at Spyglass Resources Corp., Manager, Operations at Ketch Resources Trust, Various Management Positions at Acclaim Energy Trust
Tony van Winkoop, VP ExplorationPresident and CEO at Arsenal Energy Inc., General Manager of Development at PrimeWest Energy, Co-founder of Venator Petroleum
Gjoa Taylor, VP LandVice President, Land at Arsenal Energy Inc. Various land positions of increasing responsibility with Imperial Oil, Crestar Energy, and Manager, Negotiations.At PrimeWest Energy
Board of Directors
Patrick R. McDonald, Chairman
Derek Petrie
Ajay Sabherwal
Rob Wonnacott
Terence (Tad) Flynn
Tim Granger (President & CEO)

7
• Built an oil-weighted and low-risk asset base in Alberta focused in Wheatland / Princess and Evi, which offers:• 5 years of drilling inventory on internally identified development drilling opportunities (assuming
a notional 30 MM$/yr. capital budget)
• 2017 activity was reduced to defer capital spending in low a commodity price environment and to refocus on higher net back liquids weighted opportunities
• Refocused drilling to the Wayne area to target better economics through higher liquids rate
• Attractive Waterflood, Granite Wash and future Slave Point development opportunities at Evi
• Increased Princess footprint • Multiple M&A targets in close proximity to focus areas
POSITIONEDFOR GROWTH
7

8
2017 RESERVES HIGHLIGHTS
Reserve Category(1)(4)Volumes Value (Btax)
Oil (mbbl) Gas (mmcf) NGL (mbbl) Total (mboe) NPV10 ($m)
Proved developed producing 6,305 11,302 280 8,469 150,439
Proved developed non-producing 328 2,147 24 710 7,290
Proved undeveloped 4,074 5,839 125 5,172 50,097
Total proved 10,707 19,288 429 14,351 207,826
Probable 4,639 9,073 176 6,327 90,640
Total proved plus probable 15,346 28,361 605 20,678 298,4660.100
0.110
0.120
0.130
0.140
0.150
0.160
0.170
0.180
0.190
1P 2P
2016 2017
10% YoY Increase
13% YoY Increase
ABILITY TO INCREASE RESERVES PER SHARE IN A CHALLENGING
ENVIRONMENT(1) Sproule Report, effective December 31, 2017; company interest gross reserves(2) Sproule Report, effective December 31, 2016; company interest gross reserves(3) Per share numbers based on basic shares outstanding at December 31(4) Columns may not add due to rounding
Reserves per BOE/Share(1)(2)(3)

9
• 2018 estimated capital program of ~$26 million* (flexibility to increase, depending on commodity prices and results)
• Cash flow, hedges and access to capital support growth plans
Average Type Well Economics*(1)PrincessDetrital
Princess Glauconite
Wheatland Wayne
Evi Granite Wash drill
EVI Waterflood
Drill, Complete, Equip & Tie-in ($MM) $0.7 $1.6 $1.5 $1.1 $1.0
Production, IP30 (boe/d) 65 boe/d 180 boe/d 350 boe/d 66 boe/d n/a
Production, IP365 (boe/d) 45 boe/d 130 boe/d 180 boe/d 55 boe/d 60 boe/d
EUR (mboe) 55 mboe 150 mboe 260 mboe 133 mboe 150 mboe
Rate of return (%) 73% 60% 40% 106% 40%
Payout (years) 1.2 yrs 1.4 yrs 1.9 yrs 1.7 yrs 2.5 yrs
Finding and development cost ($/boe) $13.55/boe $10.69/boe $5.77/boe $8.41/boe $7.49/boe
Operating netback ($/boe) $35.00/boe $29.00/boe $15.00/boe $43.00/boe $40.00/boe
Recycle ratio 2.6 2.7 2.6 5.1 5.3
* Note: See Oil and Gas Metrics and Non-IFRS Measures Advisories on slide 24(1) Based on Jan 15, 2018 strip pricing – average 2018 WTI – US$63.00/bbl, AECO - C$1.43/mcf, WCS - C$51.50/bbl, Edmonton Light to WTI differential - C$6.00/bbl and USD/CAD FX - $0.81
ATTRACTIVE ECONOMICS & INVENTORY

10
• Drilling program allocated across core areas at Wheatland, Princess and Evi
• 2018 estimated capital program of approximately $26 million*
Core Area Capex
Wheatland / Wayne $9 MMPrincess $10 MMEvi Drilling $3 MMEvi Waterflood $4 MMTotal $26 MM
• Business development opportunities can supplement accretive organic growth
• Strong balance sheet and access to capital supports M&A
CORE AREA DEVELOPMENT
* $26 million 2018 capital program does not include ARO or capitalized G&A
11
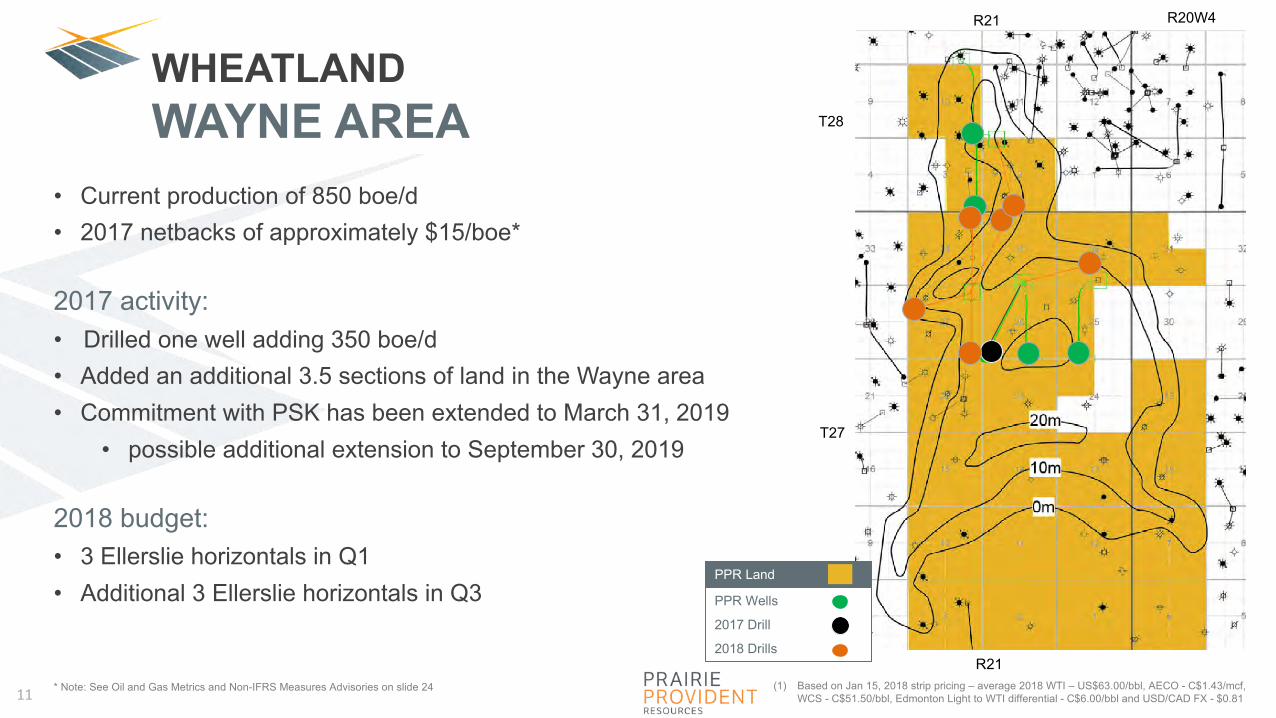
• Current production of 850 boe/d• 2017 netbacks of approximately $15/boe*
2017 activity: • Drilled one well adding 350 boe/d • Added an additional 3.5 sections of land in the Wayne area• Commitment with PSK has been extended to March 31, 2019
• possible additional extension to September 30, 2019
2018 budget:• 3 Ellerslie horizontals in Q1• Additional 3 Ellerslie horizontals in Q3
(1) Based on Jan 15, 2018 strip pricing – average 2018 WTI – US$63.00/bbl, AECO - C$1.43/mcf, WCS - C$51.50/bbl, Edmonton Light to WTI differential - C$6.00/bbl and USD/CAD FX - $0.81
* Note: See Oil and Gas Metrics and Non-IFRS Measures Advisories on slide 24
PPR Wells
2017 Drill
2018 Drills
PPR Land
T27
T28
R21
R21 R20W4
WHEATLANDWAYNE AREA

12
• Capital: $1.5 million/well
• IP30: 350 boe/day
• EUR: 260 Mboe
• Operating Netback: $15.00/boe
• NPV10: $740,000 /location
~700 boe/d
(1) Based on Jan 15, 2018 strip pricing – average 2018 WTI – US$63.00/bbl, AECO - C$1.43/mcf, WCS -C$51.50/bbl, Edmonton Light to WTI differential - C$6.00/bbl and USD/CAD FX - $0.81
* Note: See Oil and Gas Metrics and Non-IFRS Measures Advisories on slide 24
0
50
100
150
200
250
300
350
0 5 10 15 20 25 30 35
Prod
uctio
n (b
oe/d
)
Producing Months
Ellerslie Type Well
WAYNE AREAECONOMICS
ROR: 40%(1)
Payout: 1.9 yearsRecycle Ratio: 2.6
Average Type Well Economics*
13
PRINCESS
(1) Based on Jan 15, 2018 strip pricing – average 2018 WTI – US$63.00/bbl, AECO - C$1.43/mcf, WCS - C$51.50/bbl, Edmonton Light to WTI differential - C$6.00/bbl and USD/CAD FX - $0.81
PPR lands
Newly Acquired Lands
Well Locations
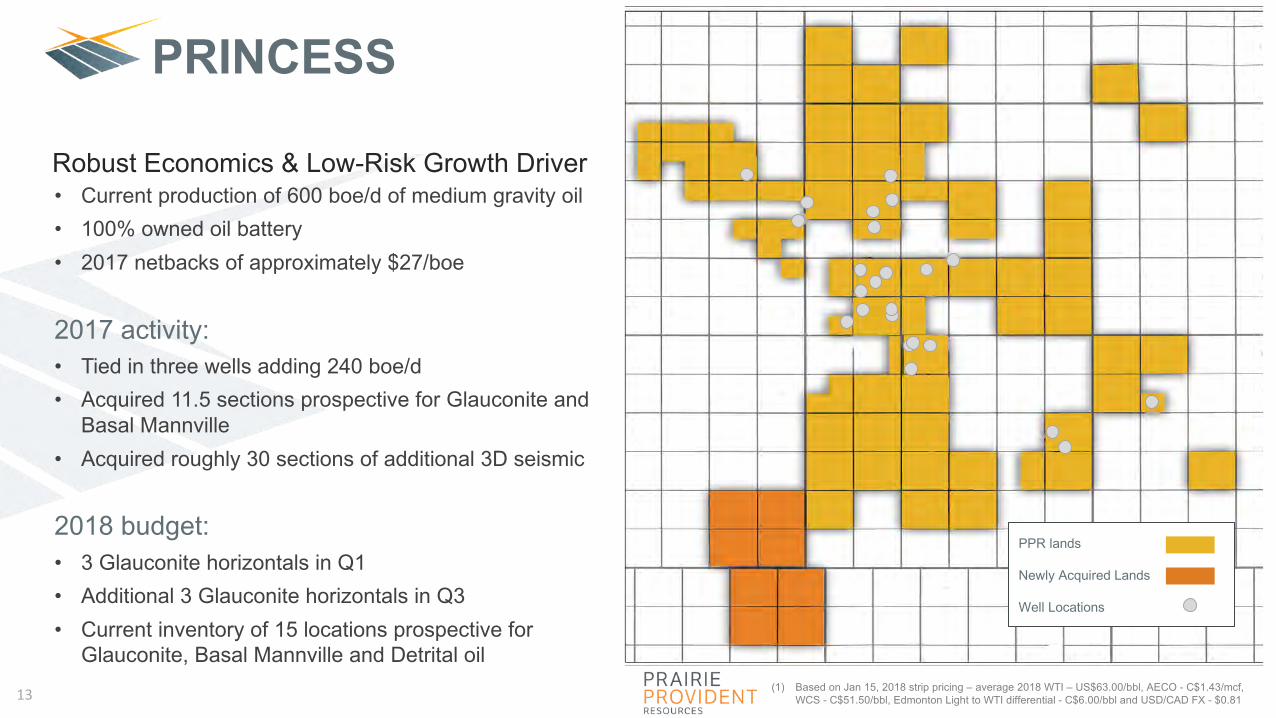
• Current production of 600 boe/d of medium gravity oil • 100% owned oil battery• 2017 netbacks of approximately $27/boe
2017 activity:• Tied in three wells adding 240 boe/d• Acquired 11.5 sections prospective for Glauconite and
Basal Mannville• Acquired roughly 30 sections of additional 3D seismic
2018 budget:• 3 Glauconite horizontals in Q1• Additional 3 Glauconite horizontals in Q3• Current inventory of 15 locations prospective for
Glauconite, Basal Mannville and Detrital oil
Robust Economics & Low-Risk Growth Driver

14
0
20
40
60
80
100
120
140
160
180
200
1 3 5 7 9 11 13 15 17 19 21 23 25 27 29 31 33 35 37
Prod
uctio
n (b
oe/d
)
months
Glauconite Type Well
ROR: 60%(1)
Payout: 1.4 yearsRecycle Ratio: 2.7
* Note: See Oil and Gas Metrics and Non-IFRS Measures Advisories on slide 24
• Capital: $1.6 million/well
• IP30: 180 boe/day
• EUR: 150 Mboe
Average Type Well Economics*
PRINCESS AREA
(1) Based on Jan 15, 2018 strip pricing – average 2018 WTI – US$63.00/bbl, AECO - C$1.43/mcf, WCS -C$51.50/bbl, Edmonton Light to WTI differential - C$6.00/bbl and USD/CAD FX - $0.81

15
Impact• 1.4 MMboe of incremental oil reserves have been booked as a
result of waterflood efforts to date; opportunity to increase further• 4 additional injectors to be online in Q1 2018 with an additional
4 conversions planned during the remainder of the year
Future Potential:• With Evi area acquisition completed in Q1 2017 we have
increased waterflood development potential
RPS study found:• 2% recovery factor (RF) to date• Potential for 9% RF with water flood development• Incremental EUR* potential from waterflood ~6.8 MMbbl• Study was completed in 2015 and will be updated based on
activity to date and to include new land acquisition
FULL FIELD (EVI MAIN) WATERFLOOD DEVELOPMENT
* Note: See Oil and Gas Metrics and Non-IFRS Measures Advisories on slide 24 and Reserves Data Disclosures Advisories on slide 25.
Cumulative Oil Production
Oil
(bbl
/d)/I
nj. (
x10b
bl/d
)/GO
R (s
cf/b
bl)

16
• Declines have been arrested where waterflood has been introduced• Significant room for flood expansion on existing land base• Low-cost mechanism to add reserves and production
Waterflood AreaWaterflood SLVP Producers
Non-waterflood SLVP Producers
WATERFLOODRESULTS
0
500
1,000
1,500
2,000
2,500
3,000
3,500
4,000
4,500
Jan-14
Mar-14
May-14
Jul-1
4
Sep-14
Nov-14
Jan-15
Mar-15
May-15
Jul-1
5
Sep-15
Nov-15
Jan-16
Mar-16
May-16
Jul-1
6
Sep-16
Nov-16
Jan-17
Mar-17
May-17
Oil
Prod
uctio
n (b
bl/d
) CD Rate bbl/d35% annual decline25% annual decline15% annual decline
EviSlavePt.ProductionDecline- 225operatedwells(includesbothwaterfloodandnon-waterfloodareas)

17
ST. LAWRENCE LOWLANDS: QUEBECCALL OPTION ON NATURAL GAS DEVELOPMENT
• 309,620 gross (241,884 net) acres in the St. Lawrence Lowlands
• Prospective for the Utica Shale
• Close proximity to major markets has historically provided for premium product pricing compared to NYMEX for natural gas produced from the area
• Drilling suspended since 2011 pending development of the provincial energy policy and regulation
• Quebec Petroleum Resources Act recently enacted to establish new regime for oil and gas exploration and development
St. Lawrence Lowlands of QuebecChamplain#1(100%WI)Operator:PPR
Becancour #8(100%WI)Operator:PPR
St-Francois-du-Lac#1(60%WI)Operator:PPRSt-Francois-du-LacHZ#1(60%WI)Operator:PPR
St-LouisRichelieuHZ#1(60%WI)Operator:PPR
St-DenisRichelieu#1(60%WI)Operator:PPR

18
2018 OUTLOOKCurrent Estimates(1)*
Average production (boe/d) 5,200 – 5,600
% liquids weighting 68% - 71%
Operating netback ($/boe) 20.50 - 22.00
Forecast Adjusted EBITDAX* ($millions) 27 - 30
Royalties (%) 15%
Operating expenses ($/boe) $17.00 - $18.50
Capital expenditures(2) ($millions) ~ 26
(1) Based on Jan 15, 2018 strip pricing – average 2018 WTI – US$63.00/bbl, AECO - C$1.43/mcf, WCS - C$51.50/bbl, Edmonton Light to WTI differential - C$6.00/bbl and USD/CAD FX - $0.81
(2) 2018 $26 million 2018 capital program does not include ARO or capitalized G&A
* Note: See Oil and Gas Metrics and Non-IFRS Measures Advisories on slide 24 and Forward Looking Information on slide 25

19
WHY INVEST IN PPRCompelling value opportunity ~38%
PPR trading at
of PDP NPV10(2) (Btax)
* Note: See Oil and Gas Metrics and Non-IFRS Measures Advisories on slide 24(1) Based on Jan 15, 2018 strip pricing – average 2018 WTI – US$63.00/bbl, AECO - C$1.43/mcf, WCS -
C$51.50/bbl, Edmonton Light to WTI differential - C$6.00/bbl and USD/CAD FX - $0.81(2) Based on Sproule Associates Limited’s forecase prices as at December 31, 2017
Focused on returns• Disciplined approach to capital allocation and focus on projects that provide the highest IRR
• Asset portfolio provides returns ranging from 40% - 106%(1) in current price environment, supporting organic growth and development
Oil-weighted, low-risk asset base • >5 years identified development drilling opportunities*
• Light oil waterflood project at Evi offers attractive economics + significant reserves addition potential
• High working interest and operatorship allows control over pace of development
Financial flexibility • Total Debt (net of cash on hand) of $52 MM representing 1.7x debt / next twelve-month EBITDAX*• Strong hedge position (60%, 45% and 25% of base net production for 2018, 2019 and 2020, respectively• Remain focused on prudent capital management and will scale our 2018 budget depending on commodity prices

20
COMPELLING OPPORTUNITYPROVEN ASSETS, COMMITTED TEAM, STRONG TORQUE TO OIL PRICES
(1) Source: Bloomberg, Mackie Research Capital as at September 5, 2017(2) Companies included above: SRX, BXE, RMP, GXO, EGL, SGY, TVL, JOY,DEE, GXE, ATU
Current valuation presents attractive entry point
2017 EV / DACF Comparatives 2017 EV / Production Comparatives
0.0x
1.0x
2.0x
3.0x
4.0x
5.0x
6.0x
7.0x
8.0x
9.0x
EV /
2017
E D
AC
F (x
)
$0
$10,000
$20,000
$30,000
$40,000
$50,000
$60,000
EV /
2017
E Pr
oduc
tion
($/b
oe/d
)

21
ACTIVE RISK MANAGEMENT45% hedged
of forecast 2019 base volumes (net of royalties) 60% hedged
of forecast 2018 base volumes (net of royalties)
Commodity Contract Reference Notional Quantity Remaining Term Weighted Average Price
Oil (bbl/d) Swap WTI ($USD) 1,050 Cal 2018 56.09Swap WTI ($USD) 510 Cal 2019 52.74Swap WTI ($USD) 419 Cal 2020 50.96Collar WTI ($USD) 675 Cal 2019 51.48 x 58.78Collar WTI ($USD) 175 Cal 2020 49.00 x 54.75
Sold Call WTI ($USD) 500 Cal 2018 (65.00)Sold Call WTI ($USD) 400 Cal 2020 (60.50)
Collar WTI ($CAD) 800 Cal 2018 58.00 x 67.50Sold Call WTI ($CAD) 400 Cal 2019 (85.00)
Gas (GJ/d) Swap AECO ($CAD) 4,000 Q1 2018 2.99Swap AECO ($CAD) 1,500 Q3 - Q4 2018 2.76Swap AECO ($CAD) 3,000 Q1 2019 2.73
Sold Call AECO ($CAD) 1,500 Cal 2018 (2.76)

22
SUMMARYOIL-WEIGHTED GROWTH ENGINE
FUTURE GROWTHSizeable drilling inventory for organic growthConsolidation opportunities in core areasLow maintenance capital requirements
LIQUIDITYDevelopment funded with future operating cash flows$11 MM (US$9 MM) available on $70 MM credit facilitySteady cash flows from low-decline assets
ATTRACTIVE ASSETS~5,000 boe/d current production~70% oil and liquids weighted~60% of 2018 base production is hedged, economic netbacks and returns in current environment
$298.5 MMTotal Proved NPV10(1)
20.7 MMboeTotal Proved Reserves(1)
Oil & liquids focused E&P company executing a returns-based growth strategy
(1) See Reserves Data Disclosure Advisories on slide 25

Prairie ProvidentCorporate Information
PrairieProvidentResources1100,640– 5thAvenueSWCalgary,AlbertaT2P3G4
EMAIL/WEB:
STOCKEXCHANGELISTING:TSX:PPR
LEGALCOUNSEL:BennettJonesLLP
RESERVEENGINEERS:SproulePartnersLimited
HEADOFFICE
INVESTORRELATIONS:5QuartersInvestorRelationsInc.
PHONE:+1.403.292.8000

24
Oil and Gas Metrics and Non-IFRS Measures. This presentation includes reference to certain measures commonly used in the oil and gas industry but which do not have standardized meanings or methods of calculation under International Financial Reporting Standards (IFRS), the COGE Handbookor applicable law. Accordingly, such measures, as determined by the Company and presented in this presentation (or in other documents published by Prairie Provident), may not be comparable to similarly defined or described measures presented by other entities, and should not be used for anysuch comparisons. The following measures are provided as supplementary information by which readers may wish to consider the Company's performance, but should not be relied upon for comparative or investment purposes.Operating Netback. The Company calculates operating netback as production revenues (excluding realized and unrealized gains and losses on commodity hedging) less royalties and operating expenses, divided by gross working interest production (on a boe basis). Management considersoperating netback to provide a useful measure for evaluating operational performance at the oil and gas lease level, as an indicator of field-level profitability relative to current commodity prices.EBITDAX.PrairieProvidentmonitorsitscapitalstructureandliquiditybasedonadebt-to-EBITDAXratio,whichprovidesameasureofits abilitytomanageitsdebtlevelsundercurrentoperatingconditions. Forpurposesofthiscalculation,"debt"referstoborrowingsundertheCompany'screditarrangements,while"EBITDAX"correspondstodefinedtermsundertheCompany'screditagreementsandmeansnetearningsbeforefinancingcharges,foreignexchangegain(loss),E&Eexpense,incometaxes,depreciation,depletion,amortization,othernon-cash expenseitemsandnon-recurringitemsoverthemostrecentfourconsecutivefiscalquarters,adjustedformajoracquisitionsandmaterialdispositions assumingthatsuchtransactionshadoccurredonthefirstdayoftheapplicablecalculationperiod.AdjustedEBITDAX"AdjustedEBITDAX"correspondstodefinedtermsundertheCompany'screditagreementsandmeansEBITDAX(definedabove)asadjustedformajoracquisitionsandmaterialdispositionsassumingthatsuchtransactionshadoccurredonthefirstdayoftheapplicablecalculationperiod.ManagementbelievesthistobeausefulsupplementalmeasureforassessingPrairieProvident'soperationalperformanceonacontinuingbasisbyeliminatingcertainnon-cashchargesandchargesthatarenon-recurring,andutilizesthemeasuretoassesstheCompany'sabilitytogeneratethecashnecessarytofinanceoperatingactivities,capitalexpendituresanddebtrepayments.AdjustedEBITDAXaspresenteddoesnotandisnotintendedtorepresent,andshouldnotbeconsideredanalternativetoormoremeaningfulthan,cash flowfromoperatingactivities,netearningsorothermeasuresoffinancialperformancecalculatedinaccordancewithIFRSFundsfromOperations.TheCompanycalculatesfundsfromoperationsascashflowfromoperatingactivities(asdeterminedinaccordancewithIFRS)adjustedforchangesinnon-cashworkingcapital,transactioncosts,restructuringcosts,decommissioningexpendituresandothernon-recurringitems.ManagementbelievesthistobeausefulsupplementalmeasureforassessingPrairieProvident'soperationalperformanceonacontinuingbasisbyeliminatingcertainnon-cashchargesandchargesthatarenon-recurring,andutilizesthemeasuretoassesstheCompany'sabilitytogeneratethecashnecessarytofinanceoperatingactivities,capitalexpendituresanddebtrepayments.Fundsfromoperationsaspresenteddoesnotandisnotintendedtorepresent,andshouldnotbeconsideredanalternativetoormoremeaningfulthan,cashflowfromoperatingactivities,netearningsorothermeasuresoffinancialperformancecalculatedinaccordancewithIFRS.Reserve Life Index. Reserve life index (RLI) is calculated by dividing total company share reserves by annualized production. RLI provides a summary measure of the relative magnitude of the Company's reserves through an indication as to how long they would last based on a current, annualizedproduction rate and assuming no additions to reserves.F&D Costs. Prairie Provident calculates F&D (finding and development) costs for a particular period by dividing the sum of all capital costs for the period (except capitalized general and administrative expenses) and change in estimated future development costs by the change in reserves relating todiscoveries, infill drilling, improved recovery, extensions and technical revisions for the same period. Management considers F&D costs to provide a useful measure of capital efficiency.Recycle Ratio. The Company calculates recycle ratio by dividing operating netback per share by F&D costs for the period. Management considers recycle ratio to be a useful measure for capital deployment and comparing the cost of replacement reserves against produced reserves.Financial Outlook Information. Information in this presentation regarding 2017 forecast adjusted EBITDAX constitutes a financial outlook within the meaning of applicable Canadian securities laws, and is also forward-looking information subject to the cautionary statements under "Forward-Looking Information" below. See also "Oil and Gas Metrics and Non-IFRS Measures" above. Such financial outlook is made as of the date hereof and is provided for the sole purpose of describing the Company's internal expectations as to its ability to generate funds necessary to finance operatingactivities, capital expenditures and debt repayments. The financial outlook information contained herein should not be used, and may be inappropriate for, any other purpose.Drilling Inventory and Locations. This presentation refers to drilling inventory and drilling locations or opportunities. Drilling inventory is expressed in years and is based on identified drilling locations and internal estimates regarding pace of drilling activity. Drilling locations include (i) provedlocations, being those for which Sproule has attributed proved reserves in its current evaluation report under NI 51-101, (ii) probable locations, being those for which Sproule has attributed probable reserves in its current evaluation report under NI 51-101, and (iii) unbooked locations, being thosefor which there are no attributed reserves but which the Company internally estimates can be drilled based on current land holdings, industry practice regarding well density, and internal review. Unbooked locations represent an estimation of multi-year drilling activity based on internal evaluationof geological, geophysical, seismic, engineering, production and resource information. There is no certainty that the Company will drill any particular locations, or that drilling activity on any locations will result in additional oil and gas reserves, resources or production. Locations on which theCompany in fact drills wells will ultimately depend upon the availability of capital, regulatory approvals, seasonal restrictions, commodity prices, costs, actual drilling results, additional reservoir information and other factors.Type Well Information. This presentation provides indicative information regarding type wells for the Company. Type well information reflects Prairie Provident's current operating experience in relation to wells of the indicated types, including with respect to costs, production and decline rates,and reflects commodity price forecasts based on January 15, 2018 strip pricing that contemplates an average 2018 WTI price of US$63.00 and AECO price of Cdn$1.46/mmbtu. There is no assurance that actual well-related results will be in accordance with those suggested by the type wellinformation. Actual results will differ, and the difference may be material. The type well information includes estimated ultimate recovery (EUR), which is not a resource category or defined term under NI 51-101 or the COGE Handbook. EUR refers to the quantity of petroleum estimated to bepotentially recoverable from an accumulation, plus quantities already produced therefrom. EUR estimates reflect type curve information based on internal empirical data and publicly available information sources believed to be independent but which the Company cannot confirm was prepared bya qualified reserves evaluator or in accordance with the COGE Handbook. EUR volumes are not reserves. There is no assurance that EUR volumes are recoverable or that it will be commercially viable to produce any portion thereof. The presentation discloses well-flow test rates of production forcertain wells and initial production (IP) rates for type wells. Test results and initial production rates are not necessarily indicative of long-term well or reservoir performance or of ultimate recovery. Actual results will differ from those realized during testing or an initial short-term production period,and the difference may be material.Barrel of Oil Equivalent (boe). Production and reserves information in this presentation is provided on a barrel of oil equivalent (boe) basis, with natural gas volumes converted to a boe measure at a ratio of six thousand cubic feet to one barrel. Boes may be misleading, particularly if used inisolation. A boe conversion ratio of six mcf (six thousand cubic feet) to one bbl (one barrel) is based on an energy equivalency conversion method primarily applicable at the burner tip and does not represent a value equivalency at the wellhead or at the plant gate. Although the 6:1 conversion ratiois an industry accepted norm, it is not reflective of price or market value differentials between product types. Based on current commodity prices, the value ratio between natural gas and oil is significantly different than the 6:1 ratio based on energy equivalency. Accordingly, a 6:1 conversion ratiomay be misleading as an indication of value.
Oil and Gas Metrics and Non-IFRS Measures
ADVISORIES

25
ADVISORIESForward-Looking Information. Certain information included in this presentation constitutes forward-looking information within the meaning of applicable Canadian securities laws. Statements that constitute forward-looking information relate to future performance, events orcircumstances, and are based upon internal assumptions, plans, intentions, expectations and beliefs. All statements other than statements of current or historical fact constitute forward-looking information. Forward-looking information is typically, but not always, identified bywords such as "anticipate", "believe", "expect", "intend", "plan", "budget", "forecast", "target", "estimate", "propose", "potential", "project", "continue", "may", "will", "should" or similar words suggesting future outcomes or events or statements regarding an outlook. Inparticular, this presentation includes forward-looking information regarding: drilling inventory and future drilling locations; the Company's target debt-to-EBITDAX ratio; forecast funds from operations for 2018; reserve life index (RLI); future M&A opportunities; type welleconomics (including estimated ultimate recovery); estimated capital program for 2018; future exploration and development activity (including 2018 drilling plans at Wheatland and future vertical well development opportunities at Evi); expectations with respect to furtherhedging activity; estimated average production, liquids weighting, operating netback, royalty rate, operating expenses, general and administrative costs and capital expenditures for 2018; and expected benefits of Evi waterflood initiatives.The forward-looking information in this presentation reflects expectations and assumptions of Prairie Provident regarding, among other things: commodity prices and foreign exchange rates for 2018 and beyond; the timing and success of future drilling, development andcompletion activities (and the extent to which the results thereof meet Management's expectations); the continued availability of financing (including borrowings under the Company's credit facility) and cash flow to fund current and future expenditures, with external financingon acceptable terms; future capital expenditure requirements and the sufficiency thereof to achieve the Company's objectives; the performance of both new and existing wells; the stability of production from Prairie Provident's properties and capital and operating costs inrespect thereof; the timely availability and performance of facilities, pipelines and other infrastructure in areas of operation; the geological characteristics and quality of Prairie Provident's properties and the reservoirs in which the Company conducts oil and gas activities(including field production and decline rates); successful integration of acquired assets into the Company's operations; the successful application of drilling, completion and seismic technology; future exploration, development, operating, transportation, royalties and other costs;the Company's ability to economically produce oil and gas from its properties and the timing and cost to do so; the predictability of future results based on past and current experience; prevailing weather conditions; prevailing legislation and regulatory requirements affectingthe oil and gas industry (including royalty regimes); the timely receipt of required regulatory approvals; the availability of capital, labour and services on a timely and cost-effective basis; the creditworthiness of industry partners; the ability to source and complete acquisitions;and the general economic, regulatory and political environment in which the Company operates.Although Prairie Provident believes that its underlying expectations and assumptions are reasonable based on currently available information, undue reliance should not be placed on forward-looking information, which is inherently uncertain, depends upon the accuracy of suchexpectations and assumptions, and is subject to known and unknown risks, uncertainties and other factors, both general and specific, many of which are beyond the Company's control, that may cause actual results or events to differ materially from those indicated or suggestedin the forward-looking information. Prairie Provident can give no assurance that the forward-looking information contained herein will prove to be correct or that the expectations and assumptions upon which they are based will occur or be realized. Actual results will differ,and the differences may be material and adverse to the Company. Relevant risk factors include, but are not limited to: risks inherent to oil and gas exploration, development, exploitation and production operations and the oil and gas industry in general, including geological,technical, engineering, drilling, completion, processing and other operational problems and potential delays, cost overruns, production or reserves loss or reduction in production, and environmental, health and safety implications arising therefrom; uncertainties associated withthe estimation of reserves, production rates, product type and costs; adverse changes in commodity prices, foreign exchange rates or interest rates; the ability to access capital when required and on acceptable terms; increases in future costs of capital; the ability to securerequired services on a timely basis and on acceptable terms; increases in operating costs; unexpected capital cost requirements; environmental risks; changes in laws and governmental regulation (including with respect to royalties, taxes and environmental matters); adverseweather or break-up conditions; competition for labour, services, equipment and materials necessary to further the Company's oil and gas activities; and changes in plans with respect to exploration or development projects or capital and operating costs in respect thereof. Theseand other risks are discussed in more detail in the Company's current annual information form and other documents filed by it from time to time with securities regulatory authorities in Canada, copies of which are available electronically under Prairie Provident's issuer profile onthe SEDAR website and on the Company's website at www.ppr.ca. This list is not exhaustive.The forward-looking information contained in this presentation is made as of the date hereof and Prairie Provident undertakes no obligation to update publicly or revise any forward-looking information, whether as a result of new information, future events or otherwise, unlessrequired by applicable securities laws. All forward-looking information contained in this presentation is expressly qualified by this cautionary statement.
Forward Looking Information
Reserves Data DisclosureReserves Data Disclosure. Figures provided in this presentation as to Prairie Provident's proved reserves and probable reserves volumes, and net present value of related future net revenue, are estimates of such volumes and values as at December 31, 2017 based on evaluations by Sproule Associates Limited("Sproule"), the Company's independent qualified reserves evaluator, of the Company's reserves data which evaluation was effective December 31, 2017. Sproule's evaluations were in accordance with NI 51-101 and, pursuant thereto, the standards contained in the Canadian Oil and Gas Evaluation Handbook("COGE Handbook").
Information in this presentation regarding the Company's estimated reserves, net present value of related future net revenue, and production is expressed on a net Company interest basis, being its working interest (operating and non-operating) share after deduction of royalty obligations plus any royalty interest.Estimates of future net revenue are after deduction of royalties, operating costs, estimated well abandonment and reclamation costs and estimated future development costs, but without any provision for interest costs, debt service charges or general and administrative expenses.
The determination of oil and gas reserves involves estimating subsurface accumulations of oil, natural gas and natural gas liquids that cannot be measured in an exact manner. The preparation of estimates is subject to an inherent degree of associated risk and uncertainty, including factors that are beyond theCompany's control. The estimation and classification of reserves is a complex process involving the application of professional judgment combined with geological and engineering knowledge to assess whether specific classification criteria have been satisfied. It requires significant judgments based on availablegeological, geophysical, engineering, and economic data as well as forecasts of commodity prices and anticipated costs. As circumstances change and additional data becomes available, whether through the results of drilling, testing and production or from economic factors such as changes in product prices ordevelopment and production costs, reserves estimates also change. Revisions may be positive or negative. Reserves volumes attributed to the Company's properties and related future net revenue (and net present values thereof) are estimates only. There is no assurance that the estimated reserves can or will berecovered. Actual reserves may be greater or less than those estimated, and the difference may be material. Estimated net present values of future net revenue do not represent fair market value of the reserves. There is no assurance that the forecast prices and cost assumptions applied in evaluating the reserveswill be attained, and variances between actual and forecast prices and costs may be material.
References herein to (i) "PDP" reserves means proved developed producing reserves, (ii) "TP" reserves means total proved reserves, (iii) "P+P" reserves means proved reserves plus probable reserves, and (iv) "NPV10" means, with respect to reserves, net present value of estimated future net revenue related to thereserves, discounted at 10% per year.
Related Documents