DOCUMENT RESUME ED 025 21b 24 HE 000 310 By-Reisman. Arnold flow of Doctorate Holders Into College and University Staffs: A Computerized Study. Final Report. Wisconsin Univ., Milwaukee. Spons Agency-Office of Education (DHEW), Washington, D.C. Bureau of Research. Bureau No- BR-6-8133 Pub Date Oct 68 Contract- OEC- 3- 7-068133- 0257 Note- 33p. EDRS Price MF-$0.25 HC-$1.75 Descriptors-Employment Patterns, Employment Projections, *Engineers, *Graduate Study, *Higher Education, *Manpower Needs, *Manpower Utilization, Professional Occupations A conceptual and methematical model was developed to study the preparation of persons holding Bachelor's, Master's and Doctoral degrees and to discover the proportion of them who assume academic positions. Data were collected on the number of US and foreign engineering students enrolled, degrees granted and their employment in academic, industrial, governmental and other sectors of the national economy. The model, consisting of over 200 non-linear difference equations, was programmed for computer simulation and validation against data collected. It broke down the academic sector into undergraduate, master s, doctoral and post-doctoral programs; each of the other sectors were broken down according to the highest degree held by their employees. Project objectives included a study of the dynamics of employment in higher education, interrelationships of academically trained manpower with the rest of the economy, the usefulness of available data, the impact of inflow and outflow of foreign nationals on US economy, and the impact of development in educational technology upon the manpower redistributions in the economy. The overall aim was to determine future manpower needs and set national standards for higher education in order to meet those needs. Software problems which developed with the Burroughs B500 computer installation were not resolved and the simulation results were inconclusive. A supplementary final report will be submitted upon completion of current work. (WM)

Welcome message from author
This document is posted to help you gain knowledge. Please leave a comment to let me know what you think about it! Share it to your friends and learn new things together.
Transcript
DOCUMENT RESUME
ED 025 21b 24 HE 000 310
By-Reisman. Arnoldflow of Doctorate Holders Into College and University Staffs: A Computerized Study. Final Report.
Wisconsin Univ., Milwaukee.Spons Agency-Office of Education (DHEW), Washington, D.C. Bureau of Research.
Bureau No- BR-6-8133Pub Date Oct 68Contract- OEC- 3- 7-068133- 0257Note- 33p.EDRS Price MF-$0.25 HC-$1.75Descriptors-Employment Patterns, Employment Projections, *Engineers, *Graduate Study, *Higher Education,
*Manpower Needs, *Manpower Utilization, Professional Occupations
A conceptual and methematical model was developed to study the preparationof persons holding Bachelor's, Master's and Doctoral degrees and to discover theproportion of them who assume academic positions. Data were collected on thenumber of US and foreign engineering students enrolled, degrees granted and theiremployment in academic, industrial, governmental and other sectors of the nationaleconomy. The model, consisting of over 200 non-linear difference equations, wasprogrammed for computer simulation and validation against data collected. It brokedown the academic sector into undergraduate, master s, doctoral and post-doctoralprograms; each of the other sectors were broken down according to the highestdegree held by their employees. Project objectives included a study of the dynamics
of employment in higher education, interrelationships of academically trainedmanpower with the rest of the economy, the usefulness of available data, the impactof inflow and outflow of foreign nationals on US economy, and the impact ofdevelopment in educational technology upon the manpower redistributions in the
economy. The overall aim was to determine future manpower needs and set nationalstandards for higher education in order to meet those needs. Software problemswhich developed with the Burroughs B500 computer installation were not resolved andthe simulation results were inconclusive. A supplementary final report will be submitted
upon completion of current work. (WM)

FINAL REPORTProject No. 6-8133
Grant No. OEC 3-7-068133-0257
"FLOW OF DOCTORATE HOLDERS INTO COLLEGE
AND UNIVERSITY STAFFS: A COMPUTERIZED STUDY"
Arnold Reismae
University of Wisconsin
Milwaukee, Wisconsin
E D025216
October 1968
U.S. DEPARTMENT OFHEALTH, EDUCATION, AND WELFARE
Office of EducationBureau of Research
6-49.-(1r/ 33
=1614 &I aiC
ZCL. i....2 c tli1.61 Si Clg =Cit CO cmagg CD IAA
liti &A.. . II
5;Lm htti CO
iy., 41(7.3
Clg 0 u-941.1.1
5= totc)
.11,1!Iwig = sP"
=I C)CL 4,..0115= r= Cm). .c
L.., 4,LP" ,..7.: 6-=cl f.D 1,7Im .....I IAA gic4,.., ... 41.11,01X Liro.o 0=CO ii." au 71=CD gl.
:::Ig :C)32 lgiaj
ict -4-28k.,
ACaggCh.LirCM
IAA
Itta r=
tot 161"'" ...II tot
"a "=- oar =
1.4= IDIC c* CL.tar Ct
I
Z= otg 0 C)C) = 0CI 0 ea Itot uot p --= .Igg totE Li.1 p 0t... CI. tot CL.
Current affiliation is the Department of Operations Research,
Case Western Reserve University, Cleveland, Ohio
FINAL REPORTProject No. 6-8133
Grant No. OEC 3-7-068133-0257
"FLOW OF DOCTORATE HOLDERS INTO COLLEGE
AND UNIVERSITY STAFFS: A COMPUTERIZED STUDY"
Arnold Reisman
University of Wisconsin
Milwaukee, Wisconsin
October 1968
The research reported herein was performed pursuant to a Grant
with the Office of Education, U.S. Department of Health, Education,
and Welfare. Contractors undertaking such projects under Government
sponsorship are encouraged to express freely their professionaljudgment in the conduct of the project. Points of view or opinions
stated do not, therefore, necessarily represent official Office of
Education position or policy.
U.S. DEPARTMENT OFHEALTH, EDUCATION, AND WELFARE
Office of EducationBureau of Research

TABLE OF CONTENTS
Page
SUMMARY 1
INTRODUCTION 2
OBJECTIVES OF THIS STUDY 2
RESULTS 6
METHOD: MODEL DEVELOPMENT 6
SUGGESTED FUTURE EXTENSIONS OF THE MODEL 18
REFERENCES 22
APPENDIX 23
LIST OF TABLES
Table
1. FLOWRATES AND THE MAJOR INFLUENTIAL FACTORS 12
LIST OF FIGURES
Figure
1. THE LOCATIONS & FLOW PATHS OF PEOPLE WITH AN
ENGINEERING EDUCATION: A SYSTEMS SCHEMATIC .
2. THE LOCATION & FLOW PATHS OF PEOPLE WITHIN THE
UNDERGRADUATE SUBSECTOR AND THE INTERRELATION OF
SOCIO-ECONOMIC FACTORS WHICH "CONTROL" THE
POPULATION FLOWS
8
13
3. A TYPICAL SOCIO-ECONOMIC LOOP 14
4. THE LOCATION & FLOW PATHS OF PEOPLE WITHIN THE POST
BACCALAUREATE SUBSECTOR AND :THE INTERRELATION OF
SOCIO-ECONOMIC FACTORS WHICH "CONTROL" THE
POPULATION FLOWS
iii
19

5. THE LOCATION & FLOW PATHS OF PEOPLE WITHIN THE POST
MASTERS SUBSECTOR AND THE INTERRELATION OF
SOCIO-ECONOMIC FACTORS WHICH "CONTROL" THE
POPULATION FLOWS20
6. THE LOCATION & FLOW PATHS OF PEOPLE WITHIN THE-POST
DOCTORATE SUBSECTOR AND THE INTERRELATION OF
SOCIO-ECONOMIC FACTORS WHICH "CONTROL" THE
POPULATION FLOWS21
1 11

SUMMARY
The dynamiceffects of alternative manpower policies and
programs can be "Pretested" in a computer based simulation. Tt.is
generally recognized that the production of DOctorates Aapends to
a large degree on the Doctorate-holding facultY. Because the
doctorate holders are in great demand by the other.sectors of the
eCohomy, a circular ot a "feedback" 'situation existt. The ptobleM
is further complicateil by the availability of developed Student
taleht and by various socioeconomic Conditions existing at different
periods of time within twO or three decades to the time a study is
made.
This Study vieVeloped a conceptUal and a mathematical model to
study the prOduCtidin Of.DoCtoratet; flEasters and Baccalaureate
degtees and theit eedback into Itighet education. The model
consisting Of oVet 200ton-linear diffetehce eguatiOns.was ptogrammed
for cOmputer situlation and validation Against hittorical
Simulation attemptd t:io describe what nab 'happened in the pabt haVe
thus fat proveh intOttlneive: 'HoWeVet, these failures are
attributable to softwate problems ehcounteted with the Univetsity of
Wisconsin Butroughs B5500 computer installation. Curtently efforts
'are under way to resolVe these ptoblema and the study is continuing
albeit uhsupported. Once the above phase is accomplished, the Model
can be used to prescribe what will happen in the future with a fair
level Of confidence.
1

INTRODUCTION
The output of higher education in,general,and of the
professional schools in particular,has been a subject of concern
to various agencies of government, of foundations; both publid
and private,and to the professional associations involved for over
half of a century. Data regarding the number of students enrolled
and degrees granted have been diligently.collected, compiled,
classified and reported. On the other hand, data regarding the,
utilization of the graduates in academic positiOns,, industry,
government, etc., are much more sparse,although available. Data
regarding the retention within our economy of foreign nationals
who have successfully completed their schooling here is more sparse
yet, or more precisely unavailable, even though foreign nationals
comprise a large segment of the student body.in our professional
and/or postgraduate programs of study. It is in this setting that
planners are attempting to set national policy',concerning higher
and/or professional education in order to satisfy anticipated or
perceived needs.for trained talent in the years ahead.
Objectives of this:Study
The objectives of this-study are:
(1) To develop a simulation vehicle to pretestalternative manpower policies and programs.
(2) To study the dynamics of the higher education
sector within our society.
(3) To study the dynamic.interrelationship of the
various subsectors of higher education in the
rest of the economy.
(4) To study the usefulness of currently available
data and to indicate what additional data would
be useful in determining long-range policy and
planning.
(5) To determine the impact on our economy in general
(and the higher education sector in particular),of the inflow and outflow of people from other
nations.
2

(6) To study the possible impact of development in
the technology of education upon manpower
redistributions in the economy and the timing of
same (i.e., increases in student-faculty ratios)'..
During the last two decades attention has been turned to the
production and retention, within the higher educational sector Of
the economy, of people holding the doctorate degree. It .is
generally recognized that the production of doctorates depends.to
a large degree on the doctorate-holding faculty. Because the
doctorate holders, especially in the sciences, are in great demand
by the other sectors of the economy, a circular or a "feed-back"
situation exists. The problem is further Complicated by the
availability of developed student talent and by various socio-
economic conditions existing at different periods of time within
two or three decades prior to the time a study is nade. Various
studies of thede problems have been initiated by agencies of
government And by privately financed foundations.
In order to attempt to rectify an existing situation or
proVide for future needs, initiators of prograns are in need of 4
rational methodology to evaluate the effects of their programs.
Historical data and judgment have,not always yielded satisfying
bases for decisions. Both the military and industry are recognizing,
to an increasing degree, the need for quick and economical ways of
evaluating the Various effects of their deciaions. For this they
have turned to analytical methods. Computer-based simulation is
one method successfully used to study the dynamics of complex and
non-linear problems.
Bolt, Koltun and Levine (1) made the first attempt, in 1965,
to model and to study the dynamics of the problem at hand. Their
work was indeed landmark in nature, for it showed the advantages
of dynamic over statistical analysis of manpower problets while
recognizing that the two are not mutually exclusive. The above
model conceptually split the economy into two sectors, one sector
containing the entire educational establishment (Higher Education)
and the other the rest of the economy. The flaws of graduates
between these two sectors were established recognizing the fact
that Ph.D. holders do return to the academic sector to take up
faculty or administrative positions while others leave for industry,
government, etc. All of the flaws including the so-called .
"feedback" flows were described by two linear difference equations
which were simultaneously solved at various values of the equations'
parameters.
This highly aggregated approach was considered unjustifiable
by this investigator, inyiew of the inherent complexity of the
prOblem studied and,in light of modern computer capability to solve
large sets of differential or difference equations. Consequently,
a less aggregated model was proposed (2).
3

This model broke the educational sector up into four segments;undergraduate programs, master's programs, doctoral programs, and
post-doctoral programs. It broke the other sectors of society
employing college or university-trained people into segmentsaccording to the highest degree earned by those within the segment.
Furthermore, it showed the retirement and other attrition sectors
more or less as a sink outside of either of the above two sectors.
The model delineated the various possible paths for population
shifts between the segments.
In a manner similar to (1), (3) and (4) and to many works in
the physical sciences, it accounted for all the net flows to a
segment and the rate of accumulation of people within the segment.
The equations recognized the fact that degrees, especially
at the doctorate level, are not earned at a given time of the year
throughout society. Some sdhools operate on the semester basis,
others operate on a trimester, and yet others on the quarter system.
When aggregated, an assumption of continuity in flows seemed a
little more realistic than an assumption of discreteness, Thus,
the equations offered were differential, equations. Depending on
the postulates regarding lead-lag relationihips in the production
of the various degrees these equationsvere allowed to be
non-linear.
The basic advantages of that model over (1) were described in
outline as follows:
1) It recognized the input of students into the higher
education sector.
2) In the educational sector, it distinguished between
persons who have recently become engaged in the educational
function and persons who have worked in education for
many years.
3) It recognized that the relationships between the variables
involved were not necessarily linear in nature.
4) It distinguished between the use of doctorate holders in
education at the doctorate, master's and undergraduate
levels.
5) It considered the effect of the rates of production of
high school, bachelor and master's graduates in successively
preceding years.
6) It considered post-doctoral university prograns and the
interrelated flows from them to teaching at the various
levels and to the other sectors employing doctorates.
4

7) In as much as the rate of doctorate production has Changed
drastically during the last three decades, because of the
depression of the 1930's, World War II, and the postwar
and the cold-war periods, it emphasized that the age mix
is not,a uniform one. Thus, the number of degrees granted
some years prior (say ,30 or 35 years) is.the independent
variable used in calculating attrition in.that,model.
8) ,Concern for economic, social, and physical influences in
doctorate production and shifts in employment was.
acComodated.
A tangible result of this study was the rearrangement;
extension and modification of the above model. This latter veraion
of the model described in the following sectiOn and spelled out,in
detail in the Appendix to this report was discussed and revieWed
with colleagues in varilus settings. The first presentation took
place at the 14th international Meeting of the Institute of
Management Sciences which was held in Mexico city, August 22-25;
1967. (6) The next presentation took place at the "Operations
Analysis in Education" Symposium sponsored by the Office of Education
and held in Washington, D.C., November 19-22, 1967. The Fall issue
of the dournal, Socio Economic Planning Sciences, which is devoted
to the Proceedings of th4 conference, will carry the paper "On the
Generatioa of Doctorates and Their Feedback into Higher Education".
.A preSentation of this model was also made .at the "Engineering
Manpowei Planning Institute", which was held in Madison, Wisconsin,
January 8, 9, 1968. At all of these meetings this model generated
quite a bit. of -active discussion resulting in several additional
Changes of the model.
Unlike its predecessor, this model separates out the student
and the faculty subsectors within the academic sector and does this
at all levels of educational attainment. It provides for inflows as
well as outflows of foreign nationals at various leliels of attain-
ment.1 This model explicitly p4ovides for the psyChological,
sociological and economiC factors which influence the movement of
personnel from one sector to another within our economy. It
furthermore is exprilssed in tarms of pifference" types of equations
as opposed to differential equations.
1This extension was suggested by Dr. Lindsey Harmon, Director
of Research, Office of Scientific Personnel, National Academy of
Sciences National Research Council.
2The change from differential to difference equations was
necessitated by the availability of the DYNAMO compiler for the
B 5500 computer. Although difference equations are used, the time
increMent considered is relatively short, specifically it is 1
calendar.month.
5

A detailed description of this model ie Elven in Appendix I
to this report.
RESULTS
Because of the soLmare problems with the Burroughs B 5500computer which was the only computer, large enough for the purpose
available to us at the University of Wisconsin, this investigatorregrets to report that,no useful simulation runs are as yet
aVailable. Although the project grant has run its course,' work is
still continuing on the project, albeit at the principalinvestigator's new location, the Department of Operations Research,
Case Western Reserve Uniyersity, Cleveland, Ohio. Two graduate
students are working with the principal investigator on this
project. Current work involves the simultaneoUS progtamming of
this model for solution on either the Univac 1108 coMputer or the
IBM 360-40 machines,' it ts the investigator's intent to submit asupplementary final report, on this wotk as soon:as the simulation
has been completed resulting in substantive or new insights to the
problem.
METHOD: MODEL DEVELOPMENT
Figure 1 describes all of the sectors and subsectors of our
economy and the paths through which population shifts may take
place. In moving upward along the diagram ye find that the.lowedt
layer in Figure 1 symbolically houses all personnel who are eitherstudying for the Bachelors Degree (subsector 51) or who have dropped
out after some university or college training and are in industry
(Subsector P1). The non-degree holders layer allows for three types
of personnel inflows. Thus,.high school students can enter the
student subsector via the H1S1 path. Similarly, high school
graduates from other nations-can enter the same Subsector via the
flow path labeled E1S1. The model alloWs for foreign nationals
who have had some college or university training but who.have hotattained the equivalent of. a Bachelors Degree to enter the model
via the path ElPl. It was a matter of convenience to allow these
people to enter only into the professional (PI) subsector. It is
fully recognized that many of these people may, in fact, enter the
country with the intention of stUdying further toward a Bachelors
Degree and this may, in fact, be the predominant majority of such
entrants. It was felt that in due time these people will, in fact,
enter the student sector within the model. The availability of
data, or better, the lack thereof, justifies this Simplifying
assumption in the construction of the model. Using similar
reasoning, it was felt that all non-achievers who leave the country
prior to Obtaining their Bachelors Degree will leave via the
professional subsector rather than leaving directly ftom the student
subsector. The flaw P1E1 allows for all foreign nationals with some

undergraduilteeducation to leave the country. The two remaining
flows out ol layer number 1 allow for the students who have, in
fact, dbtained the Bachelors Degree to move out and go on to anyone
of the three subsectors in layer 2 which contains all personnel
holding a Bachelors Degree.
-Before moving into layer 2, however, we must account for all
those people who leave layer 1 as the result of retirement or
attrition. These are basically people who have completed their
useful economic lives either as technicians or supporting personnel
and are leaving the productive economy into permanent and complete
retirement. The flow which allows for this to take place Is PlRi.
Layer 1 allows for two intra-layer flaws, specifically flow S1P1
which channels all of the students who have dropped out into the
professional or productive subsector Pl. Similarly, flow P1S1
allows for students who have at ane time dropped out to reenter the
academic or student subsector S1 in order to continue their studies
for the Bachelors Degree. It should be noticed that subsector P1
represents that part of the economy, be it government, industry,
commerce, or whatever, which employs people having some college
training but no degree.
The interlayer flows can only come, in this model, from the
student subsector of the layer.below. Thus, all those who have
successfully completed their Baccalaureate studies leave subsector
S1 in layer 1 and move on to either of the three subsectors in
layer 2. Layer 2, representing all those who do hold a Bachelors
Degree but no more, differs from layer 1 in that within this layer
there are three subsectors. In addition to subsector S2, which
represents all students studying for a Masters Degree,and subsector
P2 which represents all those holding a Bachelors Degree but not more
who are productively employed by our society in all areas other than
university or college-level teaching, subsector F2 houses all
Bachelors holders who hold no higher degree and 'Who are employed in
an academic capacity within higher education.
Layer number 2 allows for only two inflows. Recent graduates
With a Bachelors Degree from the layer below and foreign nationals
.who enter the country holding a Bachelors Degree (E2P2). Again,
in this case as in layer 1,the assumption was made that all foreign
nationals enter through the professional subsector Similarly, all
foreign nationals who leave this country holding a Bachelors Degree,
but no more,leave through the professional subsector of layer 2 (P2).
In this case, retirement is allowed both from the professional
subsector, namely P2R2 and also from the faculty or academic sub-
sector, namely F2R2. It was felt that the retirment age of academics
was generally somewhat different than the retirement age of people
from industry or from government. Hence, the two flows were
separated.
7

E4P4P4E4
P4F4
DOCTORATE DEGRE HOLDERS
S34
E3P3ra- P3E3
S3F3
MASTERS DEGREE- -HOLDERS /-------E2P2P2E2
S23
P4R4
F4R4
P3R3
F3R3
S2F2 F2R2
BACHELOR DEGREE HOLDERS
H1§1.E1S1
E1P1
r:-p1E1
Sin
NON-DEGREE HOLDERS
P1R1
S-STUDENTP-PROFESSIONALSF-FACULTYE-EXTERNAL
(FOREIGNERS)R-RETIREMENT
Figure 1
The Locations & Flow Paths of People with
an Engineering Education: A Systems Schematic
8

In layer 2 there are not two but six possible intralayer
flows. In addition to the population shifts between the students
subsector S2 and.the professional subsector F2, there are now
similar paths for population shifts between either of these sUb-
sectors and the faculty subsector f2. All those who have
successfully completed their studies toward a Masters Degree can
leave layer 2 and move on to layer 3 via the 'channel labeled S23.,
Layer 3 is conceptually similar to layer .2 although within it
reside all those who hold a .Masters Degree but no higher degrees.
From layer 3 individuals may move up to layer 4 upon satisfactory,
completion of.the Doctorate Degree. Layer 4 is different,from
layers 2 or 3 in that 'within it reside all Doctorate holders smh
this layer does not contain a student subsector. Although it-is
recognized that there are post-doctoral students, it was felt that
most of these people do hold.an academic-rating, and so for the
sake of simplicity, the student subsector was eliminated.
It should be noted that except for the exogenous inputs, all
of the flaws either originate and/or terminate at one of the sub-
sectors. Therefore, at .each subsector it is.possible to write a
"personnel" conservation equation in a manner analogous to the
vonservation .equations of either mass or energy br Momentum in tht
Physical sciences. These equations basically take into atcount, at
any instant of,time, all.of the inflows, outflows and.rates of
accumulation 'within a subsector. The equation states that the.total
rate (of flow into a subsector minus.the rate of outflow is equal to
the rate of accumulation,or growth.of population within.a given
subseCtor. Equation 1 states this in descriptive termS. It should
be noted that the rate of.generation term, quite often used in the
physical sciences, is meaningless in.this case and therefore forced
: to equal zero. What we are basically saying here is that within a
given subsector there can be MD people generated. Any generation
1which does,take,place in our population takes place some time prior
k to the individual's entrance into either the academic ,or professional
Isubsectors. Equation 1 is described in,mathematical symbols by
equation 2.
or?Input, - Output +
]
Equation 2 may be rearranged from its differential formulation ,to an
integral formulation which As done in equatlon 3.
Rates
i 0 dt
; Rates
9
neration Accumulationj
(1)
(2)
0
RaA [ of
Rate, -1r-

t+dt Mt+dtf ami - Imo]dt f d(m)
mt
(3)
If we now force the infinitesimal time increment dt to be equal
to At a finite increment of time,and similarly, we allow the
infinitesimal increment of accumulation dM to be equal to AM,
then we may transform equation 3 to its difference format with buta few apologies to those who are inclined toward the purity of
mathematics.
Let
dt + At, and dM + AM
[1Mi M ]Atft+At Mt
(4)
Allowing for some additional transformations such as those described
by equation 5
If t J, t + At = K, And At = DT
we can moVe on to equation 6
MK = Mj + - 51,0]At
and then on to equation' 7
M.K = M.J + (DT) [Mi - IM0]
(5)
(6)
(7)
which is in a format,easily comprehended by the DYNAMO compilerdeveloped in connection with a social-systems simulation methodologygenerally known as industrial dynamics which was developed by
Professor J. W. Forrester at the Massachusetts Institute of Technology.
Although the level equations are determined by a straightforward application of the law of conservation of mass, the rateequations are determined largely by a group of relationships
between many diverse factors. A brief sunnary of the "flowrates
and the major ihfluential factors" is given in Table 1. The table
shows that the flowrates from one sector to another are determined
by such gross influential factors as societal needs, group psychology,
10

student capabilities., national needs for faculty, student-faculty
ratios, inputs, world technological gaps, and so forth.
The approach that is used in combining these and determining the
flow rate can perhaps be best explained by means of a number of
specific examples.
In Figure 2, we see an expanded version of the non-degree
holders level where the student sector Sl and the professional
sector P1 are shown in the square boxes. Let us consider the flow
of professionals from P1 to S1 and call that flowrate P1S1. In
order to understand the dynamics of the flowrate P1S1 we resort to
a psychological submodel which is given in Figure 3.
There are a number of students studying for a Bachelors Degree
in subsector Sl. After some length of time ,which we call a delay
(say, six months) we observe or count the number of students that
exist in that sector. This delay is due to the fact that we do not
usually count large nuMber of students instantaneously, but it takes
some time before our bookkeeping system presents the data to decision
makers. Furthermore, even after the figures regarding head count
are available, it takes'some additional time forthe decision makers
to become really aware of what the figures mean. At the same title
that there is an observation of the nuMber of students, there exists
in society a need for people to obtain a:Bachelor's Degree namely,
need for students in the Bachelors program. This need is generated
by the discrepancy between the nuMber of students who have a
Badhelors Degree and those that we think we need with such a degree.
It is reasonable to expect that if there is no difference between
the need for students and the number of students that we dbserve
there will be no dissatisfaction with the conditions that prevail.
However, if we need more students than we have, there is some
dissatisfaction generated. As the dissatisfactiOn grows there is
a pressure to change the nuMber of students that we observe, namely
to open.the valve P1S1 and let more students into school:
The relationship between dissatisfaction and pressure to change
the number of students is not a linear one. It can be seen .from
Figure 3 that the relationship may be represented by an S-shaped
curve. Thua, if there is very little dissatisfaction there is no
pressure. But as the dissatisfaction grows, the pressure builds
up rapidly. After the dissatisfaction has reached some large value,
the pressure does not continue to increase linearly, but levels off
and thereafter no matter how great the dissatisfaction, the préssure
no longer increases. This kind of a relationship is representative
of many real situations which we find in socio-economic situations.
11
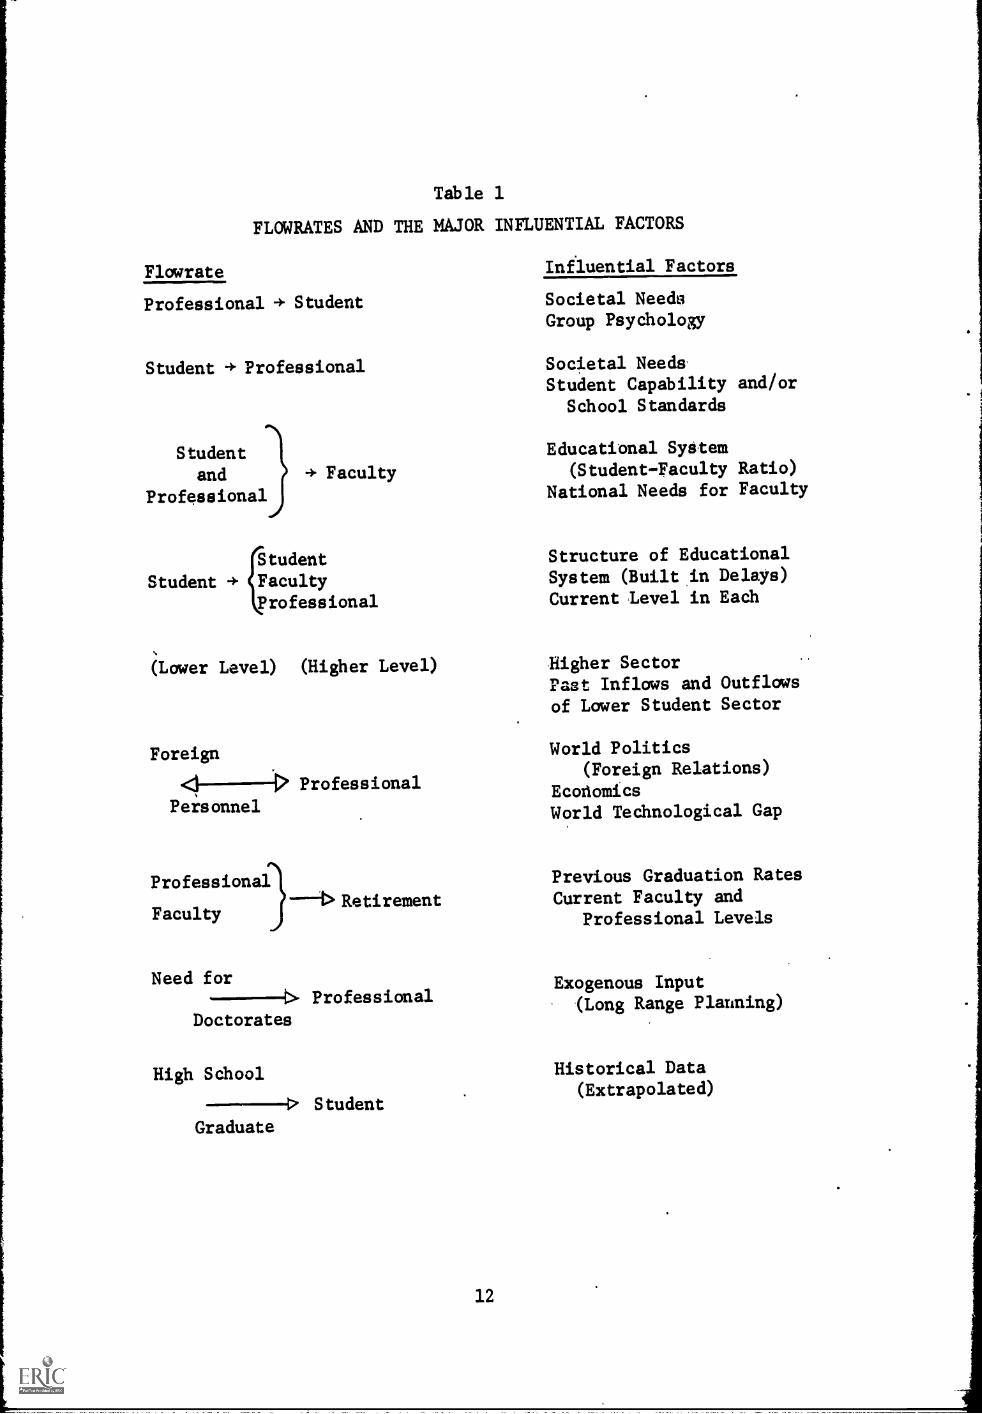
Table 1
FLOWRATES AND THE MAJOR INFLUENTIAL FACTORS
Flawrate Infiuential Factors
Professional 4. Student
Student + Professional
Studentand
Professional
Faculty
{I
Student
Student 4. FacultyProfessional
(Lower Level) (Higher Level)
Foreign
<1 Professional
Personnel
)ProfessionalRetirement
Faculty
Need for-------4> Professional
Doctorates
Societal NeedsGroup Psydhology
Societal NeedsStudent Capability and/or
School Standards
Educational System(Student-Faculty Ratio)
National Needs for Faculty
Structure of EducationalSystem (Built in Delays)Current Level in Each
Higher SectorPast Inflows and Outflowsof Lower Student Sector
World Politics(Foreign Relations)
Ecoliomics
World Technological Gap
Previous Graduation RatesCurrent Faculty and
Professional Levels
Exogenous Input(Long Range Planning)
High School Historical Data(Extrapolated)
Student
Graduate
12

TPCS1
CONS1 TCP1S
YRH
Figure 2
The Location & Flow Paths of People within the
Undergraduate Subsector anc! the Interrelation
of :Socio-economic Factors which "control"the Population Flows
13

NUMBER OF STUDENTSSTUDYING FOR BACHELORSDEGREE
DELAY
OBSERVATION OFNUMBER OFSTUDENTS
NEED FORSTUDENTS
DISSATISFACTION
PRESSURE TOCHANGE NUMBEROF STUDENTS
PERCENT CHANGEIN FLOW TO THESTUDENT SECTOR
PRESSURE
PERCENTCHANGE
DISSATISFACTION
PRESSURE
Figure 3
Typical Socio-economic Loop
14

In a similar manner, as the pressure increases we tend to make
sot* percentage Change in the flow thatArelallow'into the student
sector. This means that we might open the valve 2% or 3% greater
than it was at the previous instant in time. The relationship
between pressure and the percentage of dhange in the flowrate is
similar to the one given for dissatisfaction and pressure. From a
mathematical standpoint we could combine the,two functions into one
composite ane, but this would obscure the physical significance of,
the variables And make it more difficult to make intelligent
modifications in the curve. We can see from Figure 3 that the
percentage dhange in flow to the student sector is the variable
which will control the flowrate P1S1. Thus we have a dynamic loop
in which the feedback, the delays, the need for students and some
of the functional relationships that are postulated All combine to
regulate the 'valve.
The actual variables used in thismodel are,shown in Figure 2.
OS1 represents the observation of the number of students that exist
in the student sector,S1 at the present instant of time. This
information together with the Societal need for students in Sl, NS1,
yield the variable DS1, which is the dissatisfaction with the number
of students in Sl. DS1 provides informatiOn for generating pressure
to change the number of students in Sl, namely PCS1, and this in
turn provides the information to generate CPIS, which is the
percentage dhange in the flowrate. The dhange in the flowrate
CPIS controls the valve P1S1.
The mathematical relationships which represent the foregoing
dynamic loop are represented by equations (8) through (15). With
the exception of a number of sumbols peculiar to the dynamo program
and our own nomenclature, the equations are self-explanatory. It
will be noted that.in equation 10, S1D* (11.J) represents a special
computer routine which stores the number of students in S1 at a
given instant,in time and makes that number available sometime
later (say 6 months later) in the analysis. In equations (13) and
(14), the symbols TPCS1 and TCPS represent tables of values that,
give the relationship between DS1 and PCS1, as well as PCS1 and
CP1S. The tables are shown graphically beside the equations.
Finally, the flow rate P1S1.KL which represents the flow rate during
the time interval between time K and time L. is given by the flow
rate between time interval J and K plus some percentage of '-
dhange in that flawrate. This.relationship is shown in equation (15).
Sl.K Sl.J + (D1)(H1S1.JK + ElS1.3K + P1S1,JK
- SlP1.JK SIPLJK) (8>
15

Pl.K = Pl.J + (DT)(E1P1.JK + S1P1.JK - P1S1.JK
- PlEl.JK - P1R1.JK) (9)
0S1.K = S1D*(11.J) DS1
DS1.K = CONS1 /.(0S1.J / NS14)
(10)
CONS1 whereCONS1 = 1
0S1/NS1
NS1.K = NS2.J + NF2.J + NP2.J - (F2.J + P2.J + S2.J) (12)
PCS1.K = TPCS1 (DS1.K)
CP1S.K = TCP1S (PCS1.K)
PCS1
CPIS'
(13)
DS1
(14)
PCS1
P1S1.KL = P1S1.JK + CP1S.K (P1S1.JK) (15)
On the other hand, the flowrate from the student sector S1
to the professional sector P1 is controlled by the valve S1P1.
The flowrate is determined by some internal as well as external
factors. The external factors are similar to those given for the
flowrate P1S1 and are controlled by the external needs of our .
society for professional people NP1. The number of students who
dropped out of school and do hot achieve a Bachelors Degree is
determined not only by the need for professional personnel, but
also by the mental ability of the students who enter the Bachelors
program and the educational standards of the school. The
combination of student abilities and school standards cause some
16

percentage of the entering students td drop out.' The percentage
of etUdents that dtop out, PD1S1, cati be assuthed to-be a constant
cir it may vary with time. For the purposes oi the initial Simulation
we will assuthe that this dropout rate'is a conetant. The fraction
of Studenisthat will drop Out due to the aforetentioned cauSes,
FR1S1, is equal to the percentage of studenta who entered SChoOl
ftot high sChool from foreign countries and froth'the profestional
sector. The students do not drop but all'at one time. MastsOf
them drop out during the first yeat Of College and less and less
stUdents drop -cut as.the years go by. This phenotenon is taken
into acdOunt in thesthodel by introducing d.special routine knawn
as a delay. The delay-routine takes' the flowrate and distributes
it in an appropriate manner over the tithe period involved. Theflawrate S1P1 is thus the sum of the internal flowrate ES1P1. Some
of the definitions of termb and typical equations that are'used in,
the internal loop Are given below.
The rate at which students graduate from S1 and who proceed
to level 2 is called S12. This flawrate is determined by the rate
of students entering as freshthan.approximately 4 years earlier than
the present time minus the rate at which students dropped out over
the 4 year period. All Of these rates are delayed in an appropriate
mannet by a deiay routine.
PD1S1 = Constant or Variable with Time
at Percent Dropout of Students Entering 81
Due to Mental AbilitieS, i.e., Internal Reasons
FR1S1.KL = PD1S1 (H1S1.JK + E1S1.JK + P1S1.JK)
ISIP1.KL = 1 (FR1S1.KL, DRDS1),
DRDS1 = Constant
= Dropout Delay at S1 in Time Units
(16)
(17)
S1Pl.KL = ISIPLKL = ES1P1.KL (18)
The rate at which people retire frOm the professional sector
P1 is called P1R1. As might be expected, that flowrate is determined
by the number of people that entered this system 30 or 40 years
earlier from high school, the number of people who retire from the
Masters and Ph.D. sectors and some appropriate distribution functions
regarding the age at which people retire.

Finally, the rate of inflow and outflow of foreigners from
the professional sector, namely E1P1 and PlE1 are recognized
explicitly in the model and their respective values are assumed to
be reasonably constant. An extensive search of available
information regarding foreign personnel entering and leaving the
United States has revealed that very little good data is now being
kept on this subject. If we were to assume relationships which
are other than constant values for these flowrates, we would have
to greatly expand the model to include the influence of foreign
economics, politics, world affaits, cultural patterns, and so forth.
For the present time we will make reasonable assumptions regarding
these flowrates, and turn our attention to more realistic
assumptions at a future date.
In a manner substantially similar to the one presented for
level 1, the model has been developed for the second, third and
fourth level. The flow diagrams are shown in Figures 4, 5 and 6.
SUGGESTED FUTURE EXTENSIONS OF THE MODEL
At the present time the model and the simulation are concerned
strictly with the profession of Engineering (not distinguishing
between mechanical, electrical, etc. engineers). However, in the
future we are looking forward to doing the following:
a. ND4 in fhe model represents the need for doctorates
which is felt in the seneral population at a given
time. This variable must be functionally related to
the projected long-range needs of the nation. An
extension of the present model is required.
b. Applications,to other professions and disciplines each
treated individually.
c. Generalization of the model to include several inter-
related professions and/or disciplines. (Physical Sciences,
Mathematics, and Engineering; The Life Sciences, Behavioral
Sciences, and Medicine; The Social Sciences, Law, and
Business Administration.)
d. Extension of the generalized model to interrelate all
areas of higher learning.
e. To further delineate withim all of foregoing model the
impact of economic variahles scholarships,
industrial, government and academic salaries, avaiability
of money for educational plant...)
18

TPCS2
NS3NF3NP3S3F3P3 .
TPCP2(NS2)
(ND4)1
/CONS2
DELS(
----CONP2
(NF2)-o/ N
TCS2P
TCF2S
DELP2
TP2E2
(PCP2)
DMIX2
TE2P2
TCS2F
(S12)
1 FM1X
(F3)- \ MSFR2\TSFR2
(F4) / \
1
----,..
,DELF2
ICONF2
1TPCF2/
I \YR2 YR3
\ PCF2E /
\ /PSFR2
Figure 4
The Location 4I'Flow Paths of People within the
Post Baccalaureate Subsector and the
Interrelation of Socio-economic Factors
which "control" the Population Flows
19

TPCS3
TCP3S
.... tn2
012
S34
DMS3
6
TPCP3
// (NS3)
----
CONP3
(NF3)
-0
CO(S3V/DELS3
TP3E3
TCF3SI
TE3P3
(PCP3)
TCS3F
/(S23)
FMla
r\
1-SFR3MSFR3 \
i \(F4)
1 4',- DELF3
ICONF3
1
TPCF3
./
I \YR3 YR4
\ PC F3E /\ /
Figure 5
The Location & Flow Paths of People within thePost Masters Subsector and the Interrelationof Socio-economic Factors which "control"
the Population Flows23

TP4E4TPCP4 ,r/
I
(S34)L(FMIX2)---,(FMIX3).
\CONF4.
Figure 6
The Location & Flow Paths of People within the
Post Doctorate 6ubsector and the Interrelation
of Socio-economic Factors which "control"the Population Flows
-
21
..

References
1. Bolt, Richard H., Walter L. Koltun and Oscar H. Levine,"Doctoral Feedback into Higher Education", Science, Vol. 148,
pp. 918-928, 14 May 1965.
2. Reisman, Arnold, "Higher Education: A Population Flow Feedback
Model" Science Vol. 153, pp. 89-91, 1 July 1966.
3. , "A General Model for Production Systems", Ph.D.Dissertation, Department of Engineering, University of
California, Los Angeles, June 1963.
4. and Elwood S. Buffa, "A General Model for
Production and Operations Systems", Management Science,
11:64-79, September 1964.
5. and Martin I. Taft, "On the Generation of
Doctorates and Their Feedback into Higher Education". A paper
presented at ehe 14th International Meeting of the Instituteof Management Sciences; Mexico City, August, 1967.
6. Forrester, Jay W., Industrial Dynamics, The MIT Press, 1961.Also pp. 53-72 in READINGS IN PRODUCTION & OPERATIONSMANAGEMENT, edited by E. S. Buffa, John Wiley & Sons, Inc.,
New York, 1966.
22

APPENDIX
NOTE PRINT CARDS START AT 40000
NOTE DEC. 27, 1967SPEC DT=1/LENGTH=010/PRTPER=2/PLTPER=2NOTE LAYER 12L .S1.K=S1.J4(DT)(H1S1.JK+E1S1.JK+P1S1.JKS1P1.JKS12.JK-1-0)7N S1=180000/122L P1.K=P1.,14-(DT)(E1P1.JK+S1P1.JK-P1E1.JK--P1R1.JK-P1S1.JK+0)8N P1=P2+133+P4
H1S1.KL=H1S1.../K
6N H1S1=62000/12E1S1.KL=E1S1.JK
6N E1S1=4600/1214R P1S1.KL=P1S1.JK-1-(01S.K)(P1S1...1K)
P1-T0 S1a
6N P1S1=03.78. S1D=BOXLIN(771)
051.K=S1D*7.KS1D*1.K=S1.KS1D=BOXLOAD(S191)
6N OS1=S110A NS1.K=NS2.K+NF2.K+NP2.K*42.K.-P2.K."'.S2.K
NEED FOR S1
6N NS1=OS1DS1.K=NS1.K/OS1.K
6N DS1=1PCS1.K=CLIP(PCS1POS.K9PCS1NEG.KOS1.K71)
PCS1POS.K=1-.EXP((4)((DS1.K-1)(DS1.K.-4)(DS1.K-.1)))PCS1NEG.K=EXP((-4)(DS1.K)(DS1.K)(DS1.K))
CP1S.K=(PCS1.K/PCS1A8S.K)(1-EXP((-4)(PCS1ABS.K)-.PCS1ABS.K-PCS1ABSX .K-.PCS1ABS.K))
PCS1ABS.K=MAX(PCS1.K9PCS1.K)6N S12=20200/12
DMS1=45 DELAY IN ACT. MATR. FOR BACH. STUDENTS
18R M51EX.KL=(SUMS.JK)(1-ADOI-1.K)SDOS1.K=SUM1(52,8AVS1)ADOS1.K=SDOS1.K/52 AV DROP OUT OF S1
44A BAVS1*1.K=(S1P1.JK)(DT)/S1.KBAVS1=BOXLIN(52,1)SUMS.KL=8SMS1*52.JK
8R BSMS1*1.KL=H1S1.JK+E1S1.JK+P1S1.JKBSMS1=BOXLIN(52,1)BSMS1=BOXLOAD(H1S1+E1S1+P1S111)
36N BAVS1=BOXLOAD(BAVS1*1,1)DTPY=12 MONTHS
7A S1P1.KL=IS1P1.JK+ES1P1.JK6N S1P1=8200'
IS1P1.KL=DELAY3(FRIS1.JK924)NOTE PRECEDING SCHOULD BE DELAY 11 NOT 3
6N IS1P1=019R FRIS1.KL=(PDIS1)(H1S1.JK+E1S1.JK+P1S1.JK+0)
POIS1=209/12 (.5.-'S1)/12
14R ES1P1.KL=ES1P1...1K+(CS1P.K) (ES1P1.JK) SOCIAL EXTERNAL
6N ES1P1=0 '
PCP1.K=CLIP(PCP1POS.K9PCP1NEG.KOP1.K/1)PCP1POS.K=1-EXP((-4)((DP1.K 1)(DP1.K--1)(DP1.K.-.1)))
PCP1NEG.K=-EXP((-4)(DP1.K-DP1.K-DP1.K))PCP1A8S.K=MAX(PCP1.K,--PCP1.0CS1P.K=(PCP1.K/PCP1ABS.K)(1-EXP((-4)-PCP1PWER.K))PCP1PWER.K=PCP1ABS.K-PCP1ABS.K-PCP1A8S.K
23

DP1.K=10-1.K/001.K
6N DP1=0
--74 NP1.K=NN1.K-NS1.K7N NP1=NN1-NS1
----1-14--Thiii1:iG(bi4ri1:,-K)(ND4.K)74 DMIX1.K=CC1+ATB1.K284 ATB1.K=(AA1)EXP(BLT17K)294 BLT1.K=(BB1)LOGM(TIME.K)C -AA1=0
C BB1=0
C CC1=1712N NN1=(DMIX1)(ND4)6N DMIX1=20C . N04=650/12
OP1.K=P1D*7.KP1D*1.K=P1.KP1D=BOXLIN(711)P1D=BOXLOAD(P111)OP1=P1
6R P1R1.KL=RR1.JK6N P1R1=09R RR1.KL=TOTR.JK-RR2.JK-RR3.JK-RR4.JK
-1Tiftb:OF P1
6R TOTR.KL=TOTR.JK19N TOTR=(.15)(Pl+P2+P3+P4)6R E1P1.KL=E1P1.JK
FOREIGN TO PI
6N E1P1=06R PlELKL=PlEl.JK
P1 TO El
6N PlE1=02L S2.K=S2.J+(DT)(S12.JK+P2S2.JK+F2S2.JK-S23.JK-S2P2.JK-S2F2.JK)20N S2=12400/DTPY84 AP2.K=E2P2.JK+F2P2.JK+S1P2.JK
AUX. OF P2
2L P2.K=P2.J+(01.)(AP2.JK+S2P2.JK-P2E2.JK-P2R2.JK-P2F2.JK-P2S2.JK)20N P2=138000/DTPY2L F2.K=F2.J+(DT)(S1F2.JK+52P2.JK+P2F2.JK-F2R2.JK-F2P2.JK-F2S2.JK)20N F2=660/DTPY84 AS1S2.K=S2.K+P2.K+F2.K
AUX. FOR S1S2
44R S1S2.KL=(S12.JK)(S2.K)/AS1S2.K44R S1P2.KL=(S12.JK)(P2.K)/AS1S2.K8R S1F2.KL=S12.TKIS1S2.JK-S1P2.JK20N S1F2=1000/DTPY14R F2S2.KL=F2S2.JK+(CF2S.K)(F2S2.JK)6N F2S2=0
PCS2.K=CLIP(PCS2POS:KIPCS2NEG.KIDS2.K,1)PCS2POS.K=1-EXP((-4)((DS2.K-1)(0S2.K-1)(0S2.K-1)))PCS2NEG.K=-EXP((-4)(DS2.K-DS2.K-DS2.K))PCS2ABS.K=MAX(PCS2.K1-PCS2.K)CF2S.K=(PCS2.K/PCS2ABS.K)(1-EXP((-4)(PCS2PWER.K)))
----
PCS2PWER.K=PCS2ABS.K-PCS2ABS.K-PCS2ABS.K104 NS2.K=NS3.K+NF3.K+NP3.K-F3.K-P3.K-S3.K
NEEDS OF S2
6N NS2=0S2DS2.K=NS2.K/0S2.K
. 64 0S2.K=S20*7.K6 MONTH DELAY
S2D*1.K=S2.KS2D=BOXLI4(7,1)S20=BOXL0A0(S2,1)
6N 0S2=S2
24 .
-

P2S2.KL=P2S2.JK+(CP2S.K)(P2S2.JK)P2S2=0
CP2S.K=(PCS2.KiPCS2ABS.K)(1-EXP((-4)(PCS2PWER.K)))14R S2P2.KL=S2P2.JK+(CS2P.K)(S2P2.JK)20N S2P2=6500/DTPY
CS2P.K=(PCP2.K/PCP2ABS.K)(1-EXP(-4-PCP2PWER.q)CF2P.K=CS2P.K
14R F2P2.KL=F2P2.JK+(CF2P.K)(F2P2.JK)6N F2P2=0
PCP2.K=CLIP(PCP2POS.K,PCP2NEG.K,OP2.K11)PCP2POS.K=1-EXP((-4)((DP2.K-1)(DP2.K-1)(DP2.K-1)))PCP2NEG.K=-EXP(-4-(DP2.K-DP2.K-DP2.K))PCP2ABS.K=MAX(PCP2.Kr-PCP2.K).
--------------PCP2PWER.K=PCP2ABS.K.-PCP2ABS.K-PCP2ABS.K8A' NP2.K=N82.K-NF2.K-NS2.K6N NP2=0P212A NE52.K=MMIX2.0(ND4.K)
. 7A DMIX2.K=CC2+ATB.K28A ATB.K=(AA2)EXP(BLT.K)29A BLT.K=(882)LOGN(TIME.K)8N NB2=NP2+NF2+NS26N DMIX2=76.3/5.00
AA2=0BB2=0 "--
CC2=13DP2.K=NP2.K/0P2.K
6A 0P2.K=BOXP2*13.K6A BOXP2*1.K=P2.K37B BOXP2=BOXLIN(13,1)
BOXP2=BOXLOAD(P2,1)14R S2F2.KL=S2F2.JK+(CS2F.K)(S2F2.JK)6N S2F2=0
CS2F.K=(PCF2.K/PCF2ABS.K)(1-EXP(-4-PCF2PWER.K))PCF2PWER.K=PCF2ABS.K.-PCF2ABS.K-.PCF2ABS.KPCF2ABS.K=MAX(PCF2.Kr-PCF2.K)
7A PCF2.K=PCF2E.K+PSFR2.K7N PCF2=PCF2E+PSFR2
PSFR2.K=CLIP(PSFR2POS.KIPSFR2NEG.K,SFR2.K9MSFR2.K)PSFR2POS.K=1-EXP(-4--SFR2POWERABS.K) .
SFR2PPER.K=(SFR2.K.-MSFR2)(SFR2.K-MSFR2.K)(SFR2.K-MSFR2)SFR2POWERABS.K=MAX(SFR2PPER.K1-SFR2PPER.K)PSFR2NEG.K=-EXP(-4-SFR2.K-SFR2.K-SFR2.K)MSFR2=20 AVER. OR DESIRED MASTERS LEVEL START OF SFR2
8A FF.K=F2.K+F3.K+F4.K20A SFR2.K=S2.K/FF.K8N FF=F2+F3+F420N SFR2=S2/FF
PCF2E.K=CLIP(PCF2EPOS.KIPCF2ENEG.KOF2.K11)PCF2EPOS.K=1-EXP(-4--((0F2.K-1)(DF2.K-1)(0F2.K-1)))PCF2ENEG.K=-EXP(-4-(DF2.K-DF2.K-DF2.10)DF2.K=NF2.K-OF2.K
DF2=1
19A NF2.K=(FMIX2.4()(NF4.K+NF3.K+NF2.K+0)NEEDS OF F2
6N NF2=0F27A FMIX2.K=FF2.+DTE.K28A DTE.K=(DD2)EXP(ELT.K)29A ELT.K=(EE2)LOGN(TIMEtIC)
25

C 0D2=0
C EE2=0
C FF22.16A OF2.K=BOXF2*5.1(
4 MONTH DELAY .
6A BOXF2*1.K=F2.KBOXF2=BOXLIN(5d).BOXF2=8OXLOAD(F271)
6N OF2=F2, -
14R P2F2.KL=P2F2.JK+(CP2F.K)(P2F2.JK)6N P2F2=0
CP2F.K=(PCF2.KPCF2ABS.K)(1-.EXP(-4-PCF2PWER.K))50R P2R2.KL=(RR2.JK)(P2.K)/(P2.K+F2.K)20N P2R2=2444/DTPY
RRLKL=DELAY6(BXS12*516,24)BXS12=BOXLIN(516,1)BXS12=BOXOAD(S1271)
6A BXS12*1.K=S12.jKF2R2.KL=RR2.JK.-P2R2.JK
20N F2R2=156/DTPYS23.KL=DELAY3(MS2EX.JK,6)
NOTE SHOULD HAVE BEEN DELAY 1, NOT 3
20N S23=4444/DTPY18R MS2EX.KL=(SUMA.JK)(1-ADOS2.K)
SUMA.K=BSMS2*35.K8R BSMS2*1.KL=F2S2.JK+P2S2.JK+S1S2.JK37B BSMS2=BOXLIN(3591)53A ADOS2.K=SUM1(35,BAVS2.K)/3522A BAVS2*1.K=(1/S2.K)((S2P2.K)(DT)+(S2F2.K)(DT))378 BAVS2=BOXLIN(3591)
BSMS2=BOXLOAD(F2S2+P2S2+S1S291)BAVS2=BOXLOAD(BAVS2*1,1)
6R E2P2.KL=E2P2.JK20N E2P2=3047/DTPY
P2E2.KL=P2E2. JK
P2E2=0
NOTE LAYER 3
21 S3.K=S3.J+(DT)(S23.JK+P3S3.JK+F3S3.JK-.S34.JK-S3P3.JK-S3F3.JK)20N S3=2921/DTPY
.
8A AP3.K=P3R3.JK-P3F3.JK-P3S3.JKAUX. OF P3
21 P3.K=P3.J+(DT)(E3P3.JK+F3P3.JK+S2P3.JK+S3P3.JK-P3E3.JK+AP3.JK)20N P3=33700/DTPY2L F3.K=F3.J+(DT)(S2F3.JK+S3F3.JK+P3F3.JK-.F3R3.JK-F3P3.JK-F3R3.JK)20N F3=2640/DTPY8A AS2S3.K=S3.K+P3.K+F3.K44R S2S3.KL=(S23.JK)(S3.K)/AS2S3.K44R S2P3.KL=($23.JK)(P3.K)/AS2S3.K8R S2F3.KL=S23.JK-S2S3.JK-S2P3.JK
IS S2S3 CORRECT
44R F3S3.KL=F3S3.JK+(CF3S.K)(F3S3.JK).
CP3S.K=(PCS3.K/PCS3ABS.K)(1EXP(-4-PCS3PWER.K))PCS3.K=CLIP(PCS3POS.KIPC53NEG.K1DS3.K/1)PCS3POS.K,=.1-EXP(-4-((DS3.K-1)(DS3.K-1)(DS3.K-1)))PCS3NEG.K=.-EXP(-4-(DS3.K-DS3.K-DS3.K))PCS3PWER.K=PCS3ABS.K-PCS3ABS.K-PCS3ABS.K
________PCS3ABS.K=h1AX(P.CS3.K9-PCS3.K)25

DS3.K=NS3.K/0S3.K84 NS3.K=ND4.K-P4.K-F4.K6N NS3=0S3
0$3.K=S3D*7.K 6 MO DELAY
'6A .S3D*1.K=S1.K378 S3D=BOXLIN(711)
S3D=BOXLOAD(S311)0S3=S3
-NOTE DELS3=48 WHATS IT FOR
-14R P3S3.KL=P3S3.JK+(CP3S.K)(P3S3.JK)6N 03S3=0
CF3SK=CP3S.K SAME FOR NOW
14R -S3P3.KL=S.3P3.JK+(CS3P.K)(S3P3.JK).6W S3P3=0
CS3P.K=(PCP3.K/PCP3ABS.K)(1-EXP(-4-PCP3PWER.K)FPCP3.K=CLIP(PCP3POS.K9PCP3NEG.KI0P3.KWPCP3POS.K=I-EXPC-4-HDP3.K-1)(DP3.K-1)(DP3.K-1)))PCP3NEG.K=-EXP(-4-(DP3.K-DP3.K-DP3.10)OCP3PWER.K=PCP3ABS.K-PCP3ABS.K-PCP3ABS.K
. PCP3ABS.K=MAX(PCP3.KI-PCP3.K)DP3:K=NPS.K/OP3.K.---0P3.K=BOXP3:47.K.BOXP3*1.K=P3.K
37B BOXP3=BOXLIN(711)6N OP3=P3'36N BOXP3=BOXLOAD(P311)8A NP3.K=NM3.K-NF3.K-NS3.K6N NP3=0P312A NM3.K=(DMIX3.K) (ND4.K)
74 DMIX3.K=CC3+ATB3.K28A ATB3.K=(A43)EXP(BLT3.1029A BLT3.K=(883)LOGN(TIME.K)8N NM3=NP3+11F3+NS36N DMIX3=18.815
AA3=1 .BB3=1CC3=20.0/6.0
14R F3P3.KL=F3P3,JK+(CF3P.K)(F3P3.JK). 6N F3P3=0
CF3P.K=CS3P.K SAME FOR NOW, 14R S3F3.KL=S3F3.JK+(CS3F.K)(S3F3.JK)6N S3F3=0
CS3F.K=(PCF3.K/PCF3ABS.K)(1-EXP(-4-PCF3PWER.K))74 PCF3.K=PCF3E.K+PSFR3.K7N PCF3=PCF3E+PSFO.
PCF3ABS.K=MAX(PCF3.K9-PCF3.K)PCF3PWER.K=PCF3ABS.K-PCF3ABS.K-PCF3ABS.KPSFR3.K=CLIP(PSFR3POS.K9PSFR3NEG.KISFR3.K11)PSFR3POS.K=1-EXP(-4-(SFR3.K-1)(SFR3.K-1)(SFR3.K-1))PSFR3NEG.K=-EXP(-4-SFR3.K-SFR3.K-SFR3.K)
264 SFR3.1<=($3.K+0+0)/(F2.1+F3.K+F4.K)26N SFR3=(S3+0+0)/(F2+F3+F4)
DF3.K=NF3.K/0F3.KPCF3E.K=CLIP(PCF3EPOS.K,PCF3ENEG.K9DF3.K11)PCF3EPOS.K=1-EXP(-4-(0F3.K-1)(DF3.K-1)(DF3.K-1)YPCF3ENEG.K=-EXP(-4-0F3.K-DF3.K-DF3:R.)NF3.K=(FMIX3.K)(NF4.K+NF3.K+NF2.K)

FAIX3.K=FF3+DTE3.K
284 DTE3.K=(DD3)EXP(ELT3.K)294 EIT3.W=(EE3)LOGN(TIME.K)6N NF3=0F3C -103=1
EE3=0FF3=0.3
6A OF3.K=B0XF3*7.K64 BOXF3*1.KI:70-3.K
378 BOXF3=BOXLIN(7.1)6N OF3=F336N B0XF3=30.XL0AD(F3j1439R S34.KL=DELAY3(MS3EX.JK.12)NOTE SHOULD BE DELAY 1, NOT 3
20N S34=600/DTPY1BR MS3EX.KL=(SUMB.JK)(1-ADDS3.K)534 AUXAO.K=SUM1(62.BAVS300.204 ADOS3.K=AUXAD.K/62224 BAVS3*1.K=(1/S3.K)((S3P3.K)(OT)+(S3F3.K)(0T))376 BAVS3=BOXLIN(62,1)
BAVS3=BOXLOAD(BAVS3*191)64 SUMB.K=BSMS3*52.K7A BSMS3*1.K=P3S3.JK+S2S3.JK378 BSMS3=BOXLIN(52,1)
BSMS3=BOXLOAD(P353+52S3.1)50R P3R3.KL=(RR3.JK)(P3.K)/(P3.K+F3.106N P3R3=039R RR3.KL=DELAY3(RR3A.JK.ORET3)39R R-R3A.KL=DELAY3(UORR3.JKORET3)44N DRET3=(0YR3)(0TPY)/2
DYR3=(2.0)(DTPY).64 U0RR3.K=BRR3*31.K64 BRR341..K=S23.JK37B BRR3=BOXLIN(311SFTR3)
BRR3=BOXLDAD(S23.1)44N SFTR3=(YR3)(DTPY)/307N YR3=YR3T-2
YR3T=3B TOTAL YEARS TO RETIREMENT AFTER MASTERS DEG
7R F3R3.KL=RR3.JK+P3R3.JK12N E3P3=(.1)(S23)
(+ OR )
6N E3P3.KL=E3P3.JK6N P3.E3.KL=P3E3.JK
P3E3=014R P3F3.KL=P3F3.JK+(CP3F.K)(P3F3.JK)7N P3F3=PCF3E+PSFR3
CP3F.K=(PCF3.K/PCF3ABS.K)(1-EXP(-4-4CF3PWER.K))
NOTE LAYER 4
21 P4.K=P4.J+(OT)(S3P4.JK+F4P4.JK+E4P4.JK.-P4F4.JK-P4E4.JK-P4R4.JK)12N P4=(PCTP4)(D4I)
PCT154=.94 ( DOC. ARE PROF.
041=9000/DTPY DOCTORATE HOLDERS INITIALLY
2L F4.K=F4.J+COTHS3F4.JK+P4F4.JK-F4P4.JK-F4R4.JK+0+0)20N F4=2720/DTPY
S3F4.K=S34.JK-S3P4.JKS3P4..K.1.7(.S.34.4)9(P4.K)/(P4.K+F4.K)
28

14R F4P4.KL=F4P4.JK+(CF4P.K)(F4P4.JK)CF4P.K=(PCP4,K/PCP4ABS.K)(1.-EXP(4--PCP4PWER.K))DP4.K=NP4.K/0P4.KPCP4.K=CLIP(PCP4POS.KIPCP4NEG.K9DP4.K,1) ,
PCP4POS.K=1-EXP(-4-(0P4.K-.1)(0P4.K-..1)(DP4.K.-.1)).PCP4NEG.K=--EXP(.-.4-0P4.K-.DP4,K-0P4.K)
PCP4PWER.K=PCP4ABS.K.-..PCP4ABS.K-PCP4ABS4KPCP4A6S.K=MAX(PCP4.Kl-PCP4.K)
6A 0P4.K=60XP4*13.K6A BOXP4*1.K=P4.K
BOXP4=6OXLIN(13,1)BOXP4=BOXLOAO(P491)0F4.K=NF4..K/0F40(
-NP4,K=N-04.1C-W5.4-7RND4.K=D4.KD4i,K=D4.JD4=F4
NOTE ******** 04 VALUE =TS USED 9 NOT CORRaT****
6A OF4,K=BOXF4*7.K 6 MO DELAY
6A BOXF4*1.K=F4,K376 BOXF4=BOXLIN(7/1)36N BOXF4=BOXLOAD(F411)6N OF4=F4f9A Nr4.7.7.(FMIX4.K)(N54.K4105,77174F2.K+0)
6N NF4=0F4BA FMIX4.K=14MIX3.K4MIX2.K14R P4F4.KL=P4F4.JK+(CP4F.K)(P4F4.JK)6N P4F4=0
PCF4.K=CLIP(PCF4POS.K,PCF4NEG.K9DF4.K91)PCF4POS.K=1-EXP(-4-(0F4.K.-.1)(DF4.K-.1)(0F4.K-.1))PCF4NEG.K=-EXP('--4-0F4.1(--0F4.K-0F4.K)PCF4ABS.K=MAX(PCF4.K9-PCF4.K)PCF4PWER.K=PCF4ABS.K-PCF4ABS.K.-PCF4ABS.K
CP4F.K=(PCF4.K/PCF4ABS.K)(1-EXP(-4.-.PCF4PWER.K))NOTE P4R4.KL=(RR4.JK)FP4.K)/(P4.K+F4.K)NOTE P4R4 CHANGED BECAUSE OF SIMUTANEOUS E0.
P4R4.KL=RR4.JK-P4.K10N P4R4=S3P4+E4P4-P4E4.-P4R4+F4R4+07R F4R4.KL=RR4.JK-...P4R4.JK
F4R4=0NOTE ABOVE IS INCORRECT, CHANGED TO RIO SIMULTAN EG).
RR4.KL=DELAY6(BRR4*25924)6A BRR4*1.K=S34,JK .
376 BRR4=BOXLIN(21/1)BRR4=BOXLOAO(S3491)
12N RR4=(.15)(9000)6R P4E4.KL=P4E4,JK6N P4E4=06R E4P4.KL=E4P4,JK6N E4P4=0NOTE ENO OF DYNAMO DECKNOTE PRINT CARDSPRINT 1)S11S2153/2)P1,P21P304/3)F2,F3,F4/4)512951S29S1P29$1F2/5)S23,§X 251,S2P31S2F3/6)$341*IS3P41S3F4/7)S1P1,S2P29$3P39*/8)P1S102$203SX 31*PLOT $1=SIP1=P/S2P2=BIF2=C/S3=D,P3=E1F3=F/P4=G9F4=H
-
29
Related Documents