Annual Report 2018-19 Courage of Conviction. Constancy of Change.

Welcome message from author
This document is posted to help you gain knowledge. Please leave a comment to let me know what you think about it! Share it to your friends and learn new things together.
Transcript
Annual Report 2018-19
Courage of Conviction.
Constancy of Change.
Kotak M
ahindra Bank Limited | Thirty Fourth A
nnual Report 2018-19
Kotak Mahindra Bank Limited, 27BKC, C 27, G Block, Bandra-Kurla Complex, Bandra (E),
Mumbai - 400 051Website: www.kotak.com
BSE: 500247 | NSE: KOTAKBANK | Bloomberg: KMB:IN
CIN: L65110MH1985PLC038137 conc
ept a
nd d
esig
n at
Wya
ttPr
ism C
omm
unic
atio
ns
Annual Report 2018-19
Courage of Conviction.
Constancy of Change.
Kotak M
ahindra Bank Limited | Thirty Fourth A
nnual Report 2018-19Kotak Mahindra Bank Limited, 27BKC,
C 27, G Block, Bandra-Kurla Complex, Bandra (E), Mumbai - 400 051
Website: www.kotak.com
BSE: 500247 | NSE: KOTAKBANK | Bloomberg: KMB:IN
CIN: L65110MH1985PLC038137 conc
ept a
nd d
esig
n at
Wya
ttPr
ism C
omm
unic
atio
ns
1
Financial HighlightsBank Reports and
StatementsConsolidated Financial
StatementsDirectors Report
Courage of Conviction.Constancy of Change.
Directors’ ReportTo the Members of
Kotak Mahindra Pension Fund Limited
Your Directors present their Tenth Annual Report together with Audited Financial Statements of the company for the year ended 31st March 2019.
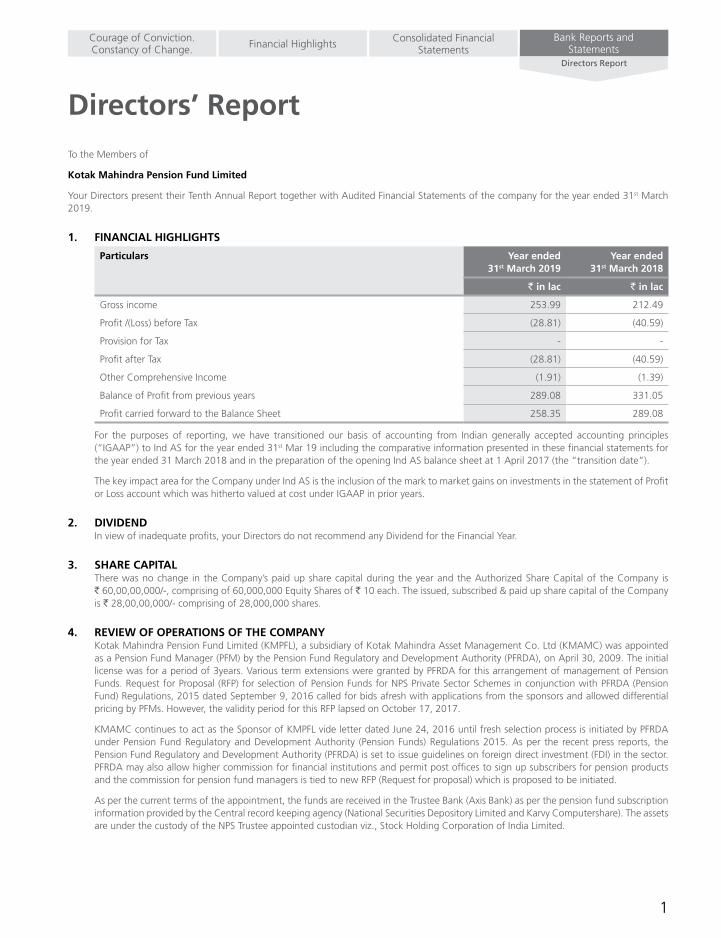
1. FINANCIAL HIGHLIGHTS
Particulars Year ended31st March 2019
Year ended31st March 2018
` in lac ` in lac
Gross income 253.99 212.49
Profit /(Loss) before Tax (28.81) (40.59)
Provision for Tax - -
Profit after Tax (28.81) (40.59)
Other Comprehensive Income (1.91) (1.39)
Balance of Profit from previous years 289.08 331.05
Profit carried forward to the Balance Sheet 258.35 289.08
For the purposes of reporting, we have transitioned our basis of accounting from Indian generally accepted accounting principles (“IGAAP”) to Ind AS for the year ended 31st Mar 19 including the comparative information presented in these financial statements for the year ended 31 March 2018 and in the preparation of the opening Ind AS balance sheet at 1 April 2017 (the “transition date”).
The key impact area for the Company under Ind AS is the inclusion of the mark to market gains on investments in the statement of Profit or Loss account which was hitherto valued at cost under IGAAP in prior years.
2. DIVIDEND In view of inadequate profits, your Directors do not recommend any Dividend for the Financial Year.
3. SHARE CAPITAL There was no change in the Company’s paid up share capital during the year and the Authorized Share Capital of the Company is
` 60,00,00,000/-, comprising of 60,000,000 Equity Shares of ` 10 each. The issued, subscribed & paid up share capital of the Company is ` 28,00,00,000/- comprising of 28,000,000 shares.
4. REVIEW OF OPERATIONS OF THE COMPANY Kotak Mahindra Pension Fund Limited (KMPFL), a subsidiary of Kotak Mahindra Asset Management Co. Ltd (KMAMC) was appointed
as a Pension Fund Manager (PFM) by the Pension Fund Regulatory and Development Authority (PFRDA), on April 30, 2009. The initial license was for a period of 3years. Various term extensions were granted by PFRDA for this arrangement of management of Pension Funds. Request for Proposal (RFP) for selection of Pension Funds for NPS Private Sector Schemes in conjunction with PFRDA (Pension Fund) Regulations, 2015 dated September 9, 2016 called for bids afresh with applications from the sponsors and allowed differential pricing by PFMs. However, the validity period for this RFP lapsed on October 17, 2017.
KMAMC continues to act as the Sponsor of KMPFL vide letter dated June 24, 2016 until fresh selection process is initiated by PFRDA under Pension Fund Regulatory and Development Authority (Pension Funds) Regulations 2015. As per the recent press reports, the Pension Fund Regulatory and Development Authority (PFRDA) is set to issue guidelines on foreign direct investment (FDI) in the sector. PFRDA may also allow higher commission for financial institutions and permit post offices to sign up subscribers for pension products and the commission for pension fund managers is tied to new RFP (Request for proposal) which is proposed to be initiated.
As per the current terms of the appointment, the funds are received in the Trustee Bank (Axis Bank) as per the pension fund subscription information provided by the Central record keeping agency (National Securities Depository Limited and Karvy Computershare). The assets are under the custody of the NPS Trustee appointed custodian viz., Stock Holding Corporation of India Limited.
2 Annual Report 2018-19
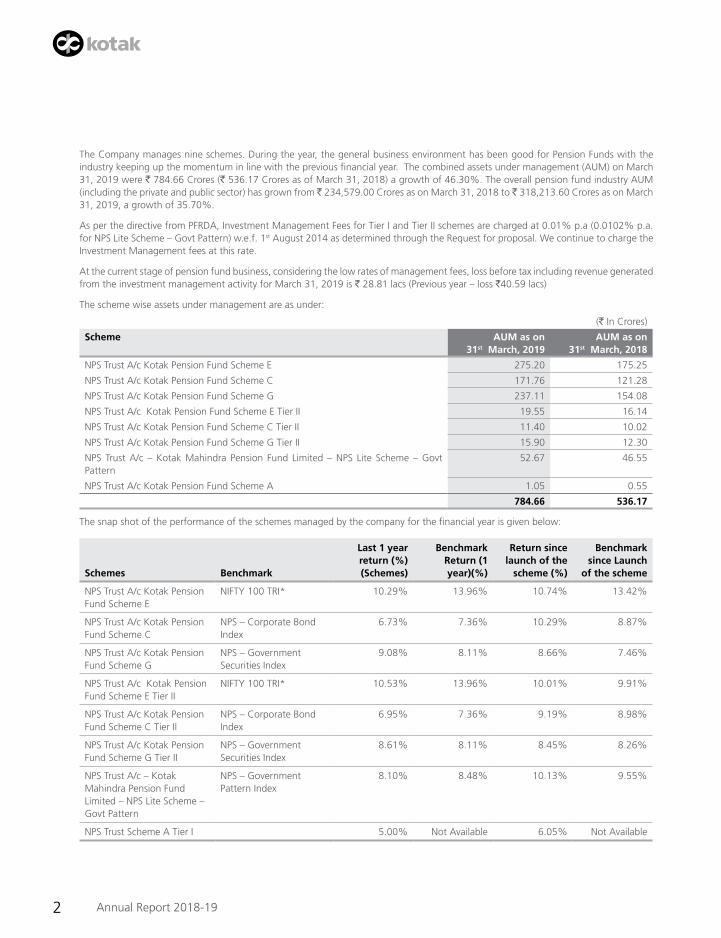
The Company manages nine schemes. During the year, the general business environment has been good for Pension Funds with the industry keeping up the momentum in line with the previous financial year. The combined assets under management (AUM) on March 31, 2019 were ` 784.66 Crores (` 536.17 Crores as of March 31, 2018) a growth of 46.30%. The overall pension fund industry AUM (including the private and public sector) has grown from ̀ 234,579.00 Crores as on March 31, 2018 to ̀ 318,213.60 Crores as on March 31, 2019, a growth of 35.70%.
As per the directive from PFRDA, Investment Management Fees for Tier I and Tier II schemes are charged at 0.01% p.a (0.0102% p.a. for NPS Lite Scheme – Govt Pattern) w.e.f. 1st August 2014 as determined through the Request for proposal. We continue to charge the Investment Management fees at this rate.
At the current stage of pension fund business, considering the low rates of management fees, loss before tax including revenue generated from the investment management activity for March 31, 2019 is ` 28.81 lacs (Previous year – loss `40.59 lacs)
The scheme wise assets under management are as under:
(` In Crores)
Scheme AUM as on31st March, 2019
AUM as on31st March, 2018
NPS Trust A/c Kotak Pension Fund Scheme E 275.20 175.25
NPS Trust A/c Kotak Pension Fund Scheme C 171.76 121.28
NPS Trust A/c Kotak Pension Fund Scheme G 237.11 154.08
NPS Trust A/c Kotak Pension Fund Scheme E Tier II 19.55 16.14
NPS Trust A/c Kotak Pension Fund Scheme C Tier II 11.40 10.02
NPS Trust A/c Kotak Pension Fund Scheme G Tier II 15.90 12.30
NPS Trust A/c – Kotak Mahindra Pension Fund Limited – NPS Lite Scheme – Govt Pattern
52.67 46.55
NPS Trust A/c Kotak Pension Fund Scheme A 1.05 0.55
784.66 536.17
The snap shot of the performance of the schemes managed by the company for the financial year is given below:
Schemes Benchmark
Last 1 year return (%)(Schemes)
Benchmark Return (1 year)(%)
Return since launch of the
scheme (%)
Benchmark since Launch
of the scheme
NPS Trust A/c Kotak Pension Fund Scheme E
NIFTY 100 TRI* 10.29% 13.96% 10.74% 13.42%
NPS Trust A/c Kotak Pension Fund Scheme C
NPS – Corporate Bond Index
6.73% 7.36% 10.29% 8.87%
NPS Trust A/c Kotak Pension Fund Scheme G
NPS – Government Securities Index
9.08% 8.11% 8.66% 7.46%
NPS Trust A/c Kotak Pension Fund Scheme E Tier II
NIFTY 100 TRI* 10.53% 13.96% 10.01% 9.91%
NPS Trust A/c Kotak Pension Fund Scheme C Tier II
NPS – Corporate Bond Index
6.95% 7.36% 9.19% 8.98%
NPS Trust A/c Kotak Pension Fund Scheme G Tier II
NPS – Government Securities Index
8.61% 8.11% 8.45% 8.26%
NPS Trust A/c – Kotak Mahindra Pension Fund Limited – NPS Lite Scheme – Govt Pattern
NPS – Government Pattern Index
8.10% 8.48% 10.13% 9.55%
NPS Trust Scheme A Tier I 5.00% Not Available 6.05% Not Available
3
Financial HighlightsBank Reports and
StatementsConsolidated Financial
StatementsDirectors Report
Courage of Conviction.Constancy of Change.
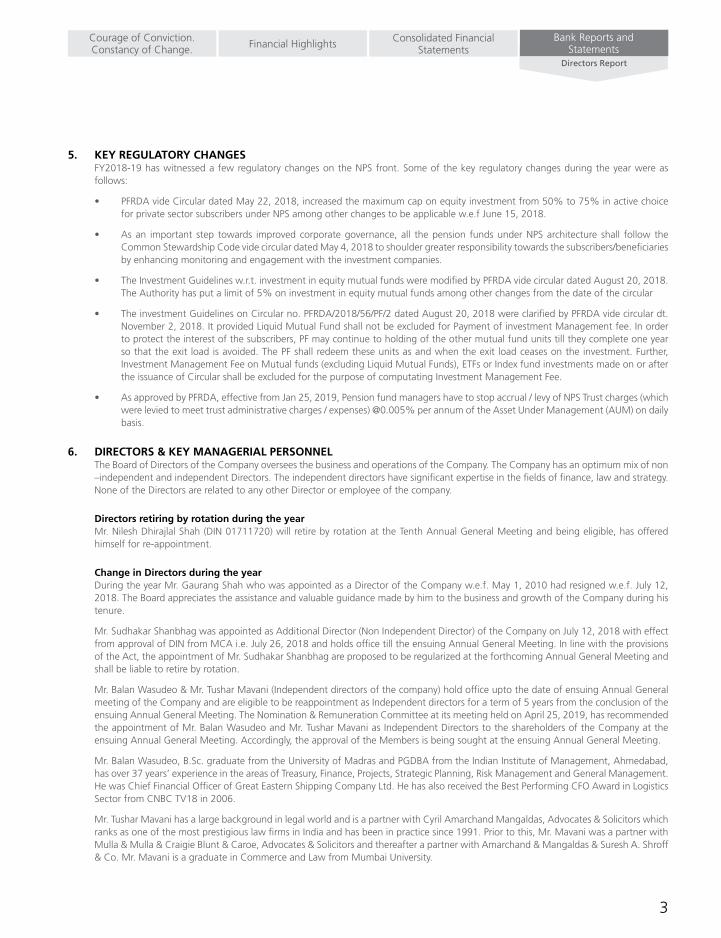
5. KEY REGULATORY CHANGES FY2018-19 has witnessed a few regulatory changes on the NPS front. Some of the key regulatory changes during the year were as
follows:
• PFRDAvideCirculardatedMay22,2018,increasedthemaximumcaponequityinvestmentfrom50%to75%inactivechoicefor private sector subscribers under NPS among other changes to be applicable w.e.f June 15, 2018.
• Asan important step towards improvedcorporategovernance,all thepension fundsunderNPSarchitecture shall follow theCommon Stewardship Code vide circular dated May 4, 2018 to shoulder greater responsibility towards the subscribers/beneficiaries by enhancing monitoring and engagement with the investment companies.
• TheInvestmentGuidelinesw.r.t.investmentinequitymutualfundsweremodifiedbyPFRDAvidecirculardatedAugust20,2018.The Authority has put a limit of 5% on investment in equity mutual funds among other changes from the date of the circular
• TheinvestmentGuidelinesonCircularno.PFRDA/2018/56/PF/2datedAugust20,2018wereclarifiedbyPFRDAvidecirculardt.November 2, 2018. It provided Liquid Mutual Fund shall not be excluded for Payment of investment Management fee. In order to protect the interest of the subscribers, PF may continue to holding of the other mutual fund units till they complete one year so that the exit load is avoided. The PF shall redeem these units as and when the exit load ceases on the investment. Further, Investment Management Fee on Mutual funds (excluding Liquid Mutual Funds), ETFs or Index fund investments made on or after the issuance of Circular shall be excluded for the purpose of computating Investment Management Fee.
• AsapprovedbyPFRDA,effectivefromJan25,2019,Pensionfundmanagershavetostopaccrual/levyofNPSTrustcharges(whichwere levied to meet trust administrative charges / expenses) @0.005% per annum of the Asset Under Management (AUM) on daily basis.
6. DIRECTORS & KEY MANAGERIAL PERSONNEL The Board of Directors of the Company oversees the business and operations of the Company. The Company has an optimum mix of non
–independent and independent Directors. The independent directors have significant expertise in the fields of finance, law and strategy. None of the Directors are related to any other Director or employee of the company.
Directors retiring by rotation during the year Mr. Nilesh Dhirajlal Shah (DIN 01711720) will retire by rotation at the Tenth Annual General Meeting and being eligible, has offered
himself for re-appointment.
Change in Directors during the year During the year Mr. Gaurang Shah who was appointed as a Director of the Company w.e.f. May 1, 2010 had resigned w.e.f. July 12,
2018. The Board appreciates the assistance and valuable guidance made by him to the business and growth of the Company during his tenure.
Mr. Sudhakar Shanbhag was appointed as Additional Director (Non Independent Director) of the Company on July 12, 2018 with effect from approval of DIN from MCA i.e. July 26, 2018 and holds office till the ensuing Annual General Meeting. In line with the provisions of the Act, the appointment of Mr. Sudhakar Shanbhag are proposed to be regularized at the forthcoming Annual General Meeting and shall be liable to retire by rotation.
Mr. Balan Wasudeo & Mr. Tushar Mavani (Independent directors of the company) hold office upto the date of ensuing Annual General meeting of the Company and are eligible to be reappointment as Independent directors for a term of 5 years from the conclusion of the ensuing Annual General Meeting. The Nomination & Remuneration Committee at its meeting held on April 25, 2019, has recommended the appointment of Mr. Balan Wasudeo and Mr. Tushar Mavani as Independent Directors to the shareholders of the Company at the ensuing Annual General Meeting. Accordingly, the approval of the Members is being sought at the ensuing Annual General Meeting.
Mr. Balan Wasudeo, B.Sc. graduate from the University of Madras and PGDBA from the Indian Institute of Management, Ahmedabad, has over 37 years’ experience in the areas of Treasury, Finance, Projects, Strategic Planning, Risk Management and General Management. He was Chief Financial Officer of Great Eastern Shipping Company Ltd. He has also received the Best Performing CFO Award in Logistics Sector from CNBC TV18 in 2006.
Mr. Tushar Mavani has a large background in legal world and is a partner with Cyril Amarchand Mangaldas, Advocates & Solicitors which ranks as one of the most prestigious law firms in India and has been in practice since 1991. Prior to this, Mr. Mavani was a partner with Mulla & Mulla & Craigie Blunt & Caroe, Advocates & Solicitors and thereafter a partner with Amarchand & Mangaldas & Suresh A. Shroff & Co. Mr. Mavani is a graduate in Commerce and Law from Mumbai University.
4 Annual Report 2018-19
Board Evaluation – The Nomination and Remuneration Committee of the Company’s Board has formulated the criteria for performance evaluation of the
Directors and the Board as a whole. The Criteria formulated broadly covers the Board role, Board/Committee membership, practice & procedure and collaboration & style.
In line with SEBI Guidance note on Board Evaluation, a Board effectiveness assessment questionnaire was designed for the performance evaluation of the Board, its Committees, Chairman and individual directors in accordance with the criteria set and covering various aspects of performance including Structure and composition of the Board, relationship among directors, director competency, contribution to risk management compliance, roles and responsibility, board procedures, processes, functioning and effectiveness. The said questionnaire was circulated to all the directors of the Company for the annual performance evaluation.
Based on the assessment of the responses received to the questionnaire from the directors on the annual evaluation of the Board, it’s Committees, Chairman and the individual Directors, a summary of the Board Evaluation was placed before the meeting of the Independent Directors for consideration. Similarly, the Board at its meeting assessed the performance of the Independent Directors and expressed satisfaction with the results of evaluation of the Board, Performance of the Board Committees, Chairman and individual directors.
Key Managerial Personnel (KMP’s) Change in Key Managerial Personnel
During the year Mr. Vinod A.N resigned from the post of manager of the Company with effect from 30th June 2018 and Mr. Sandeep Shrikhande was appointed as manager of the Company from 1st July 2018.
The following officials continue to be the “Key Managerial Personnel” pursuant to the provisions of Section 203 of Companies Act, 2013:
1. Mr. Krishnan Ramchandran – Chief Financial Officer
2. Ms. Darshana Baliya – Company Secretary
Appointment & Remuneration of Directors and KMPs
The Nomination and Remuneration Committee of the Board of Directors of the Company has formulated criteria for appointment of Senior Management personnel and the Directors. Based on the criteria set it recommends to the Board the appointment of Directors and Senior Management personnel. The Committee considers the qualifications, experience fit & proper status, positive attributes as per the suitability of the role and independent status and various regulatory/statutory requirements as may be required of the candidate before such appointment.
The Board has adopted the Remuneration Policy for the Whole-time Directors, Chief Executive Officer and other employees of the Company. The Policy is in line with the Compensation Policy of Kotak Mahindra Bank Ltd., its holding company, which is based on the Guidelines issued by Reserve Bank of India. The salient features of the Remuneration Policy are as follows:
• Objectiveistomaintainfair,consistentandequitablecompensationpracticesinalignmentwithKotak’scorevaluesandstrategicbusiness goals.
• ApplicabletoallemployeesoftheCompany.Employeesclassifiedinto3groups:
o Whole-time Directors/Chief Executive Officer
o Risk, Operations & Support Staff
o Other categories of Staff
• CompensationstructurebroadlydividedintoFixed,VariableandESOPs
o Fixed Pay – Total cost to the Company i.e. Salary, Retirals and Other Benefits
o Variable Pay – Linked to assessment of performance and potential based on Balanced Key Result Areas (KRAs), Standards of Performance and achievement of targets with overall linkage to Bank budgets and business objectives. The main form of incentive compensation includes – Cash, Deferred Cash/Incentive Plan and Stock Appreciation Rights.
o ESOPs – Granted on a discretionary basis to employee based on their performance and potential with the objective of retaining the employee.
5
Financial HighlightsBank Reports and
StatementsConsolidated Financial
StatementsDirectors Report
Courage of Conviction.Constancy of Change.
• CompensationComposition–TheratioofVariablePaytoFixedPayandtheratioofCashv/sNonCashwithinVariablepayoutlinedfor each category of employee classification.
• AnyvariationinthePolicytobewithapprovaloftheNomination&RemunerationCommittee.
• MalusandClawbackclausesapplicableonDeferredVariablePay.
The Independent Directors are only in receipt of sitting fees for attending the meeting from the Company. Remuneration to the KMPs i.e. Chief Executive Officer, Chief Financial Officer and the Company Secretary, is as per the terms of their employment.
7. NUMBER OF BOARD MEETINGS
Board Meetings During the year, six Board Meetings were held. The maximum interval between any two meetings did not exceed 120 days.
Declaration from Independent Directors The Board has received declarations from all Independent Directors as per the requirement of Section 149(7) of the Companies Act, 2013
and the Board is satisfied that all the Independent Directors meet the criteria of independence as mentioned in Section 149(6) of the Act.
8. COMMITTEES
a) Audit Committee In terms of the requirement of Section 177 of Companies Act, 2013, the Audit Committee presently consists of Mr. Balan Wasudeo
(Chairman), Mr. Tushar Mavani and Mr. Nilesh Shah with any two members forming the quorum.
During the year, five meetings of the committees were held. There were no cases where recommendations of Audit Committee were not accepted by the Board of Directors of your Company.
b) Nomination & Remuneration Committee In terms of the requirement of Section 178 of Companies Act, 2013, the Nomination and Remuneration Committee presently
consists of Mr. Balan Wasudeo (Chairman), Mr. Tushar Mavani and Mr. Sudhakar Shanbhag with any two members forming the quorum.
During the year, four meetings of the committee were held.
c) Risk Management Committee Pursuant to the revised Investment Management Agreement signed with NPS Trust, Risk Management Committee was constituted
to analyze and review the risk associated with managing the Pension Fund business and risk mitigants put in place. It consists of Mr. Tushar Mavani (Chairman), Mr. Sudhakar Shanbhag, Mr. Sandeep Shrikhande- Chief Executive Officer, Mr. Vinod A N- Fund Manager and Ms. Darshana Baliya – Company Secretary with any two members forming the quorum.
During the year, four meetings of the committee were held.
d) Investment Committee Pursuant to the revised Investment Management Agreement signed with NPS Trust, Investment Committee was constituted to
ensure that all investments are carried out as per the provisions of PFRDA Guidelines/directions and to ensure that all investments are made consistent with the protection, safety and liquidity of such funds, in the interest of the subscribers. It presently consists of viz. Mr. Balan Wasudeo (Chairman), Mr. Sudhakar Shanbhag, Mr. Nilesh Shah, Mr. Sandeep Shrikhande – Chief Executive Officer and Mr. Vinod A N – Fund Manager with any two members forming the quorum.
During the year, four meetings of the committee were held.
6 Annual Report 2018-19
9. AUDITORS In terms of Section 139 of the Companies Act, 2013, Khimji Kunverji & Co, Chartered Accountants, (Firm Reg. No. 105146W) were
appointed as statutory auditors of the Company for a period of three years from the conclusion of the eighth Annual General Meeting until the conclusion of the eleventh Annual General Meeting of the Company subject to the ratification by the members every year. Auditors - Khimji Kunverji & Co, Chartered Accountants, (Firm reg No: 105146W) has resigned as statutory Auditor of the Company for the financial year 2019-20 due to a possible conflict of the role of statutory Auditors having regards to other engagement with a group company. Gokhale & Sathe, Chartered Accounts (Firm reg No103264W) is proposed to be appointed as statutory auditor of the Company to hold office from the conclusion of the tenth Annual General Meeting till the conclusion of the Annual General Meeting to be held for FY 2021-22.
10. INTERNAL FINANCIAL CONTROLS The Board of Directors confirms that it has established a governance framework and a control environment including internal controls
commensurate with the size; scale and complexity of its operations with reference to the Financial Statements and that such controls are operating effectively. During the year under review, no material observation has been observed for inefficiency or inadequacy of such controls
11. RELATED PARTY TRANSACTIONS All Related Party Transactions that were entered into during the financial year were on arm’s length basis and were in the ordinary course
of business.
Pursuant to Section 134(3) (h) read with Rule 8(2) of the Companies (Accounts) Rules, 2014, there are no transactions to be reported under Section 188(1) of the Companies Act, 2013, in form AOC-2.
All Related Party Transactions as required under Accounting Standards AS18 are reported in Notes to Financial Statement under clause no. 25
12. PARTICULARS OF LOAN GUARANTEES OR INVESTMENTS U/S 186 During the year the company has not given any loans, guarantees or has made investments which attract the provisions of Section 186
of Companies Act, 2013.
13. WHISTLE BLOWER POLICY: Your Company has put in place the Whistle blower policy to raise concerns internally and to disclose information, which the individual
believes shows malpractice, serious irregularities, fraud, unethical business conduct, abuse or wrong doing or violation of any Indian law. The Kotak Group endeavors to develop a culture where it is safe and acceptable for all employees and directors to raise / voice genuine concerns in good faith and in a responsible as well as effective manner.
14. RISK MANAGEMENT Your Company acts as Pension Fund Manager for managing the funds under NPS.
Pension Fund schemes are governed by the Investment Management Agreement (IMA) including any amendment thereof and the PFRDA Act 2013, regulations, applicable provisions of the NPS, the Schemes, the guidelines/notifications issued by the Authority, Ministry of Finance, Government of India, from time to time, as per the Applicable Law
The IMA provides for constitution of Risk Management Committee and to draw up a Risk Policy to consider:
a. Risk management functions
b. Disaster recovery and business contingency plans
c. Insurance cover against risks
d. Ensuring a risk adjusted return to subscribers consistent with the protection, safety and liquidity of such funds.
Our risk Management Policy has been approved by the Board and is implemented by the Risk Management Committee, which keeps the Board informed periodically about its activities. The Board periodically updates the NPS Trust on the same.
The policy gives detailed guidelines in the areas of Fund management, Operations and other risks associated with the pension fund business. The said practices are audited by the internal auditors and the audit report is presented to the boards of KMPFL on a quarterly basis.
7
Financial HighlightsBank Reports and
StatementsConsolidated Financial
StatementsDirectors Report
Courage of Conviction.Constancy of Change.
Liquidity Management
RBI in its Circular No. DBOD.BP.NO.56/21.04.098/2012-13 dated November 7, 2012 had stipulated that Banks need to put in Place a framework for monitoring institution-wide Liquidity risk and for overseeing operating subsidiaries and foreign branches, Further, the RBI, in its Annual Financial Inspection report has directed the Bank to implement a Group wide Liquidity risk management framework.
Based on the above Kotak Mahindra Bank Ltd (Bank) and its group companies have adopted a Liquidity Risk Management Policy. The Board of Directors has adopted Liquidity Risk Management Policy which is line with the Kotak Bank Policy.
The Company invests its surplus funds in the Liquid / debt schemes of Kotak Mahindra Mutual Fund. The Company’s surplus Funds were invested by the authorized personnel of the Company, as per the mandate of the Board of Directors. All expenses (including revenue and capital) during the year were also authorized by personnel duly authorized by the Board of Directors.
15. DEPOSITS Your Company neither invited nor accepted any deposit from the public falling within the ambit of Section 73 of the Companies Act,
2013 and The Companies (Acceptance of Deposits) Rules, 2014 during the year. Also, there are no deposits due and outstanding as on 31st March 2019.
16. CONSERVATION OF ENERGY, TECHNOLOGY ABSORPTION, FOREIGN EXCHANGE EARNINGS AND OUTGO The provisions pertaining to the Conservation of Energy and Technology Absorption are not applicable to your Company.
During the financial year ended 31st March 2019 the Company has no foreign exchange inflow and outgo of ` Nil (Previous Year: Nil).
17. MATERIAL CHANGES AND COMMITMENTS, IF ANY, AFFECTING THE FINANCIAL POSITION OF THE COMPANY As per 134(3) (l) of the Companies Act, 2013, there have been no material changes and commitments affecting the financial position of
your Company which have occurred between the end of the financial year of the Company to which the financial statements relate and the date of the report.
18. SIGNIFICANT AND MATERIAL ORDERS PASSED BY THE REGULATORS OR COURTS WHICH IMPACTS GOING CONCERN STATUS AND COMPANY OPERATIONS IN FUTURE. There have been no orders passed by the Regulators / Courts, which would impact the going concern status of your Company and its
future operations, during the financial year.
19. DIRECTORS RESPONSIBILITY STATEMENT The Directors, based on the representations received from the management, confirm in pursuance of Section 134(5) of the Companies
Act, 2013 that:
i. Your Company has, in the preparation of the annual accounts followed the applicable accounting standards along with proper explanations relating to material departures, if any;
ii. the Directors have selected such accounting policies and applied them consistently and made judgments and estimates that are reasonable and prudent so as to give a true and fair view of the state of affairs of your Company as at 31st March 2019 and of Profit/Loss of your Company for the financial year ended 31st March 2019;
iii. the Directors have taken proper and sufficient care to the best of their knowledge and ability, for the maintenance of adequate accounting records in accordance with the provisions of the Act for safeguarding the assets of your Company and for preventing and detecting fraud and other irregularities; and
iv. the Directors have prepared the annual accounts on a going concern basis.
v. the Directors have devised proper systems to ensure compliance with the provisions of all applicable laws and that such systems are adequate and operating effectively.

8 Annual Report 2018-19
ANNEXUREFollowing statement is set out as annexure to the Directors’ Report:
(a) Extract of Annual Return under Section 134(3)(a) of the Companies Act, 2013 read with Rule 12(1) of Companies (Management & Administration) Rules, 2014 (Annexure – A).
ACKNOWLEDGEMENTYour Directors thank the subscribers, customers and business associates for reposing their trust in the Company. The Directors also thank the Company’s employees for their continued hard work, dedication and commitment; and the Management for continuing success of the business.
Your Directors takes this opportunity to place on record their gratitude for the valuable guidance and support received from the Pension Fund Regulatory and Development Authority, NPS Trust and other statutory and regulatory authorities for their support, advice and direction provided from time to time.
For and on behalf of the Board of Directors
MumbaiJune 07, 2019
Sudhakar ShanbhagDirector
Balan WasudeoDirector

9
Financial HighlightsBank Reports and
StatementsConsolidated Financial
StatementsDirectors Report
Courage of Conviction.Constancy of Change.
I. REGISTRATION AND OTHER DETAILS
1. CIN U67200MH2009PLC191144
2. Registration Date March 23, 2009
3. Name of the Company Kotak Mahindra Pension Fund Limited
4. Category/Sub-Category of the Company Public Company limited by shares
5. Address of the Registered office and contact Details 27BKC, C 27, G Block, Bandra Kurla Complex, Bandra (E), Mumbai – 400051,Tel No. : (022) 66056825Fax No.: (022) 66384455
6. Whether listed Company (Yes/No) No
7. Name, Address and Contact details of Registrar and Transfer Agent, if any
Not Applicable
II. PRINCIPAL BUSINESS ACTIVITIES OF THE COMPANY All the business activities contributing 10 % or more of the total turnover of the company shall be stated:-
Sr.No.
Name and Description of Main Product/Services NIC Code of the Product
% to total turnover of the Company
1. Management of Pension Funds 66302 100%
III. PARTICULARS OF HOLDING, SUBSIDIARY AND ASSOCIATE COMPANIES –
Sr.No.
Name and Address of the Company CIN/GIN
Holding/Subsidiary ofthe Company
% ofshares held
ApplicableSection
1. Kotak Mahindra Bank LimitedAddress: 27 BKC, C 27, G Block, Bandra Kurla Complex, Bandra (E), Mumbai 400051
L65110MH1985PLC038137 Holding Company 4.29 2(46)
2. Kotak Mahindra Asset Management Company Limited Address: 27 BKC, C 27, G Block, Bandra Kurla Complex, Bandra (E), Mumbai 400051
U65991MH1994PLC080009 Holding Company 95.71 2(46)
ANNEXURE A TO THE DIRECTORS’ REPORT
Form No. MGT-9EXTRACT OF ANNUAL RETURN
as on the financial year ended on March 31, 2019
[Pursuant to section 92(3) of the Companies Act, 2013 and rule 12(1) of theCompanies (Management and Administration) Rules, 2014]
10 Annual Report 2018-19
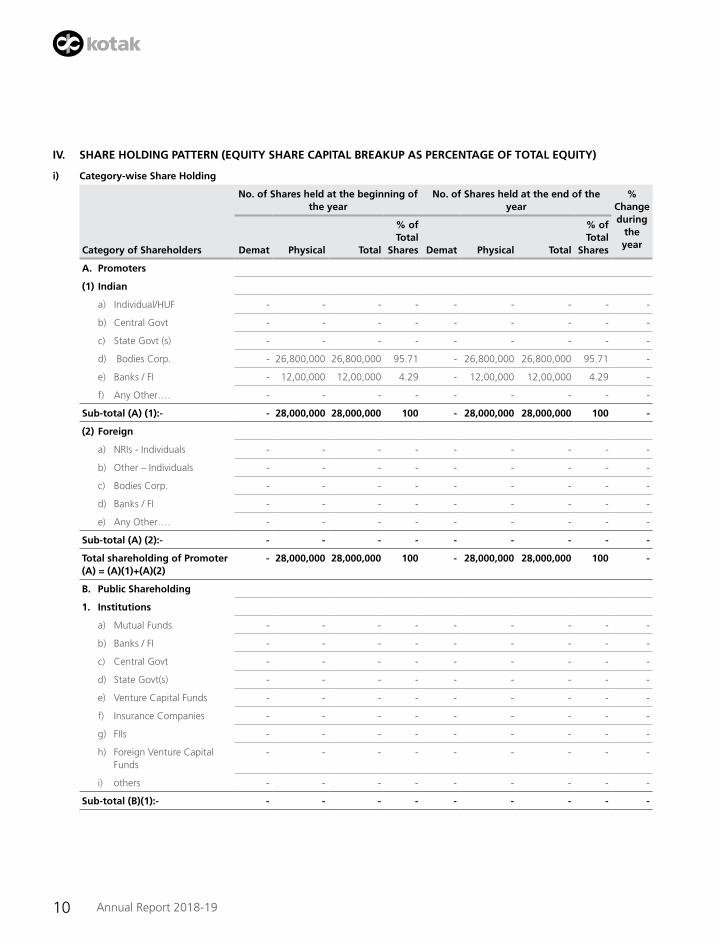
IV. SHARE HOLDING PATTERN (EqUITY SHARE CAPITAL BREAKUP AS PERCENTAGE OF TOTAL EqUITY)
i) Category-wise Share Holding
Category of Shareholders
No. of Shares held at the beginning of the year
No. of Shares held at the end of the year
% Change during
the yearDemat Physical Total
% of Total
Shares Demat Physical Total
% of Total
Shares
A. Promoters
(1) Indian
a) Individual/HUF - - - - - - - - -
b) Central Govt - - - - - - - - -
c) State Govt (s) - - - - - - - - -
d) Bodies Corp. - 26,800,000 26,800,000 95.71 - 26,800,000 26,800,000 95.71 -
e) Banks / FI - 12,00,000 12,00,000 4.29 - 12,00,000 12,00,000 4.29 -
f) Any Other…. - - - - - - - - -
Sub-total (A) (1):- - 28,000,000 28,000,000 100 - 28,000,000 28,000,000 100 -
(2) Foreign
a) NRIs - Individuals - - - - - - - - -
b) Other – Individuals - - - - - - - - -
c) Bodies Corp. - - - - - - - - -
d) Banks / FI - - - - - - - - -
e) Any Other…. - - - - - - - - -
Sub-total (A) (2):- - - - - - - - - -
Total shareholding of Promoter (A) = (A)(1)+(A)(2)
- 28,000,000 28,000,000 100 - 28,000,000 28,000,000 100 -
B. Public Shareholding
1. Institutions
a) Mutual Funds - - - - - - - - -
b) Banks / FI - - - - - - - - -
c) Central Govt - - - - - - - - -
d) State Govt(s) - - - - - - - - -
e) Venture Capital Funds - - - - - - - - -
f) Insurance Companies - - - - - - - - -
g) FIIs - - - - - - - - -
h) Foreign Venture Capital Funds
- - - - - - - - -
i) others - - - - - - - - -
Sub-total (B)(1):- - - - - - - - - -
11
Financial HighlightsBank Reports and
StatementsConsolidated Financial
StatementsDirectors Report
Courage of Conviction.Constancy of Change.
Category of Shareholders
No. of Shares held at the beginning of the year
No. of Shares held at the end of the year
% Change during
the yearDemat Physical Total
% of Total
Shares Demat Physical Total
% of Total
Shares
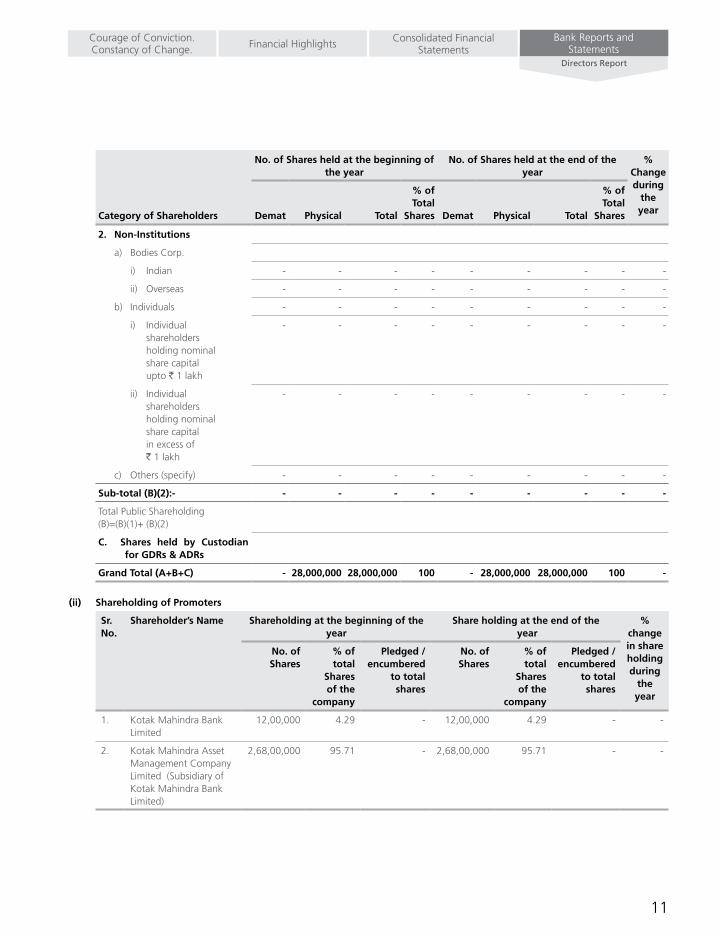
2. Non-Institutions
a) Bodies Corp.
i) Indian - - - - - - - - -
ii) Overseas - - - - - - - - -
b) Individuals - - - - - - - - -
i) Individual shareholders holding nominal share capital upto ` 1 lakh
- - - - - - - - -
ii) Individual shareholders holding nominal share capital in excess of ` 1 lakh
- - - - - - - - -
c) Others (specify) - - - - - - - - -
Sub-total (B)(2):- - - - - - - - - -
Total Public Shareholding (B)=(B)(1)+ (B)(2)
C. Shares held by Custodian for GDRs & ADRs
Grand Total (A+B+C) - 28,000,000 28,000,000 100 - 28,000,000 28,000,000 100 -
(ii) Shareholding of Promoters
Sr.No.
Shareholder’s Name Shareholding at the beginning of the year
Share holding at the end of the year
% change in share holding during
the year
No. of Shares
% of total
Shares of the
company
Pledged / encumbered
to total shares
No. of Shares
% of total
Shares of the
company
Pledged / encumbered
to total shares
1. Kotak Mahindra Bank Limited
12,00,000 4.29 - 12,00,000 4.29 - -
2. Kotak Mahindra Asset Management Company Limited (Subsidiary of Kotak Mahindra Bank Limited)
2,68,00,000 95.71 - 2,68,00,000 95.71 - -

12 Annual Report 2018-19
(iii) Change in Promoters’ Shareholding
Sr.No.
Shareholding at the beginning of the year
Cumulative Shareholding during the year
No. ofshares
% of total shares of the
companyNo. ofshares
% of total shares of the
company
At the beginning of the year - - - -
Date wise Increase / Decrease in Promoters Share holding during the year specifying the reasons for increase/ decrease (e.g. allotment / transfer / bonus/ sweat
- - - -
At the end of the year - - - -
(iv) Shareholding Pattern of top ten Shareholders (other than Directors, Promoters and Holders of GDRs and ADRs):
Sr.No.
Shareholding at the beginning of the year
Cumulative Shareholding during the year
No. ofshares
% of total shares of the company
No. ofshares
% of total shares of the company
At the beginning of the year - - - -
Date wise Increase / Decrease in Share holding during the year specifying the reasons for increase / decrease (e.g.allotment / transfer / bonus/ sweat equity etc):
- - - -
At the End of the year ( or on the date of separation, if separated during the year)
- - - -
(v) Shareholding of Directors and Key Managerial Personnel:
For Each of the Directors and KMP
Shareholding at the beginning of the year
Cumulative Shareholding during the year
No. of shares
% of total shares of the company
No. of shares
% of total shares of the company
Mr. Krishnan Ramchandran – Chief Financial Officer (as nominee of Kotak Mahindra Asset Management Co. Ltd.)
At the beginning of the year 10 # 10 #
Date wise Increase / Decrease in Share holding during the year specifying the reasons for increase / decrease (e.g. allotment / transfer / bonus/ sweatequity etc):
- - - -
At the End of the year 10 # 10 #
13
Financial HighlightsBank Reports and
StatementsConsolidated Financial
StatementsDirectors Report
Courage of Conviction.Constancy of Change.
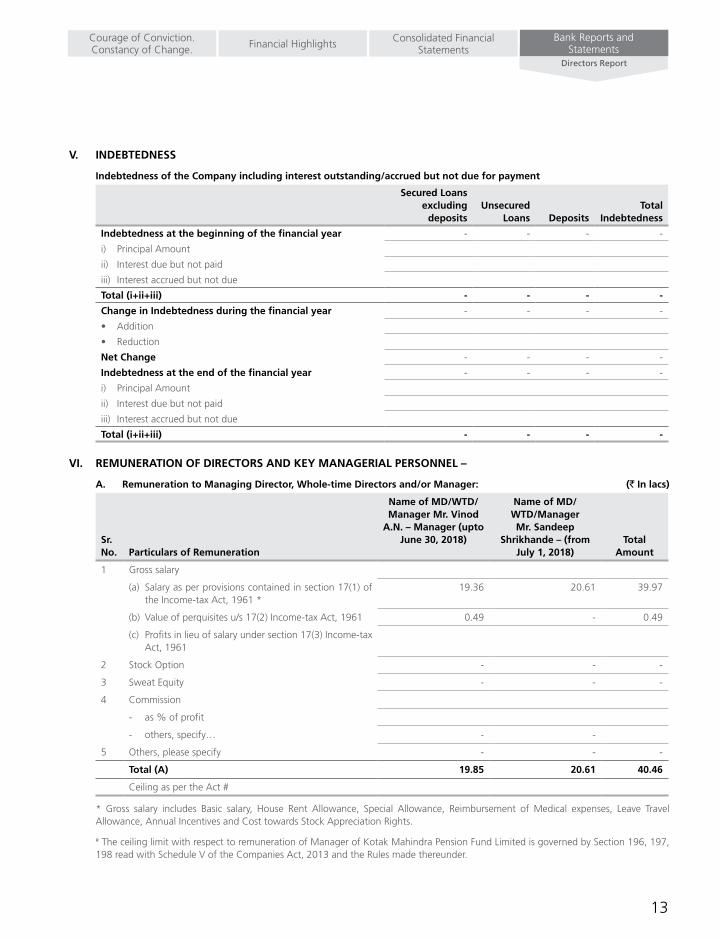
V. INDEBTEDNESS
Indebtedness of the Company including interest outstanding/accrued but not due for payment
Secured Loans excluding
depositsUnsecured
Loans DepositsTotal
Indebtedness
Indebtedness at the beginning of the financial year - - - -
i) Principal Amount
ii) Interest due but not paid
iii) Interest accrued but not due
Total (i+ii+iii) - - - -
Change in Indebtedness during the financial year - - - -
• Addition
• Reduction
Net Change - - - -
Indebtedness at the end of the financial year - - - -
i) Principal Amount
ii) Interest due but not paid
iii) Interest accrued but not due
Total (i+ii+iii) - - - -
VI. REMUNERATION OF DIRECTORS AND KEY MANAGERIAL PERSONNEL –
A. Remuneration to Managing Director, Whole-time Directors and/or Manager: (` In lacs)
Sr. No. Particulars of Remuneration
Name of MD/WTD/Manager Mr. Vinod
A.N. – Manager (upto June 30, 2018)
Name of MD/WTD/Manager Mr. Sandeep
Shrikhande – (from July 1, 2018)
TotalAmount
1 Gross salary
(a) Salary as per provisions contained in section 17(1) of the Income-tax Act, 1961 *
19.36 20.61 39.97
(b) Value of perquisites u/s 17(2) Income-tax Act, 1961 0.49 - 0.49
(c) Profits in lieu of salary under section 17(3) Income-tax Act, 1961
2 Stock Option - - -
3 Sweat Equity - - -
4 Commission
- as % of profit
- others, specify… - -
5 Others, please specify - - -
Total (A) 19.85 20.61 40.46
Ceiling as per the Act #
* Gross salary includes Basic salary, House Rent Allowance, Special Allowance, Reimbursement of Medical expenses, Leave Travel Allowance, Annual Incentives and Cost towards Stock Appreciation Rights.
# The ceiling limit with respect to remuneration of Manager of Kotak Mahindra Pension Fund Limited is governed by Section 196, 197, 198 read with Schedule V of the Companies Act, 2013 and the Rules made thereunder.
14 Annual Report 2018-19
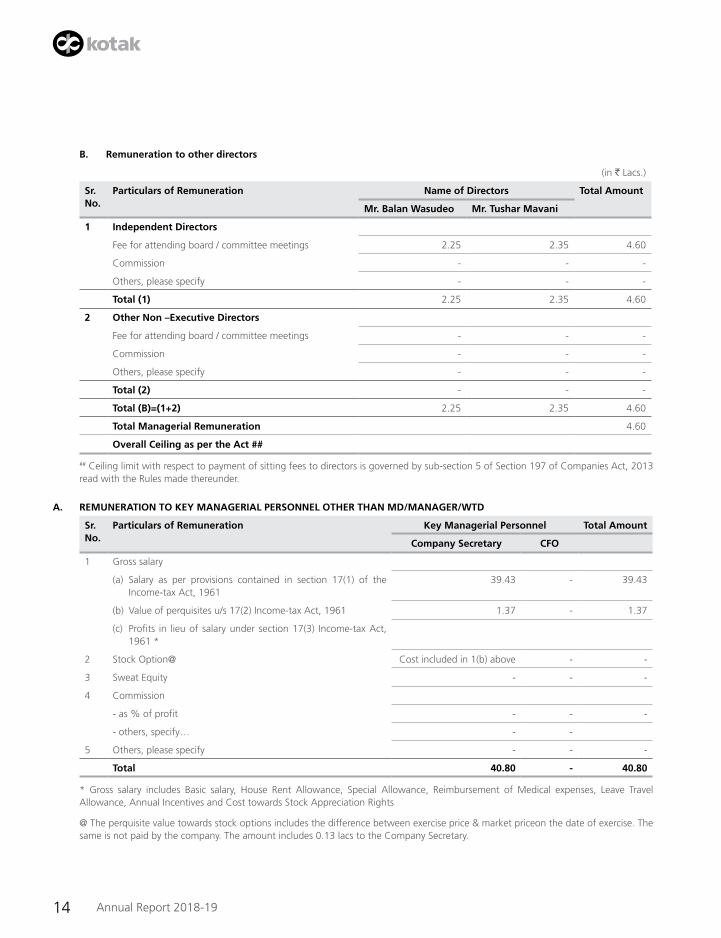
B. Remuneration to other directors
(in ` Lacs.)
Sr.No.
Particulars of Remuneration Name of Directors Total Amount
Mr. Balan Wasudeo Mr. Tushar Mavani
1 Independent Directors
Fee for attending board / committee meetings 2.25 2.35 4.60
Commission - - -
Others, please specify - - -
Total (1) 2.25 2.35 4.60
2 Other Non –Executive Directors
Fee for attending board / committee meetings - - -
Commission - - -
Others, please specify - - -
Total (2) - - -
Total (B)=(1+2) 2.25 2.35 4.60
Total Managerial Remuneration 4.60
Overall Ceiling as per the Act ##
## Ceiling limit with respect to payment of sitting fees to directors is governed by sub-section 5 of Section 197 of Companies Act, 2013 read with the Rules made thereunder.
A. REMUNERATION TO KEY MANAGERIAL PERSONNEL OTHER THAN MD/MANAGER/WTD
Sr.No.
Particulars of Remuneration
Key Managerial Personnel Total Amount
Company Secretary CFO
1 Gross salary
(a) Salary as per provisions contained in section 17(1) of the Income-tax Act, 1961
39.43 - 39.43
(b) Value of perquisites u/s 17(2) Income-tax Act, 1961 1.37 - 1.37
(c) Profits in lieu of salary under section 17(3) Income-tax Act, 1961 *
2 Stock Option@ Cost included in 1(b) above - -
3 Sweat Equity - - -
4 Commission
- as % of profit - - -
- others, specify… - -
5 Others, please specify - - -
Total 40.80 - 40.80
* Gross salary includes Basic salary, House Rent Allowance, Special Allowance, Reimbursement of Medical expenses, Leave Travel Allowance, Annual Incentives and Cost towards Stock Appreciation Rights
@ The perquisite value towards stock options includes the difference between exercise price & market priceon the date of exercise. The same is not paid by the company. The amount includes 0.13 lacs to the Company Secretary.
15
Financial HighlightsBank Reports and
StatementsConsolidated Financial
StatementsDirectors Report
Courage of Conviction.Constancy of Change.
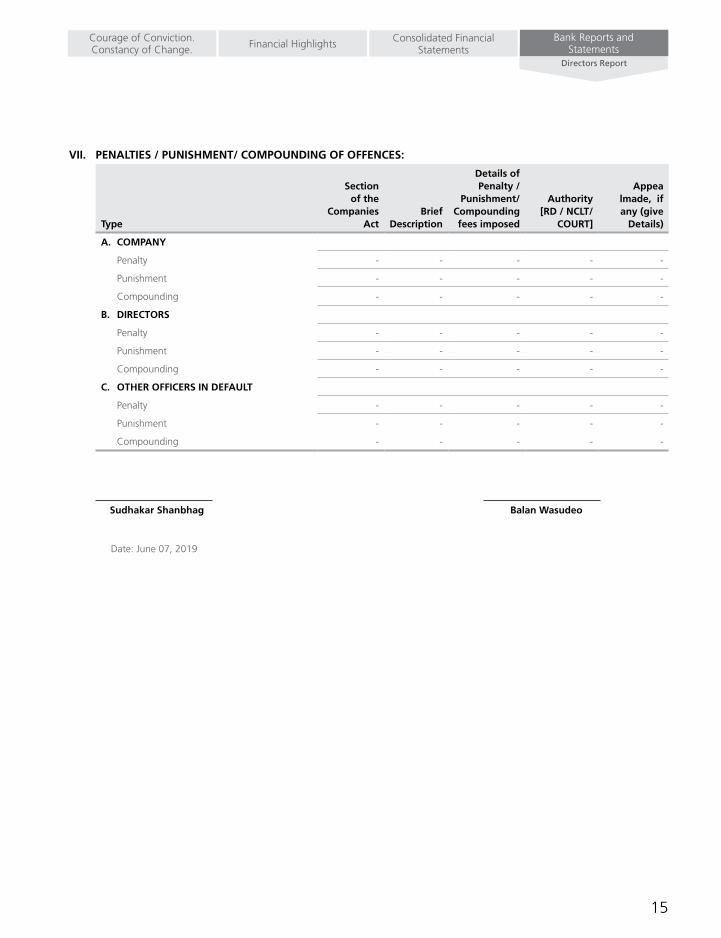
VII. PENALTIES / PUNISHMENT/ COMPOUNDING OF OFFENCES:
Type
Section of the
Companies Act
Brief Description
Details of Penalty /
Punishment/ Compounding fees imposed
Authority [RD / NCLT/
COURT]
Appea lmade, if any (give
Details)
A. COMPANY
Penalty - - - - -
Punishment - - - - -
Compounding - - - - -
B. DIRECTORS
Penalty - - - - -
Punishment - - - - -
Compounding - - - - -
C. OTHER OFFICERS IN DEFAULT
Penalty - - - - -
Punishment - - - - -
Compounding - - - - -
Sudhakar Shanbhag Balan Wasudeo
Date: June 07, 2019
16 Annual Report 2018-19
To The Members of KOTAK MAHINDRA PENSION FUND LIMITED
REPORT ON THE AUDIT OF THE STANDALONE IND AS FINANCIAL STATEMENTS
OPINION1. We have audited the accompanying standalone Ind AS financial statements of Kotak Mahindra Pension Fund Limited
(‘the Company’), which comprise the Balance Sheet as at March 31, 2019, the Statement of Profit and Loss (including Other Comprehensive Income), the Statement of Changes in Equity and the Statement of Cash Flows for the year then ended, and notes to the financial statements, including a summary of significant accounting policies and other explanatory information. In our opinion and to the best of our information and according to the explanations given to us, the aforesaid standalone Ind AS financial statements give the information required by the Companies Act, 2013 (‘the Act’) in the manner so required and give a true and fair view in conformity with the accounting principles generally accepted in India, of the state of affairs of the Company as at March 31, 2019, and its profit (including other comprehensive income), changes in equity and its cash flows for the year ended on that date.
BASIS FOR OPINION2. We conducted our audit in accordance with the Standards on Auditing (‘SAs’) specified under section 143(10) of the Act. Our
responsibilities under those Standards are further described in the Auditor’s Responsibilities for the Audit of the Standalone Ind AS Financial Statements section of our report. We are independent of the Company in accordance with the Code of Ethics issued by the Institute of Chartered Accountants of India (‘ICAI’) together with the ethical requirements that are relevant to our audit of the financial statements under the provisions of the Act and the Rules thereunder; and we have fulfilled our other ethical responsibilities in accordance with these requirements and the Code of Ethics. We believe that the audit evidence we have obtained is sufficient and appropriate to provide a basis for our opinion.
INFORMATION OTHER THAN THE FINANCIAL STATEMENTS AND AUDITOR’S REPORT THEREON3. The Company’s Board of Directors is responsible for the preparation of the other information, comprising of the information included
in the Management Discussion and Analysis, Directors’ Report including Annexures to Directors’ Report, Corporate Governance and such other disclosures related Information, excluding the standalone Ind AS financial statements and auditors report thereon (‘Other Information’). The other information is expected to be made available to us after the date of this auditors’ report. Our opinion on the standalone Ind AS financial statements does not cover the other information and we do not express any form of assurance conclusion thereon.
In connection with our audit of the standalone Ind AS financial statements, our responsibility is to read the other information when it becomes available and, in doing so, consider whether the other information is materially inconsistent with the standalone Ind AS financial statements or our knowledge obtained during the course of our audit or otherwise appears to be materially misstated.
When we read the other Information and if we conclude that there is a material misstatement therein, we are required to communicate the matter to those charges with governance as required under SA 720 ‘The Auditor’s responsibilities Relating to other Information’
RESPONSIBILITY OF MANAGEMENT FOR STANDALONE IND AS FINANCIAL STATEMENTS4. The Company’s Board of Directors is responsible for the matters stated in section 134(5) of the Act with respect to the preparation of
these standalone Ind AS financial statements that give a true and fair view of the financial position, financial performance including other comprehensive income, changes in equity and cash flows of the Company in accordance with the accounting principles generally accepted in India, including the Accounting Standards specified under prescribed Section 133 of the Act. This responsibility also includes maintenance of adequate accounting records in accordance with the provisions of the Act for safeguarding of the assets of the Company and for preventing and detecting frauds and other irregularities; selection and application of appropriate accounting policies; making judgments and estimates that are reasonable and prudent; design, implementation and maintenance of adequate internal financial controls, that were operating effectively for ensuring the accuracy and completeness of the accounting records, relevant to the preparation and presentation of the standalone Ind AS financial statements that give a true and fair view and are free from material misstatement, whether due to fraud or error. In preparing the standalone Ind AS financial statements, management is responsible for assessing the Company’s ability to continue as a going concern, disclosing, as applicable, matters related to going concern and using the going concern basis of accounting unless management either intends to liquidate the Company or to cease operations, or has no realistic alternative but to do so.
The Board of Directors are also responsible for overseeing the Company’s financial reporting process.
Independent Auditor’s Report
17
Bank Reports and Statements
Consolidated Financial StatementsFinancial HighlightsCourage of Conviction.
Constancy of Change.Independent Auditor’s Report
Auditor’s Responsibilities for the Audit of the Standalone Ind AS Financial Statements
Our objectives are to obtain reasonable assurance about whether the standalone Ind AS financial statements, as a whole are free from material misstatement, whether due to fraud or error, and to issue an auditor’s report that includes our opinion. Reasonable assurance is a high level of assurance, but is not a guarantee that an audit conducted in accordance with SAs will always detect a material misstatement when it exists. Misstatements can arise from fraud or error and are considered material if, individually or in the aggregate, they could reasonably be expected to influence the economic decisions of users taken on the basis of these standalone Ind AS financial statements. Our audit process in accordance with the SAs is narrated in Annexure 1 to this report.
REPORT ON OTHER LEGAL AND REGULATORY REqUIREMENTS5. As required by the Companies (Auditor’s Report) Order, 2016 (‘the Order’), issued by the Central Government of India in terms of sub-
section (11) of section 143 of the Act, we give in the Annexure 2, a statement on the matters specified in paragraphs 3 and 4 of the Order.
6. As required by section 143(3) of the Act, we report that:
a. We have sought and obtained all the information and explanations which to the best of our knowledge and belief were necessary for the purposes of our audit.
b. In our opinion, proper books of account as required by law have been kept by the Company so far as it appears from our examination of those books.
c. The Balance Sheet, the Statement of Profit and Loss including Other Comprehensive Income, the Statement of Changes in Equity and the Cash Flow Statement dealt with by this Report are in agreement with the books of account.
d. In our opinion, the aforesaid standalone Ind AS financial statements comply with the Accounting Standards specified under section 133 of the Act, read with Rule 7 of the Companies (Accounts) Rules, 2014.
e. On the basis of the written representations received from the directors as on March 31, 2019, taken on record by the Board of Directors, none of the directors is disqualified as on March 31, 2019 from being appointed as a director in terms of section 164 (2) of the Act.
f. With respect to the adequacy of the internal financial controls over financial reporting of the Company and the operating effectiveness of such controls, refer to our separate Report in Annexure 3.
g. In terms of provisions of Section 197(16) of the Act, as per the information and explanations given, we report that the managerial remuneration paid by the Company to its Directors is in accordance with provisions of Section 197 of the Act.
h. With respect to the other matters to be included in the Auditor’s Report in accordance with Rule 11 of the Companies (Audit and Auditors) Rules, 2014, in our opinion and to the best of our information and according to the explanations given to us, we report as under:
(i) The Company has disclosed the impact of pending litigations on the financials position in its standalone Ind AS financial statements.[Refer note 26 to the Standalone Ind AS Financial Statements];
(ii) The Company did not have any long-term contracts including derivative contracts for which there were any material foreseeable losses.
(iii) There has been no delay in transferring amounts, required to be transferred to the Investor Education and Protection Fund by the Company.
For Khimji Kunverji & Co LLP(Formerly Khimji Kunverji & CoFRN 105146W)
Chartered Accountants
Hasmukh B Dedhia Partner (F - 033494)
Place: Mumbai\ Date: June 7, 2019
18 Annual Report 2018-19
Annexure 1 to the Independent Auditors’ Report to the members of Kotak Mahindra Pension Fund Limited (referred to in para 4 titled “Auditor’s Responsibilities for the Audit of the Standalone Ind AS Financial Statements”)
As part of our audit in accordance with SAs we exercise professional judgment and maintain professional scepticism throughout the audit. We also:• Identifyandassesstherisksofmaterialmisstatementofthefinancialstatements,whetherduetofraudorerror,todesignandperform
audit procedures responsive to those risks, and obtain audit evidence that is sufficient and appropriate to provide a basis for our opinion. The risk of not detecting a material misstatement resulting from fraud is higher than for one resulting from error, as fraud may involve collusion, forgery, intentional omissions, misrepresentations, or the override of internal control.
• Obtain an understanding of internal control relevant to the audit in order to design audit procedures that are appropriate in thecircumstances. Under section 143(3)(i) of the Act, we are also responsible for expressing our opinion on whether the Company has adequate internal financial controls system in place and the operating effectiveness of such controls.
• Evaluatetheappropriatenessofaccountingpoliciesusedandthereasonablenessofaccountingestimatesandrelateddisclosuresmadeby management.
• Concludeontheappropriatenessofmanagement’suseofthegoingconcernbasisofaccountingand,basedontheauditevidenceobtained, whether a material uncertainty exists related to events or conditions that may cast significant doubt on the Company’s ability to continue as a going concern. If we conclude that a material uncertainty exists, we are required to draw attention in our auditor’s report to the related disclosures in the financial statements or, if such disclosures are inadequate, to modify our opinion. Our conclusions are based on the audit evidence obtained up to the date of our auditor’s report. However, future events or conditions may cause the Company to cease to continue as a going concern.
• Evaluatetheoverallpresentation,structureandcontentofthefinancialstatements,includingthedisclosures,andwhetherthefinancialstatements represent the underlying transactions and events in a manner that achieves fair presentation.
• Communicatewiththosechargedwithgovernanceregarding,amongothermatters,theplannedscopeandtimingoftheauditandsignificant audit findings, including any significant deficiencies in internal control that we identify during our audit. We also provide those charged with governance with a statement that we have complied with relevant ethical requirements regarding independence, and to communicate with them all relationships and other matters that may reasonably be thought to bear on our independence, and where applicable, related safeguards.
19
Bank Reports and Statements
Consolidated Financial StatementsFinancial HighlightsCourage of Conviction.
Constancy of Change.Independent Auditor’s Report
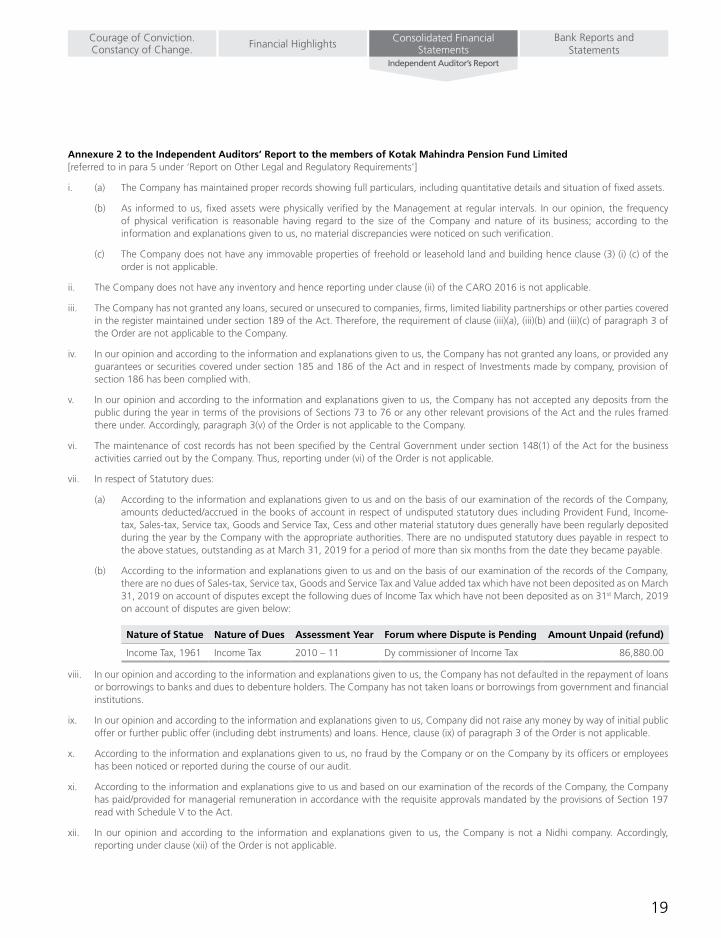
Annexure 2 to the Independent Auditors’ Report to the members of Kotak Mahindra Pension Fund Limited [referred to in para 5 under ‘Report on Other Legal and Regulatory Requirements’]
i. (a) The Company has maintained proper records showing full particulars, including quantitative details and situation of fixed assets.
(b) As informed to us, fixed assets were physically verified by the Management at regular intervals. In our opinion, the frequency of physical verification is reasonable having regard to the size of the Company and nature of its business; according to the information and explanations given to us, no material discrepancies were noticed on such verification.
(c) The Company does not have any immovable properties of freehold or leasehold land and building hence clause (3) (i) (c) of the order is not applicable.
ii. The Company does not have any inventory and hence reporting under clause (ii) of the CARO 2016 is not applicable.
iii. The Company has not granted any loans, secured or unsecured to companies, firms, limited liability partnerships or other parties covered in the register maintained under section 189 of the Act. Therefore, the requirement of clause (iii)(a), (iii)(b) and (iii)(c) of paragraph 3 of the Order are not applicable to the Company.
iv. In our opinion and according to the information and explanations given to us, the Company has not granted any loans, or provided any guarantees or securities covered under section 185 and 186 of the Act and in respect of Investments made by company, provision of section 186 has been complied with.
v. In our opinion and according to the information and explanations given to us, the Company has not accepted any deposits from the public during the year in terms of the provisions of Sections 73 to 76 or any other relevant provisions of the Act and the rules framed there under. Accordingly, paragraph 3(v) of the Order is not applicable to the Company.
vi. The maintenance of cost records has not been specified by the Central Government under section 148(1) of the Act for the business activities carried out by the Company. Thus, reporting under (vi) of the Order is not applicable.
vii. In respect of Statutory dues:
(a) According to the information and explanations given to us and on the basis of our examination of the records of the Company, amounts deducted/accrued in the books of account in respect of undisputed statutory dues including Provident Fund, Income-tax, Sales-tax, Service tax, Goods and Service Tax, Cess and other material statutory dues generally have been regularly deposited during the year by the Company with the appropriate authorities. There are no undisputed statutory dues payable in respect to the above statues, outstanding as at March 31, 2019 for a period of more than six months from the date they became payable.
(b) According to the information and explanations given to us and on the basis of our examination of the records of the Company, there are no dues of Sales-tax, Service tax, Goods and Service Tax and Value added tax which have not been deposited as on March 31, 2019 on account of disputes except the following dues of Income Tax which have not been deposited as on 31st March, 2019 on account of disputes are given below:
Nature of Statue Nature of Dues Assessment Year Forum where Dispute is Pending Amount Unpaid (refund)
Income Tax, 1961 Income Tax 2010 – 11 Dy commissioner of Income Tax 86,880.00
viii. In our opinion and according to the information and explanations given to us, the Company has not defaulted in the repayment of loans or borrowings to banks and dues to debenture holders. The Company has not taken loans or borrowings from government and financial institutions.
ix. In our opinion and according to the information and explanations given to us, Company did not raise any money by way of initial public offer or further public offer (including debt instruments) and loans. Hence, clause (ix) of paragraph 3 of the Order is not applicable.
x. According to the information and explanations given to us, no fraud by the Company or on the Company by its officers or employees has been noticed or reported during the course of our audit.
xi. According to the information and explanations give to us and based on our examination of the records of the Company, the Company has paid/provided for managerial remuneration in accordance with the requisite approvals mandated by the provisions of Section 197 read with Schedule V to the Act.
xii. In our opinion and according to the information and explanations given to us, the Company is not a Nidhi company. Accordingly, reporting under clause (xii) of the Order is not applicable.
20 Annual Report 2018-19
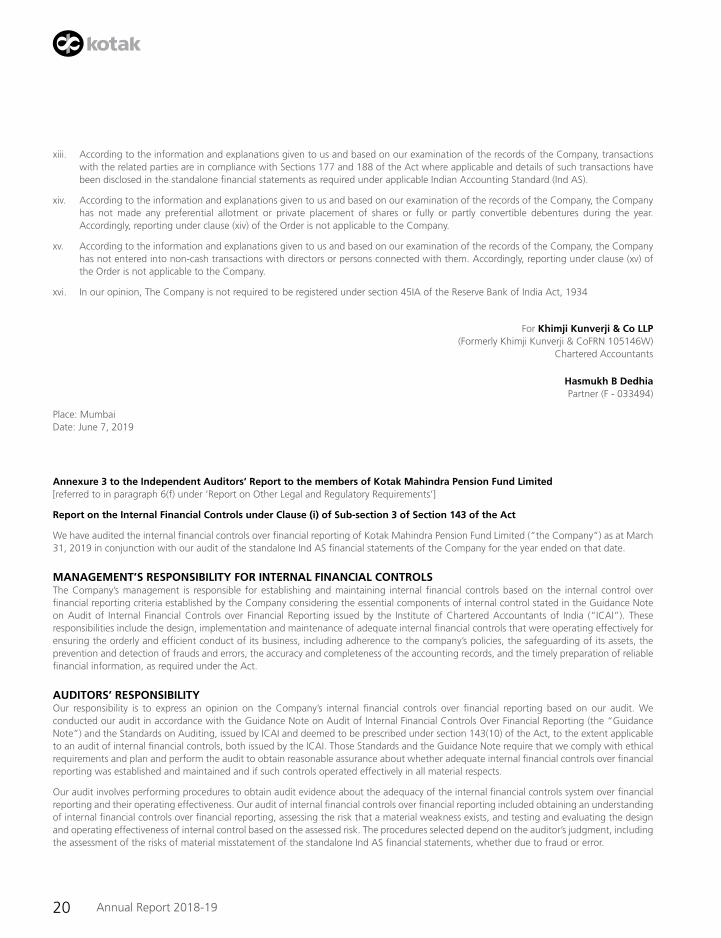
xiii. According to the information and explanations given to us and based on our examination of the records of the Company, transactions with the related parties are in compliance with Sections 177 and 188 of the Act where applicable and details of such transactions have been disclosed in the standalone financial statements as required under applicable Indian Accounting Standard (Ind AS).
xiv. According to the information and explanations given to us and based on our examination of the records of the Company, the Company has not made any preferential allotment or private placement of shares or fully or partly convertible debentures during the year. Accordingly, reporting under clause (xiv) of the Order is not applicable to the Company.
xv. According to the information and explanations given to us and based on our examination of the records of the Company, the Company has not entered into non-cash transactions with directors or persons connected with them. Accordingly, reporting under clause (xv) of the Order is not applicable to the Company.
xvi. In our opinion, The Company is not required to be registered under section 45IA of the Reserve Bank of India Act, 1934
For Khimji Kunverji & Co LLP(Formerly Khimji Kunverji & CoFRN 105146W)
Chartered Accountants
Hasmukh B Dedhia Partner (F - 033494)
Place: Mumbai Date: June 7, 2019
Annexure 3 to the Independent Auditors’ Report to the members of Kotak Mahindra Pension Fund Limited[referred to in paragraph 6(f) under ‘Report on Other Legal and Regulatory Requirements’]
Report on the Internal Financial Controls under Clause (i) of Sub-section 3 of Section 143 of the Act
We have audited the internal financial controls over financial reporting of Kotak Mahindra Pension Fund Limited (“the Company”) as at March 31, 2019 in conjunction with our audit of the standalone Ind AS financial statements of the Company for the year ended on that date.
MANAGEMENT’S RESPONSIBILITY FOR INTERNAL FINANCIAL CONTROLSThe Company’s management is responsible for establishing and maintaining internal financial controls based on the internal control over financial reporting criteria established by the Company considering the essential components of internal control stated in the Guidance Note on Audit of Internal Financial Controls over Financial Reporting issued by the Institute of Chartered Accountants of India (“ICAI”). These responsibilities include the design, implementation and maintenance of adequate internal financial controls that were operating effectively for ensuring the orderly and efficient conduct of its business, including adherence to the company’s policies, the safeguarding of its assets, the prevention and detection of frauds and errors, the accuracy and completeness of the accounting records, and the timely preparation of reliable financial information, as required under the Act.
AUDITORS’ RESPONSIBILITYOur responsibility is to express an opinion on the Company’s internal financial controls over financial reporting based on our audit. We conducted our audit in accordance with the Guidance Note on Audit of Internal Financial Controls Over Financial Reporting (the “Guidance Note”) and the Standards on Auditing, issued by ICAI and deemed to be prescribed under section 143(10) of the Act, to the extent applicable to an audit of internal financial controls, both issued by the ICAI. Those Standards and the Guidance Note require that we comply with ethical requirements and plan and perform the audit to obtain reasonable assurance about whether adequate internal financial controls over financial reporting was established and maintained and if such controls operated effectively in all material respects.
Our audit involves performing procedures to obtain audit evidence about the adequacy of the internal financial controls system over financial reporting and their operating effectiveness. Our audit of internal financial controls over financial reporting included obtaining an understanding of internal financial controls over financial reporting, assessing the risk that a material weakness exists, and testing and evaluating the design and operating effectiveness of internal control based on the assessed risk. The procedures selected depend on the auditor’s judgment, including the assessment of the risks of material misstatement of the standalone Ind AS financial statements, whether due to fraud or error.
21
Bank Reports and Statements
Consolidated Financial StatementsFinancial HighlightsCourage of Conviction.
Constancy of Change.Independent Auditor’s Report
We believe that the audit evidence we have obtained is sufficient and appropriate to provide a basis for our audit opinion on the Company’s internal financial controls system over financial reporting.
MEANING OF INTERNAL FINANCIAL CONTROLS OVER FINANCIAL REPORTINGA Company’s internal financial control over financial reporting is a process designed to provide reasonable assurance regarding the reliability of financial reporting and the preparation of financial statements for external purposes in accordance with generally accepted accounting principles. A Company’s internal financial control over financial reporting includes those policies and procedures that:
(a) pertain to the maintenance of records that, in reasonable detail, accurately and fairly reflect the transactions and dispositions of the assets of the Company;
(b) provide reasonable assurance that transactions are recorded as necessary to permit preparation of standalone Ind AS financial statements in accordance with generally accepted accounting principles, and that receipts and expenditures of the Company are being made only in accordance with authorisations of management and directors of the Company; and
(c) provide reasonable assurance regarding prevention or timely detection of unauthorised acquisition, use, or disposition of the Company’s assets that could have a material effect on the standalone Ind AS financial statements.
INHERENT LIMITATIONS OF INTERNAL FINANCIAL CONTROLS OVER FINANCIAL REPORTINGBecause of the inherent limitations of internal financial controls over financial reporting, including the possibility of collusion or improper management override of controls, material misstatements due to error or fraud may occur and not be detected. Also, projections of any evaluation of the internal financial controls over financial reporting to future periods are subject to the risk that the internal financial control over financial reporting may become inadequate because of changes in conditions, or that the degree of compliance with the policies or procedures may deteriorate.
OPINIONIn our opinion considering the nature and size of the operations, the Company has, in all material respects, an adequate internal financial controls system over financial reporting and such internal financial controls over financial reporting were operating effectively as at March 31, 2019, based on the internal control over financial reporting criteria established by the Company considering the essential components of internal control stated in the Guidance Note on Audit of Internal Financial Controls Over Financial Reporting issued by the ICAI.
For Khimji Kunverji & Co LLP(Formerly Khimji Kunverji & CoFRN 105146W)
Chartered Accountants
Hasmukh B Dedhia Partner (F - 033494)
Place: Mumbai Date: June 7, 2019
22 Annual Report 2018-19
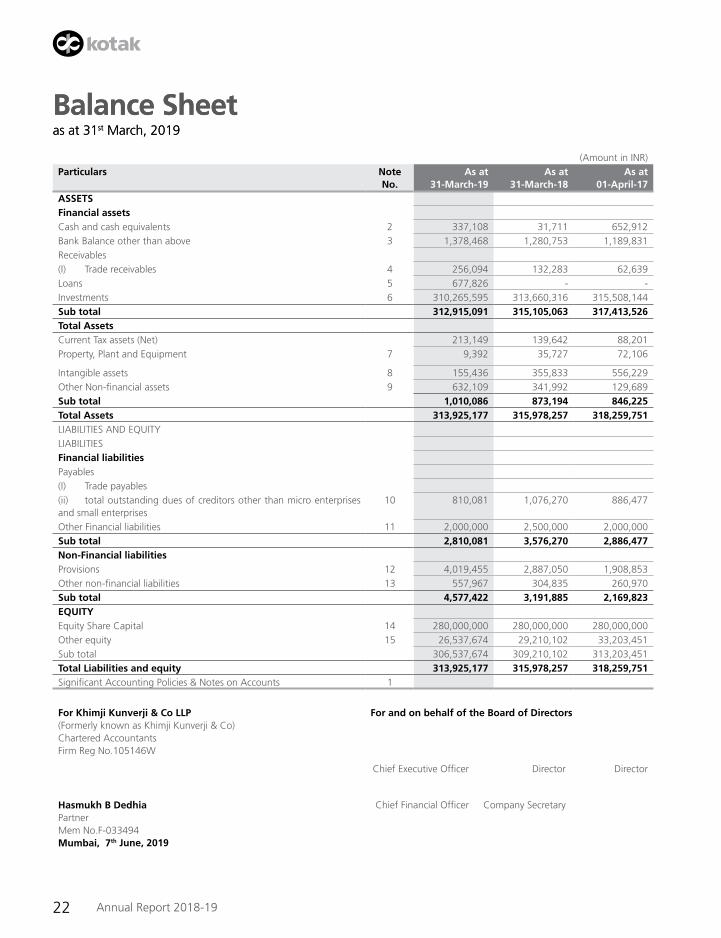
(Amount in INR)Particulars Note
No.As at
31-March-19As at
31-March-18As at
01-April-17ASSETSFinancial assetsCash and cash equivalents 2 337,108 31,711 652,912 Bank Balance other than above 3 1,378,468 1,280,753 1,189,831 Receivables(I) Trade receivables 4 256,094 132,283 62,639 Loans 5 677,826 - - Investments 6 310,265,595 313,660,316 315,508,144 Sub total 312,915,091 315,105,063 317,413,526 Total AssetsCurrent Tax assets (Net) 213,149 139,642 88,201 Property, Plant and Equipment 7 9,392 35,727 72,106
Intangible assets 8 155,436 355,833 556,229 Other Non-financial assets 9 632,109 341,992 129,689 Sub total 1,010,086 873,194 846,225 Total Assets 313,925,177 315,978,257 318,259,751 LIABILITIES AND EQUITYLIABILITIESFinancial liabilitiesPayables(I) Trade payables(ii) total outstanding dues of creditors other than micro enterprises and small enterprises
10 810,081 1,076,270 886,477
Other Financial liabilities 11 2,000,000 2,500,000 2,000,000 Sub total 2,810,081 3,576,270 2,886,477 Non-Financial liabilitiesProvisions 12 4,019,455 2,887,050 1,908,853 Other non-financial liabilities 13 557,967 304,835 260,970 Sub total 4,577,422 3,191,885 2,169,823 EqUITYEquity Share Capital 14 280,000,000 280,000,000 280,000,000 Other equity 15 26,537,674 29,210,102 33,203,451 Sub total 306,537,674 309,210,102 313,203,451 Total Liabilities and equity 313,925,177 315,978,257 318,259,751 Significant Accounting Policies & Notes on Accounts 1
For Khimji Kunverji & Co LLP (Formerly known as Khimji Kunverji & Co) Chartered Accountants Firm Reg No.105146W
For and on behalf of the Board of Directors
Chief Executive Officer Director Director
Hasmukh B Dedhia Partner Mem No.F-033494 Mumbai, 7th June, 2019
Chief Financial Officer Company Secretary
Balance Sheet as at 31st March, 2019
Balance Sheet as at 31st March, 2019
23
Bank Reports and Statements
Consolidated Financial StatementsFinancial HighlightsCourage of Conviction.
Constancy of Change.Balance Sheet | Profit & Loss
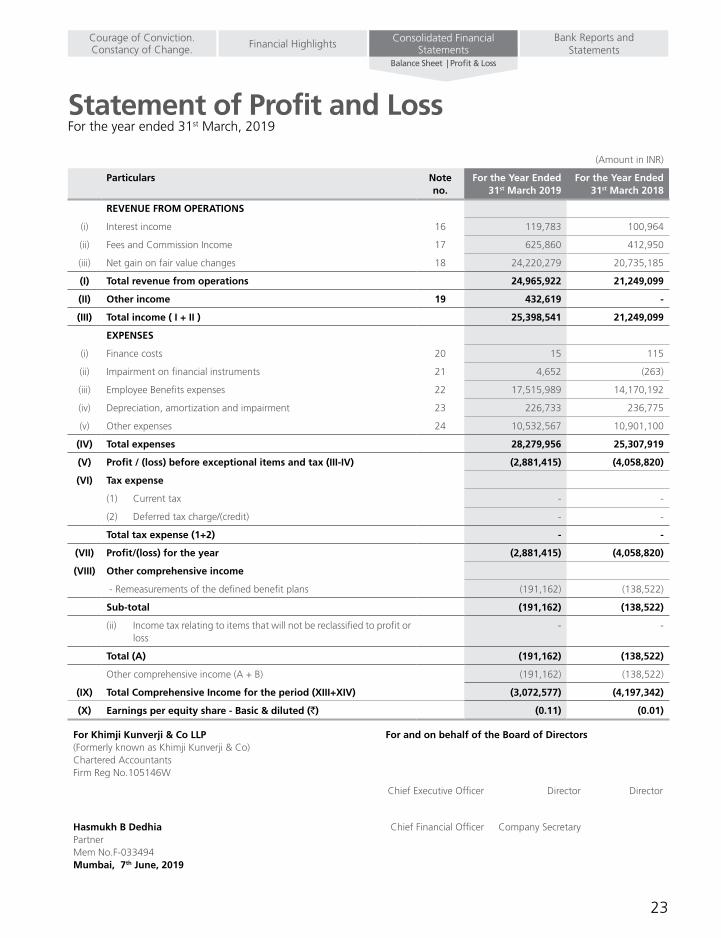
(Amount in INR)
Particulars Note no.
For the Year Ended 31st March 2019
For the Year Ended 31st March 2018
REVENUE FROM OPERATIONS
(i) Interest income 16 119,783 100,964
(ii) Fees and Commission Income 17 625,860 412,950
(iii) Net gain on fair value changes 18 24,220,279 20,735,185
(I) Total revenue from operations 24,965,922 21,249,099
(II) Other income 19 432,619 -
(III) Total income ( I + II ) 25,398,541 21,249,099
EXPENSES
(i) Finance costs 20 15 115
(ii) Impairment on financial instruments 21 4,652 (263)
(iii) Employee Benefits expenses 22 17,515,989 14,170,192
(iv) Depreciation, amortization and impairment 23 226,733 236,775
(v) Other expenses 24 10,532,567 10,901,100
(IV) Total expenses 28,279,956 25,307,919
(V) Profit / (loss) before exceptional items and tax (III-IV) (2,881,415) (4,058,820)
(VI) Tax expense
(1) Current tax - -
(2) Deferred tax charge/(credit) - -
Total tax expense (1+2) - -
(VII) Profit/(loss) for the year (2,881,415) (4,058,820)
(VIII) Other comprehensive income
- Remeasurements of the defined benefit plans (191,162) (138,522)
Sub-total (191,162) (138,522)
(ii) Income tax relating to items that will not be reclassified to profit or loss
- -
Total (A) (191,162) (138,522)
Other comprehensive income (A + B) (191,162) (138,522)
(IX) Total Comprehensive Income for the period (XIII+XIV) (3,072,577) (4,197,342)
(X) Earnings per equity share - Basic & diluted (`) (0.11) (0.01)
Statement of Profit and Loss For the year ended 31st March, 2019
For Khimji Kunverji & Co LLP (Formerly known as Khimji Kunverji & Co) Chartered Accountants Firm Reg No.105146W
For and on behalf of the Board of Directors
Chief Executive Officer Director Director
Hasmukh B Dedhia Partner Mem No.F-033494 Mumbai, 7th June, 2019
Chief Financial Officer Company Secretary
24 Annual Report 2018-19
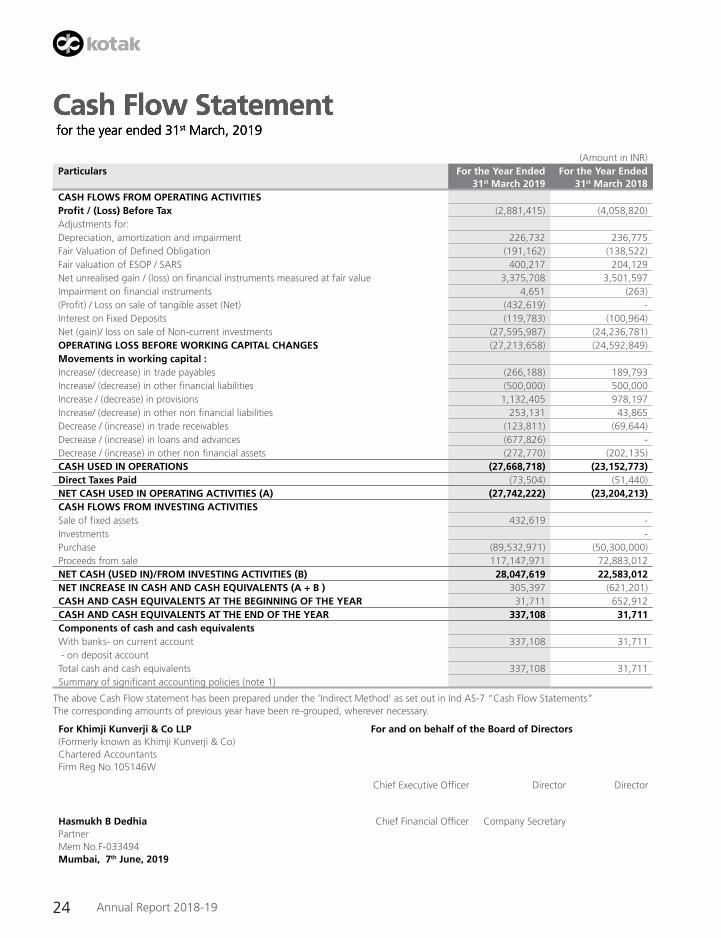
Cash Flow Statement for the year ended 31st March, 2019
(Amount in INR)Particulars For the Year Ended
31st March 2019For the Year Ended
31st March 2018CASH FLOWS FROM OPERATING ACTIVITIESProfit / (Loss) Before Tax (2,881,415) (4,058,820)Adjustments for:Depreciation, amortization and impairment 226,732 236,775 Fair Valuation of Defined Obligation (191,162) (138,522)Fair valuation of ESOP / SARS 400,217 204,129 Net unrealised gain / (loss) on financial instruments measured at fair value 3,375,708 3,501,597 Impairment on financial instruments 4,651 (263)(Profit) / Loss on sale of tangible asset (Net) (432,619) - Interest on Fixed Deposits (119,783) (100,964)Net (gain)/ loss on sale of Non-current investments (27,595,987) (24,236,781)OPERATING LOSS BEFORE WORKING CAPITAL CHANGES (27,213,658) (24,592,849)Movements in working capital :Increase/ (decrease) in trade payables (266,188) 189,793 Increase/ (decrease) in other financial liabilities (500,000) 500,000 Increase / (decrease) in provisions 1,132,405 978,197 Increase/ (decrease) in other non financial liabilities 253,131 43,865 Decrease / (increase) in trade receivables (123,811) (69,644)Decrease / (increase) in loans and advances (677,826) - Decrease / (increase) in other non financial assets (272,770) (202,135)CASH USED IN OPERATIONS (27,668,718) (23,152,773)Direct Taxes Paid (73,504) (51,440)NET CASH USED IN OPERATING ACTIVITIES (A) (27,742,222) (23,204,213)CASH FLOWS FROM INVESTING ACTIVITIESSale of fixed assets 432,619 - Investments - Purchase (89,532,971) (50,300,000)Proceeds from sale 117,147,971 72,883,012 NET CASH (USED IN)/FROM INVESTING ACTIVITIES (B) 28,047,619 22,583,012 NET INCREASE IN CASH AND CASH EqUIVALENTS (A + B ) 305,397 (621,201)CASH AND CASH EqUIVALENTS AT THE BEGINNING OF THE YEAR 31,711 652,912 CASH AND CASH EqUIVALENTS AT THE END OF THE YEAR 337,108 31,711 Components of cash and cash equivalentsWith banks- on current account 337,108 31,711 - on deposit accountTotal cash and cash equivalents 337,108 31,711 Summary of significant accounting policies (note 1)
The above Cash Flow statement has been prepared under the ‘Indirect Method’ as set out in Ind AS-7 “Cash Flow Statements”The corresponding amounts of previous year have been re-grouped, wherever necessary.
For Khimji Kunverji & Co LLP (Formerly known as Khimji Kunverji & Co) Chartered Accountants Firm Reg No.105146W
For and on behalf of the Board of Directors
Chief Executive Officer Director Director
Hasmukh B Dedhia Partner Mem No.F-033494 Mumbai, 7th June, 2019
Chief Financial Officer Company Secretary
Cash Flow Statement for the year ended 31st March, 2019
Cash Flow Statement for the year ended 31st March, 2019
25
Bank Reports and Statements
Consolidated Financial StatementsFinancial HighlightsCourage of Conviction.
Constancy of Change.Cash Flow Statement | Changes in equity
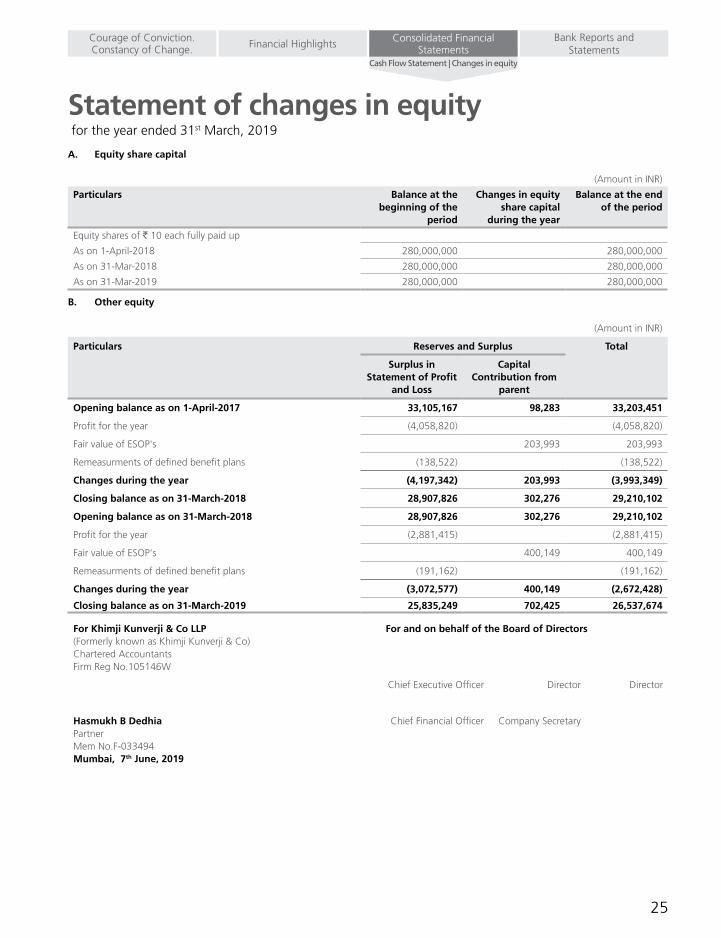
Statement of changes in equity for the year ended 31st March, 2019
A. Equity share capital
(Amount in INR)
Particulars Balance at the beginning of the
period
Changes in equity share capital
during the year
Balance at the end of the period
Equity shares of ` 10 each fully paid up
As on 1-April-2018 280,000,000 280,000,000
As on 31-Mar-2018 280,000,000 280,000,000
As on 31-Mar-2019 280,000,000 280,000,000
B. Other equity
(Amount in INR)
Particulars Reserves and Surplus Total
Surplus in Statement of Profit
and Loss
Capital Contribution from
parent
Opening balance as on 1-April-2017 33,105,167 98,283 33,203,451
Profit for the year (4,058,820) (4,058,820)
Fair value of ESOP's 203,993 203,993
Remeasurments of defined benefit plans (138,522) (138,522)
Changes during the year (4,197,342) 203,993 (3,993,349)
Closing balance as on 31-March-2018 28,907,826 302,276 29,210,102
Opening balance as on 31-March-2018 28,907,826 302,276 29,210,102
Profit for the year (2,881,415) (2,881,415)
Fair value of ESOP's 400,149 400,149
Remeasurments of defined benefit plans (191,162) (191,162)
Changes during the year (3,072,577) 400,149 (2,672,428)
Closing balance as on 31-March-2019 25,835,249 702,425 26,537,674
For Khimji Kunverji & Co LLP (Formerly known as Khimji Kunverji & Co) Chartered Accountants Firm Reg No.105146W
For and on behalf of the Board of Directors
Chief Executive Officer Director Director
Hasmukh B Dedhia Partner Mem No.F-033494 Mumbai, 7th June, 2019
Chief Financial Officer Company Secretary
26 Annual Report 2018-19
Schedules forming part of Balance Sheet and Profit and Loss Account
1. CORPORATE INFORMATION Kotak Mahindra Pension Fund Limited (‘the Company’) is a company domiciled in India and incorporated on 23rd March, 2009 with
its registered office situated at 27 BKC C-27, G Block, Bandra-Kurla Complex, Bandra East, Mumbai. The Company is incorporated to manage the investments of the National Pension System as formed by the Government of India through the Pension Fund Regulatory & Development Authority (PFRDA). The investments are held by the Board of Trustees of the National Pension System Trust, established by the PFRDA under the Indian Trusts Act, 1882.
2. BASIS OF PREPARATION
A. Statement of compliance The financial statements of the Company have been prepared in accordance with Indian Accounting Standards (Ind AS) notified
under the Companies (Indian Accounting Standards) Rules, 2015 as amended by the Companies (Indian Accounting Standards) Rules, 2016 and other relevant provisions of the Act.
The Company has adopted Ind AS from 1st April 2018 with effective transition date of 1st April 2017 and accordingly, these financial statements together with the comparative reporting period have been prepared in accordance with the recognition and measurement principles as laid down in lnd AS, prescribed under Section 133 of the Companies Act, 2013 (‘the Act’) read with relevant rules issued there under and other relevant provisions of the Act. The transition to Ind AS has been carried out from the erstwhile Accounting Standards notified under the Act read with Rule 7 of Companies (Accounts) Rules 2014 (as amended), and other generally accepted accounting principles in India (collectively referred to as ‘the Previous GAAP’). Accordingly, the impact of transition has been recorded in the opening reserves as at 1st April 2017 and the comparative previous year has been restated / reclassified. Reconciliations and explanations of the effect of the transition from Previous GAAP to Ind AS on the Equity, Statement of Profit and Loss and Cash Flows are provided in Note 31.
The financial statements have been prepared on accrual and going concern basis. The accounting policies are applied consistently to all the financial years presented in the financial statements, including the preparation of the opening Ind AS Balance Sheet as at 1st April 2017 being the ‘date of transition to Ind AS’. These standalone financial statements were authorized for issue by the Company’s Board of Director’s on 7th June 2019.
B. Functional and presentation currency The financial statements are presented in Indian Rupees (INR) which is also the Company’s functional currency.
C. Basis of preparation and presentation The financial statements have been prepared on a historical cost basis except for the following:
• Certainfinancialassetsand liabilities (includingderivative instruments) -measuredat fair value (referaccountingpolicyregarding financial instruments).
• Netdefinedbenefit(asset)/liability:planassetsaremeasuredatfairvaluelesspresentvalueofdefinedbenefitobligation;
• Share-basedpayments-measuredatfairvalue;and
D Use of estimates and judgements The preparation of financial statements in accordance with Ind AS requires use of judgements, estimates and assumptions for
some items, which might have an effect on their recognition and measurement in the Balance Sheet and Statement of Profit and Loss. The actual amounts realized may differ from these estimates. The estimates and the underlying assumptions are reviewed on an ongoing basis.
Judgment, estimates and assumptions are required in particular for:
I. Revenue
(a) Identifying performance obligation in the contract: The Company manages the investments of the National Pension System as formed by the Government of India
through the Pension Fund Regulatory & Development Authority (PFRDA). The Company has determined all the above services are capable of being distinct because the Company can provides those services on stand-alone basis and customer can benefit from those services on its own.
27
Schedules forming part of Balance Sheet and Profit and Loss Account
Bank Reports and Statements
Consolidated Financial StatementsFinancial HighlightsCourage of Conviction.
Constancy of Change.Schedules
Recognition of revenue over time or at a point in time:
The Company recognizes revenue from all the services over time because the customer simultaneously receives and consumes the benefits of the Company’s performance as it performs.
II. Determination of estimated useful lives of property, plant, equipment Useful lives of property, plant and equipment are based on nature of the asset, the estimated usage of the asset, the
operating conditions of the asset, past history of replacement, anticipated technological changes, manufacturers’ warranties and maintenance support.
III. Recognition and Measurement of defined benefit obligations The obligation arising from defined benefit plan is determined on the basis of actuarial valuation. Key actuarial assumptions
which form the basis of above valuation includes discount rate, trends in salary escalation, demographics and life expectancy. The discount rate is determined by reference to market yields at the end of the reporting period on government bonds. The period to maturity of the underlying bonds correspond to the probable maturity of the post-employment benefit obligations. Further details are disclosed in Note 28.
IV. Recognition of deferred tax assets Deferred tax assets and liabilities are recognized for the future tax consequences of temporary differences between the
carrying values of assets and liabilities and their respective tax bases, depreciation carry-forwards and tax credits. Deferred tax assets are recognized to the extent that it is probable that future taxable income will be available against which the deductible temporary differences, depreciation carry-forwards and unused tax credits could be utilized.
V. Recognition and measurement of provisions and contingencies The recognition and measurement of other provisions are based on the assessment of the probability of an outflow of
resources, and on past experience and circumstances known at the reporting date. The actual outflow of resources at a future date may therefore, vary from the amount included in other provisions.
VI. Discounting of long-term financial assets/liabilities All financial assets/liabilities are required to be measured at fair value on initial recognition. In case of financial assets/
liabilities which are required to be subsequently measured at amortized cost, interest is accrued using the effective interest method.
VII. Fair value of share-based payments Estimating fair value for share-based payment transactions requires determination of the most appropriate valuation model,
which depends on the terms and conditions of the grant. This estimate also requires determination of the most appropriate inputs to the valuation model including the expected life of the share option or appreciation right, volatility and dividend yield and making assumptions about them. The Company initially measures the cost of cash-settled transactions with employees using a Black-Scholes model. Key assumptions have been made with respect to expected volatility includes share price, expected dividends and discount rate, under this option pricing model. For cash-settled share-based payment transactions, the liability needs to be remeasured at the end of each reporting period up to the date of settlement, with any changes in fair value recognized in the Statement of Profit and Loss. This requires a reassessment of the estimates used at the end of each reporting period.
For the measurement of the fair value of equity-settled transactions with employees at the grant date, the Company uses a Black-Scholes model.
The assumptions and models used for estimating fair value for share-based payment transactions are disclosed in Note 29.
VIII. Fair value of financial instruments The fair value of financial instruments is the price that would be received to sell an asset or paid to transfer a liability in
an orderly transaction in the principal (or most advantageous) market at the measurement date under current market conditions (i.e., an exit price) regardless of whether that price is directly observable or estimated using another valuation technique. When the fair values of financial assets and financial liabilities recorded in the balance sheet cannot be derived from active markets, they are determined using a variety of valuation techniques that include the use of valuation models.
28 Annual Report 2018-19
Schedules forming part of Balance Sheet and Profit and Loss Account
The inputs to these models are taken from observable markets where possible, but where this is not feasible, estimation is required in establishing fair values. For further details about determination of fair value please refer Note 30.
IX. Business model assessment Classification and measurement of financial assets depends on the results of the SPPI and the business model test. The
Company determines the business model at a level that reflects how groups of financial assets are managed together to achieve a particular business objective. This assessment includes judgment reflecting all relevant evidence including how the performance of the assets is evaluated and their performance measured, the risks that affect the performance of the assets and how these are managed and how the managers of the assets are compensated. The Company monitors financial assets measured at amortized cost that are derecognized prior to their maturity to understand the reason for their disposal and whether the reasons are consistent with the objective of the business for which the asset was held.
X. Effective Interest Rate (EIR) method The Company’s EIR methodology, recognizes interest income / expense using a rate of return that represents the best
estimate of a constant rate of return over the expected behavioral life of loans given / taken and recognizes the effect of potentially different interest rates at various stages and other characteristics of the product life cycle.
This estimation, by nature, requires an element of judgment regarding the expected behavior and life-cycle of the instruments, as well expected changes to benchmark rate and other fee income/expense that are integral parts of the instrument.
XI. Impairment of financial assets The Company recognizes loss allowances for expected credit losses on its financial assets measured at amortized cost and
Fair Value through Other Comprehensive Income (FVOCI) except investment in equity instruments classified as FVOCI. At each reporting date, the Company assesses whether the above financial assets are credit- impaired. A financial asset is ‘credit- impaired’ when one or more events that have a detrimental impact on the estimated future cash flows of the financial asset have occurred. The Company’s ECL calculations are outputs of statistical models with a number of underlying assumptions regarding the choice of variable inputs and their interdependencies such as macroeconomic scenarios.
XII. Impairment of non-financial assets Impairment exists when the carrying value of an asset or cash generating unit (CGU) exceeds its recoverable amount, which
is the higher of its fair value less costs of disposal and its value in use. The fair value less costs of disposal calculation is based on available data from binding sales transactions, conducted at arm’s length, for similar assets or observable market prices less incremental costs of disposing of the asset. The value in use calculation is based on a discounted cash flow model. The recoverable amount is sensitive to the discount rate used for the discounted cash flow model as well as the expected future cash-inflows and the growth rate used for extrapolation purposes.
E. STANDARD ISSUED BUT NOT EFFECTIVE Following are the new standards and amendments to existing standards (as notified by Ministry of Corporate Affairs (‘MCA’)
on March 30, 2019) which are effective for annual period beginning after April 1, 2019. The Company intends to adopt these standards or amendments from the effective date.
Ind AS 116 – Leases
Ind AS 116 is applicable for financial reporting periods beginning on or after April 1, 2019 and replaces existing lease accounting guidance, namely Ind AS 17 Leases. Ind AS 116 introduces a single, on-balance sheet lease accounting model for lessees. A lessee recognizes a right-of-use (“ROU”) asset representing its right to use the underlying asset and a lease liability representing its obligation to make lease payments. The nature of expenses related to those leases will change as Ind AS 116 replaces the operating lease expense (i.e. rent) with depreciation charge for ROU assets and interest expense on lease liabilities. There are recognition exemptions for short-term leases and leases of low-value items. Lessor accounting remains similar to the current standard – i.e. lessors continue to classify leases as finance or operating leases.
The Company is in the process of analyzing the impact of new lease standard on its financial statements.
F. AMENDMENTS TO EXISTING IND AS: The following amended standards are not expected to have a significant impact on the Company’s standalone financial statements.
This assessment is based on currently available information and may be subject to changes arising from further reasonable and supportable information being made available to the Company when it will adopt the respective amended standards.
29
Schedules forming part of Balance Sheet and Profit and Loss Account
Bank Reports and Statements
Consolidated Financial StatementsFinancial HighlightsCourage of Conviction.
Constancy of Change.Schedules
I. Amendment to Ind AS 12 Income Taxes: Appendix C – Uncertainty over Income Tax Treatments The Appendix addresses how to recognize and measure deferred and current income tax assets and liabilities where there is
uncertainty over a tax treatment.
II. Amendments to Ind AS 12 Income Taxes The amendments clarify that the income tax consequences of dividends on financial instruments classified as equity should
be recognized according to where the past transactions or events that generated distributable profits were recognized.
III. Amendments to Ind AS 19 Employee Benefits This amendment requires:
• Touseupdatedassumptionstodeterminecurrentservicecostandnetinterestfortheremainderoftheperiodafteraplan amendment, curtailment or settlement; and
• To recognize in the Statement of Profit and Loss as part of past service cost, or gainor loss on settlement, anyreduction in surplus, even if that surplus was not previously recognized because of the impact of the asset ceiling.
3. SIGNIFICANT ACCOUNTING POLICIES
A. Property, plant and equipment
i. Recognition and measurement Items of property, plant and equipment (PPE) are measured at cost less accumulated depreciation and any accumulated
impairment losses.
The cost of an item of property, plant and equipment comprises:
a. its purchase price, including import duties and non-refundable purchase taxes, after deducting trade discounts and rebates.
b. any costs directly attributable to bringing the asset to the location and condition necessary for it to be capable of operating in the manner intended by management.
Income and expenses related to the incidental operations, not necessary to bring the item to the location and condition necessary for it to be capable of operating in the manner intended by management, are recognized in the Statement of Profit and Loss.
If significant parts of an item of property, plant and equipment have different useful lives, then they are accounted and depreciated for as separate items (major components) of property, plant and equipment.
Any gain or loss on disposal of an item of property, plant and equipment is recognized in the Statement of Profit and Loss.
ii. Subsequent expenditure Subsequent expenditure is capitalized only if it is probable that the future economic benefits associated with the expenditure
will flow to the Company.
iii. Depreciation Deprecation is provided on a pro-rata basis on a Straight-Line Method over the estimated useful life of the assets at rates
which are equal to or higher than the rates prescribed under Schedule II of the Companies Act, 2013 in order to reflect the actual usage of the assets. Estimated useful lives of assets based on technical evaluation by management are as follows:
Computers 3 years
Office Equipment 5 years
Vehicles 4 years
Assets costing less than INR 5,000 are fully depreciated in the year of purchase.
Depreciation methods, useful lives and residual values are reviewed at each reporting date and adjusted if appropriate.

30 Annual Report 2018-19
Schedules forming part of Balance Sheet and Profit and Loss Account
B. Intangible assets
i. Recognition and measurement Intangible assets are stated at cost of acquisition less accumulated amortization and impairment losses, if any. The cost of
an intangible asset comprises its purchase price, including any import duties and other taxes (other than those subsequently recoverable from the taxing authorities), and any directly attributable expenditure on making ‘the asset ready for its intended use and net of any trade discounts and rebates. Subsequent expenditure on an intangible asset after its purchase/completion is recognized as an expense when incurred unless it is probable that such expenditure will enable the asset to generate future economic benefits in excess of its originally assessed standards of performance and such expenditure can be measured and attributed to the asset reliably, in which case such expenditure is added to the cost of the asset.
ii. Subsequent expenditure Subsequent expenditure is capitalized only when it increases the future economic benefits embodied in the specific asset to
which it relates.
iii. Amortization The intangible assets are amortized over the estimated useful lives as given below:
Software (including development) expenditure 3 years
Amortization methods, useful lives and residual values are reviewed at each reporting date and adjusted if appropriate.
C. Accounting for Operating Leases as a Lessee Leases where the lessor effectively retains substantially all the risks and rewards of ownership of the leased term, are classified as
operating leases. Payments made under operating leases are generally recognized in the Statement of Profit and Loss on a straight line basis over the term of the lease unless such payments are structured to increase in line with expected general inflation to compensate for the lessors expected inflationary cost increases.
D. Revenue recognition of income Revenue (other than for those items to which Ind AS 109 Financial Instruments are applicable) is measured at fair value of the
consideration received or receivable. Ind AS 115 Revenue from contracts with customers outlines a single comprehensive model of accounting for revenue arising from contracts with customers.
The Company recognizes revenue from contracts with customers based on a five step model as set out in Ind 115:
Step 1: Identify contract(s) with a customer: A contract is defined as an agreement between two or more parties that creates enforceable rights and obligations and sets out the criteria for every contract that must be met.
Step 2: Identify performance obligations in the contract: A performance obligation is a promise in a contract with a customer to transfer a good or service to the customer.
Step 3: Determine the transaction price: The transaction price is the amount of consideration to which the Company expects to be entitled in exchange for transferring promised goods or services to a customer, excluding amounts collected on behalf of third parties.
Step 4: Allocate the transaction price to the performance obligations in the contract: For a contract that has more than one performance obligation, the Company allocates the transaction price to each performance obligation in an amount that depicts the amount of consideration to which the Company expects to be entitled in exchange for satisfying each performance obligation.
Step 5: Recognize revenue when (or as) the Company satisfies a performance obligation
Revenue from contracts with customers is recognized when control of the goods or services are transferred to the customer at an amount that reflects the consideration to which the Company expects to be entitled in exchange for those goods or services
Investment Management Fee is recognized at specific rates agreed with the relevant schemes, applied on the daily net assets managed
31
Schedules forming part of Balance Sheet and Profit and Loss Account
Bank Reports and Statements
Consolidated Financial StatementsFinancial HighlightsCourage of Conviction.
Constancy of Change.Schedules
Dividend income is recognized in the Statement of Profit and Loss on an accrual basis when the right to receive the dividend is established.
Purchase and sale of investments are recorded on trade date. The profit / loss on sale of investments is recognized in the Statement of Profit and Loss on the trade date, using the weighted average cost method.
Interest income on financial assets is recognized on an accrual basis using effective interest method. Interest revenue is continued to be recognized at the original effective interest rate applied on the gross carrying amount of assets falling under impairment stages 1 and 2 as against on amortized cost for the assets falling under impairment stage 3.
E. Income Tax Income tax expense comprises current and deferred tax. It is recognized in the Statement of Profit and Loss except to the extent
that it relates to items recognized directly in equity or in other comprehensive income (OCI).
Current tax Current tax is measured at the amount expected to be paid in respect of taxable income for the year in accordance with the Income
Tax Act, 1961. Current tax comprises the expected tax payable or receivable on the taxable income or loss for the year and any adjustment to the tax payable or receivable in respect of previous years. It is measured using tax rates enacted or substantively enacted at the reporting date.
Current tax assets and current tax liabilities are offset only if the Company has a legally enforceable right to set off the recognized amounts, and it intends to realize the asset and settle the liability on a net basis or simultaneously.
Deferred tax Deferred tax is recognized in respect of temporary differences between the carrying amounts of assets and liabilities for financial
reporting purposes and the amounts used for taxation purposes.
Deferred tax assets are reviewed at each reporting date and based on management’s judgment, are reduced to the extent that it is no longer probable that the related tax benefit will be realized; such reductions are reversed when the probability of future taxable profits improves.
Unrecognized deferred tax assets are reassessed at each reporting date and recognized to the extent that it has become probable that future taxable profits will be available against which they can be used.
Deferred tax is measured at the tax rates that are expected to be applied to temporary differences when they reverse, using tax rates enacted or substantively enacted at the reporting date.
The measurement of deferred tax reflects the tax consequences that would follow from the manner in which the Company expects, at the reporting date, to recover or settle the carrying amount of its assets and liabilities.
Deferred tax assets and liabilities are offset only if:
a. the Company has a legally enforceable right to set off current tax assets against current tax liabilities; and
b. the deferred tax assets and the deferred tax liabilities relate to income taxes levied by the same taxation authority.
F. Employee benefits
Defined Contribution Plan
Provident Fund/Employee State Insurance Scheme The Company’s contribution to government provident fund and employee state insurance scheme are considered as defined
contribution plans and are charged as an expense based on the amount of contribution required to be made and when services are rendered by the employees. The Company has no further obligations.
New Pension Scheme The Company contributes up to 10% of eligible employees’ salary per annum, to the New Pension Fund administered by PFRDA
appointed pension fund manager. The Company recognizes such contributions as an expense in the year they are incurred.
32 Annual Report 2018-19
Schedules forming part of Balance Sheet and Profit and Loss Account
Defined Benefit Plan
Gratuity The Company accounts for the liability for future gratuity benefits based on an independent actuarial valuation. The gratuity
obligation is unfunded. The net present value of the Company’s obligation towards the same is determined based on the Projected Unit Credit method as at the Balance Sheet date.
Remeasurement of all defined benefit plans, which comprise actuarial gains and losses are recognized immediately in OCI in the year they are incurred. Net interest expense (income) on the net defined liability (assets) is computed by applying the discount rate, used to measure the net defined liability (asset), to the net defined liability (asset) at the start of the financial year after taking into account any changes as a result of contribution and benefit payments during the year. Net interest expense and other expenses related to defined benefit plans are recognized in the Statement of Profit and Loss. Remeasurements are not reclassified to profit or loss in subsequent period.
Compensated Absences Compensated absences which accrue to employees and which are expected to be availed within twelve months immediately
following the year end are reported as expenses during the year in which the employees performs the services that the benefit covers and the liabilities are reported at the undiscounted amount of the benefit, and where the availment or encashment is otherwise not expected to wholly occur within the next twelve months, the liability on account of the benefit is actuarially determined using the projected unit credit method.
Other Employee Benefits The undiscounted amount of short-term employee benefits expected to be paid in exchange for the services rendered by employees
are recognized during the year when the employees render the service. These benefits include performance incentives.
As per the Group policy, employees of the Company are eligible for an award after completion of a specified number of years of service with the Company. The obligation is measured at the Balance Sheet date on the basis of an actuarial valuation using the projected unit credit method.
G. Earnings per share Basic earnings per share is calculated by dividing the profit or loss for the year attributable to equity shareholders (after deducting
preference dividends and attributable taxes) by the weighted average number of equity shares outstanding during the year. Partly paid equity shares are treated as a fraction of an equity share to the extent that they are entitled to participate in dividends relative to a fully paid equity share during the reporting period. The weighted average number of equity shares outstanding during the year is adjusted for events such as bonus issue, bonus element in a rights issue, share split, and reverse share split (consolidation of shares), if any, that have changed the number of equity shares outstanding, without a corresponding change in resources.
For the purpose of calculating diluted earnings per share, the profit or loss for the year attributable to equity shareholders and the weighted average number of shares outstanding during the year are adjusted for the effects of all dilutive potential equity shares.
H. Impairment of non-financial assets The carrying values of assets/cash generating units at each balance sheet date are reviewed for impairment if any indication of
impairment exists. If the carrying amount of the assets exceed the estimated recoverable amount, an impairment is recognized for such excess amount in the Statement of Profit and Loss.
The recoverable amount is the greater of the fair value less costs of disposal and their value in use. Value in use is arrived at by discounting the future cash flows to their present value based on an appropriate discount factor.
When there is indication that an impairment loss recognized for an asset (other than a revalued asset) in earlier accounting periods which no longer exists or may have decreased, such reversal of impairment loss is recognized in the Statement of Profit and Loss, to the extent the amount was previously charged to the Statement of Profit and Loss. In case of revalued assets, such reversal is not recognized.
I. Provisions and contingent liabilities A provision is recognized when the Company has a present obligation as a result of past events and it is probable that an outflow
of resources will be required to settle the obligation in respect of which a reliable estimate can be made. When the effect of the time value of money is material, the Company determines the level of provision by discounting the expected cash flows at a pre-tax
33
Schedules forming part of Balance Sheet and Profit and Loss Account
Bank Reports and Statements
Consolidated Financial StatementsFinancial HighlightsCourage of Conviction.
Constancy of Change.Schedules
rate reflecting the current rates specific to the liability. These are reviewed at each balance sheet date and adjusted to reflect the current best estimates.
Contingent liabilities are not recognized but disclosed in the notes.
J. Share based payments Employees Stock Options Plans (“ESOPs”) - Equity settled
The ultimate holding company of the company operates share option schemes for the purpose of providing incentives and rewards to eligible participants who contribute to the success of the Company’s operations. Employees (including directors) of the Company receive remuneration in the form of share-based payments, whereby employees render services as consideration for equity instruments (“equity settled transactions”).
The cost of equity-settled transactions with employees and directors for grants is measured by reference to the fair value at the date at which they are granted. The cost of equity-settled transactions is recognized in profit or loss, together with a corresponding increase in reserves, representing contribution received from the ultimate holding company, over the period in which the performance and/or service conditions are fulfilled. The cumulative expense recognized for equity-settled transactions at the end of each reporting period until the vesting date reflects the extent to which the vesting period has expired and the company’s best estimate of the number of equity instruments that will ultimately vest. The charge or credit to profit or loss for a period represents the movement in the cumulative expense recognized as at the beginning and end of that period.
Stock Appreciation Rights (“SARs”) - Cash Settled
The fair value of the amount payable to employees in respect of share appreciation rights, which are settled in cash, is recognized as an expense with a corresponding increase in liabilities, over the period the employees unconditionally become entitled to payment. The liability is measured at the end of each reporting date up to and including settlement date, with changes in the fair value recognized in the Statement of Profit and Loss in ‘Provision for Stock Appreciation Rights’ under the head Employee Benefit Expense.
K. Segment reporting The company’s operating segments are established on the basis of those components of the company that are evaluated regularly
by the Executive Committee (the ‘Chief Operating Decision Maker’ as defined in lnd AS 108- ‘Operating Segments’), in deciding how to allocate resources and in assessing performance. These have been identified taking into account nature of products and services, the differing risks and returns and the internal business reporting systems. Basis evaluation, the company concluded it operates in single reportable segment.
L. Financial Instruments A financial instrument is any contract that gives rise to a financial asset of one entity and a financial liability or equity instrument
of another entity.
Financial assets
Recognition and Initial measurement All financial assets are recognized initially at fair value plus or minus, in the case of financial assets not recorded at fair value
through profit or loss, transaction fees or costs that are directly attributable and incremental to the origination/acquisition of the financial asset unless otherwise specifically mentioned in the accounting policies.
Classification The Company classifies its financial assets as subsequently measured at either amortized cost or fair value based on the business
model for managing the financial assets and the contractual cash flow characteristics of the financial assets.
Business model assessment The Company makes an assessment of the objective of a business model in which an asset is held such that it best reflects the way
the business is managed and is consistent with information provided to the management. The information considered includes:
• theobjectivesfortheportfolio,inparticular,management’sstrategyoffocusingonearningcontractualinterestrevenue,maintaining a particular interest rate profile, matching the duration of the financial assets to the duration of the liabilities that are funding those assets or realizing cash flows through the sale of the assets;
34 Annual Report 2018-19
Schedules forming part of Balance Sheet and Profit and Loss Account
• thefrequency,volumeandtimingofsalesinpriorperiods,thereasonsforsuchsalesanditsexpectationsaboutfuturesalesactivity. However, information about sales activity is not considered in isolation, but as part of an overall assessment of how the Company’s stated objective for managing the financial assets is achieved and how cash flows are realized.
• therisksthataffecttheperformanceofthebusinessmodel,thefinancialassetsheldwithinthatbusinessmodelandhowthose risks are managed.
Assessment whether contractual cash flows are solely payments of principal and interest
For the purposes of this assessment, ‘principal’ is defined as the fair value of the financial asset on initial recognition. ‘Interest’ is defined as consideration for the time value of money and for the credit risk associated with the principal amount outstanding during a particular period of time and for other basic lending risks and costs, as well as profit margin.
Subsequent measurement The Company classifies its financial assets in the following measurement categories:
Financial assets at amortized cost A financial asset is measured at amortized cost if it meets both of the following conditions:
• theassetisheldwithinabusinessmodelwhoseobjectiveistoholdassetsinordertocollectcontractualcashflows;and
• thecontractualtermsofthefinancialassetrepresentcontractualcashflowsthataresolelypaymentsofprincipalandintereston the principal amount outstanding.
After initial measurement, such financial assets are subsequently measured at amortized cost using the effective interest (EIR) method. Amortized cost is calculated by considering any discount or premium on acquisition and fees or costs that are an integral part of the EIR and reported as part of interest income in the Statement of Profit and Loss. The losses if any, arising from impairment are recognized in the Statement of Profit and Loss.
Financial asset at fair value through Other Comprehensive Income (FVOCI)
A financial asset is measured at FVOCI if it meets both of the following conditions: • theassetisheldwithinabusinessmodelwhoseobjectiveisachievedbybothcollectingcontractualcashflowsandselling
financial assets; and
• thecontractualtermsofthefinancialassetrepresentcontractualcashflowsthataresolelypaymentsofprincipalandintereston the principal amount outstanding.
After initial measurement, such financial assets are subsequently measured at fair value. Interest income is recognized using the effective interest (EIR) method. The impairment losses, if any, are recognized through Statement of Profit and Loss. The loss allowance is recognized in OCI and does not reduce the carrying value of the financial asset. On derecognition, gains and losses accumulated in OCI are reclassified to the Statement of Profit and Loss.
Financial asset at fair value through profit and loss (FVTPL) Any financial asset, which does not meet the criteria for classification as at amortized cost or as FVOCI, is classified to be measured
at FVTPL.
Financial assets included within the FVTPL category are measured at fair value with all changes recognized in the Statement of Profit and Loss.
All equity investments except for investments in subsidiary/associate/joint ventures are measured at fair value. Equity instruments which are held for trading are classified as at FVTPL.
Equity instruments at FVOCI The Company subsequently measures all equity investments at fair value through profit or loss, unless the Company has elected
to classify irrevocably some of its equity investments as equity instruments at FVOCI, when such instruments meet the definition of definition of Equity under Ind AS 32 Financial Instruments: Presentation and are not held for trading. Such classification is determined on an instrument-by-instrument basis.
35
Schedules forming part of Balance Sheet and Profit and Loss Account
Bank Reports and Statements
Consolidated Financial StatementsFinancial HighlightsCourage of Conviction.
Constancy of Change.Schedules
Gains and losses on these equity instruments are never recycled to the Statement of Profit and Loss. Dividends are recognized in the Statement of Profit and Loss as dividend income when the right of the payment has been established, except when the Company benefits from such proceeds as a recovery of part of the cost of the instrument, in which case, such gains are recorded in OCI. Equity instruments at FVOCI are not subject to an impairment assessment.
Financial liabilities
The company classifies all financial liabilities as subsequently measured at amortized cost, except for financial liabilities at fair value through profit or loss. Liabilities which are classified at fair value through profit or loss, including derivatives that are liabilities, shall be subsequently measured at fair value.
M. Impairment of Financial Assets Methodology for computation of Expected Credit Losses (ECL)
The financial instruments covered within the scope of ECL include financial assets measured at amortized cost and FVOCI, such as loans, trade receivables, balances with banks and other financial assets. ECL has not been determined on financial assets measured at FVTPL.
The loss allowance has been measured using lifetime ECL except for financial assets on which there has been no significant increase in credit risk since initial recognition. In such cases, loss allowance has been measured at 12 month ECL.
At each reporting date, the Company assesses whether financial assets carried at amortized cost and FVOCI is credit-impaired. A financial asset is credit- impaired when one or more events that have a detrimental impact on the estimated future cash flows of the financial asset have occurred since initial recognition. Evidence that a financial asset is credit-impaired include observable data about the following events:
• significantfinancialdifficultyoftheissuerortheborrower;
• abreachofcontract,suchasadefaultorpastdueevent;
• the lender(s)of theborrower, foreconomicor contractual reasons relating to theborrower’sfinancialdifficulty,havinggranted to the borrower a concession(s) that the lender(s) would not otherwise consider;
• itisbecomingprobablethattheborrowerwillenterbankruptcyorotherfinancialreorganization;
• thedisappearanceofanactivemarketforthatfinancialassetbecauseoffinancialdifficulties.
ECL are a probability weighted estimate of credit losses, measured as follows: • Financialassetsthatarenotcreditimpairedatthereportingdate:
ECL has been estimated by determining the probability of default (‘PD’), Exposure At Default (‘EAD’) and loss given default (‘LGD’).
PD has been computed using observed history of default and converted into forward looking PD’s using suitable macro-economic variable data.
• Financialassetsthatarecreditimpairedatthereportingdate:
ECL has been estimated as the difference between the gross carrying amount and the present value of estimated future cash flows.
For trade receivables, the Company applies a simplified approach. It recognizes impairment loss allowance based on lifetime ECLs at each reporting date, right from its initial recognition. Therefore, the Company does not track changes in credit risk, but instead recognizes a loss allowance based on lifetime ECLs at each reporting date.
If the terms of a financial asset are renegotiated or modified or an existing financial asset is replaced with a new one due to financial difficulties of the borrower, then an assessment is made of whether the financial asset should be derecognized:
• If theexpected restructuringwillnot result inderecognitionof theexistingasset,expectedcashflowsarising fromthemodified financial asset are included in calculating cash shortfalls from the existing asset.
• If theexpectedrestructuringwill result inderecognitionoftheexistingassetandtherecognitionofmodifiedasset,themodified asset is considered as a new financial asset. The date of the modification is treated as the date of initial recognition of that financial asset when applying the impairment requirements to the modified financial asset. The impairment loss
36 Annual Report 2018-19
Schedules forming part of Balance Sheet and Profit and Loss Account
allowance is measured at an amount equal to 12 month expected credit losses until there is a significant increase in credit risk. If modified financial asset is credit-impaired at initial recognition, the financial asset is recognized as originated credit impaired asset.
Criteria used for determination of movement from stage 1 (12 month ECL) to stage 2 (lifetime ECL) and stage 3 (Lifetime ECL)
The Company applies a three-stage approach to measure ECL on financial assets measured at amortized cost and FVOCI. The assets migrate through the following three stages based on an assessment of qualitative and quantitative considerations:
• Stage1:12monthECL:
For exposures where there has not been a significant increase in credit risk since initial recognition and that are not credit impaired upon origination, the portion of the lifetime ECL associated with the probability of default events occurring within the next 12 months is recognized. Interest income is accrued using the effective interest rate on the gross carrying amount.
• Stage2:LifetimeECL(notcreditimpaired):
At each reporting date, the Company assesses whether there has been a significant increase in credit risk for financial assets since initial recognition. In determining whether credit risk has increased significantly since initial recognition, the Company uses days past due (DPD) information and other qualitative factors to assess deterioration in credit quality of a financial asset.
For credit exposures where there has been a significant increase in credit risk since initial recognition but that are not credit impaired, a lifetime ECL is recognized. Interest income is accrued using the effective interest rate on the gross carrying amount.
• Stage3:LifetimeECL(creditimpaired):
Financial assets are assessed as credit impaired when one or more events that have a detrimental impact on the estimated future cash flows of the asset have occurred. For financial assets that have become credit impaired, a lifetime ECL is recognized and interest revenue is calculated by applying the effective interest rate to the amortized cost (net of loss allowance).
If, in a subsequent period, credit quality improves and reverses any previously assessed significant increase in credit risk since origination, then the Expected Credit Loss reverts from lifetime ECL to 12-months ECL.
For loans whose significant payment obligations are only after next 12 months, life time ECL has been applied.
Method used to compute lifetime ECL:
The Company calculates ECLs based on a probability-weighted scenarios to measure the expected cash shortfalls, discounted at an approximation to the EIR. A cash shortfall is the difference between the cash flows that are due to an entity in accordance with the contract and the present value of cash flows that the entity expects to receive. The Company applies statistical techniques to estimate 12 month ECL and lifetime ECL.
Manner in which forward looking assumptions has been incorporated in ECL estimates:
The Company considers its historical loss experience and adjusts it for current observable data. In addition, the Company uses reasonable forecasts of future economic conditions including expert judgment to estimate the amount of expected credit losses. The methodology and assumptions including any forecasts of future economic conditions are periodically reviewed and changes, if any, are accounted for prospectively.
N. Derecognition of financial assets and financial liabilities A financial asset (or, where applicable, a part of a financial asset or part of a group of similar financial assets) is primarily
derecognized when:
• Therightstoreceivecashflowsfromtheassethaveexpired,or
• TheCompanyhastransferreditsrightstoreceivecashflowsfromtheassetorhasassumedanobligationtopaythereceivedcash flows in full without material delay to a third party under a ‘pass-through’ arrangement; and either (a) the Company
37
Schedules forming part of Balance Sheet and Profit and Loss Account
Bank Reports and Statements
Consolidated Financial StatementsFinancial HighlightsCourage of Conviction.
Constancy of Change.Schedules
has transferred substantially all the risks and rewards of the asset, or (b) the Company has neither transferred nor retained substantially all the risks and rewards of the asset, but has transferred control of the asset.
On derecognition of a financial asset, the difference between the carrying amount of the asset (or the carrying amount allocated to the portion of the asset derecognized) and the sum of (i) the consideration received (including any new asset obtained less any new liability assumed) and (ii) any cumulative gain or loss that had been recognized in OCI is recognized in the Statement of Profit and Loss.
Financial liabilities
The Company derecognizes a financial liability when its contractual obligations are discharged or cancelled, or expire.
O. Modifications of financial assets and financial liabilities Financial assets
If the terms of a financial asset are modified, the Company evaluates whether the cash flows of the modified asset are substantially different. If the cash flows are substantially different, then the contractual rights to cash flows from the original financial asset are deemed to have expired. In this case, the original financial asset is derecognized and a new financial asset is recognized at fair value.
If the cash flows of the modified asset carried at amortized cost are not substantially different, then the modification does not result in derecognition of the financial asset. In this case, the Company recalculates the gross carrying amount of the financial asset as the present value of the renegotiated or modified contractual cash flows that are discounted at the financial asset’s original effective interest rate and recognizes the amount arising from adjusting the gross carrying amount as a modification gain or loss in profit and loss account. Any costs or fees incurred adjust the carrying amount of the modified financial asset and are amortized over the remaining term of the modified financial asset. If such a modification is carried out because of financial difficulties of the borrower, then the gain or loss is presented together with impairment losses. In other cases, it is presented as interest income.
Financial liabilities
The Company derecognizes a financial liability when its terms are modified and the cash flows of the modified liability are substantially different. In this case, a new financial liability based on the modified terms is recognized at fair value. The difference between the carrying amount of the financial liability extinguished and the new financial liability with modified terms is recognized in the Statement of Profit and Loss.
P. Measurement of fair values The Company’s accounting policies and disclosures require fair value measurement of financial instruments such as investment in
unquoted equity instruments, mutual fund, etc.
Fair value is the price that would be received to sell an asset or paid to transfer a liability in an orderly transaction between market participants at the measurement date.
Management uses its judgment in selecting an appropriate valuation technique for financial instruments not quoted in an active market. Valuation techniques commonly used by market participants are applied.
When measuring the fair value of an asset or a liability, the Company uses observable market data as far as possible. Fair values are categorized into different levels in a fair value hierarchy based on the inputs used in the valuation techniques as follows:
• Level1:quotedprices(unadjusted)inactivemarketsforidenticalassetsorliabilities.
• Level2:inputsotherthanquotedpricesincludedinLevel1thatareobservablefortheassetorliability,eitherdirectly(i.e.asprices) or indirectly (i.e. derived from prices).
• Level3:inputsfortheassetorliabilitythatarenotbasedonobservablemarketdata(unobservableinputs).
If the inputs used to measure the fair value of an asset or a liability fall into different levels of the fair value hierarchy, then the fair value measurement is categorized in its entirety in the same level of the fair value hierarchy as the lowest level input that is significant to the entire measurement.
38 Annual Report 2018-19
Schedules forming part of Balance Sheet and Profit and Loss Account
q. Cash and cash equivalents Cash and cash equivalents comprise of cash on hand and demand deposits with banks. It also comprises of short-term deposits
with an original maturity of three months or less, highly liquid investments that are readily convertible into known amounts of cash and which are subject to insignificant risk of changes in value.
R. Cash Flow Statement Cash flows are reported using the indirect method, whereby profit / (loss) before exceptional items and tax is adjusted for the
effects of transactions of non-cash nature and any deferrals or accruals of past or future cash receipts or payments. The cash flows from operating, investing and financing activities.
S. All assets and liabilities have been classified as current or non-current as per the Company’s operating cycle and other criteria set out in the Schedule III to the Companies Act, 2013. Based on the nature of services and the time between the provision of services and their realisation in cash and cash equivalents, the Company has ascertained its operating cycle as 12 months for thepurpose of current or non-current classification of assets and liabilities.
T. Optional exemptions and Mandatory exceptions under Ind AS 101 First Time Adoption of Indian Accounting Standards (Ind AS)
Optional exemptions:
I. Deemed cost The Company has elected to account for property plant and equipment and intangible assets at their previous GAAP
carrying amount as on 1 April 2017 i.e. deemed cost as at the date of transition.
II. Share-based payments The Company has elected not to apply Ind AS 102 Share-based payment to equity instruments that vested before the date
of transition to Ind AS. Accordingly, the Company has measured only the unvested stock options on the date of transition as per Ind AS 102.
Mandatory exemptions:
I. Estimates The estimates at April 1, 2017 and March 31, 2018 are consistent with those made for the same dates in accordance
with the Indian GAAP (after adjustments to reflect any differences if any, in accounting policies). The Company has made estimates for following items in accordance with Ind AS at the date of transition as these were not required under previous GAAP:
• FairvaluationoffinancialinstrumentsatFVTPLand/orFVOCI
• Impairmentoffinancialassetsbasedonexpectedcreditlossmodel.
II. Derecognition of financial assets and financial liabilities Ind AS 101 requires a first-time adopter to apply the de-recognition provisions of Ind AS 109 prospectively for transactions
occurring on or after the date of transition to Ind AS. However, Ind AS 101 allows a first-time adopter to apply the de-recognition requirements in Ind AS 109 retrospectively from a date of the entity’s choosing, provided that the information needed to apply Ind AS 109 to financial assets and financial liabilities derecognised as a result of past transactions was obtained at the time of initially accounting for those transactions.
III. Classification of financial assets The Company has classified and measured the financial assets on the basis of the facts and circumstances that exist at the
date of transition to Ind AS.
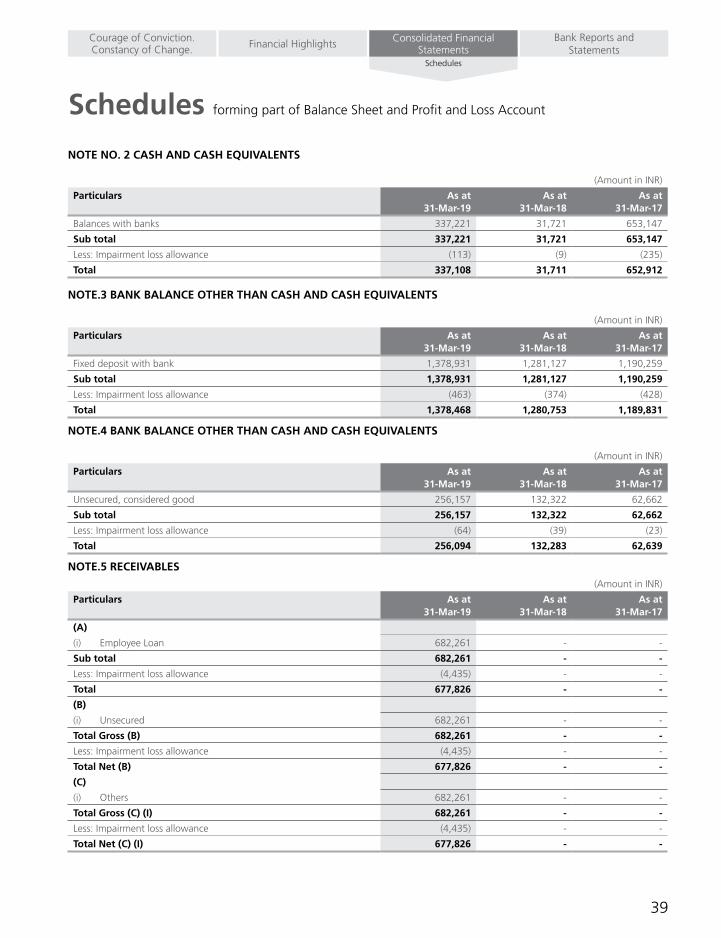
39
Schedules forming part of Balance Sheet and Profit and Loss Account
Bank Reports and Statements
Consolidated Financial StatementsFinancial HighlightsCourage of Conviction.
Constancy of Change.Schedules
NOTE NO. 2 CASH AND CASH EqUIVALENTS
(Amount in INR)
Particulars As at 31-Mar-19
As at 31-Mar-18
As at 31-Mar-17
Balances with banks 337,221 31,721 653,147
Sub total 337,221 31,721 653,147
Less: Impairment loss allowance (113) (9) (235)
Total 337,108 31,711 652,912
NOTE.3 BANK BALANCE OTHER THAN CASH AND CASH EqUIVALENTS
(Amount in INR)
Particulars As at 31-Mar-19
As at 31-Mar-18
As at 31-Mar-17
Fixed deposit with bank 1,378,931 1,281,127 1,190,259
Sub total 1,378,931 1,281,127 1,190,259
Less: Impairment loss allowance (463) (374) (428)
Total 1,378,468 1,280,753 1,189,831
NOTE.4 BANK BALANCE OTHER THAN CASH AND CASH EqUIVALENTS
(Amount in INR)
Particulars As at 31-Mar-19
As at 31-Mar-18
As at 31-Mar-17
Unsecured, considered good 256,157 132,322 62,662
Sub total 256,157 132,322 62,662
Less: Impairment loss allowance (64) (39) (23)
Total 256,094 132,283 62,639
NOTE.5 RECEIVABLES
(Amount in INR)
Particulars As at 31-Mar-19
As at 31-Mar-18
As at 31-Mar-17
(A)
(i) Employee Loan 682,261 - -
Sub total 682,261 - -
Less: Impairment loss allowance (4,435) - -
Total 677,826 - -
(B)
(i) Unsecured 682,261 - -
Total Gross (B) 682,261 - -
Less: Impairment loss allowance (4,435) - -
Total Net (B) 677,826 - -
(C)
(i) Others 682,261 - -
Total Gross (C) (I) 682,261 - -
Less: Impairment loss allowance (4,435) - -
Total Net (C) (I) 677,826 - -

40 Annual Report 2018-19
Schedules forming part of Balance Sheet and Profit and Loss Account
(Amount in INR)
Particulars As at 31-Mar-19
As at 31-Mar-18
As at 31-Mar-17
(II) Loans outside India - - -
Less: Impairment allowance - - -
Total Net (C) (II) - - -
Total (C) (I) and (II) 677,826 - -
NOTE.6 INVESTMENTS
(Amount in INR)
Particulars As at 31-Mar-19
As at 31-Mar-18
As at 31-Mar-17
Mutual funds 310,265,595 313,660,316 315,508,144
Total Gross (A) 310,265,595 313,660,316 315,508,144
(i) Investments outside India - - -
(ii) Investments in India 310,265,595 313,660,316 315,508,144
Total (B) 310,265,595 313,660,316 315,508,144
Less: Impairment allowance - - -
Total Net 310,265,595 313,660,316 315,508,144
Ammortised cost
At fair value through profit or loss 310,265,595 313,660,316 315,508,144
310,265,595 313,660,316 315,508,144

41
Schedules forming part of Balance Sheet and Profit and Loss Account
Bank Reports and Statements
Consolidated Financial StatementsFinancial HighlightsCourage of Conviction.
Constancy of Change.Schedules
NOTE.7 PROPERTY, PLANT AND EqUIPMENT :
(Amount in INR)
Particulars As at 31-Mar-19
As at 31-Mar-18
As at 31-Mar-17
Office equipment - 2,382 5,232
Computers 9,392 33,345 66,874
Total 9,392 35,727 72,106
(Amount in INR)
Particulars Office equipment
Computers Total
PROPERTY, PLANT AND EQUIPMENT
At cost or fair value as at 1-April-2017 5,232 66,874 72,106
Additions during the year -
Disposals during the year -
At cost or fair value as at 31-March-2018 5,232 66,874 72,106
Accumulated depreciation and impairment as at 1-April-2017 -
Depreciation for the year 2,850 33,529 36,379
Disposals during the year -
Accumulated depreciation and impairment as at 31-March-2018 2,850 33,529 36,379
Net carrying amount as on 31-March-2018 2,382 33,345 35,727
At cost or fair value as at 31-March-2018 5,232 66,874 72,106
Additions during the year -
Disposals during the year -
At cost or fair value as at 31-March-2019 5,232 66,874 72,106
Accumulated depreciation and impairment as at 31-March-2018 2,850 33,529 36,379
Depreciation for the year 2,382 23,953 26,335
Disposals during the year -
Accumulated depreciation and impairment as at 31-March-2019 5,232 57,481 62,714
Net carrying amount as at 31-March-2019 - 9,393 9,392
The Company has availed the deemed cost exemption as per IND AS 101 in relation to the tangible assets as on the date of transition (1st April 2017) and hence the net block carrying amount has been considered as the gross block carrying amount on that date. Refer note below for the gross block value and the accumulated depreciation on 1st April 2017 under the previous GAAP.
(Amount in INR)
Particulars Office equipment
Computers Total
Gross Block 14,250 189,450 203,700
Accumulated Depreciation (9,018) (122,576) (131,594)
Net Block 5,232 66,874 72,106

42 Annual Report 2018-19
Schedules forming part of Balance Sheet and Profit and Loss Account
NOTE 8 OTHER INTANGIBLE ASSETS
(Amount in INR)
Particulars As at 31-Mar-19
As at 31-Mar-18
As at 31-Mar-17
(i) Computer software 155,436 355,833 556,229
Total 155,436 355,833 556,229
NOTE 8 INTANGIBLE ASSETS
(Amount in INR)
Particulars Software Total
At cost or fair value as at 1-April-2017 556,230 556,230
Additions during the year -
Disposals during the year -
At cost or fair value as at 31-March-2018 556,230 556,230
Accumulated depreciation and impairment as at 1-April-2017 -
Depreciation for the year 200,397 200,397
Disposals during the year -
Accumulated depreciation and impairment as at 31-March-2018 200,397 200,397
Net carrying amount as at 31-March-2018 355,833 355,833
At cost or fair value as at 31-March-2018 556,230 556,230
Additions during the year - -
Disposals during the year -
At cost or fair value as at 30-June-2019 556,230 556,230
Accumulated depreciation and impairment as at 31-March-2018 200,397 200,397
Depreciation for the year 200,397 200,397
Disposals during the year -
Accumulated depreciation and impairment as at 31-March-2019 400,794 400,794
Net carrying amount as at 31-March-2019 155,436 155,436
The Company has availed the deemed cost exemption as per IND AS 101 in relation to the intangible assets as at the date of transition (1st April 2017) and hence the net block carrying amount has been considered as the gross block carrying amount on that date. Refer note below for the gross block value and the accumulated depreciation on 1st April 2017 under the previous GAAP.
(Amount in INR)
Particulars Software Total
Gross Block 601,251 203,700
Accumulated Depreciation (45,021) (131,594)
Net Block 556,230 72,106
Impairment loss and reversal of impairment loss There is no impairment loss recognized for intangible assets
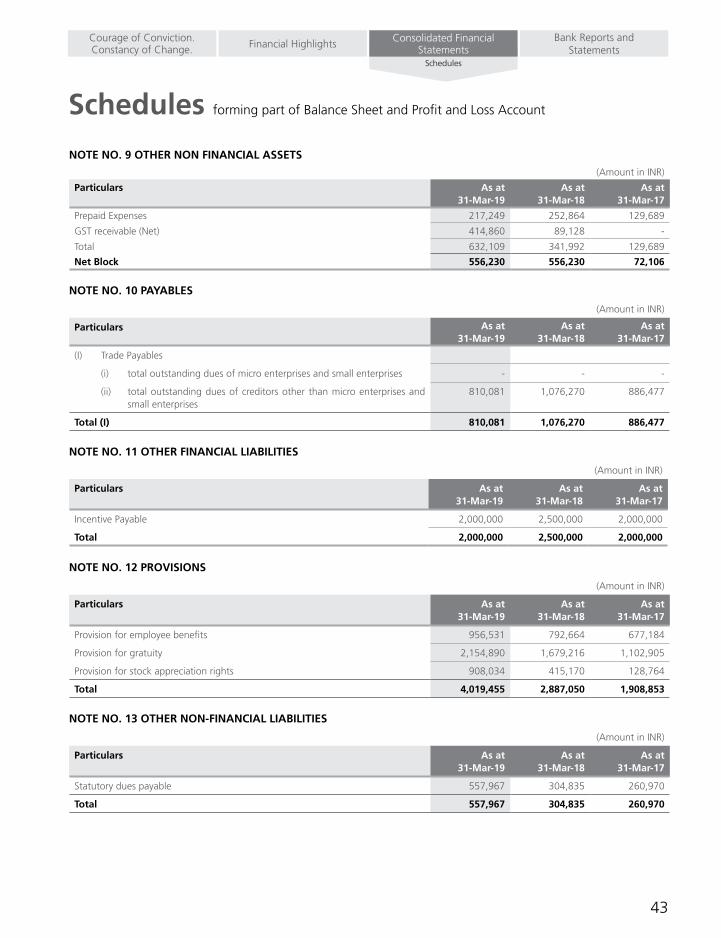
43
Schedules forming part of Balance Sheet and Profit and Loss Account
Bank Reports and Statements
Consolidated Financial StatementsFinancial HighlightsCourage of Conviction.
Constancy of Change.Schedules
NOTE NO. 9 OTHER NON FINANCIAL ASSETS
(Amount in INR)
Particulars As at 31-Mar-19
As at 31-Mar-18
As at 31-Mar-17
Prepaid Expenses 217,249 252,864 129,689
GST receivable (Net) 414,860 89,128 -
Total 632,109 341,992 129,689
Net Block 556,230 556,230 72,106
NOTE NO. 10 PAYABLES
(Amount in INR)
Particulars As at 31-Mar-19
As at 31-Mar-18
As at 31-Mar-17
(I) Trade Payables
(i) total outstanding dues of micro enterprises and small enterprises - - -
(ii) total outstanding dues of creditors other than micro enterprises and small enterprises
810,081 1,076,270 886,477
Total (I) 810,081 1,076,270 886,477
NOTE NO. 11 OTHER FINANCIAL LIABILITIES
(Amount in INR)
Particulars As at 31-Mar-19
As at 31-Mar-18
As at 31-Mar-17
Incentive Payable 2,000,000 2,500,000 2,000,000
Total 2,000,000 2,500,000 2,000,000
NOTE NO. 12 PROVISIONS
(Amount in INR)
Particulars As at 31-Mar-19
As at 31-Mar-18
As at 31-Mar-17
Provision for employee benefits 956,531 792,664 677,184
Provision for gratuity 2,154,890 1,679,216 1,102,905
Provision for stock appreciation rights 908,034 415,170 128,764
Total 4,019,455 2,887,050 1,908,853
NOTE NO. 13 OTHER NON-FINANCIAL LIABILITIES
(Amount in INR)
Particulars As at 31-Mar-19
As at 31-Mar-18
As at 31-Mar-17
Statutory dues payable 557,967 304,835 260,970
Total 557,967 304,835 260,970

44 Annual Report 2018-19
Schedules forming part of Balance Sheet and Profit and Loss Account
NOTE NO. 14 EqUITY SHARE CAPITAL
(Amount in INR)
Particulars Office equipment
Computers Total
Authorised
6,00,00,000 (31 March 2018 6,00,00,000) equity shares of `10/- each 600,000,000 600,000,000 600,000,000
Issued, subscribed and paid-up
2,80,00,000 (31 March 2018 2,80,00,000) equity shares of ` 10/- each, fully paid up 280,000,000 280,000,000 280,000,000
280,000,000 280,000,000 280,000,000
a. Reconciliation of number of shares outstanding at the beginning and end of the year :
(Amount in INR)
Particulars Computers Total
Equity shares of ` 10 each, fully paid-up
As at 1 April 2017 28,000,000 280,000,000
Add : Issued during the year
As at 31 March 2018 28,000,000 280,000,000
Add : Issued during the year
As at 31 March 2019 28,000,000 280,000,000
b. Terms/ rights attached to equity shares The Company has only one class of equity shares having par value of ` 10 per share. Each holder of equity shares is entitled to one vote
per share. In the event of liquidation of the Company, the holders of equity shares will be entitled to receive remaining assets of the company, after distribution of all preferential amounts. The distribution will be in proportion to the number of equity shares held by the shareholders.
c. Shares held by holding/ ultimate holding company and/ or their subsidiaries/ associates
(Amount in INR)
Particulars 31-Mar-19 31-Mar-18 1-Apr-17
Number of shares
% Holding
Number of shares
% Holding
Number of shares
% Holding
Kotak Mahindra Asset Management Company Limited
26,800,000 95.71 26,800,000 95.71 26,800,000
95.71
Kotak Mahindra Bank Limited 1,200,000 4.29 1,200,000 4.29 1,200,000 4.29
28,000,000 100.00 28,000,000 100.00 28,000,000 100.00
d. Details of shareholders holding more than 5% shares in the company
(Amount in INR)
Particulars 31-Mar-19 31-Mar-18 1-Apr-17
Number of shares
% Holding
Number of shares
% Holding
Number of shares
% Holding
Kotak Mahindra Asset Management Company Limited
26,800,000 95.71 26,800,000 95.71 26,800,000 95.71
28,000,000 100.00 28,000,000 100.00 28,000,000 100.00
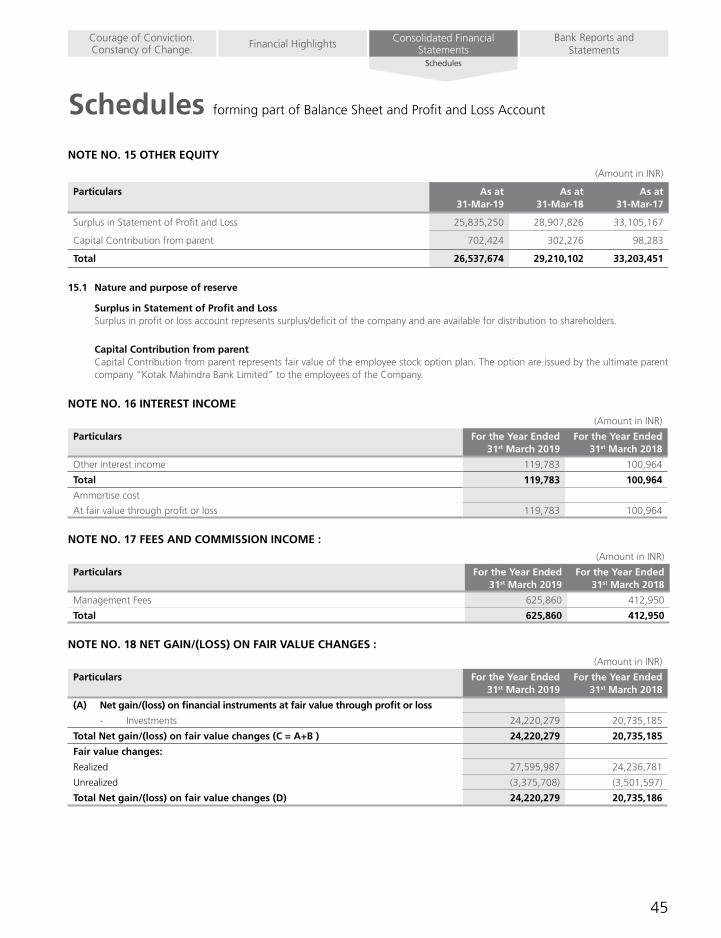
45
Schedules forming part of Balance Sheet and Profit and Loss Account
Bank Reports and Statements
Consolidated Financial StatementsFinancial HighlightsCourage of Conviction.
Constancy of Change.Schedules
NOTE NO. 15 OTHER EqUITY
(Amount in INR)
Particulars As at 31-Mar-19
As at 31-Mar-18
As at 31-Mar-17
Surplus in Statement of Profit and Loss 25,835,250 28,907,826 33,105,167
Capital Contribution from parent 702,424 302,276 98,283
Total 26,537,674 29,210,102 33,203,451
15.1 Nature and purpose of reserve
Surplus in Statement of Profit and Loss Surplus in profit or loss account represents surplus/deficit of the company and are available for distribution to shareholders.
Capital Contribution from parent Capital Contribution from parent represents fair value of the employee stock option plan. The option are issued by the ultimate parent
company “Kotak Mahindra Bank Limited” to the employees of the Company.
NOTE NO. 16 INTEREST INCOME
(Amount in INR)
Particulars For the Year Ended 31st March 2019
For the Year Ended 31st March 2018
Other interest income 119,783 100,964
Total 119,783 100,964
Ammortise cost
At fair value through profit or loss 119,783 100,964
NOTE NO. 17 FEES AND COMMISSION INCOME :
(Amount in INR)
Particulars For the Year Ended 31st March 2019
For the Year Ended 31st March 2018
Management Fees 625,860 412,950
Total 625,860 412,950
NOTE NO. 18 NET GAIN/(LOSS) ON FAIR VALUE CHANGES :
(Amount in INR)
Particulars For the Year Ended 31st March 2019
For the Year Ended 31st March 2018
(A) Net gain/(loss) on financial instruments at fair value through profit or loss
- Investments 24,220,279 20,735,185
Total Net gain/(loss) on fair value changes (C = A+B ) 24,220,279 20,735,185
Fair value changes:
Realized 27,595,987 24,236,781
Unrealized (3,375,708) (3,501,597)
Total Net gain/(loss) on fair value changes (D) 24,220,279 20,735,186
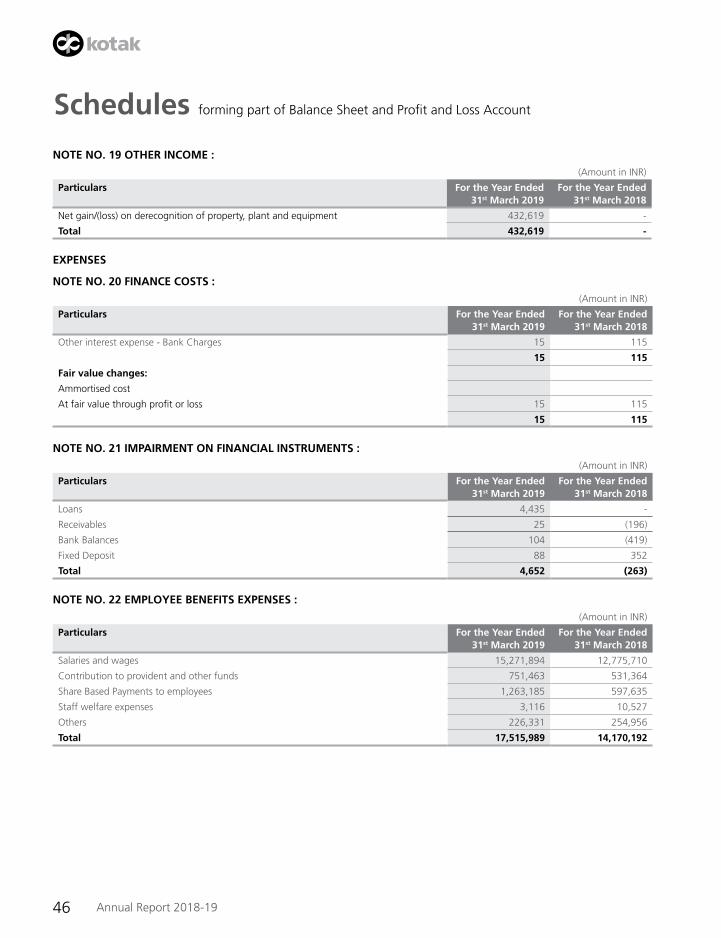
46 Annual Report 2018-19
Schedules forming part of Balance Sheet and Profit and Loss Account
NOTE NO. 19 OTHER INCOME :
(Amount in INR)
Particulars For the Year Ended 31st March 2019
For the Year Ended 31st March 2018
Net gain/(loss) on derecognition of property, plant and equipment 432,619 -
Total 432,619 -
EXPENSES
NOTE NO. 20 FINANCE COSTS :
(Amount in INR)
Particulars For the Year Ended 31st March 2019
For the Year Ended 31st March 2018
Other interest expense - Bank Charges 15 115
15 115
Fair value changes:
Ammortised cost
At fair value through profit or loss 15 115
15 115
NOTE NO. 21 IMPAIRMENT ON FINANCIAL INSTRUMENTS :
(Amount in INR)
Particulars For the Year Ended 31st March 2019
For the Year Ended 31st March 2018
Loans 4,435 -
Receivables 25 (196)
Bank Balances 104 (419)
Fixed Deposit 88 352
Total 4,652 (263)
NOTE NO. 22 EMPLOYEE BENEFITS EXPENSES :
(Amount in INR)
Particulars For the Year Ended 31st March 2019
For the Year Ended 31st March 2018
Salaries and wages 15,271,894 12,775,710
Contribution to provident and other funds 751,463 531,364
Share Based Payments to employees 1,263,185 597,635
Staff welfare expenses 3,116 10,527
Others 226,331 254,956
Total 17,515,989 14,170,192
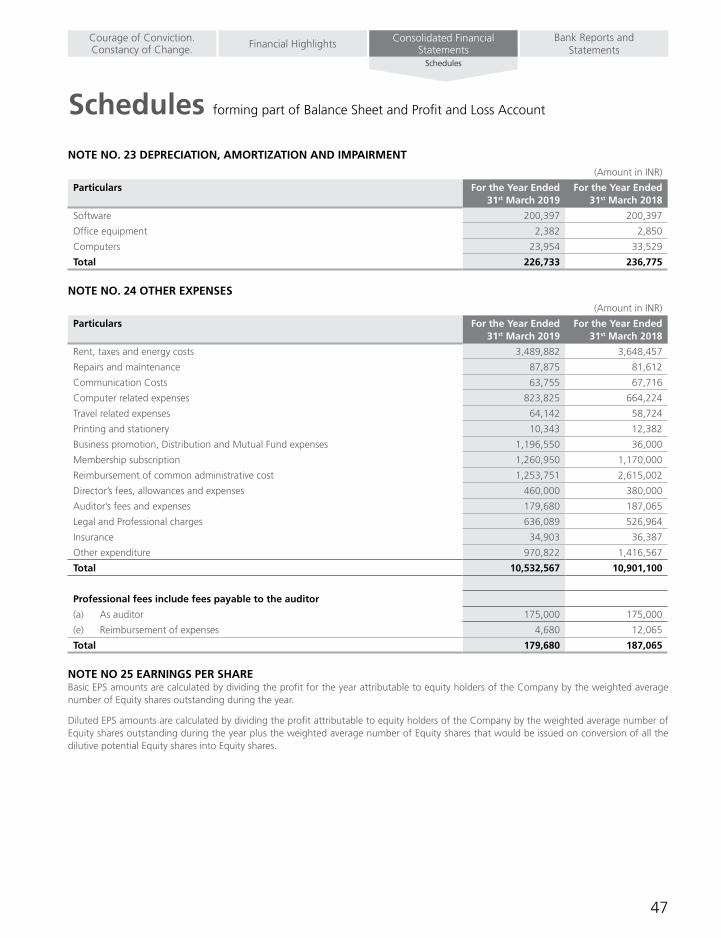
47
Schedules forming part of Balance Sheet and Profit and Loss Account
Bank Reports and Statements
Consolidated Financial StatementsFinancial HighlightsCourage of Conviction.
Constancy of Change.Schedules
NOTE NO. 23 DEPRECIATION, AMORTIzATION AND IMPAIRMENT
(Amount in INR)
Particulars For the Year Ended 31st March 2019
For the Year Ended 31st March 2018
Software 200,397 200,397
Office equipment 2,382 2,850
Computers 23,954 33,529
Total 226,733 236,775
NOTE NO. 24 OTHER EXPENSES
(Amount in INR)
Particulars For the Year Ended 31st March 2019
For the Year Ended 31st March 2018
Rent, taxes and energy costs 3,489,882 3,648,457
Repairs and maintenance 87,875 81,612
Communication Costs 63,755 67,716
Computer related expenses 823,825 664,224
Travel related expenses 64,142 58,724
Printing and stationery 10,343 12,382
Business promotion, Distribution and Mutual Fund expenses 1,196,550 36,000
Membership subscription 1,260,950 1,170,000
Reimbursement of common administrative cost 1,253,751 2,615,002
Director’s fees, allowances and expenses 460,000 380,000
Auditor’s fees and expenses 179,680 187,065
Legal and Professional charges 636,089 526,964
Insurance 34,903 36,387
Other expenditure 970,822 1,416,567
Total 10,532,567 10,901,100
Professional fees include fees payable to the auditor
(a) As auditor 175,000 175,000
(e) Reimbursement of expenses 4,680 12,065
Total 179,680 187,065
NOTE NO 25 EARNINGS PER SHAREBasic EPS amounts are calculated by dividing the profit for the year attributable to equity holders of the Company by the weighted average number of Equity shares outstanding during the year.
Diluted EPS amounts are calculated by dividing the profit attributable to equity holders of the Company by the weighted average number of Equity shares outstanding during the year plus the weighted average number of Equity shares that would be issued on conversion of all the dilutive potential Equity shares into Equity shares.
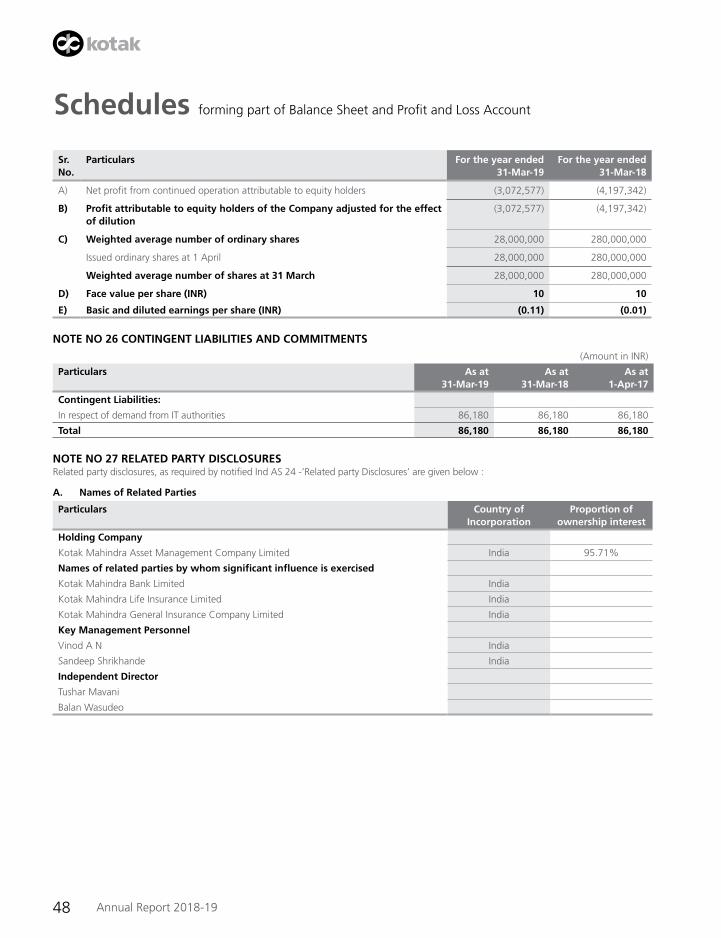
48 Annual Report 2018-19
Schedules forming part of Balance Sheet and Profit and Loss Account
Sr. No.
Particulars For the year ended 31-Mar-19
For the year ended 31-Mar-18
A) Net profit from continued operation attributable to equity holders (3,072,577) (4,197,342)
B) Profit attributable to equity holders of the Company adjusted for the effect of dilution
(3,072,577) (4,197,342)
C) Weighted average number of ordinary shares 28,000,000 280,000,000
Issued ordinary shares at 1 April 28,000,000 280,000,000
Weighted average number of shares at 31 March 28,000,000 280,000,000
D) Face value per share (INR) 10 10
E) Basic and diluted earnings per share (INR) (0.11) (0.01)
NOTE NO 26 CONTINGENT LIABILITIES AND COMMITMENTS
(Amount in INR)
Particulars As at 31-Mar-19
As at 31-Mar-18
As at 1-Apr-17
Contingent Liabilities:
In respect of demand from IT authorities 86,180 86,180 86,180
Total 86,180 86,180 86,180
NOTE NO 27 RELATED PARTY DISCLOSURESRelated party disclosures, as required by notified Ind AS 24 -’Related party Disclosures’ are given below :
A. Names of Related Parties
Particulars Country of Incorporation
Proportion of ownership interest
Holding Company
Kotak Mahindra Asset Management Company Limited India 95.71%
Names of related parties by whom significant influence is exercised
Kotak Mahindra Bank Limited India
Kotak Mahindra Life Insurance Limited India
Kotak Mahindra General Insurance Company Limited India
Key Management Personnel
Vinod A N India
Sandeep Shrikhande India
Independent Director
Tushar Mavani
Balan Wasudeo
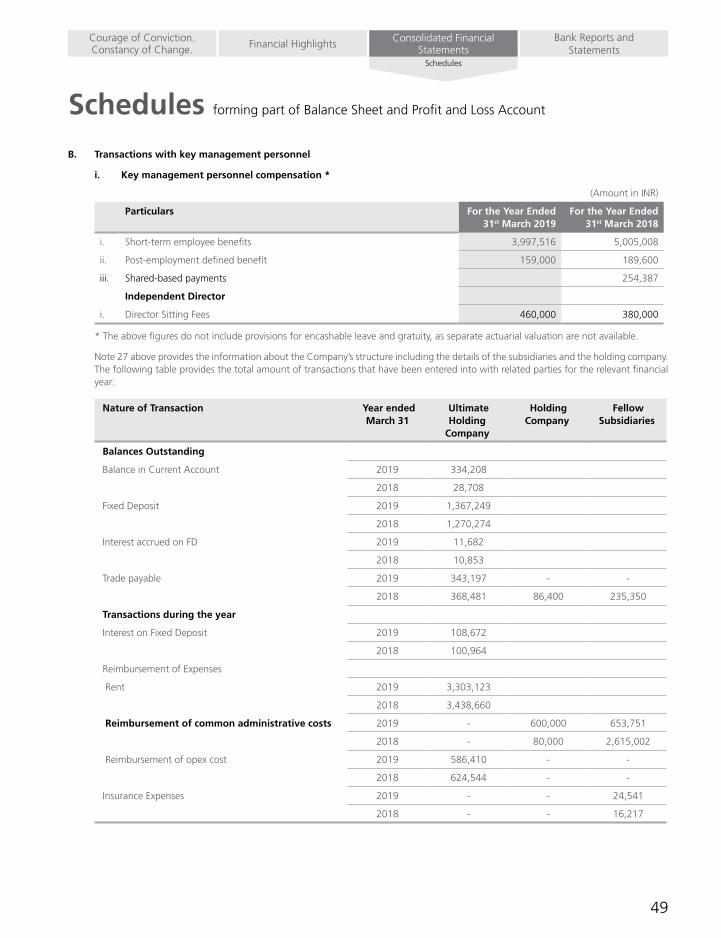
49
Schedules forming part of Balance Sheet and Profit and Loss Account
Bank Reports and Statements
Consolidated Financial StatementsFinancial HighlightsCourage of Conviction.
Constancy of Change.Schedules
B. Transactions with key management personnel
i. Key management personnel compensation *
(Amount in INR)
Particulars For the Year Ended 31st March 2019
For the Year Ended 31st March 2018
i. Short-term employee benefits 3,997,516 5,005,008
ii. Post-employment defined benefit 159,000 189,600
iii. Shared-based payments 254,387
Independent Director
i. Director Sitting Fees 460,000 380,000
* The above figures do not include provisions for encashable leave and gratuity, as separate actuarial valuation are not available.
Note 27 above provides the information about the Company’s structure including the details of the subsidiaries and the holding company. The following table provides the total amount of transactions that have been entered into with related parties for the relevant financial year:
Nature of Transaction Year ended March 31
Ultimate Holding
Company
Holding Company
Fellow Subsidiaries
Balances Outstanding
Balance in Current Account 2019 334,208
2018 28,708
Fixed Deposit 2019 1,367,249
2018 1,270,274
Interest accrued on FD 2019 11,682
2018 10,853
Trade payable 2019 343,197 - -
2018 368,481 86,400 235,350
Transactions during the year
Interest on Fixed Deposit 2019 108,672
2018 100,964
Reimbursement of Expenses
Rent 2019 3,303,123
2018 3,438,660
Reimbursement of common administrative costs 2019 - 600,000 653,751
2018 - 80,000 2,615,002
Reimbursement of opex cost 2019 586,410 - -
2018 624,544 - -
Insurance Expenses 2019 - - 24,541
2018 - - 16,217
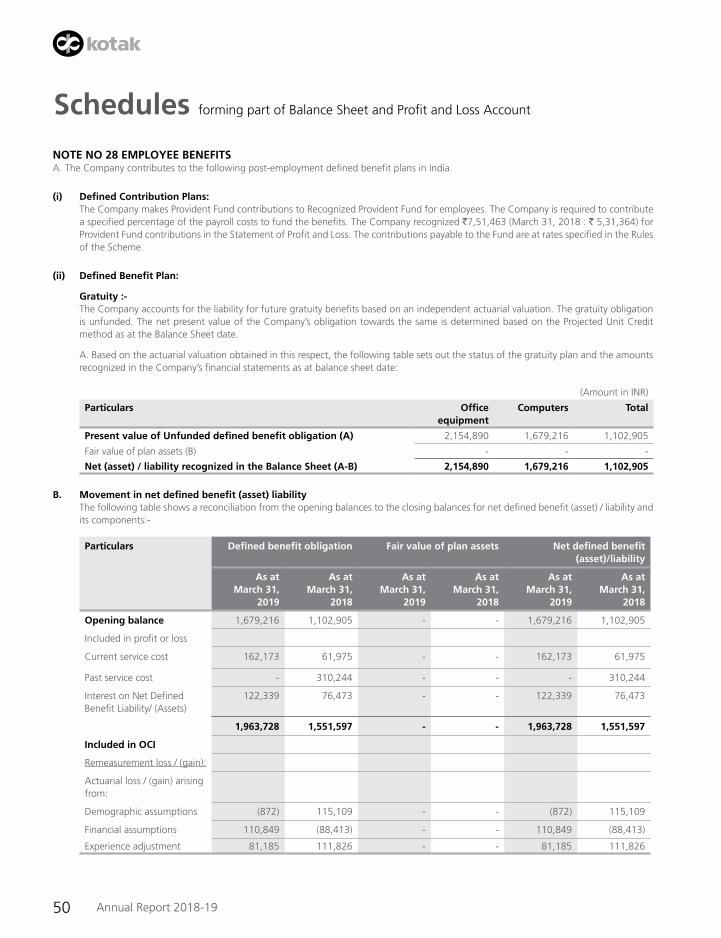
50 Annual Report 2018-19
Schedules forming part of Balance Sheet and Profit and Loss Account
NOTE NO 28 EMPLOYEE BENEFITSA. The Company contributes to the following post-employment defined benefit plans in India.
(i) Defined Contribution Plans: The Company makes Provident Fund contributions to Recognized Provident Fund for employees. The Company is required to contribute
a specified percentage of the payroll costs to fund the benefits. The Company recognized `7,51,463 (March 31, 2018 : ` 5,31,364) for Provident Fund contributions in the Statement of Profit and Loss. The contributions payable to the Fund are at rates specified in the Rules of the Scheme.
(ii) Defined Benefit Plan:
Gratuity :- The Company accounts for the liability for future gratuity benefits based on an independent actuarial valuation. The gratuity obligation
is unfunded. The net present value of the Company’s obligation towards the same is determined based on the Projected Unit Credit method as at the Balance Sheet date.
A. Based on the actuarial valuation obtained in this respect, the following table sets out the status of the gratuity plan and the amounts recognized in the Company’s financial statements as at balance sheet date:
(Amount in INR)
Particulars Office equipment
Computers Total
Present value of Unfunded defined benefit obligation (A) 2,154,890 1,679,216 1,102,905
Fair value of plan assets (B) - - -
Net (asset) / liability recognized in the Balance Sheet (A-B) 2,154,890 1,679,216 1,102,905
B. Movement in net defined benefit (asset) liability The following table shows a reconciliation from the opening balances to the closing balances for net defined benefit (asset) / liability and
its components:-
Particulars Defined benefit obligation Fair value of plan assets Net defined benefit (asset)/liability
As at March 31,
2019
As at March 31,
2018
As at March 31,
2019
As at March 31,
2018
As at March 31,
2019
As at March 31,
2018
Opening balance 1,679,216 1,102,905 - - 1,679,216 1,102,905
Included in profit or loss
Current service cost 162,173 61,975 - - 162,173 61,975
Past service cost - 310,244 - - - 310,244
Interest on Net Defined Benefit Liability/ (Assets)
122,339 76,473 - - 122,339 76,473
1,963,728 1,551,597 - - 1,963,728 1,551,597
Included in OCI
Remeasurement loss / (gain):
Actuarial loss / (gain) arising from:
Demographic assumptions (872) 115,109 - - (872) 115,109
Financial assumptions 110,849 (88,413) - - 110,849 (88,413)
Experience adjustment 81,185 111,826 - - 81,185 111,826
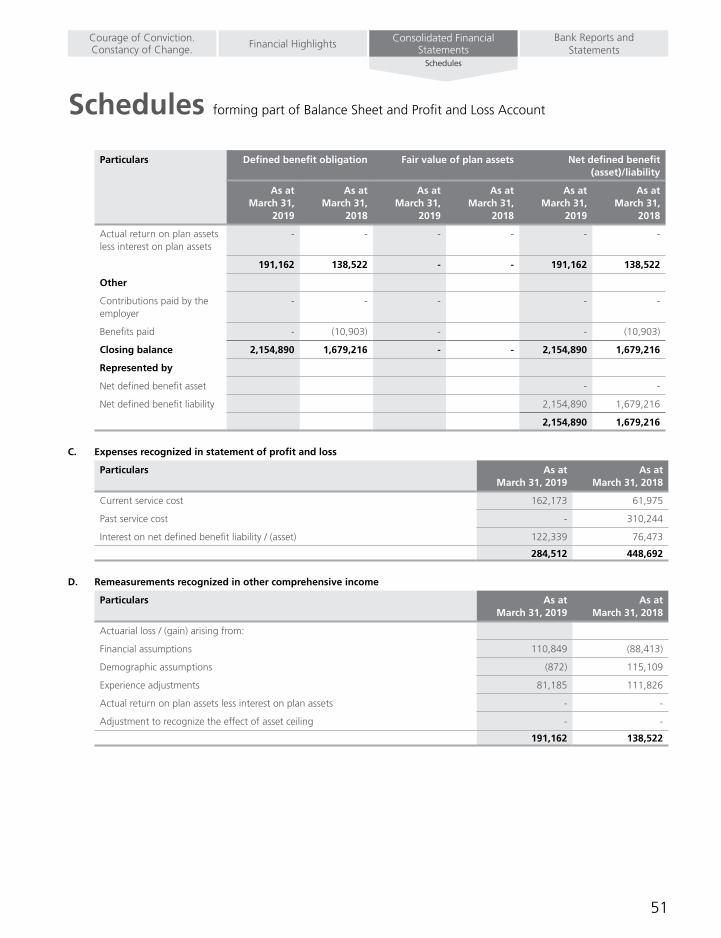
51
Schedules forming part of Balance Sheet and Profit and Loss Account
Bank Reports and Statements
Consolidated Financial StatementsFinancial HighlightsCourage of Conviction.
Constancy of Change.Schedules
Particulars Defined benefit obligation Fair value of plan assets Net defined benefit (asset)/liability
As at March 31,
2019
As at March 31,
2018
As at March 31,
2019
As at March 31,
2018
As at March 31,
2019
As at March 31,
2018
Actual return on plan assets less interest on plan assets
- - - - - -
191,162 138,522 - - 191,162 138,522
Other
Contributions paid by the employer
- - - - -
Benefits paid - (10,903) - - (10,903)
Closing balance 2,154,890 1,679,216 - - 2,154,890 1,679,216
Represented by
Net defined benefit asset - -
Net defined benefit liability 2,154,890 1,679,216
2,154,890 1,679,216
C. Expenses recognized in statement of profit and loss
Particulars As at March 31, 2019
As at March 31, 2018
Current service cost 162,173 61,975
Past service cost - 310,244
Interest on net defined benefit liability / (asset) 122,339 76,473
284,512 448,692
D. Remeasurements recognized in other comprehensive income
Particulars As at March 31, 2019
As at March 31, 2018
Actuarial loss / (gain) arising from:
Financial assumptions 110,849 (88,413)
Demographic assumptions (872) 115,109
Experience adjustments 81,185 111,826
Actual return on plan assets less interest on plan assets - -
Adjustment to recognize the effect of asset ceiling - -
191,162 138,522
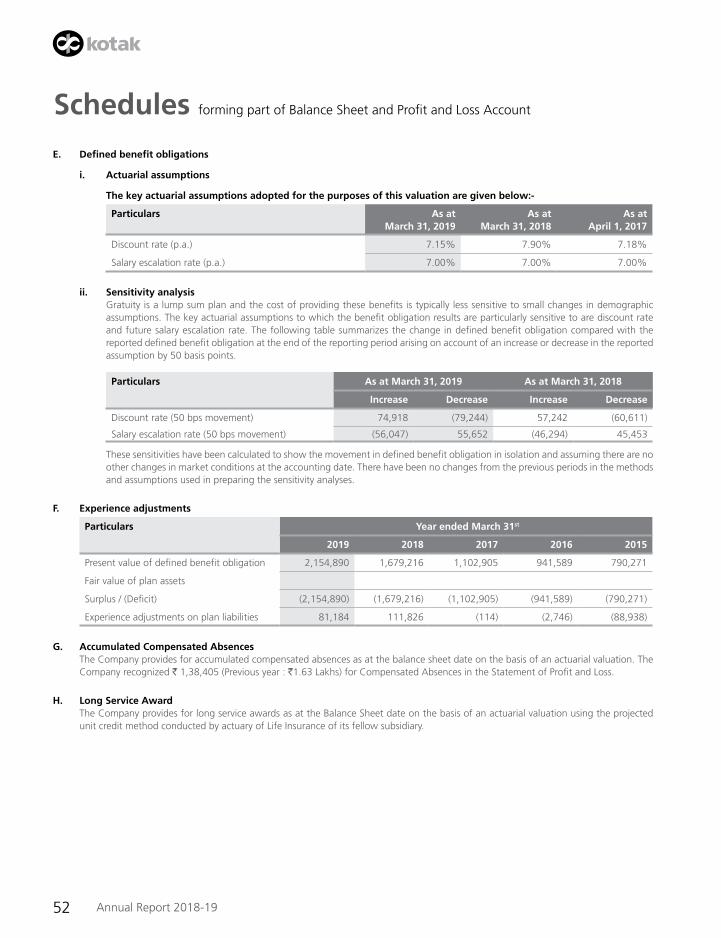
52 Annual Report 2018-19
Schedules forming part of Balance Sheet and Profit and Loss Account
E. Defined benefit obligations
i. Actuarial assumptions
The key actuarial assumptions adopted for the purposes of this valuation are given below:-
Particulars As at March 31, 2019
As at March 31, 2018
As at April 1, 2017
Discount rate (p.a.) 7.15% 7.90% 7.18%
Salary escalation rate (p.a.) 7.00% 7.00% 7.00%
ii. Sensitivity analysis Gratuity is a lump sum plan and the cost of providing these benefits is typically less sensitive to small changes in demographic
assumptions. The key actuarial assumptions to which the benefit obligation results are particularly sensitive to are discount rate and future salary escalation rate. The following table summarizes the change in defined benefit obligation compared with the reported defined benefit obligation at the end of the reporting period arising on account of an increase or decrease in the reported assumption by 50 basis points.
Particulars As at March 31, 2019 As at March 31, 2018
Increase Decrease Increase Decrease
Discount rate (50 bps movement) 74,918 (79,244) 57,242 (60,611)
Salary escalation rate (50 bps movement) (56,047) 55,652 (46,294) 45,453
These sensitivities have been calculated to show the movement in defined benefit obligation in isolation and assuming there are no other changes in market conditions at the accounting date. There have been no changes from the previous periods in the methods and assumptions used in preparing the sensitivity analyses.
F. Experience adjustments
Particulars Year ended March 31st
2019 2018 2017 2016 2015
Present value of defined benefit obligation 2,154,890 1,679,216 1,102,905 941,589 790,271
Fair value of plan assets
Surplus / (Deficit) (2,154,890) (1,679,216) (1,102,905) (941,589) (790,271)
Experience adjustments on plan liabilities 81,184 111,826 (114) (2,746) (88,938)
G. Accumulated Compensated Absences The Company provides for accumulated compensated absences as at the balance sheet date on the basis of an actuarial valuation. The
Company recognized ` 1,38,405 (Previous year : `1.63 Lakhs) for Compensated Absences in the Statement of Profit and Loss.
H. Long Service Award The Company provides for long service awards as at the Balance Sheet date on the basis of an actuarial valuation using the projected
unit credit method conducted by actuary of Life Insurance of its fellow subsidiary.
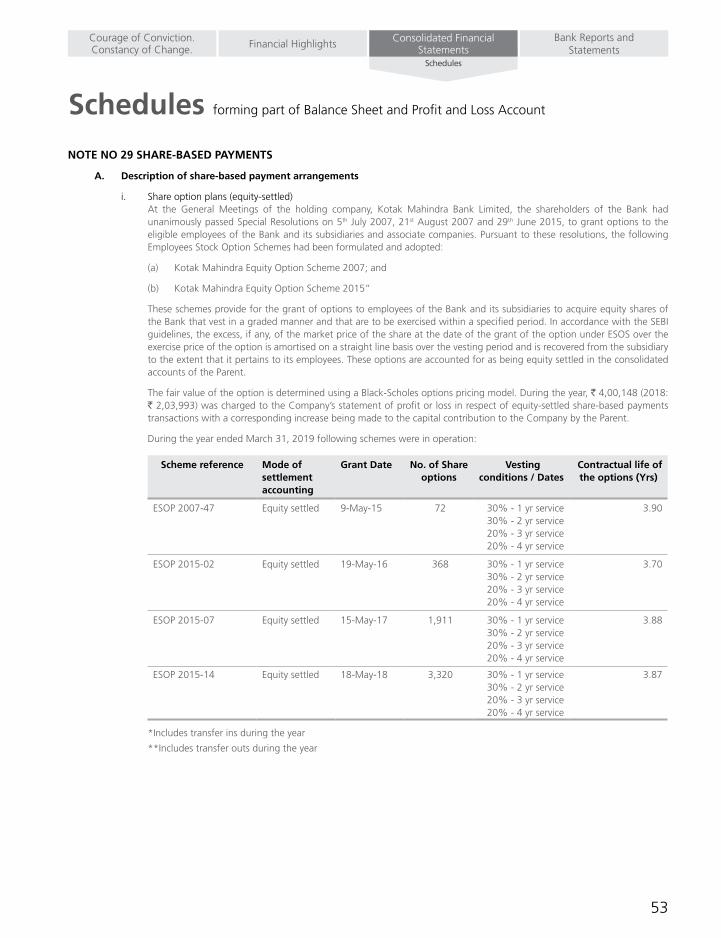
53
Schedules forming part of Balance Sheet and Profit and Loss Account
Bank Reports and Statements
Consolidated Financial StatementsFinancial HighlightsCourage of Conviction.
Constancy of Change.Schedules
NOTE NO 29 SHARE-BASED PAYMENTS
A. Description of share-based payment arrangements
i. Share option plans (equity-settled) At the General Meetings of the holding company, Kotak Mahindra Bank Limited, the shareholders of the Bank had
unanimously passed Special Resolutions on 5th July 2007, 21st August 2007 and 29th June 2015, to grant options to the eligible employees of the Bank and its subsidiaries and associate companies. Pursuant to these resolutions, the following Employees Stock Option Schemes had been formulated and adopted:
(a) Kotak Mahindra Equity Option Scheme 2007; and
(b) Kotak Mahindra Equity Option Scheme 2015”
These schemes provide for the grant of options to employees of the Bank and its subsidiaries to acquire equity shares of the Bank that vest in a graded manner and that are to be exercised within a specified period. In accordance with the SEBI guidelines, the excess, if any, of the market price of the share at the date of the grant of the option under ESOS over the exercise price of the option is amortised on a straight line basis over the vesting period and is recovered from the subsidiary to the extent that it pertains to its employees. These options are accounted for as being equity settled in the consolidated accounts of the Parent.
The fair value of the option is determined using a Black-Scholes options pricing model. During the year, ` 4,00,148 (2018: ` 2,03,993) was charged to the Company’s statement of profit or loss in respect of equity-settled share-based payments transactions with a corresponding increase being made to the capital contribution to the Company by the Parent.
During the year ended March 31, 2019 following schemes were in operation:
Scheme reference Mode of settlement accounting
Grant Date No. of Share options
Vesting conditions / Dates
Contractual life of the options (Yrs)
ESOP 2007-47 Equity settled 9-May-15 72 30% - 1 yr service 30% - 2 yr service 20% - 3 yr service 20% - 4 yr service
3.90
ESOP 2015-02 Equity settled 19-May-16 368 30% - 1 yr service 30% - 2 yr service 20% - 3 yr service 20% - 4 yr service
3.70
ESOP 2015-07 Equity settled 15-May-17 1,911 30% - 1 yr service 30% - 2 yr service 20% - 3 yr service 20% - 4 yr service
3.88
ESOP 2015-14 Equity settled 18-May-18 3,320 30% - 1 yr service 30% - 2 yr service 20% - 3 yr service 20% - 4 yr service
3.87
*Includes transfer ins during the year
**Includes transfer outs during the year
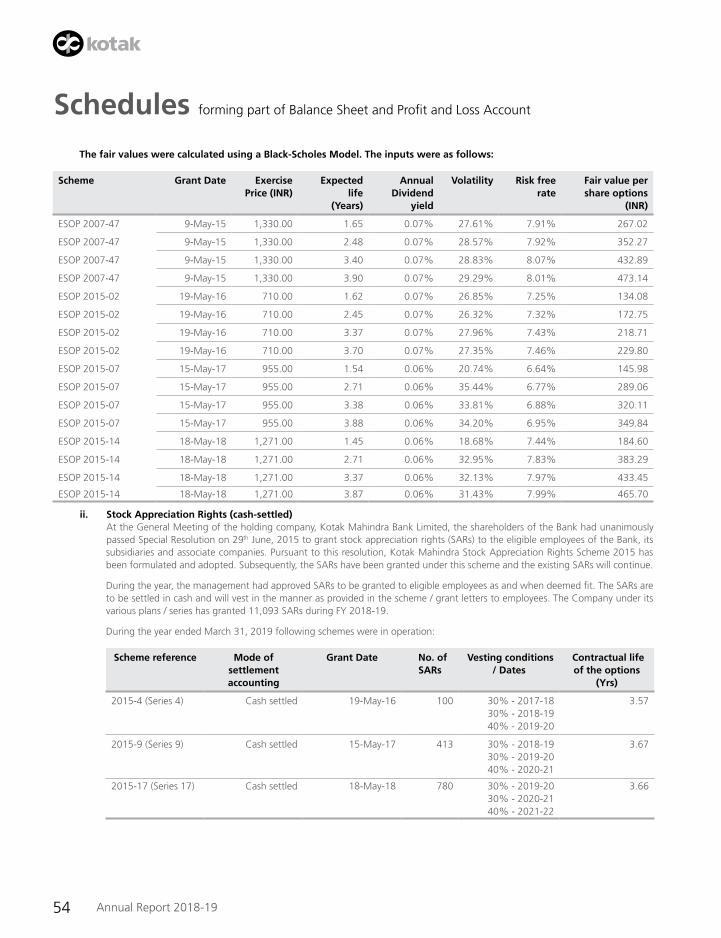
54 Annual Report 2018-19
Schedules forming part of Balance Sheet and Profit and Loss Account
The fair values were calculated using a Black-Scholes Model. The inputs were as follows:
Scheme Grant Date Exercise Price (INR)
Expected life
(Years)
Annual Dividend
yield
Volatility Risk free rate
Fair value per share options
(INR)
ESOP 2007-47 9-May-15 1,330.00 1.65 0.07% 27.61% 7.91% 267.02
ESOP 2007-47 9-May-15 1,330.00 2.48 0.07% 28.57% 7.92% 352.27
ESOP 2007-47 9-May-15 1,330.00 3.40 0.07% 28.83% 8.07% 432.89
ESOP 2007-47 9-May-15 1,330.00 3.90 0.07% 29.29% 8.01% 473.14
ESOP 2015-02 19-May-16 710.00 1.62 0.07% 26.85% 7.25% 134.08
ESOP 2015-02 19-May-16 710.00 2.45 0.07% 26.32% 7.32% 172.75
ESOP 2015-02 19-May-16 710.00 3.37 0.07% 27.96% 7.43% 218.71
ESOP 2015-02 19-May-16 710.00 3.70 0.07% 27.35% 7.46% 229.80
ESOP 2015-07 15-May-17 955.00 1.54 0.06% 20.74% 6.64% 145.98
ESOP 2015-07 15-May-17 955.00 2.71 0.06% 35.44% 6.77% 289.06
ESOP 2015-07 15-May-17 955.00 3.38 0.06% 33.81% 6.88% 320.11
ESOP 2015-07 15-May-17 955.00 3.88 0.06% 34.20% 6.95% 349.84
ESOP 2015-14 18-May-18 1,271.00 1.45 0.06% 18.68% 7.44% 184.60
ESOP 2015-14 18-May-18 1,271.00 2.71 0.06% 32.95% 7.83% 383.29
ESOP 2015-14 18-May-18 1,271.00 3.37 0.06% 32.13% 7.97% 433.45
ESOP 2015-14 18-May-18 1,271.00 3.87 0.06% 31.43% 7.99% 465.70
ii. Stock Appreciation Rights (cash-settled) At the General Meeting of the holding company, Kotak Mahindra Bank Limited, the shareholders of the Bank had unanimously
passed Special Resolution on 29th June, 2015 to grant stock appreciation rights (SARs) to the eligible employees of the Bank, its subsidiaries and associate companies. Pursuant to this resolution, Kotak Mahindra Stock Appreciation Rights Scheme 2015 has been formulated and adopted. Subsequently, the SARs have been granted under this scheme and the existing SARs will continue.
During the year, the management had approved SARs to be granted to eligible employees as and when deemed fit. The SARs are to be settled in cash and will vest in the manner as provided in the scheme / grant letters to employees. The Company under its various plans / series has granted 11,093 SARs during FY 2018-19.
During the year ended March 31, 2019 following schemes were in operation:
Scheme reference Mode of settlement accounting
Grant Date No. of SARs
Vesting conditions / Dates
Contractual life of the options
(Yrs)
2015-4 (Series 4) Cash settled 19-May-16 100 30% - 2017-18 30% - 2018-19 40% - 2019-20
3.57
2015-9 (Series 9) Cash settled 15-May-17 413 30% - 2018-19 30% - 2019-20 40% - 2020-21
3.67
2015-17 (Series 17) Cash settled 18-May-18 780 30% - 2019-20 30% - 2020-21 40% - 2021-22
3.66
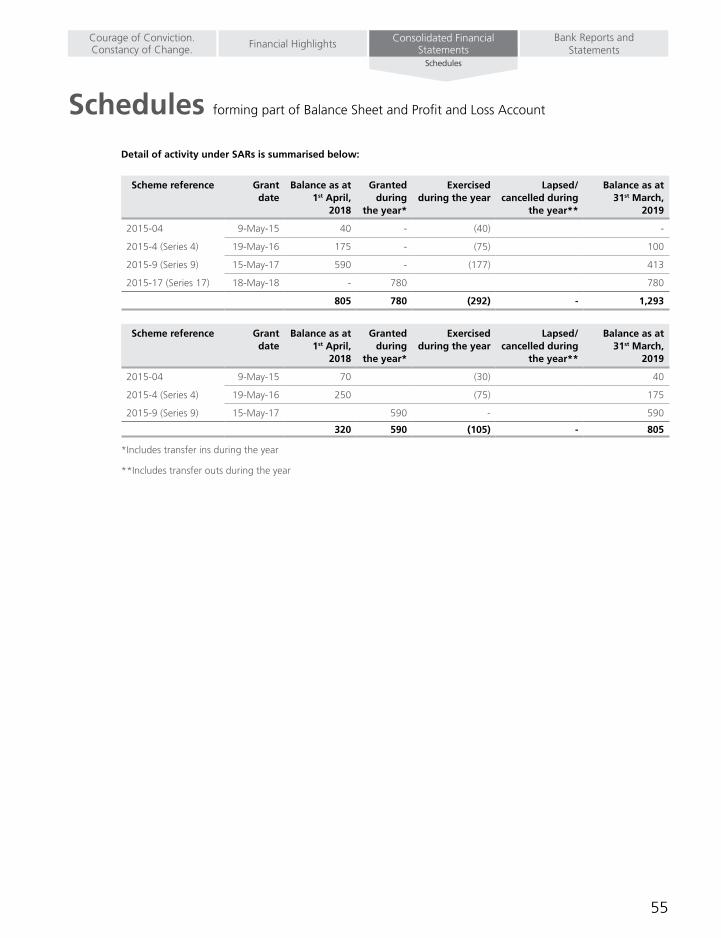
55
Schedules forming part of Balance Sheet and Profit and Loss Account
Bank Reports and Statements
Consolidated Financial StatementsFinancial HighlightsCourage of Conviction.
Constancy of Change.Schedules
Detail of activity under SARs is summarised below:
Scheme reference Grant date
Balance as at 1st April,
2018
Granted during
the year*
Exercised during the year
Lapsed/cancelled during
the year**
Balance as at 31st March,
2019
2015-04 9-May-15 40 - (40) -
2015-4 (Series 4) 19-May-16 175 - (75) 100
2015-9 (Series 9) 15-May-17 590 - (177) 413
2015-17 (Series 17) 18-May-18 - 780 780
805 780 (292) - 1,293
Scheme reference Grant date
Balance as at 1st April,
2018
Granted during
the year*
Exercised during the year
Lapsed/cancelled during
the year**
Balance as at 31st March,
2019
2015-04 9-May-15 70 (30) 40
2015-4 (Series 4) 19-May-16 250 (75) 175
2015-9 (Series 9) 15-May-17 590 - 590
320 590 (105) - 805
*Includes transfer ins during the year
**Includes transfer outs during the year

56 Annual Report 2018-19
Schedules forming part of Balance Sheet and Profit and Loss Account
The
fair
val
ues
wer
e ca
lcu
late
d u
sin
g a
Bla
ck-S
cho
les
Mo
del
. Th
e in
pu
ts w
ere
as f
ollo
ws:
Sch
eme
Gra
nt
Dat
eV
esti
ng
p
erio
dEx
pec
ted
life
(Y
ears
)Ex
erci
se
Pric
e (I
NR
)M
arke
t p
rice
(IN
R)
Ris
k fr
ee
rate
Div
iden
d
yiel
dV
ola
tilit
yFa
ir v
alu
e p
er o
pti
on
Seri
es 2
015-
4 (S
erie
s 4)
Tran
che
IV19
-May
-16
0.3
3 0
.33
-
1,0
47.8
0 6.
21%
0.06
%17
.88%
1,0
47.6
0
Tran
che
V19
-May
-16
0.3
5 0
.35
-
1,0
47.8
0 6.
22%
0.06
%17
.76%
1,0
47.5
9
Tran
che
VI
19-M
ay-1
6 0
.37
0.3
7 -
1
,047
.80
6.24
%0.
06%
17.4
4% 1
,047
.58
Tran
che
VII
19-M
ay-1
6 0
.25
0.2
5 -
1
,334
.50
6.25
%0.
05%
20.1
2% 1
,334
.32
Tran
che
VIII
19-M
ay-1
6 0
.27
0.2
7 -
1
,334
.50
6.26
%0.
05%
19.7
4% 1
,334
.31
Tran
che
IX19
-May
-16
0.2
9 0
.29
-
1,3
34.5
0 6.
27%
0.05
%20
.04%
1,3
34.3
0
Tran
che
X19
-May
-16
0.6
7 0
.67
-
1,3
34.5
0 6.
42%
0.05
%27
.53%
1,3
34.0
3
Tran
che
XI
19-M
ay-1
6 0
.69
0.6
9 -
1
,334
.50
6.43
%0.
05%
27.2
2% 1
,334
.02
Tran
che
XII
19-M
ay-1
6 0
.71
0.7
1 -
1
,334
.50
6.44
%0.
05%
27.2
3% 1
,334
.00
Seri
es 2
015-
9 (S
erie
s 9)
Tran
che
I15
-May
-17
0.4
2 0
.42
-
1,0
47.8
0 6.
27%
0.06
%16
.74%
1,0
47.5
5
Tran
che
II15
-May
-17
0.4
4 0
.44
-
1,0
47.8
0 6.
29%
0.06
%18
.62%
1,0
47.5
4
Tran
che
III15
-May
-17
0.4
6 0
.46
-
1,0
47.8
0 6.
30%
0.06
%18
.79%
1,0
47.5
2
Tran
che
IV15
-May
-17
0.5
9 0
.59
-
1,3
34.5
0 6.
39%
0.05
%28
.06%
1,3
34.0
9
Tran
che
V15
-May
-17
0.6
1 0
.61
-
1,3
34.5
0 6.
40%
0.05
%27
.79%
1,3
34.0
8
Tran
che
VI
15-M
ay-1
7 0
.62
0.6
2 -
1
,334
.50
6.41
%0.
05%
27.9
1% 1
,334
.06
Tran
che
VII
15-M
ay-1
7 1
.25
1.2
5 -
1
,334
.50
6.58
%0.
05%
24.1
6% 1
,333
.62
Tran
che
VIII
15-M
ay-1
7 1
.27
1.2
7 -
1
,334
.50
6.59
%0.
05%
24.0
3% 1
,333
.61
Tran
che
IX15
-May
-17
1.2
9 1
.29
-
1,3
34.5
0 6.
59%
0.05
%23
.89%
1,3
33.6
0
Tran
che
X15
-May
-17
1.7
6 1
.76
-
1,3
34.5
0 6.
64%
0.05
%22
.45%
1,3
33.2
7
Tran
che
XI
15-M
ay-1
7 1
.78
1.7
8 -
1
,334
.50
6.65
%0.
05%
22.3
6% 1
,333
.26
Tran
che
XII
15-M
ay-1
7 1
.79
1.7
9 -
1
,334
.50
6.65
%0.
05%
22.3
1% 1
,333
.24
Seri
es 2
015-
17 (
Seri
es 1
7)
Tran
che
I18
-May
-18
0.3
3 0
.33
-
1,3
34.5
0 6.
29%
0.05
%27
.91%
1,3
34.2
7
Tran
che
II18
-May
-18
0.3
5 0
.35
-
1,3
34.5
0 6.
30%
0.05
%27
.33%
1,3
34.2
5
Tran
che
III18
-May
-18
0.3
7 0
.37
-
1,3
34.5
0 6.
31%
0.05
%27
.53%
1,3
34.2
4
Tran
che
IV18
-May
-18
1.5
9 1
.59
-
1,3
34.5
0 6.
63%
0.05
%23
.04%
1,3
33.3
9
Tran
che
V18
-May
-18
1.6
1 1
.61
-
1,3
34.5
0 6.
63%
0.05
%22
.98%
1,3
33.3
7
Tran
che
VI
18-M
ay-1
8 1
.63
1.6
3 -
1
,334
.50
6.63
%0.
05%
22.9
4% 1
,333
.36
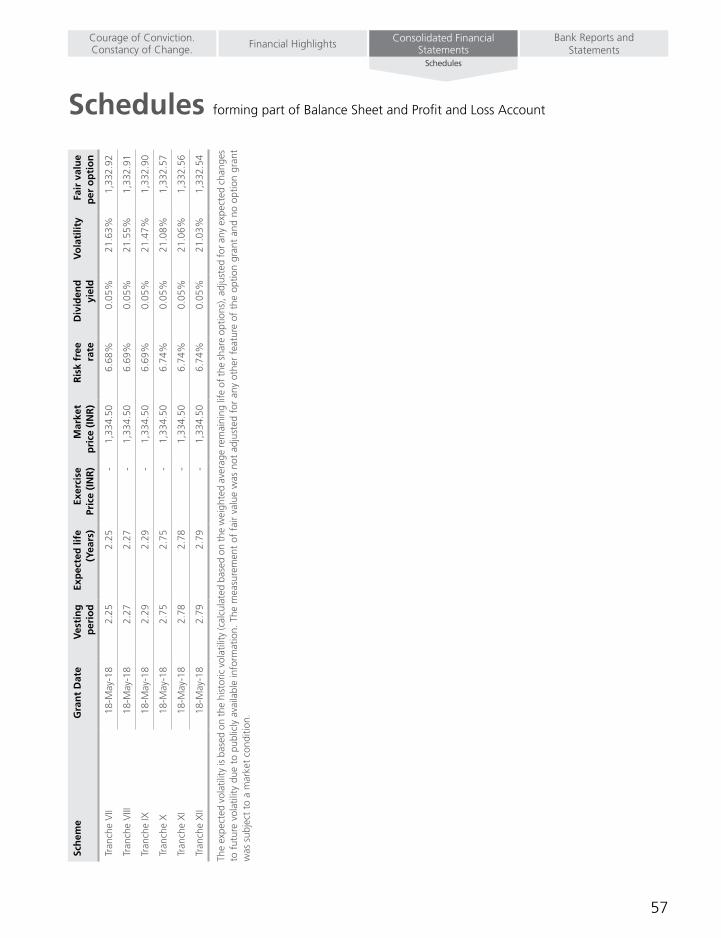
57
Schedules forming part of Balance Sheet and Profit and Loss Account
Bank Reports and Statements
Consolidated Financial StatementsFinancial HighlightsCourage of Conviction.
Constancy of Change.Schedules
Sch
eme
Gra
nt
Dat
eV
esti
ng
p
erio
dEx
pec
ted
life
(Y
ears
)Ex
erci
se
Pric
e (I
NR
)M
arke
t p
rice
(IN
R)
Ris
k fr
ee
rate
Div
iden
d
yiel
dV
ola
tilit
yFa
ir v
alu
e p
er o
pti
on
Tran
che
VII
18-M
ay-1
8 2
.25
2.2
5 -
1
,334
.50
6.68
%0.
05%
21.6
3% 1
,332
.92
Tran
che
VIII
18-M
ay-1
8 2
.27
2.2
7 -
1
,334
.50
6.69
%0.
05%
21.5
5% 1
,332
.91
Tran
che
IX18
-May
-18
2.2
9 2
.29
-
1,3
34.5
0 6.
69%
0.05
%21
.47%
1,3
32.9
0
Tran
che
X18
-May
-18
2.7
5 2
.75
-
1,3
34.5
0 6.
74%
0.05
%21
.08%
1,3
32.5
7
Tran
che
XI
18-M
ay-1
8 2
.78
2.7
8 -
1
,334
.50
6.74
%0.
05%
21.0
6% 1
,332
.56
Tran
che
XII
18-M
ay-1
8 2
.79
2.7
9 -
1
,334
.50
6.74
%0.
05%
21.0
3% 1
,332
.54
The
expe
cted
vol
atili
ty is
bas
ed o
n th
e hi
stor
ic v
olat
ility
(cal
cula
ted
base
d on
the
wei
ghte
d av
erag
e re
mai
ning
life
of t
he s
hare
opt
ions
), ad
just
ed fo
r any
exp
ecte
d ch
ange
s to
fut
ure
vola
tility
due
to
publ
icly
ava
ilabl
e in
form
atio
n. T
he m
easu
rem
ent
of f
air
valu
e w
as n
ot a
djus
ted
for
any
othe
r fe
atur
e of
the
opt
ion
gran
t an
d no
opt
ion
gran
t w
as s
ubje
ct t
o a
mar
ket
cond
ition
.
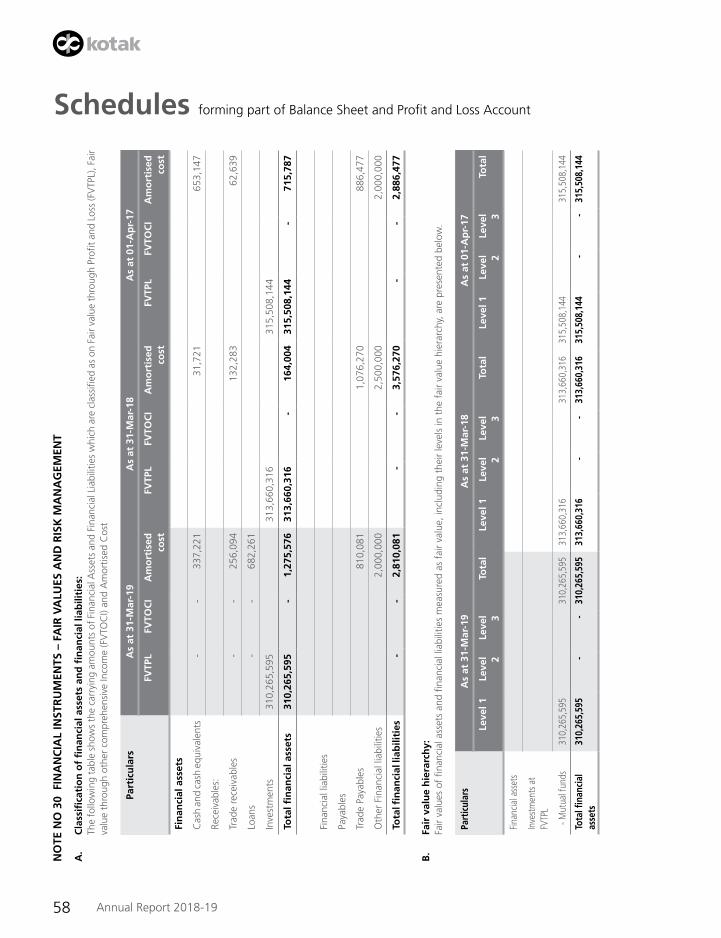
58 Annual Report 2018-19
Schedules forming part of Balance Sheet and Profit and Loss Account
NO
TE N
O 3
0 F
INA
NC
IAL
INST
RU
MEN
TS –
FA
IR V
ALU
ES A
ND
RIS
K M
AN
AG
EMEN
T
A.
Cla
ssifi
cati
on
of
fin
anci
al a
sset
s an
d fi
nan
cial
liab
iliti
es:
Th
e fo
llow
ing
tabl
e sh
ows
the
carr
ying
am
ount
s of
Fin
anci
al A
sset
s an
d Fi
nanc
ial L
iabi
litie
s w
hich
are
cla
ssifi
ed a
s on
Fai
r va
lue
thro
ugh
Profi
t an
d Lo
ss (F
VTP
L), F
air
valu
e th
roug
h ot
her
com
preh
ensi
ve In
com
e (F
VTO
CI)
and
Am
ortis
ed C
ost
Part
icu
lars
As
at 3
1-M
ar-1
9A
s at
31-
Mar
-18
As
at 0
1-A
pr-
17
FV
TPL
FV
TOC
I A
mo
rtis
ed
cost
F
VTP
L F
VTO
CI
Am
ort
ised
co
st
FV
TPL
FV
TOC
I A
mo
rtis
ed
cost
Fin
anci
al a
sset
s
Cas
h an
d ca
sh e
quiv
alen
ts -
-
3
37,2
21
31,
721
653
,147
Rece
ivab
les:
Trad
e re
ceiv
able
s -
-
2
56,0
94
132
,283
6
2,63
9
Loan
s -
-
6
82,2
61
Inve
stm
ents
310,
265,
595
313,
660,
316
315,
508,
144
Tota
l fin
anci
al a
sset
s31
0,26
5,59
5 -
1
,275
,576
31
3,66
0,31
6 -
1
64,0
04
315,
508,
144
-
715
,787
Fina
ncia
l lia
bilit
ies
Paya
bles
Trad
e Pa
yabl
es 8
10,0
81
1,0
76,2
70
886
,477
Oth
er F
inan
cial
liab
ilitie
s 2
,000
,000
2
,500
,000
2
,000
,000
Tota
l fin
anci
al li
abili
ties
-
-
2,8
10,0
81
-
-
3,5
76,2
70
-
-
2,8
86,4
77
B.
Fair
val
ue
hie
rarc
hy:
Fa
ir va
lues
of
finan
cial
ass
ets
and
finan
cial
liab
ilitie
s m
easu
red
as f
air
valu
e, in
clud
ing
thei
r le
vels
in t
he f
air
valu
e hi
erar
chy,
are
pre
sent
ed b
elow
.
Part
icul
ars
As
at 3
1-M
ar-1
9A
s at
31-
Mar
-18
As
at 0
1-A
pr-
17
Lev
el 1
L
evel
2 L
evel
3 T
ota
l L
evel
1
Lev
el 2
Lev
el 3
To
tal
Lev
el 1
L
evel
2 L
evel
3 T
ota
l
Finan
cial a
sset
s
Inve
stm
ents
at
FVTP
L
- M
utua
l fun
ds31
0,26
5,59
5 31
0,26
5,59
5 31
3,66
0,31
6 3
13,6
60,3
16
315
,508
,144
31
5,50
8,14
4
Tota
l fina
ncia
l as
sets
310,
265,
595
- -
310,
265,
595
313,
660,
316
- -
313
,660
,316
3
15,5
08,1
44
- -
315,
508,
144
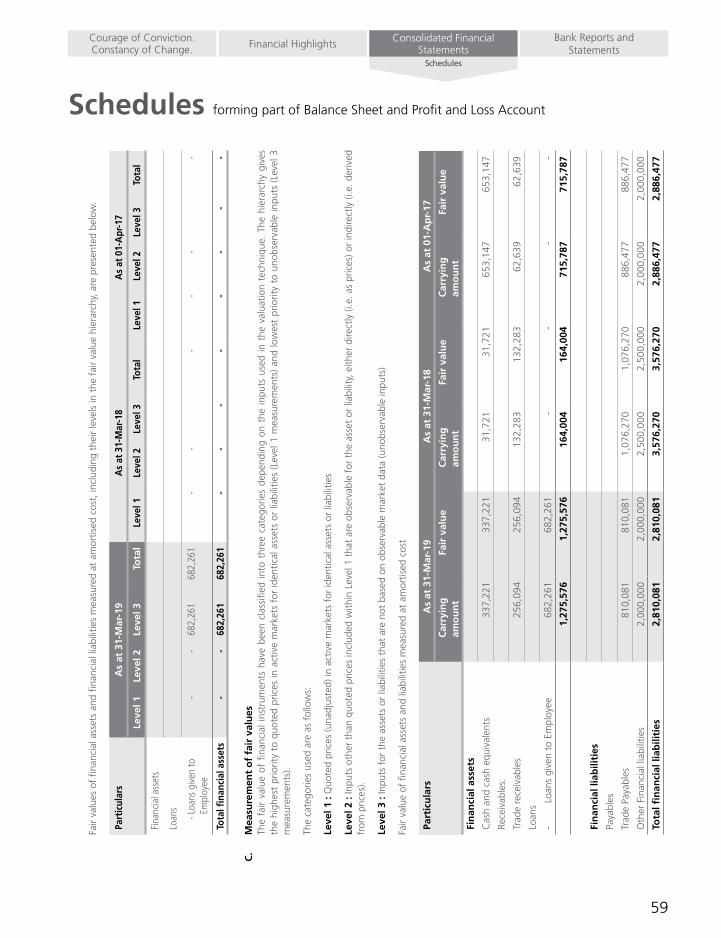
59
Schedules forming part of Balance Sheet and Profit and Loss Account
Bank Reports and Statements
Consolidated Financial StatementsFinancial HighlightsCourage of Conviction.
Constancy of Change.Schedules
Fa
ir va
lues
of
finan
cial
ass
ets
and
finan
cial
liab
ilitie
s m
easu
red
at a
mor
tised
cos
t, in
clud
ing
thei
r le
vels
in t
he f
air
valu
e hi
erar
chy,
are
pre
sent
ed b
elow
.
Part
icul
ars
As
at 3
1-M
ar-1
9A
s at
31-
Mar
-18
As
at 0
1-A
pr-1
7
Lev
el 1
L
evel
2
Lev
el 3
T
ota
l L
evel
1
Lev
el 2
L
evel
3
Tot
al
Lev
el 1
L
evel
2
Lev
el 3
T
otal
Fina
ncia
l ass
ets
Loan
s
-
Loan
s gi
ven
to
Empl
oyee
- -
682,
261
682
,261
-
- -
- -
-
Tota
l fina
ncia
l ass
ets
- -
682,
261
682
,261
-
- -
- -
- -
-
C.
Mea
sure
men
t o
f fa
ir v
alu
es
The
fair
valu
e of
fina
ncia
l ins
trum
ents
hav
e be
en c
lass
ified
into
thr
ee c
ateg
orie
s de
pend
ing
on t
he in
puts
use
d in
the
val
uatio
n te
chni
que.
The
hie
rarc
hy g
ives
th
e hi
ghes
t pr
iorit
y to
quo
ted
pric
es in
act
ive
mar
kets
for
iden
tical
ass
ets
or li
abili
ties
(Lev
el 1
mea
sure
men
ts)
and
low
est
prio
rity
to u
nobs
erva
ble
inpu
ts (
Leve
l 3
mea
sure
men
ts).
Th
e ca
tego
ries
used
are
as
follo
ws:
Le
vel 1
: Q
uote
d pr
ices
(una
djus
ted)
in a
ctiv
e m
arke
ts f
or id
entic
al a
sset
s or
liab
ilitie
s
Le
vel 2
: In
puts
oth
er t
han
quot
ed p
rices
incl
uded
with
in L
evel
1 t
hat
are
obse
rvab
le f
or t
he a
sset
or
liabi
lity,
eith
er d
irect
ly (i
.e. a
s pr
ices
) or
indi
rect
ly (i
.e. d
eriv
ed
from
pric
es).
Le
vel 3
: In
puts
for
the
ass
ets
or li
abili
ties
that
are
not
bas
ed o
n ob
serv
able
mar
ket
data
(uno
bser
vabl
e in
puts
)
Fa
ir va
lue
of fi
nanc
ial a
sset
s an
d lia
bilit
ies
mea
sure
d at
am
ortis
ed c
ost
Part
icu
lars
As
at 3
1-M
ar-1
9A
s at
31-
Mar
-18
As
at 0
1-A
pr-
17
Car
ryin
g
amo
un
t F
air
valu
e C
arry
ing
am
ou
nt
Fai
r va
lue
Car
ryin
g
amo
un
t F
air
valu
e
Fin
anci
al a
sset
s
Cas
h an
d ca
sh e
quiv
alen
ts 3
37,2
21
337
,221
3
1,72
1 3
1,72
1 6
53,1
47
653
,147
Rece
ivab
les:
Trad
e re
ceiv
able
s 2
56,0
94
256
,094
1
32,2
83
132
,283
6
2,63
9 6
2,63
9
Loan
s
- Lo
ans
give
n to
Em
ploy
ee 6
82,2
61
682
,261
-
-
-
-
1,2
75,5
76
1,2
75,5
76
164
,004
1
64,0
04
715
,787
7
15,7
87
Fin
anci
al li
abili
ties
Paya
bles
Trad
e Pa
yabl
es 8
10,0
81
810
,081
1
,076
,270
1
,076
,270
8
86,4
77
886
,477
Oth
er F
inan
cial
liab
ilitie
s 2
,000
,000
2
,000
,000
2
,500
,000
2
,500
,000
2
,000
,000
2
,000
,000
Tota
l fin
anci
al li
abili
ties
2,8
10,0
81
2,8
10,0
81
3,5
76,2
70
3,5
76,2
70
2,8
86,4
77
2,8
86,4
77
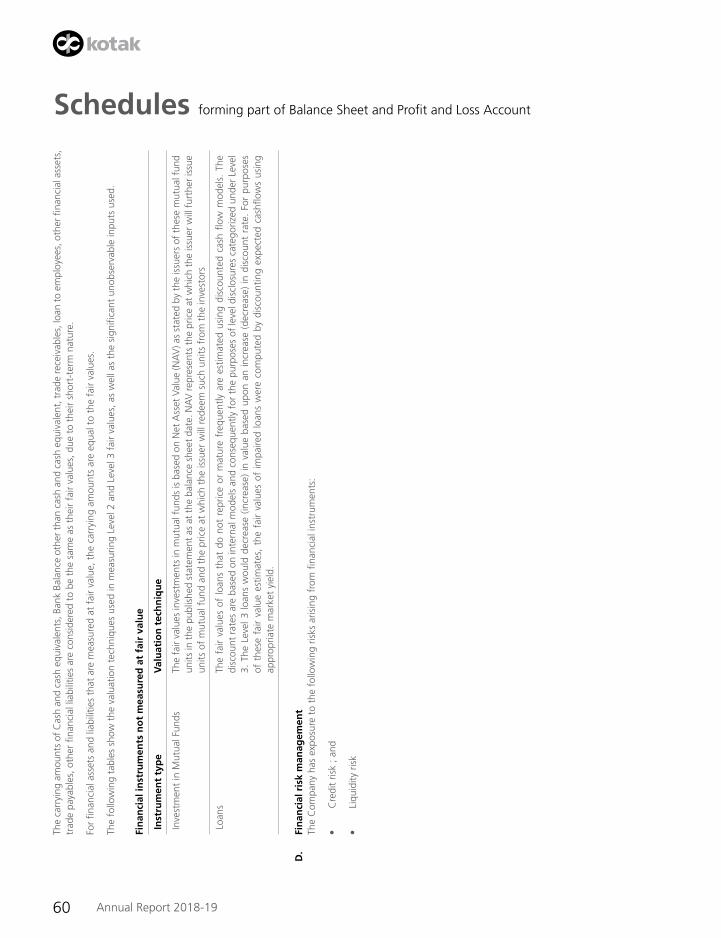
60 Annual Report 2018-19
Schedules forming part of Balance Sheet and Profit and Loss Account
Th
e ca
rryi
ng a
mou
nts
of C
ash
and
cash
equ
ival
ents
, Ban
k Ba
lanc
e ot
her t
han
cash
and
cas
h eq
uiva
lent
, tra
de re
ceiv
able
s, lo
an to
em
ploy
ees,
oth
er fi
nanc
ial a
sset
s,
trad
e pa
yabl
es, o
ther
fina
ncia
l lia
bilit
ies
are
cons
ider
ed t
o be
the
sam
e as
the
ir fa
ir va
lues
, due
to
thei
r sh
ort-
term
nat
ure.
Fo
r fin
anci
al a
sset
s an
d lia
bilit
ies
that
are
mea
sure
d at
fai
r va
lue,
the
car
ryin
g am
ount
s ar
e eq
ual t
o th
e fa
ir va
lues
.
Th
e fo
llow
ing
tabl
es s
how
the
val
uatio
n te
chni
ques
use
d in
mea
surin
g Le
vel 2
and
Lev
el 3
fai
r va
lues
, as
wel
l as
the
sign
ifica
nt u
nobs
erva
ble
inpu
ts u
sed.
Fi
nan
cial
inst
rum
ents
no
t m
easu
red
at
fair
val
ue
Inst
rum
ent
typ
eV
alu
atio
n t
ech
niq
ue
Inve
stm
ent
in M
utua
l Fun
dsTh
e fa
ir va
lues
inve
stm
ents
in m
utua
l fun
ds is
bas
ed o
n N
et A
sset
Val
ue (N
AV
) as
stat
ed b
y th
e is
suer
s of
the
se m
utua
l fun
d un
its in
the
publ
ishe
d st
atem
ent a
s at
the
bala
nce
shee
t dat
e. N
AV
repr
esen
ts th
e pr
ice
at w
hich
the
issu
er w
ill fu
rthe
r iss
ue
units
of
mut
ual f
und
and
the
pric
e at
whi
ch t
he is
suer
will
red
eem
suc
h un
its f
rom
the
inve
stor
s
Loan
sTh
e fa
ir va
lues
of
loan
s th
at d
o no
t re
pric
e or
mat
ure
freq
uent
ly a
re e
stim
ated
usi
ng d
isco
unte
d ca
sh fl
ow m
odel
s. T
he
disc
ount
rat
es a
re b
ased
on
inte
rnal
mod
els
and
cons
eque
ntly
for
the
pur
pose
s of
leve
l dis
clos
ures
cat
egor
ized
und
er L
evel
3.
The
Lev
el 3
loan
s w
ould
dec
reas
e (in
crea
se)
in v
alue
bas
ed u
pon
an in
crea
se (
decr
ease
) in
dis
coun
t ra
te.
For
purp
oses
of
the
se f
air
valu
e es
timat
es,
the
fair
valu
es o
f im
paire
d lo
ans
wer
e co
mpu
ted
by d
isco
untin
g ex
pect
ed c
ashfl
ows
usin
g ap
prop
riate
mar
ket
yiel
d.
D.
Fin
anci
al r
isk
man
agem
ent
Th
e C
ompa
ny h
as e
xpos
ure
to t
he f
ollo
win
g ris
ks a
risin
g fr
om fi
nanc
ial i
nstr
umen
ts:
•
Cre
dit
risk
; and
•
Liqu
idity
ris
k
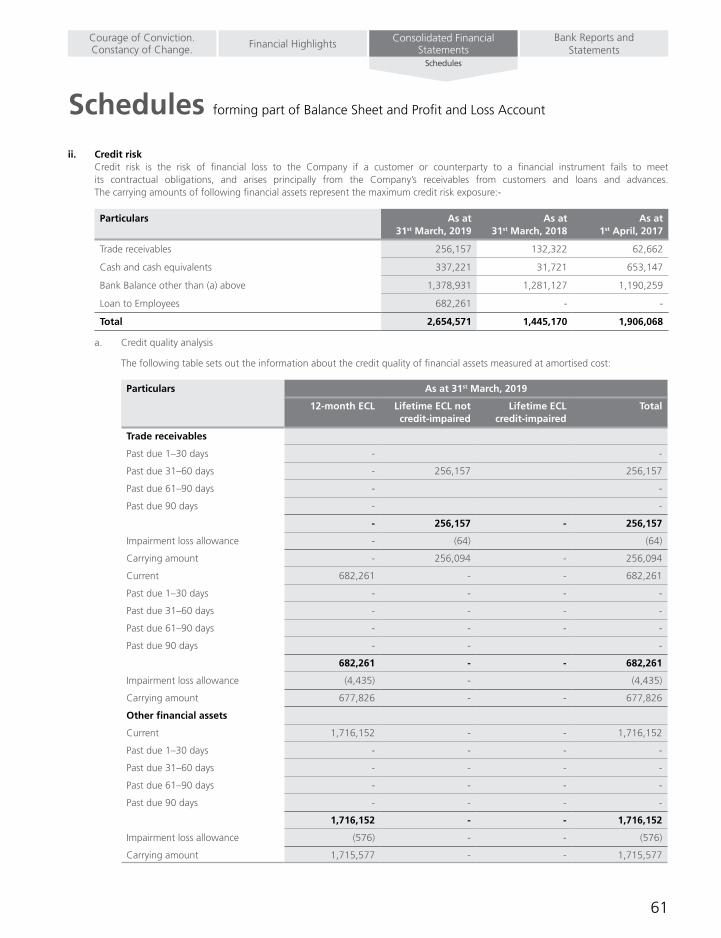
61
Schedules forming part of Balance Sheet and Profit and Loss Account
Bank Reports and Statements
Consolidated Financial StatementsFinancial HighlightsCourage of Conviction.
Constancy of Change.Schedules
ii. Credit risk Credit risk is the risk of financial loss to the Company if a customer or counterparty to a financial instrument fails to meet
its contractual obligations, and arises principally from the Company’s receivables from customers and loans and advances. The carrying amounts of following financial assets represent the maximum credit risk exposure:-
Particulars As at 31st March, 2019
As at 31st March, 2018
As at 1st April, 2017
Trade receivables 256,157 132,322 62,662
Cash and cash equivalents 337,221 31,721 653,147
Bank Balance other than (a) above 1,378,931 1,281,127 1,190,259
Loan to Employees 682,261 - -
Total 2,654,571 1,445,170 1,906,068
a. Credit quality analysis
The following table sets out the information about the credit quality of financial assets measured at amortised cost:
Particulars As at 31st March, 2019
12-month ECL Lifetime ECL not credit-impaired
Lifetime ECL credit-impaired
Total
Trade receivables
Past due 1–30 days - -
Past due 31–60 days - 256,157 256,157
Past due 61–90 days - -
Past due 90 days - -
- 256,157 - 256,157
Impairment loss allowance - (64) (64)
Carrying amount - 256,094 - 256,094
Current 682,261 - - 682,261
Past due 1–30 days - - - -
Past due 31–60 days - - - -
Past due 61–90 days - - - -
Past due 90 days - - -
682,261 - - 682,261
Impairment loss allowance (4,435) - (4,435)
Carrying amount 677,826 - - 677,826
Other financial assets
Current 1,716,152 - - 1,716,152
Past due 1–30 days - - - -
Past due 31–60 days - - - -
Past due 61–90 days - - - -
Past due 90 days - - - -
1,716,152 - - 1,716,152
Impairment loss allowance (576) - - (576)
Carrying amount 1,715,577 - - 1,715,577
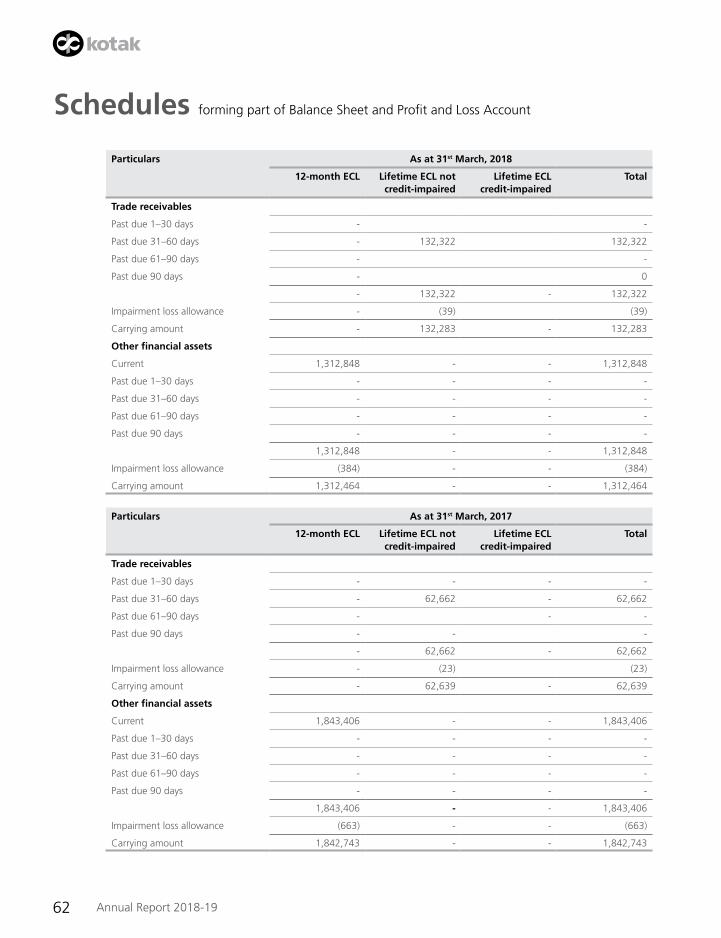
62 Annual Report 2018-19
Schedules forming part of Balance Sheet and Profit and Loss Account
Particulars As at 31st March, 2018
12-month ECL Lifetime ECL not credit-impaired
Lifetime ECL credit-impaired
Total
Trade receivables
Past due 1–30 days - -
Past due 31–60 days - 132,322 132,322
Past due 61–90 days - -
Past due 90 days - 0
- 132,322 - 132,322
Impairment loss allowance - (39) (39)
Carrying amount - 132,283 - 132,283
Other financial assets
Current 1,312,848 - - 1,312,848
Past due 1–30 days - - - -
Past due 31–60 days - - - -
Past due 61–90 days - - - -
Past due 90 days - - - -
1,312,848 - - 1,312,848
Impairment loss allowance (384) - - (384)
Carrying amount 1,312,464 - - 1,312,464
Particulars As at 31st March, 2017
12-month ECL Lifetime ECL not credit-impaired
Lifetime ECL credit-impaired
Total
Trade receivables
Past due 1–30 days - - - -
Past due 31–60 days - 62,662 - 62,662
Past due 61–90 days - - -
Past due 90 days - - -
- 62,662 - 62,662
Impairment loss allowance - (23) (23)
Carrying amount - 62,639 - 62,639
Other financial assets
Current 1,843,406 - - 1,843,406
Past due 1–30 days - - - -
Past due 31–60 days - - - -
Past due 61–90 days - - - -
Past due 90 days - - - -
1,843,406 - - 1,843,406
Impairment loss allowance (663) - - (663)
Carrying amount 1,842,743 - - 1,842,743
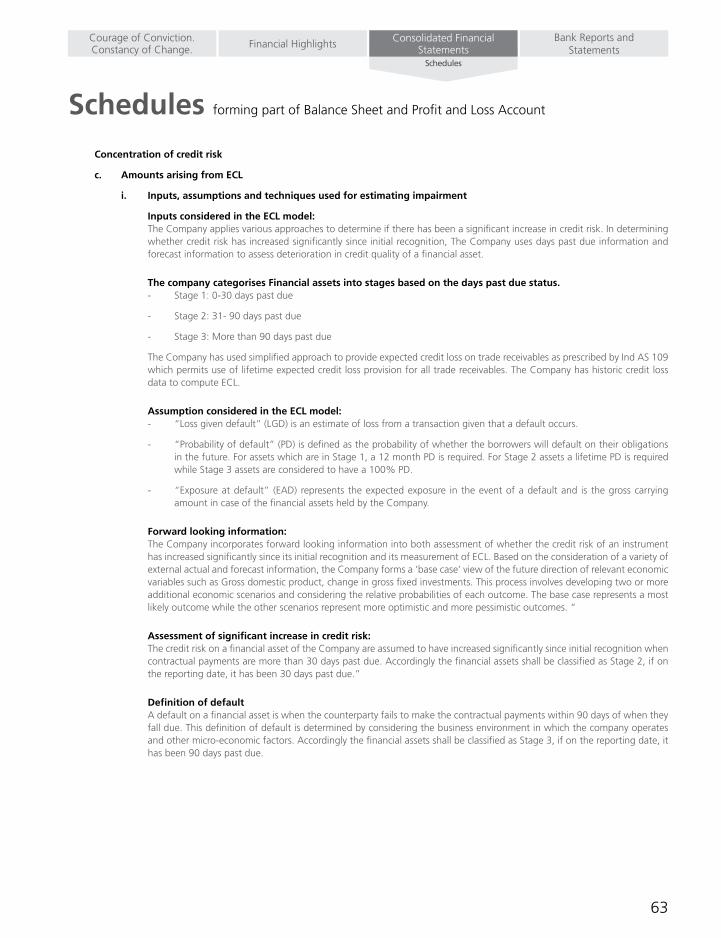
63
Schedules forming part of Balance Sheet and Profit and Loss Account
Bank Reports and Statements
Consolidated Financial StatementsFinancial HighlightsCourage of Conviction.
Constancy of Change.Schedules
Concentration of credit risk
c. Amounts arising from ECL
i. Inputs, assumptions and techniques used for estimating impairment
Inputs considered in the ECL model: The Company applies various approaches to determine if there has been a significant increase in credit risk. In determining
whether credit risk has increased significantly since initial recognition, The Company uses days past due information and forecast information to assess deterioration in credit quality of a financial asset.
The company categorises Financial assets into stages based on the days past due status. - Stage 1: 0-30 days past due
- Stage 2: 31- 90 days past due
- Stage 3: More than 90 days past due
The Company has used simplified approach to provide expected credit loss on trade receivables as prescribed by Ind AS 109 which permits use of lifetime expected credit loss provision for all trade receivables. The Company has historic credit loss data to compute ECL.
Assumption considered in the ECL model: - “Loss given default” (LGD) is an estimate of loss from a transaction given that a default occurs.
- “Probability of default” (PD) is defined as the probability of whether the borrowers will default on their obligations in the future. For assets which are in Stage 1, a 12 month PD is required. For Stage 2 assets a lifetime PD is required while Stage 3 assets are considered to have a 100% PD.
- “Exposure at default” (EAD) represents the expected exposure in the event of a default and is the gross carrying amount in case of the financial assets held by the Company.
Forward looking information: The Company incorporates forward looking information into both assessment of whether the credit risk of an instrument
has increased significantly since its initial recognition and its measurement of ECL. Based on the consideration of a variety of external actual and forecast information, the Company forms a ‘base case’ view of the future direction of relevant economic variables such as Gross domestic product, change in gross fixed investments. This process involves developing two or more additional economic scenarios and considering the relative probabilities of each outcome. The base case represents a most likely outcome while the other scenarios represent more optimistic and more pessimistic outcomes. “
Assessment of significant increase in credit risk: The credit risk on a financial asset of the Company are assumed to have increased significantly since initial recognition when
contractual payments are more than 30 days past due. Accordingly the financial assets shall be classified as Stage 2, if on the reporting date, it has been 30 days past due.”
Definition of default A default on a financial asset is when the counterparty fails to make the contractual payments within 90 days of when they
fall due. This definition of default is determined by considering the business environment in which the company operates and other micro-economic factors. Accordingly the financial assets shall be classified as Stage 3, if on the reporting date, it has been 90 days past due.
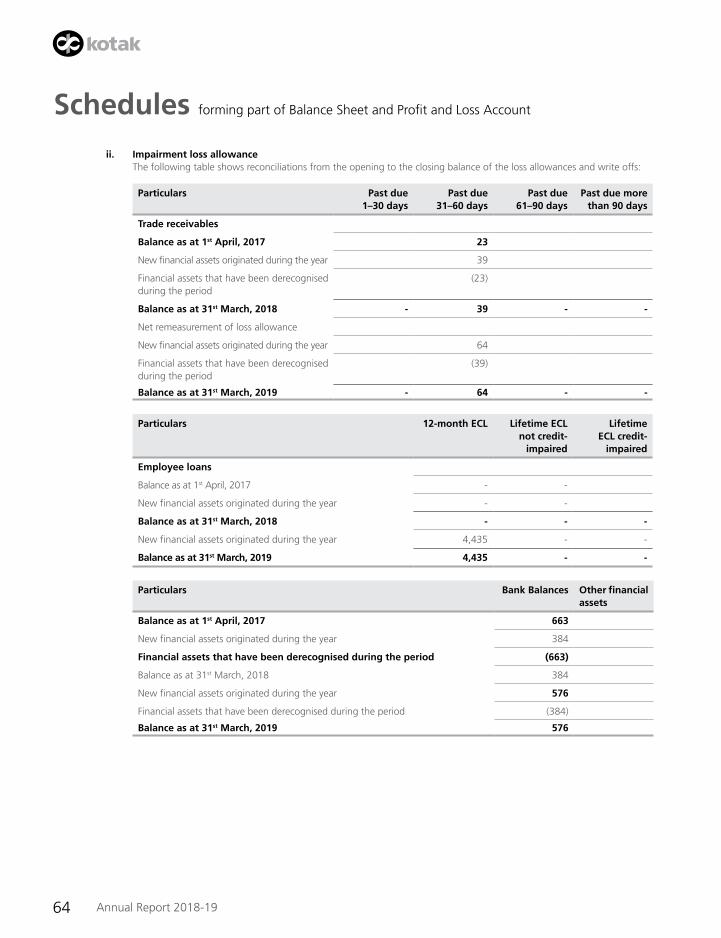
64 Annual Report 2018-19
Schedules forming part of Balance Sheet and Profit and Loss Account
ii. Impairment loss allowance The following table shows reconciliations from the opening to the closing balance of the loss allowances and write offs:
Particulars Past due 1–30 days
Past due 31–60 days
Past due 61–90 days
Past due more than 90 days
Trade receivables
Balance as at 1st April, 2017 23
New financial assets originated during the year 39
Financial assets that have been derecognised during the period
(23)
Balance as at 31st March, 2018 - 39 - -
Net remeasurement of loss allowance
New financial assets originated during the year 64
Financial assets that have been derecognised during the period
(39)
Balance as at 31st March, 2019 - 64 - -
Particulars 12-month ECL Lifetime ECL not credit-
impaired
Lifetime ECL credit-
impaired
Employee loans
Balance as at 1st April, 2017 - -
New financial assets originated during the year - -
Balance as at 31st March, 2018 - - -
New financial assets originated during the year 4,435 - -
Balance as at 31st March, 2019 4,435 - -
Particulars Bank Balances Other financial assets
Balance as at 1st April, 2017 663
New financial assets originated during the year 384
Financial assets that have been derecognised during the period (663)
Balance as at 31st March, 2018 384
New financial assets originated during the year 576
Financial assets that have been derecognised during the period (384)
Balance as at 31st March, 2019 576
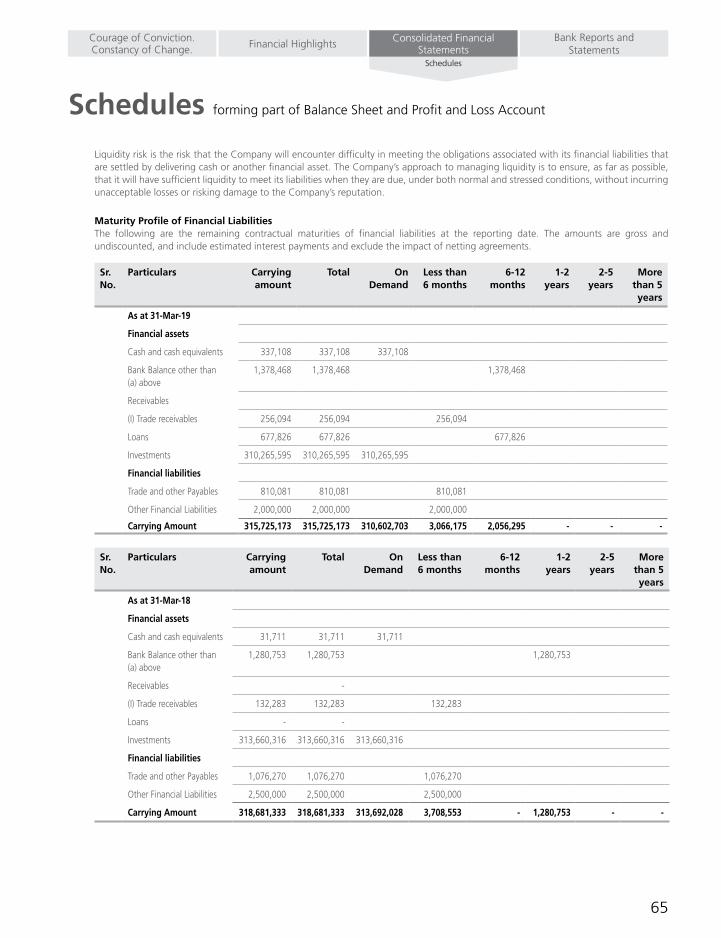
65
Schedules forming part of Balance Sheet and Profit and Loss Account
Bank Reports and Statements
Consolidated Financial StatementsFinancial HighlightsCourage of Conviction.
Constancy of Change.Schedules
Liquidity risk is the risk that the Company will encounter difficulty in meeting the obligations associated with its financial liabilities that are settled by delivering cash or another financial asset. The Company’s approach to managing liquidity is to ensure, as far as possible, that it will have sufficient liquidity to meet its liabilities when they are due, under both normal and stressed conditions, without incurring unacceptable losses or risking damage to the Company’s reputation.
Maturity Profile of Financial Liabilities The following are the remaining contractual maturities of financial liabilities at the reporting date. The amounts are gross and
undiscounted, and include estimated interest payments and exclude the impact of netting agreements.
Sr. No.
Particulars Carrying amount
Total On Demand
Less than 6 months
6-12 months
1-2 years
2-5 years
More than 5 years
As at 31-Mar-19
Financial assets
Cash and cash equivalents 337,108 337,108 337,108
Bank Balance other than (a) above
1,378,468 1,378,468 1,378,468
Receivables
(I) Trade receivables 256,094 256,094 256,094
Loans 677,826 677,826 677,826
Investments 310,265,595 310,265,595 310,265,595
Financial liabilities
Trade and other Payables 810,081 810,081 810,081
Other Financial Liabilities 2,000,000 2,000,000 2,000,000
Carrying Amount 315,725,173 315,725,173 310,602,703 3,066,175 2,056,295 - - -
Sr. No.
Particulars Carrying amount
Total On Demand
Less than 6 months
6-12 months
1-2 years
2-5 years
More than 5 years
As at 31-Mar-18
Financial assets
Cash and cash equivalents 31,711 31,711 31,711
Bank Balance other than (a) above
1,280,753 1,280,753 1,280,753
Receivables -
(I) Trade receivables 132,283 132,283 132,283
Loans - -
Investments 313,660,316 313,660,316 313,660,316
Financial liabilities
Trade and other Payables 1,076,270 1,076,270 1,076,270
Other Financial Liabilities 2,500,000 2,500,000 2,500,000
Carrying Amount 318,681,333 318,681,333 313,692,028 3,708,553 - 1,280,753 - -

66 Annual Report 2018-19
Schedules forming part of Balance Sheet and Profit and Loss Account
Sr. No.
Particulars Carrying amount
Total On Demand
Less than 6 months
6-12 months
1-2 years
2-5 years
More than 5 years
As at 1-Apr-17
Financial assets
Cash and cash equivalents
652,912 652,912 652,912
Bank Balance other than (a) above
1,189,831 1,189,831 1,189,831
Receivables -
(I) Trade receivables 62,639 62,639 62,639
Loans - -
Investments 315,508,144 315,508,144 315,508,144
Financial liabilities
Trade and other Payables 886,477 886,477 839,654 19,138 27,685
Other Financial Liabilities 2,000,000 2,000,000 2,000,000
Carrying Amount 320,300,003 320,300,003 316,161,056 2,902,293 19,138 - 1,217,516 -
NOTE NO 31 TRANSITION TO IND AS:For the purposes of reporting as set out in Note 1, we have transitioned our basis of accounting from Indian generally accepted accounting principles (“IGAAP”) to Ind AS. The accounting policies set out in note 1 have been applied in preparing the financial statements for the year ended 31 March 2019, the comparative information presented in these financial statements for the year ended 31 March 2018 and in the preparation of an opening Ind AS balance sheet at 1 April 2017 (the “transition date”). In preparing our opening Ind AS balance sheet, we have adjusted amounts reported in financial statements prepared in accordance with IGAAP. An explanation of how the transition from IGAAP to Ind AS has affected our financial performance, cash flows and financial position is set out in the following tables and the notes that accompany the tables. On transition, we did not revise estimates previously made under IGAAP except where required by Ind AS.
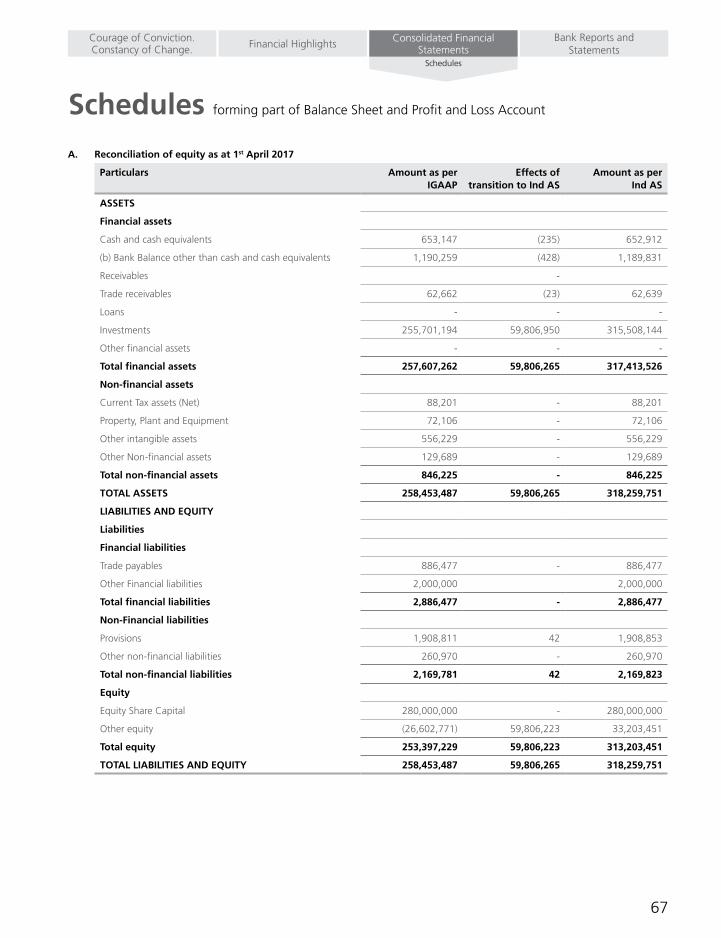
67
Schedules forming part of Balance Sheet and Profit and Loss Account
Bank Reports and Statements
Consolidated Financial StatementsFinancial HighlightsCourage of Conviction.
Constancy of Change.Schedules
A. Reconciliation of equity as at 1st April 2017
Particulars Amount as per IGAAP
Effects of transition to Ind AS
Amount as per Ind AS
ASSETS
Financial assets
Cash and cash equivalents 653,147 (235) 652,912
(b) Bank Balance other than cash and cash equivalents 1,190,259 (428) 1,189,831
Receivables -
Trade receivables 62,662 (23) 62,639
Loans - - -
Investments 255,701,194 59,806,950 315,508,144
Other financial assets - - -
Total financial assets 257,607,262 59,806,265 317,413,526
Non-financial assets
Current Tax assets (Net) 88,201 - 88,201
Property, Plant and Equipment 72,106 - 72,106
Other intangible assets 556,229 - 556,229
Other Non-financial assets 129,689 - 129,689
Total non-financial assets 846,225 - 846,225
TOTAL ASSETS 258,453,487 59,806,265 318,259,751
LIABILITIES AND EqUITY
Liabilities
Financial liabilities
Trade payables 886,477 - 886,477
Other Financial liabilities 2,000,000 2,000,000
Total financial liabilities 2,886,477 - 2,886,477
Non-Financial liabilities
Provisions 1,908,811 42 1,908,853
Other non-financial liabilities 260,970 - 260,970
Total non-financial liabilities 2,169,781 42 2,169,823
Equity
Equity Share Capital 280,000,000 - 280,000,000
Other equity (26,602,771) 59,806,223 33,203,451
Total equity 253,397,229 59,806,223 313,203,451
TOTAL LIABILITIES AND EqUITY 258,453,487 59,806,265 318,259,751

68 Annual Report 2018-19
Schedules forming part of Balance Sheet and Profit and Loss Account
B. Reconciliation of equity as at 31st March, 2018
Particulars Amount as per IGAAP
Effects of transition to Ind AS
Amount as per Ind AS
ASSETS
Financial assets
Cash and cash equivalents 31,721 (9) 31,711
(b) Bank Balance other than cash and cash equivalents 1,281,127 (374) 1,280,753
Receivables
Trade receivables 132,322 (39) 132,283
Loans -
Investments 257,354,963 56,305,353 313,660,316
Other financial assets - - -
Total financial assets 258,800,133 56,304,931 315,105,063
Non-financial assets
(b) Current Tax assets (Net) 139,642 - 139,642
Property, Plant and Equipment 35,727 - 35,727
Other intangible assets 355,833 - 355,833
Other Non-financial assets 341,992 - 341,992
Total non-financial assets 873,194 - 873,194
TOTAL ASSETS 259,673,326 56,304,931 315,978,257
LIABILITIES AND EqUITY
Liabilities
Financial liabilities
Trade payables 1,076,270 - 1,076,270
Other Financial liabilities 2,500,000 2,500,000
Total financial liabilities 3,576,270 - 3,576,270
Non-Financial liabilities
Provisions 2,886,872 178 2,887,050
Other non-financial liabilities 304,835 - 304,835
Total non-financial liabilities 3,191,707 178 3,191,885
Equity
Equity Share Capital 280,000,000 - 280,000,000
Other equity (27,094,651) 56,304,753 29,210,102
Total equity 252,905,349 56,304,753 309,210,102
TOTAL LIABILITIES AND EqUITY 259,673,326 56,304,931 315,978,257

69
Schedules forming part of Balance Sheet and Profit and Loss Account
Bank Reports and Statements
Consolidated Financial StatementsFinancial HighlightsCourage of Conviction.
Constancy of Change.Schedules
c. Reconciliation of profit or loss for the year ended 31st March, 2018
Particulars Amount as per IGAAP
Effects of transition to Ind AS
Amount as per Ind AS
I. REVENUE FROM OPERATIONS
Interest income 100,964 - 100,964
Management Fees 412,950 - 412,950
Net gain on fair value changes 24,236,781 (3,501,597) 20,735,185
Total revenue from operations 24,750,695 (3,501,597) 21,249,099
II. Other income -
III. Total Income (I+II) 24,750,695 (3,501,597) 21,249,099
IV. Expenses
Finance costs 115 - 115
Employee Benefits expenses 14,104,585 65,607 14,170,192
Depreciation, amortization and impairment 236,775 - 236,775
Other expenses 10,901,099 1 10,901,100
Total Expenses 25,242,574 65,608 25,308,182
V. Profit / (loss) before exceptional items and tax (III-IV)
(491,879) (3,567,205) (4,059,083)
VI. Exceptional items - - -
VII. Profit/(loss) before tax (V -VI ) (491,879) (3,567,205) (4,059,083)
VIII. Tax expense:
1. Current Tax - - -
2. Deferred Tax -
IX. Profit/(Loss) for the period from continuing operations
(491,879) (3,567,205) (4,059,083)
X. Profit/(Loss) for the period (491,879) (3,567,205) (4,059,083)
XI. Other comprehensive income
(i) Items that will not be reclassified to profit or loss
Remeasurements of the defined benefit plans - (138,522) (138,522)
Other comprehensive income (net of tax) - (138,522) (138,522)
XII. Total comprehensive income for the year (X + XI) (491,879) (3,705,727) (4,197,605)
D. Cash flow statement
There were no significant reconciliation items between cash flows prepared under Indian GAAP and those prepared under Ind AS. The following reconciliations provide a quantification of the effect of significant differences arising from the transition from Previous
GAAP to Ind AS in accordance with Ind AS 101.
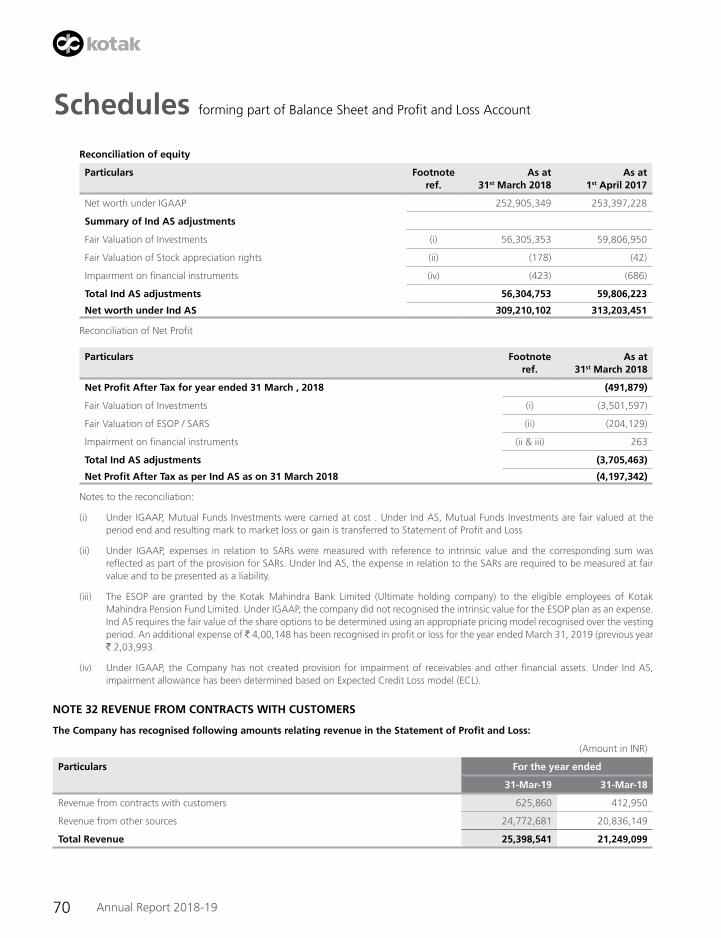
70 Annual Report 2018-19
Schedules forming part of Balance Sheet and Profit and Loss Account
Reconciliation of equity
Particulars Footnote ref.
As at 31st March 2018
As at 1st April 2017
Net worth under IGAAP 252,905,349 253,397,228
Summary of Ind AS adjustments
Fair Valuation of Investments (i) 56,305,353 59,806,950
Fair Valuation of Stock appreciation rights (ii) (178) (42)
Impairment on financial instruments (iv) (423) (686)
Total Ind AS adjustments 56,304,753 59,806,223
Net worth under Ind AS 309,210,102 313,203,451
Reconciliation of Net Profit
Particulars Footnote ref.
As at 31st March 2018
Net Profit After Tax for year ended 31 March , 2018 (491,879)
Fair Valuation of Investments (i) (3,501,597)
Fair Valuation of ESOP / SARS (ii) (204,129)
Impairment on financial instruments (ii & iii) 263
Total Ind AS adjustments (3,705,463)
Net Profit After Tax as per Ind AS as on 31 March 2018 (4,197,342)
Notes to the reconciliation:
(i) Under IGAAP, Mutual Funds Investments were carried at cost . Under Ind AS, Mutual Funds Investments are fair valued at the period end and resulting mark to market loss or gain is transferred to Statement of Profit and Loss
(ii) Under IGAAP, expenses in relation to SARs were measured with reference to intrinsic value and the corresponding sum was reflected as part of the provision for SARs. Under Ind AS, the expense in relation to the SARs are required to be measured at fair value and to be presented as a liability.
(iii) The ESOP are granted by the Kotak Mahindra Bank Limited (Ultimate holding company) to the eligible employees of Kotak Mahindra Pension Fund Limited. Under IGAAP, the company did not recognised the intrinsic value for the ESOP plan as an expense. Ind AS requires the fair value of the share options to be determined using an appropriate pricing model recognised over the vesting period. An additional expense of ̀ 4,00,148 has been recognised in profit or loss for the year ended March 31, 2019 (previous year ` 2,03,993.
(iv) Under IGAAP, the Company has not created provision for impairment of receivables and other financial assets. Under Ind AS, impairment allowance has been determined based on Expected Credit Loss model (ECL).
NOTE 32 REVENUE FROM CONTRACTS WITH CUSTOMERS
The Company has recognised following amounts relating revenue in the Statement of Profit and Loss:
(Amount in INR)
Particulars For the year ended
31-Mar-19 31-Mar-18
Revenue from contracts with customers 625,860 412,950
Revenue from other sources 24,772,681 20,836,149
Total Revenue 25,398,541 21,249,099
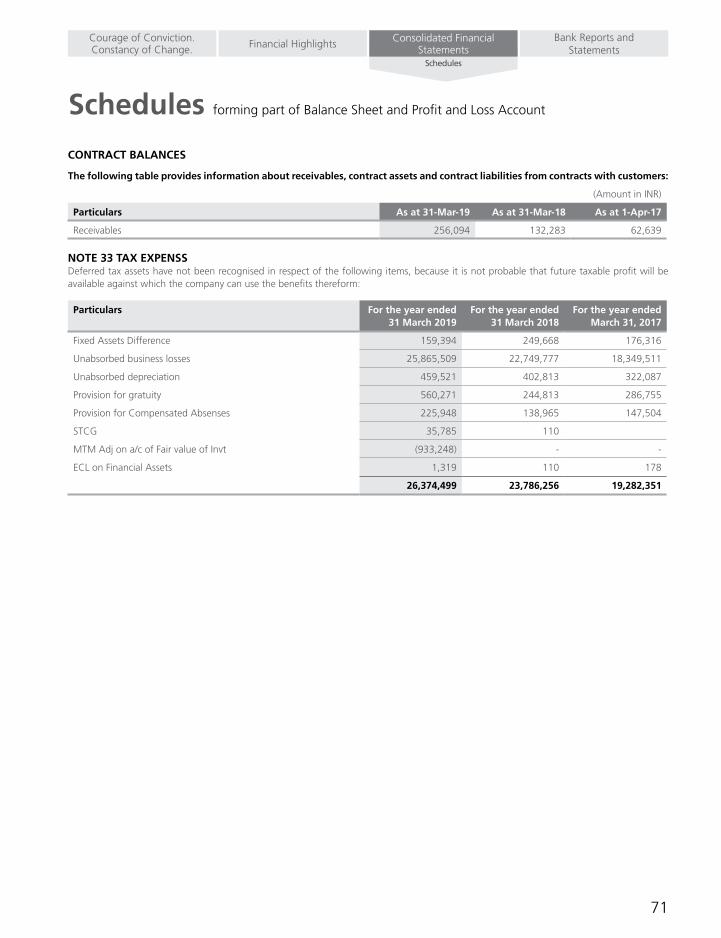
71
Schedules forming part of Balance Sheet and Profit and Loss Account
Bank Reports and Statements
Consolidated Financial StatementsFinancial HighlightsCourage of Conviction.
Constancy of Change.Schedules
CONTRACT BALANCES
The following table provides information about receivables, contract assets and contract liabilities from contracts with customers:
(Amount in INR)
Particulars As at 31-Mar-19 As at 31-Mar-18 As at 1-Apr-17
Receivables 256,094 132,283 62,639
NOTE 33 TAX EXPENSS Deferred tax assets have not been recognised in respect of the following items, because it is not probable that future taxable profit will be available against which the company can use the benefits thereform:
Particulars For the year ended 31 March 2019
For the year ended 31 March 2018
For the year ended March 31, 2017
Fixed Assets Difference 159,394 249,668 176,316
Unabsorbed business losses 25,865,509 22,749,777 18,349,511
Unabsorbed depreciation 459,521 402,813 322,087
Provision for gratuity 560,271 244,813 286,755
Provision for Compensated Absenses 225,948 138,965 147,504
STCG 35,785 110
MTM Adj on a/c of Fair value of Invt (933,248) - -
ECL on Financial Assets 1,319 110 178
26,374,499 23,786,256 19,282,351
Annual Report 2018-19
Courage of Conviction.
Constancy of Change.
Kotak M
ahindra Bank Limited | Thirty Fourth A
nnual Report 2018-19
Kotak Mahindra Bank Limited, 27BKC, C 27, G Block, Bandra-Kurla Complex, Bandra (E),
Mumbai - 400 051Website: www.kotak.com
BSE: 500247 | NSE: KOTAKBANK | Bloomberg: KMB:IN
CIN: L65110MH1985PLC038137 conc
ept a
nd d
esig
n at
Wya
ttPr
ism C
omm
unic
atio
ns
Related Documents


