Jürg Fedier Chief Financial Officer Ermatingen September 20, 2012 Oerlikon at UBS Best of Switzerland 2012

Welcome message from author
This document is posted to help you gain knowledge. Please leave a comment to let me know what you think about it! Share it to your friends and learn new things together.
Transcript

Jürg Fedier Chief Financial Officer Ermatingen September 20, 2012
Oerlikon at UBS Best of Switzerland 2012

Agenda
Page 2
1 Business Overview
2 Business Update and Financials
3 Outlook
4 Appendix
UBS Best of Switzerland, September 20, 2012
Business Overview Segments
Page 3
Textile Drive
Systems Vacuum Coating Advanced
Technologies Solar
Textile solution provider
Mechatronic, hydrostatic and electric
drive systems
Full vacuum solutions,
components and services
Coating services and equipment
Manufacturing equipment
supplier of the semi, PV and
clean tech industries
Turn key solutions for
thin film silicon photovoltaic
Sales 2011*
EBIT 2011* 183
2’037
49
821
59
409
97
484
11
108
-10
323
* in CHF m
Group** ∆ to 2010
4’182
419
16%
>100%
Sale concluded: closing expected Q3 2012
** Group EBIT contains corporate/elimination items, e.g. management and trademark fees, real estate income, income from IT services of CHF 30m UBS Best of Switzerland, September 20, 2012

Business Overview Markets
Page 4 * Sales to third parties
Oerlikon is an innovative technology group
Oerlikon is focused on high quality businesses with leading positions in global markets
Innovation is at the core of Oerlikon business model across all segments
Oerlikon is an early mover in Asia where the company now enjoys a strong reputation and track record
Market capitalization of CHF 2.6 bn (as per 31.05.2012)
Market presence and example end markets of Oerlikon Group*
Food Clothing Transportation Infrastructure Energy Electronics Others
2011 Sales* split by geography (CHF m)
Asia 2 031 49 %
Europe 1 186 28 %
NorthAm 609
15 %
Others 356
Very diversified applications from agriculture machinery components to machinery for the textile industry
Agriculture Technical clothing
Automotive Glass coatings
Wind turbines Touch- screens
Formula 1
defines percentage of total Group sales within respective market
** according to research by ubc consulting
UBS Best of Switzerland, September 20, 2012

Oerlikon Customer Base (selection)
Page 5
Preferred technology supplier to technology leaders in their respective industries Global customer base and world-leading brand names Strong long-term customer relationships
UBS Best of Switzerland, September 20, 2012

Agenda
Page 6
1 Business Overview
2 Business Update and Financials
3 Outlook
4 Appendix
UBS Best of Switzerland, September 20, 2012
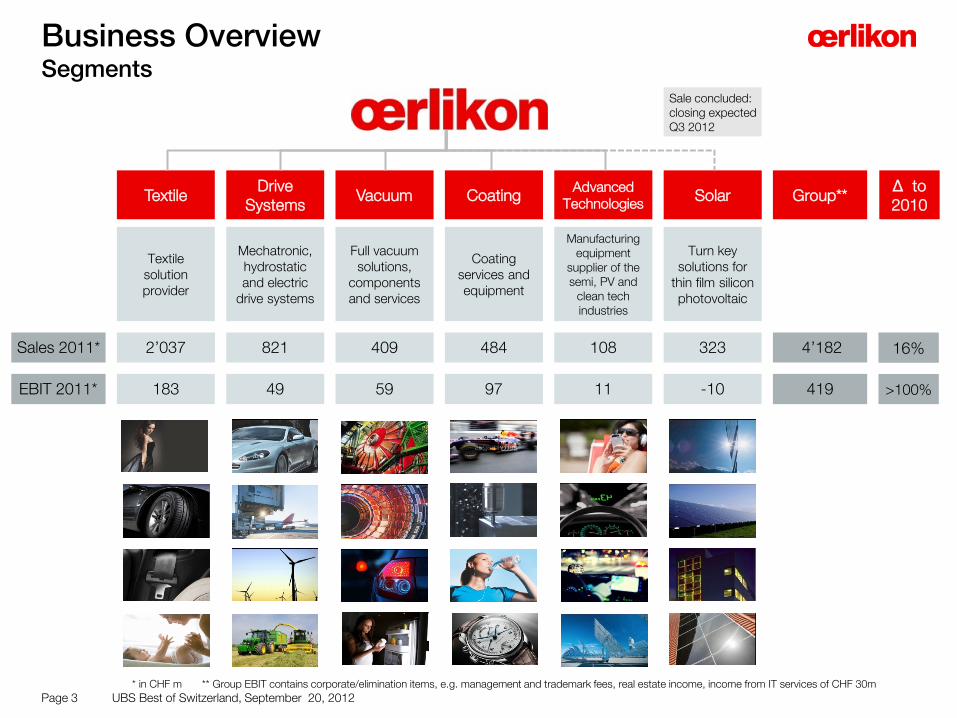
Strong operating performance in Q2 2012 Group EBIT margin improves to 11.7 % in CHF m / in %
Significant increase in profitability
With an EBIT margin of 11.7 %, Oerlikon operates on a continued high level
Strong margin improvements at the Textile, Drive Systems and Coating Segments
Currency impact in Q2 negligible
Growth in Asia (China sales increased by 17 %) and the US
Execution of Operational Excellence programs and portfolio adjustments
Page 7
Comprehensive refinancing successfully completed in July 2012
Order intake Sales*
1 033 -7%
Q2 2012 cont. op.
956
Q2 2011 restated
994 0%
Q2 2012 cont. op.
990
Q2 2011 restated
EBIT
93+24%
Q2 2012 cont. op.
115
Q2 2011 restated
Order backlog
1 605
-18%
Q2 2012 cont. op.
1 319
Q2 2011 restated
EBIT margin
9.4+24%
Q2 2012 cont. op.
11.7
Q2 2011 restated
* Sales to third parties UBS Best of Switzerland, September 20, 2012
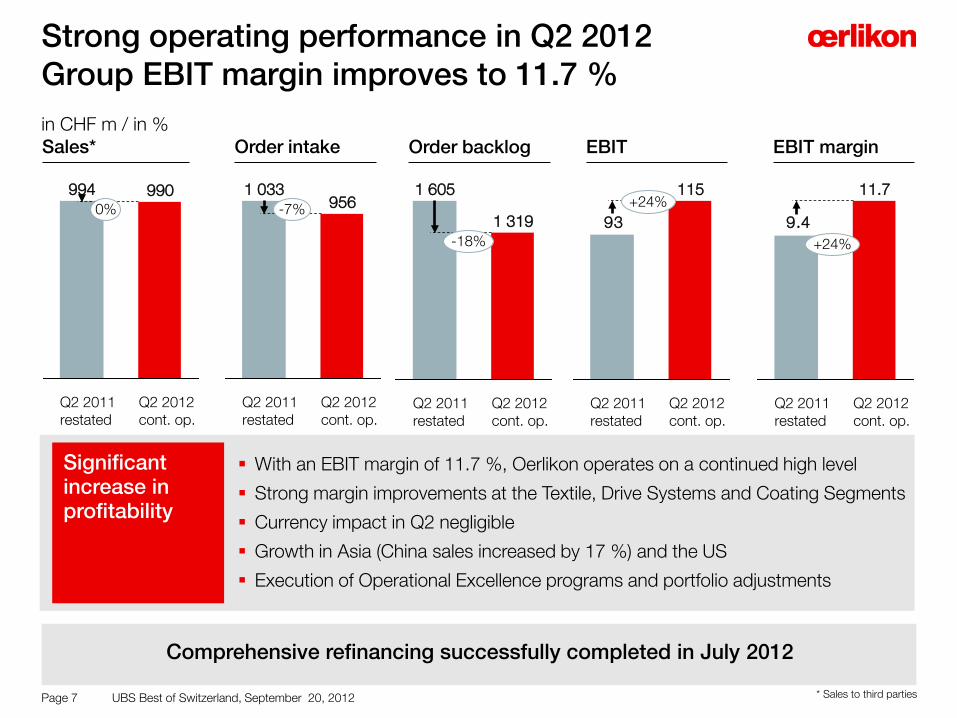
Textile
Vacuum
Oerlikon Segments 1/2
Page 8
Second quarter business review
Postponements of sales projects in an overall softening market environment Demand from the solar market continued to be
very weak and Asian market slowed, i.e. lighting market in China Continued investments in new product
introductions, logistics and regional expansion
Drive Systems
Mature markets in the US and Europe as drivers Slower market growth environment but ongoing
demand in agriculture, construction, mining and energy Sale of production site in Italy completed Ramp-up of production capabilities in China and
alignment of customer opportunities
Manmade fiber with continued strong performance, highest order intake for five quarters Natural fiber saw weaker contribution ITMA 2012 in Shanghai demonstrated leading
technology position Strong Q2 sales growth in China (25 %) Continued portfolio adjustment (sale of Melco)
UBS Best of Switzerland, September 20, 2012

Coating
Oerlikon Segments 2/2
Page 9
Second quarter business review
Advanced Technologies
Positive trend in selected markets of the semiconductor industry continued, especially in Advanced Packaging for mobile applications Restructuring measures due to the exit of the
optical disc equipment business Successful qualification processes in the
semiconductor and LED business
Strong growth in the tools markets in Japan, Germany and the US Solutions for high-volume automotive components
supported growth in Europe 87 coating centers worldwide with continued
capacity increase Further regional expansion in preparation
UBS Best of Switzerland, September 20, 2012
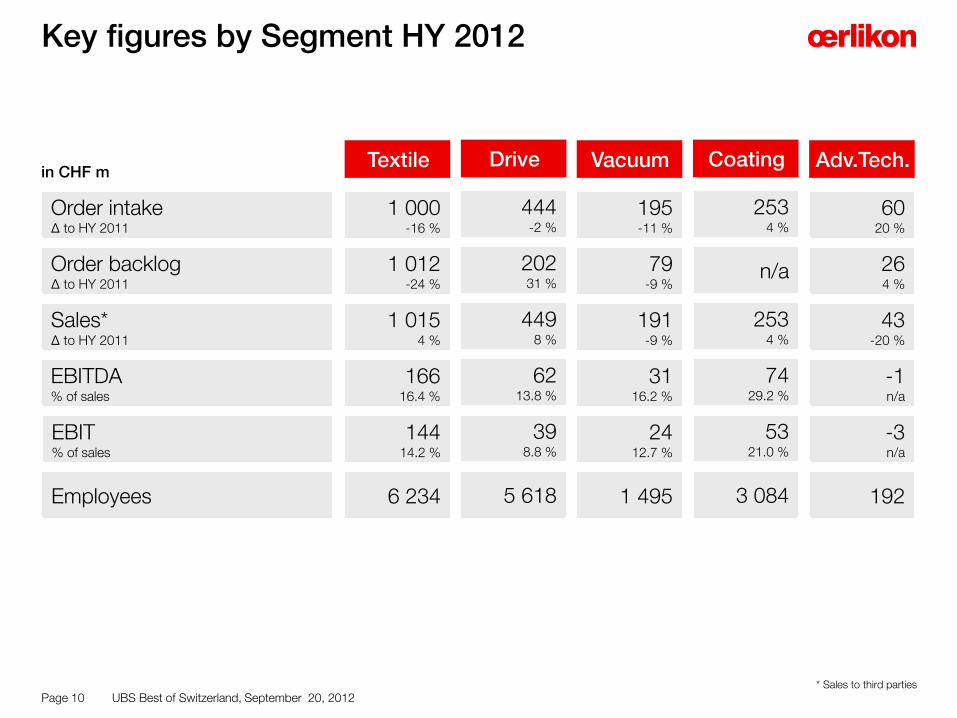
Key figures by Segment HY 2012
Order intake Δ to HY 2011
Order backlog Δ to HY 2011
Sales* Δ to HY 2011
EBITDA % of sales
EBIT % of sales
in CHF m
Page 10
Employees
Vacuum
195 -11 %
79 -9 %
191 -9 %
31 16.2 %
24 12.7 %
1 495
Textile
1 000 -16 %
1 012 -24 %
1 015 4 %
166 16.4 %
144 14.2 %
6 234
Coating
253 4 %
n/a
253 4 %
74 29.2 %
53 21.0 %
3 084
Adv.Tech.
60 20 %
26 4 %
43 -20 %
-1 n/a
-3 n/a
192
Drive
444 -2 %
202 31 %
449 8 %
62 13.8 %
39 8.8 %
5 618
* Sales to third parties UBS Best of Switzerland, September 20, 2012

Constant range of investments in R&D to secure technological leadership
Page 11
Expenditures for R&D in the range of 4-6 % of Sales (restated)
74
145147
197194
4
4
5
6
5
4
0
50
100
150
200
0.0
0.5
1.0
1.5
2.0
2.5
3.0
3.5
4.0
4.5
5.0
5.5
6.0
HY 2012 FY 2011 FY 2010
163
FY 2009 FY 2008 FY 2007
in CHF m / as % of Sales
UBS Best of Switzerland, September 20, 2012
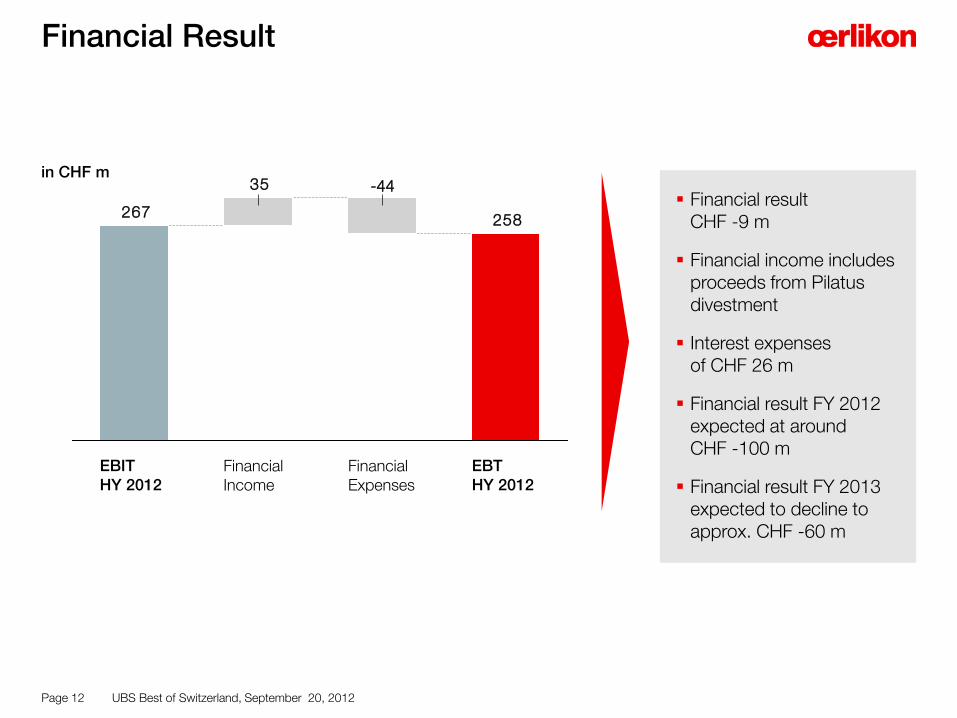
Financial Result
Page 12
258
35
267
EBT HY 2012
Financial Expenses
-44
Financial Income
EBIT HY 2012
in CHF m
Financial result
CHF -9 m
Financial income includes proceeds from Pilatus divestment
Interest expenses of CHF 26 m
Financial result FY 2012 expected at around CHF -100 m
Financial result FY 2013 expected to decline to approx. CHF -60 m
UBS Best of Switzerland, September 20, 2012
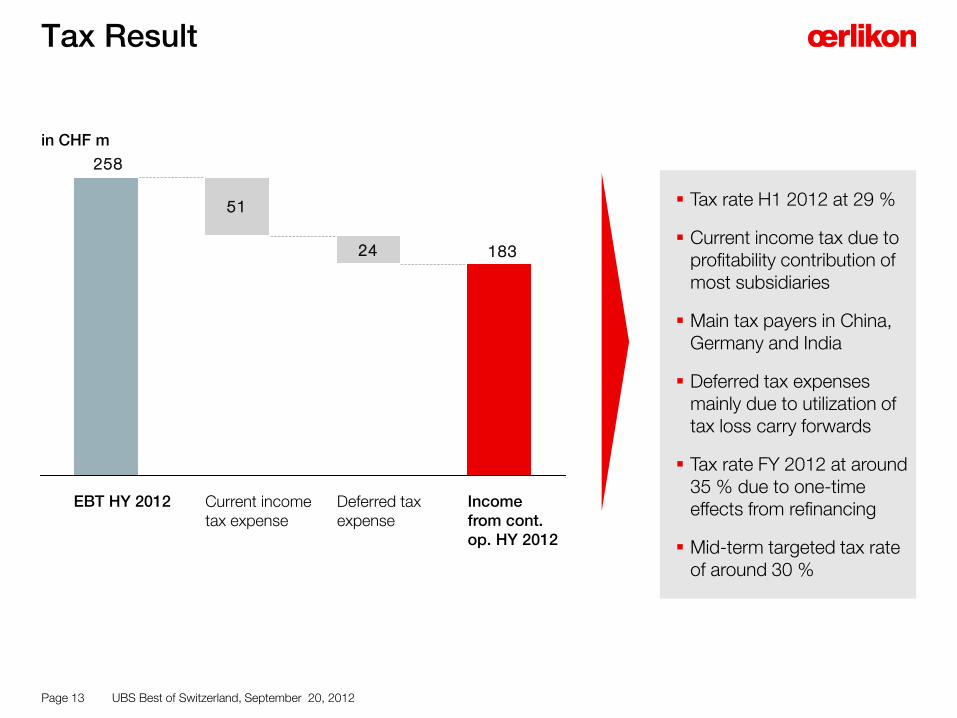
Tax Result
Page 13
51
24 183
258
Income from cont. op. HY 2012
Deferred tax expense
Current income tax expense
EBT HY 2012
Tax rate H1 2012 at 29 %
Current income tax due to profitability contribution of most subsidiaries
Main tax payers in China, Germany and India
Deferred tax expenses mainly due to utilization of tax loss carry forwards
Tax rate FY 2012 at around 35 % due to one-time effects from refinancing
Mid-term targeted tax rate of around 30 %
in CHF m
UBS Best of Switzerland, September 20, 2012
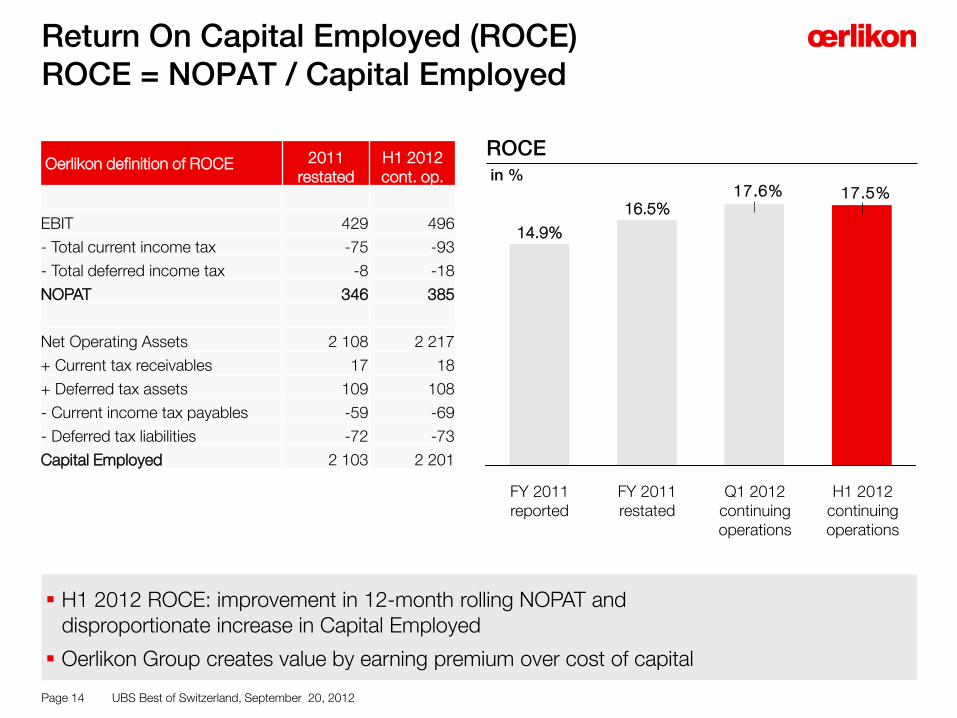
H1 2012 ROCE: improvement in 12-month rolling NOPAT and disproportionate increase in Capital Employed
Oerlikon Group creates value by earning premium over cost of capital
ROCE
Return On Capital Employed (ROCE) ROCE = NOPAT / Capital Employed
Page 14
17.5%17.6%
H1 2012 continuing operations
Q1 2012 continuing operations
FY 2011 restated
16.5%
FY 2011 reported
14.9%
in % Oerlikon definition of ROCE 2011
restated H1 2012 cont. op.
EBIT 429 496
- Total current income tax -75 -93
- Total deferred income tax -8 -18
NOPAT 346 385
Net Operating Assets 2 108 2 217
+ Current tax receivables 17 18
+ Deferred tax assets 109 108
- Current income tax payables -59 -69
- Deferred tax liabilities -72 -73
Capital Employed 2 103 2 201
UBS Best of Switzerland, September 20, 2012

Maintaining a solid balance sheet
1) Net debt / Equity
Page 15
Cash and cash equivalents
in CHF m
Trade receivables
Inventories
Property, plant and equipment
Total other assets
Total assets
Current and non-current loans and borrowings
Total liabilities
Gearing1)
Total equity
Equity ratio
Net debt
Total other liabilities
Intangible assets
Non-current post-employment benefit provisions
Trade payables
Current customer advances
HY 2012
620
680
609
817
1 234
500
4 %
4 460
695
570
683
2 846
1 614
36 %
61
410
488
FY 2011
742
635
582
915
1 261
438
5 %
4 573
856
525
654
2 963
1 610
35 %
86
457
471
UBS Best of Switzerland, September 20, 2012

Net Working Capital*
** restated * Net Working Capital is defined as trade receivables + inventories – trade payables – current customer advances
Page 16
Net Working Capital* FY 2007-HY 2012
391
289302
499
837772
7%
FY 2010
8%
FY 2009
17%
FY 2008
18%
HY 2012 FY 2011
14% 10%
FY 2007**
Net working capital
increased due to higher receivables, higher inventory and influenced by increased customer advances
Net Working Capital HY 2012 at 10 % of 12-month rolling sales
in % of Sales and CHF m
UBS Best of Switzerland, September 20, 2012

Depreciation & amortization* CAPEX CAPEX / depreciation & amortization ratio * *
70
56
+25%
HY 2012 cont. op.
HY 2011 restated
7678-3%
HY 2012 cont. op.
HY 2011 restated
Mid-term target
corridor 1.20
1.00
in CHF m in CHF m
CAPEX close to depreciation level
** Excluding impairment
Page 17
* Restated
UBS Best of Switzerland, September 20, 2012

Comprehensive Refinancing 2012 Increased strategic and operational flexibility
Page 18
New Syndicated Credit Facility Swiss Bond
Unsecured transaction
CHF 700m Credit Facility (Facility A) revolving facility of CHF 450 m and ancillary facility of CHF 250 m
Term of three years and two additional one-year extension options
Initial margin of 250 basis points per year
13 international banks in the syndicate
CHF 100 m term loan (Facility B) cancelled due to successful issuance of Bond
CHF 300 m Swiss Bond
4-year maturity
Coupon of 4.25 %
Coupon paid annually, starting on July 13, 2013
Regained confidence of capital market and recognition of underlying performance improvement Repayment in full of old facility from financial restructuring as of July 20, 2012
UBS Best of Switzerland, September 20, 2012

Comprehensive Refinancing 2012 Reduction of debt and diversification
Page 19
483 486
345
196
300
Facility C (old)
5
-36%
Others
Bond
687 Facility B (old)
Facility A (new)
Post Refinancing July 2012
535
230
HY 2012
5
FY 2011
832
4
Development of debt position FY 2011-Post-Refinancing July 2012
Successful closing of Solar divestment will allow to further reduce debt (drawing of Facility A)
UBS Best of Switzerland, September 20, 2012

Agenda
Page 20
1 Business Overview
2 Business Update and Financials
3 Outlook
4 Appendix
UBS Best of Switzerland, September 20, 2012
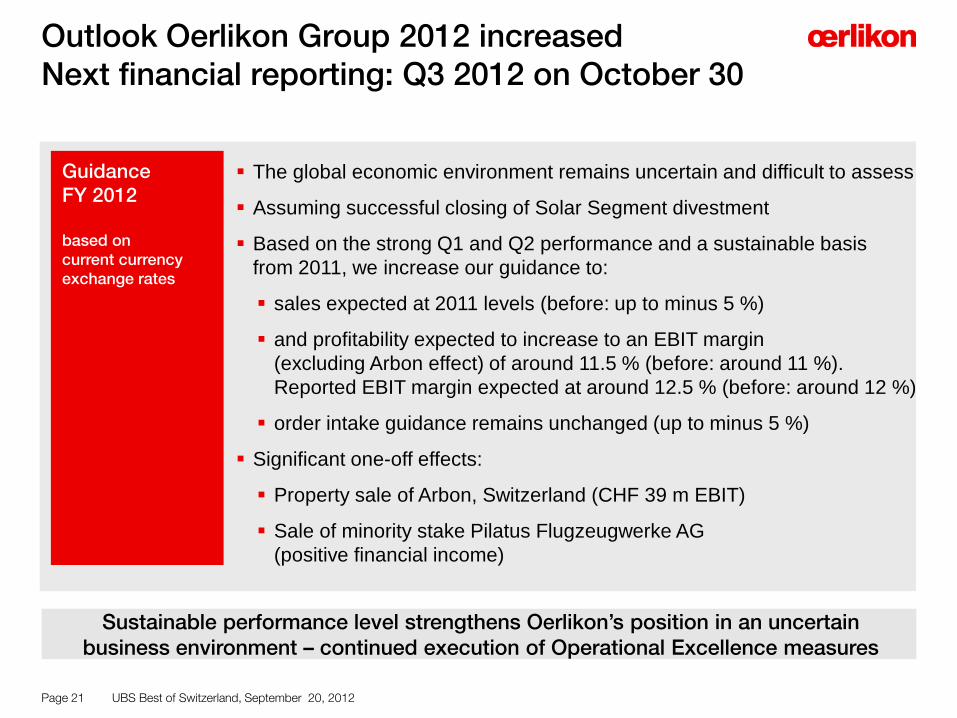
Outlook Oerlikon Group 2012 increased Next financial reporting: Q3 2012 on October 30
Page 21
The global economic environment remains uncertain and difficult to assess
Assuming successful closing of Solar Segment divestment
Based on the strong Q1 and Q2 performance and a sustainable basis from 2011, we increase our guidance to:
sales expected at 2011 levels (before: up to minus 5 %)
and profitability expected to increase to an EBIT margin (excluding Arbon effect) of around 11.5 % (before: around 11 %). Reported EBIT margin expected at around 12.5 % (before: around 12 %)
order intake guidance remains unchanged (up to minus 5 %)
Significant one-off effects:
Property sale of Arbon, Switzerland (CHF 39 m EBIT)
Sale of minority stake Pilatus Flugzeugwerke AG (positive financial income)
Guidance FY 2012 based on current currency exchange rates
Sustainable performance level strengthens Oerlikon’s position in an uncertain business environment – continued execution of Operational Excellence measures
UBS Best of Switzerland, September 20, 2012

Summary – Investment Case
Page 22
Leading position in attractive growth markets
Sustainable improved EBIT margin
Underlying performance improvement
Solid balance sheet
Strong cash flow/dividend
Technological leadership/ innovation
Limited Swiss Franc exposure
Global player/ strong interna-tional footprint
UBS Best of Switzerland, September 20, 2012

Questions & Answers
Page 23 UBS Best of Switzerland, September 20, 2012

Agenda
Page 24
1 Business Overview
2 Business Update and Financials
3 Outlook
4 Appendix
UBS Best of Switzerland, September 20, 2012

Graziano becomes part of Saurer AG
Oerlikon Space lifts off. Launch of first Euro-pean booster rocket, Ariane 4
Schweizerische Werkzeugma-schinenfabrik Oerlikon (SWO) is founded
Oerlikon-Bührle Holding floats on the stock market
Oerlikon-Bührle Group is split up. Core business is renamed Unaxis
1907 1946 1951 1968 1988 1992 1998 2005 2006 2008 2012
More than 100 years of history and Oerlikon’s ability to change
Foundation of Balzers
Foundation of Graziano
Comprehensive rebranding: Oerlikon stands by its business tradition and its Swiss values: quality, reliability, precision, and innovative flair
Takeover of Saurer AG with ist strong textile business
Announcement to divest the Solar Segment
Opening of the plant in Suzhou, China
New profitability level: Record EBIT margin at 10 percent
2011
Page 25
Swiss roots: Oerlikon was named after a suburb of Zurich
UBS Best of Switzerland, September 20, 2012

Vision Mission Tagline
Oerlikon’s Identity
Page 26 UBS Best of Switzerland, September 20, 2012

Oerlikon Shares
Page 27
Oerlikon Shares Oerlikon Shareholder Structure (as of June 30, 2012)
Oerlikon Share Price Development
As of September 14, 2012, Indexed; 100 percent = Closing price per December 31, 2011
Listed on Swiss Exchange (SIX) since 1975 Securities symbol: OERL Securities number 81 682 ISIN: CH0000816824 No. of shares outstanding: 323 279 836 shares* Re-entry to Swiss SMIM on April 17, 2012 Addition to STOXX Europe 600 as of June 18,2012
48.34% Free Float 51.51%
Treasury Shares (part of Free Float)
0.15%
Renova Group
* as of June 30, 2012
90.0
100.0
110.0
120.0
130.0
140.0
150.0
160.0
170.0
180.0
190.0
200.0
30.1
2.11
06.0
1.12
13.0
1.12
20.0
1.12
27.0
1.12
03.0
2.12
10.0
2.12
17.0
2.12
24.0
2.12
02.0
3.12
09.0
3.12
16.0
3.12
23.0
3.12
30.0
3.12
06.0
4.12
13.0
4.12
20.0
4.12
27.0
4.12
04.0
5.12
11.0
5.12
18.0
5.12
25.0
5.12
01.0
6.12
08.0
6.12
15.0
6.12
22.0
6.12
29.0
6.12
06.0
7.12
13.0
7.12
20.0
7.12
27.0
7.12
03.0
8.12
10.0
8.12
17.0
8.12
24.0
8.12
31.0
8.12
07.0
9.12
14.0
9.12
Oerlikon STOXX 600 SMI SMIM
UBS Best of Switzerland, September 20, 2012
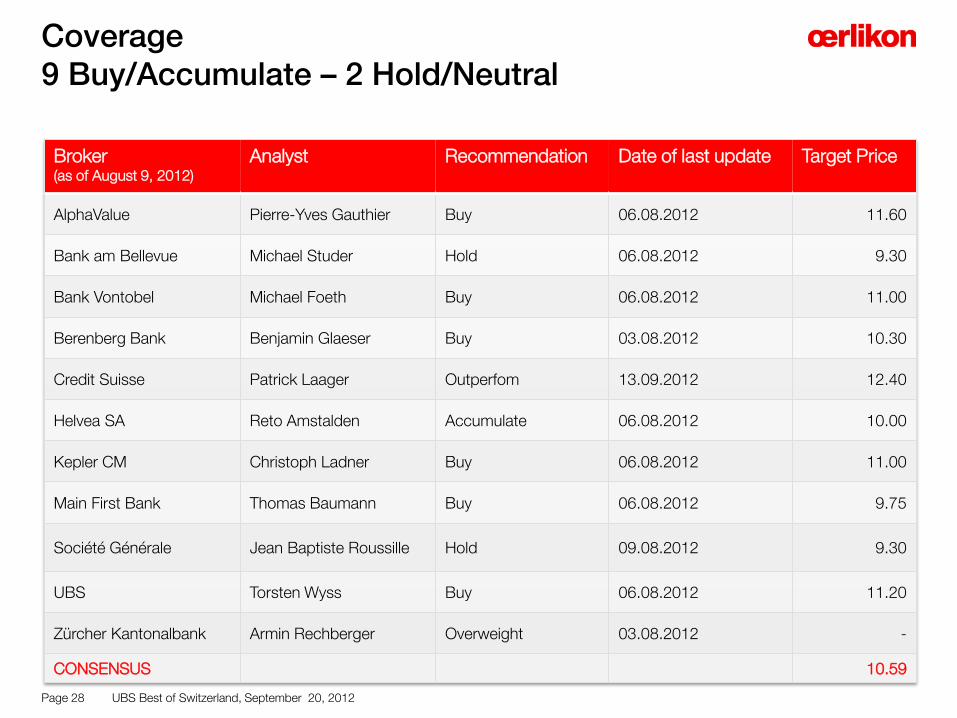
Coverage 9 Buy/Accumulate – 2 Hold/Neutral
Page 28
Broker (as of August 9, 2012)
Analyst Recommendation Date of last update
Target Price
AlphaValue Pierre-Yves Gauthier Buy 06.08.2012 11.60
Bank am Bellevue Michael Studer Hold 06.08.2012 9.30
Bank Vontobel Michael Foeth Buy 06.08.2012 11.00
Berenberg Bank Benjamin Glaeser Buy 03.08.2012 10.30
Credit Suisse Patrick Laager Outperfom 13.09.2012 12.40
Helvea SA Reto Amstalden Accumulate 06.08.2012 10.00
Kepler CM Christoph Ladner Buy 06.08.2012 11.00
Main First Bank Thomas Baumann Buy 06.08.2012 9.75
Société Générale Jean Baptiste Roussille Hold 09.08.2012 9.30
UBS Torsten Wyss Buy 06.08.2012 11.20
Zürcher Kantonalbank Armin Rechberger Overweight 03.08.2012 -
CONSENSUS 10.59
UBS Best of Switzerland, September 20, 2012

Financial Calendar 2012
Page 29
March 5, 2012 FY results 2011 and publication of Annual Report 2011 - Media & Analyst Conference, Zurich
April 12, 2012 Annual General Meeting of Shareholders - Lucerne
April 30, 2012
Q1 results - Analyst Conference Call
August 3, 2012 Q2 results and publication of Interim Report 2012 - Media & Analyst Conference Call
October 30, 2012 Q3 results - Analyst Conference Call
UBS Best of Switzerland, September 20, 2012

Key figures by Segment Q2 2012
Order intake Δ to Q2 2011
Order backlog Δ to Q2 2011
Sales* Δ to Q2 2011
EBIT % of sales
in CHF m Vacuum
92 -7 %
79 -9 %
93 -13 %
10 11.0 %
Page 30
Textile
496 -13 %
1 012 -24 %
520 -
55 10.5 %
Coating
126 7 %
n/a
126 7 %
27 21.0 %
Adv.Tech.
29 26 %
26 4 %
26 -32 %
- n/a
Drive
213 -5 %
202 +31 %
225 7 %
21 9.2 %
**restated
Group**
956 -7 %
1 319 -18 %
990 -
115 11.7 %
* Sales to third parties
UBS Best of Switzerland, September 20, 2012
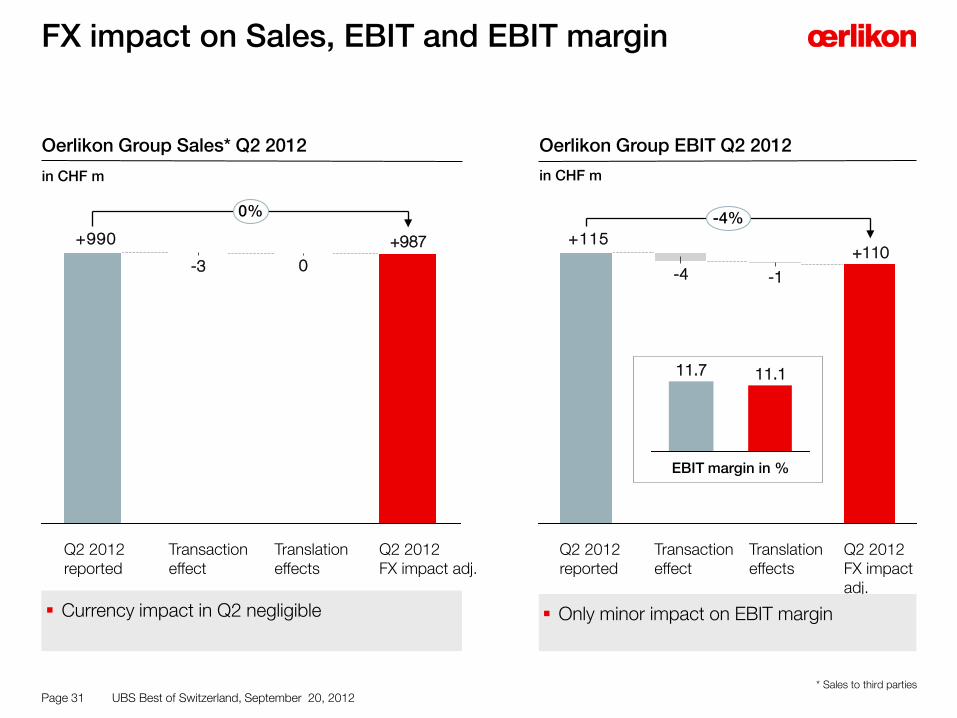
FX impact on Sales, EBIT and EBIT margin
Page 31
0
+990
0%
Q2 2012 FX impact adj.
+987
Translation effects
Transaction effect
-3
Q2 2012 reported
Oerlikon Group Sales* Q2 2012
in CHF m
Oerlikon Group EBIT Q2 2012
in CHF m
+115-4%
Q2 2012 FX impact adj.
+110
Translation effects
-1
Transaction effect
-4
Q2 2012 reported
11.1 11.7
Currency impact in Q2 negligible Only minor impact on EBIT margin
EBIT margin in %
* Sales to third parties UBS Best of Switzerland, September 20, 2012

Oerlikon benefits from growth opportunities worldwide
Asian markets fueled sales up by 14 % followed by North America up by 11 %
BRIC opportunities should create better balance of geographical diversification
Sales* by market region Q2 2012 Sales* by market region Q2 2011
Europe
Asia/Pacific
Other regions
North America
Europe
Asia/Pacific
Other regions
North America
Sales by region Sales share of Asia increased to 42 %
Page 32 * Sales to third parties
(continuing operations) (restated)
UBS Best of Switzerland, September 20, 2012

Oerlikon Group key figures HY 2012
in CHF m
Page 33
Order intake 1 952 2 159 –10 %
Order backlog 1 319 1 605 –18 %
Sales* 1 951 1 900 +3 %
EBITDA (incl. one-time effect property sale Arbon) % of sales
343 17.6 %
276 14.5 %
+24 %
Result from continuing operations % of sales
183 9.4 %
98 5.2 %
+87 %
HY 2011 (restated) Δ
2 217 2 108** +5 % Net Operating Assets (incl. goodwill and brands)
EBIT (incl. one-time effect property sale Arbon) % of sales
267 13.7 %
199 10.5 %
+34 %
Cash flow from operating activities before changes in net current assets
205 250 -18 %
HY 2012 (cont. op.)
**December 31, 2011
* Sales to third parties
UBS Best of Switzerland, September 20, 2012

Oerlikon increased profitability
Result before interest and taxes (EBIT) in % of sales
Financial result
Result before taxes (EBT) in % of sales
Income taxes
in % of EBT
Result from continuing operations in % of sales
in CHF m HY 2011* HY 2012
199 10.5 %
-54
145 7.6 %
-47 32.4 %
Δ
+34 %
n/a
+78 %
n/a
Page 34
98 5.2 %
+87 %
267 13.7 %
-9
258 13.2 %
-75 29.1 %
183 9.4 %
* restated
UBS Best of Switzerland, September 20, 2012

Consolidated Cash Flow Statement HY 2012
624
205
742
Cash and cash equivalents at the end of the period*
-118
Translation adjustments to cash and cash equivalents
Financing activities
3
-266
Investing activities
25
Changes in net current assets
-85
Operating activities before changes in net current assets
Cash and cash equivalents at the beginning of the period*
145 Operating Free Cash Flow
CAPEX PP&E -64 CAPEX intangibles -10 Purchase of financial investments -2 Proceeds from sale of financial investm. 54 Proceeds from sale of PP&E 39 Interest received 8 Total 25
in CHF m
Dividends paid -66 Interest paid -26 Repayment of financial debt -164 Other -10 Total -266
Receivables -20 Inventories -44 Payables/liabilities -85 Customer advances 64 Total -85
Page 35
* includes cash and cash equivalents included in “assets classified as held for sale” in the balance sheet
UBS Best of Switzerland, September 20, 2012

Dividend policy and dividend for 2011 Dividend yield of 4 %
Page 36
Dividend policy to pay out up to 40 % of net profit
AGM approved to pay out CHF 0.20 per share for 2011
0.27
0.68
Up to 40 % of net profit Net profit per share 2011
0.20
0.27
Max. pay-out Dividend proposal
Dividend distributed from the reserve from capital contribution
Dividend yield of 4 % based on a share price of CHF 5.03 at year-end 2011
UBS Best of Switzerland, September 20, 2012
Investor Relations Contact
Page 37
OC Oerlikon Management AG Churerstrasse 120 CH-8808 Pfäffikon SZ Switzerland Andreas Schwarzwälder Head of Investor Relations Phone: +41-58-360-9622 Mobile: +41-79-810-8211 E-mail: [email protected]
UBS Best of Switzerland, September 20, 2012

Oerlikon has made great efforts to include accurate and up-to-date information in this document. However, we make no representation or warranties, expressed or implied, as to the accuracy or completeness of the information provided in this document and we disclaim any liability whatsoever for the use of it. This presentation is based on information currently available to management. The forward-looking statements contained herein could be substantially impacted by risks and influences that are not foreseeable at present, so that actual results may vary materially from those anticipated, expected or projected. Oerlikon is under no obligation to (and expressly disclaims any obligation to) update or alter its forward-looking statements, whether as a result of new information, future events or otherwise. All information provided in this document is not intended as, and may not be construed as, an offer or solicitation for the purchase or disposal, trading or any transaction in any Oerlikon securities. Investors must not rely on this information for investment decisions.
Disclaimer
Page 38 UBS Best of Switzerland, September 20, 2012
Related Documents