Voting Behavior Among College Students October 2010 This brief report uses data from two Cooperative Institutional Research Program (CIRP) surveys, the 2009 Your First College Year (YFCY) survey and the 2009 College Senior Survey (CSS), to examine voting behavior among students who were first-years and seniors in the fall of 2008. It also examines how students’ background characteristics, self-identified political orientations, and civic awareness propensities relate to their voting behavior. VOTER TURNOUT IN THE 2008 PRESIDENTIAL ELECTION The right to vote is one of the most fundamental American rights, and in the 2008 presidential election the majority of Americans exercised this right and cast a ballot at the polls. Indeed, approximately 131 million Americans voted in the 2008 Presidential election; this represents 64% of those eligible to vote, the highest voter turnout since the 1960’s (McDonald, 2008). Turnout among young voters was no exception; the rate of voting among youth was one of the highest ever recorded. According to estimates from the Center for Information and Research on Civic Learning and Engagement (CIRCLE) at Tufts University, half— 51%—of Americans between ages 18-29 cast votes Although studies have shown that people with higher levels of education have higher rates of political participation (Burden, 2009), little is known about voting behavior among students currently in college. 2008 FIRST-YEAR AND SENIOR VOTING-ELIGIBLE STUDENTS The analyses in this report are limited to students who could be identified as “voting eligible,” defined as being 18 or older and a U.S. citizen. For the YFCY, the sample utilized all first-time full-time freshmen who indicated that they were 18 years old and U.S. citizens. For the CSS, the sample was restricted to all seniors graduating in four years who were U.S. Citizens (all of these students were over age 18). In total, the voting-eligible respondent pool consisted of 19,977 first-year students, and 12,766 graduating seniors. The majority of students in each sample were enrolled at private institutions, most were at 4-year schools, and most were at institutions of high selectivity. Three-quarters or more of the respondents were white, and the majority were female. 75.3 71.5 77.1 77.2 59.6 75.2 72.5 81.4 77.1 84.0 82.5 66.9 85.6 82.5 0 20 40 60 80 100 Overall Men Women White Asian Black Latino/a Figure 1: Percent of students voting in the 2008 presidential election First-Year (YFCY) Senior (CSS) National Average for 18-29 year olds* *Source: Lopez & Taylor, 2009 and CIRCLE, 2008 in the 2008 election (Kirby & Kawashima-Ginsberg, 2009).

Welcome message from author
This document is posted to help you gain knowledge. Please leave a comment to let me know what you think about it! Share it to your friends and learn new things together.
Transcript
Voting Behavior Among College StudentsOctober 2010
This brief report uses data from two Cooperative Institutional Research Program (CIRP) surveys, the 2009 Your First College Year (YFCY) survey and the 2009 College Senior Survey (CSS), to examine voting behavior among students who were first-years and seniors in the fall of 2008. It also examines how students’ background characteristics, self-identified political orientations, and civic awareness propensities relate to their voting behavior.
VOTER TURNOUT IN THE 2008 PRESIDENTIAL ELECTIONThe right to vote is one of the most fundamental American rights, and in the 2008 presidential election the majority of Americans exercised this right and cast a ballot at the polls. Indeed, approximately 131 million Americans voted in the 2008 Presidential election; this represents 64% of those eligible to vote, the highest voter turnout since the 1960’s (McDonald, 2008). Turnout among young voters was no exception; the rate of voting among youth was one of the highest ever recorded. According to estimates from the Center for Information and Research on Civic Learning and Engagement (CIRCLE) at Tufts University, half—51%—of Americans between ages 18-29 cast votes
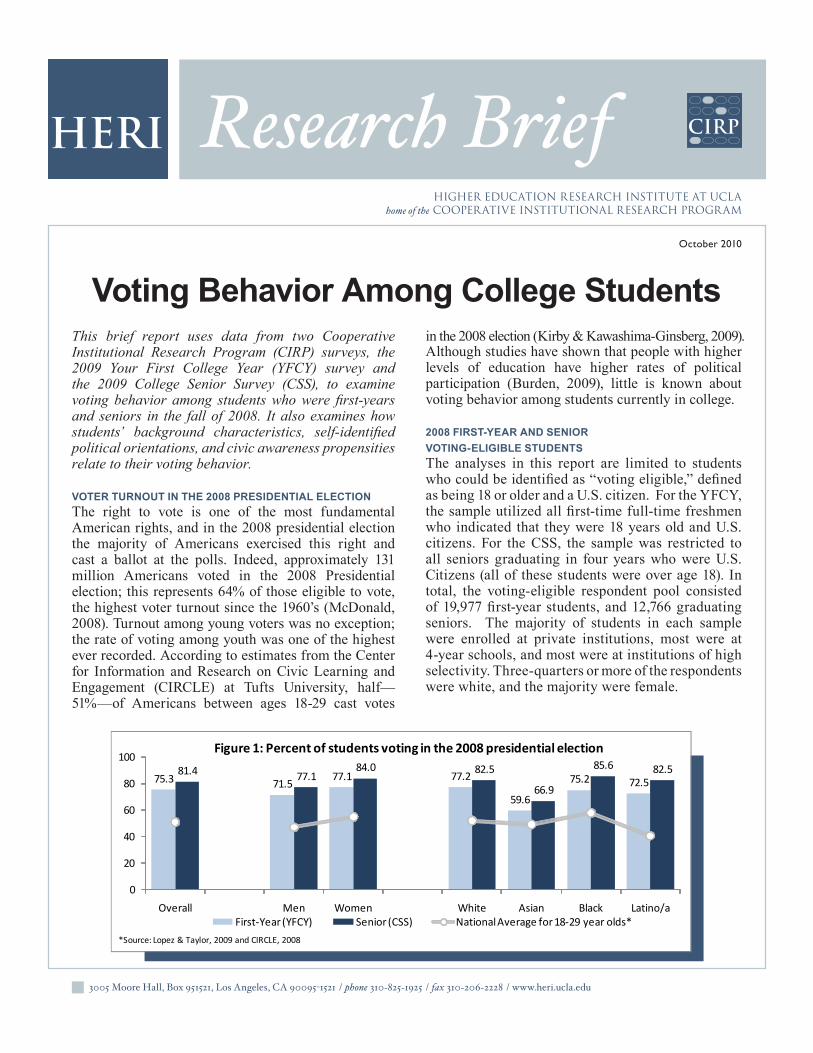
Although studies have shown that people with higher levels of education have higher rates of political participation (Burden, 2009), little is known about voting behavior among students currently in college. 2008 FIRST-YEAR AND SENIOR VOTING-ELIGIBLE STUDENTSThe analyses in this report are limited to students who could be identified as “voting eligible,” defined as being 18 or older and a U.S. citizen. For the YFCY, the sample utilized all first-time full-time freshmen who indicated that they were 18 years old and U.S. citizens. For the CSS, the sample was restricted to all seniors graduating in four years who were U.S. Citizens (all of these students were over age 18). In total, the voting-eligible respondent pool consisted of 19,977 first-year students, and 12,766 graduating seniors. The majority of students in each sample were enrolled at private institutions, most were at 4-year schools, and most were at institutions of high selectivity. Three-quarters or more of the respondents were white, and the majority were female.
75.3 71.577.1 77.2
59.6
75.2 72.581.4 77.1
84.0 82.5
66.9
85.6 82.5
0
20
40
60
80
100
Overall Men Women White Asian Black Latino/a
Figure 1: Percent of students voting in the 2008 presidential election
First-Year (YFCY) Senior (CSS) National Average for 18-29 year olds*
*Source: Lopez & Taylor, 2009 and CIRCLE, 2008
in the 2008 election (Kirby & Kawashima-Ginsberg, 2009).
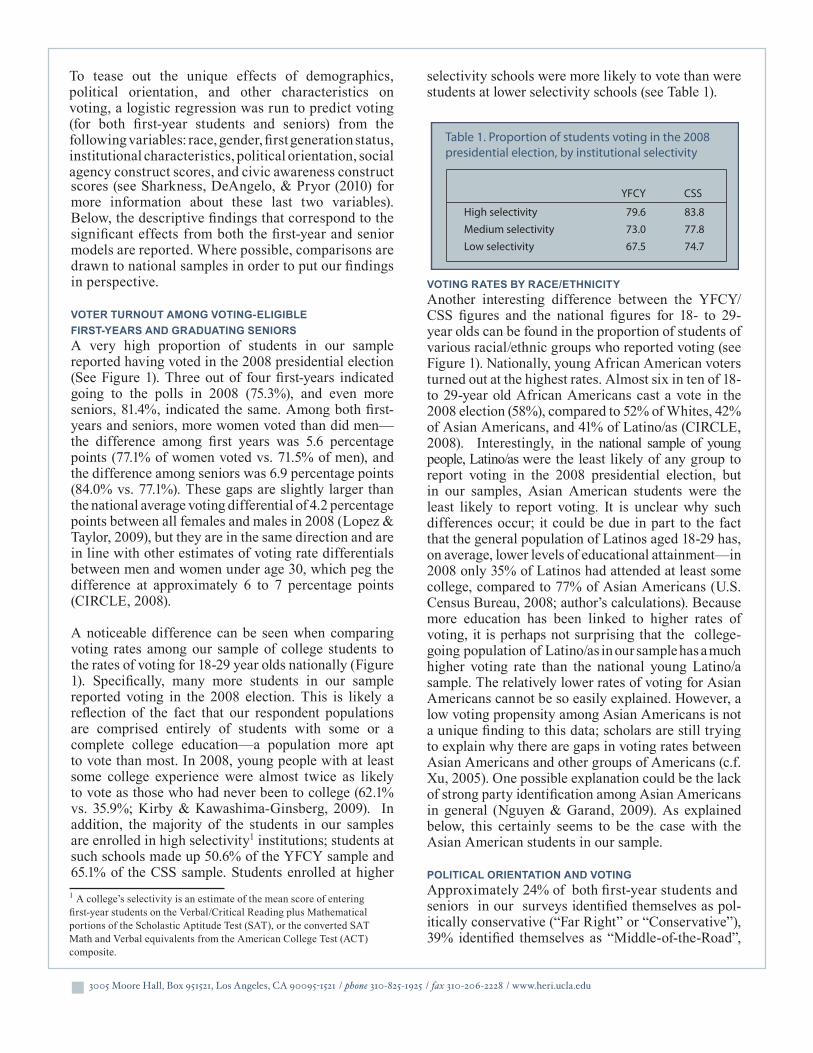
Table 1. Proportion of students voting in the 2008 presidential election, by institutional selectivity
YFCY CSS
High selectivity 79.6 83.8Medium selectivity 73.0 77.8Low selectivity 67.5 74.7
To tease out the unique effects of demographics, political orientation, and other characteristics on voting, a logistic regression was run to predict voting (for both first-year students and seniors) from the following variables: race, gender, first generation status, institutional characteristics, political orientation, social agency construct scores, and civic awareness construct scores (see Sharkness, DeAngelo, & Pryor (2010) for more information about these last two variables). Below, the descriptive findings that correspond to the significant effects from both the first-year and senior models are reported. Where possible, comparisons are drawn to national samples in order to put our findings in perspective.
VOTER TURNOUT AMONG VOTING-ELIGIBLE FIRST-YEARS AND GRADUATING SENIORSA very high proportion of students in our sample reported having voted in the 2008 presidential election (See Figure 1). Three out of four first-years indicated going to the polls in 2008 (75.3%), and even more seniors, 81.4%, indicated the same. Among both first-years and seniors, more women voted than did men—the difference among first years was 5.6 percentage points (77.1% of women voted vs. 71.5% of men), and the difference among seniors was 6.9 percentage points (84.0% vs. 77.1%). These gaps are slightly larger than the national average voting differential of 4.2 percentage points between all females and males in 2008 (Lopez & Taylor, 2009), but they are in the same direction and are in line with other estimates of voting rate differentials between men and women under age 30, which peg the difference at approximately 6 to 7 percentage points (CIRCLE, 2008).
A noticeable difference can be seen when comparing voting rates among our sample of college students to the rates of voting for 18-29 year olds nationally (Figure 1). Specifically, many more students in our sample reported voting in the 2008 election. This is likely a reflection of the fact that our respondent populations are comprised entirely of students with some or a complete college education—a population more apt to vote than most. In 2008, young people with at least some college experience were almost twice as likely to vote as those who had never been to college (62.1% vs. 35.9%; Kirby & Kawashima-Ginsberg, 2009). In addition, the majority of the students in our samples are enrolled in high selectivity1 institutions; students at such schools made up 50.6% of the YFCY sample and 65.1% of the CSS sample. Students enrolled at higher
selectivity schools were more likely to vote than were students at lower selectivity schools (see Table 1).
VOTING RATES BY RACE/ETHNICITY Another interesting difference between the YFCY/CSS figures and the national figures for 18- to 29-year olds can be found in the proportion of students of various racial/ethnic groups who reported voting (see Figure 1). Nationally, young African American voters turned out at the highest rates. Almost six in ten of 18- to 29-year old African Americans cast a vote in the 2008 election (58%), compared to 52% of Whites, 42% of Asian Americans, and 41% of Latino/as (CIRCLE, 2008). Interestingly, in the national sample of young people, Latino/as were the least likely of any group to report voting in the 2008 presidential election, but in our samples, Asian American students were the least likely to report voting. It is unclear why such differences occur; it could be due in part to the fact that the general population of Latinos aged 18-29 has, on average, lower levels of educational attainment—in 2008 only 35% of Latinos had attended at least some college, compared to 77% of Asian Americans (U.S. Census Bureau, 2008; author’s calculations). Because more education has been linked to higher rates of voting, it is perhaps not surprising that the college-going population of Latino/as in our sample has a much higher voting rate than the national young Latino/a sample. The relatively lower rates of voting for Asian Americans cannot be so easily explained. However, a low voting propensity among Asian Americans is not a unique finding to this data; scholars are still trying to explain why there are gaps in voting rates between Asian Americans and other groups of Americans (c.f. Xu, 2005). One possible explanation could be the lack of strong party identification among Asian Americans in general (Nguyen & Garand, 2009). As explained below, this certainly seems to be the case with the Asian American students in our sample.
POLITICAL ORIENTATION AND VOTINGApproximately 24% of both first-year students andseniors in our surveys identified themselves as pol-itically conservative (“Far Right” or “Conservative”), 39% identified themselves as “Middle-of-the-Road”,
1 A college’s selectivity is an estimate of the mean score of entering first-year students on the Verbal/Critical Reading plus Mathematical portions of the Scholastic Aptitude Test (SAT), or the converted SAT Math and Verbal equivalents from the American College Test (ACT) composite.
among seniors, only 60.5% of Asian middle-of-the-road identifiers voted compared to 65% or more of all groups except Asian conservatives, who voted as the same rate as their middle-of-the-road counterparts.
CIVIC ENGAGEMENT PROPENSITIES AND VOTINGStudents who voted in the 2008 presidential election were more likely to exhibit civic awareness propensities than were students who did not vote. For example, students with high levels of social agency, a measure of the extent to which students value political and social involvement as a personal goal, were more likely to vote than were students with low levels of this measure, and the same was true of students who reported more change in their civic awareness—their understanding of the issues facing their community, nation, and the world—over the course of their college careers. Although it is not surprising that voting rates are highest among students who value knowing about the world and who believe more strongly in being politically and socially involved, it is remarkable that even students with low levels of these traits have higher voting rates than the national average (Figure 3).
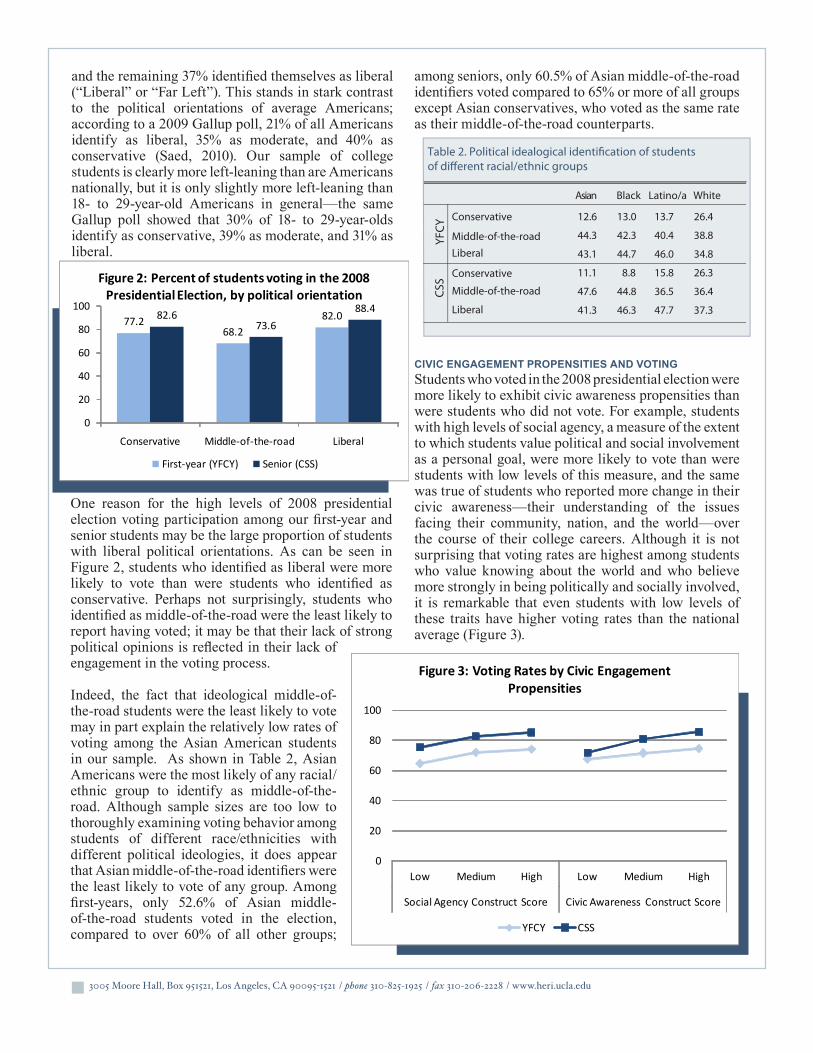
One reason for the high levels of 2008 presidential election voting participation among our first-year and senior students may be the large proportion of students with liberal political orientations. As can be seen in Figure 2, students who identified as liberal were more likely to vote than were students who identified as conservative. Perhaps not surprisingly, students who identified as middle-of-the-road were the least likely to report having voted; it may be that their lack of strong political opinions is reflected in their lack of engagement in the voting process.
Indeed, the fact that ideological middle-of-the-road students were the least likely to vote may in part explain the relatively low rates of voting among the Asian American students in our sample. As shown in Table 2, Asian Americans were the most likely of any racial/ethnic group to identify as middle-of-the-road. Although sample sizes are too low to thoroughly examining voting behavior among students of different race/ethnicities with different political ideologies, it does appear that Asian middle-of-the-road identifiers were the least likely to vote of any group. Among first-years, only 52.6% of Asian middle-of-the-road students voted in the election, compared to over 60% of all other groups;
and the remaining 37% identified themselves as liberal (“Liberal” or “Far Left”). This stands in stark contrast to the political orientations of average Americans; according to a 2009 Gallup poll, 21% of all Americans identify as liberal, 35% as moderate, and 40% as conservative (Saed, 2010). Our sample of college students is clearly more left-leaning than are Americans nationally, but it is only slightly more left-leaning than 18- to 29-year-old Americans in general—the same Gallup poll showed that 30% of 18- to 29-year-olds identify as conservative, 39% as moderate, and 31% as liberal.
Table 2. Political idealogical identification of students of different racial/ethnic groups
Asian Black Latino/a White
Conservative 12.6 13.0 13.7 26.4
Middle-of-the-road 44.3 42.3 40.4 38.8
Liberal 43.1 44.7 46.0 34.8
11.1 8.8 15.8 26.3Conservative
47.6 44.8 36.5 36.4Middle-of-the-road
41.3 46.3 47.7 37.3Liberal
YFCY
CSS
0
20
40
60
80
100
Low Medium High Low Medium High
Social Agency Construct Score Civic Awareness Construct Score
Figure 3: Voting Rates by Civic Engagement Propensities
YFCY CSS
77.268.2
82.082.673.6
88.4
0
20
40
60
80
100
Conservative Middle-of-the-road Liberal
Figure 2: Percent of students voting in the 2008 Presidential Election, by political orientation
First-year (YFCY) Senior (CSS)
higher education research institute
Research DirectorsSylvia Hurtado, HERI DirectorJohn H. Pryor, CIRP DirectorSerge Tran, Associate Director for Data Management/AnalysisLinda DeAngelo, CIRP Assistant Director for ResearchLaura Palucki Blake, CIRP Assistant DirectorMelissa C. Aragon, Special Projects Manager
Affiliated ScholarsWalter R. Allen, Allan Murray Cartter Professor of Higher EducationAlexander W. Astin, Founding Director and Senior ScholarHelen S. Astin, Senior ScholarMitchell J. Chang, ProfessorPatricia M. McDonough, ProfessorJosé Luis Santos, Assistant ProfessorLinda J. Sax, Associate ProfessorRick Wagoner, Assistant ProfessorVictor B. Sáenz, Assistant Professor, University of Texas at Austin
References Burden, B. (2009). The dynamic effects of education on voter turnout.
Electoral Studies, 28, 540-549.Center for Information & Research on Civic Learning & Engagement
(CIRCLE). (2008). Trends by Race, Ethnicity and Gender. Medford, MA: Tufts University Tisch College of Citizenship and Public Service. Accessed online on 9 February, 2010 from http://www.civicyouth.org/?page_id=235
Kirby, E.H & Kawashima-Ginsberg, K. (2009). CIRCLE Fact Sheet: The youth vote in 2008. Medford, MA: Tufts University Tisch College of Citizenship and Public Service. Accessed online on 9 February, 2010 from http://www.civicyouth.org/PopUps/FactSheets/FS_youth_Voting_2008_updated_6.22.pdf
Lopez, M.H. & Taylor, P. (2009, April 30). Dissecting the 2008 electorate: Most diverse in U.S. history. Pew Research Center, Washington, D.C.
McDonald, M. (2008). The return of the voter: Voter turnout in the 2008 Presidential Election. The Forum, 6(4), Article 4.
Nguyen, N.K. & Garand, J.C. (2009). Partisan strength and nonpartisanship among Asian Americans. American Politics Research, 37(3), 375-408.
Saed, L. (2010, June 15). “Conservatives” are Single-Largest Ideological Group. Princeton, NJ: Gallup, Inc. Accessed online on 15 October, 2010 at http://www.gallup.com/poll/120857/Conservatives-Single-Largest-Ideological-Group.aspx
Sharkness, J., DeAngelo, L. & Pryor, J. (2010). CIRP Construct Technical Report. University of California, Los Angeles: Higher Education Research Institute. Accessed online on 15 October, 2010 at http://www.heri.ucla.edu/PDFs/constructs/technicalreport.pdf
U.S. Census Bureau. (2008). Current Population Survey, 2008 Annual Social and Economic Supplement (Tables 1-Asian Alone and 1-Hispanic of Any Race). Internet Release date: April 2009. Accessed online on 10 February, 2010 at http://www.census.gov/population/www/socdemo/education/cps2008.html
Xu, J. (2005). Why do minorities participate less? The effects of immigration, education, and electoral process on Asian American voter registration and turnout. Social Science Research, 34, 682-702.
CONCLUSIONOverall, college students, both first-time, full-time first-years and graduating seniors, had a high voting rate in the 2008 presidential election. Indeed, far more of these students voted than did their age group at large. In part this may be due to the fact that the college student population examined here is comprised largely of females, students at high-selectivity institutions, and White/Caucasians, since these are the students who are most likely to vote. However, the rates of voting for males, students at lower-selectivity institutions, and students of non-white race/ethnicities were still much higher than national averages. Indeed, the lowest estimate of voting behavior examined here—that of Asian students who identified as politically middle-of-the-road—was still higher than the national average voting rate for students aged 18 to 29.
Although concerns are often raised about a lack of political engagement among young people, such concerns do not seem to apply to the enrolled college students examined in this report. However, the numbers cited here should not cause us to be complacent about college students’ voting participation in the future. The 2008 presidential election was historic and unique in many ways, and there is no guarantee that college students will continue to vote in the future at the same levels as they did in the past.
Related Documents