ABSTRACT Title of Dissertation: ETHNIC POLITICS AND URBAN VOTING BEHAVIOR IN INDIA: EXPLAINING VARIATION IN ELECTORAL SUPPORT FOR THE BHARATIYA JANATA PARTY, 1999-2009 Allison Berland Kaul, Doctor of Philosophy, 2013 Directed By: Professor Margaret Pearson Department of Government and Politics This dissertation focuses on urban voting behavior in India, and explores the factors affecting voter support for the Bharatiya Janata Party (BJP), one of two major parties in India, and the only ethnic party that competes at the national level. How do we understand the rise of this ethnic party to become the second most electorally successful party in India? Why do voters vote for this ethnic party, which has been linked in the past with episodes of ethnic violence? Existing explanations have focused on ethnic factors or programmatic factors to explain voter support for the BJP. I argue that there is a need to understand the way in which both ethnic interests and programmatic interests explain voter support for the BJP. This dissertation puts forward a theory of voting behavior, Ethnically Mediated Retrospective Voting (ERV), which posits the conditions under which ethnic interests and programmatic interests influence voters’ political choices, as a means of explaining the nature of voter support for an ethnic party.

Welcome message from author
This document is posted to help you gain knowledge. Please leave a comment to let me know what you think about it! Share it to your friends and learn new things together.
Transcript

ABSTRACT Title of Dissertation: ETHNIC POLITICS AND URBAN VOTING
BEHAVIOR IN INDIA: EXPLAINING VARIATION IN ELECTORAL SUPPORT FOR THE BHARATIYA JANATA PARTY, 1999-2009
Allison Berland Kaul, Doctor of Philosophy, 2013 Directed By: Professor Margaret Pearson
Department of Government and Politics
This dissertation focuses on urban voting behavior in India, and explores the
factors affecting voter support for the Bharatiya Janata Party (BJP), one of two major
parties in India, and the only ethnic party that competes at the national level.
How do we understand the rise of this ethnic party to become the second most
electorally successful party in India? Why do voters vote for this ethnic party, which has
been linked in the past with episodes of ethnic violence? Existing explanations have
focused on ethnic factors or programmatic factors to explain voter support for the BJP.
I argue that there is a need to understand the way in which both ethnic interests
and programmatic interests explain voter support for the BJP. This dissertation puts
forward a theory of voting behavior, Ethnically Mediated Retrospective Voting (ERV),
which posits the conditions under which ethnic interests and programmatic interests
influence voters’ political choices, as a means of explaining the nature of voter support
for an ethnic party.

ERV theorizes the way in which changes in the level of ethnic conflict influences
the political salience of ethnic interests, and changes resulting from economic growth and
economic reforms influences programmatic demands by voters. The mechanisms of ERV
together posit different generalized scenarios of voting behavior to explain voter support
for an ethnic party in different socio-economic conditions.
The theory is tested through an investigation of urban voting behavior in two
locations, Delhi and Gujarat, across three national elections (1999, 2004 and 2009), and
includes over 70 interviews of voters in the cities of Ahmedabad and New Delhi.
This study finds that ethnic interests and retrospective programmatic interests are
both important factors in explaining voter support for the BJP over space and time. Under
conditions of a high level of perceived ethnic conflict, ethnic interests increase in salience
in voters’ political choices. Second, under conditions of strong economic growth,
programmatic demands increase in salience in voters’ political choices. As a result,
different socio-economic conditions impact the relative influence of ethnic and
programmatic interests in explaining overall voter support for an ethnic party.
Through an examination of the way in which both ethnic interests and
programmatic influence explain voter support for the Bharatiya Janata party, this
dissertation broadens our understanding of voting behavior and the factors influencing
voter support for an ethnic party in a rapidly developing country context.

ETHNIC POLITICS AND URBAN VOTING BEHAVIOR IN INDIA: EXPLAINING VARIATION IN ELECTORAL SUPPORT FOR THE
BHARATIYA JANATA PARTY, 1999-2009
By
Allison Berland Kaul
Dissertation submitted to the Faculty of the Graduate School of the University of Maryland, College Park, in partial fulfillment
of the requirements for the degree of Doctor of Philosophy
2013 Advisory Committee: Professor Margaret Pearson, Chair Professor Jóhanna Kristín Birnir Professor Ken Conca Professor Karen Kaufmann Professor Karol Soltan Professor Reeve Vanneman, Dean’s Representative

© Copyright by Allison Berland Kaul
2013
ii
PrefaceandAcknowledgements
Life sometimes follows the path of circles not lines, a supervisor of mine often
used to say. At the time, I was working in international development on a program
focusing on water resource management initiatives aimed to build cooperation through
joint development initiatives and reduce conflict among historically contentious African
states.
To understand how I came from a professional background working on water
politics, development, and conflict management, to write a dissertation on ethnic politics
and voting behavior, can perhaps be explained best by the path of circles.
The roots of my interest in the topic of ethnic politics and conflict can be traced
back to my years as an undergraduate in college in the early 1990s. As a religion major at
Reed College, I was deeply interested and concerned about the ethnic nationalist politics
exploding in the Balkans.
Shortly after, tragedy occurred in Rwanda in 1994, when Hutus massacred
hundreds of thousands of Tutsis. A few years later, in 1998, I interviewed Dr. Howard
Wolpe, who was President Clinton’s Special Envoy to the African Great Lakes Region,
for an article in Reed College Magazine. Wolpe believed that one of the great tragedies of
Rwanda is that, at one point, Hutus and Tutsis lived together but that, “under conditions
of extreme poverty, a dense population, and severe land shortages, competition for
control of the state became fierce,” leading to genocidal mass slaughter.

iii
My interest in ethnic politics and ethnic conflict led me to an internship at the
Brookings Institution, where I provided background research assistance for a book on
globalization and ethnic conflict written by Dr. Yahya Sadowski.
Upon entering a master’s program in international relations, it was through my
interest in the politics of deeply divided societies that I begin to look at the strategic role
of water resources as a means of conflict or cooperation between contentious states. I
wrote my master’s thesis on the water component of the Middle East conflict and the
peace process initiated in Madrid. This was to be my focus both academically and
professionally for eight years.
My first trip to India came in 2006 right before entering the doctoral program. An
initial dissertation topic of consideration drew from my abiding interest in water politics
and management, in the context of rapid economic development in India. Yet, it was my
earlier interest in ethnic politics, combined with a deep fascination in Indian electoral
politics in the world’s largest democracy, and specifically understanding the rise and
popularity of the Bharatiya Janata Party, which came to the forefront and would not let
go.
In a democratic country constitutionally mandating secular politics, how do we
understand the rise of an ethnic party to become the second most electorally successful
party in India? More specifically, why do voters vote for this ethnic party, which has
been linked to several episodes of ethnic violence? Common explanations focus on ethnic
factors such as religion or caste. Other explanations focus on programmatic factors such
as concerns about corruption or development. After the recent 2009 national election, one
iv
Indian politics scholar, Tariq Thachil, emphasized the need to examine both the role of
ethnic identity and programmatic factors in the study of voting behavior in India.
How do ethnic and programmatic interests factor into explaining variation in
voter support for an ethnic party such as the Bharatiya Janata Party? What conditions
increase the salience of ethnic interests in voters’ political choices? Alternatively, what
conditions increase the salience of programmatic interests in voters’ political choices?
These are the driving questions underlying this research project.
Completing this dissertation has been a challenge and reward, and I am thankful
and honored to have worked with and learned from many dedicated, inspiring individuals
along the way. I would like to begin by thanking two people who have provided a level of
mentorship, which both includes and exceeds this dissertation.
Professor Ken Conca was my first mentor upon entering the doctoral program in
the Department of Government and Politics. Over the course of many meetings and
discussions, Professor Conca provided academic mentoring that served as the foundation
for my development as a scholar. I have greatly appreciated his practical guidance and
wisdom.
During my second year of the doctoral program, I took a Comparative Politics
course with Professor Margaret Pearson. Shortly thereafter, I began to conceive what
would become this dissertation project. Professor Conca provided critical feedback on the
proposal development. Along the way, it became evident that the evolution and nature of
the dissertation project would greatly benefit from a comparativist’s perspective. This led
me to my second mentor, Professor Margaret Pearson.

v
Through the journey from proposal development, fieldwork, and the long march
of dissertation writing, Professor Pearson’s commitment to academic rigor and steadfast
support, have been a constant guide, encouraging me forward toward completion. I am
honored to have Professor Pearson as my dissertation chair.
I would like to thank the members of my dissertation committee for all of their
guidance, feedback and expertise. Professor Karen Kaufmann, through her deep
knowledge of voting behavior, and Professor Jóhanna Birnir, through her expertise in
ethnicity and electoral politics, have provided critical guidance throughout the
development of this dissertation. I am grateful for their ongoing support.
I met Professor Karol Soltan during my first year of the doctoral program in the
Scope and Methods seminar, and later had the good fortune to take his Political Economy
seminar, which has greatly informed my academic worldview. I am fortunate to have him
on my committee.
A scholar with expertise and experience working in India, I am thankful for
Professor Reeve Vanneman’s participation on my committee as the Dean’s
Representative.
My fieldwork in India would not have been possible without the help from several
individuals, and the institutional support from the Centre for the Study of Developing
Societies, under the supervision of Sanjay Kumar.
Sanjayji’s knowledge of Indian politics and voting behavior is astonishing. Over
the course of my stay at CSDS, he became a colleague and friend whose contribution to
the study of Indian politics I deeply admire. I am thankful to have had the opportunity to

vi
work with him at CSDS and given the opportunity to conduct analysis of the institute’s
unique national election survey data.
Before leaving for India, I had the good fortune to meet and work with fellow
doctoral student, Dan Biggers, who I secretly call the “statistics guru.” With seemingly
endless patience, Dan provided immense help to me in thinking about how to model the
Indian national election survey data. For this I am eternally grateful.
During my time as CSDS, I came to know and become friends with Rahul Verma,
whose passion and knowledge led to many interesting conversations, and a deeper
appreciation for the masala of Indian politics. My case study field work in New Delhi
and Ahmedabad could not have been possible without the excellent research assistance of
Alia Zaman and Bhoomi Shroff. Alia and I worked together as a research team in New
Delhi, while Bhoomi and I worked together in Ahmedabad. I am thankful for their
contributions to this dissertation.
I would also like to thank Sunit Madhur, Swadesh Singh, Dhananjai Joshi,
Mahashweta Jani, Raheel Dhattiwala, Achin Vanaik, Shekhar Gupta, Harin Pathak
(Member of Parliament, Ahmedabad), and Sandeep Dixit (Member of Parliament, Delhi),
for talking with me and sharing their unique insights about the BJP and politics in India.
I am deeply grateful to have met and interviewed the people in New Delhi and
Ahmedabad for the case studies. Though their names remain anonymous, each of their
stories remain forever imprinted in my memory.
I am especially thankful for the institutional support and funding from the
Department of Government and Politics. In particular, I have been fortunate through the

vii
department’s funding support in the form of an assistantship position to work as an ENSP
Politics & Policy Advisor.
The department’s Comparative Politics workshop provided a unique opportunity
to receive comments and suggestions early in the writing process on two dissertation
chapters. I thank Professor Joel Simmons and others at the workshop for their useful
feedback. Professor Virginia Haufler patiently read a very early draft of the dissertation
proposal in the context of an independent study focusing on the political economy of
conflict and development. Additional conversations with Professors Ric Uslaner, Dan
Corstange, Ernesto Calvo, Mike Hanmer, Geoff Layman, Peter White, and Mark
Lichbach were greatly appreciated.
Outside of my department, I was fortunate to get to know and learn from
Professor Walter Andersen, the Director of the South Asia Studies Program at the Johns
Hopkins School of Advanced International Studies. A graduate course with Dr. Andersen
on the Comparative Politics of South Asia was my scholarly entryway into the study of
Indian politics.
I have benefited greatly from conversations with Tariq Thachil, Steven
Wilkinson, Pradeep Chhibber, Irfan Nooruddin, and Yogendra Yadav, whose knowledge
of Indian politics and suggestions for this project were incredibly helpful along the way.
In closing, I would like to express my gratitude for the ongoing support from my
family. Early on, my parents instilled in me the love of learning while emphasizing the
rewards from discipline and hard work. My sister, Gretchen, has been a role model for
courage and perseverance. More than anything, during an era with so many fallen public

viii
role models, my family has taught me the importance of living and working with
integrity.
My in-laws, Vandana and Vijay Kaul, were immensely supportive during my stay
in India. India is at times not an easy place to navigate, and they provided enormous
support to me in conducting fieldwork in Delhi. I am very grateful for all of their help
and support.
My husband, Nick, has been there all the way. I will always remember his huge
smile and hug when I received the acceptance letter from the University of Maryland. He
has provided unwavering support and encouragement, and celebrated each milestone of
this journey with me.

ix
TableofContents
PrefaceandAcknowledgements......................................................................................................... ii
ListofTables............................................................................................................................................... xiListofFigures...........................................................................................................................................xiii
Abbreviations...........................................................................................................................................xiv
MapofIndia ............................................................................................................................................... xv
Chapter1.Introduction .......................................................................................................................... 1ResearchQuestions .............................................................................................................................................6ResearchContribution .................................................................................................................................... 10EthnicallyMediatedRetrospectiveVoting ............................................................................................. 11ResearchMethods ............................................................................................................................................. 14ResearchFindings ............................................................................................................................................. 15ChapterSummaries .......................................................................................................................................... 18
Chapter2.SettingtheContext:TheRiseoftheBharatiyaJanataParty(BJP) ..............20
Chapter3:EthnicPoliticsandUrbanVotingBehaviorinIndia ..........................................34IndianElectoralPoliticsandVotingBehavior ...................................................................................... 34ReviewofLiterature......................................................................................................................................... 41Ethnicpoliticsandvotingbehavior...................................................................................................... 41RetrospectiveVotingandVoter‐PartyLinkages ............................................................................ 50
EthnicallyMediatedRetrospectiveVotingTheory(ERV) ............................................................... 57ERV’sTestableImplications ......................................................................................................................... 66ERV’spredictionstoexplainurbanvotersupportfortheBJP ...................................................... 85ERV’spredictionsforDelhiandNewDelhi....................................................................................... 86ERV’spredictionsforGujaratandAhmedabad............................................................................... 87
Chapter4:ResearchDesignandMethodology...........................................................................88 NestedAnalysisResearchDesign............................................................................................................... 91Large‐NAnalysis ................................................................................................................................................ 92CaseStudyAnalysis ........................................................................................................................................101
x
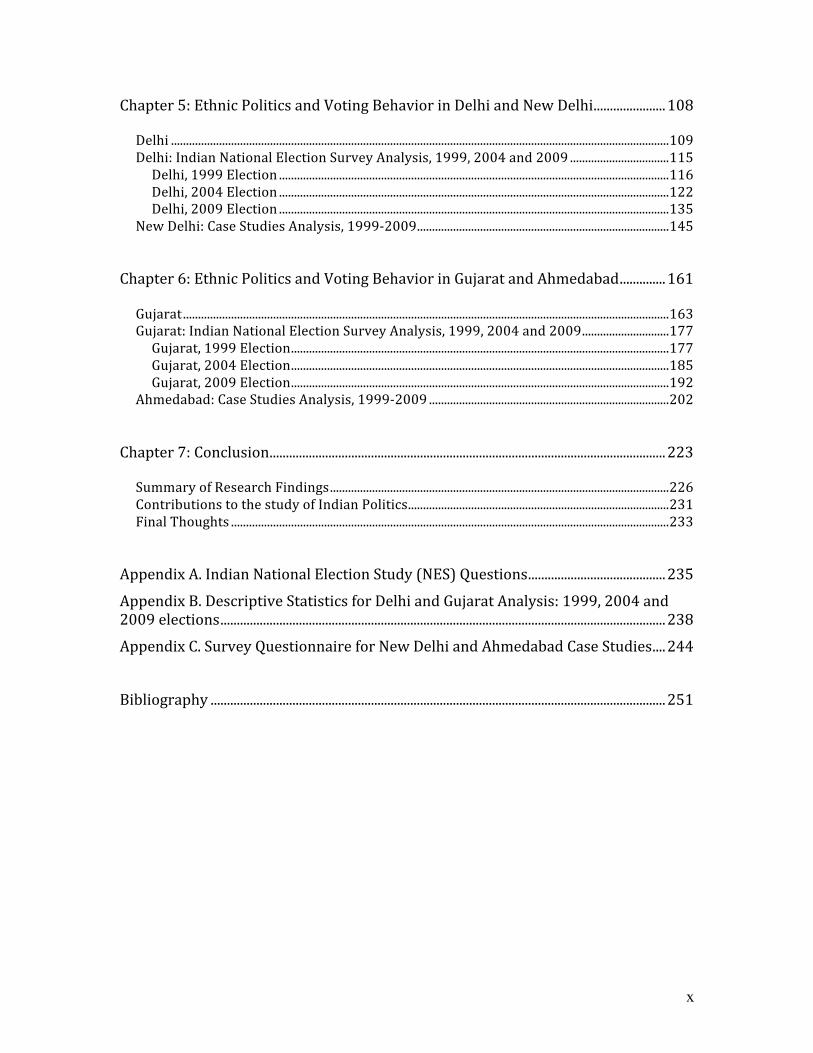
Chapter5:EthnicPoliticsandVotingBehaviorinDelhiandNewDelhi......................108Delhi ......................................................................................................................................................................109Delhi:IndianNationalElectionSurveyAnalysis,1999,2004and2009 .................................115Delhi,1999Election ..................................................................................................................................116Delhi,2004Election ..................................................................................................................................122Delhi,2009Election ..................................................................................................................................135
NewDelhi:CaseStudiesAnalysis,1999‐2009....................................................................................145Chapter6:EthnicPoliticsandVotingBehaviorinGujaratandAhmedabad..............161Gujarat..................................................................................................................................................................163Gujarat:IndianNationalElectionSurveyAnalysis,1999,2004and2009.............................177Gujarat,1999Election..............................................................................................................................177Gujarat,2004Election..............................................................................................................................185Gujarat,2009Election..............................................................................................................................192
Ahmedabad:CaseStudiesAnalysis,1999‐2009 ................................................................................202
Chapter7:Conclusion.........................................................................................................................223SummaryofResearchFindings.................................................................................................................226ContributionstothestudyofIndianPolitics.......................................................................................231FinalThoughts ..................................................................................................................................................233
AppendixA.IndianNationalElectionStudy(NES)Questions..........................................235
AppendixB.DescriptiveStatisticsforDelhiandGujaratAnalysis:1999,2004and2009elections........................................................................................................................................238
AppendixC.SurveyQuestionnaireforNewDelhiandAhmedabadCaseStudies....244
Bibliography ...........................................................................................................................................251

xi
ListofTables
Table 1.1 Summary of Election Results: BJP, Congress, NDA and UPA, 1999-2009 ........3 Table 1.2 Number of BJP Seats Won in Delhi and Gujarat, 1999-2009 .............................3 Table 3.1 ERV’s predicted generalized scenarios of voting behavior and voter support for
an ethnic party in different social and economic conditions...................................67 Table 3.2 Scenarios of Individual Voting Behavior: based on differences in the way in
which ERV’s mechanisms impact individual vote choice .......................................71 Table 3.3 Levels of political economy of development and ethnic conflict in Delhi and
Gujarat, 1999, 2004 and 2009 elections .................................................................75 Table 3.4 Sectoral Composition of Delhi Economy: 1993-2009 .......................................78 Table 3.5 Sectoral Composition of Gujarat Economy: 1993-2009 ...................................81 Table 4.1: Ethnic Group Identity and Interest Indicators .................................................94 Table 4.2 Retrospective Programmatic Interest Indicators...............................................96 Table 4.3: New Delhi Cases.............................................................................................105 Table 5.1: Party Winner of Delhi Elections at the National and State Levels ................113 Table 5.2 Delhi National Election Results, 1999-2009 ...................................................115 Table 5.3 Differences of sample proportions for Ethnic and Retrospective Programmatic
Indicators for BJP voters, Delhi 1999 election.....................................................118 Table 5.4 Delhi Voter Priorities in 1999: central versus state level government ...........120 Table 5.5 Logit Regression Results, Delhi 2004 election ................................................124 Table 5.6 Predicted Probabilities: Delhi 2004 election ..................................................126 Table 5.7 Logit Regression Results, Delhi 2004 election with interaction terms............128 Table 5.8 Marginal effects of development, Delhi 2004 election ....................................130 Table 5.9 Differences of sample proportions for indicators of caste and religion for BJP voters, Delhi 1999 and 2004 elections ..........................................................132 Table 5.10 Delhi Voter Priorities in 2004: central versus state level government .........133 Table 5.11 Logit Regression Results, Delhi 2009 election ..............................................137 Table 5.12 Predicted Probabilities, Delhi 2009 election ................................................139 Table 5.13 What should be built at the Ayodhya site? (Delhi 2009) ...............................140 Table 5.14 Differences of sample proportions for indicators of caste and religion for BJP voters, Delhi 1999, 2004 and 2009 elections ................................................142 Table 5.15 Delhi Voter Priorities in 2009: central versus state level government .........143 Table 5.16 Summary of socio-economic characteristics of New Delhi case studies .......145 Table 5.17 New Delhi Cases Summary............................................................................146 Table 5.18 New Delhi Cases: Vote Choices, 1999-2009 elections..................................147 Table 5.19 Summary of Vote Patterns: All New Delhi cases...........................................148

xii
Table 6.1 Gujarat National Election Results, 1999-2009................................................176 Table 6.2 Logit Regression Results, Gujarat 1999 Election............................................179 Table 6.3 Predicted Probabilities: Gujarat 1999 Election..............................................180 Table 6.4 Differences of sample proportions for select indicators for BJP voters,
Gujarat and Delhi, 1999 election..........................................................................183 Table 6.5 Gujarat Voter Priorities in 1999: central versus state level government........184 Table 6.6 Logit Regression Results, Gujarat 2004 Election............................................187 Table 6.7 Predicted Probabilities: Gujarat 2004 Election..............................................189 Table 6.8 Differences of sample proportions for ethnic indicators for BJP voters, Gujarat 1999, Gujarat 2004 and Delhi 2004 elections.........................................190 Table 6.9 Logit Regression Results, Gujarat 2009 election ............................................194 Table 6.10 Predicted Probabilities, Gujarat 2009 election.............................................195 Table 6.11 Gujarat Voter Priorities in 2009: central versus state level government......197 Table 6.12 What should be built at the Ayodhya site? (Gujarat 2009) ...........................198 Table 6.13 Differences of sample proportions for indicators of caste and religion for BJP
voters, Gujarat 1999, 2004 and 2009 elections ....................................................200 Table 6.14 Summary of socio-economic characteristics of Ahmedabad case studies.....203 Table 6.15 Ahmedabad Cases..........................................................................................205 Table 6.16 Ahmedabad and New Delhi Cases: number of BJP voters............................206 Table 6.17 Summary of Vote Patterns: Ahmedabad and New Delhi Cases ....................208 Table 6.18 Vote Patterns of BJP voters in Ahmedabad and New Delhi, 1999 & 2009...208

xiii
ListofFigures
Map of India....................................................................................................................... xv Figure 3.1 Ethnic Group Conflict and Shifts in the Political Salience of Ethnic Group Identity and Interests..........................................................................................................61 Figure 3.2 Political Economy of Development and Shifts in Retrospective Programmatic Demands by Voters ............................................................................................................63 Figure 3.3 ERV: Theorizing Emerging Linkages between Voters and Parties in India....65

xiv
Abbreviations
BJP Bharatiya Janata Party
BJS Bharatiya Jana Sangh
INC Indian National Congress
JD Janata Dal
NDA National Democratic Alliance
OBC Other Backward Classes/Backward Castes
RSS Rashtriya Swayamsevak Sangh
SC Scheduled Caste
ST Scheduled Tribe
UPA United Progressive Alliance
VHP Vishwa Hindu Parishad

xv
MapofIndia
Source: Map “Base 802509 (R00903) 12-96,” Washington, DC, Library of Congress, 1996.

1
Chapter1.Introduction
“Free India will be no Hindu raj, it will be India raj based not on the majority of any religious sect or community but on the representatives of the whole people without distinction of religion.” -- Mahatma Gandhi For many Indians, the rise of the Bharatiya Janata Party (BJP) in the 1990s was
and continues to be a highly controversial addition to Indian electoral politics. The BJP
has advocated a vision of Indian national unity through the concept of Hindutva, which
many believe does not equally embrace or represent all ethnic or religious groups, and
contrasts sharply with India’s constitutional mandate as a secular democratic republic.1
The BJP’s electoral strategy in the late 1980s and early 1990s to mobilize social
and political support for building a temple for the Hindu deity, Lord Ram, in Ayodhya, in
particular has been deeply criticized for inciting violence between Hindus and Muslims.
In December 1992, following a yatra (religious pilgrimage) and kar seva (religious
services) organized by the BJP and other Hindu organizations to initiate the construction
of the Ram temple, thousands of Hindu nationalists tore down the Babri mosque in
Ayodhya, triggering months of communal violence and rioting throughout the country.
The BJP’s advocacy of Hindutva and its mobilization efforts to build the Ram
temple has thus earned it the reputation as being an explicitly pro-Hindu party. More
specifically, since the BJP’s inception in 1980, the party has typically been associated
with traders, shopkeepers, professionals and civil servants, which predominantly includes
1ThePreambleofIndia’sConstitutionstates,“We,thepeopleofIndia,havingsolemnlyresolvedtoconstituteIndiaintoasovereignsocialistseculardemocraticrepublic…”TheConstitutionofIndia,availableathttp://india.gov.in/govt/constitutions_india.php.

2
upper caste Hindus living in urban areas.2 For this research project, the BJP is defined as
an ethnic party, in that it “overtly represents itself as a champion of the cause of one
particular ethnic category or set of categories to the exclusion of others.”3
The Bharatiya Janata Party’s rise to power culminated in its sweep of the 1999
National (Lok Sabha) election: the party won 182 parliamentary seats and built a 270-
member National Democratic Alliance (NDA) coalition government for a full five-year
term. Yet, within three election cycles, the party’s precipitous rise to power at the
national level was followed by a rapid decline. In the 2004 election, the Indian National
Congress (INC) led United Progressive Alliance (UPA) defeated the BJP, which lost over
40 parliamentary seats. In the 2009 Lok Sabha election, the BJP fared even worse: the
Congress party gained an additional 60 parliamentary seats while the BJP was reduced to
116 seats.4 Table 1.1 summarizes the national election results by the number of
parliamentary seats won for the BJP, the Congress and the two national coalitions, (i.e.,
National Democratic Alliance and the United Progressive Alliance) in the 1999, 2004 and
2009 Lok Sabha elections.
2Falcao,VanitaLeah,“UrbanPatternsofVotingandPartyChoices,”Economic&PoliticalWeekly,September26,2009,p.101.Chhibber,Pradeep,“WhoVotedfortheBharatiyaJanataParty,”BritishJournalofPoliticalScience,27(4),1997,p.638.Chhibbershowsthatthevariablesofcaste(i.e.,beinguppercaste)andurbanresidencewereassociatedwithahigherlikelihoodofvotingfortheBJPinthe1991nationalelection.3Theterm,ethnicparty,isbasedonKanchanChandra’sdescriptionthatanethnicparty“overtlyrepresentsitselfasachampionofthecauseofoneparticularethniccategoryorsetofcategoriestotheexclusionofothers,andthatmakessucharepresentationcentraltoitsstrategyofmobilizingvoters.”Chandra,Kanchan,WhyEthnicPartiesSucceed:PatronageandEthnicHeadCountsinIndia.Cambridge:CambridgeUniversityPress,2004,p.3.TheBahujanSamajPartyisanexampleofanethnicpartyrepresentinglowercasteHinduinterestsinthestateofUttarPradesh,India.However,unliketheBJP,theBSPhasgenerallynotbeenassociatedwithethnicviolence.4DespitetheBJP’selectoraldeclineinthe2009electioncomparedtothetwopastelections,itremainsthesecondmostpopularpartyinIndia,garneringnearlytwentypercentofthepopularvote.
3
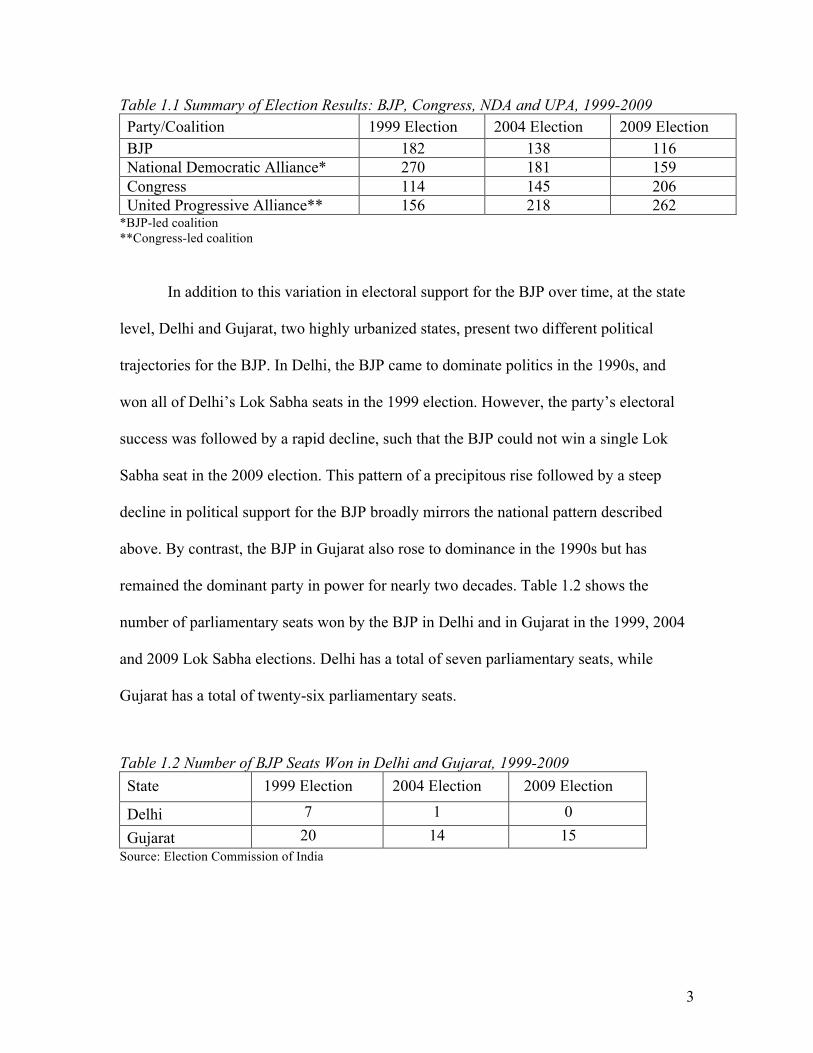
Table 1.1 Summary of Election Results: BJP, Congress, NDA and UPA, 1999-2009 Party/Coalition 1999 Election 2004 Election 2009 Election BJP 182 138 116 National Democratic Alliance* 270 181 159 Congress 114 145 206 United Progressive Alliance** 156 218 262
*BJP-led coalition **Congress-led coalition
In addition to this variation in electoral support for the BJP over time, at the state
level, Delhi and Gujarat, two highly urbanized states, present two different political
trajectories for the BJP. In Delhi, the BJP came to dominate politics in the 1990s, and
won all of Delhi’s Lok Sabha seats in the 1999 election. However, the party’s electoral
success was followed by a rapid decline, such that the BJP could not win a single Lok
Sabha seat in the 2009 election. This pattern of a precipitous rise followed by a steep
decline in political support for the BJP broadly mirrors the national pattern described
above. By contrast, the BJP in Gujarat also rose to dominance in the 1990s but has
remained the dominant party in power for nearly two decades. Table 1.2 shows the
number of parliamentary seats won by the BJP in Delhi and in Gujarat in the 1999, 2004
and 2009 Lok Sabha elections. Delhi has a total of seven parliamentary seats, while
Gujarat has a total of twenty-six parliamentary seats.
Table 1.2 Number of BJP Seats Won in Delhi and Gujarat, 1999-2009 State 1999 Election 2004 Election 2009 Election
Delhi 7 1 0 Gujarat 20 14 15
Source: Election Commission of India

4
The emergence of the Bharatiya Janata Party to become the second most popular
party in the world’s largest democracy, and the subsequent variation in the party’s
electoral popularity over space and time during the 1999-2009 timeframe pose important
questions for understanding the factors underlying voter support for an ethnic party in a
rapidly developing country. In the fall of 2010, I moved to India to explore this further.
In March 2011, in the city of Ahmedabad, Gujarat, I met Professor “P,” a Public
School Principal, who agreed to be interviewed about her political choices. I listened as
Professor P explained why she voted for the Bharatiya Janata Party in the 1999, 2004 and
2009 national elections. The most important factor in her vote choice, she said, was her
opinion that the Ram temple should be built at Ayodhya. She consistently voted for the
BJP because of the party’s advocacy for building the Ram temple.
A few days later, I interviewed Mr. “B,” a mid-level clerk in a government office
in Ahmedabad. Mr. B had also voted for the BJP in the past three national elections. In
the 1999 election, Mr. B supported the BJP primarily because of its advocacy of
Hindutva. He did not mince words in expressing his belief that the Congress party gives
more attention and support to Muslims. However, in the 2004 election, he said that rising
prices were becoming a bigger concern for him. While Mr. B continued to vote for the
BJP in the 2004 and 2009 election, he noted that Hindutva had taken a back burner to
programmatic concerns about rising prices.
Several months earlier, I had heard a somewhat similar story to Mr. B’s from a
voter in New Delhi. I interviewed Mr. “S,” an owner of a magazine stand in an outdoor
market. In the 1999 election, Mr. S was a strong supporter of the BJP and its leader, Atal
Bihari Vajpayee. At that time, Mr. S recalled that seeing the Ram temple built was the
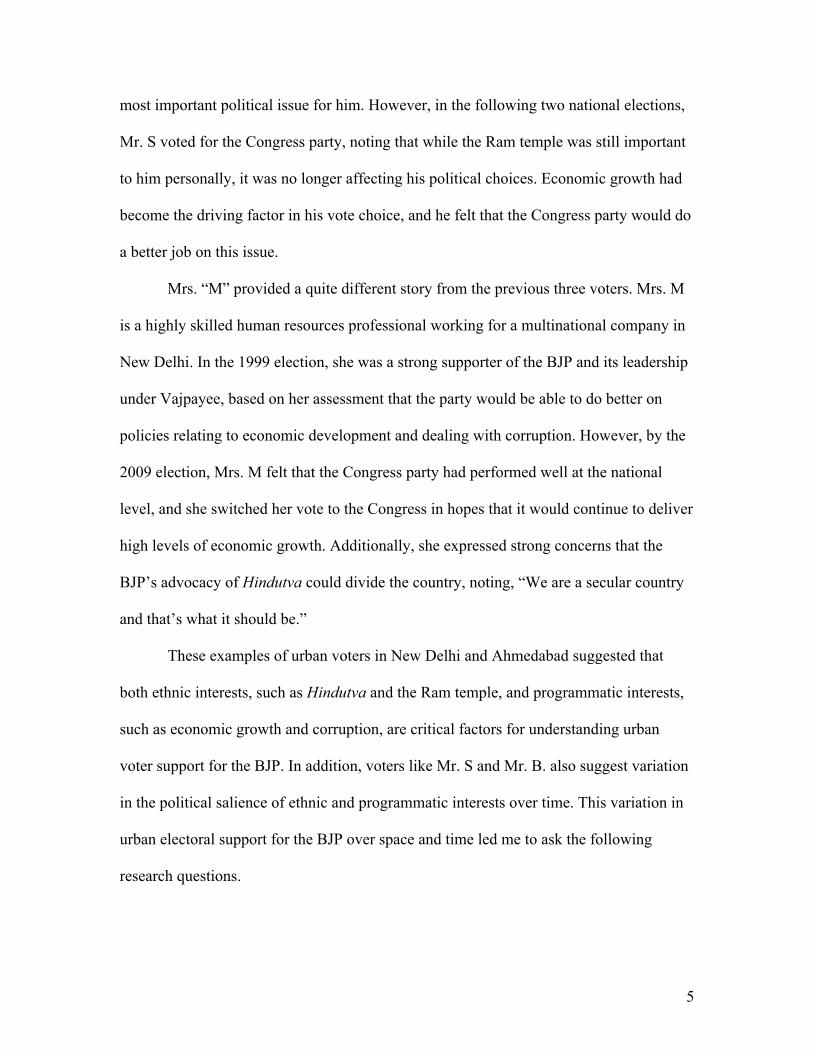
5
most important political issue for him. However, in the following two national elections,
Mr. S voted for the Congress party, noting that while the Ram temple was still important
to him personally, it was no longer affecting his political choices. Economic growth had
become the driving factor in his vote choice, and he felt that the Congress party would do
a better job on this issue.
Mrs. “M” provided a quite different story from the previous three voters. Mrs. M
is a highly skilled human resources professional working for a multinational company in
New Delhi. In the 1999 election, she was a strong supporter of the BJP and its leadership
under Vajpayee, based on her assessment that the party would be able to do better on
policies relating to economic development and dealing with corruption. However, by the
2009 election, Mrs. M felt that the Congress party had performed well at the national
level, and she switched her vote to the Congress in hopes that it would continue to deliver
high levels of economic growth. Additionally, she expressed strong concerns that the
BJP’s advocacy of Hindutva could divide the country, noting, “We are a secular country
and that’s what it should be.”
These examples of urban voters in New Delhi and Ahmedabad suggested that
both ethnic interests, such as Hindutva and the Ram temple, and programmatic interests,
such as economic growth and corruption, are critical factors for understanding urban
voter support for the BJP. In addition, voters like Mr. S and Mr. B. also suggest variation
in the political salience of ethnic and programmatic interests over time. This variation in
urban electoral support for the BJP over space and time led me to ask the following
research questions.

6
This chapter follows by introducing the research questions motivating this
dissertation project and briefly discusses the literature informing these questions. I then
discuss how these research questions contribute to the study of ethnicity and electoral
politics, through expanding knowledge of the reasons why voters vote for an ethnic party
in a rapidly developing country context like India. Next, I present my theory, Ethnically
Mediated Retrospective Voting (ERV), which offers a framework for understanding the
way in which both ethnic and programmatic interests factor into explaining voter support
for an ethnic party, and the conditions under which each of these factors increase in
salience in voters’ political choices. I then outline the research design used to test the
applicability of this theory to explain urban voter support for the BJP over space and
time, and provide a summary of the research findings. I conclude with an outline of the
following chapters.
ResearchQuestions
In the study of ethnicity and electoral politics, scholars have highlighted the ways
in which political elites use ethnic identity strategically for political gain. Early
scholarship on ethnic politics and conflict highlighted the mechanism of ethnic
outbidding, in which ethnic parties make increasingly more extreme ethnic appeals
leading to polarization and political instability. In the context of India, Wilkinson’s work
posits the conditions under which politicians will support or prevent ethnic violence in
order to win votes. Related research by Jaffrelot argues that the BJP’s support for
building the Ram temple was an instrumental use of ethnic mobilization for gaining
Hindu votes.

7
This dissertation research project seeks to contribute to this research on ethnicity
and electoral politics by focusing on voting behavior and the factors affecting voter
support for an ethnic party, the Bharatiya Janata Party, in a rapidly developing country
context. Recent research by Birnir on the nature of ethnic political participation argues
that voters use ethnic identity strategically as a means of achieving ethnic group
objectives, and that ethnicity can provide an information short-cut for voters’ political
choices. Birnir’s research highlights that under certain institutional contexts, an ethnic
party can serve as a means to promote peaceful and productive ethnic political
participation. Related research by Chandra argues that voters in a patronage democracy
choose a party that best represents their own ethnic category through conducting ethnic
head counts.
Thus, we can posit that a voter such as Professor P, an urban upper caste Hindu in
Ahmedabad, votes strategically for the BJP primarily based on the ethnic objective of
electing the party most likely to support the construction of the Ram temple in Ayodhya.
Likewise, we can posit that other Hindu voters I interviewed who indicated that they
voted for the BJP because of the party’s advocacy of Hindutva, or support for building
the Ram temple, do so based on a strategic assessment that it is the party most likely to
support and reward their ethnic group interests.
Yet, for some voters we find variation in the propensity to focus on ethnic
interests when voting over time. The voting behavior of Mr. B in Ahmedabad and Mr. S
in New Delhi are examples of urban voters who are strongly influenced by ethnic group
identity and interests related to Hindutva or the Ram temple to vote for the BJP in the

8
1999 election, but are more influenced by programmatic interests when voting in later
elections.
Specifically, in seeking to explain variation in voter support for the BJP, an
important question to consider is the following: why is it that the bitterly disputed site of
the Ram temple at Ayodhya, a critical rallying point in the BJP’s Hindu nationalist
mobilization strategy throughout the 1990s, appeared by the fall of 2010 with a landmark
court decision dividing the site between Hindus and Muslims, to no longer evoke as
intense political passion by the Indian electorate? 5
This variation in the relative influence of ethnic interests in explaining voter
support for an ethnic party suggests the need to examine the conditions which influence
variation in the salience of ethnic group identity and interests upon voters’ political
choices.
In the literature on Indian politics, existing theories put forward to explain the
surge in electoral support for the BJP tend to focus on either ethnic identity issues or
programmatic issues. One predominant theory of electoral support for the BJP focuses
primarily on ethnic/religious factors. This explanation posits that Hindus felt threatened
by the changes taking place in the social and political order, and thus were attracted to the
BJP’s discourse of a unifying Hindu nationalist vision particularly through its advocacy
of Hindutva. But this explanation has difficulty explaining why some voters vote for BJP
for principally programmatic reasons.
5OnSeptember30,2010,aftersixtyyearsoflitigation,theAllahabadHighCourt(stateSupremeCourtofUttarPradesh)ruledthatthelandatthedisputedAyodhyasitewouldbedividedbetweenHindusandMuslims.TheentirecountrywasputonhighsecurityalertbeforetheverdictforfearthattherulingwouldsparknationwideHindu‐Muslimriots.However,therewerenoreportsofriotsorothermajorpublicactsofviolence,andmostnotably,neithertheCongresspartynortheBJPpubliclycapitalizedontheruling.See“LandDivided,IndiaUnited,”TheEconomicTimes,October1,2010,frontpage.

9
Two other explanations have focused primarily on programmatic factors to
explain electoral support for the BJP. A second explanation argues that the BJP’s
electoral success in the late 1990s was the result of the party’s economic position of a
reduced role for the state in the economy. A third explanation focuses on issues of
governance and corruption and argues that electoral support for the BJP, particularly
from the emerging upper middle class, was primarily driven by concerns about corruption
and a desire for more effective government. In contrast to the first explanation, these
explanations have difficulty explaining why some voters vote for the BJP primarily for
ethnic reasons. All of these three explanations of electoral support for the BJP have been
applied in particular to explain middle class support for the BJP.
Each of these existing theoretical explanations focus primarily on either ethnic
factors or programmatic factors to explain the upsurge in voter for support for the BJP in
the 1990s, and do not address the subsequent variation in electoral popularity of the BJP
over space and time. However, the examples of voting behavior in Ahmedabad and New
Delhi indicate that some urban voters, such as Professor P, support an ethnic party such
as the BJP primarily based on ethnic group identity and interests, while other urban
voters, such as Mrs. M, vote for an ethnic party based primarily on programmatic
interests.
These examples also suggest the need to examine the conditions which influence
variation in the salience of programmatic issues upon voter’s political choices, and the
need for a theory of voting behavior that can account for the ways in which both ethnic
and programmatic interests influence voter support for an ethnic party such as the BJP
over space and time in a rapidly developing country like India.
10
From this discussion, three questions can be identified that guide this research
project going forward. First, how do ethnic and programmatic interests influence voting
behavior and help us understand variation in voter support for an ethnic party, such as the
BJP? Second, what conditions increase the salience of ethnic interests in voters’ political
choices? Third, what conditions increase the salience of programmatic interests in voters’
political choices? Next, I will address how focusing on these questions contributes to the
study of ethnicity and electoral politics and why it is useful to study them in the context
of Indian politics.
ResearchContribution
The study of ethnicity and electoral politics has become a well-established field of
inquiry. This literature has shown the ways in which ethnic parties can function as a
stabilizing or a destabilizing presence to democratic politics. The literature has expanded
our understanding of party behavior and the conditions under which politicians
strategically support or prevent ethnic violence in order to win votes.
In the context of India, existing explanations of voting behavior either focus on
the role of ethnic identity or performance on programmatic issues to explain voter
support for an ethnic party. However, less attention has been paid to the way in which
ethnic interests and programmatic interests influence voter support for an ethnic party,
and the conditions under which each of these factors increase in salience in voters’
political choices.
In developing and testing a theory of voting behavior which posits the conditions
under which ethnic interests and programmatic interests influence voter support for an
ethnic party, this dissertation broadens our understanding of voting behavior and the

11
factors influencing voter support for an ethnic party in a rapidly developing country
context
For nearly half a century, India has functioned as a patronage democracy. Yet,
since the early 1990s, as the country undergoes major structural socio-economic change,
India is also an example of a rapidly developing maturing democracy in which multiple
political parties compete for votes.
A study focusing on voter support for the Bharatiya Janata Party, the only national
ethnic party in India, offers a unique opportunity to undertake a structured comparison of
voting behavior and voter support for an ethnic party over time and space in a rapidly
developing country context.
EthnicallyMediatedRetrospectiveVoting
To answer the above research questions, I put forward a theory, Ethnically
Mediated Retrospective Voting (ERV), which posits the conditions that influence the
salience of ethnic interests and programmatic interests in voters’ political choices in order
to explain variation in voter support for an ethnic party such as the BJP.
ERV can be understood as a theory of retrospective voting which is adapted to
explain voting behavior and voter support for an ethnic party in a rapidly developing
country context, that seeks to account for the impact of 1) changes in the perceived level
of ethnic group conflict, and 2) changes brought about by rapid economic growth and
reforms, on voters’ political choices.
I start with the assumption that in many poor countries, voters often sell their
votes in exchange for access to state-provided material goods and services, such that the
party-voter relationship is often based on an expectation of votes in return for patronage.
12
ERV first posits that under conditions of a heightened level of perceived ethnic
group conflict, ethnic group identity and interests increase in salience for voters’ political
choices. Drawing from Karen Kaufmann’s research on urban voting behavior in a
developed country context, this claim is based on the idea that changes in the level of
perceived ethnic group conflict have a corresponding influence on the political salience
of ethnic group identity and interests.
Contextual factors, such as institutional environment, party program and
campaign strategy, and socio-political history, can influence perceptions of ethnic
conflict, which in turn increases in-group identification and cohesiveness. Drawing from
Birnir, ethnic group identification is viewed as both fluid and as something that can be
used strategically by voters as a means of achieving ethnic group objectives. This
mechanism provides a means of explaining relative changes in the political salience of
ethnic group identity and interests.
Second, ERV posits that under conditions of economic growth and reforms, an
increasing number of voters can make programmatic demands on government and
political leaders. This mechanism draws from Herbert Kitschelt’s idea that structural
changes associated with a strong political economy of development support
programmatic voter-party linkage formation.6 This mechanism focuses on the impact of
structural changes resulting from rapid economic growth and economic reforms in a
developing country context, which create the conditions for new opportunities and
6Iusethephrase,thepoliticaleconomyofdevelopment,torefertothestructuralchangesassociatedwitheconomicreform(suchaschangesineconomicopennessandthesizeofthepublicandprivatesectors)andeconomicdevelopment(suchaschangesincitizenincomeandlevelofaffluence,etc.)inadevelopingcountrycontext.Thistermisdefinedinthetheorychapter.

13
expectations by voters, which in turn creates the possibility for an increasing number of
voters to make retrospective programmatic demands on government and political leaders.
Whereas poor citizens discount future rewards and rely on clientelistic exchanges,
increasing levels of affluence and expanding economic opportunities put citizens in a
position to be able to demand indirect collective goods, which in turn creates the
opportunity for an increasing number of voters to make retrospective programmatic
demands on government and political leaders.7
This mechanism provides a means of situating programmatic linkage formation
between voters and parties in a developing country context historically characterized by
clientelistic exchanges, and in turn, explaining the conditions under which an increasing
number of voters could vote for an ethnic party based on programmatic interests, such as
employment or economic growth.
With these two mechanisms, ERV conceptualizes the way in which changes in the
level of ethnic conflict influences the political salience of ethnic group identity and
interests, and changes in the level of economic growth and reforms influences
programmatic voter-party linkage formation and increases retrospective programmatic
demands on government and political leaders. In doing so, ERV provides a framework
for explaining how both ethnic and programmatic interests influence voter support for an
ethnic party, such as the BJP, in a rapidly developing country like India.
7Iusetheterm,retrospectiveprogrammaticvoting,tomeanvotingbasedonanassessmentofincumbentperformanceaswellasanassessmentoffutureincumbentandoppositionpartyperformanceonprogrammaticissuesofconcern.ItissimilartoFiorina’sdefinitionofretrospectivevoting,butemphasizestheprogrammaticelementofpoliticalexchange(i.e.,indirect,basedonapackageofpolicypositions,etc.).Thistermisdefinedinthetheorychapter.
14
ResearchMethods
In order to test ERV as a means of answering the research questions identified in
this introduction, and its ability to explain variation in voter support for the BJP over
space and time, this dissertation utilizes a mixed-methods research design strategy
combining statistical analysis of national election data, with an investigation of case
studies of individual voting behavior.
From a research design perspective, India’s urban population, which has
functioned as an engine of economic growth, provides a useful location to situate a
comparative analytical study of the impact of socio-economic change on voting behavior
and the factors affecting voter support for an ethnic party, such as the BJP, in the context
of a rapidly developing country.
Using a most-similar research design, the large-N analysis focuses on
comparing voting behavior in Delhi and Gujarat over three Lok Sabha (national)
elections: 1999, 2004 and 2009. The states of Delhi and Gujarat share several
commonalities, such as relatively large urban populations compared to the rest of
India, and increasingly higher levels of economic growth. Additionally, Gujarat and
Delhi have been dominated by a two-party system comprised of the Congress and the
BJP, with very little influence from other regional political parties.
However, Delhi has experienced moderate to low levels of ethnic conflict,
whereas Gujarat has had a recent history of severe violent ethnic conflict. Thus, while
Gujarat and Delhi share some similar characteristics, the states diverge significantly in
their experience of ethnic conflict.
15
The data used for the large-N analysis comes from the Indian National Election
Study (NES) post-poll surveys for the 1999, 2004 and 2009 Lok Sabha elections. This
dissertation benefits greatly from this relatively new and evolving collection of data on
Indian voters’ political preferences.
The second component of research for this project entails in-depth case studies
of urban voters and their voting behavior in the cities of New Delhi, Delhi and
Ahmedabad, Gujarat, two of the largest cities in India. Similar to Gujarat and Delhi,
the cities of Ahmedabad and New Delhi share similar characteristics (i.e., a political
landscape dominated by two-party system and increasingly higher levels of economic
growth). Yet, Ahmedabad has experienced major episodes of Hindu-Muslim violent
conflict during the 1999-2009 timeframe, whereas New Delhi did not. I conducted
research on a total of 72 case studies, including 35 in-depth voter interviews in New
Delhi, and 37 in-depth voter interviews in Ahmedabad.
By conducting in-depth case studies of urban voters in these two large cities,
the research design seeks to generate a structured focused comparison of urban voting
behavior and voter support for the BJP, which complements the large-N analysis of
voting behavior in Delhi and Gujarat.
ResearchFindings
In this dissertation I posit the need to examine both the role of ethnic interests and
programmatic interests to understand voter support for an ethnic party in a rapidly
developing country context like India. Focusing only on ethnic interests or on
programmatic interests only tells half of the story of the nature of voter support for an
ethnic party, such as the Bharatiya Janata Party.

16
Ethnically Mediated Retrospective Voting hypothesizes that heightened levels of
perceived ethnic group conflict in turn increases the salience of ethnic group identity and
interests for voters’ political choices. Second, ERV hypothesizes that under conditions of
rapid economic growth and economic reform, an increasing number of voters are able to
make retrospective programmatic demands on government and political leaders. This
study tests ERV’s ability to explain how ethnic and programmatic interests influence
variation in urban voter support for the Bharatiya Janata Party over space and time.
The findings from the large-N research in Delhi and Gujarat provide support for
these propositions and are corroborated from the case study research findings in
Ahmedabad and in New Delhi. First, the research findings suggest that the condition of a
high level of perceived ethnic conflict is associated with a heightened salience of ethnic
group identity and interests in voters’ political choices
During the 1999 national election, which was influenced by the Kargil conflict
with Pakistan, and the BJP’s decade long political mobilization strategy emphasizing
Hindutva and building the Ram temple, the relative influence of ethnic interests on vote
choice and explaining voter support for the BJP was markedly higher in both Gujarat and
Delhi than compared to in the 2004 and 2009 elections.
In Gujarat, which has had a history of ethnic conflict between Hindus and
Muslims, the relative influence of ethnic group identity and interests in explaining voter
support for the BJP is comparatively higher than in Delhi, which has experienced low to
moderate levels ethnic conflict between Muslims and Hindus.
Second, the research findings suggest that the condition of a strong political
economy of development is associated with an increase in retrospective programmatic

17
demands guiding voters’ political choices. During the 2009 national election, in which
both Gujarat and Delhi experienced a high political economy of development, the relative
influence of retrospective programmatic interests on vote choice and explaining voter
support for the BJP is higher in both Delhi and Gujarat compared to in the 1999 election.
In addition to finding evidence of the effects of ERV’s individual propositions on
voting behavior, the findings of voting behavior over time in Delhi and Gujarat provide
evidence to support the proposition that ERV’s combined mechanisms are able to explain
changes in the relative influence of ethnic interests and programmatic interests on voting
behavior and voter support for the BJP at the societal level under different socio-
economic conditions
The findings from the case study analysis of individual voting behavior in New
Delhi and Ahmedabad suggest that differences in an individual voter’s assessment of the
potential threat from ethnic group conflict and the reward from economic growth and
development have a subsequent role in the relative influence of ethnic group identity and
interests or retrospective programmatic interests on vote choice and explaining individual
voter support for an ethnic party.
I identify four patterns of individual voting behavior, i.e., 1) Retrospective
Programmatic Voting, 2) Weak Ethnic Voting, 3) Strong Ethnic Voting, and 4) Party
Loyalty, to explain individual voter support for the BJP. These patterns of voting
behavior illustrate differences in an individual voter’s assessment of and relationship to
ethnic group conflict and economic growth and development, which in turn result in
differences in the relative influence of ethnic group identity and interests and

18
retrospective programmatic interests on vote choice and explaining individual voter
support for an ethnic party.
ChapterSummaries
This dissertation is comprised of seven chapters. Chapter Two introduces the
Bharatiya Janata Party (BJP). This chapter provides a historical context of the creation of
the BJP in 1980 and its rise to power over the following two decades. I include a
discussion of the party’s use of ethnic political mobilization strategies, particularly its
actions to support the construction of the Ram temple, and its advocacy of Hindutva. This
chapter provides a contextual background to study the nature of voter support for this
ethnic party over space and time.
Chapter Three begins with an overview of the literature on ethnic politics, voting
behavior and voter-party linkage mechanisms. The chapter outlines Ethnically Mediated
Retrospective Voting theory (ERV) and develops scenarios for testing ERV as a means of
explaining urban voter support for the BJP both at the societal level and at the level of the
individual voter.
Chapter Four describes the research design and methodology used to test ERV. I
start with a brief discussion about the use of mixed-methods in comparative politics
research, and also highlight the recent interest in using surveys in the study of Indian
politics. I introduce the “nested analysis” research design, describe the research plan for
data collection and analysis of electoral survey data, including a description of the ethnic
and programmatic indicators used in the large-N analysis, and describe the strategy for
conducting structured and focused case studies of individual voting behavior.

19
In Chapter Five, I introduce the first case, which includes a large-N analysis of
voting behavior at the state level in Delhi, and case study analysis of individual voters in
New Delhi. The chapter begins with an overview of the political landscape in Delhi.
Delhi represents a highly urbanized state, characterized by conditions of low to medium
levels of ethnic conflict and very high levels of economic growth. Through an analysis of
Indian National Election Study (NES) survey data of Delhi voters in the 1999, 2004 and
2009 national elections, and case study analysis of individual voters in New Delhi, I test
ERV as a means of explaining variation in electoral support for the BJP.
Chapter Six presents the second case, which includes a large-N analysis of voting
behavior at the state level in Gujarat, and case study analysis of individual voters in
Ahmedabad. I begin with a discussion of the political context in Gujarat. Gujarat, like
Delhi, is a highly urbanized state with increasingly higher levels of economic growth.
However, unlike Delhi, Gujarat, and Ahmedabad in particular, is characterized by
conditions of high levels of ethnic conflict. Through a similar analysis of NES survey
data of Gujarati voters in the 1999, 2004 and 2009 national elections, and case study
analysis of individual voters in Ahmedabad, I test ERV as a plausible means of
explaining variation in electoral support for the BJP.
Chapter Seven provides a summary of this dissertation study and its main
findings. I conclude with a discussion of the implications of these findings for the study
of Indian electoral politics, and final thoughts for further research on voting behavior and
the nature of voter support for ethnic parties in a developing country context.

20
Chapter2.SettingtheContext:TheRiseoftheBharatiyaJanataParty(BJP)
This chapter introduces the reader to the Bharatiya Janata Party in order to
provide a historical context of the party’s rise to power to become the second most
popular party in India, and a springboard to study the nature of voter support for this
ethnic party over space and time.
India’s political system is governed by a constitutional commitment to secular
democracy. For decades, democratic stability in India was often perceived in part as a by-
product of the Congress party’s long-standing dominant role in politics as a multi-ethnic
party advocating for a secular social democracy and socio-economic development.8
During the 1980s, however, the Congress party began to advance ethnic themes in its
political discourse. Shortly thereafter, Indian electoral politics experienced the rise of the
Bharatiya Janata Party (BJP), the first national rival to the Congress party.
Since the early 20th century, Hindu nationalism has constituted a social and
political presence in India, with the creation of Hindu movements such as the Rashtriya
Swayamsevak Sangh (RSS) in 1925. The first RSS leaders were deeply influenced by the
ideas of Vinayak Damodar Savarkar, a contemporary of Nehru and Gandhi, whose vision
of Indian national unity was expressed by the concept of “Hindutva.” Savarkar identified
three elements of Hindutva or “Hindu-ness”, which included 1) a geographical area
8Formanydecades,theIndianNationalCongresswasassociatedwithPrimeMinisterNehru’svisionofbuildingamodernIndiabasedonpluralistsecularsocialdemocracyandtechnologicallydrivendevelopment(Misra,1961;ImtiazandReifeld,2002;Deshpande,2002).
21
known historically as Hindustan, 2) a common blood, and 3) a common shared
civilization or Sanskriti.9
Despite the historical presence of Hindu nationalist movements, Ashutosh
Varshney notes that at no point before 1989 did a Hindu nationalist party receive more
than ten percent of the national vote.10 The Bharatiya Jana Sangh party (BJS or Jana
Sangh), the precursor to the BJP, was created in 1951 and was deeply connected with the
Hindu nationalist organization, RSS. The Jana Sangh party built its electoral support base
from urban traders, shopkeepers, civil servants and the professional class. However, the
Jana Sangh was never able to garner more than nine percent of the vote.11
In 1980, after a dismal electoral performance in the Lok Sabha election, leaders of
the Jana Sangh created a new party, the Bharatiya Janata Party (BJP).12 The BJP drew
from the support base of its predecessor, the Jana Sangh, and was thus associated with the
9SavarkarwasdeeplyopposedtoGandhi’sattemptsatHindu‐Muslimunity,andclaimedthatonlythosewhocouldclaimHindutvahavethemoral‐politicalrighttoconstitutethenation.ThisviewadvancedtheperceptionthatMuslimsinIndiawereareligiouscommunitythatconstitutedathreattothestabilityandunityofthestate.NehruandotherleadersoftheIndianNationalistCongressatthetimeconsideredtheHindunationalistorganizationsbothfascistandcommunal.SeeAndersen,WalterandShridharDamle,TheBrotherhoodinSaffron:TheRashtriyaSwayamsevakSanghandHinduRevivalism.Boulder:WestviewPress,1987.Deshpande,Satish,ContemporaryIndia–ASociologicalView.NewDelhi:PenguinBooksIndia,2003.Frankel,Francine,India’sPoliticalEconomy19472004,secondedition.Oxford:OxfordUniversityPress,2005.10Varshney,Ashutosh,“ContestedMeanings:India’sNationalIdentity,HinduNationalism,andthePoliticsofAnxiety,”Daedalus,122(3),1993,p.232.11Jaffrelot,Christophe,TheHinduNationalistMovementinIndia.NewYork:ColumbiaUniversityPress,1996,pgs.114‐149andAppendixD,“PerformanceoftheJanaSanghandtheB.J.PinLokSabhaElections1952to1991.”ThefollowingbackgrounddiscussiondrawsinparticularfromJaffrelot’scomprehensiveaccountofHindunationalisminIndia.Seealso,Frankel,Francine,India’sPoliticalEconomy,pgs.206&589.12InresponsetoIndiraGandhi’simpositionofaNationalEmergency,agroupofoppositionparties,includingtheJanaSanghformedtocreatetheJanataParty.TheJanataPartycametopowerbrieflyin1977,butitsdiversepoliticalinterests,rangingfromtheSocialistPartytotheJanaSangh,ultimatelymadetheJanataPartyanunstableamalgamofpoliticalentities.SeeJaffrelot,TheHinduNationalistMovement,pgs.282‐313.

22
interests of traders, shopkeepers, professionals, and civil servants. This constituency
disproportionately included upper caste Hindus living in urban areas.13
The creators of the new BJP initially wanted to distance the new party from the
Hindu nationalist leanings of the Jana Sangh, and to focus instead on issues such as
promoting a more decentralized economy and combating political corruption. However,
this strategy was not electorally successful in expanding the party. Jaffrelot notes, “The
[BJP’s] tactic of openness, intended to make it…an alternative to Congress by virtue of a
socio-economic ‘people-oriented’ programme, had not enabled it to enlarge its base.”14 In
the 1984 national election, the BJP won only two parliamentary seats, receiving 7.4
percent of the national vote.15
While the newly created BJP initially aimed at a strategy of openness and
moderation, Indian politics in the first half of the 1980s experienced a shift toward ethnic
politics and ethnic social and political mobilization on multiple fronts. The early 1980s
marked the revival of the Vishwa Hindu Parishad (i.e. World Hindu Council), a Hindu
nationalist organization created in 1964 by the RSS. In 1981, the VHP and the RSS
galvanized in response to perceived threats from proselytizing religions after a series of
religious conversions of lower caste Hindus took place across India.16 In the effort to
13Heath,Oliver,“AnatomyofBJP’sRisetoPower:Social,RegionalandPoliticalExpansionin1990s,”Economic&PoliticalWeekly,August21‐September3,1999,pgs.2511‐2517.14Jaffrelot,TheHinduNationalistMovement,pgs.318.Intheearly1980s,asmallnumberofMuslimpoliticiansjoinedtheBJPinthestateofMadhyaPradesh.JaffrelotnotesthattheRSSwashighlycriticaloftheBJPforplayingdownitsHinducharacter,anddidnotliketheparty’seffortstoattractMuslims.Seepgs.325&327.15Ibid.,pgs.318‐319.16Ibid.,p.340.InFebruary1981,approximately1000lowercasteHinduswereconvertedtoIslaminMeenakshipuram,TamilNadu.Thenumberofallegedreligiousconversionsthattookplaceatthistimerangeswidelyfrom2,000to22,000.

23
mobilize and unify Hindus, the VHP employed yatras (a religious pilgrimage to a holy
site), and emphasized Hindu symbols such as water from the Ganges, or Hindu deities.
In 1984, the Dharma Sansad, the religious parliament of the VHP, passed a
resolution to “liberate” the site at which Lord Ram was born in Ayodhya in the state of
Uttar Pradesh, in order to construct a temple dedicated to the most revered Hindu deity.17
According to local tradition, before the Muslim Mughal expansion into India, several
Hindu temples existed in Ayodhya, of which the most important was a temple located at
the birthplace of Ram. In the 16th century, a mosque was built at the site of the destroyed
Hindu temple believed to be the birthplace of Ram.18
Several months after passing the Ram temple resolution, in September 1984, the
VHP launched a procession through India to gather support for building the Ram temple
in Ayodhya. The procession was both religious in nature, with a truck carrying statues of
the Lord Ram and his wife, as well as political: members of the audience were asked to
“give their vote only to those parties which explicitly promised to give the Hindus their
sacred places back.”19
During this time, the Congress party, under the leadership of Indira Gandhi, began
to veer away from a secular political discourse and to advance and support ethnic themes
in order to gain political advantage against rivals in several states, such as in Jammu and
Kashmir, and Punjab.20 The event commonly referred to as the “Shah Bano Affair,” is
17Ibid.,p.363.18VanDerVeer,Peter,“’GodMustbeLiberated!’AHinduLiberationMovementinAyodhya,”ModernAsianStudies,21(2),1987,p.285.ThemosquewasbuiltbythefirstMughalemperor,Babur,in1527afterthedestructionofanexistingHindutemplebelievedtobethebirthplaceofLordRam.ArcheologicalexcavationatthesitehasindicatedtheremainsofalargeHinducomplex.19VanDerVeer,“GodMustbeLiberated,”pgs.291&293.20Ibid.,p.330.Forexample,CongressusedHinduthemestocounterFarooqAbdullah’sNationalconferenceinthe1983stateelectioninJammuandKashmir.

24
often considered the most blatant example of the Congress party’s turn toward
“communal” or identity-based politics.21
The Shah Bano affair took place a year after Indira Gandhi’s assassination, when
her son, Rajiv Gandhi assumed leadership of the Congress party. In 1985, Shah Bano, a
divorced Muslim woman, sued her husband in order to obtain financial support from
him.22 Her husband in turn appealed to the Supreme Court on the grounds that under the
Muslim customary law of Iddat, he was not required to continue financial support after a
certain period of time designated by Iddat. The Supreme Court rejected the husband’s
appeal on the basis that Indian law related to alimony and financial support applied to all
faiths.
In response to the Supreme Court’s decision, several prominent Muslims
petitioned Prime Minister Rajiv Gandhi to change the Indian law related to alimony, such
that it would exempt Muslims. Following large demonstrations, Prime Minister Gandhi
reversed the Supreme Court’s decision and agreed that the Indian law would be amended.
Subsequently, in early 1986, the Muslim Women (Protection of Rights on Divorce) Act
was passed by parliament, which specified that divorced Muslim women would be
provided maintenance (alimony) based on a period defined by Muslim customary law.23
This political decision, arguably more than any other, instigated criticism of Congress as
having a pro-Muslim bias.
21Theterm,communalpolitics,isoftenusedinthecontextofIndianpolitics,andreferstopoliticsbasedonreligious‐identity,particularlyHinduversusMuslimidentity.22Ibid.,p.334.ShahBanoinvokedSection125oftheCodeofCriminalProcedurearguingthatitestablishedherrighttomaintenance(i.e.,financialsupport).23Fulltextofthebillisavailableathttp://www.helplinelaw.com.

25
Yet, at about the same time, Congress appeared to yield to the Hindu nationalist
Vishwa Hindu Parishad’s demands to unlock the padlocks at the gate of the disputed
Babri Masjid mosque in Ayodhya.24 This allowed a new level of access to the disputed
religious site, which had previously only been accessible once a year to a Hindu priest.
Thus, Jaffrelot notes that in the first half of the 1980s, while the newly created Bharatiya
Janata Party sought a “strategy of moderation at the price of distancing itself somewhat
from the RSS...Congress opted to exploit religious identities.”25
The second half of the 1980s, however, witnessed the BJP’s move toward Hindu
nationalist themes. Under pressure from the RSS and local party activists, and in response
to poor electoral performance in the 1984 election, BJP party strategy shifted. In various
speeches in 1986 and 1987, BJP president, L.K. Advani, spoke of the danger of “pseudo-
secularism,” a criticism of Congress actions, including the Shah Bano affair, and called
for the imposition of a uniform civil code.26
In a decisive move, the BJP’s National Executive Meeting in June 1989 adopted
the “Palampur Resolution,” in which the party formally embraced the “Ram
Janmabhoomi movement” to build the Ram temple at Ayodhya.27 Through this decision,
24FrankelnotesthatRajivGandhiadoptedIndiraGandhi’snotionofsecularismintheIndiancontextasgivingequalrecognitiontoallreligions.However,hisimplementationwasmoretacticalandlackinginforesight.AftertheShahBanoaffair,RajivGandhilookedforasimilarconcessionforHindunationalists.TheVishwaHinduParishad’spetitiontounlockthegatesatthedisputedsiteinAyodhyawasjustsuchanopportunity.Later,RajivGandhitriedtostrikeabargainwiththeVHPthatwouldbothmollifyHindunationalistswhilenotalienatingMuslims.In1989,thecentralgovernmentandstategovernmentagreedtoallowtheVHPtocarryoutafoundation‐layingceremonyforaRamtempleatalocationnearthedisputedsiteiftheorganizationagreedinturnnottoproceedwithamarchtotheAyodhyasiteinrelationtoitsRamShilasPujansprocessions(seethefollowingpage).Frankelcallsthisanapproachtocommunalismasavote‐gettingstrategythatwasnaïveandcynical.Frankel,India’sPoliticalEconomy,pgs.684‐685.25Jaffrelot,p.336.26Ibid.,p.376.27ThePalampurResolution,draftedbyBJPleaderL.K.Advani,wasadoptedattheBJP’sNationalExecutivemeetinginPalampur,HimachalPradeshinJune1989.TheresolutioncommitstheBJPto
26
the BJP became actively engaged with the Hindu nationalist RSS and VHP networks in a
large-scale ethno-nationalist political mobilization strategy leading up to the 1989
national election.
As part of the Ram temple movement, the VHP’s grassroots network mobilized
thousands of religious processions throughout the country in the form of Ram Shilas
Pujans. A Ram Shilas Pujan entailed offering prayer (puja) to a sacred brick with the
name Ram (Ram Shilas) inscribed on it, combined with door-to-door fundraising efforts
of approximately 1.25 rupees per household.28
Jaffrelot notes that these “rituals of mobilization” were also in effect “rituals of
confrontation.”29 As a result, the Ram Shilas Pujan processions led to an outbreak of
communal rioting in multiple locations in the months leading up to the 1989 national
election. The Congress party lost the 1989 election to the National Front coalition.
Although the BJP did not win the election, its electoral gains were significant: the party
won 85 parliamentary seats and increased its vote share to 11.4 percent.30
The short-lived National Front coalition (December 1989 to March 1991) initially
had the support of both the BJP and the Communist Party. However, this was before the
National Front government made the highly controversial announcement in August 1990,
that it would implement recommendations put forward a decade earlier by the Mandal
Commission to expand the number of reserved seats for socio-economically
theHindutvaideologyandtosupportingtheVishnaHinduParishad’s(VHP)movementtobuildatempletotheHinduDeity,Ram,atAyodhya.Ramakrishnan,Venkitesh,“TheHindutvaRoad,”Frontline,21(25),December4‐17,2004.BharatiyaJanataWebsite,www.bjp.org.28Chandhoke,Neera,“TheTragedyofAyodhya,”Frontline,17(3),June24‐July7,2000.Jaffrelot,p.373.29Jaffrelot,pgs.373&395.JaffrelotinturnnotesthatheborrowsthisexpressionfromN.Bhattarya.30StatisticalReportonGeneralElections,1989,totheNinthLokSabha,Volume1,NewDelhi:ElectionCommissionofIndia,http://eci.nic.in/eci_main/statisticalreports/LS_1989/Vol_I_LS_89.pdf.

27
disadvantaged individuals in educational institutions and public sector jobs by twenty-
seven percent.31 The government’s decision to implement Mandal sparked widespread
violent protests across the country and dozens of protest-suicides by upper caste college
students.32
A month after the Mandal decision, BJP leader, L.K. Advani, announced that he
would undertake a Rath Yatra (a pilgrimage by chariot) on September 25, 1990 to
mobilize support for constructing the Ram temple. The plan was for the religious
procession to arrive in Ayodhya and inaugurate a Kar Seva (religious services). Advani
drove across several Indian states in a van decorated as a chariot but was arrested on
October 23 in the state of Bihar. Violence between Hindus and Muslims followed in the
wake of Advani’s Rath Yatra.33 In response to Advani’s arrest, the BJP withdrew its
support from the National Front coalition, forcing national elections.
Less than a year after Advani’s Rath Yatra, the BJP nearly doubled its voted share
in the 1991 national election compared to the 1989 election, winning 20 percent of the
vote and 120 Lok Sabha seats.34 The Congress party, winning 35 percent of the vote, was
able to form a stable government for a full five-year term. However, the Congress-led
government’s tenure was beset by a major economic crisis, corruption scandals, and bitter
31TheMandalCommissionwascreatedin1979todeterminecriteriaforsociallyandeducationallydisadvantagedgroups.LedbyBindheshwariPrasadMandal,theMandalCommissionReportrecommendedexpandingthenumberofreservedseatsinpublicsectorpostsandeducationalinstitutionsbytwenty‐sevenpercentforOtherBackwardClasses(OBCs).ThisproposedreservationforOBCswasinadditiontoreservationsconstitutionallyrecognizedforScheduledCastes(SCs)andScheduledTribes(STs).Ineffect,therecommendationsbytheMandalCommissionwouldraisethetotalnumberofreservedseatsforSCs,STsandOBCstoforty‐ninepercent.SeeRamaiah,A.,“IdentifyingOtherBackwardClasses,”EconomicandPoliticalWeekly,27(23),June6,1992.32Frankel,p.689.33Jaffrelot,pgs.416‐420.34StatisticalReportonGeneralElections,1991,totheTenthLokSabha,Volume1,NewDelhi:ElectionCommissionofIndia,http://eci.nic.in/eci_main/StatisticalReports/LS_1991/VOL_I_91.pdf.

28
criticism that it did not take appropriate action to prevent the destruction of the Babri
Mosque in Ayodhya, described below.
Facing an immediate economic crisis spurred by public debt pressure and
critically low foreign exchange reserves, the Congress-led government in 1991 instituted
comprehensive economic reforms to liberalize the economy. Despite earlier efforts, in
particular by Rajiv Gandhi, to promote economic reforms, Prime Minister Narasimha
Rao, with his Finance Minister, Dr. Manmohan Singh, was able to implement an
integrated set of economic policies to transform the Indian economy on a path toward
greater openness and sustained economic growth.35
The following year, in November 1992, BJP leader, L.K. Advani, announced that
he would resume the Rath Yatra, which had not been completed due to his arrest in
October 1990, in order to inaugurate religious services in Ayodhya. In taking this
decision, the BJP effectively endorsed the VHP’s goal of relaunching the Kar Seva in
Ayodhya on December 6, 1992.36 With L.K. Advani present, on December 6, 1992,
thousands of kar sevaks broke through security into the disputed Ayodhya site and
proceeded to demolish the Babri mosque.37 Communal riots broke out throughout the
country, with some of the worst violence in the cities of Bombay and Surat.
35AsPrimeMinister,RajivGandhipromotedeconomicpoliciestoreducestatecontrolofIndiancompanieswhilereducingsometariffs.However,thereformsduringthePrimeMinisterRao’sgovernmentweremuchmorecomprehensive.TheseeconomicreformsinstitutedabroadbasedtransformationofIndia’splannedeconomy,includingdismantlingmuchofthe“LicenseRaj”systemofregulationsforsettingupabusiness,taxconcessions,devaluingtherupee,removingimportquotas,andreducingrestrictionsonforeigninvestment.Frankel,pgs.587&591.36Frankel,p.713.37PrimeMinisterRaodidnotpreemptivelyimposePresident’sRuleuntiltheeveningofDecember6,1992.JaffrelotquotesBJPleader,AtalBihariVajpayee,expressingthefollowingdaythatthedemolitionoftheBabrimosquewasthe“worstcalculation”evermadebyhisparty.Jaffrelot,pgs.457&464.

29
In addition to criticism that the national government did not take effective actions
to prevent the destruction of the Babri mosque, the remainder of Rao’s government was
deeply marred by major corruption scandals. The BJP also criticized the government’s
private sector policies initiated in the 1991 economic reforms, triggering a national
debate about the nature and implementation of economic reforms. The BJP at the time
signaled its commitment to swadeshi (economic self-reliance) to protect and promote
Indian business in solidarity with the RSS’s nationalist position on the economy. Once in
power, however, BJP leadership under Atal Bihari Vajpayee would become more vocal
in advocating economic reforms that promoted privatization and opening the economy to
foreign direct investment.38
The BJP’s 1996 national election manifesto promoted swadeshi (economic self-
reliance), suraksha (security), shuchita (probity) and samrasata (social harmony), and
highlighted Hindutva as, “the rainbow, which will bridge our present to our glorious past
and pave the way for an equally glorious future.”39 The party won the greatest number of
Lok Sabha seats in the 1996 election, increasing its share to 161. However, it could not
maintain a stable majority, and as a result, the BJP’s tenure was limited to 13 days.
After a series of short-lived coalition governments collapsed, new national
elections were called for in 1998. The BJP continued to assert the principle of
Hindutva and its commitment to building the Ram temple.”40 The 1998 BJP party
manifesto also contrasted what it deemed the “phony liberalization,” under the
38Frankel,p.731.39BharatiyaJanataParty,1996ElectionManifesto,1996.401998BharatiyaJanataPartyElectionManifesto,availableattheBJPwebsite,www.bjp.org.Themanifestogoesontostate,“TheBJPiscommittedtofacilitatetheconstructionofamagnificentShriRamMandiratRamJanmasthaninAyodhyawhereamakeshifttemplealreadyexists.ShriRamliesatthecoreofIndianconsciousness.TheBJPwillexploreallconsensual,legalandconstitutionalmeanstofacilitatetheconstructionofShriRamMandiratAyodhya,”page4.
30
Congress party, in which foreign companies flourish while Indian companies flounder,
with its preferred swadeshi approach to economic policy making which emphasizes
internal liberalization before globalization.”41 In the 1998 election, the BJP repeated its
performance from 1996 and again won the greatest number of Lok Sabha seats, while
increasing its vote share to 25.6 percent. The BJP-led National Democratic Alliance
coalition ruled for 13 months.
In the run-up to the 1999 national election, the BJP campaigned on producing
one year of economic growth, its handling of the Kargil Conflict, in which India
forcefully repelled Pakistani militants who had infiltrated and occupied positions
within the Indian-controlled section of Kashmir during the summer of 1999, and
emphasizing the party’s national homegrown political leadership under Atal Bihari
Vajpayee, compared to the Congress party’s “foreign” leadership under Sonia Gandhi,
the Italian-born wife of Prime Minister Rajiv Gandhi.42
Although the common agenda for the BJP-led National Democratic Alliance
(NDA) for the 1999 national election did not refer to the Ram temple issue as it had in
the BJP’s own 1998 election manifesto, it is important to note that the BJP itself did
not reverse or back away from its 1989 Palampur Resolution, in which the party
explicitly declared it would support the movement to build a Ram temple at Ayodhya.
This time the BJP and its NDA coalition won a majority of Lok Sabha parliamentary
seats and maintained a government for a full five-year term from 1999 to 2004.
Five years later, during the 2004 national elections, the BJP launched its “India
Shining” campaign, using the slogan, “the feel good factor,” and highlighting
41Ibid.,p.12.421999NationalDemocraticAlliance(NDA)ElectionManifesto,www.bjp.org.

31
economic growth, during its tenure.4344 While the BJP did not actively emphasize the
Ram temple issue or Hindutva in its campaign strategy, the party continued to affirm
its positions on these issues in its “Vision Document 2004,” located on the party’s
official website.”45
This time, the Congress party took the BJP head on and was deeply critical of
the BJP’s positions with regard to issues of cultural nationalism and social harmony.
The 2004 Congress election manifesto charged that the BJP engages in a form of
“inconsistent double-speak” with its support for the construction of the Hindu Ram
Temple and the party’s links with Hindu nationalist organizations on the one hand, and
its talk of preserving secularism on the other. Perhaps most seriously, the Congress
party charged the BJP with deliberately inciting communal carnage with regard to the
massive Hindu-Muslim rioting that engulfed Gujarat in 2002.46 Although the BJP was
expected to win the 2004 election, its coalition lost 62 Lok Sabha seats, while the
Congress-led UPA gained 89 seats and was able to create a stable majority.
After five years of Congress rule, the BJP’s 2009 election platform espoused
an agenda for change, focusing on the goals of good governance, development, and
43TheIndianeconomygrewat8percentin2003andin2004,thoughitwasmoresluggishtheprecedingthreeyears,from2000to2003,withGDPratesof4.0,5.2and3.7percent.SeeWorldBank,DevelopmentIndicatorsforIndia.44Tripathi,Purnima,“ReworkingStrategies,”Frontline,21(3),Jan.31‐Feb.13,2004.45See,2004BJPVisionDocument–2004,www.bjp.org.Theparty’sVisionDocument2004states,“WebelievethatCulturalNationalismforwhichIndianness,BharatiyaandHindutvaaresynonyms‐‐isthebasisofournationalidentity.”Thevisiondocumentalsostatestheparty’sreaffirmationto,“itscommitmenttotheconstructionofaRamtempleinAyodhya.”46The2004CongressPartyelectionmanifestoclaims,“TheBJP’s“culturalnationalismisadevicefordividingIndiansemotionally.TheCongressunitestheIndiannationthroughconsensus;theBJPdividestheIndiannationthroughconfrontation….theBJP‐ledNDAgovernmenthasdamagedsocialharmonybydeliberatelyincitingandsponsoringacommunalcarnageinGujarat;byglorifyingviolenceagainstmissionaries;[and]byencouragingviciouslycommunalandfascistorganizationsliketheVHP/BajrangDaltospreadhate,”http://www.aicc.org.in.
32
security.47 However, the party’s formal issue agenda was significantly subsumed by
political controversy during the campaign, by the remarks made by BJP political
candidate, Varun Gandhi, grandson of Indira Gandhi.48 During a campaign rally,
Varun Gandhi was reported to claim that he would cut off the hand of any Muslim
who threatened a Hindu.49 India’s powerful Election Commission of India urged the
BJP to drop Varun Gandhi as a political candidate, but the party did not do so. The
Election Commission initiated criminal charges against Varun Gandhi for inciting
communal tensions.50
In refusing to take a strong stand against Varun Gandhi’s threatening rhetoric,
the BJP’s action, or lack thereof, made it difficult to delink the party from its long-
standing connection with ethno-nationalist political mobilization and ideology. The
2009 election results were decisive: the Congress-led UPA coalition added 44 seats to
create a stable majority coalition for a second five-year term.
In summary, this chapter highlights the rise of the Bharatiya Janata Party in the
1990s to become the second most popular party in India to provide the historical
political context for studying the nature of voter support for this ethnic party. As this
chapter shows, a key aspect of the rise of the BJP in electoral politics in India is the
party’s use of an ethno-political mobilization strategy emphasizing issues such as
constructing the Ram temple and a vision of Indian national unity expressed through
the concept of Hindutva. In the following chapter, I discuss the role of the BJP’s 472009BJPElectionManifesto,www.bjp.org.48VarunGandhiisthegrandsonofIndiraGandhiandthecousinofRahulandPriyankaGandhi.WhiletheGandhifamilyisprimarilyassociatedwiththeCongressParty,VarunGandhiisaffiliatedwiththeBJP.49“CasefiledagainstVarunforinflammatoryspeech,”IndiaToday,March17,2009.50Ibid.TheBJPstatedthatVarunGandhishouldapologizeforhisremarks,butthepartydidnotdrophimasacandidate.

33
ethno-political mobilization strategy as one important factor influencing voter
perceptions of ethnic group conflict.

34
Chapter3:EthnicPoliticsandUrbanVotingBehaviorinIndia
This chapter begins with an overview of the main themes in the scholarship on
Indian electoral politics and voting behavior, followed by an analysis of the relevant
literature on ethnic politics and voting behavior, retrospective voting, and voter-party
linkage mechanisms. I then introduce the theory, Ethnically Mediated Retrospective
Voting (ERV), and discuss its testable implications for explaining variation in urban
voter support for the BJP over space and time.
IndianElectoralPoliticsandVotingBehavior
In the historical context of a politically dominant Congress system, scholarship on
Indian electoral politics has often highlighted 1) the patronage-based nature of party
politics, and 2) ethnic identity variables, such as caste or religion, to explain vote
choice.51 Scholars writing about Indian electoral politics in the 1950s and 1960s referred
51Weiner,Myron,ed.StatePoliticsinIndia.Princeton:PrincetonUniversityPress,1968.Weiner,MyronandJohnOsgoodField,eds.ElectoralPoliticsintheIndianStates:PartySystemsandCleavages.NewDelhi:ManoharBookServiceandMassachusettsInstituteofTechnology:1975.Eldersveld,S.J.,andBashiruddinAhmed,CitizensandPolitics:MassPoliticalBehaviorinIndia.Chicago:UniversityofChicago,1978.Chhibber,PradeepandJohnPetrocik,“ThePuzzleofIndianPolitics:SocialCleavagesandtheIndianPartySystem”,BritishJournalofPoliticalScience,19(2),1989.Malik,YogendraandV.B.Singh,HinduNationalistsinIndia:TheRiseoftheBharatiyaJanataParty.Boulder:WestviewPress,1994.Gould,HaroldandSumitGanguly,eds.IndiaVotesAlliancePoliticsandMinorityGovernmentsintheNinthandTenthGeneralElections.Boulder:WestviewPress,1993.Hansen,ThomasBlomandChristopheJaffrelot,eds.TheBJPandtheCompulsionofPoliticsinIndia.Oxford:OxfordUniversityPress,1998.Jaffrelot,Christophe,TheHinduNationalistMovementandIndianPolitics.NewYork:ColumbiaUniversityPressandLondon:Hurst,1996.Jaffrelot,Christophe,India’sSilentRevolution:TheRiseoftheLowerCastesinNorthIndia.NewYork:ColumbiaUniversityPressandLondon:Hurst,2003.Shastri,Sandeep,K.C.SuriandYogendraYadav,eds.ElectoralPoliticsinIndianStates:LokSabhaElectionsin2004andBeyond.Delhi:OxfordUniversityPress,2009.Heath,AnthonyandRogerJeffery,eds.DiversityandChangeinModernIndia:Economic,SocialandPoliticalApproaches.London:OxfordUniversityPress,2010.
35
to the “machine model,” in which politicians provide material rewards in exchange for
votes, to describe the way in which political parties operate in the states of India. In the
context of ethnic group concentration and ethnic group demands for autonomy and/or
secession, some scholars suggested at the time that the machine model of politics was
useful to reconcile competing ethnic interests and hold Indian states together.52
Kanchan Chandra characterizes India as a form of patronage democracy, which
she defines as one in which 1) the state rather than the private sector monopolizes access
to jobs and services, and 2) where elected officials have significant power in the
allocation of jobs and services at the disposal of the state.53 A primary motivation for
voting in a patronage democracy is to secure access to state benefits (i.e., jobs, resources,
services, etc).
In a similar vein, writing about historical voter-party linkages in India, Steve
Wilkinson writes that nearly a decade before Indian independence in 1938, Congress
leader Jawaharlal Nehru indicated his concerns to Mahatma Gandhi that the party under
his leadership had succumbed to “Tammany Hall” politics.54 The Congress party’s
singular control of the state administration and resources provided it with “enormous
pools of patronage,” writes Wilkinson, such that clientelistic politics based on ethnic
identifiers like religion or caste, underscored party-voter relations.55
Yet, Ralph Meyer in the late 1980s hypothesized that many Indians vote
retrospectively and that economic factors are an important factor in vote choice. At the 52Weiner,Myron,ThePoliticsofScarcity.Chicago:UniversityofChicagoPress,1962.53Chandra,Kanchan,WhyEthnicPartiesSucceed:AComparativeStudyoftheBahujanSamajParty,DoctoralDissertationHarvard,2000.P.57.54Wilkinson,Steven,“ExplainingChangingPatternsofParty‐VoterLinkagesinIndia,”inPatrons,ClientsandPolicies–PatternsofDemocraticAccountabilityandPoliticalCompetition,Eds.HerbertKitscheltandStevenWilkinson.Cambridge:CambridgeUniversityPress,2007.55Ibid.,p.110.

36
time, Meyer noted the lack of individual public opinion data in India to test this
argument. Instead, using aggregate data, he compared changes in agricultural production
and per capita net national product with electoral support for the incumbent party, and
found that voters are politically sensitive to shifts in agricultural production. 5657
More recently, Rahul Verma argues that ethnic identifiers, such as caste and
religion, alone are not adequate determinants of national electoral outcomes. Rather,
using recent survey data from the Indian National Election Study, Verma highlights that
voters assess government performance and work done at multiple levels (i.e., national,
state and constituency), and that their decision to either punish or reward government
performance based on this aggregate assessment of work done is the best predictor of the
2004 election outcomes.58
In investigating why many Dalit59 voters did not vote for the incumbent Bahujan
Samaj Party (BSP), an ethnic party that has typically done well with the Dalit
community, in the 2012 State Assembly elections in Uttar Pradesh, Sanjay Kumar and
Oliver Heath recently found that voter assessment of the party’s ability to deliver on
programmatic concerns, particularly related to development and corruption, was a
56Meyer,C.Ralph,“HowDoIndiansVote?,”AsianSurvey,29(12),1989.Meyer,C.RalphandDavidMalcolm,“EffectsofEconomicChangeandNewPartyFormation,”AsianSurvey33(3),1993.57Additionally,othernotablescholarsinthe1970sand1980sanalyzedandexplainedelectoralsuccessthroughthelensofpolicyandperformance.Forexample,MyronWeinerhighlightedthegovernments“excesses,”referringtothenationalemergencyandunpopularpoliciessuchasthesterilizationprogram,asimportantfactorsinthedefeatoftheincumbentCongresspartyinthe1977nationalelections.Weiner,Myron,IndiaatthePolls:TheParliamentaryElectionsof1977.WashingtonDC:AmericanEnterpriseInstituteforPublicPolicyResearch,1977.58VermaRahul,“WhatDeterminesElectoralOutcomesinIndia?Caste,ClassorVoters’SatisfactionwithGovernmentPerformance,”AsianSurvey,52(2),2012.59Dalitisthetermusedforuntouchables.TheIndiangovernmentrecognizesthemasscheduledcastes,meaningthoseindividualswhohavebeenhistoricallydisadvantaged.

37
significant factor in explaining reduced Dalit voter support for the BSP.60 In addition, the
authors found that, while older Dalits were still more likely to vote for the BSP, Dalits
with higher incomes, more education, and/or were living in urban areas, were
significantly less likely to vote for the BSP.61 The authors conclude that, while the Dalit
identity continues to be an important factor in vote choice in Uttar Pradesh, performance
assessment on programmatic issues relating to development and corruption were also key
factors in explaining why many Dalits failed to support the BSP, suggesting evidence of a
“public policy-oriented performance failure.”62
Thus, while the study of Indian electoral politics and voting behavior has often
focused on the patronage nature of electoral politics and on ethnic factors to explain
voting behavior, recent access to empirical data of voting behavior has spurred research
to examine the nature and degree to which voter assessment of party performance on
programmatic concerns are also a factor in vote choice.
These differing views on how to understand and explain electoral politics and
voting behavior in India, (i.e., predominantly through a focus on ethnic identity or a focus
on performance on programmatic issues), broadly mirror the competing explanations for
explaining the upsurge in voter support for the BJP in the 1990s, leading to their election
to a full term in the 1999 election.
As noted in the introduction, one predominant explanation for the BJP’s electoral
success focuses on religious/ethnic factors, and posits that Hindus felt threatened by the
changes taking place in the social and political order, and thus were attracted to the BJP’s
60Heath,OliverandSanjayKumar,“WhyDidDalitsDeserttheBahujanSamajPartyinUttarPradesh,”EconomicandPoliticalWeekly,July14,2012,p.41.61Ibid,pgs.44&48.62Ibid,p.47.

38
discourse of a unifying Hindu nationalist vision particularly through its advocacy of
Hindutva.63 But this explanation has difficulty explaining why some voters voted for BJP
for principally programmatic reasons.
Two other explanations have focused on non-ethnic factors to explain electoral
support for the BJP. A second explanation argues against a focus primarily on
religious/ethnic factors such as Hindutva, and highlights the role of economic factors,
arguing that BJP supporters wanted a reduced role for the state in the economy.64
However, this predominantly economic perspective has difficulty explaining why some
voters identify ethnic identity factors, such as Hindutva or support for building the Ram
temple, as a primary reason for voting for the BJP.
A third explanation focuses on issues of governance and corruption, and argues
that electoral support for the BJP, in particular from the emerging upper middle class,
was driven primarily by voters’ attempts to support better governance, less corruption
and for a more effective, coherent party.65 However, this explanation too does not
account for voters who identify ethnic interests as a primary factor in their support for the
BJP. All of these three explanations of electoral support for the BJP have been applied in
particular to explain middle class support for the BJP.
63Hansen,ThomasBlom,TheSaffronWave:DemocracyandHinduNationalisminModernIndia.Princeton:PrincetonUniversityPress,1999.Fernandes,LeelaandPatrickHeller,“HegemonicAspirations–NewMiddleClassPoliticsandIndia’sDemocracyinComparativePerspective,CriticalAsianStudies38(4),2006.64Chhibber,Pradeep,“WhoVotedfortheBharatiyaJanataParty?,”BritishJournalofPoliticalScience27(4),1997.Chhibber,Pradeep,DemocracyWithoutAssociations:TransformationofthePartySystemandSocialCleavagesinIndia.AnnArbor:UniversityofMichiganPress,1999.65Jaffrelot,Christophe,TheHinduNationalistMovementinIndia.NewYork:ColumbiaUniversityPress,1996.Jaffrelot’sbookprovidesacomprehensiveaccountofthenatureoftheBJP’sethno‐nationalistpoliticalmobilizationstrategyinthe1980sand1990s.ButhealsonotesthattherewaspoliticalsupportfortheBJP,particularlyfromtheuppermiddleclasses,whostressedthebenefitsofeconomicliberalizationandwereattractedtothepartyforreasonsotherthanethnicissues,particularlyconcernsaboutpoliticalcorruptionandgovernance,pgs.431‐433.
39
Each of these theoretical explanations highlights either ethnic factors or
programmatic factors to explain the upsurge in voter for support for the BJP in the 1990s
and its election to a full term in the 1999 national election.
However, these theories are unable to explain why some voters vote for the BJP
based primarily on ethnic appeals, such as the party’s support for the construction of the
Ram temple, while other voters vote for the BJP based primarily on programmatic
appeals, such as concerns about economic development, or account for variation in the
propensity of voters to emphasize either ethnic or programmatic appeals when voting for
an ethnic party.
A noted exception is recent research by Tariq Thachil, who has sought to provide
a comprehensive theoretical explanation for understanding variation in low-income voter
support for the BJP. Thachil has recently offered a theory positing a services strategy
mechanism as a distinct form of party-voter linkage, to explain poor voters’ electoral
support for the BJP.66
Thus, we are left without a theoretical framework for understanding the way in
which ethnic and programmatic interests influence voter support for an ethnic party, and
the conditions under which each of these factors increase in salience in voters’ political
choices.67
66Thachil,Tariq,“TheSaffronWaveMeetsTheSilentRevolution:WhyThePoorVoteForHinduNationalismInIndia.”PhDDissertation,CornellUniversity,2009.TariqThachil,“EmbeddedMobilization:NonstateServiceProvisionasElectoralStrategyinIndia,”WorldPolitics,63(3),2011.67Indiscussingthemostrecent2009nationalelectionoutcome,TariqThachilpositstheinadequacyofreferringtoidentitypoliticsorprogrammaticpoliticsinabsolutetermstoexplainIndianvotingbehavior.Rather,hesuggeststheneedtolookattheroleofbothcaste‐basedpoliticsandprogrammaticissuesinanalyzingIndianvotingbehavior.SeeThachil,Tariq,“DoPoliciesMatterinIndianElections?”IndiaInTransition,April26,2010,attheCenterfortheAdvancedStudyofIndiawebsite,http://casi.ssc.upenn.edu/iit/thachil.

40
Before turning to the literature on ethnic politics, retrospective voting, and voter-
party linkages, I would like to address the reason why I chose to focus this research
project on urban voting behavior in examining voter support for the BJP.
In a developing country context, economic development and urbanization are
deeply interlinked, as urban areas often represent the focal point of socio-economic
changes related to economic growth and development.68
As noted earlier, scholars have characterized India as a form of patronage
democracy, in which a primary motivation for voting is to secure access to state benefits.
Yet, over the past two decades, as the country has undergone major socio-economic
structural change, India is also an example of a rapidly developing maturing democracy
in which multiple ethnic parties compete for votes.
During this time, the urban population in India has continued to grow, increasing
from 25.7 percent in 1991, to 31.1 percent of the total population in 2011.69 In addition,
India’s urban population currently generates 60 percent of the country’s GDP. One policy
study estimates that by the year 2030, forty percent of Indians will live in urban areas,
and will generate 70 percent of the country’s GDP.70
68DavisJamesandJ.VernonHenderson,“Evidenceonthepoliticaleconomyoftheurbanizationprocess,”JournalofUrbanEconomics,53(1),2003.69TheCensusofIndiadefinesanurbanareaassatisfyingthefollowingthreecriteria:i)aminimumpopulationof5,000;ii)atleast75percentofthemaleworkingpopulationengagedinnon‐agriculturalpursuits;andiii)adensityofpopulationofatleast400person/sq.km.(1,000person/sq.mile).Seehttp://censusindia.gov.in/Metadata/Metada.htm.70See,“India’surbanawakening:Buildinginclusivecities,sustainingeconomicgrowth,”McKinseyGlobalInstitute,April2010.Accordingtothe2011Census,India’surbanpopulationadded91millionpeopleoverthepasttenyears,growingfrom286millionto377millionpeople,representinganincreasefrom27.7percentto31.1percentofthepopulation.Duringtheten‐yeartimeframefrom2001to2011,theannualurbangrowthratewas2.76percent,comparedtotheruralgrowthrateof1.15percent.Bhagat,R.B.,“EmergingPatternofUrbanisationinIndia,”Economic&PoliticalWeekly,August20,2011.

41
In spite of these dramatic socio-economic structural changes taking place, little
research exists on the factors affecting urban voting behavior in India.71 In this context, a
research project focusing on voting behavior in India’s expanding urban areas provides a
unique lens for studying ethnic politics and voting behavior in a rapidly developing
country context, and the ways in which ethnic and programmatic factors influence voter
support for an ethnic party.
ReviewofLiterature
ERV theory seeks to provide a theoretical framework for understanding voter
support for an ethnic party such as the BJP, which takes into account both ethnic and
programmatic factors in a developing country context. ERV theory is informed by three
strands of literature: 1) ethnic politics and voting behavior, 2) retrospective voting, and 3)
voter-party-linkage mechanisms. This section discusses the way in which each strand of
literature provides critical insight in developing ERV.
Ethnicpoliticsandvotingbehavior
Scholars hold differing views on the impact of ethnicity on electoral politics. In
the book, Ethnic Groups in Conflict, Donald Horowitz notes that the main features of an
ethnic party system can be summarized as the following: stable parties, unstable
71AnearliergenerationofscholarsofIndianpoliticsdidexamineaspectsofurbanpoliticsfocusingprimarilyoncitypoliticsandurbanvotingtrends.OnecollectionofarticlesonIndiancitypoliticsisincludedintheseries,“UrbanPoliticsinaPluralSociety,”TheJournalofAsianStudies,20(03),1961.AsecondcollectionofarticlesonIndianurbanpoliticsisincludedintheseries“SymposiumonIndianUrbanPolitics,”AsianSurvey,13(4),1973.RodneyJonesfocusesonthepoliticsofIndore,MadhyaPradesh.SeeJones,Rodney.UrbanPoliticsinIndia:Area,PowerandPolicyinaPenetratedSystem.Berkeley:UniversityofCaliforniaPress,1974.MyronWeinerandJohnOsgoodFieldexaminedurbanvotingtrendsinIndiafrom1952to1972.SeeWeinerMyronandJohnOsgoodField,“India’sUrbanConstituencies,”ComparativePolitics,8(2),1976.However,thisliteraturedoesnotspecificallyfocusonurbanvotingbehaviorandthefactorsaffectingurbanvoters’politicalchoicesinIndia.

42
politics.72 Because there is little relief from the ethnic character of politics, and because
ethnicity is largely an ascriptive affiliation, “the ultimate issue in every election is, starkly
put, ethnic inclusion or exclusion.”73 In particular, early scholarship on ethnic politics and
conflict highlighted the mechanism of ethnic outbidding, in which ethnic parties make
increasingly more extreme ethnic appeals that lead to political instability.74 Sri Lanka
presents an example of the way in which ethnic outbidding led to decades of ethnic
violence and civil war.75
While some scholars have identified ethnic parties with political instability, more
recent empirical research has identified the benefits and stabilizing influence of ethnic
political participation in developing countries and maturing democracies.76 In her book,
Why Ethnic Parties Succeed, Kanchan Chandra theorizes that ethnic parties in a
developing country such as India succeed in obtaining the support of members of their
targeted ethnic group because in India’s patronage-democracy characterized by severe
information constraints, voters are inclined to favor co-ethnics at the polls by supporting
the party with the greatest number of co-ethnics.77 Within this structural context of a
patronage democratic system characterized by severe information constraints, it is
72Horowitz,Donald,EthnicGroupsinConflict.Berkeley:UniversityofCaliforniaPress,1985,p.101.73Ibid,p.348.74Rabushka,AlvinandKennethShepsle,Politicsinpluralsocieties:Atheoryofdemocraticinstability.Columbus:CharlesMerrill,1972.75DeVottaNeil,“Fromethnicoutbiddingtoethnicconflict:theinstitutionalbasesforSriLanka’sseparatistwar,”NationsandNationalism11(1),2005.76Foraformalmodelexplainingthepossibilityofcooperationbetweenethnicgroups,seeFearonandLaitin,“Explaininginterethniccooperation,”AmericanPoliticalScienceReview,90(4),199677Chandra,Kanchan,WhyEthnicPartiesSucceed:PatronageandEthnicHeadCountsinIndia.Cambridge:CambridgeUniversityPress,2004.

43
strategically more efficient to exchange votes for patronage goods based on ethnically
based “bloc voting.”78
Comparative empirical research by Birnir shows that in new democracies, ethnic
identity functions as a ‘stable but flexible information shortcut for politics choices,” and
similar to Chandra’s findings, ethnic identity is used strategically by voters as a means of
achieving ethnic group objectives.79 Birnir’s research identifying nonviolent ethnic
political participation in Bulgaria, Romania, and Spain, shows that ethnic groups can
engage and compete peacefully in electoral politics.
The models by Chandra and Birnir provide new theoretical insights into ethnic
political participation and the mechanisms linking ethnic identity and interests with vote
choice. Birnir’s model in particular can account for variation in an ethnic voter’s political
choices, (i.e. whether she votes for an ethnic party or a non-ethnic party), based on the
representative capabilities of the ethnic and non-ethnic parties, and by ethnic issue
salience.80 Accordingly, her model shows that an ethnic voter could vote for a non-ethnic
party in power if 1) she ascertains that the non-ethnic party has included the salient ethnic
policy issue into its platform, or 2) the ethnic issue has decreased in importance, or no
longer has political salience for the voter.81 Birnir’s model provides a useful theoretical
mechanism for explaining the way in which ethnicity is used strategically by voters,
which in turn can account for variation in ethnic voters’ political choices.
78Chandra,2000,pgs.11‐13.79Birnir,JóhannaKristín,EthnicityandElectoralPolitics.Cambridge:CambridgeUniversityPress,2007,p.9.Birnirusesthetermethnicitytorefertocharacteristicsthatareeitherimpossibletochange,suchascolorofskin,orverydifficulttochange,suchasprimarylanguage.p.4.80Ibid,p.51.81Ibid,p.52.

44
Many scholars of comparative politics have focused on why some social
cleavages rather than others become politically salient. Lipset and Rokkan focus on the
impact of historical conflict and change in influencing which social cleavages became
politically salient over time and the basis for stable party systems to emerge in Western
Europe.82 Laitin identifies the impact of colonial rule to explain why religious divisions
are not politicized while tribal divisions remain politically salient in Yoruba, Nigeria.83
More recently, Posner identifies group size as a key factor to explain why certain ethnic
group identities are politically salient in Malawi, but not in Zambia.84
Scholars of ethnic politics have also examined what institutional factors influence
variation in the political salience of ethnic identity. In Institutions and Ethnic Politics in
Africa, Daniel Posner’s research on ethnic politics in Zambia shows that formal political
institutions can have a profound impact on which ethnic cleavage becomes salient in
voter’s political choices.85 More recently, using an experimental research design, Thad
Dunning and Lauren Harrison show that an informal cultural institution called cousinage
in Mali functions to decrease the salience of ethnic identity on vote choice in Mali.86 This
research shows how institutional context, both formal and informal, can impact the
political salience of ethnicity on vote choice.
82Lipset,SeymourMartinandSteinRokkan,PartySystemsandVoterAlignments:CrossNationalPerspectives.NewYork:TheFreePress,1967.83Laitin,David,HegemonyandCulture.Chicago:UniversityofChicagoPress,1986.84Posner,Daniel,“ThePoliticalSalienceofCulturalDifference:WhyChewasandTumbukasareAlliesinZambiaandAdversariesinMalawi,”AmericanPoliticalScienceReview,98(4),2004.85Posner,Daniel,InstitutionsandEthnicPoliticsinAfrica.Cambridge:CambridgeUniversityPress,2005.86Dunning,ThadandLaurenHarrison,“Cross‐CuttingCleavagesandEthnicVoting:AnExperimentalStudyofCousinageinMali,”AmericanPoliticalScienceReview,104(01),2010.

45
Yet, a question remains: how do we explain variation in the salience of ethnic
identity and interests in voter’s political choices over space and time across a similar
institutional context? In the context of this research project, as noted in the introduction,
we find variation in the propensity of voters to emphasize ethnic appeals over space and
time. What conditions influence variation in the political salience of ethnic group identity
and interests over space and time?
In the study of American voting behavior, scholarship on ethnic politics in the
1960s revealed the persistence of the role of ethnic voting in American politics.87 In
response to Robert Dahl’s assimilation theory in Who Governs, which predicted that
ethnic voting would decline as immigrants assimilated socially and economically,
Wolfinger found that ethnic voting persisted despite changes in social assimilation.88
Although the debate about the causes and persistence of ethnic voting subsided in the
1970s, more recent debates framed around the politics of race and religion indicate the
important role social group identity continues to play in understanding American
politics.89
Recent scholarship on social group identity and urban voting behavior in America
has sought to explain under what conditions social group identity is salient to voter’s
political choices. In her recent book, The Urban Voter, Kaufmann examines changes in
voting behavior in New York and Los Angeles, and shows that the relative levels of
perceived intergroup conflict are correlated with variation in the political salience of
87Wolfinger,Raymond,“TheDevelopmentandPersistenceofEthnicVoting,”AmericanPoliticalScienceReview,59(4),1965.Parenti,Michael,“EthnicPoliticsandthePersistenceofEthnicIdentification,”AmericanPoliticalScienceReview,61(3)1967.88Dahl,Robert,WhoGoverns?NewHaven:YaleUniversityPress,1961.89Kaufmann,Karen,TheUrbanVoter:GroupConflictandMayoralVotingBehaviorinAmericanCities.AnnArbor:TheUniversityofMichiganPress,2004,pgs.24&25.

46
group identity.90 Higher levels of perceived intergroup conflict are associated with an
increase in the political salience of social group identification, whereas in low levels of
social group conflict, voting behavior is more apt to reflect considerations such as party
identification and/or retrospective evaluations of an incumbent’s performance.91
Informed by group conflict theory, Kaufmann’s model is able to account for
variation in the political salience of social group identity through its proposition that
group identity and group cohesiveness are dynamic, and that intergroup conflict is
conditioned by the perception of competition over symbolic and material resources
between groups.92 Group-based competition over symbolic or material resources in turn
induces social conflict, which increases the political salience of social group identity and
group distinctive voting.
Drawing from sociological research, which highlights the role that changes in the
perception of group threat and competition play in influencing the level of group
identification and group cohesiveness, Kaufmann’s model defines conflict as salient
group-based resentment resulting from heightened perceptions of intergroup competition.
Kaufmann explains, “Under conditions where the candidates, the campaign rhetoric or
the external political environment emphasizes competition over scarce, desirable
resources, group members will likely exhibit higher levels of in-group identification and
will in essence become more cohesive in the face of external competition to the values
and valued resources of the group.” 93
90Ibid,p.3.91Ibid,p.152.92Ibid,p.32.93Ibid,pgs.32&33.SeeBobo,LawrenceandVincentHutchings,“PerceptionsofRacialGroupCompetition:ExtendingBlumer’sTheoryofGroupPositiontoaMultiracialContext,”American
47
Kaufmann discusses several important contextual factors which can influence the
perception of group conflict at a given point in time, namely, 1) institutional factors, such
as electoral rules and local form of government, 2) party program and campaign strategy,
such as whether or not a party or candidate focuses on a particular group-specific agenda
and 3) external factors, such as socio-political history or the local economy.94
In the context of India, the constitutionally created Election Commission of India
(ECI) directly controls the election process for all national and state level elections,
which includes establishing uniform electoral rules across all states. Thus, one feature of
conducting a comparative analysis of political behavior across Indian states is a degree of
institutional similarity relating to electoral rules as a result of the Indian election
commission’s powerful role overseeing the entire election process.
While Indian states share common electoral laws, the party systems of individual
states do vary, ranging from two-party systems to multiparty systems.95 In Votes and
Violence, Steven Wilkinson identifies the conditions under which politicians protect
minorities and act to prevent violence, and the conditions under which they do not act to
prevent ethnic violence.96 His research finds that the nature of party competition and the
effective number of parties competing for votes at the town and state level play a pivotal
role in determining the electoral incentives for preventing or allowing ethnic violence.
While Wilkinson focuses primarily on the institutional elements of party system variation
in India in explaining why Hindu-Muslim violence takes place, his model also
SociologicalReview,61(6),1996.BoboandHutchingsdiscussaframeworkforunderstandingtheformationofperceivedgroupthreatandcompetition.94Ibid,pgs.40&50.95Chhibber,PradeepandIrfanNooruddin,“DoPartySystemsCount?TheNumberofPartiesandGovernmentPerformanceintheIndianStates,”ComparativePoliticalStudies,37(02),2004.96Wilkinson,Steven,VotesandViolence:ElectoralCompetitionandEthnicRiotsinIndia.Cambridge:CambridgeUniversityPress,2004.

48
underscores the functional role that social conflict plays in influencing the salience of
social identity in voters’ electoral choices.98
In the context of this dissertation project, the state party systems of Delhi and
Gujarat are similar in that both states have two-party systems in which the Congress party
and the BJP are the predominant parties competing for votes. While the state party
systems are held constant for this dissertation, in the following discussion about party
program, I identify the role of the BJP’s ethno-political mobilization strategy as an
important factor influencing perceptions of ethnic group conflict over time.
The BJP’s political party program and campaign strategy related to Hindu-
Muslim relations in India have varied over time. As discussed in Chapter Two, in the late
1980s and 1990s, the BJP engaged in a decade long ethno-political mobilization strategy
focusing on support for building the Ram temple and advocating a vision of Indian unity
through the concept of Hindutva. By 2009, the BJP’s party program had formally shifted
its focus to issues such as promoting good governance, development and security.
However, the events surrounding Varun Gandhi’s alleged claim that he would cut off the
hand of any Muslim who threatened a Hindu, and the party’s inaction to drop him as a
political candidate, indicated that the BJP at the national level had somewhat, though not
entirely, curtailed its relationship of allowing ethno-political mobilization relating to
Hindu-Muslim relations. This variation in the BJP’s party program involving ethno-
political mobilization relating to Hindu-Muslim relations is an important contextual
factor influencing perceptions of ethnic group conflict.
98Ibid,p.4.

49
Socio-political factors related to historical Hindu-Muslim relations have also
varied across space and time in India. In 1999, all of India experienced the threat of the
Kargil war as Pakistan invaded India, putting stress on already fragile Hindu-Muslim
relations. Ten years later, the country continued to experience incidents of terror, but not
outright violent conflict or war with Pakistan. The socio-political context relating to
Hindu-Muslim relations also varies considerably over space. For example, Delhi has had
a history of low to medium conflict between Hindus and Muslims, whereas Gujarat has
experienced several major episodes of violent ethnic conflict between Muslims and
Hindus over the past forty years. This variation in the context of Hindu-Muslim relations
across space and time is another important contextual factor influencing perceptions of
ethnic group conflict.
Kaufmann’s finding that voters’ perceptions of intergroup conflict influence the
political salience of social group interests, combined with Birnir’s finding that ethnic
identity is used strategically by voters as a means of achieving ethnic group objectives,
suggests a potential mechanism to test, which links changes in the perceived level of
ethnic group conflict to changes in the political salience of ethnic group identity and
interests, as a means of explaining fluctuation in electoral support for an ethnic party,
and variation in urban voter support for the BJP.
For example, during a high level of perceived ethnic group conflict, this
mechanism would predict that voter support for an ethnic party, such as the BJP, would
be influenced by a general heightened political salience of ethnic group identity and
interests, such as a party’s stated goal to support a particular ethnic group objective like
building a Hindu temple. Yet, if conditions change and the perception of ethnic group
50
conflict is reduced over time, we would expect ethnic group objectives to decrease in
salience in voter’s political choices.
RetrospectiveVotingandVoter‐PartyLinkages
An important question remains: How do we explain a voter who votes for an
ethnic party for non-ethnic identity reasons and instead votes based on programmatic
interests, such as economic growth, corruption, or employment? In the context of
contemporary American politics, we might explain such voting behavior through a theory
of retrospective voting. Accordingly, we could test the degree to which party choice is
reflective of a voter’s evaluation of party performance on policy outcomes and an
assessment of future party performance.
Theories of retrospective voting view voters as having policy interests and a
policy results orientation, and interprets swing voters as voters who change their votes
based on rational political decisions.99 While Key posits that voters focus on policy
outcomes, Fiorina argues that citizens both monitor party promises and party
performance on outcomes related to their particular policy interests, and also make an
assessment of future incumbent and opposition party performance on policy outcomes,
with vote choice representing a running tally of a voter’s evaluation. Over time,
retrospective voting predicts that these evaluations by voters of party performance on
policy outcomes are reflected in party identification. Thus, this theory accounts for
changes in party choice depending on the individual’s assessment of party promises and
performance on policy outcomes and future party performance. Retrospective voting has
99Fiorina,Morris,RetrospectiveVotinginAmericanNationalElections.NewHaven:YaleUniversityPress,1981.Key,V.O.,Jr.,TheResponsibleElectorate:RationalityinPresidentialVoting,19361960.Cambridge:BelknapPressofHarvardUniversityPress,1966.

51
been applied and tested to voting behavior in countries including the United States,
Canada, and Nordic countries.100
In the historical context of a socially based patronage democracy like India, how
do we situate retrospective programmatic voting? Scholars studying voter-party linkages
have posited that, just as certain conditions are favorable to patronage-based voting,
other conditions can open up the door for programmatic appeals by voters.
From a comparative perspective, I believe we can gain some useful insight about
changes in voting behavior and voter-party linkages by looking at how scholars have
characterized the nature of American politics and voting behavior in the late 19th and
early 20th centuries. In writing about the history of voter registration and voter turnout,
Frances Fox Piven and Richard Cloward describe nineteenth-century politics in America
as being organized by clientelist methods through party machines, and marked by ethnic
and religious divisions.101 In City Politics, Edward Banfield and James Wilson
characterize a machine as a “party organization that depends crucially upon inducements
that are both specific and material.”102 Cities such as Chicago and Philadelphia were the
strongholds of party machines, while immigrants who were unfamiliar with American
politics and institutions and lower-income groups were often their targets.103
Some scholars have compared the political characteristics of this era in American
politics with contemporary conditions in many developing countries. Piven and Cloward
100Uslaner,Eric,“LookingForwardandBackward:ProspectiveandRetrospectiveVotinginthe1980FederalElectionsinCanada,”BritishJournalofPoliticalScience,19(4),1989.Söderlund,Peter,“RetrospectiveVotingandElectoralVolatility:ANordicPerspective,”ScandinavianPoliticalStudies,31(2),2008.101Piven,FrancesFoxandRichardCloward,WhyAmericansStillDon’tVoteandWhyPoliticiansWantItThatWay.Boston:BeaconPress,2000,pgs.49‐51.102Banfield,EdwardandJamesQ.Wilson,CityPolitics.Boston:HarvardUniversityPress,1963,p.115.103PivenandCloward,p.53;BanfieldandWilson,p.118.

52
write, “And as in other developing countries, it was clientelist party organization that
emerged to solve the problems of coordination and political integration. Clientelism
appears to thrive in situations where formal enfranchisement precedes industrialization
and the self-organization of the working class that industrialization makes possible.”104
Writing about the causes of corruption in developing countries, James Scott also draws
parallels with the social and institutional context that fostered clientelism in 19th century
American politics (i.e., strong influence of ethnic or social identity and weak formal
political institutions) to the conditions in India and some Western African states.105
Scholars have pointed to the socio-economic changes brought about by industrial
capitalism and the political reforms undertaken during the Progressive Era, as factors
influencing the decline of the political machine in American politics. As incomes rose,
more people moved above the poverty line, and public welfare programs extended, voters
increasingly no longer depended on the material benefits provided by the machine, and
patronage increasingly became an insufficient method of organizing and a less effective
linkage between parties and voters.106
I have included this short background about late 19th and early 20th century
American politics and the influence of party patronage and ethnic or religious identity
during this era because I believe it provides an historical example of the way in which
104PivenandCloward,p.52.105Scott,James,“Corruption,MachinePoliticsandPoliticalChange,”TheAmericanPoliticalScienceReview,63(4),1969,p.1145.106Burham,WalterDean,“PartySystemsandthePoliticalProcess,”inTheAmericanPartySystems:StatesofPoliticalDevelopmentSecondEdition,”Eds.WilliamNisbetChambersandWalterDeanBurnham.NewYork:OxfordUniversityPress,1975.Seealso,PivenandCloward,p.69;BanfieldandWilson,pgs.118and123.BanfieldandWilsonwrite,“Asonemovesoutfromtheriver[theriverwardsbeingwherethepoorestlive]andtherailroadyardsfirstintolower‐middleclassdistricts,thenintomiddle‐classones,andfinally(usuallyinthesuburbsbeyondthecityproper)intoupper‐middleclassterritory,fewerandfewerprecinctsaremannedandthetiestothemachinebecomefewerandweakeruntiltheyceasetoexist,”p.118.

53
some scholars have viewed the impact of structural socio-economic changes on political
development (i.e. the move away from machine party politics) and on the linkages
connecting parties to voters.
As the nature of American politics evolved and changed in the 20th century,
scholars developed new theories to explain voting behavior beyond the machine,
developing new schools of thought, most prominently the social-psychological approach,
and the economic or rational choice approach, to the study of American voting behavior.
Recent scholarship in comparative politics has sought to conceptualize the
different types of voter-party linkage mechanisms in democracies, and to provide the
theoretical underpinnings for explaining linkage formation and change.107 In Linkages
Between Citizens and Politicians in Democratic Polities, Herbert Kitschelt outlines the
conceptual differences between three types of voter-party linkage mechanisms
(charismatic, clientelistic and programmatic) and presents several theoretical approaches
for explaining voter-party linkage formation and change.108
Kitschelt, in particular, focuses on providing analytical distinctions between
clientelistic (or patronage-based) and programmatic linkages, which are distinguished by
different modes of political exchange (direct versus indirect), and the degree of policy
107Itisrelevanttonoteherethatearliermodernizationliteratureaddressedarelatedissueofpoliticaldevelopmentandthequestionofwhatsocialoreconomicchangespromotedifferenttypesofpoliticalorganizationandpoliticalparticipation.AclassicexampleofthisliteratureisSamuelHuntington’scritiqueofmodernizationtheoryinPoliticalOrderinChangingSocieties.NewHaven:YaleUniversityPress,1968.WhileHuntingtonassociatestheearlystagesofmodernizationwithcorruption,heassociatesthelatterstagesofmodernizationwiththepotentialforstrongerpoliticalpartiesandpartisanship.Huntington’sanalysisgivesamacro‐levelaccountofthedistinctionsbetweeneconomicandsocialdevelopment,andpoliticaldevelopment,andtheimportanceofthelatteronthenatureofpoliticalorganizationandpoliticalparticipation,butitdoesnotprovidethemicro‐levelfoundationsforexplaininghowvotersinthecontextofapatronagedemocracyintransitionwouldhavetheincentivetovotebasedonpartisanorprogrammaticissues.108Kitschelt,Herbert,“LinkagesbetweenCitizensandPoliticiansinDemocraticPolities,”ComparativePoliticalStudies,33(6‐7),2000.
54
preference identification and ranking (program formation). Among several theoretical
approaches outlined in the article to explain voter-party linkage formation and change,
two approaches in particular, which focus on socioeconomic development and political
economy, are particularly useful in situating programmatic voting in a developing
country context, by highlighting the factors that create the conditions for programmatic
appeals by voters.
The socioeconomic development approach highlights factors such as changes in
citizen income and education levels as key factors in explaining voter-party linkage
formation and change. The micrologic of this approach is that poor citizens discount
future rewards and must rely on clientelistic or patronage-based exchanges, whereas
increasing levels of affluence put citizens in a position to be able to demand indirect
collective goods. The political economy approach highlights structural changes such as
trade exposure and the size of the public sector economy to explain linkage formation and
change. The micrologic of this approach is that the size of the public sector economy
impacts politicians’ ability to employ public sector resources to build clientelistic
linkages.
Together, these two approaches, socioeconomic development and political
economy, can be useful in explaining how, as economic reforms and rapid economic
growth in a developing country context create the conditions for rising incomes and a
new range of economic opportunities not limited to the public sector, more citizens are in
a position to make programmatic appeals and to vote based on a retrospective assessment
of party programmatic performance.

55
Recent empirical studies suggest the relevance of these theoretical approaches in
understanding changes in voter-party linkages in developing countries. In an empirical
study of patronage and partisanship in the context of Argentine electoral politics, Calvo
and Murillo find that low income/skilled workers are more sensitive to patronage
spending than higher income/skilled workers, and that patronage in particular benefits
parties with low-skilled constituencies. The authors posit that the changes produced from
economic development on voter demand, including changing income and skill levels and
distribution, and new employment alternatives, in turn affects the propensity of citizens to
accept patronage in return for votes.109
Research on changes in political party behavior in Brazil identifies major state
and market reforms of the 1990s as the key catalyst for explaining a shift away from
patronage-based electoral strategies and toward a greater use of programmatic-based
electoral strategies.110 Hagopian et al. argue that the structural changes resulting from
Brazil’s state and market reforms have reduced the efficiency of patronage based
electoral strategies (such as reducing the level of access to government spending for
patronage), in turn, making programmatic elements of party competition more attractive.
While the paper focuses on the changes taking place in the behavior of politicians, it does
not explore the impact of Brazil’s state and market reforms on voting behavior, and the
possible changes in voters’ evaluation and demands on political parties.
Of particular relevance for this study, in Explaining Changing Patterns of Party-
Voter Linkages in India, Steven Wilkinson makes a similar argument based on changes in
109Calvo,Ernesto,andMariaVictoriaMurillo,“WhoDelivers?PartisanClientsintheArgentineElectoralMarket,”AmericanJournalofPoliticalScience,48(4),October2004.110Hagopian,Frances,CarlosGervasoniandJuanAndrewsMoraes,“FromPatronagetoProgram–TheEmergenceofParty‐OrientedLegislatorsinBrazil,”ComparativePoliticalStudies,42(3),2009.

56
India’s political economy and economic development, positing that India’s economic
reforms and rapid economic development have led to higher income and education levels,
and growth and diversity in the private sector, which has opened up the door for the
possibility of a decline in the usefulness of patronage, such as less reliance on state jobs
or subsidies, and an increase in programmatic demands by voters.111
Wilkinson posits that demands for reform of clientelist politics and an increase in
demand for programmatic party competition is not equal across India, and ranks Indian
states according to the likelihood of demand for political reform based on economic,
social and media indicators. According to his analysis, the states of Delhi and Gujarat
are among the states with the highest likelihood for political change away from
clientelistic politics and toward programmatic appeals by voters, because these states
have experienced high levels of economic growth, and have a comparatively high level of
literacy and a large mass media audience.112
The political economy and socioeconomic development theoretical approaches to
explaining voter-party linkage formation and change outlined by Kitschelt and the recent
empirical studies of the factors affecting voter-party linkage formation and change in
developing counties such as Argentina, Brazil and India, suggest a means of situating and
contextualizing retrospective programmatic voting in India.
These theoretical approaches to explaining voter-party linkage mechanisms and
the factors affecting programmatic linkage formation suggest a second mechanism to
111Wilkinson,Steven,“ExplainingChangingPatternsofParty‐VoterLinkagesinIndia,”inPatrons,ClientsandPolicies–PatternsofDemocraticAccountabilityandPoliticalCompetition,”Eds.HerbertKitscheltandStevenWilkinson.Cambridge:CambridgeUniversityPress,2007,p.133.112WilkinsonusesthreeindicatorstorankIndianstatesbythelikelihoodthattheywillbeopentopoliticalreformawayfromclientelisticpoliticsandtowardprogrammaticpolitics:1:percapitanetstatedomesticproduct,2)literacy,and3)mediapenetration,p.139.

57
test, which links the changes resulting from economic growth and economic reforms to
creating the conditions for an increasing number of voters to make retrospective
programmatic appeals, as a means of explaining programmatic electoral support for
ethnic parties, and variation in urban voter support for the BJP.
This second mechanism could potentially explain why a voter might vote for an
ethnic party for non-ethnic reasons and instead vote based on retrospective programmatic
interests such as employment, inflation or economic growth. For example, this
mechanism could explain how a voter in one election votes for the BJP largely in support
of the party’s programmatic positions on the economy (or some other set of
programmatic issues), and in a subsequent election, she may choose to continue to vote
for the BJP, or she may punish the party and vote for another party, based on a
retrospective evaluation of party performance on policy outcomes and an assessment of
future party performance.
EthnicallyMediatedRetrospectiveVotingTheory(ERV)
Drawing from theoretical ideas highlighted in this chapter on ethnicity and
electoral politics, retrospective voting behavior, and voter-party linkage mechanisms, I
present Ethnically Mediated Retrospective Voting (ERV), a theoretical framework for
understanding the way in which ethnic and programmatic interests influence voter
support for an ethnic party, and explaining variation in urban voter support for the BJP.
ERV theory proposes two mechanisms which aim to explain the conditions under
which 1) ethnic group identity and interests, and 2) retrospective programmatic interests,
function to explain the BJP’s rise to power and continued dominance from 1999 to 2009

58
in Gujarat, compared with the rise and fall of BJP dominance in Delhi over the same
timeframe.
As noted in the introduction, ERV is a theory of retrospective voting which is
adapted to explain voting behavior and voter support for an ethnic party in a developing
country context, that seeks to account for the impact of 1) changes in the perceived level
of ethnic group conflict, and 2) changes brought about by rapid economic growth and
reform, on voters’ political choices.
Before outlining ERV theory, it is useful to first define some key terms and
clarify assumptions used in the following discussion and throughout the remainder of the
dissertation. Ethnicity and ethnic identity are defined as a subset of identity categories in
which eligibility for membership is determined by attributes associated with descent or
descent-based attributes.113 Drawing from constructivist arguments, ethnic identity and
ethnic identification are conceived as fluid and may change over time.114 Drawing from
Kaufmann and group conflict theory, ethnic group conflict is defined as group-based
resentment or friction resulting from perceptions of heightened group threat or
competition between or among groups.115 This definition views ethnic group conflict as a
dynamic condition, which may change over time depending on contextual factors.
As noted in the introduction, an ethnic party is defined as a party that overtly
represents itself as a champion of an ethnic group to the exclusion of others.116 In India,
key ethnic identities include Hindu versus Muslim, or upper-caste versus lower-caste.
113Chandra,Kanchan,“WhatisEthnicityandDoesitMatter?,”AnnualReviewofPoliticalScience,9,2006.Chandrareviewsexistingdefinitionsofethnicidentityandhighlightsthatdescentisanimportantaspectoftheseearlierdefinitions.114Birnir,2007,p.4.115Kaufmann,pgs.32&39.116Chandra,2004,p.3.

59
The Bharatiya Janata Party is considered an ethnic party in the context of this dissertation
research project. Ethnic voting refers to voting for a party that is identified with a voter’s
ethnic group or an ethnic group objective.117
Drawing from the literatures on American voting behavior and on voter-party
linkage mechanisms, I use the term, retrospective programmatic voting, to mean voting
based on an assessment of incumbent performance as well as an assessment of future
incumbent and opposition party performance on programmatic issues of concern. It is
similar to Fiorina’s definition of retrospective voting, but emphasizes the programmatic
element of political exchange (i.e., indirect, based on a package of policy positions,
etc.).118
Informed by Kitschelt’s research on voter-party linkage formation and change
(i.e. the socioeconomic development and political economy approaches), I use the phrase,
the political economy of development, to refer to the structural changes associated with
economic reform (such as changes in economic openness and the size of the public
sector) and economic development (such as changes in citizen income and level of
affluence, etc.) in a developing country context.119
117Horowitz,EthnicGroupsinConflict,pgs.319‐320.Horowitzidentifiestwodefinitionsofethnicvoting.Inthefirstdefinition,membersofanethnicgroupidentifywithaparticularparty.Intheseconddefinition,membersofanethnicgroupvoteforacandidatebelongingtothesameethnicgroup.ForthisdissertationIuseethnicvotingtomeantheformerdefinition.118Onemayreasonablyaskwhynotjustusetheterm,retrospectivevoting.IntheliteratureonAmericanvotingbehavior,retrospectivevotingreferstomakinganassessmentofpartyperformanceonpolicyoutcomes.IntheComparativePoliticsliterature,programmaticpoliticsandvoter‐partylinkagesreferstopoliticsthatarenotbasedonpatronageorethnicgroupidentity.Takingintoconsiderationthedifferentconnotationsofbothterms,retrospectivevotingandprogrammaticpolitics,Iusethetermretrospectiveprogrammaticvotingtomeanvotingthatisneitherbasedonpatronagevoter‐partylinkages,norbasedonanassessmentofperformanceonethnicpolicyissues,butratherbasedonanassessmentofperformanceonprogrammaticissues,whichcouldincludeissuessuchasdevelopment,corruption,inflation,etc.119Kitschelt,pgs.856&862.

60
In addition to the above definitions, I make the assumption that an Indian voter
makes a vote choice in a way that best serves her particular objectives. I assume that
voters have political preferences that can be ordered, however, I do not assume that
voters value the same sorts of things. This assumption has been characterized as
instrumental rationality or a thin-rational account of human behavior.120
In presenting ERV theory, I will first describe each mechanism individually, and
then show how these two mechanisms together create testable scenarios for explaining
voting behavior and voter support for an ethnic party such as the BJP over space and
time. The first mechanism posits that an increase in the perceived level of ethnic group
conflict in turn creates the conditions for an increase in the political salience of ethnic
group identity and interests. The second mechanism posits that changes resulting from
economic reform and economic growth create the conditions for increasing retrospective
programmatic demands by voters.
I start with the assumption that in many poor countries, voters often sell their
votes in exchange for access to state-provided material goods and services, such that the
party-voter relationship is often based on an expectation of votes in return for patronage.
As discussed earlier, electoral politics in India have been characterized by patronage
democratic linkages between parties and voters that has favored ethnic bloc voting.
ERV first posits that under conditions of heightened levels of perceived ethnic group conflict, ethnic group identity and interests increase in salience for voters’ political choices.
120Green,DonaldandIanShapiro,PathologiesofRationalChoiceTheory:ACritiqueofApplicationsinPoliticalScience.NewHaven:YaleUniversityPress,1994.
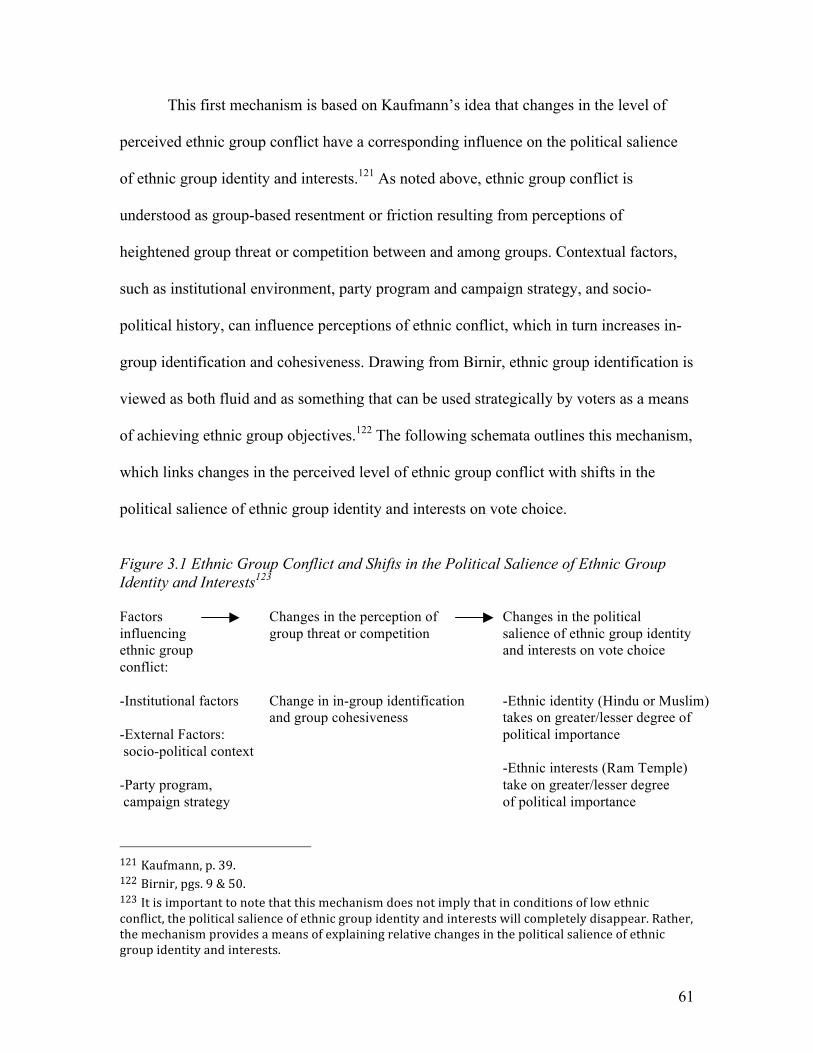
61
This first mechanism is based on Kaufmann’s idea that changes in the level of
perceived ethnic group conflict have a corresponding influence on the political salience
of ethnic group identity and interests.121 As noted above, ethnic group conflict is
understood as group-based resentment or friction resulting from perceptions of
heightened group threat or competition between and among groups. Contextual factors,
such as institutional environment, party program and campaign strategy, and socio-
political history, can influence perceptions of ethnic conflict, which in turn increases in-
group identification and cohesiveness. Drawing from Birnir, ethnic group identification is
viewed as both fluid and as something that can be used strategically by voters as a means
of achieving ethnic group objectives.122 The following schemata outlines this mechanism,
which links changes in the perceived level of ethnic group conflict with shifts in the
political salience of ethnic group identity and interests on vote choice.
Figure 3.1 Ethnic Group Conflict and Shifts in the Political Salience of Ethnic Group Identity and Interests123 Factors Changes in the perception of Changes in the political influencing group threat or competition salience of ethnic group identity ethnic group and interests on vote choice conflict: -Institutional factors Change in in-group identification -Ethnic identity (Hindu or Muslim) and group cohesiveness takes on greater/lesser degree of -External Factors: political importance socio-political context -Ethnic interests (Ram Temple) -Party program, take on greater/lesser degree campaign strategy of political importance
121Kaufmann,p.39.122Birnir,pgs.9&50.123Itisimportanttonotethatthismechanismdoesnotimplythatinconditionsoflowethnicconflict,thepoliticalsalienceofethnicgroupidentityandinterestswillcompletelydisappear.Rather,themechanismprovidesameansofexplainingrelativechangesinthepoliticalsalienceofethnicgroupidentityandinterests.
62
Based on this mechanism, I posit that changes in the perceived level of ethnic
group conflict in Delhi and Gujarat correspond to shifts in the political salience of ethnic
group identity and interests on urban voting behavior.
Hypothesis 1: All things being equal, urban electoral support for the BJP hinges upon changes in the perceived level of ethnic group conflict and the corresponding shifts in the political salience of ethnic group identity and interests on vote choice.
H1 hypothesizes that variation in urban voter support for the BJP during the 1999-
2009 timeframe can be explained by changes in the perceived level of ethnic group
conflict between Hindus and Muslims, leading to corresponding shifts in the political
salience of ethnic group identity and interests on voting behavior. In particular, voters in
Delhi and Gujarat have had different experiences with regard to ethnic group conflict
over the 1999 to 2009 timeframe. Both Delhi and Gujarat have experienced some
common contextual factors, such as the BJP’s ethno-political mobilization strategy
focusing on a particular group specific agenda (i.e., Ram temple and Hindutva), and the
Kargil War with Pakistan in 1999, which in turn heightened the perception of group
threat in both locations, particularly during the 1999 election. However, other contextual
factors, such as historical Hindu-Muslim relations in each state have varied considerably.
Gujarat, and Ahmedabad in particular, has experienced several major episodes of large-
scale violent ethnic group conflict over the past four decades, whereas Delhi has
experienced low to medium levels of conflict between Hindus and Muslims. This
variation in the context of Hindu-Muslim relations at the state level has influenced
whether or not the perception of group threat has remained heightened or decreased over

63
time. H1 posits that this variation in the perception of ethnic group conflict between
Hindus and Muslims over time and space can explain the differences in the political
salience of ethnic group identity and interests, and in turn, variation in electoral support
for the BJP.
Second, ERV posits that under conditions of economic reform and rapid economic development, voters are inclined to approach political choices based on a retrospective assessment of party performance pertaining to programmatic issues.
This second mechanism is based on Kitschelt’s idea that structural changes
associated with a strong political economy of development support programmatic voter-
party linkage formation and retrospective programmatic demands. This claim posits that
economic development and economic reforms create the conditions for new opportunities
and expectations by voters, which in turn creates the possibility for an increasing number
of voters to make retrospective programmatic demands on government and political
leaders. The following schemata outlines this mechanism, which links rapid economic
development and economic reforms with an increase in retrospective programmatic
demands by voters.
Figure 3.2 Political Economy of Development and Shifts in Retrospective Programmatic Demands by Voters Economic New opportunities to increase Changes in voter demands Reforms and skills, income and education on government and political Economic leaders Development Growing size of private sector, Expansion of different types of Voters are able to consider future Employment opportunities indirect needs and rewards, and engage in programmatic assessment of party performance (i.e., consider public policies, public goods provisions, etc.)

64
Based on this mechanism, I posit that rapid economic reform and development in
Delhi and Gujarat have created the conditions in which increasing numbers of voters are
able to consider future indirect needs and rewards, and in turn to make retrospective
programmatic demands when choosing government and political leaders.
Hypothesis 2: All things being equal, urban electoral support for the BJP hinges upon changes in the political economy of development and the corresponding shift in retrospective demands on party performance pertaining to programmatic issues and policies.
H2 hypothesizes that variation in urban voter support for the BJP during the 1999-2009
timeframe can be explained by changes in the political economy of development, leading
to shifts in retrospective programmatic demands by voters. In particular, Delhi and
Gujarat have each experienced a high political economy of development in recent years.
Delhi experienced high levels of economic growth during the entire 1999-2009
timeframe, while Gujarat experienced low economic growth in 1999, and increasingly
higher levels of growth in the following years. H2 posits that the changes associated with
a strong political economy of development can explain changes in retrospective
programmatic demands by voters, and in turn variation in electoral support for the BJP.
For voters living in conditions with an increasingly strong political economy of
development, H2 predicts that retrospective programmatic interests are increasingly
influential factors explaining voter support for the BJP.
How does ERV help us better understand voter support for an ethnic party such as
the BJP? While political patronage in return for votes will likely continue in India into
the future, in positing the conditions which increase the political salience of ethnic group

65
identity and interests, ERV offers a mechanism for understanding variation in voter
support for an ethnic party, based on shifts in the perceived level of ethnic group conflict.
Additionally, in providing a mechanism to explain programmatic voter-party
linkage formation, which posits the conditions in which an increasing number of voters
are able to make retrospective programmatic demands in a developing country context,
ERV also offers a means to understand how voters may view and evaluate an ethnic party
not only in terms of its promises to a particular ethnic group, but also in terms of the
party’s ability to deliver on non-ethnic (i.e., programmatic) issues, such as inflation,
economic growth, public works, or corruption. Figure 3.3 illustrates the emerging voter-
party linkages in India posited by ERV.
Figure 3.3 ERV: Theorizing Emerging Linkages between Voters and Parties in India Historical Mechanisms of Change Emerging Linkages between Voters Linkage between and Parties in India Voters and Parties in India 1) Political Economy of Dev’t 1) Programmatic demands by voters: (creates new set of political Retrospective programmatic voting 1) Socially-based and economic expectations) Patronage voting (voting in exchange 2) Shifts in Ethnic conflict 2) Shifts in political salience of ethnic for access to state (creates changes in salience of group identity and interests: resources along ethnic ethnicity on vote choice) Ethnic group identity voting lines)
The left side of the table represents the historical voter-party linkage mechanism
in which votes are given in exchange for access to state resources often along ethnic
lines. The middle column represents ERV’s mechanisms linking changes in the political
economy of development with a new set of political and economic expectations such as
demanding indirect collective (i.e. programmatic) goods rather than direct (i.e. patronage)

66
goods, and shifts in ethnic conflict with changes in the political salience of ethnic group
identity and interests. The right column postulates emerging linkages between voters and
parties, suggesting a strengthening of retrospective programmatic voter-party linkages in
India, particularly in areas experiencing a sustained high level of economic reform and
development. The potential for voting based on ethnic group identity and interests does
not go away, but is increasingly linked to shifts in the perceived level of ethnic group
conflict.
Alternative Hypothesis
Hypothesis 3: All things being equal, urban electoral support for the BJP hinges upon changes in the level of religiosity of voters.
Social cleavage theory is one predominant means of explaining voting patterns
and party systems. Chhibber notes that Indian electoral politics have been studied through
the lens of social cleavages, particularly caste or religion, to explain vote choice. This
hypothesis tests the relevance of the cleavage related a voter’s religious beliefs and
degree of religiosity to explain urban voter support for the BJP.
ERV’sTestableImplications
To illustrate ERV’s theoretical propositions, the following table identifies four
different predicted scenarios of patterns of voting behavior resulting from the
combination of these two mechanisms. The vertical axis identifies and characterizes
conditions based on the H1 mechanism (i.e. different levels of ethnic group conflict); the
horizontal axis identifies and characterizes conditions based on the H2 mechanism (i.e.
different levels of political economy of development). Each cell posits different

67
generalized scenarios of the relative influence of ethnic and programmatic interests in
explaining overall voter support for an ethnic party such as the BJP.
Table 3.1 ERV’s predicted generalized scenarios of voting behavior and voter support for an ethnic party in different social and economic conditions
ERV Mechanisms: H1, H2
H2. Political Economy of Development: High
H2. Political Economy of Development: Low
H1. Ethnic Conflict: High
Scenario 1 i. Retrospective programmatic voting high ii. Political salience of ethnic group identity and interests on vote choice is high
Scenario 2 i. Limited retrospective programmatic voting ii. Political salience of ethnic group identity and interests on vote choice is high
H1. Ethnic Conflict: Low
Scenario 3 i. Retrospective programmatic voting high ii. Political salience of ethnic group identity and interests on vote choice is low
Scenario 4 i. Limited retrospective programmatic voting ii. Patronage-based voting high
Though the four scenarios of patterns of voting behavior are generalized ideal
types, the above table is useful for positing the ways in which ERV’s two mechanisms
together predict the relative influence of ethnic and programmatic interests in explaining
overall voter support for an ethnic party such as the BJP under different socio-economic
conditions. To begin with, in conditions with little economic reform and low economic
growth, and a low level of ethnic conflict, represented by scenario 4 in the lower right
hand corner, many voters are expected to discount future rewards and rely more heavily
on direct patronage-based exchanges. These conditions are reflective of the assumption
that in many poor countries, many voters often sell their votes in exchange for access to
68
state provided material goods and services. Patronage-based voting may have an ethnic
component.
While some scholars such as Ralph Meyer and Myron Weiner have considered
the role of retrospective voting and government policy in explaining electoral outcomes
in India, scenario 4 represents the assumption by many scholars of Indian politics that
electoral politics in India has historically been characterized by patronage-based
democratic linkages between parties and voters (i.e., represented in the left-hand side of
Figure 3.3). Kanchan Chandra’s research on patronage and ethnic parties in India best
addresses the predicted pattern of voting behavior in this scenario, and provides the most
in-depth theoretical work explaining the historical patronage-based nature of Indian
politics, and why voters may vote for an ethnic party in the context of a patronage
democracy. In this scenario, voting behavior and voter support for an ethnic party is
largely driven by the aim of securing access to state benefits.
Under conditions where the perceived level of ethnic conflict is high but the
political economy of development is low, represented by scenario 2 in the upper right
hand corner, ERV predicts an increase in the political salience of ethnic group identity
and interests to explain voting behavior and voter support for an ethnic party, while
retrospective programmatic interests are limited. In this scenario, the effect of H1 (i.e. a
heightened political salience of ethnic group identity and interests) is posited to have a
relatively greater influence than the effect of H2 (i.e. retrospective programmatic
interests) on voting behavior and explaining voter support for an ethnic party. Under
socio-economic conditions represented by scenario 2, we would expect that voting
behavior and explaining voter support for the BJP would be strongly influenced by a

69
heightened political salience of ethnic group identity and interests, while retrospective
programmatic interests would be a less influential factor.
Alternatively, under conditions where the perceived level of ethnic conflict is low
but the political economy of development is high, represented by scenario 3 in the lower
left hand corner, ERV predicts that an increasing number of voters can make
retrospective programmatic demands on government and political leaders to explain
voting behavior and voter support for an ethnic party, while the political salience of
ethnic group identity and interests is a less influential factor. In this scenario, the effect of
H2 (i.e. retrospective programmatic interests) is posited to have a relatively greater
influence than the effect of H1 (i.e. a heightened political salience of ethnic group
identity and interests) on voting behavior and explaining voter support for an ethnic
party. Under socio-economic conditions represented by scenario 3, with a low degree of
ethnic conflict and a high political economy of development, we would expect that
retrospective programmatic interests would play a strong role in explaining voting
behavior and voter support for the BJP, while ethnic group identity and interests would
be a less influential factor.
Finally, under conditions of a high level of political economy of development, and
a high level of ethnic group conflict, represented by scenario 1 in the upper left hand
corner, we would expect to find both retrospective programmatic interests and ethnic
group identity and interests to be strong factors in explaining voting behavior and voter
support for an ethnic party. In the previous two scenarios, one mechanism is posited to
have a relatively greater influence than the other mechanism in explaining overall voter

70
support for an ethnic party. However, in this scenario, both mechanisms are posited to
have strong roles in explaining overall voter support for an ethnic party.
Scenarios 1, 2 and 3 hypothesize the ways in which the combination of ERV’s
two mechanisms under different socio-economic conditions predict different patterns in
the relative influence of ethnic group identity and interests and retrospective
programmatic interests on voting behavior and explaining overall voter support for an
ethnic party. As these scenarios are ideal types representing the way in which different
constellations of ethnic group interests and retrospective programmatic interests factor
into explaining overall electoral support for an ethnic party, a key question to consider is
if the combination of these mechanisms influences individual voters’ political choices in
different ways.
As noted earlier, I assume in this dissertation that an Indian voter makes a vote
choice in a way that best serves her particular objectives. I assume that voters have
political preferences that can be ordered, but I do not assume that voters value the same
sorts of things. Thus, we may ask if some voters’ political choices are generally more
influenced by the risks (i.e., perception of group threat or competition) associated from
the perception of ethnic group conflict than the rewards associated from economic
reforms and development, while other voters are in general more influenced by the
rewards of economic reforms and development than the threats associated from ethnic
group conflict. In other words, could differences in an individual voter’s assessment of
ethnic group conflict and economic reforms and development have a subsequent role in
the relative influence of ethnic group identity and interests or retrospective
programmatic interests on vote choice and explaining individual voter support for an

71
ethnic party? The following table posits four hypothesized types of individual voting
behavior, which represent the impact of differences in a voter’s perception of the in-
group threat from ethnic group conflict and the rewards from economic reforms and
development on vote choice.
Table 3.2 Scenarios of Individual Voting Behavior: based on differences in the way in which ERV’s mechanisms impact individual vote choice Individual Voting Behavior Type
Ethnic Conflict Perceived Group Threat
Economic Reforms and Development Perceived Reward
Impact on Vote Choice/Support for Ethnic Party
Type 1 Low High Predominantly influenced by programmatic interests
Type 2 High Low Predominantly influenced by ethnic identity interests
Type 3 High High When ethnic conflict heightened, ethnic interests override programmatic interests; when economic reforms and dev’t increases, programmatic interests override ethnic interests
Type 4 Low Low Influenced by reward from patronage, or other interests
While table 3.1 posits four generalized scenarios of patterns of voting behavior,
mapping the combination of ERV’s two mechanisms under different socio-economic
conditions with changes in the relative degree of influence of ethnic and programmatic
interests in explaining overall voter support for an ethnic party, table 3.2 posits 4 types of

72
individual voting behavior based on the different ways in which ERV’s mechanisms
impact individual vote choice. These four hypothesized types of individual voting
behavior posit differences in an individual voter’s assessment of the perceived risks and
rewards from ethnic group conflict and from economic reforms and development, which
in turn impact the relative influence of ethnic group identity and interests and
retrospective programmatic interests on vote choice at the individual level and the
reasons for voting for an ethnic party.
The first type of individual voting behavior, type 1, is characterized by a voter
who perceives a high level of reward from the opportunities arising from economic
reforms and development, and generally perceives a lower level of in-group threat from
ethnic group conflict. For this type of voter, changes in the perception of group threat or
competition is generally less likely to impact the individual’s sense of in-group
identification and result in the increase in the political salience of ethnic group identity.
Rather, this voter is generally more influenced by the opportunities posed by economic
reforms and development, and thus vote choice and the evaluation of an ethnic party is
predominantly influenced by retrospective programmatic interests under scenarios of low
ethnic conflict as well as high ethnic conflict.
Alternatively, the second type of individual voting behavior, type 2, is
characterized by a voter who perceives a generally high level of risk of group threat or
competition from ethnic conflict, and a comparatively lower level of reward arising from
economic reforms and development. For this type of voter, the perception of group threat
or competition is high, increasing an individual’s sense of in-group identification and
resulting in a general heightened political salience of ethnic group identity and interests.
73
As a result, this voter is quite sensitive to the perceived threat from ethnic group conflict
(i.e., under scenarios with a high level of perceived ethnic conflict as well as a low level
of perceived ethnic conflict), and thus vote choice and the evaluation of an ethnic party is
predominantly influenced by a heighted political salience of ethnic group identity and
interests.
The third type of individual voting behavior is characterized by a voter who
perceives both a high level of risk from ethnic group conflict, and a high level of reward
from economic reforms and development. For this voter, who is influenced by both the
perceived risks of group threat or competition from ethnic conflict and the perceived
opportunities posed by economic reforms and development, we can hypothesize that
changes in socio-economic conditions in turn change the relative importance of ethnic
group identity and interests and retrospective programmatic interests on vote choice and
the factors affecting support for an ethnic party.
In conditions of a heightened level of perceived ethnic group conflict, such as in
scenario 2 in table 3.1, the political salience of ethnic interests for this voter is likely to
swamp out retrospective programmatic interests in explaining vote choice and voter
support for an ethnic party. By contrast, in conditions of a high political economy of
development such as in scenario 3 in table 3.1, retrospective programmatic interests are
likely to swamp out ethnic group identity and interests in explaining vote choice and
voter support for an ethnic party.
We can ask, what happens to this voter in conditions of a high level of ethnic
conflict and a high political economy of development, represented in scenario 1 in table
3.1. Since this voter is influenced by both the perceived risks of ethnic group conflict and
74
the rewards of economic reforms and development, I posit that it depends on what
conditions changed that resulted in scenario 1, which in turn impacts the relative degree
of influence of ethnic interests and programmatic interests on vote choice.
Thus, if a heightened level of perceived ethnic group conflict led to a change in
conditions from scenario 3 to scenario 1, I posit that the political salience of ethnic group
identity and interests is likely to swamp out retrospective programmatic interests in
explaining vote choice and voter support for an ethnic party. However, if an increasingly
high political economy of development led to a change in conditions from scenario 2 to
scenario 1, I posit that retrospective programmatic interests are likely to swamp out
ethnic interests in explaining vote choice and voter support for an ethnic party.
For this third type of voting behavior, the interaction of ERV’s mechanisms under
different socio-economic conditions changes the relative influence of ethnic group
identity and interests and retrospective programmatic interests on individual vote choice,
which in turn helps to explain in part relative changes in the overall level of influence of
ethnic and programmatic interests in explaining voter support for an ethnic party.
Lastly, the fourth type of individual voting behavior is characterized by a voter
who perceives both a low level of reward from economic reforms and development, as
well as a low level of risk from ethnic group conflict. For this voter, I hypothesize that
either patronage-based interests or some other type of interest influences vote choice and
the decision to vote for an ethnic party.
In testing ERV as a means of explaining variation in urban voter support for the
BJP, it is important to examine not only the impact of ERV’s mechanisms on overall
support for the BJP, but also the impact of these mechanisms on individual voting

75
behavior. In the following chapter discussing research design and methodology, I put
forward a research plan for examining the way in which ethnic and programmatic
interests influence voter support for the BJP at the societal level, and also how these
factors influence voting behavior and voter support for the BJP for the individual voter.
To test the implications of ERV theory for explaining variation in urban voter
support for the BJP over space and time, I have created below a table which categorizes
the social and economic conditions in Delhi and Gujarat by 1) the level of political
economy of development, and 2) ethnic conflict relating to Hindu-Muslim relations,
during the 1999, 2004 and 2009 national elections. Since no previous categorization
exists for assigning levels of ethnic group conflict and the political economy of
development for Indian states, I then discuss the rationale behind the metrics used for
categorizing these two conditions in Delhi and Gujarat in the 1999, 2004 and 2009
elections.
Table 3.3 Levels of political economy of development and ethnic conflict in Delhi and Gujarat, 1999, 2004 and 2009 elections
National Election Year Level of Political Economy of Development
Level of Ethnic Conflict
Delhi: 1999 High Medium Delhi: 2004 Very high Medium-Low Delhi: 2009 Very high Low Gujarat: 1999 Low Very high Gujarat: 2004 High High Gujarat: 2009 High Medium
Source: Author’s categories
Informed by Kitschelt’s socioeconomic development approach and political
economy approach to explaining programmatic voter-party linkage formation, I use
76
three measures to categorize the level of political economy of development.124 The
socioeconomic development approach identifies rising levels of affluence as an
important factor for explaining programmatic voter-party linkage formation. Based on
this proposition, I use measures of state domestic product and state poverty levels as
indicators of socioeconomic development.
The political economy approach highlights the size of the public sector and
trade exposure (i.e. economic openness) as important factors influencing
programmatic voter-party linkage formation. Economic openness is often measured
from trade flows, FDI inflows and financial capital inflows. Though state level data of
the size of the public sector and state trade flows are unavailable, some studies of
statewide variation in FDI inflows over time in India do exist. Therefore, I use FDI
inflows as a measure of economic openness. These three measures, 1) state domestic
product, 2) state poverty levels, and 3) state wide variation in FDI inflows, provide an
overall picture of changes in socioeconomic development and economic openness at
the state level, which are used to categorize the level of political economy of
development for each state during the 1999, 2004 and 2009 elections.
I use two measures to categorize the level of ethnic group conflict for each
state: 1) the historical political context of ethnic relations, including riots resulting
from Hindu-Muslim violence during the ten-year timeframe and 2) voter survey data
from the 1999 and 2004 Indian National Election Studies about the perception of
changes in relations between Hindus and Muslims. I draw in part from the Varshney
Wilkinson Dataset on Hindu-Muslim Violence in India to assess the political context
124Kitschelt,pgs.856&862.

77
of the degree of ethnic riots over time in each state.125 Additionally, voter survey data
from the Indian NES provides unique insight into voter perceptions about Hindu-
Muslims relations, and whether these relations have improved or deteriorated. Using
this combination of empirical data on ethnic conflict and data on voter perceptions of
ethnic relations, I categorize the level of ethnic group conflict for each state during the
1999, 2004 and 2009 elections.
Political Economy of Development in Delhi
Delhi’s economy is one of the largest in the country, and has experienced
increasingly high levels of economic growth and openness from 1999 to 2009.126
During this timeframe, Delhi’s annual economic growth rates, measured in changes in
the state domestic product, were robust and continued to increase, from 11.9 percent in
1999-2000, to 14.5 percent in 2004-2005, and 16.8 percent in 2008-2009.127 From
January 2000 to March 2009, Foreign Direct Investment (FDI) annual inflows into
India grew by 1500 percent, increasing from US $2,155 million to US $33,613
million. Over this time, Delhi received 14 percent of the country’s total FDI, the
second highest amount after Mumbai.128
125“VarshneyWilkinsonDatasetonHindu‐MuslimViolenceinIndia,Version2,”AshutoshVarshneyandStevenWilkinson,October8,1004,availableatwww.icpsr.umich.edu.126AccordingtothePlanningCommissionofIndia,asof2011‐2012,Delhi’scontributiontotheGrossDomesticProductis313,934incrores(1croreequalstenmillion)rupees,approximatelyequaltoa$US56billioneconomy.127GrossandnetStateDomesticProductisavailablefromTheReserveBankofIndia’sHandbookofStatisticsonIndianEconomypublishedannually.GrowthrateslistedherearebasedontheannualchangeinnetStateDomesticProductusingcurrentprices:1999‐2000:11.9percent,2004‐2005:14.5percent,and2008‐2009:16.8percent.SeeTable4,NetStateDomesticProductatFactorCost–StateWiseatcurrentprices,http://www.rbi.org.in/scripts/AnnualPublications.aspx?head=Handbook%20of%20Statistics%20on%20Indian%20Economy.128ForeignDirectInvestment(FDI)isdefinedascross‐borderinvestmentmadebyaresidentinoneeconomywiththeobjectiveofestablishingalastinginterestinanenterprisethatresidesinanother
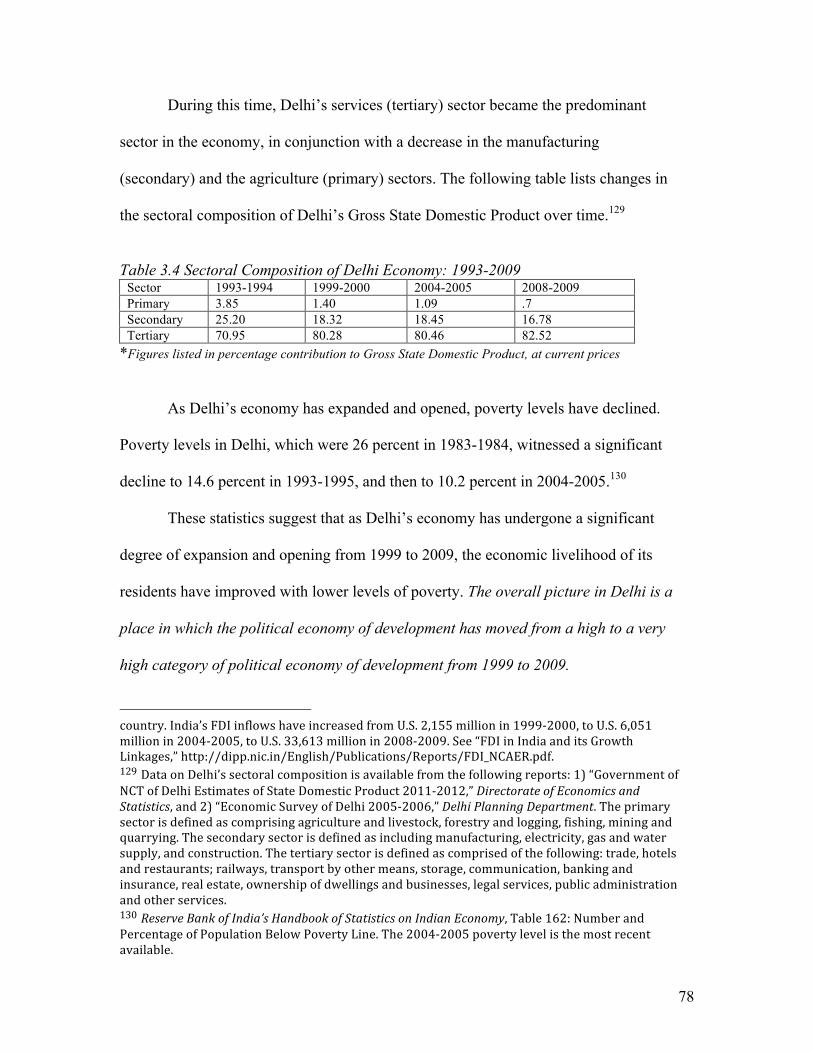
78
During this time, Delhi’s services (tertiary) sector became the predominant
sector in the economy, in conjunction with a decrease in the manufacturing
(secondary) and the agriculture (primary) sectors. The following table lists changes in
the sectoral composition of Delhi’s Gross State Domestic Product over time.129
Table 3.4 Sectoral Composition of Delhi Economy: 1993-2009
Sector 1993-1994 1999-2000 2004-2005 2008-2009 Primary 3.85 1.40 1.09 .7 Secondary 25.20 18.32 18.45 16.78 Tertiary 70.95 80.28 80.46 82.52
*Figures listed in percentage contribution to Gross State Domestic Product, at current prices
As Delhi’s economy has expanded and opened, poverty levels have declined.
Poverty levels in Delhi, which were 26 percent in 1983-1984, witnessed a significant
decline to 14.6 percent in 1993-1995, and then to 10.2 percent in 2004-2005.130
These statistics suggest that as Delhi’s economy has undergone a significant
degree of expansion and opening from 1999 to 2009, the economic livelihood of its
residents have improved with lower levels of poverty. The overall picture in Delhi is a
place in which the political economy of development has moved from a high to a very
high category of political economy of development from 1999 to 2009.
country.India’sFDIinflowshaveincreasedfromU.S.2,155millionin1999‐2000,toU.S.6,051millionin2004‐2005,toU.S.33,613millionin2008‐2009.See“FDIinIndiaanditsGrowthLinkages,”http://dipp.nic.in/English/Publications/Reports/FDI_NCAER.pdf.129DataonDelhi’ssectoralcompositionisavailablefromthefollowingreports:1)“GovernmentofNCTofDelhiEstimatesofStateDomesticProduct2011‐2012,”DirectorateofEconomicsandStatistics,and2)“EconomicSurveyofDelhi2005‐2006,”DelhiPlanningDepartment.Theprimarysectorisdefinedascomprisingagricultureandlivestock,forestryandlogging,fishing,miningandquarrying.Thesecondarysectorisdefinedasincludingmanufacturing,electricity,gasandwatersupply,andconstruction.Thetertiarysectorisdefinedascomprisedofthefollowing:trade,hotelsandrestaurants;railways,transportbyothermeans,storage,communication,bankingandinsurance,realestate,ownershipofdwellingsandbusinesses,legalservices,publicadministrationandotherservices.130ReserveBankofIndia’sHandbookofStatisticsonIndianEconomy,Table162:NumberandPercentageofPopulationBelowPovertyLine.The2004‐2005povertylevelisthemostrecentavailable.

79
Ethnic Conflict in Delhi
Unlike other parts of India, which have experienced major episodes of Hindu-
Muslim violence, Delhi has generally maintained moderate to low levels of Hindu-
Muslim conflict.131 In recent history, from 1950 to 1995, Delhi experienced 33 Hindu-
Muslim relating riots, and 93 deaths resulting from Hindu-Muslim violence.132
In 1999, Hindu-Muslim relations in Delhi and throughout the country were
strained by the Kargil War with Pakistan, and by the BJP’s decade long political
mobilization strategy emphasizing the cultural nationalist notion of Hindutva and its
advocacy of building the Hindu Ram temple. However, Delhi itself did not experience
major ethnic violence.
Looking at voters’ perceptions of Hindu-Muslim relations in Delhi during this
time, we find that in the 1999 election survey, thirty percent of election survey
respondents indicated that Hindu-Muslim relations had not improved, while forty-nine
percent of survey respondents indicate that relations had improved. This political
context of a heightened level of Hindu-Muslim tensions combined with a lack of local
level ethnic violence suggests a medium level of ethnic conflict in Delhi in 1999.
Five years later in 2004, voters’ perceptions of Hindu-Muslim relations in
Delhi are more positive: while 14 percent of respondents indicated that Hindu-Muslim
relations had deteriorated, thirty percent of respondents indicated that conditions had
131AlthoughDelhihasexperiencedfewerincidentsofviolentHindu‐MuslimconflictcomparedtootherlocationsinIndia,itisimportanttonotethattheareaexperiencedsevereanti‐SikhriotingbeginningonOctober31,1984afterPrimeMinisterIndiraGandhiwasassassinatedbyherSikhbodyguards.Iaddressthisincidentinchapter5.132DataondeathsresultingfromHindu‐Muslimviolencefrom,“VarshneyWilkinsonDatasetonHindu‐MuslimViolenceinIndia.”SeeVarshney,Ashutosh.EthnicConflictandCivicLife–HindusandMuslimsinIndia.NewHaven:YaleUniversityPress,2002,p.105.

80
stayed the same, and forty-four percent indicated that conditions had improved. Delhi
continued to experience negligible levels of Hindu-Muslim ethnic violence, suggesting
a medium-low level of ethnic conflict in Delhi in 2004.133
Delhi continued to experience little Hindu-Muslim conflict in 2009, absent
ethnic riots or violence. During the 2005-2009 timeframe, Delhi witnessed less than .2
deaths per million which were related to communal violence, statistically equal to less
than 4 deaths from ethnic violence.134 Although we do not have survey data on voter
perceptions of Hindu-Muslim relations in 2009, the absence of ethnic riots or violence,
suggests a low level of ethnic conflict in Delhi in 2009.
Political Economy of Development in Gujarat
Gujarat, like Delhi, is one of India’s strongest economic regions, representing
the sixth largest contributor to the country’s gross domestic product.135 For the past ten
years, Gujarat has also been the fourth largest state recipient of foreign direct
investment, receiving about six percent of the total FDI inflows into the country.136
133The1999and2004NESincludeaquestionregardingvoter’sassessmentofHindu‐Muslimrelations:1)1999NES:DoyouthinkHindu‐Muslimbrotherhoodhasgoneup,and2)2004NES:HaveconditionsregardingHindu‐Muslimbrotherhoodimprovedordeteriorated,1999and2004NESsurveyquestionnaires.Inbothsurveys,asmallpercentageofrespondentsindicated“noopinion”forthisquestion.134Kumar,Rohit,“CommunalViolenceinIndia:2011,”VitalStatsReportavailableatPRSLegislativeResearchwebsite,www.prsindia.org.Thereportindicatesthatfrom2005‐2009,Delhiwitnessedlessthan.2deathspermillion,statisticallyequalto3.3deaths(basedonapopulationof16.7million).135See,GrossStateDomesticProductatcurrentpricesdatatable,GovernmentofIndia,PlanningCommission,datedMarch15,2012,athttp://planningcommission.nic.in/data/datatable/0904/tab_104.pdf.AccordingtothePlanningCommissionofIndia,asof2011‐2012,Gujarat’scontributiontotheGrossDomesticProductis513,173incrores(1croreequalstenmillion)rupees,approximatelyequalto$US93billion.136ThethreehighestrecipientsofFDIinflowsareMumbai(34.2percent),Delhi(14.2percent),andKarnataka(6.5)percent.See“FDIinIndiaanditsGrowthLinkages,”http://dipp.nic.in/English/Publications/Reports/FDI_NCAER.pdf.

81
Over the 1999-2009 timeframe, while Delhi’s tertiary (services) sector became
the predominant sector in the economy, Gujarat’s economy has remained
economically diversified, with a strong presence in various industries, including
textiles, pharmaceuticals, cement, chemicals, petrochemicals, and fertilizer. The
following table lists changes in the sectoral composition of Gujarat’s Gross State
Domestic Product over time.137 The table shows that Gujarat’s secondary
(manufacturing) and tertiary (services) sectors each currently contribute about forty
percent to the state’s economic output, while its primary (agricultural) sector
contributes the remaining twenty percent to the state economy.
Table 3.5 Sectoral Composition of Gujarat Economy: 1993-2009
Sector 1993-1994 1999-2000 2004-2005 2008-2009 Primary 25.5 18.6 18.4 19.8 Secondary 35.7 39.2 38.8 40.8 Tertiary 38.8 42.2 42.8 39.4
*Figures listed in percentage contribution to Gross State Domestic Product, at current prices
During the 1990s, Gujarat was one of the few states to experience consistently
high levels of economic growth in the eight percent range.138 However, in 1999, after
years of strong economic performance, Gujarat experienced a major economic
downturn. In 1999-2000, the Gujarat economy contracted to less than one percent
economic growth.139 Production of commodities, metals and agricultural inputs,
137“Socio‐EconomicReviewGujaratState2009‐2010,”DirectorateofEconomicsandStatistics,GovernmentofGujarat,Gandhinagar,February2010.138 Montel,Ahluwalia,“StateLevelPerformanceUnderEconomicReformsinIndia,”paperpresentedattheCentreforResearchonEconomicDevelopmentandPolicyReformConferenceonIndianEconomicProspects:AdvancingPolicyReformatStanfordUniversity,May2000.ThestateofMaharashtraistheonlyotherstatetomaintainanaverageeconomicgrowthrateof8percentduringthistime. 139TheReserveBankofIndia’sHandbookofStatisticsonIndianEconomy,Table4,NetStateDomesticProductatFactorCost–StateWiseatcurrentprices.
82
including sugar, salt, iron, steel and cement, all declined during this time.140 This
significantly contracted economy, coinciding with the 1999 national election, suggests
a time of low political economy of development for Gujarat.
Five years later, during the 2004 national election, the economic landscape of
Gujarat had greatly improved. In 2003, Gujarat’s Chief Minister, Narendra Modi,
initiated a new global investor’s summit called “Vibrant Gujarat,” in the effort to
attract foreign investment to the state.141 The state economy was now growing at a
strong 8.9 percent.142
As Gujarat’s economy expanded and opened, its poverty levels declined
significantly. The state poverty level, which was nearly one-third (32.79 percent) of its
population in 1983-84, and a quarter (24.2 percent) of its population in 1993-95, was
reduced to 12.5 percent by 2004-2005.143
Thus, by 2004, the combination of a strong economic rebound, a major effort
to induce outside foreign investment, and a pattern of decreasing poverty suggests a
high level of political economy of development in Gujarat.
From 2004 to 2009, Gujarat continued to experience high levels of economic
growth, reaching 11.8 percent during 2008-2009.144 The Gujarat government under
Chief Minister Modi continued to seek foreign investment through its biennial
“Vibrant Gujarat” investor’s summit.
140“SlowdownintheState?BlameitontheGlobalRecession,”TimesofIndia,August18,2001.141SeeVibrantGujaratwebsiteatwww.vibrantgujarat.com.142TheReserveBankofIndia’sHandbookofStatisticsonIndianEconomy,Table4,NetStateDomesticProductatFactorCost–StateWiseatcurrentprices.143ReserveBankofIndia’sHandbookofStatisticsonIndianEconomy,Table162:NumberandPercentageofPopulationBelowPovertyLine.The2004‐2005povertylevelisthemostrecentavailable.144TheReserveBankofIndia’sHandbookofStatisticsonIndianEconomy,Table4,NetStateDomesticProductatFactorCost–StateWiseatcurrentprices.

83
During the 2009 national election, Narendra Modi highlighted both the state’s
high level of economic growth, and his government’s successful efforts to bring
employment opportunities to the state, such as securing the relocation of the Nano car
manufacturing plant to Gujarat, touted as the world’s least expensive car aimed at
India’s emerging middle class.145
The 2009 economic conditions in Gujarat, characterized by double-digit
growth, and a continued opening of the state’s economy by actively pursuing global
investment, suggests a continuing high level of political economy of development in
Gujarat.
Ethnic conflict in Gujarat
Gujarat, and in particular its largest city Ahmedabad, has experienced over the
past four decades some of the most deadly episodes of Hindu-Muslim conflict in India.
From 1950 to 1995, Gujarat experienced 243 Hindu-Muslim riots.146 As will be described
in more detail in chapter 6, Gujarat has experienced several instances of large scale ethnic
rioting in 1969, 1985-86, 1990, 1992, 1999, and most recently, in 2002. The political and
social context of Gujarat can be described as displaying a culture with multiple severe
episodes of ethnic conflict.
In the lead up to the 1999 election, Hindu-Muslim relations in Gujarat were
significantly strained. The BJP’s Hindu nationalist mobilization strategy during the 1990s
was keenly felt in Gujarat. In 1990, BJP leader L.K. Advani began his famous
mobilization effort to liberate the Hindu Ram temple from the city of Somnath in Gujarat,
145“InGujarat,BJPridestheNano,”TheIndianExpress,April8,2009.146VarshneyWilkinsonDatasetonHindu‐MuslimViolenceinIndia.

84
which caused ethnic rioting in the state. In 1992, when the Babri mosque was torn down
at the disputed Ayodhya site, major rioting again broke out this time in the city of Surat
in Southern Gujarat.
In late 1998, human rights groups reported instances of violence against
Christians in Southern Gujarat. In the summer of 1999, Hindu-Muslim riots broke out in
Ahmedabad during the Kargil War with Pakistan. In the 1999 national election survey,
nearly forty percent of respondents from Gujarat responded that Hindu-Muslim relations
had not improved, while twenty-seven percent of respondents indicated that relations had
improved.147 This political context of high level of ethnic tensions and local level ethnic
violence suggests a very high level of ethnic conflict in Gujarat in 1999.148
While the state experienced one of the worst episodes of Hindu-Muslim rioting
and violence in 2002 during the same year as the state assembly elections, the lead up
to the 2004 national election was notably absent of ethnic conflict. One scholar of
Gujarati politics called the 2004 national election the first somewhat “conventional”
election that the BJP contested in the state, absent ethnic rioting and with less direct
influence of Hindu nationalist organizations in the election.149
However, voter’s perceptions of Hindu-Muslim relations in Gujarat in 2004
were still quite weak: forty-one percent of survey respondents said that Hindu-Muslim
relations had deteriorated, twenty percent of respondents indicated that relations had
stayed the same, and only twenty-six percent of respondents indicated that relations
147Responsefrom1999NESsurveyquestion:“DoyouthinkHindu‐Muslimbrotherhoodhasgoneup?”148Patel,Priyavadan,“Gujarat–Anti‐incumbencyBegins,”Economic&PoliticalWeekly,December18,2004.PatelcharacterizestheperiodfromFebruary1998toDecember2002asatimemarkedby“thedominanceofhardlineHindutva”bytheBJPinGujaratusingethno‐politicalmobilizationandpolarizationforelectoralgains.149Ibid,p.5475.

85
had improved.150 This political context of a continued heightened level of Hindu-
Muslim tension despite little ethnic violence suggests a high level of ethnic conflict in
Gujarat in 2004.
In the run-up to the 2009 national election, Gujarat did not experience episodes of
major ethnic violence. Although we do not have national election survey data on voter
perceptions of Hindu-Muslim relations for 2009, as part of my own data collection for the
in-depth case studies, I asked voters in the survey administered in Ahmedabad if they
agreed or disagreed with the opinion that it was time for Gujarat to move forward with
regard to the violence in 2002. Although the sample size is small, about one quarter (24
percent) of voters interviewed responded that they disagreed that it was possible to move
forward from the 2002 riots. Despite a lack of ethnic violence, the continued presence of
ethnic tensions suggests a medium level of ethnic conflict in Gujarat in 2009. 151
ERV’spredictionstoexplainurbanvotersupportfortheBJP
Based on the above categorizations of the level of political economy of
development and the level of ethnic conflict in Delhi and Gujarat, ERV predicts the
following scenarios of voting behavior and the influence of ethnic and programmatic
interests in explaining overall voter support for an ethnic party such as the BJP.
150Responsefromthe2004NESsurveyquestion:“HaveconditionsregardingHindu‐Muslimbrotherhoodimprovedordeteriorated?”151ThesurveyquestionnaireaskedAhmedabadvotersthefollowingquestion:YoumayhaveheardtherecentremarksbyDarulUloomvice‐chancellor,MaulanaGhulamMohammedVastenvi,whosaidthateightyearshaspassedsincetheviolencein2002andthatitwastimeforGujarattomoveforward.Doyouagreeordisagreewiththisopinion/sentiment?

86
ERV’spredictionsforDelhiandNewDelhi
1. In 1999, with Delhi experiencing a medium level of ethnic conflict and a high
level of political economy of development, ERV predicts that voter support for the BJP is
the result of both a heightened political salience of ethnic group identity and interests and
strong retrospective programmatic interests by voters, best represented by scenario 1.
2. In 2004, as the political economy of development continued to strengthen while
ethnic conflict decreased markedly in Delhi, ERV predicts an increasing influence of
retrospective programmatic interests combined with a decrease in the political salience of
ethnic group identity and interests to explain voter support for the BJP in the 2004
elections, best represented by scenario 3.
3. In 2009, with economic growth in the double digits and continued very low
levels of ethnic polarization in Delhi, ERV again predicts an increasing influence of
retrospective programmatic interests combined with continued decrease in the political
salience of ethnic group identity and interests to explain voter support for the BJP in the
2009 election, best represented by scenario 3.
In summary, ERV predicts that variation in voter support for the BJP in Delhi
over the 1999 to 2009 timeframe can be explained by shifts in voting behavior
approximately represented by a shift from scenario 1 to scenario 3.

87
ERV’spredictionsforGujaratandAhmedabad
1. By comparison, in Gujarat in 1999, with a very high level of ethnic conflict and
a low political economy of development, ERV predicts that voter support for the BJP in
the 1999 election is strongly influenced by ethnic group identity and interests and less
influenced by retrospective programmatic interests, best represented by scenario 2.
2. In 2004, with an increasingly robust political economy of development and a
high level of ethnic conflict in Gujarat, ERV predicts a stronger influence of retrospective
programmatic interests combined with a strong, though less extreme, influence in the
political salience of ethnic group identity and interests, to explain voter support for the
BJP in the 2004 election, best represented by scenario 1.
3. In 2009, with Gujarat experiencing a high political economy of development
and a moderate level of ethnic conflict, ERV predicts a continued strong influence in
retrospective programmatic interests combined with a slightly more moderate influence
of ethnic group identity and interests to explain voter support for the BJP in the 2009
election, best represented by scenario 1.
In summary, ERV predicts that variation in voter support for the BJP in Gujarat
over the 1999 to 2009 timeframe can be explained by shifts in voting behavior
approximately represented by a shift from scenario 2 to scenario 1.

88
Chapter4:ResearchDesignandMethodology
This chapter presents the research design and methodology for testing ERV
theory as a means of explaining variation in voter support for the Bharatiya Janata Party
in the 1999, 2004 and 2009 national elections in two highly urbanized locations. This
dissertation research project employs a mixed-methods research design strategy
combining statistical analysis and case studies.152 The research design and methodology
employed for this study is based on the goal of making inferences about voting behavior
and explaining urban voter support for an ethnic party in a rapidly developing country
context.
The chapter begins by providing a brief backdrop of the recent evolution in
thinking about research design and methodology in comparative politics and the study of
Indian politics, to contextualize the use of a mixed-methods research design for this
project, followed by a detailed description of the design, methods, and data used for this
study.
In choosing to implement a mixed-methods research design, it is informative to
recall that the field of comparative politics once experienced a vigorous debate over the
merits of qualitative versus quantitative research methodology. In 1994, Gary King,
Robert Keohane and Sidney Verba published Designing Social Inquiry, (DSI) which
sought to bring a unified logic – the goal of making inferences from the particular to
152ThedissertationresearchwasapprovedbytheUniversityofMaryland’sInstitutionalReviewBoard(IRB),onSeptember9,2010.IRBProtocol10‐0497.
89
something more generalizable that is not directly observed – to both qualitative and
quantitative research methods in social science.153 DSI ushered in multiple waves of
debate and research about the process of designing and conducting research, which has
arguably forced researchers to be more rigorous in their thinking about research design
and methodology.
Shortly after the publication of DSI, scholars explored and identified the merits
and challenges of using multiple research methodologies to study particular research
areas, such as the study of democratic peace.154 In 2000, David Laitin, in Comparative
Politics: The State of the Subdiscipline, suggested that a new consensus in comparative
politics had emerged which both accepts and promotes the use of statistical, formal and
narrative (case study) research methods.155
Recent research on the range of research methods used in comparative politics
suggests a growing place for the use of research using mixed-methodology. For example,
Gerardo Munck and Richard Snyder analyzed published articles from three leading
153King,Gary,RobertKeohaneandSidneyVerba,DesigningSocialInquiry:ScientificInferenceinQualitativeResearch.Princeton:PrincetonUniversityPress,2004,p.8.FollowingthepublicationofDSIin1994,theAmericanPoliticalScienceAssociation’sComparativePoliticsNewsletterbecameaforumfordebateoverseveralyearsaboutthedirectionoftheComparativePoliticsfield,thesimilaritiesanddifferencesbetweenqualitativeandquantitativeresearchapproaches,andalsowhetherornotitispossibleforsocialsciencestobescientific.SeeComparativePoliticsNewsletter,7(1),Winter1996.Fortheviewpointthatitisamisguidedendeavorforsocialsciencestofocusongeneratingscientificknowledgeordevelopingtheory,seeBentFlyvbjerg,MakingSocialScienceMatter–whysocialinquiryfailsandhowitcansucceedagain.Cambridge:CambridgeUniversityPress,2001.Myresearchdesignisbasedonthegoalofmakinginferencesaboutvotingbehaviorandunderstandingvotersupportforanethnicpartyinarapidlydevelopingcountrycontext.154Bennett,AndrewandAlexanderGeorge,“AnAllianceofStatisticalandCaseStudyMethods:ResearchontheInterdemocraticPeace,”intheComparativePoliticsNewsletter,Vol.9.No.1.Winter1998.Seealso,SidneyTarrow,“BridgingtheQuantitative‐QualitativeDivide,”inBrady,HenryandDavidCollier,Eds.RethinkingSocialInquiry–DiverseTools,SharedStandards.Oxford:Rowman&LittlefieldPublishers,2004.155Laitin,David,“ComparativePolitics:TheStateoftheSubdiscipline,”firstpresentedattheAnnualMeetingoftheAmericanPoliticalScienceAssociation,Washington,DC,2000.

90
comparative politics journals and found that over forty percent of the articles employed
some type of a mixed-methods research design.156
While comparative politics has developed a place for the use of multiple research
methods, it is relevant to note that the discipline of Political Science in India for a long
time did not place heavy emphasis on the use of quantitative research methods, and
particularly survey methods. Indian Political Scientist, Yogendra Yadav, explains that in
the historically left-wing orientation of political science in India, the empirical study of
politics in India was viewed with deep suspicion as a cultural importation of a type of
research practice from the West.157
In this context, the systematic study and data collection of citizens’ attitudes and
voting behavior in India was not emphasized. However, Yadav notes, a new perception
has recently taken hold that it is possible to engage in the study of voting behavior in
India and to use survey methods which are locally shaped and guided, marking a shift in
the practice of political science in India.158 Consequently, since the mid-1990s, Indian
Political Science scholars have begun to systematically collect data on voting behavior
using survey methods. Drawing in part from this new collection of election study survey
data, this dissertation research project seeks to be part of a new body of empirical
research and comparative analytical studies of Indian politics through an exploration of
voting behavior and voter support for an ethnic party in India.
156Munck,GerardoandRichardSnyder,“DebatingtheDirectionofComparativePolitics:AnAnalysisofLeadingJournals,”ComparativePoliticalStudies,Vol.40,No.1,January2007.MunckandSnyderanalyzearticlesfromthreeleadingcomparativepoliticsjournalsfrom1989to2004.Theyfindthatover40percentofthearticlesemployamixed‐methodsresearchdesign(19percentemployedmixedmethodsthatwerepredominantlymorequalitative,and23.6percentemployedmixedmethodsthatwerepredominantlymorequantitative).157Yadav,Yogendra,“WhitherSurveyResearch?ReflectionsofontheStateofSurveyResearchonPoliticsinMostoftheWorld,”MalcolmAdiseshiahMemorialLecture,2008,p.11.158Ibid,p.4.

91
NestedAnalysisResearchDesign
This dissertation study uses a mixed-method strategy of data collection and
analysis referred to as “nested analysis.”159 Nested analysis is a mixed-methods research
design strategy that integrates statistical analyses of a large sample of cases, large-N
analysis, with an in-depth investigation of one or more cases, small-N-analysis.160 I will
provide a brief overview of nested analysis research design, and then describe how it will
be employed to carry out data collection and analysis for this research project.
Evan Lieberman notes that nested analysis usually begins with large-N analysis.
What is needed at the beginning are initial hypotheses and access to data in order to test a
baseline theory. Nested analysis then integrates large-N analysis with case study analysis,
by leveraging the information from the former to inform decisions about the latter. A key
benefit of small-N case study analysis, within the context of this design strategy, is that it
takes the information gained from the large-N analysis, and focuses the research on
exploring in more detail specific mechanisms linking independent variables to outcomes.
Nested analysis is both an appropriate and useful research method for this
research project. Indian Political Science scholars have been collecting voting behavior
survey data that can be used for the large-N analysis, and the country’s open political
culture allows for the possibility of conducting in-depth case studies of individual voters
to examine in greater detail the effects of individual factors on vote choice. Combining
the two methods, statistical analysis of a large sample of voters’ preferences with case
studies of individual voters, aims to both corroborate and deepen the research findings.
159 Lieberman, Evan, “Nested Analysis as a Mixed-Method Strategy for Comparative Research,” American Political Science Review, 99(3), 2005. This description of nested analysis draws from Lieberman’s article, which provides both a conceptual and practical overview of how to use this type of research design. 160Ibid.,p.436.

92
Large‐NAnalysis
The large-N analysis component of this project entails logistic regression analysis
of voting behavior in three Indian national elections, 1999, 2004 and 2009, in order to test
ERV’s ability to explain the way in which ethnic and programmatic interests influence
voting behavior and voter support for the BJP at the societal level. As noted in the
introduction, the 1999 national election marked the rise to power of the BJP at the
national level and its ability to maintain a coalition government that lasted a full five-year
term, while the 2009 national election marks a significant retrenchment of voter support
for the BJP.
Using a most-similar research design, the large-N analysis focuses on comparing
voting behavior in these three national elections in the states of Delhi and Gujarat.161 As
discussed in the theory chapter, the states of Delhi and Gujarat share several
commonalities. First, both states have relatively large urban populations compared to the
rest of India.162 Economically, both states have experienced increasingly higher levels of
economic growth over time. Politically, Gujarat and Delhi have been dominated by a
two-party system comprised of Congress and the BJP, with little influence from other
regional political parties.
However, during the 1999-2009 timeframe, Delhi did not experience episodes of
major violent ethnic conflict, whereas Gujarat did. In 1999, Gujarat witnessed violent
attacks against Christians mostly in the south, and Hindu-Muslim riots in Ahmedabad. In
161Most‐similardesignisalsoknownasthemethodofdifferences,afterJ.S.Mill,inwhichchosencasesaresimilarinallrespectsexceptthevariable(s)ofinterest.SeeGerring,John.CaseStudyResearch–PrinciplesandPractices.Cambridge:CambridgeUniversityPress,2007,p.131.162Accordingtothe2001Census,Delhi’surbanpopulationis92percent,andGujarat’surbanpopulationis44percent.http://www.censusindia.gov.in/Census_Data_2001.

93
February 2002, Ahmedabad and many other cities experienced major Hindu-Muslim riots
for several months.
The large-N analysis examines what factors influence electoral support for the
BJP in Delhi and Gujarat over time. The dependent variable for the large-N analysis is
vote choice, a binary, or dichotomous, dependent variable, coded 0 for individuals who
voted for the Congress Party, and 1 for individuals who voted for the BJP. Because of its
dichotomous nature, the research employs logistic regression to test for the effects of two
categories of indicators, ethnic group identity and interests, and retrospective
programmatic voting interests, on the likelihood of voting for the BJP.163
To test ERV theory and its two hypothesized mechanisms for explaining changes
in voter support for the BJP over space and time, I created a typology of two categories of
indicators representing 1) ethnic group identity and interests, and 2) retrospective
programmatic interests. The following tables provide a description of the two types of
indicators used for the large-N analysis.
163Thelogitmodelisaprobabilitymodelthatcanbeusedwithadichotomousdependentvariable,andteststheprobabilityofeventYoccurring(i.e.avotervoting/notvotingfortheBJP),givenchangesinvaluesforX.AlogitmodelisamoreappropriatemodeltousewithadichotomousdependentvariablesthananOrdinaryLeastSquares(OLS)model,whichassumesthatthechangeinadependentvariable,Y,isthesameforallvaluesofanindependentvariable,X.Thelogitmodelallowsforanon‐linearrelationshipbetweenadependentandindependentvariables,suchthat,atdifferentvaluesofX,theeffectofXonYmaybedifferent.

94
Table 4.1: Ethnic Group Identity and Interest Indicators Variable Name Type Description Data Source 1. Religion Dummy Indicates voter’s religion, and whether or
not they are Hindu NES 1999: B10 NES 2004: B7 NES 2009: Z8
2. Caste Dummy Indicates voter’s caste, and whether or not they are upper caste
NES 1999: B9A NES 2004: B6A NES 2009: Z7A
3. Class Dummy Indicates voter’s economic class Composite NES data draw from income and household items
4. Religiosity Ordinal Measures voter’s level of personal religious practice
NES 1999: B1,B1A NES 2004: Q34 NES 2009: Q30
5. Social Harmony Ordinal Measures voter’s opinion of social harmony/Hindu-Muslim harmony
NES 1999: 16D NES 2004: Q20E
6. Hindu Ram Temple Views
Ordinal Measures voter’s opinion about building the Ram Temple
NES 1999: 22G NES 2004: 24D NES 2009: A3 a,b
The table above lists indicators measuring ethnic group identity (i.e., religion,
caste) and ethnic group interests (i.e., perceptions of Hindu-Muslim relations, views
about building the Hindu Ram Temple). In addition, I have also included in this typology
an indicator for class. A complete list of the NES survey data questions used to develop
these indicators is included in Appendix A.
Recall that the BJP is typically associated with being a party which represents the
interests of upper castes and Hindu voters. To test the influence of these ethnic factors, I
created two dummy variables, Religion and Caste. Religion is coded 0 for non-Hindu and
coded 1 for Hindu. Caste is coded 0 for non-upper caste and 1 for upper caste. These
indicators measure two different attributes of a voter, which are related but not
necessarily correlated (i.e., caste in the context of this dissertation refers to the subset of
attributes of being a Hindu).
In addition to being associated with the interests of upper caste and Hindu voters,
the BJP is also associated with the interests of higher income voters. I have created a

95
dummy variable, Class, coded 0 for non-rich and 1 for rich, to test for the effects of class
on vote choice. Though an individual’s class and caste measure two different attributes,
they can be correlated (i.e., higher caste individuals have been associated with greater
access to education and employment opportunities leading to higher income). However,
this relationship is changing as non-upper caste individuals gain greater access to
education and employment opportunities.
The indicator, Social Harmony, measure’s a voter’s assessment of how well the
government has acted to improve Hindu-Muslim relations. Because the voter response
categories are different in the 1999 and 2004 NES surveys (see Appendix A), this
indicator has two values (Hindu-Muslim relations have deteriorated, Hindu-Muslim
relations have improved) for the 1999 analysis, and three values (deteriorated, the same,
improved) for the 2004 analysis.
The indicator, Hindu Ram Temple Views, measures a voter’s opinion about
whether or not a temple dedicated to the Hindu Deity, Lord Ram, should be built at the
site where the Babri Mosque was torn down in Ayodhya. Because, the voter responses
categories are different in the 1999, 2004, and 2009 NES (see Appendix A), the indicator
has two values for the 1999 analysis (i.e., agree the temple should be built, disagree the
temple should not be built) and four values for the 2004 analysis (i.e., fully agree temple
should be built, somewhat agree, somewhat disagree and fully disagree). The related
question in the 2009 NES survey has completely different response categories from the
1999 and 2004 NES survey question. The indicator has five values for the 2009 analysis
(i.e., only a temple should be built, only a mosque should be built, neither should be built,
both should be built, no opinion).

96
These indicators are employed to test H1: All things being equal, urban electoral
support for the BJP hinges upon changes in the perceived level of ethnic group conflict
and the corresponding shifts in the political salience of ethnic group identity and
interests on vote choice, as a means of examining the conditions under which ethnic
group identity and interests increase in salience on vote choice.
Finally, to test for the effects of religiosity in explaining electoral support for the
BJP, I have included an indicator, Religiosity, which provides a measure of a voter’s
personal religious practices. Because the voter response categories are different in the
1999, 2004 and 2009 NES surveys (see Appendix A), Religiosity has two values for the
1999 analysis (yes practice, no do not practice) and four values for the 2004 and 2009
analysis (never practice, practice on festivals, practice weekly and practice daily).
Table 4.2 Retrospective Programmatic Interest Indicators
Variable Name Type Description Data Source 1. Personal Financial Conditions
Ordinal Measures voter assessment of changes in household economic conditions
NES 2004: Q31 NES 2009: E2
2. Employment Ordinal Measures voter assessment of changes in employment opportunities
NES 2004: Q20C
3. Price Levels Ordinal Measures voter assessment of changes in price levels
NES 1999: 16A
4. Development Ordinal Measures voter assessment of changes in development conditions
NES 2004: Q20F NES 2009: C13 and E5
5. National Security or Terrorism
Ordinal Measures voters assessment of changes in national security threat or concerns about terrorism
NES 1999: 16C NES 2004: Q20B NES 2009: B5A
6. Law and Order Ordinal Measures voter assessment of changes law and order conditions and personal safety
NES 1999: 16F
7. Corruption Ordinal Measures voter assessment of changes in levels of corruption
NES 1999: 16B NES 2004: Q20A
8. Central Government Performance
Ordinal Measures overall voter level of satisfaction of performance of central government
NES 1999: 6 NES 2004: Q12 NES 2009: Q20
97
The table above lists indicators measuring a voter’s retrospective assessment of
the status of several programmatic factors (i.e., changes in price levels, personal financial
conditions, economic development, etc.) during the current political administration.
These indicators for retrospective programmatic voting are all ordinal in nature. Similar
to the ethnic indicators described above, the voter response categories for these indicators
are often different in the 1999, 2004 and 2009 NES surveys.
Personal Financial Conditions measures a voter’s assessment of changes in
household economic conditions during the current political administration. The indicator
has three values for the 2004 analysis (i.e., worse, same, improved) and five values for
the 2009 analysis (i.e., much worse, worse, same, better, much better). Employment
measures a voter’s assessment of changes in employment opportunities during the current
political administration. The indicator has three values for the 2004 analysis (i.e., worse,
same, improved). Price Levels measures a voter’s assessment of changes in price levels
during the current political administration. The indicator has two values for the 1999
analysis (i.e., agree prices have gone up, disagree prices have not gone up). Development
measures a voter’s assessment of changes in the overall development conditions in India
during the current political administration. The indicator has three values for the 2004
analysis (i.e., worse, same, improved), and five values for the 2009 analysis (i.e., much
worse, worse, same, better, much better).
National Security/Terrorism measures a voter’s assessment of changes in the
overall national security conditions in India during the current political administration.
The indicator has two values for the 1999 analysis (i.e., agree national security worsened,
disagree national security improved), and three values for the 2004 analysis (i.e.,

98
worsened, the same, improved). The related question in the 2009 NES survey has
different response categories, specifically addressing voter assessment of government
responses to Mumbai terrorist attacks. The indicator has four values for the 2009 analysis
(i.e., fully dissatisfied with government response, somewhat dissatisfied, somewhat
satisfied, fully satisfied). Law and Order measures a voter’s assessment of changes in
personal safety during the current political administration. The indicator has two values
for the 1999 analysis (agree people and belongings are safer, disagree people and
belongings are not safer). Corruption measures a voter’s assessment of changes in levels
of corruption during the current political administration. The indicator has two values for
the 1999 analysis (i.e., agree levels of corruption have improved, disagree corruption has
worsened), and three values for the 2004 analysis (i.e., worse, the same, improved).
Central government performance measures a voter’s overall assessment of the
performance of the central government during the current political administration. The
indicator has three values for the 1999 analysis (i.e., not at all satisfied, somewhat
satisfied, very satisfied), and five values for the 2004 and 2009 analysis (i.e., fully
dissatisfied, somewhat dissatisfied, somewhat satisfied, and fully satisfied).
These indicators are employed to test H2: All things being equal, urban electoral
support for the BJP hinges upon changes in the political economy of development and the
corresponding shift in retrospective demands on party performance pertaining to
programmatic issues and policies, as a means of examining the conditions under which
retrospective programmatic interests increase in salience on vote choice.

99
As noted earlier, a primary goal of the large-N analysis is to test ERV as a means
of explaining variation in urban voter support for the BJP at the societal level. Recall that
table 3.1 in the previous chapter presents four generalized types of patterns of voting
behavior by illustrating how ERV’s two mechanisms predict the relative the degree of
influence of ethnic and programmatic interests on voting behavior under different socio-
economic conditions. These indicators of ethnic group identity and interests and
retrospective programmatic interests described above will be used to analyze the factors
affecting voting behavior in Gujarat and Delhi in the 1999, 2004 and 2009 elections,
which in turn will allow us to examine the relative influence of ethnic and programmatic
interests on voting behavior under different socio-economic conditions.
The data used for the large-N analysis comes from the Indian National Election
Study (NES) post-poll surveys for the 1999, 2004 and 2009 elections. The Indian
National Election Study (NES) survey is considered the largest and most comprehensive
social science survey of India’s national elections. The NES is designed to provide
insight into voters’ political preferences and to determine the reasons for the electorate’s
vote choice, using in-depth questionnaires and a sample frame based on probability
sampling (elements of the sample are selected using a probability mechanism, allowing
for statistical analysis and inference to the overall population). Respondents for the NES
are randomly selected from electoral rolls of polling stations, a tradition that has been
used throughout the NES series.
The Indian NES has been carried out in India since 1967 by CSDS, a social
science research institution based in New Delhi, India. Scholars at the CSDS refer to
three generations of NES studies: the first generation is from 1967-1971, which is quite

100
limited in scope; the second generation is from 1996-1999, and the third generation,
which includes the 2004 and 2009 national elections. Each generation has seen an
increase in the overall number of people surveyed.164 A large portion of the data analysis
for this dissertation took place during seven months I spent as a dissertation research
fellow at CSDS from October 2010 thru April 2011.
Data Limitations: It must be noted that there are some particular limitations with
the Indian NES data used in the large-N analysis. First, some of the questions asked are
not always consistent over the years. So that, for example, questions about a voter’s
assessment of personal financial conditions are asked in the 2004 NES and the 2009 NES
surveys, but not in the 1999 NES survey. This non-uniformity often hinders the ability to
make direct comparisons of the effect of a particular indicator over all three national
elections. Second, as noted in the discussion about the indicators used for the large-N
analysis, the voter response categories for a similar question are not always the same
across the NES surveys. Despite these aspects of non-uniformity of the data across time,
the Indian NES surveys are the most comprehensive data on voter preferences in India.
By employing indicators of ethnic and programmatic interests, I have sought to preserve
as much comparability as possible. Lastly, though the overall NES country sample sizes
are large from 1999 to 2009, the sample size in some cases for particular Indian states is
small. For example, the sample size for Delhi in 1999 is under 100, but over 1000 in 2004
and 2009. For this reason, I have focused the large-N analysis to the state level, Delhi and
Gujarat, rather than to the city level (New Delhi, and Ahmedabad), in which the sample
sizes would be even smaller. Additionally, the sample size for the Delhi 1999 analysis is 164TotalachievedsamplesizeforIndianNationalElectionStudies(NES):1999:9,418;2004:27,189;2009:36,169.Datafrom“NationalElectionStudy2009:AMethodologicalNote,”EconomicandPoliticalWeekly,September26,2009.
101
too small to employ a logistic regression. Instead I use cross tabs and examine differences
in sample proportions for the Delhi 1999 analysis. In conclusion, in spite of some of the
non-uniform aspects of the data across NES surveys, it is a critical component in
allowing us to examine the relative influence of ethnic interests and programmatic
interests on voter support for the BJP in different socio-economic contexts across time
and space.
CaseStudyAnalysis
The second component of research for this project entails in-depth case studies
of urban voters and their voting behavior in the cities of New Delhi, Delhi and
Ahmedabad, Gujarat, two of the largest cities in India. Focusing on case studies of
urban voters in these two large cities aims to create a structured, focused comparison
of individual urban voting behavior which complements the large-N analysis of voting
behavior in the highly urbanized states of Delhi and Gujarat. 165
Similar to Delhi and Gujarat, the cities of New Delhi and Ahmedabad share
several commonalities. Both New Delhi and Ahmedabad rank in the top ten most
populated cities in India, ranking number two and five respectively. Politically, the
landscape in New Delhi and Ahmedabad has been defined by a two-party system
165George,AlexanderandAndrewBennett,CaseStudiesandTheoryDevelopmentintheSocialSciences.Cambridge:MITPress,2005.GeorgeandBennettdefineacaseas“aninstanceofaclassofevents,”anddescribearesearchstrategyfordesigningstructuredandfocusedcasestudieswhichareguidedby1)awell‐definedclassofeventsorcases,2)aclearresearchobjective,3)employingvariablesoftheoreticalinterest,and,borrowingfromsurveyresearchdesign,4)askingasetofstandardizedquestionsforeachcasewhichisguidedbytheresearchobjective.Thesecomponentstakentogetherorientcasestudiestowardan“orderly,cumulativedevelopmentofknowledgeandtheory”aboutaparticularclassofevents.
102
between Congress and the BJP. However, Ahmedabad experienced major Hindu-
Muslim violent conflict during the 1999-2009 timeframe, whereas New Delhi did not.
The principle research objective for the small-N component of this research is
to test ERV theory’s mechanisms as a means of explaining variation in urban voter
support for the BJP on individual voting behavior, by examining the ways in which
ethnic and programmatic interests influence voting behavior and voter support for the
BJP for the individual voter. Like the large-N analysis, the dependent variable for the
case study analysis is vote choice.
I first created a standardized survey questionnaire in order to conduct in-depth
interviews of urban voters in both cities about their vote choices and political
preferences in the 1999, 2004 and 2009 national elections. The survey questionnaire
for the case studies is similar in design to the surveys used as part of the Indian
National Election Surveys, however, it is designed to engage voters about changes in
their political choices and preferences over a ten-year time frame covering the 1999,
2004, and 2009 national elections.166 The text of the survey questionnaire is included
in Appendix C.
A key aspect of the questionnaire is that it asks voters questions about their
political preferences over the 1999 to 2009 time frame covering three national
elections, which raises concerns about memory bias. Memory or recall bias in the
context of a survey occurs when a respondent’s answer is either enhanced or impaired
by his/her memory.
166ThesurveyquestionnairewaswritteninEnglishandHindi,orEnglishandGujarati,andthequestionswerepretestedwithIndianvoterstoensurethatthestructureofthequestionnaireandthewordingoftheindividualquestionswereunderstandabletointerviewees.

103
Collaborative research between survey methodologists and cognitive scientists
have studied the impact of the passage over time on reporting performance in surveys,
and have found that using memory cues in surveys can enhance memory and recall.167
Therefore, to assist the survey respondent’s memory recall, the survey questionnaire
was structured chronologically, beginning with questions about the 1999 national
election and ending with questions about the 2009 national election. In addition, the
survey includes a short introduction about the nature and structure of the survey, and
also uses memory cues for each section of the survey.168
The survey questionnaire includes questions focused on gaining information
about what factors or issues were important to a voter in each of the 1999, 2004 and
2009 national elections. Specifically, the survey includes some questions that were
asked three times – once for each national election.169 This structure, though somewhat
redundant, was used in part to detect whether or not a voter’s priorities had changed
over time, and also as a means of checking the consistency of a respondent’s answers.
167Tourangeau,Roger,“RememberingWhatHappened:MemoryErrorandSurveyReports,”(chapter3),andMenon,GeetaandEricYorkston,“TheUseofMemoryandContextualCuesintheFormationofBehavioralFrequencyJudgments,”(chapter5),inTheScienceofSelfreport:ImplicationsforResearchandPractice,Eds.Stone,Arthur,ChristineBachrach,JaredJobe,HowardKurtzman,VirginiaCain,Eds.London:LawrenceErbaumAssociates,2000.Jobe,Jared,RogerTourangeauandAlbertSmith,“ContributionsofSurveyResearchtotheUnderstandingofMemory,”AppliedCognitivePsychology,Vol.7,567‐584,1993.JaredJobeetal.discussthevariouswaysinwhichresearchershavesoughttoimprovememorycuesinthecourseofconductingasurvey,including1)increasingquestionlength,2)askingadditionalquestionsrelatedtoamainquestion,and3)orderingthequestionsindifferentways,p.572.168Forexample,eachsectionofthesurveybeginswithafact‐basedmemorycue,suchasthefollowing:“Iwillbeginbyaskingyousomequestionsaboutthe1999LokSabhaElection.RecallthattheBJP‐ledNationalDemocraticAlliancegovernmentwasinpowerbrieflyin1998,leadinguptothe1999nationalelections.”169Thissurveyquestionisaskedthreetimes:“Iwouldliketoaskyou,inthe1999(2004and2009)election:1)Wereanyofthefollowingissuesimportanttoyouinyourvotechoice.(yes,no,noopinion).2)Whatwouldyousaywasthemostimportantissuein1999(2004,2009):a)reductioncorruption,b)nationalsecurity,c)employmentorprices,d)developmentofcountry,e)partyleadership,f)Mandir/Masjidtempledispute,g)otherissuesnotlistedhere.”

104
To explore the impact of ethnic group identity and interests on vote choice over
time, respondents were asked, “1) Over the past ten years, have ethnic issues become
more or less important to you in your vote choice (more, less, the same); and 2) Why
have ethnic issues increased/decreased/stayed the same with regard to your vote
choice?”170 The survey includes two questions related to ethnic group interests. The
first question asks respondents if the dispute involving the Hindu Ram Temple was a
factor in their vote choice. The second question asks voters their views about Hindutva
in the 1999 election and the 2009 election.
The survey includes some open-ended questions, such as asking respondents to
identify the issues or concerns that have increased in importance with regard to their
vote choice over the ten-year time frame. This question is included as a means of
identifying changes in the importance of ethnic and programmatic factors on vote
choice over time, and also as means of checking for the internal consistency of the
voter’s previous responses.
George and Bennett note that one of the more common critiques of case studies
is selection bias, in particular, selecting cases on the dependent variable (i.e., cases
which share a particular outcome).171 For this analysis, it is important to note that in
choosing these individual cases, it was not known in advance how a particular voter
voted, or the reasons why a voter voted for a particular party.
In choosing a data collection method for the case studies of urban voters, I used
a purposive sampling design, in which cases of individual voters were selected based
170Aninitialversionofthesurveyindicatedthatvotershadadifficulttimeansweringthequestion,“Aretherecertainfactorsthatincreasetheimportanceofethnicityinyourvotechoice.”However,thequestionbecamemoreaccessibletorespondentswhenitwasbrokendownintothesetwoparts.171GeorgeandBennett,p.23.

105
on a combination of several socio-economic indicators (i.e., religion, caste,
class/income, and nature of employment).172
The table 4.3 below lists the variation in socio-economic characteristics of the
individual voters interviewed in New Delhi. The same design was used to identify
voters in Ahmedabad.
Table 4.3: New Delhi Cases
172Forthecasestudysample,Iusedthefollowingcategoriestolabelanindividual’sfamilyincome/classinrupees/day:1)0‐125Rs/day:poor;2)125‐625Rs/day:workingclass;3)625‐3,500Rs/day:middleclass;3,500‐25,000Rs/day:uppermiddleclass;25,000‐up:rich.Therupeerecentlyhasfluctuatedbetween46‐56RsperUSdollar.TheincomecategoriesincludeahigherupperrangethantheincomecategoriesusedintheNESsurveydata.WhiletheNESdatamusttakeaccountofaverageincomelevelsacrossallIndianstatesinruralandurbanareas,thecasestudiesfocusontwoofthemostprosperouscitiesinIndia.

106
It is important to note that a purposive sampling design does not provide a
representative sample of the population of voters. The choice of a purposive sampling
design was guided by two primary considerations. First, the Indian National Election
Study survey data used in the large-N analysis provides a random sample to identify
general patterns of the effects of different indicators on vote choice. This kind of
randomly sampled survey data, which covers the entirety of India, is entirely unique and
expensive to carry out.
Second, a primary goal of the case study analysis is to test ERV as a means of
explaining urban voter support for the BJP for the individual voter. Recall that table 3.2
posits four types of individual voting behavior based on the different ways in which
ERV’s mechanisms impact individual vote choice through differences in an individual
voter’s assessment of the perceived risks from ethnic group conflict and the perceived
rewards from economic reforms and development. This in turn impacts the relative
influence of ethnic group identity and interests and retrospective programmatic interests
on vote choice at the individual level and the reasons for voting for an ethnic party.
Through the use of purposive sampling, I want to explore whether or not voters
with certain combinations of socio-economic characteristics, (i.e., religion, caste,
class/income, and employment sector) show similar patterns of individual voting
behavior with regard to the reasons why a voter votes for the BJP. In particular, I want to
explore if voters with certain socio-economic characteristics are more inclined to base
their votes on 1) retrospective programmatic interests, 2) ethnic group identity and
interests, 3) both retrospective programmatic interests and ethnic group identity and
interests, or 4) something entirely different. Using this purposive sampling design, I

107
conducted research on a total of 72 case studies, including 35 in-depth voter interviews in
New Delhi, and 37 in-depth voter interviews in Ahmedabad.
In addition to the large-N analysis of Indian NES survey data for Delhi and
Gujarat, and the small-N analysis of case studies of urban voters in New Delhi and
Ahmedabad, I also conducted a dozen expert interviews to gain additional insight about
the BJP and local knowledge about the politics of Delhi and Gujarat. These interviews
focus on individuals with unique knowledge or perspective pertaining to the dissertation
topic, and include Indian political scientists, Congress and BJP politicians, journalists and
political analysts.
Finally, my research also draws from 1) official government documents, 2) BJP
and Congress party documents, 3) Indian newspaper and magazine articles, and 4) the
academic literature on Indian politics.
108
Chapter5:EthnicPoliticsandVotingBehaviorinDelhiandNewDelhi
The National Capital Territory of Delhi, or “Delhi,” is India’s second largest
metropolis and home to the nation’s capital, New Delhi. Delhi is the most urbanized state
(city-state) in India with one of the highest levels of economic growth.173 One recent
study predicts that over the next twenty years, Delhi’s population will grow from its
current population of 16.7 million to 26 million, while its per capita income is projected
to increase four-fold.174
The highly urbanized character of Delhi, combined with the nature of its politics,
which have been dominated by India’s two national political parties, Congress and the
Bharatiya Janata Party, make Delhi an ideal location for this project focusing on the
factors affecting voter support for an ethnic party, and specifically explaining urban voter
support for the BJP over time.
Yet little research exists about the voting behavior of Delhi’s 16.7 million
voters,175 the factors affecting their vote choice, or patterns of voting behavior in the area
over time. Once a Congress party stronghold in the 1980s, the BJP came to dominate
173Delhiwas93percenturbanin2001,CensusofIndia2001.GrossandnetStateDomesticProductisavailablefromTheReserveBankofIndia’sHandbookofStatisticsonIndianEconomypublishedannually.GrowthrateslistedhereandthroughouttheremainderofthechapterarebasedontheannualchangeinnetStateDomesticProductusingcurrentprices:1999‐2000:11.9percent,2004‐2005:14.5percent,and2008‐2009:16.8percent.174Sankhe,Shirishetal.,“India’sUrbanAwakening:BuildingInclusiveCitiesSustainingEconomicGrowth,”McKinseyGlobalInstitute,April2010.ThiswouldgivetheDelhimetropolitanareaapopulationsimilartomanycountries(i.e.,Australia:21million;Taiwan:23million,Syria:21million).1752011CensusofIndiapopulationtablesfortheNationalCapitalTerritoryofIndia,http://www.censusindia.gov.in/2011‐prov‐results/prov_data_products_delhi.html.

109
Delhi politics in the 1990s, followed by a steep decline in BJP electoral support and a
reemergence of Congress dominance. What explains this major shift in urban voter
support for the BJP in Delhi from the 1999 election to the 2009 election?
This chapter presents an empirical analysis of voting behavior in Delhi and an in-
depth analysis of voting behavior in the Capital, New Delhi, and tests Ethnically
Mediated Retrospective Voting (ERV) theory as a means of explaining variation in urban
electoral support for the BJP over the 1999, 2004, and 2009 national elections.176 The
chapter is comprised of three main sections: 1) an overview of the politics of Delhi, 2) an
analysis of Indian National Election Study (NES) survey data of Delhi voters for the
1999, 2004 and 2009 national elections, and 3) an examination of case studies of
individual voters and voting behavior in New Delhi.
Delhi
The area of modern Delhi has had a long history as a seat of power and
governance in the Indian subcontinent going back centuries.177 In 1639, the Emperor
Shah Jahan established the walled city of Shahjahanabad as the capital of the later
Mughal Empire, where it remained until the Empire’s defeat by the British in 1857.
Under the British, the Indian capital was initially relocated to Calcutta, but then it was
176India’sgeneral(national)electionsareheldeveryfiveyearsorifparliamentisdissolved.VotersdirectlyelectmemberstotheLokSabha,India’slowerhouseofparliament.Thus,the15thLokSabha,referstotheIndiannationalelectionsin2009.Since1967,Delhihascontested7seatsintheLokSabha.177BeforetheMughalEmpire,DelhiwasthesiteoftheDelhiSultanate,aseriesofMuslimKingdomsthatruledfromthe11thcenturyuntilitfelltotheMughalEmperorBaburin1526.

110
transitioned back to Delhi in 1911178. Over the next two decades, British architect Sir
Edwin Lutyens developed the new capital of British India, New Delhi, located southwest
of Shahjahanabad. In 1947, New Delhi was named the capital of the newly independent
government of India. Since independence, the status of Delhi has evolved from a state, to
a union territory, to most recently, the constitutionally mandated National Capital
Territory of Delhi, or NCT.179180 New Delhi is both the capital of the central Government
of India and the NCT (Delhi).
Delhi has a diverse social demographic makeup, which has been influenced
recently by two distinct waves of migration. Following the partition of India and Pakistan
in 1947, large numbers of Punjabis fled from the newly created state of Pakistan and
settled in refugee camps in Delhi. This initial influx of Punjabis established an active
trading and business community, which has led to a strong Punjabi cultural and political
influence in the city.181 In the 1980s, another wave of migrants came to Delhi, in
178OnDecember12,1911,attheannualcoronationofKingGeorgeVandQueenMaryastherulingsovereignsofIndia,GeorgeVtransferredtheseatoftheGovernmentofIndiafromCalcuttatoDelhi,withthegoalofreducingtheinfluenceofanyoneProvincialGovernmentupontheworkingsoftheCentralGovernment.Thefollowingyear,thecityofDelhiwasformallyseparatedfromthePunjabandconstitutedasaseparateprovince.SeeVajpeyi,S.C.andS.P.Verma,“AdministrativeSet‐UpofDelhi,”inLandmarksinDelhiAdministrationPostIndependenceEra19471997.Eds.S.C.VajpeyiandS.P.Verma.NewDelhi:GyanPublishingHouse,1998,pgs.40‐41.179In1956,aspartoftheStatesReorganizationAct,Delhilostitsstatusasa“PartCState”andbecameaUnionTerritory,losingitsLegislativeAssemblyandcomingunderthedirectadministrationofthePresidentofIndia.Fourdecadeslater,in1991,theIndianConstitutionwasamendedbytheSixty‐NinthAmendmentAct,whichchangedtheofficialstatusoftheUnionTerritoryofDelhitotheNationalCapitalTerritory(NCT)ofDelhi,andreinstatedDelhi’sLegislativeAssembly,whichiselectedbythecitizensofDelhiandisenabledtomakelawsfortheNCT.TheNCTiscomprisedofninedistricts,includingNewDelhi,whichisitsseatofgovernment.SeeVajpeyiandVerma,pgs.52‐58.180ThetextoftheConstitution(SixtyNinthAmendment)Actof1991isavailableathttp://delhiassembly.nic.in/constitution.htm.181Raj,Pushkar,“Delhi:BenefittingfromTwo‐LayeredIncumbency,”EconomicandPoliticalWeekly,December18,2004,p.5502.

111
particular from the Northern Indian states of Uttar Pradesh, Bihar, Haryana, Punjab and
Rajasthan, increasing the OBC, Dalit and Muslim populations.182
Unlike other parts of India, such as the state of Gujarat, which have experienced
several episodes of major violent ethnic conflict, Delhi has maintained moderate to low
levels of ethnic conflict, including Hindu-Muslim relations. However, three exceptions
are of note. The first recent episode of major social conflict occurred on October 31,
1984, when the assassination of Prime Minister Indira Gandhi by two of her Sikh
bodyguards triggered four days of widespread anti-Sikh riots throughout Delhi killing
thousands of Sikhs.183 A second episode occurred when riots broke out in Chandni
Chowk between Hindus and Muslims in October and November 1990 following L.K.
Advani’s Rath Yatra through Delhi.184 A third episode occurred following the destruction
of the Babri mosque in Ayodhya on December 6, 1992, when riots between Hindus and
Muslims broke out in Delhi’s Seelampur district.185
182Ibid,p.5502.Pushkarcitesdatafromasurveyofvotersduringthe2003assemblyelectionsinDelhiindicatingthat,ofthevoterswhosaidthattheyhadmigratedtoDelhiinthe1980s,27percentsaidtheywerefromUttarPradesh,7percentwerefromBihar,6percentfromHaryana,4percentfromPunjaband3percentfromRajasthan.183TheassassinationofPrimeMinisterIndiraGandhibyherSikhbodyguardswasinretaliationtoherorderstocarryout“OperationBlueStar,”amilitaryoperationconductedinJune1984toremoveSikhmilitantseparatistsoperatingfromtheGoldenTempleholysiteinAmritsar,Punjab.Theanti‐Sikhriotsbeganwithinhoursofherassassination.RajivGandhiwasfamouslyquotedassayingoftheassassinationofhismother,IndiraGandhi,andthesubsequentanti‐SikhriotsinDelhi,“Whenagianttreefalls,theearthbelowshakes,”forwhichhewaslaterdeeplycriticized.See“Leaders‘incited’anti‐Sikhriots,”BBCNews,August8,2005athttp://news.bbc.co.uk/2/hi/south_asia/4130962.stm.EstimatesofthenumberofSikhskilledinDelhiduringthe1984riotrangefrom1000to3000.184Estimatesofthenumberofpeoplekilledintheriotsrangefromeighttoupwardsof100.“16GetLifefor1990DelhiRiots,”RediffIndiaAbroad,September8,2006athttp://www.rediff.com/news/2006/sep/08riot.htm.Saba,Naqvi,“ABeastAsleep?”OutlookIndia,March5,2012.185Drogin,Bob,“DeadlyReligiousRiotsSpreadtoIndia’sCapital:Rampagingyouthstorchhomesandshops,residentsfleeviolencestemmingfromrazingofmosque,”LosAngelesTimes,December12,1992.Miller,Sam.Delhi:AdventuresinaMegacity.NewYork:St.Martin’sPress,2009,p.258.EstimatesofthenumberofMuslimskilledinDelhiduringthe1992riotrangefrom3to20people.

112
Since independence, Delhi politics has been dominated by a two-party rivalry at
the national and state levels between the Congress party and the Jan Sangh party, (the
precursor party to the BJP), followed by the BJP. While the Congress has historically
drawn its base from the poor, the lower middle class, Other Backward Classes (OBCs),
and Muslims, the Jan Sangh in Delhi was associated with the interests of the Punjabi
refugees, who became a dominant part of the Delhi trading community, and the Hindu
upper castes.186 When the BJP was created in 1980, it adopted the same social base of
support as the Jan Sangh, and came to be known as the “Bania, Brahmin, Punjabi party”
in Delhi.187 In addition, after the anti-Sikh riots in Delhi, the BJP became a viable option
for the Sikh community who previously voted for Congress.
In 1989, the BJP gained a footing in Delhi, winning a majority of the Lok Sabha
parliamentary seats over the Congress party. Over five elections, (1989, 1991, 1996, 1998
and 1999) the BJP dominated Delhi politics in the national elections, until 2004, which
witnessed a sharp swing toward the Congress party. A similar pattern emerges in the
Delhi state assembly elections. In the first state assembly election in 1993, the BJP won
two-thirds of the assembly seats. However, the 1998 assembly election witnessed a sharp
swing toward the Congress party, which has maintained its power in the subsequent 2003
and 2008 assembly elections. Table 5.1 lists the party winner in Delhi of the national Lok
Sabha elections and the state assembly elections from 1989 to 2009.
186Raj,“Delhi:BenefitingfromTwo‐LayeredIncumbency,”p.5503.PushkarRajnotesthattheJanSanghwasoncelabeledthepartyofrefugees,referringtoitsbaseofPunjabirefugeeswhomigratedtoDelhiafterthepartitionofIndiaandPakistan.Andersen,WalterandMahenderKumarSaini,“TheCongressSplitinDelhi:TheEffectofFactionalismonOrganizationalPerformanceandSystemLevelInteractions,”AsianSurvey,11(11),November1971.187BrahminsarehighcasteHindus.Baniasaretradersormerchantsandoftenconsidereduppercaste.

113
Table 5.1: Party Winner of Delhi Elections at the National and State Levels Delhi National Elections Delhi State Elections 1989: BJP 1991: BJP 1996: BJP 1993: BJP* 1998: BJP 1998: Congress 1999: BJP 2004: Congress 2003: Congress 2009: Congress 2008: Congress
Source: Election Commission of India *1993 was the first year Delhi held State assembly elections
This similar pattern of a swing away from the BJP to the Congress party in the
national and state elections in Delhi is not entirely surprising given that New Delhi is
both the national capital of India and the state capital of the NCT. Additionally both the
central government of India and the NCT jointly administer New Delhi. Thus, the
interplay of national and state level politics is an important factor to consider in
understanding politics in Delhi.
We’ll begin the recent story of Delhi politics with the 1998 national election. Of
particular relevance to Delhi, the BJP called for constitutional reforms that would give
the national capital full statehood. The national election did not lead to an absolute
majority, but the BJP was temporarily able to forge a coalition government. In Delhi, the
BJP won 6 out of 7 Lok Sabha seats.
Eight months later, a very different outcome emerged in Delhi’s state assembly
elections. During the BJP’s five-year tenure as the leader of the Delhi state government,
the party changed its state Chief Minister three times, while civic amenities languished,
crime increased, and commodity prices soared. The Congress party’s 1998 state assembly
election campaign focused particularly on the BJP’s deficiencies in providing public
amenities (namely water, power and transport) and its inability to control prices of

114
commodities, in particular, onions. The Congress opposition, led by Delhi Congress
Committee president Sheila Dixit, campaigned on the slogan that the BJP failed to
provide bijli, jal and pyaj, (power, water and onions). The Congress won two-thirds of
the Delhi assembly seats.188
As noted in Chapter Two, in the 1999 national election, the BJP campaigned on
delivering one year of solid economic growth, its effective handling of the Kargil conflict
with Pakistan during the summer of 1999, and emphasized the party’s homegrown
leadership under Atal Bihari Vajpayee. The BJP and its NDA coalition won a majority of
Lok Sabha parliamentary seats. In Delhi, the BJP won all seven Lok Sabha seats.
During the 2004 national election, the BJP launched its, “India Shining”
campaign, and used the slogan, the feel good factor. While the BJP drew on its national
election themes, the Congress party campaigned on working for Aam Aadmi, or the
common man, and emphasized development issues related to Delhi.189
Similar to its successful past state assembly election campaigns, the Congress
party focused on the issues of bijli, sadak, pani, (power, roads, water).190 The Congress
party won six Lok Sabha seats in Delhi, while the BJP lost six seats and retained one.191
Although the BJP’s 2009 election platform focused on issues of governance, as
noted in Chapter Two, the party’s issue agenda was largely subsumed by political
188Rajalakshmi,T.K.,“AssemblyElectionsCapitalContest,”Frontline,15(23),November7‐20.1998.Ramakrishnan,Venkitesh,“AFreshPolarisationinDelhi,”Frontline,15(23),December5‐18,1998.189Congressusedtheslogan,“Congresskahaath,aamaadmikesaath,”meaning,“ThehandofCongressiswiththecommonman.”IndianNationalCongressWebsite,www.aicc.org.in/new/.190Raj,“Delhi:BenefitingfromTwo‐LayeredIncumbency,”p.5502.191Ibid,p.5502.
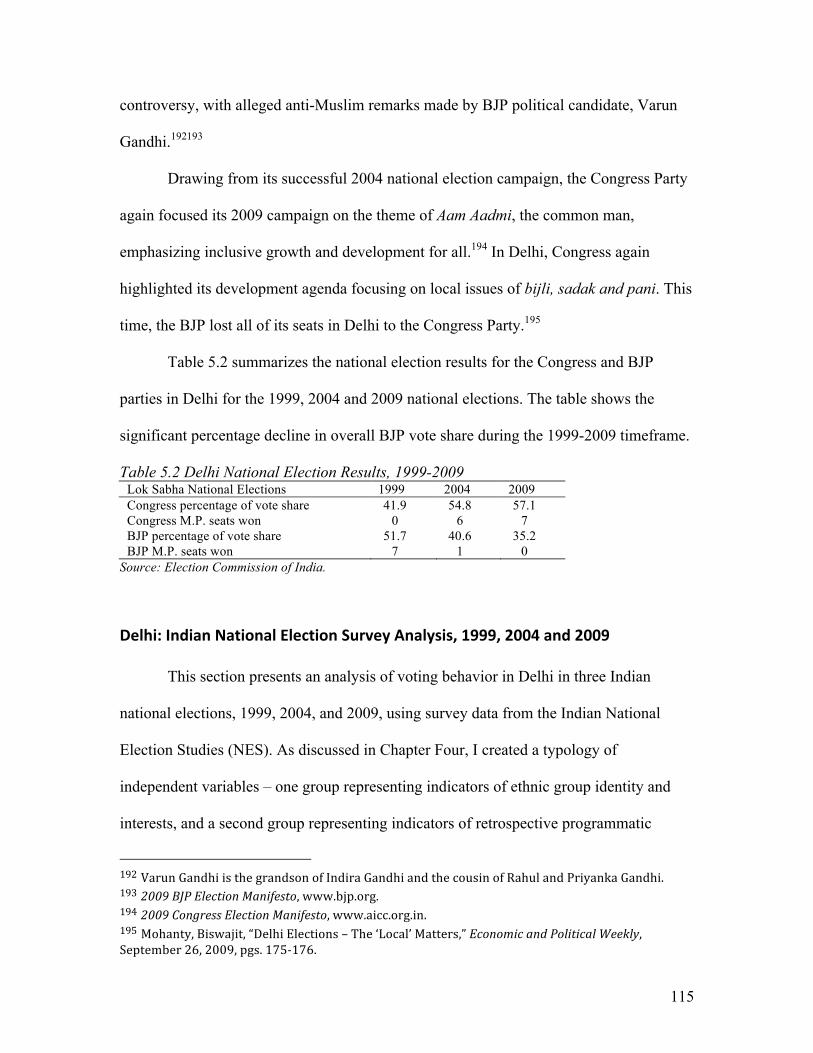
115
controversy, with alleged anti-Muslim remarks made by BJP political candidate, Varun
Gandhi.192193
Drawing from its successful 2004 national election campaign, the Congress Party
again focused its 2009 campaign on the theme of Aam Aadmi, the common man,
emphasizing inclusive growth and development for all.194 In Delhi, Congress again
highlighted its development agenda focusing on local issues of bijli, sadak and pani. This
time, the BJP lost all of its seats in Delhi to the Congress Party.195
Table 5.2 summarizes the national election results for the Congress and BJP
parties in Delhi for the 1999, 2004 and 2009 national elections. The table shows the
significant percentage decline in overall BJP vote share during the 1999-2009 timeframe.
Table 5.2 Delhi National Election Results, 1999-2009 Lok Sabha National Elections 1999 2004 2009 Congress percentage of vote share 41.9 54.8 57.1 Congress M.P. seats won 0 6 7 BJP percentage of vote share 51.7 40.6 35.2 BJP M.P. seats won 7 1 0
Source: Election Commission of India.
Delhi:IndianNationalElectionSurveyAnalysis,1999,2004and2009
This section presents an analysis of voting behavior in Delhi in three Indian
national elections, 1999, 2004, and 2009, using survey data from the Indian National
Election Studies (NES). As discussed in Chapter Four, I created a typology of
independent variables – one group representing indicators of ethnic group identity and
interests, and a second group representing indicators of retrospective programmatic
192VarunGandhiisthegrandsonofIndiraGandhiandthecousinofRahulandPriyankaGandhi.1932009BJPElectionManifesto,www.bjp.org.1942009CongressElectionManifesto,www.aicc.org.in.195Mohanty,Biswajit,“DelhiElections–The‘Local’Matters,”EconomicandPoliticalWeekly,September26,2009,pgs.175‐176.

116
interests – to test ERV’s ability to explain the way in which ethnic and programmatic
interests influence voting behavior and voter support for the BJP at the societal level
over space (i.e. Delhi and Gujarat) and time (i.e. 1999, 2004 and 2009). A complete
description of these two groups of indicators is provided in Chapter Four. The
dependent variable for this analysis is vote choice; a binary, or dichotomous,
dependent variable coded 0 for individuals who voted for the Congress Party, and 1 for
individuals who voted for the BJP.
Delhi,1999Election
Under conditions of a high political economy of development, with Delhi’s
state domestic product reaching 11.9 percent, and a medium level of Hindu-Muslim
ethnic conflict, influenced by the recent Kargil War and the BJP’s ethno-nationalist
political mobilization strategy, the BJP won all seven of Delhi’s Lok Sabha seats in the
1999 national election.
Post-poll national election surveys were conducted after the 1999 Lok Sabha
election both nationally and in Delhi. Due to the sample size constraints of the 1999
NES data for Delhi (n=63), regression analysis is not appropriate.196 Therefore, the
analysis focuses on first testing if there is a statistically significant relationship
between individual indicators and vote choice using cross tabs and chi-square analysis,
and then examining if there are statistical and substantive differences in sample
proportions for these indicators for BJP voters (for example, the percentage of Hindus
196ThesamplesizeforDelhiis97,however33respondentsdidnotprovideinformationonwhotheyvotedforandonerespondentvotedforanindependentcandidate.SincethisresearchisinterestedinthefactorsaffectingvotechoicefortheBJPandmaintainingatightcomparisonbetweenBJPvotersandCongressvoters,Iremovedthesefromthesample,reducingthesamplesizeto63.
117
who voted for the BJP versus the percentage of non-Hindus who voted for the BJP). A
full list of the descriptive statistics for the Delhi 1999 election analysis is listed in table
1, Appendix B.
The results of the chi-square test indicate that both indicators of ethnic group
identity and interests and retrospective programmatic interests are statistically
significant with vote choice. In particular, ethnic group identity and interest indicators
for 1) caste 2) social harmony related to Hindu/Muslim relations, and 3) class, are all
statistically significant on vote choice. Retrospective programmatic interests for 1)
prices, 2) corruption, 3) national security, and 4) law & order, are also statistically
significant with vote choice.197 However, indicators for 1) religiosity, 2) religion, 3)
Ram Temple views, and 4) age, are not statistically significant on vote choice.
The following table provides a summary of the differences in sample
proportions for BJP voters for indicators of ethnic group identity and interests and
retrospective programmatic interests.198 Column two “Yes” presents the proportion of
voters with a particular characteristic (i.e., upper caste, Hindu, rich), or who answered
in the affirmative to a particular question and voted for the BJP, while column three
“No” presents the proportion of voters who do not have the particular characteristic, or
who answered in the negative to a particular question and voted for the BJP. The
percentage can be derived by multiplying each proportion by 100.
197TheP‐valuesforthechi‐squareanalysisarethefollowing:Caste:0,Class:.04,Religion:.13,Religiosity:.6,HinduRamTempleviews:.57,SocialHarmony:.005,PriceLevels:.04,Corruption:.01,NationalSecurity:0,Law&Order:0.198Differencesinsampleproportionswerecalculatedusingatwo‐sampletestofproportion(prtest)foreachindicatorinStata.

118
Table 5.3 Differences of sample proportions for Ethnic and Retrospective Programmatic Indicators for BJP voters, Delhi 1999 election
Indicator Yes No Difference in proportions
Caste (Uppercaste) .68 .24 -.44** Class (Rich) .61 .33 -.28* Religion (Hindu) .43 0 -.43 Religiosity .42 .33 -.09 Hindu Ram Temple views .37 .29 -.08 Social Harmony (Improved) .56 .18 -.38** Price Levels (Increased) .31 .61 .30* Corruption (Down) .59 .23 -.36** National Security (Deteriorated) .16 .62 . 46** Law & Order .64 .17 -.47**
Source: Indian NES Survey (1999) Significance: * = at 5%; ** = at 1% N = 63
The difference of proportions test summarized above suggests both statistical and
substantive effects for most of the indicators tested for BJP voters. If we first look at
indicators of ethnic group identity and interests, we find a statistical and substantive
difference for BJP voters in terms of caste: 68 percent of upper caste voters voted for the
BJP, whereas only 24 percent of non-upper caste voters voted for the BJP, a difference of
44 percent. Thus, in the 1999 election in Delhi, it appears that being upper caste is a
distinguishing feature of BJP voters. Although, religion, measuring whether or not a
voter is Hindu, is not statistically significant, its large difference suggests substantive
significance: while 43 percent of Hindus voted for the BJP, no non-Hindus voted for the
BJP.199 These results suggest that ethnic identity related to being upper caste and being
Hindu were distinguishing features of BJP voters in this election.
The ethnic indicator, social harmony, relating to improvements in Hindu-Muslim
relations, is both statistically and substantively significant, indicating that while 56
199Onlythreerespondentsfromthesampleof63indicatedthattheywerenon‐Hindu.AllthreedidnotvotefortheBJP.
119
percent of voters who evaluated the incumbent BJP government performance in
addressing Hindu-Muslim relations favorably voted for the BJP, only 18 percent of voters
who evaluated government performance on this issue unfavorably voted for the BJP.
While the results for the ethnic identity and interests indicators of caste, religion,
and social harmony, suggest that they are distinguishing factors of BJP voters, by
contrast, the indicator for Ram temple views, in this analysis, does not appear to be a
distinguishing factor for BJP voters. This latter finding is of particular interest, because a
key aspect of the BJP’s electoral platform in the 1996 and 1998 Lok Sabha elections was
its strong advocacy for rebuilding the Ram Temple in Ayodhya. However, in the
following section examining in-depth case studies of individual voters and voting
behavior in New Delhi, I find that views about the Ram Temple controversy and the
desire to see the Ram Temple built did significantly influence electoral support for the
BJP for certain voters.200
If we turn to examine the impact of retrospective programmatic indicators, we
find both statistically significant and substantive differences on issues of national
security and law and order for BJP voters. The majority of voters who assessed the
incumbent BJP government performance on national security and law and order
favorably voted for the BJP by 62 and 64 percent respectively, as compared to only 16
and 17 percent of voters who assessed the incumbent government on these issues
unfavorably and voted for the BJP.
200The1999NESsurveyquestionasksthefollowingquestion:“OnthesitewhereBabriMasjidwassituatedonlyRamtempleshouldbebuilt(agree,noopinion,disagree).”ThesurveyquestionasksavoterwhetherornottheRamtempleshouldbebuilt.”ItdoesnotspecificallyaskthevoterifherviewsabouttheHinduRamTempleaffectedhervotechoice.Thesurveyquestionusedforthecasestudiesiswordeddifferently.
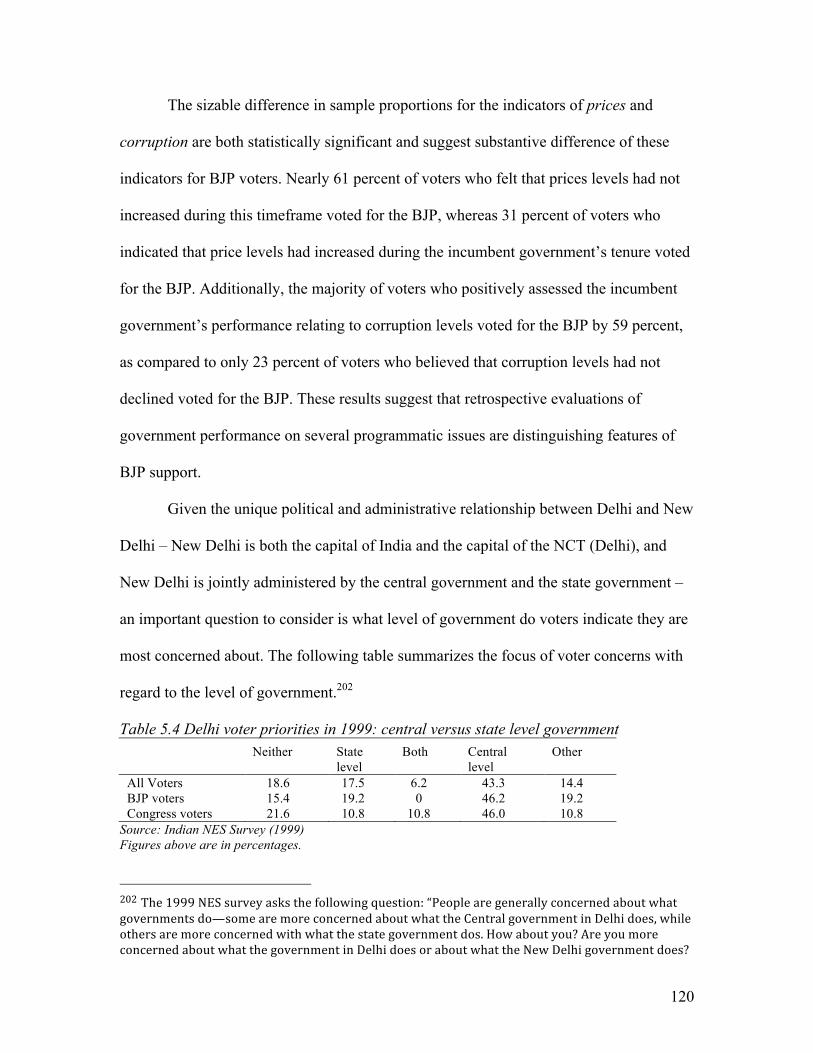
120
The sizable difference in sample proportions for the indicators of prices and
corruption are both statistically significant and suggest substantive difference of these
indicators for BJP voters. Nearly 61 percent of voters who felt that prices levels had not
increased during this timeframe voted for the BJP, whereas 31 percent of voters who
indicated that price levels had increased during the incumbent government’s tenure voted
for the BJP. Additionally, the majority of voters who positively assessed the incumbent
government’s performance relating to corruption levels voted for the BJP by 59 percent,
as compared to only 23 percent of voters who believed that corruption levels had not
declined voted for the BJP. These results suggest that retrospective evaluations of
government performance on several programmatic issues are distinguishing features of
BJP support.
Given the unique political and administrative relationship between Delhi and New
Delhi – New Delhi is both the capital of India and the capital of the NCT (Delhi), and
New Delhi is jointly administered by the central government and the state government –
an important question to consider is what level of government do voters indicate they are
most concerned about. The following table summarizes the focus of voter concerns with
regard to the level of government.202
Table 5.4 Delhi voter priorities in 1999: central versus state level government Neither State
level Both Central
level Other
All Voters 18.6 17.5 6.2 43.3 14.4 BJP voters 15.4 19.2 0 46.2 19.2 Congress voters 21.6 10.8 10.8 46.0 10.8
Source: Indian NES Survey (1999) Figures above are in percentages. 202The1999NESsurveyasksthefollowingquestion:“Peoplearegenerallyconcernedaboutwhatgovernmentsdo—somearemoreconcernedaboutwhattheCentralgovernmentinDelhidoes,whileothersaremoreconcernedwithwhatthestategovernmentdos.Howaboutyou?AreyoumoreconcernedaboutwhatthegovernmentinDelhidoesoraboutwhattheNewDelhigovernmentdoes?

121
The NES survey indicates that Delhi voters in the 1999 election were in general
more focused on and concerned with the work of the central government than the state
government. This pattern continues when looking at BJP voters and Congress voters. In
particular, nearly half of BJP voters are more concerned with the work of the central
government (46.2 percent) than with the work of the state government (19.2 percent).
This data suggests that a majority of Delhi voters in the 1999 election, including BJP
voters, were focused on central level government concerns.
In summary, the analysis of 1999 NES survey data indicates that ethnic group
identity and interests, particularly indicators for caste, religion, and social harmony
relating to Hindu-Muslim relations, and retrospective programmatic issues relating to
national security, law and order, corruption and price levels, were both substantively
important factors on voting behavior and voter support for the BJP in the 1999 national
elections in Delhi. In addition, the data indicates that the majority of BJP voters were
concerned with the work of the central government, suggesting that national level issues,
such as the BJP’s handling of the 1999 Kargil conflict, played an important role in vote
choice.
In the context of Delhi’s high political economy of development, and moderate
levels of ethnic group conflict in 1999, influenced by the BJP’s Hindu nationalist political
mobilization strategy during the late 1990s and the 1999 Kargil conflict with Pakistan,
ERV theory predicts this pattern of voting behavior, in which the influence of ethnic
group identity and interests and retrospective programmatic interests are both strong
factors in explaining voting behavior and voter support for the BJP, most closely
represented by scenario 1 in table 3.1.
122
Delhi,2004Election
The 2004 national election in Delhi were a major turning point for the BJP.
During this time, Delhi experienced a negligible level of Hindu-Muslim violent conflict,
and voters’ perceptions of Hindu-Muslim relations in Delhi had become more positive,
suggesting a medium-low level of ethnic conflict. Despite an increasingly robust political
economy of development, with Delhi’s state domestic product increasing from 11.9
percent in 1999-2000 to 14.5 percent in 2004-2005, and a decreasing trend in poverty
levels, from 14.6 percent (1993-1995) to 10.2 percent in 2004-2005, the incumbent BJP
suffered an eleven-percentage point decline in overall vote share compared to its
performance in the 1999 national election, shrinking from 51.7 percent to 40.6 percent of
the vote share, and resulting in a loss of six out of Delhi’s seven Lok Sabha seats. How
do we explain this major shift away from the BJP in Delhi?
To improve survey representation at the state level, the 2004 post-poll national
election survey sample size used for this analysis is almost three times larger than the
1999 national election survey sample, and the survey increased the Delhi sample size ten-
fold, to 1,111.203 Of the 1,111 survey respondents in Delhi, 287 respondents either
refused to answer who they voted for (n=219) or said that they didn’t know who they
voted for (n=68), and 33 respondents voted for smaller regional parties. Subtracting these
respondents who did not provide information about who they voted for or who voted for
a small regional party, leaves a sample size of 791 respondents consisting of BJP and
203See“NationalElectionStudy2004Introduction,”EconomicandPoliticalWeekly,December18,2004.

123
Congress voters. Of the 791 survey respondents, 478 voted for Congress and 313 voted
for the BJP. How do we explain the significant defeat of the BJP in Delhi in 2004?
With a sample size of almost 800, in the following analysis of 2004 national
election survey data in Delhi, it is possible to employ a logistic regression model to test
for the effects of ethnic group identity and interests, and retrospective programmatic
interests on the likelihood of voting for the BJP. A full list of the descriptive statistics for
the Delhi 2004 election analysis is listed in table 3, Appendix B.
The following model includes indicators of ethnic group identity and interests:
(i.e., caste, religion, ram temple views, and social harmony), and indicators of
retrospective programmatic voting (i.e., personal financial conditions, employment,
development, corruption, and central government performance).204 The indicator for
central government performance is included in the main model in column one. This
indicator is removed in the second and third models, in order to better ascertain which
retrospective programmatic issues are driving vote choice. The model also includes
indicators for age, class and religiosity. Table 5.5 provides a summary of the regression
results for all three models, with main model results listed in the first column.
Vote choice 2004 = ß0 + ß1Agei + ß2 Class (Rich)i + ß3Caste (Upper Caste)i+ ß4Religion (Hindu)i + ß5Religiosityi + ß6RamTempleviewsi + ß7SocialHarmonyi + ß8PersonalFinancei + ß9Employmenti + ß10Corruptioni + ß11Developmenti + ß12NationalSecurityi + ß13Central Government Performancei + ei
204 AsnotedinChapterFour,duetothedifferencesinthesurveyquestionsaskedbetweenthe1999and2004IndianNESsurveys,someoftheindicatorsincludedinthe2004modelaredifferentfromtheindicatorsusedinthe1999model.Specifically,surveyquestionsaboutavoter’sretrospectiveassessmentaboutpricelevelsandlawandorderareincludedinthe1999NESsurvey,butarenotincludedinthe2004NESsurvey,whereasquestionsaboutvoter’sretrospectiveassessmentaboutemploymentanddevelopmentareincludedinthe2004NESsurveybutnotinthe1999NESsurvey.

124
Table 5.5 Logit Regression Results, Delhi 2004 election (1) (2) (3) Age 0.016*
(0.007) 0.016* (0.007)
0.015* (0.007)
Class (Rich) 0.253 (0.247)
0.422 (0.224)
0.370 (0.225)
Caste (Upper Caste) 0.475* (0.233)
0.619** (0.214)
0.694** (0.216)
Religion (Hindu) 0.595* (0.301)
0.657* (0.286)
0.680* (0.288)
Religiosity -0.139 (0.115)
-0.113 (0.106)
-0.040 (0.106)
Ram Temple Views 0.146 (0.086)
0.128 (0.078)
0.150 (0.080)
Social Harmony (Hindu-Muslim)
0.202 (0.186)
0.328* (0.169)
0.247 (0.165)
Personal Financial Conditions
0.487** (0.172)
0.520** (0.151)
0.564** (0.153)
Employment 0.215 (0.146)
0.359** (0.134)
0.319* (0.132)
Corruption -0.167 (0.161)
0.159 (0.136)
-
Development 0.202 (0.186)
0.601** (0.192)
-
National Security
0.667** (0.208)
- 0.899** (0.172)
Central Government Performance
0.803** (0.121)
- -
Constant -7.66** (0.921)
-6.480** (0.802)
-6.981** (0.810)
Observations 535 557 566 Pseudo R-squared 0.26 0.17 0.20
Source: Indian NES Survey (2004) Significance: * = at 5%; ** = at 1%; standard errors are in parentheses. Dependent Variable is vote choice, coded 0 for Congress, and 1 for the BJP
The logit coefficient estimates in the main model, column one, show that the
indicators of ethnic group identity and interests relating to caste (upper caste) and
religion (Hindu), and the retrospective programmatic indicators relating to personal
financial conditions, national security, and central government performance each have a
positive and statistically significant impact on the likelihood of voting for the BJP,
holding all else constant. We find that the retrospective programmatic indictors relating
to development, employment, and corruption are not statistically significant on vote

125
choice. The ethnic group interest indicator, ram temple views, is also not statistically
significant on vote choice. Similar to the analysis of voting behavior in Delhi in the 1999
election, religiosity is also not statistically significant.
Since the indicator central government performance is akin to a broad job
approval rating of government performance, I removed this indicator from model two and
model three to better ascertain which retrospective issues are influencing vote choice. In
addition, because of the moderately high correlation between indicators for national
security and corruption (.50), and for national security and development (.49), I retained
indicators for corruption and development in model two and removed the indicator for
national security. In model three, I retained the indicator for national security, and
removed indicators for development and corruption.
In model two, column two, I find that the retrospective programmatic indicators
for personal financial conditions, employment and development are all positive and
statistically significant on the likelihood of voting for the BJP. In addition, the ethnic
group interest indicator, social harmony, is also statistically significant on vote choice.
Corruption again is not statistically significant.
In model three, column three, in which national security is retained, I find that
national security is positive and statistically significant on vote choice, but social
harmony loses its statistical significance. In addition, there are no changes in the direction
or the statistical significance of any of the remaining variables.

126
Predicted probabilities provide insight into the substantive effect of individual
indicators on the likelihood of voting for the BJP.206 Table 5.6 presents these predicted
probabilities.207
Table 5.6 Predicted Probabilities: Delhi 2004 election
(1) (2) (3) Age .25 .32 .30 Class (Rich) n.s. n.s. n.s. Caste (Upper Caste) .11 .14 .16 Religion (Hindu) .13 .15 .15 Religiosity n.s. n.s. n.s. Ram Temple views n.s. n.s. n.s. Social Harmony (Hindu-Muslim) n.s. .15 n.s. Personal Financial Conditions .22 .24 .26 Employment n.s. .17 .15 Corruption n.s. n.s. n/a Development n.s. .25 n/a National Security .27 n/a .36 Central Government Performance .50 n/a n/a
Source: Computed from the logit coefficients. n.s. = not statistically significant; n/a = not applicable
Predicted probabilities calculated for the main model, in column one above,
indicate that ethnic group identity related to caste (upper caste) and religion (Hindu)
increase the likelihood of voting for the BJP by 11 and 13 percentage points, respectively.
Although conditions of ethnic conflict have reduced considerably in Delhi in 2004
compared to in 1999, ethnic factors continue to have a substantive impact on the
likelihood of voting for the BJP in the 2004 election in Delhi.
Additionally, retrospective programmatic indicators relating to personal financial
conditions and national security increase the likelihood of voting for the BJP by twenty-
206Logitcoefficientsprovideinformationonthedirectionandstatisticalsignificanceofdifferentvariables.CalculatingpredictedprobabilitiesprovidestheabilitytoascertainmoreinformationaboutthesubstantiveeffectsofdifferentindicatorsonthelikelihoodofvotingfortheBJP.207Table5.6listschangesinthepredictedprobabilitiesofvotingfortheBJPaseachindicatorchangesfromitsminimumtoitsmaximumvalue,holdingallothervariablesconstantattheirmeans,usingtheprchangecommandinStata.SeeLong,J.ScottandJeremyFreese,RegressionModelsforCategoricalDependentVariablesUsingStatesSecondEdition.CollegeStation:StataPress,2006,p.169.

127
two, and twenty-seven percentage points, respectively. The indicator representing voter’s
overall assessment of central government performance has the greatest impact on the
likelihood of voting for the BJP, increasing the likelihood of voting for the BJP by 50
percent points. Under conditions of a high political economy of development,
retrospective programmatic interests appear to play a significant role in explaining voting
behavior and the likelihood of voting for the BJP in the 2004 election in Delhi.
In model two, the predicted probabilities for retrospective indicators of personal
financial conditions, development, and employment indicate significant substantive
effects on the likelihood of voting for the BJP. In addition, the predicted probability for
social harmony indicates a positive substantive effect on vote choice. In model three, the
predicted probability for national security increases the likelihood of voting for the BJP
by 35 percentage points.
These results from table 5.6 suggest that while ethnic group identity and interests
continue to have substantive effects on voter support for the BJP, retrospective
programmatic interests, in particular relating to personal financial conditions,
development, and national security, appear to have strong substantive effects on the
likelihood of voting for the BJP in the 2004 election in Delhi.
An additional question can be asked about the main model: since ERV’s
hypotheses make claims about the conditions under which ethnic group identity and
interests become salient, and when retrospective programmatic interests become salient,
we can ask what happens to the model if an interaction term is included which links these
two factors. I generated two interaction terms, one that tests for the conditioning effects

128
of caste and development, and a second, which tests for the conditioning effects of caste
and personal financial conditions. The results are listed below in table 5.7.
Table 5.7 Logit Regression Results, Delhi 2004 election with interaction terms
(1) (2) Age 0.145
(0.007) 0.0146 (0.007)
Class (Rich) 0.261 (0.237)
0.218 (0.240)
Caste (Upper Caste) -0.179 (0.973)
-0.535 (0.720)
Religion (Hindu) 0.700* (0.296)
0.639* (0.297)
Religiosity -0.123 (0.111)
-0.113 (0.112)
Ram Temple Views 0.129 (0.083)
0.200 (.084)
Personal Financial Conditions 0.429** (0.165)
0.119 (0.251)
Employment 0.287* (0.141)
0.283* (0.141)
Corruption 0.046 (0.145)
0.052 (0.145)
Development 0.311 (0.281)
0.495** (0.189)
Caste (Upper Caste) & Development
0.270 (0.355)
-
Caste (Upper Caste) & Personal Financial Conditions
- 0.503 (0.321)
Central Government Performance 0.817** (0.115)
0.811** (0.115)
Constant -6.399** (1.007)
-6.217** (0.9239)
Observations 555 555 Pseudo R-squared .24 .24
Source: Indian NES Survey (2004) Significance: * = at 5%; ** = at 1%; standard errors are in parentheses. Dependent Variable is vote choice, coded 0 for Congress, and 1 for the BJP
I refer to, Interaction Effects in Logistic Regression, in the following discussion in
interpreting the coefficients, focusing on column one of table 5.7.210 Jaccard notes the
210Jaccard,James,InteractionEffectsinLogisticRegression.ThousandOaks:SagePublications,2001.SeealsoJaccard,JamesandRobertTurrisi,InteractionEffectsinMultipleRegression,SecondEdition.ThousandOaks:SagePublications,2003.

129
importance of interpreting both the interaction term and the coefficients associated with
the interaction term. To begin, the coefficient, caste, represents the odds ratio of voting
for the BJP for upper caste voters versus non-upper caste voters in conditions when
voters’ perceptions of economic development have deteriorated.211 This variable is not
statistically significant. The coefficient, development, represents the ratio of the
conditioning effects of development for non-upper caste voters on the odds of voting for
the BJP, for a one unit increase (i.e., improvement) in voter perceptions’ of economic
development conditions.212 This variable is also not statistically significant.
The variable of the interaction term, caste&development, represents the ratio of
the conditioning effect of development on the odds ratio of voting for the BJP for upper
caste voters versus voting for the BJP for non-upper caste voters, for a one unit increase
(i.e., improvement) in voters’ perceptions of economic development conditions.213 The
interaction term is not statistically significant. Thus, we find that the interaction effects
represented by each of these three variables, caste, development, and caste&development,
are not statistically significant. The same is true in model two, column two, in that the
interaction effects represented by each of the variables, caste, personal financial
conditions, and caste&personalfinancialconditions are not statistically significant.
211Jaccardnotesthatwhenadummyvariable,inthiscaseCaste,ispartoftheproductterm,thecoefficientisconditionedonthemoderator‐variable,inthiscaseDevelopment,beingzero,whichrepresentsvoterassessmentthatdevelopmentconditionsarenotimproving.Inotherwords,theexponentofthedummyvariablereflectsthepredictedoddsratioofvotingfortheBJP,comparinguppercastevoterstonon‐uppercastevotersinthecaseinwhichDevelopmentisequaltozero.Seepgs.20‐21.212Ibid,p.31.Thecoefficient,Development,representstheconditionaleffectsofdevelopmentontheoddsofvotingfortheBJPwhenCasteisequaltozero(i.e.,non‐uppercaste).213Ibid,p.33.TheinteractiontermrepresentsaratioofanoddsratiocomparingthepredictedoddsofvotingfortheBJPwhenCasteequals1(i.e.uppercastevoters)versustheoddsofvotingfortheBJPwhenCasteequals0(i.e.non‐uppercastevoters),givena1‐unitincreaseintheconditionaleffectofDevelopment.
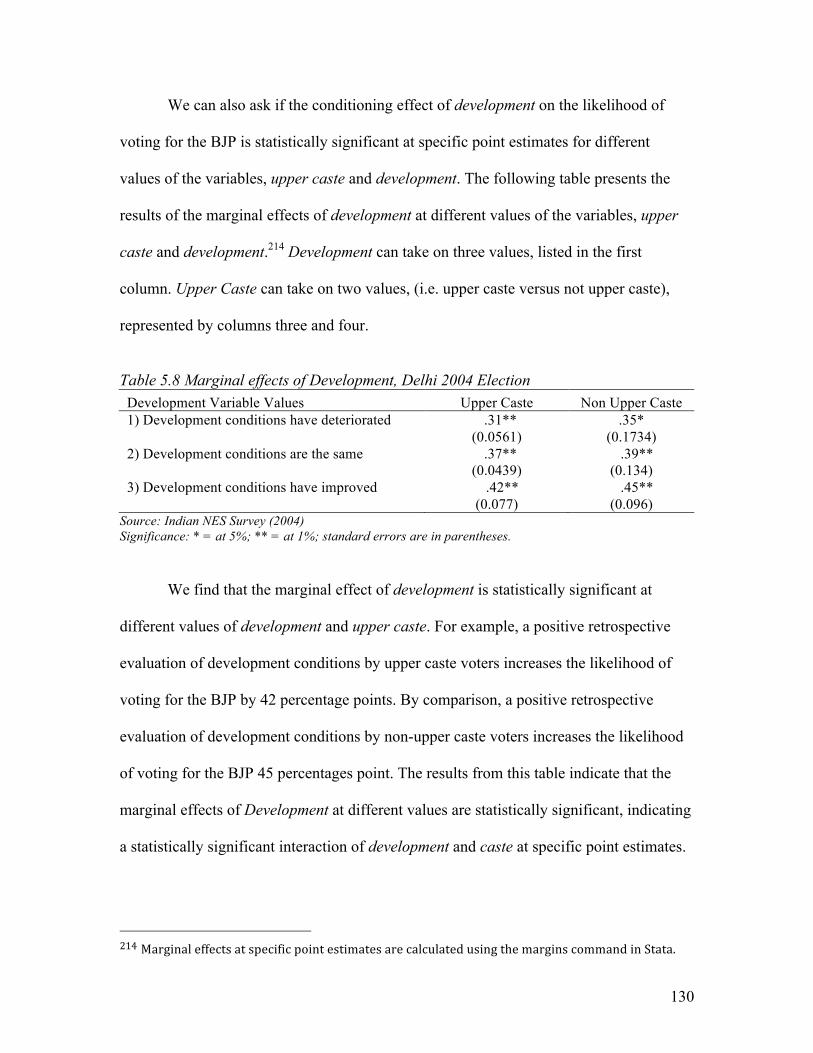
130
We can also ask if the conditioning effect of development on the likelihood of
voting for the BJP is statistically significant at specific point estimates for different
values of the variables, upper caste and development. The following table presents the
results of the marginal effects of development at different values of the variables, upper
caste and development.214 Development can take on three values, listed in the first
column. Upper Caste can take on two values, (i.e. upper caste versus not upper caste),
represented by columns three and four.
Table 5.8 Marginal effects of Development, Delhi 2004 Election
Development Variable Values Upper Caste Non Upper Caste 1) Development conditions have deteriorated .31**
(0.0561) .35*
(0.1734) 2) Development conditions are the same .37**
(0.0439) .39** (0.134)
3) Development conditions have improved .42** (0.077)
.45** (0.096)
Source: Indian NES Survey (2004) Significance: * = at 5%; ** = at 1%; standard errors are in parentheses.
We find that the marginal effect of development is statistically significant at
different values of development and upper caste. For example, a positive retrospective
evaluation of development conditions by upper caste voters increases the likelihood of
voting for the BJP by 42 percentage points. By comparison, a positive retrospective
evaluation of development conditions by non-upper caste voters increases the likelihood
of voting for the BJP 45 percentages point. The results from this table indicate that the
marginal effects of Development at different values are statistically significant, indicating
a statistically significant interaction of development and caste at specific point estimates.
214MarginaleffectsatspecificpointestimatesarecalculatedusingthemarginscommandinStata.

131
Thus, while the marginal effect of development at different values is statistically
significant at specific point estimates for upper caste and development, the results of the
logistical model in table 5.7 with the interaction term indicate that the ratio of the
conditioning effects of development on the odds ratio of voting for the BJP for upper
caste voters versus voting for the BJP for non-upper caste voters, for a one unit increase
in development, is not statistically significant.
As will be discussed in the next section examining individual case studies of New
Delhi voters, I find that the relative impact of ethnic identity and interests and
retrospective programmatic interests in explaining vote choice and voter support for the
BJP has considerable variation among individual voters.215
The above analysis of 2004 Delhi survey data indicates that ethnic group identity
interests and retrospective programmatic interests are significant factors influencing the
likelihood of voting for the BJP. But how does this compare to 1999? Of particular
interest, can we find evidence that ethnic group identity is having a greater or lesser role
distinguishing voter support for the BJP in the 2004 election compared to the 1999
election?216 Table 5.9 presents the results of the differences in sample proportions for BJP
voters for indicators of caste and religion in the 1999 and 2004 election in Delhi. Column
three presents the proportion of voters with a particular characteristic (i.e. upper caste,
Hindu) who voted for the BJP, while column four presents the proportion of voters who
do not have the characteristic and who voted for the BJP.
215Verma(2012)alsocreatedinteractiontermsofcasteandassessmentofpasteconomicconditionsusing2004NESand2009NESdata,andfoundthatmostoftheinteractiontermswerestatisticallyinsignificant.SeeVerma,“WhatDeterminesElectoralOutcomesinIndia?,”p.283.216Itisimportanttonotethatthedataexaminedinthe1999electionandinthe2004electioninDelhiisnotpaneldata.Thus,makingcomparisonsacrosstimeislimitedtoexaminingbroadpatternsinvotingbehavior.

132
Table 5.9 Differences of sample proportions for indicators of caste and religion for BJP voters, Delhi 1999 and 2004 elections
Year Indicator Yes No Difference in proportions
1999 Caste (upper caste) .68 .24 -.44** Religion (Hindu) .43 0 -.43**
2004 Caste (upper caste) .47 .28 -.19** Religion (Hindu) .42 .28 -.14**
Source: Indian NES Survey (1999, 2004) Significance: * = at 5%; ** = at 1% N = 63 (1999); 791 (2004)
The results of the differences of sample proportions for caste and religion in the
1999 election and the 2004 elections indicate that the differences with respect to these
ethnic indicators for BJP voters have narrowed. For example, in the 1999 election in
Delhi, 68 percent of upper caste voters voted for the BJP while 24 percent of non-upper
caste voters voted for the BJP. In the 2004 election, 47 percent of upper caste voters
voted for the BJP while 28 percent of non-upper caste voters voted for the BJP.
In particular, if we look at the indicator for caste (upper caste), we find a marked
change in the percentage of upper caste voters who voted for the BJP. In the 1999
election, 68 percent of upper caste voters voted for the BJP in Delhi. Five years later,
only 47 percent of upper caste voters vote for the BJP, indicating that the remaining 53
percent of upper caste voters voted for Congress. Thus, it appears that in 2004, the BJP
was no longer predominantly associated with drawing upper caste voters, who instead
were spread more evenly between the Congress and the BJP. This suggests that ethnic
group identity related to being upper caste had become a less distinguishing feature of
BJP voters in the 2004 election compared to the 1999 election in Delhi.
The analysis so far has shown that both ethnic group identity and interests and
retrospective programmatic interests play significant factors in the likelihood of voting

133
for the BJP in the 2004 election, but suggests that ethnic identity in particular relating to
being upper caste appears to be less influential in explaining voter support for the BJP
compared to the 1999 election in Delhi. In order to explain the significant change in
electoral fortunes of the BJP in Delhi in the 2004 election, another aspect to consider is
whether or not there have been changes in the priority of Delhi voters in terms of the
importance of the work of the central government versus the work of the state level
government, and how that impacts vote choice.
In the 1999 election, Delhi voters, regardless of whether they voted for the BJP or
Congress, were much more concerned about the work of the central government than the
work of the state government. Five years later, a different pattern emerges. The 2004
survey data shows that BJP voters continue to be much more concerned with the work of
the central government, whereas Congress voters are now more focused on the work of
the state government.217 Table 5.10 identifies voters’ priorities regarding the level of
government in 2004.
Table 5.10 Delhi voter priorities in 2004: central versus state level government
Neither State level
Both Central level
Other
All Voters 7.21 22.63 26.04 30.47 2.40 BJP voters 6.71 12.78 28.12 40.58 1.92 Congress voters 7.53 29.08 24.69 23.85 2.72
While BJP voters largely continued to focus their concerns on the work of the
central government, Congress voters had become more concerned about the work of the
state level government (increasing from 10.8 percent in 1999 to 29.08 percent in
217The2004NESsurveyasksthefollowingquestion:“Whilevotingsomepeoplegivemoreimportancetotheworkdonebythestategovernmentwhileothersgivemoreimportancetotheworkdonebythecentralgovernment.Whilevotinginthiselection,whatmatteredtoyoumost?(responses:CentralGovernmentinDelhi,StateGovernment,Both,Neither,Others,Don’tknow).”

134
2004).218 This data is suggestive that an increasing number of Delhi voters had become
more focused on the work of the Congress-run state level government, which likely had a
negative impact on the electoral fortunes of the BJP in the 2004 national elections.
In summary, this analysis of voting behavior in the 2004 election in Delhi
indicates that, while ethnic group identity and interests continue to play a factor in voting
behavior and voter support for the BJP in Delhi, a comparison of sample proportions for
indicators of caste and religion in the 1999 and 2004 elections suggest that ethnic group
identity, particularly being upper caste, had become a less distinguishing factor of BJP
support in the 2004 election. Additionally, retrospective programmatic concerns on issues
such as development, personal financial conditions, employment and national security,
showed both statistical significance and strong substantive effects on the likelihood of
voting for the BJP. Lastly, the findings from table 5.9 show that while BJP voters focused
more on the work of the BJP-led central government, Congress voters in Delhi were more
concerns about the work of the (Congress-led) state level government.
Under conditions of an increasingly strong political economy of development and
a lower level of ethnic conflict compared to 1999, these findings of voting behavior in
Delhi in the 2004 election, I argue, supports ERV’s prediction, in which retrospective
programmatic interests play a strong role in explaining voting behavior and voter support
for the BJP, while the political salience of ethnic group identity is less influential, most
closely represented by scenario 3 in table 3.1
218Acrosstabsandchi‐squareanalysisindicatesthatvoterprioritiesregardingcenterversusstatelevelgovernmentisstatisticallysignificantonvotechoice.TheP‐valueforthechi‐squareanalysis:0.

135
Delhi,2009Election
The 2009 national elections witnessed a continued decline in the political fortunes
of the BJP in Delhi. Within a ten-year time frame, and in socio-economic conditions of a
very high level of political economy of development, with state domestic product
increasing to 16.8 percent in 2008-2009, and the absence of ethnic riots or violence,
suggesting a low level of ethnic conflict, the BJP had gone from a party in the 1999
election which was able to win all of Delhi’s seven Lok Sabha seats by capturing 51
percent of the vote share, to a party in the 2009 election that could not win a single
parliamentary seat with a shrunken vote share of 35 percent.
The 2009 post-poll national election survey used for the following analysis
includes 1,005 survey respondents in Delhi. Of these 1,005 survey respondents in Delhi,
358 respondents either did not provide information about which party they voted for
(n=261), or indicated that they know which party they voted for (n=97). In addition, 55
respondents voted for smaller regional parties. Subtracting these respondents leaves a
sample size of 592 respondents who either voted for the BJP or the Congress party. Of
these 592 survey respondents, 378 voted for Congress and 214 voted for the BJP.219 A
full list of the descriptive statistics for the Delhi 2009 election analysis is listed in table 5,
Appendix B.
An initial examination of the 2009 Delhi survey data reveals a slight increase in
the number of Muslim respondents who voted for the BJP in the 2009 election. In the
2004 NES data for Delhi, two out of seventy Muslim survey respondents voted for the
BJP, whereas in the 2009 NES data, we find that twelve out of seventy-one Muslim
219See“NationalElectionStudy2009:AMethodologicalNote,”EconomicandPoliticalWeekly,September26,2009.
136
respondents voted for the BJP. This is suggestive of a very small but increasing number
of Muslim voters in Delhi who have become open to voting for the BJP despite its
association with Hindutva.
While the sampling method used for the 2009 NES is the same as for the 2004
NES, the interview schedule used was different, which has important implications for my
data analysis.220 While the same set of survey questions was asked to all respondents in
the 2004 NES, by contrast, five sets of questionnaires, including both common questions
and unique questions, were randomly administered to respondents in the 2009 NES.
Thus, some survey questions (i.e. class, caste, religion, religiosity, age, central
government performance) were administered to all respondents, while others (including
many which were asked to all respondents in 2004) were randomly administered to one-
fifth of all respondents.221
Due to the nature of the 2009 Delhi data, which includes variables with very
different sample sizes, a small logistic regression model is employed using variables with
the full sample size to test for the effects of ethnic group identity interests and
retrospective programmatic interests on the likelihood of voting for the BJP. Then, to
better ascertain which retrospective issues are influencing vote choice, I remove the
indicator, central government performance, and add individual indicators of retrospective
programmatic voting, which have a much reduced sample size, with the results in models
2, 3 and 4.
220Ibid,p.198.TheNESusesafour‐stagestratifiedrandomsamplingproceduretoachievearepresentativesampleofvotersacrossthecountry.Thefourstagesofrandomsamplingare:parliamentaryconstituencies(PCS),assemblyconstituencies(ACS),pollingstations(PSS)andrespondents.221Asaresultofthissplitsampleinterviewschedule,theDelhi2009dataincludesrelevantvariableswithasamplesizeof1000,andothervariableswithasamplesizecloserto200.

137
The main logit model in column one of the table below includes indicators of
ethnic group identity: (i.e., caste and religion), and one indicator of retrospective
programmatic voting (i.e., central government performance). The model also includes
indicators for age, class and religiosity. Table 5.11 provides a summary of regression
results for all four models.
Vote choice 2009 = ß0 + ß1Agei + ß2 Class (Rich)i + ß3Caste (Upper Caste)i+ ß4Religion (Hindu)i + ß5Religiosityi + ß6Central Government Performancei + ei Table 5.11 Logit Regression Results, Delhi 2009 election
(1) (2) (3) (4) Age -0.0001
(0.058) 0.011
(0.012) 0.017
(0.013) -0.001 (0.014)
Class (Rich) 0.195 (0.230)
-0.232 (0.487)
0.429 (0.521)
-0.922 (0.553)
Caste (Upper Caste) 0.813** (0.225)
0.603 (0.520)
0.898 (0.575)
-0.381 (0.588)
Religion (Hindu) 0.771** (0.238)
2.103** (0.782)
1.776* (0.801)
2.287** (1.08)
Religiosity 0.068 (0.111)
0.041 (0.254)
-.0078 (0.275)
0.098 (0.351)
Personal Financial Conditions
- -0.117 (0.216)
-
-
Development - - -0.494* (0.215)
-
Terrorism - - - 0.109 (0.288)
Central Government Performance
-1.074** (0.123)
- -
Constant 1.098 (0.622)
-3.136* (1.477)
-1.782 (1.534)
-3.287 (1.703)
Observations 555 112 103 86 Pseudo R-squared .17 .12 .16 .12
Source: Indian NES Survey (2009) Significance: * = at 5%; ** = at 1%; standard errors are in parentheses. Dependent Variable is vote choice, coded 0 for Congress, and 1 for the BJP
The results of the main model in column one show that the ethnic identity
indicators for caste (upper caste) and religion (Hindu) are positive and statistically

138
significant, while the retrospective programmatic indicator for central government
performance is negative and statistically significant on vote choice, holding all else
constant. Religiosity is not statistically significant on vote choice.
In models two, three and four, I remove the indicator, central government
performance, and add individual retrospective programmatic indicators, which have a
reduced sample size. In column two, the retrospective programmatic indicator for
personal financial conditions is included in the model. I find that this indicator is not
statistically significant on vote choice. In column three, when the retrospective
programmatic indicator for development is included in the model, it is negative and
statistically significant on vote choice.
In the fourth model, in column four, when the terrorism indicator representing
voter’s assessment of government performance handling the 2009 Mumbai terrorism
attacks is added to the model, it is not statistically significant on vote choice. Moreover,
this model as a whole does not fit better than an empty model.223 Table 5.12 below
presents the predicted probabilities from the logistic regression results.
223TheP‐valueforthelikelihoodratiochi‐squareteststatistic(LRchi2:11.51)is.07thuswecannotrejectthenullhypothesisthatthemodelfitsbetterthananemptymodelwithallcoefficientsequaltozero.
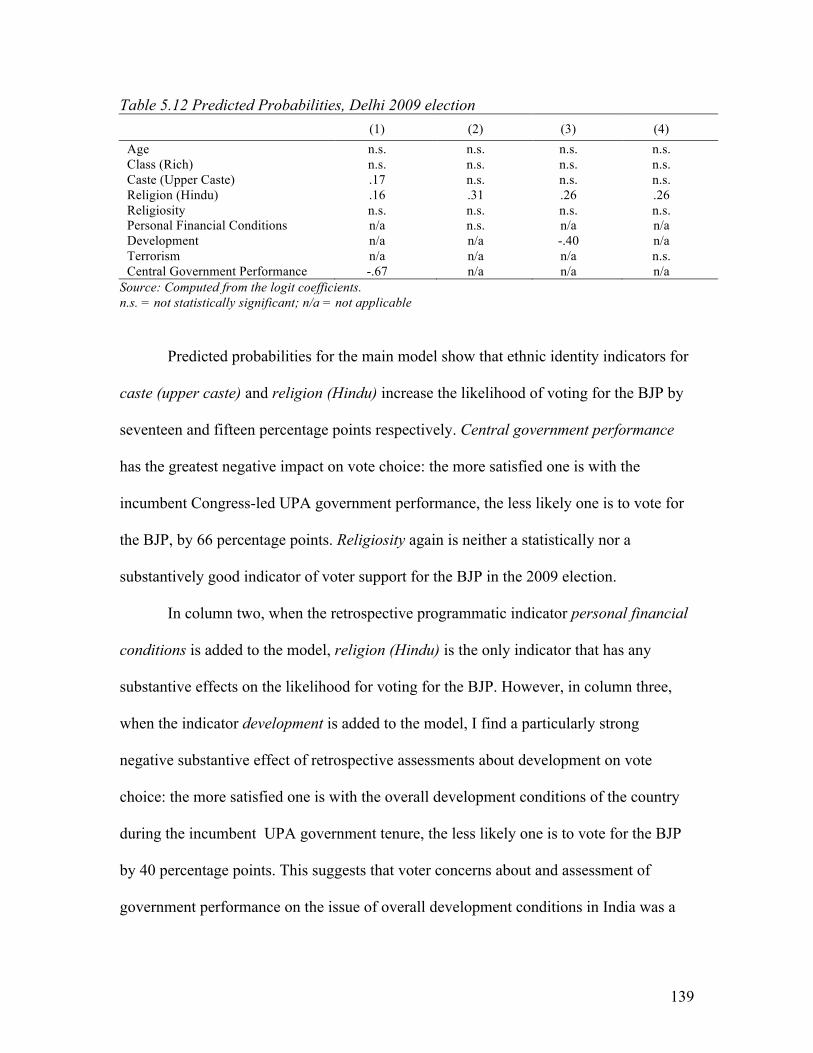
139
Table 5.12 Predicted Probabilities, Delhi 2009 election (1) (2) (3) (4) Age n.s. n.s. n.s. n.s. Class (Rich) n.s. n.s. n.s. n.s. Caste (Upper Caste) .17 n.s. n.s. n.s. Religion (Hindu) .16 .31 .26 .26 Religiosity n.s. n.s. n.s. n.s. Personal Financial Conditions n/a n.s. n/a n/a Development n/a n/a -.40 n/a Terrorism n/a n/a n/a n.s. Central Government Performance -.67 n/a n/a n/a
Source: Computed from the logit coefficients. n.s. = not statistically significant; n/a = not applicable
Predicted probabilities for the main model show that ethnic identity indicators for
caste (upper caste) and religion (Hindu) increase the likelihood of voting for the BJP by
seventeen and fifteen percentage points respectively. Central government performance
has the greatest negative impact on vote choice: the more satisfied one is with the
incumbent Congress-led UPA government performance, the less likely one is to vote for
the BJP, by 66 percentage points. Religiosity again is neither a statistically nor a
substantively good indicator of voter support for the BJP in the 2009 election.
In column two, when the retrospective programmatic indicator personal financial
conditions is added to the model, religion (Hindu) is the only indicator that has any
substantive effects on the likelihood for voting for the BJP. However, in column three,
when the indicator development is added to the model, I find a particularly strong
negative substantive effect of retrospective assessments about development on vote
choice: the more satisfied one is with the overall development conditions of the country
during the incumbent UPA government tenure, the less likely one is to vote for the BJP
by 40 percentage points. This suggests that voter concerns about and assessment of
government performance on the issue of overall development conditions in India was a
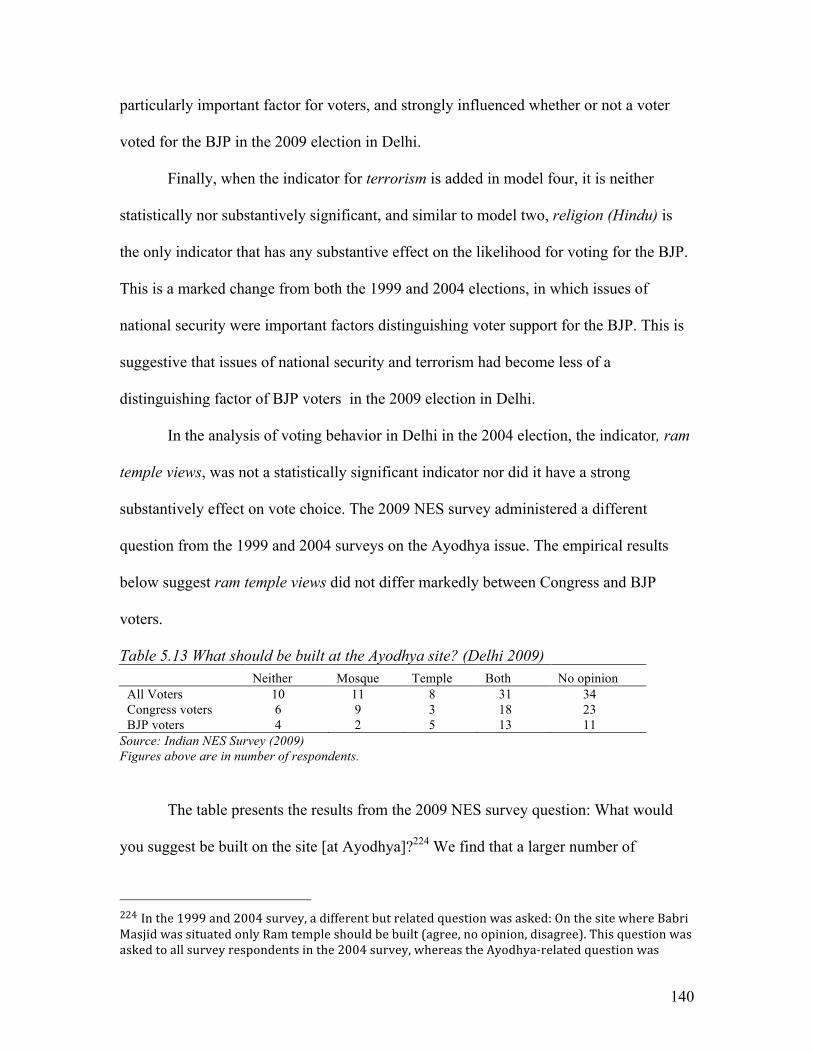
140
particularly important factor for voters, and strongly influenced whether or not a voter
voted for the BJP in the 2009 election in Delhi.
Finally, when the indicator for terrorism is added in model four, it is neither
statistically nor substantively significant, and similar to model two, religion (Hindu) is
the only indicator that has any substantive effect on the likelihood for voting for the BJP.
This is a marked change from both the 1999 and 2004 elections, in which issues of
national security were important factors distinguishing voter support for the BJP. This is
suggestive that issues of national security and terrorism had become less of a
distinguishing factor of BJP voters in the 2009 election in Delhi.
In the analysis of voting behavior in Delhi in the 2004 election, the indicator, ram
temple views, was not a statistically significant indicator nor did it have a strong
substantively effect on vote choice. The 2009 NES survey administered a different
question from the 1999 and 2004 surveys on the Ayodhya issue. The empirical results
below suggest ram temple views did not differ markedly between Congress and BJP
voters.
Table 5.13 What should be built at the Ayodhya site? (Delhi 2009) Neither Mosque Temple Both No opinion All Voters 10 11 8 31 34 Congress voters 6 9 3 18 23 BJP voters 4 2 5 13 11
Source: Indian NES Survey (2009) Figures above are in number of respondents.
The table presents the results from the 2009 NES survey question: What would
you suggest be built on the site [at Ayodhya]?224 We find that a larger number of
224Inthe1999and2004survey,adifferentbutrelatedquestionwasasked:OnthesitewhereBabriMasjidwassituatedonlyRamtempleshouldbebuilt(agree,noopinion,disagree).Thisquestionwasaskedtoallsurveyrespondentsinthe2004survey,whereastheAyodhya‐relatedquestionwas

141
Congress voters favor a Mosque at Ayodhya than BJP voters. However, the majority of
both Congress and BJP voters surveyed indicate that they have no opinion about the
issue, or that they favor both a Hindu temple and a Muslim mosque to be built at the
Ayodhya site. Although this is a very small sample size, it is suggestive that the ethnic
group interest focusing on building the Hindu Ram temple is not a significantly
distinguishing factor between Congress and BJP voters in the 2009 election in Delhi.
The analysis of voting behavior in Delhi in 2009 so far indicates that both ethnic
group identity relating to caste and religion, and retrospective programmatic interests
relating to central government performance and specifically relating to development are
significant factors influencing the likelihood of voting for the BJP. How does the above
data analysis compare to the results for the 1999 and 2004 elections with regard to the
role of ethnic group identity?
Table 5.14 presents the results of the difference in sample proportions for
indicators of caste and religion in the 1999, 2004 and 2009 elections for BJP voters in
Delhi. Column 3 presents the proportion of voters with a particular characteristic (i.e.
being upper caste) who voted for the BJP, while column 4 presents the proportion of
voters who do not have the characteristic (i.e. non upper-caste) and voted for the BJP.
askedtoonlyone‐fifthoftherespondentsinthe2009survey.Thequestionwasaskedto206respondentsinDelhi.Removingresponsesfor“wouldnotsay”or“other”leavesasamplesizeof94.
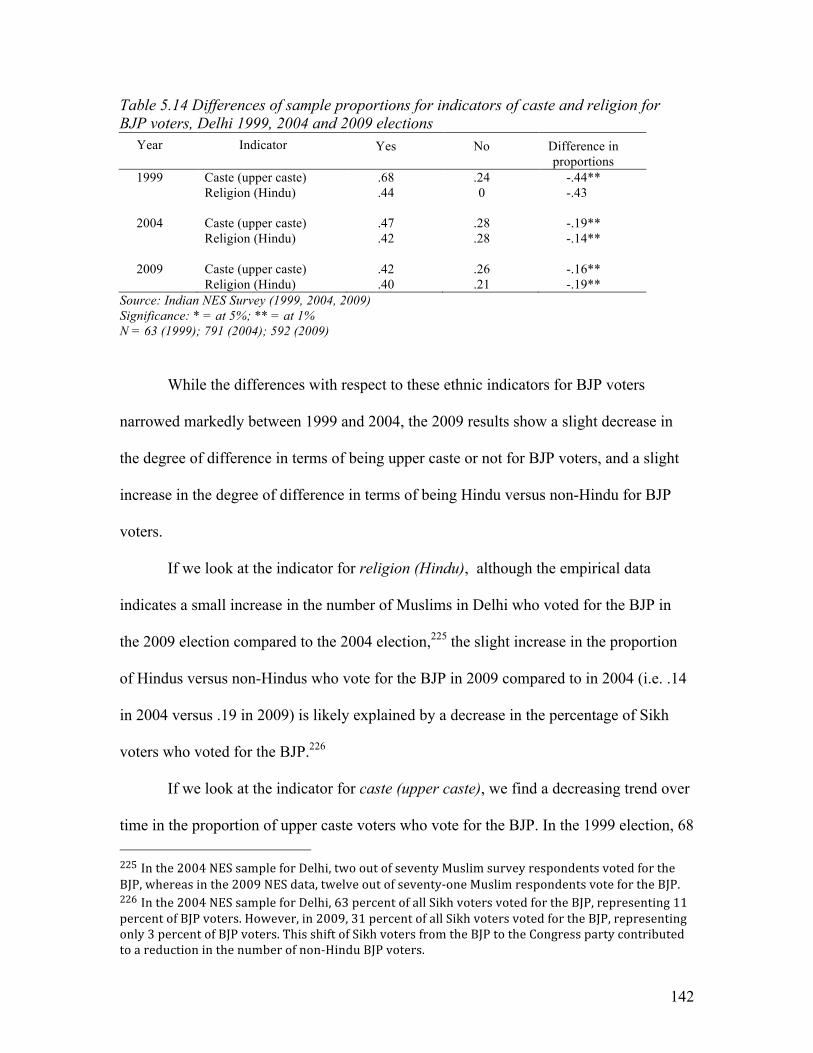
142
Table 5.14 Differences of sample proportions for indicators of caste and religion for BJP voters, Delhi 1999, 2004 and 2009 elections
Year Indicator Yes No Difference in proportions
1999 Caste (upper caste) .68 .24 -.44** Religion (Hindu) .44 0 -.43**
2004 Caste (upper caste) .47 .28 -.19** Religion (Hindu) .42 .28 -.14**
2009 Caste (upper caste) .42 .26 -.16** Religion (Hindu) .40 .21 -.19**
Source: Indian NES Survey (1999, 2004, 2009) Significance: * = at 5%; ** = at 1% N = 63 (1999); 791 (2004); 592 (2009)
While the differences with respect to these ethnic indicators for BJP voters
narrowed markedly between 1999 and 2004, the 2009 results show a slight decrease in
the degree of difference in terms of being upper caste or not for BJP voters, and a slight
increase in the degree of difference in terms of being Hindu versus non-Hindu for BJP
voters.
If we look at the indicator for religion (Hindu), although the empirical data
indicates a small increase in the number of Muslims in Delhi who voted for the BJP in
the 2009 election compared to the 2004 election,225 the slight increase in the proportion
of Hindus versus non-Hindus who vote for the BJP in 2009 compared to in 2004 (i.e. .14
in 2004 versus .19 in 2009) is likely explained by a decrease in the percentage of Sikh
voters who voted for the BJP.226
If we look at the indicator for caste (upper caste), we find a decreasing trend over
time in the proportion of upper caste voters who vote for the BJP. In the 1999 election, 68 225Inthe2004NESsampleforDelhi,twooutofseventyMuslimsurveyrespondentsvotedfortheBJP,whereasinthe2009NESdata,twelveoutofseventy‐oneMuslimrespondentsvotefortheBJP.226Inthe2004NESsampleforDelhi,63percentofallSikhvotersvotedfortheBJP,representing11percentofBJPvoters.However,in2009,31percentofallSikhvotersvotedfortheBJP,representingonly3percentofBJPvoters.ThisshiftofSikhvotersfromtheBJPtotheCongresspartycontributedtoareductioninthenumberofnon‐HinduBJPvoters.

143
percent of upper caste voters voted for the BJP. Ten years later in the 2009 election, only
42 percent of upper caste voters vote for the BJP, thus the majority of BJP support in
Delhi is no longer from upper caste voters. This suggests that being upper caste had
become a less influential characteristic distinguishing BJP voters from Congress voters
in Delhi in the 2009 election, particularly compared to the 1999 national election.
Lastly, an examination of the priority of Delhi voters in terms of the work of the
central government versus the state government reveals a more similar pattern of
priorities between Congress and BJP voters. While in the 2004 election, BJP voters were
significantly more interested in the work at the center than were Congress voters, this
pattern appears to have evened out in the 2009 election.
Table 5.15 Delhi voter priorities in 2009: central versus state level government
Neither State level
Both Central level
Other
All Voters 6.08 21.96 26.18 28.04 1.86 BJP voters 8.88 23.83 23.36 24.77 1.87 Congress voters 4.50 20.90 27.78 29.89 1.85
Source: Indian NES Survey (2009) Figures above are in percentages.
The table shows that Delhi voters from both parties place generally similar weight
on the work of the state level government, while placing slightly greater weight on the
work of the central government. It appears that in 2009, the differences in the priorities
that existed in 2004 with regard to state versus center level government, is no longer a
distinguishing feature between Congress voters and BJP voters.
The analysis of voting behavior in the 2009 election in Delhi shows that while
ethnic identity interests of caste and religion are still politically salient factors, in
particular being upper caste has become a less influential characteristic of voter support

144
for the BJP over time. Additionally, we find that retrospective programmatic concerns,
particularly about development, has a strong effect on the likelihood of voting for the
BJP, suggesting that this issue was a particularly important factor influencing voting
behavior in this election in Delhi.
Under conditions of a very high level of political economy of development and
a low level of ethnic conflict, which characterized the context of the 2009 election in
Delhi, ERV theory predicts relatively less influence in the political salience of ethnic
group identity and a greater influence of retrospective programmatic interests in
explaining voting behavior and overall voter support for an ethnic party. These
empirical results, I argue, support ERV theory as a plausible means of explaining voter
support for the BJP in Delhi in the 2009 election, most closely represented by scenario
3 in table 3.1.

145
NewDelhi:CaseStudiesAnalysis,1999‐2009
The second phase of research presents an analysis of case studies of 35 urban
voters and their vote choices in the 1999, 2004 and 2009 national elections in New Delhi.
As noted in Chapter Four, within the context of a nested research design, case studies
provide a means to both elucidate and corroborate the findings in the large-N analysis,
and in particular to examine and test ERV’s hypothesized mechanisms as a means of
explaining variation in urban voter support for the BJP at the level of the individual voter.
As described in Chapter Four, I use a purposive sampling design for this research
component, in which cases (individual voters) were selected based on a combination of
socio-economic characteristics (i.e., religion, caste, class/income, nature of employment).
Table 5.16 provides a summary list of the socio-economic characteristics included in the
New Delhi cases.227
Table 5.16 Summary of socio-economic characteristics of New Delhi case studies Caste Religion Class Sector Brahmin* 8 Hindu 28 Rich 4 Private 11 Punjabi Khatri* 5 Muslim 6 Upper
Middle 8 Public 12
Hindu middle castes**
6 Christian 1 Middle 8 Unorganized 12
Scheduled castes*** 9 Working 9 Other 7 Poor 6 Total 35 35 35 35
*Upper castes include Brahmins and Punjabi Khatris **Hindu middle castes include: 3 Rajputs, 1 Kayastha, 1 Jatt/Gurgar, 1 OBC **Scheduled castes are lower caste Hindus
The data used for the case studies analysis was collected using structured
interviews of voters in New Delhi using a survey questionnaire format. In choosing these
individual cases, it was not known in advance how a particular voter voted, or the reasons
227Ageandgenderwerenotpurposivelysampled.

146
why a voter voted for a particular party. These interviews were conducted in various
locations throughout the city. Table 5.17 presents the details of each case study and their
corresponding vote choices in the 1999, 2004 and 2009 national elections.
Table 5.17 New Delhi Cases
The change in BJP vote share in the New Delhi cases shows a pattern of decreasing
support from 1999 to 2009. In the 1999 national election, 19 out of 35 New Delhi cases
voted for the BJP. In the 2004 election, ten New Delhi cases voted for the BJP, whereas
in the 2009 election, the number of voters for the BJP decreased to six. Table 5.18
presents a summary of the vote choices of the New Delhi cases in each national election.
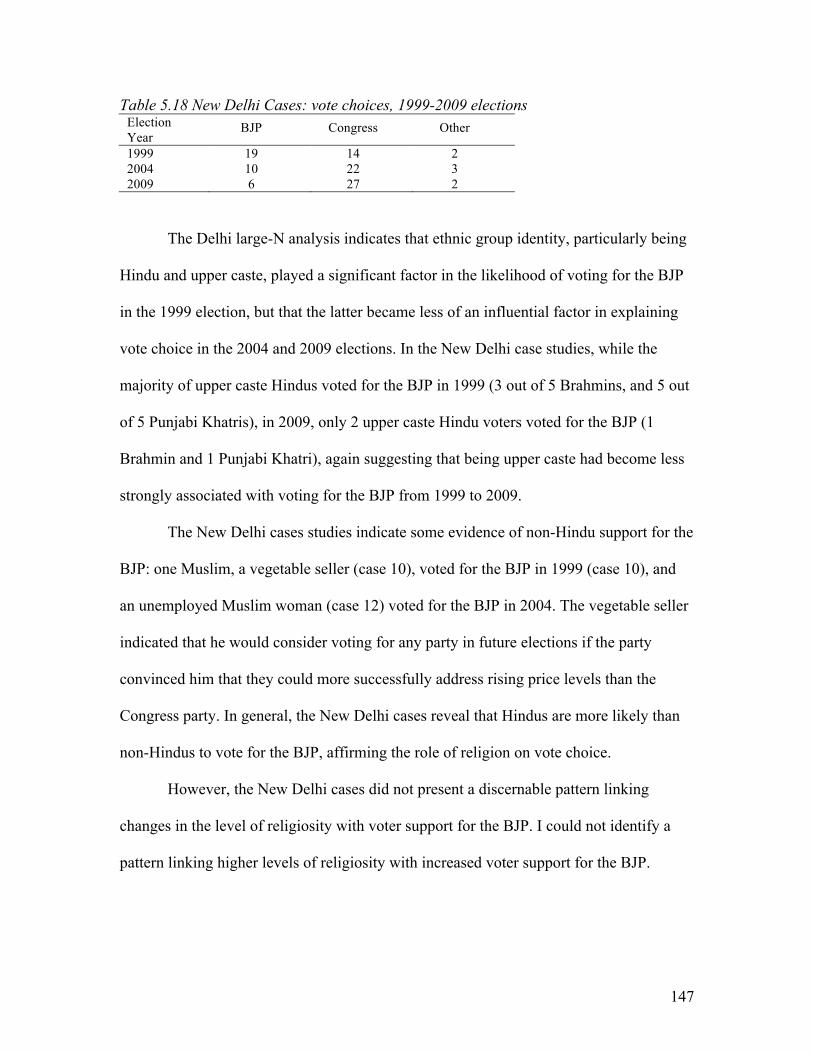
147
Table 5.18 New Delhi Cases: vote choices, 1999-2009 elections Election Year
BJP Congress Other
1999 19 14 2 2004 10 22 3 2009 6 27 2
The Delhi large-N analysis indicates that ethnic group identity, particularly being
Hindu and upper caste, played a significant factor in the likelihood of voting for the BJP
in the 1999 election, but that the latter became less of an influential factor in explaining
vote choice in the 2004 and 2009 elections. In the New Delhi case studies, while the
majority of upper caste Hindus voted for the BJP in 1999 (3 out of 5 Brahmins, and 5 out
of 5 Punjabi Khatris), in 2009, only 2 upper caste Hindu voters voted for the BJP (1
Brahmin and 1 Punjabi Khatri), again suggesting that being upper caste had become less
strongly associated with voting for the BJP from 1999 to 2009.
The New Delhi cases studies indicate some evidence of non-Hindu support for the
BJP: one Muslim, a vegetable seller (case 10), voted for the BJP in 1999 (case 10), and
an unemployed Muslim woman (case 12) voted for the BJP in 2004. The vegetable seller
indicated that he would consider voting for any party in future elections if the party
convinced him that they could more successfully address rising price levels than the
Congress party. In general, the New Delhi cases reveal that Hindus are more likely than
non-Hindus to vote for the BJP, affirming the role of religion on vote choice.
However, the New Delhi cases did not present a discernable pattern linking
changes in the level of religiosity with voter support for the BJP. I could not identify a
pattern linking higher levels of religiosity with increased voter support for the BJP.
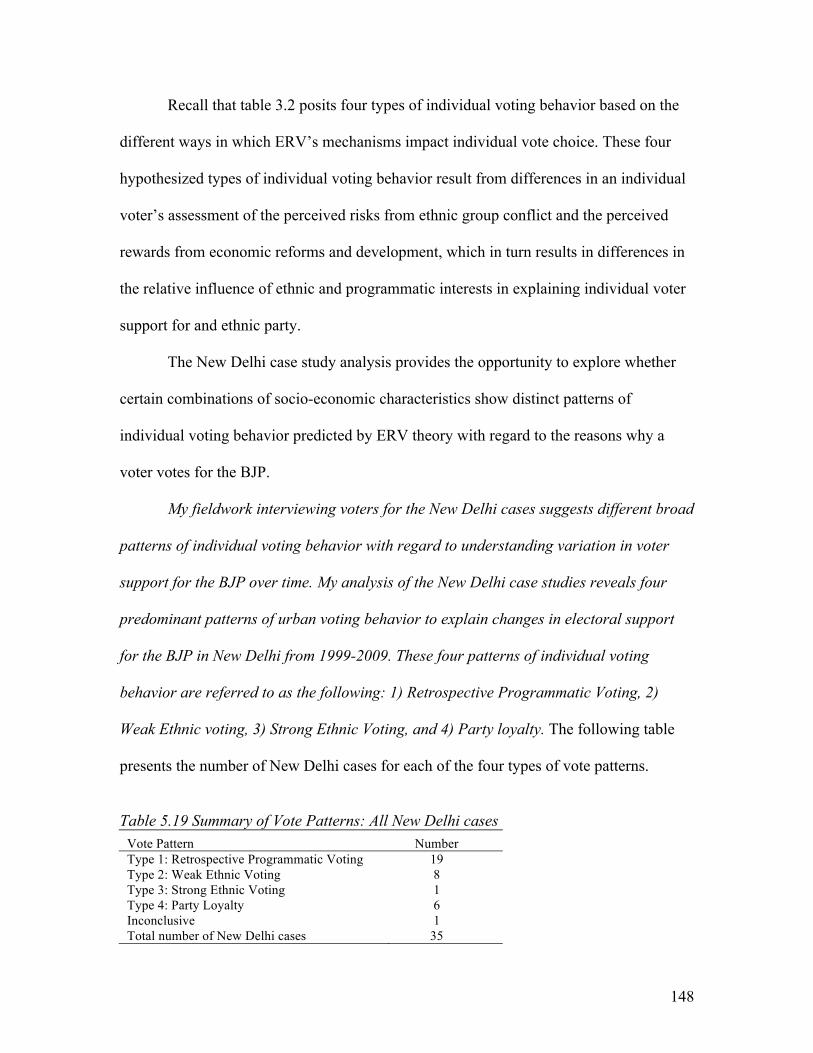
148
Recall that table 3.2 posits four types of individual voting behavior based on the
different ways in which ERV’s mechanisms impact individual vote choice. These four
hypothesized types of individual voting behavior result from differences in an individual
voter’s assessment of the perceived risks from ethnic group conflict and the perceived
rewards from economic reforms and development, which in turn results in differences in
the relative influence of ethnic and programmatic interests in explaining individual voter
support for and ethnic party.
The New Delhi case study analysis provides the opportunity to explore whether
certain combinations of socio-economic characteristics show distinct patterns of
individual voting behavior predicted by ERV theory with regard to the reasons why a
voter votes for the BJP.
My fieldwork interviewing voters for the New Delhi cases suggests different broad
patterns of individual voting behavior with regard to understanding variation in voter
support for the BJP over time. My analysis of the New Delhi case studies reveals four
predominant patterns of urban voting behavior to explain changes in electoral support
for the BJP in New Delhi from 1999-2009. These four patterns of individual voting
behavior are referred to as the following: 1) Retrospective Programmatic Voting, 2)
Weak Ethnic voting, 3) Strong Ethnic Voting, and 4) Party loyalty. The following table
presents the number of New Delhi cases for each of the four types of vote patterns.
Table 5.19 Summary of Vote Patterns: All New Delhi cases
Vote Pattern Number Type 1: Retrospective Programmatic Voting 19 Type 2: Weak Ethnic Voting 8 Type 3: Strong Ethnic Voting 1 Type 4: Party Loyalty 6 Inconclusive 1 Total number of New Delhi cases 35
149
The following presents a discussion the nature of these four patterns of voting
behavior and provides examples of individual New Delhi case studies that exemplify
each pattern.229
1. Retrospective Programmatic Voting: The first pattern of voting behavior in the
New Delhi cases, Retrospective Programmatic Voting, is characterized by voters who
indicate that their assessment of party performance on specific programmatic issues (i.e.
such as development, household financial conditions, or national security) is the main
driver underlying their vote choices in the three national elections. Retrospective
programmatic voting behavior best explains the vote choices of 19 New Delhi voters
interviewed in this study.
While New Delhi cases from various ethnic (i.e., caste and religion) and income
groups are represented in this category, a particularly strong finding is that nearly all
(10/11) of the voters interviewed who work in the private sector fall into this pattern of
Retrospective Programmatic voting behavior. I believe this is a significant finding: in a
country associated with a history of political clientelism, the ability to work in the private
sector means that a person’s economic livelihood is not primarily based on access to state
229IusedthefollowingprocedureforcodingeachNewDelhicaseusingthedatacollectedfromthesurveyquestionnaire.Basedonthestructureofthesurvey,thevotersinterviewedwereabletoindicatethemainfactorsaffectingtheirvotechoiceforeachelection.IrecordedtheresponsesofeachNewDelhicaseforeachofthethreeelections.Inextlabeledeachofthevoter’sresponsesaseitherprimarilyinfluencedbyethnicfactors,programmaticfactors,orbasedonsomeotherfactor.Onceeachofthevoter’sresponseswaslabeled,IidentifiedfourdifferentpatternsofvotingbehaviortoexplainvariationinvotersupportfortheBJP.Forexample,itbecameclearthatsomevotersvotedfortheBJPbasedpredominantlyonretrospectiveprogrammaticconcerns,whileothervotersvotedfortheBJPbasedonpredominantlyethnicinterests.AthirdgroupofvoterswasdistinctiveinthattheystronglyemphasizedethnicinterestsinexplainingvotersupportfortheBJPinoneelection,butjustasadamantlyemphasizedthattheseconcernshadtakenabackseattoprogrammaticconcernsinlaterelections.Finally,afourthgroupofvotersdidnotemphasizeeitherethnicinterestsorprogrammaticinterestswhenexplainingtheirpoliticschoices,andinsteadtalkedabouttheirloyaltyandtheirpersonalorfamilyrelationshiptotheparty.

150
employment. In addition, most private sector employment generally provides higher
incomes than in the government or unorganized sectors.
Recall that ERV’s second mechanism is based on Kitschelt’s idea that structural
changes associated with a strong political economy of development support
programmatic voter-party linkage formation and retrospective programmatic demands,
and posits that economic development and economic reforms create the conditions for
new opportunities and expectations by voters, which in turn creates the possibility for an
increasing number of voters to make retrospective programmatic demands on government
and political leaders.
The finding that nearly all the New Delhi respondents from the private sector fall
into this pattern of Retrospective Programmatic Voting suggests that, unlike poor citizens
who often must discount future rewards and instead rely on direct patronage-based
exchanges in turn for votes, these voters may be on a more firm footing to be able to
demand future indirect collective goods and in turn to be more focused on retrospective
programmatic interests in their vote choices.
Case 35 is a an upper caste Hindu woman who works as a Director of Human
Resources at a large private multinational company and who falls into this category of
voting behavior. This voter supported the BJP in the 1999 election, based on her
assessment that the party could do better on issues relating to economic development, her
concerns about corruption and the Congress party, and her favorable opinion of BJP party
leadership under Atal Bihari Vajpayee. She did not vote in the 2004 election.
However, by 2009, this voter felt that the Congress party had been doing well at
the national level since 2004, and also indicated that she viewed the BJP’s politics as

151
unnecessarily stoking Hindu-Muslim tensions. With regard to the BJP, she says, “With
the BJP, it is possible that [Narendra] Modi comes to power…[I am] not ok with voting
for Modi. The reason we are the second largest fastest growing economy is because all
kinds of people [are] working to get it there. There is economic value to all people
working together to move the country forward.”230 Thus, she switched her vote to the
Congress in the 2009 election, in hopes that the party would continue to deliver high
levels of economic growth, but also because she associated the BJP with the potential for
stirring up ethnic conflict, which she felt could have a negative impact on economic
development.
Case 24 is an upper caste Hindu man who is a Partner at a private sector
consulting firm. Similar to case 35, this voter voted for the BJP in the 1999 election
because he believed that the Congress had become inadequate at governing and was
functioning less like a party and more like a “family corporate fiefdom.” At the time, he
believed that the BJP under the leadership of Atal Bihari Vajpayee would be in an overall
better position to govern.231 Although this voter indicated that he did not care for the
BJP’s politics of Hindutva, he continued to vote for the BJP in the subsequent 2004 and
2009 elections, based on his view that the Congress party does not function well, and on
his assessment that the BJP would be better at governing and better able to deliver on
high levels of economic growth and development.
I found this pattern of Retrospective Programmatic Voting from New Delhi cases
who were not employed in the private sector. For example, case 16 is a Department Chair
at a public university in New Delhi. He is a Hindu from a scheduled caste. This voter 230NewDelhicasestudy35.ThevoterismakingreferencetoGujarat’sChiefMinisterNarendraModi.231NewDelhicasestudy24.

152
voted for the BJP in the 1999 and 2004 elections based largely on his concerns about
employment, and his overall positive assessment of his local member of parliament (MP),
a member of the BJP, who he believed was doing a good job promoting local economic
development. In addition, he felt that Atal Bihari Vajpayee, as the leader of the BJP, was
the right person to be Prime Minister and the most capable to lead the country.
This voter also expressed a strong dislike for the BJP’s ideology of Hindutva, and
indicated that he had become increasingly concerned about the BJP under the leadership
of L.K. Advani in the run-up to the 2009 election saying, “Advani was responsible for the
Rath Yatra…[the] demolition of the Babri Masjid…This was a dangerous move, just for
the sake of politics.”232 In the 2009 election, he switched his vote to the Congress party
based on his initial assessment of the performance of his new Congress MP, but similar to
the Director of Human Resources, also because he associated some BJP leaders with the
potential to provoke unwanted ethnic conflict.
My findings suggest that voters in this category place a high value not only on the
role of economic growth and development but also on the importance of good
governance. For some voters in this category, such as the Partner in the consulting firm,
the role of ethnic conflict is not highlighted as a significant factor on vote choice. For
other voters in this category, such as the Director of Human Resources or the Department
Chair, ethnic conflict, rather than representing a group threat leading to a sense of
heightened in-group identification, instead represents a potential negative influence on
economic growth and development and to social stability in general. This pattern of
Retrospective Programmatic Voting most closely resembles type 1 voting behavior in
232NewDelhicasestudy16.

153
table 3.2, in which a voter is generally more influenced by the opportunities posed by
economic reforms and development than in-group threat posed by ethnic conflict, and
thus vote choice and the evaluation of an ethnic party is predominantly influenced by
retrospective programmatic interests.
While nearly all the New Delhi cases interviewed from the private sector fall into
this category of Retrospective Programmatic Voting, voters from the public and
unorganized sectors, as well as from different income levels and castes groups, also
indicated that a retrospective assessment of government performance, on issues ranging
from national and local development conditions, employment, price inflation and
corruption, were key factors determining their vote choice and whether or not to vote to
for the BJP. This suggests that the opportunities resulting from both a growing private
sector as well as other changes taking place in New Delhi’s very high political economy
of development is supporting the conditions for voters to make retrospective
programmatic demands on government and political leaders.
2. Weak Ethnic Voting: The second pattern of voting behavior, Weak Ethnic
Voting, is quite different from the pattern described above. This pattern of voting
behavior is characterized by New Delhi cases whose political choices are strongly
influenced by ethnic identity and interests at one point of time, but whose political
preferences distinctly change, such that they are more influenced by retrospective
programmatic interests at a later point in time.233 Weak Ethnic Voting best explains the
voting behavior of eight New Delhi voters interviewed in this study.234
233VotersinthissecondcategorywereveryopenaboutdiscussingtheirethnicinterestsandthewayinwhichtheseethnicinterestsaffectedtheirdecisiontovotefortheBJP.234TheeightNewDelhicasesthatfallintothiscategoryofweakethnicvotingbehaviorarecases1,3,5,8,12,15,19and23.

154
While nearly all the voters working in the private sector fall into the category of
Retrospective Programmatic Voting, the majority of voters in this pattern of voting
behavior are either from the lower-middle class, are working class or poor, and half of the
respondents work in the unorganized sector. Additionally, most of voters in this category
are either from a middle or lower caste, or are a minority. Thus, this category of voters
has a markedly different socio-economic profile from the cases in the first category.
A key characteristic of this group is that ethnic identity and interests are a
distinguishing, if not the defining factor, driving their political choices at a particular
point of time, (i.e., the 1999 election). Most notably, all of the New Delhi voters
interviewed who are in this category and voted for the BJP in the 1999 election indicated
that that their views and concerns about building the Hindu Ram temple were either an
important factor or the driving factor in their vote choice.235 However, in later elections,
these voters indicated that their desire for the Ram temple to be built was no longer a
factor in their vote choice. In the 2009 election, all voters in this category indicated that
retrospective programmatic interests had become the primary factors influencing their
vote choice.
Case 1 owns a small but thriving magazine stand in an outdoor market whose
business has put him in Delhi’s fast growing working class. He comes from a Punjabi
Khatri family. In explaining his vote for the BJP in the 1999 election he noted that, “he is
235Thisfindingisincontrasttotheresultsofthelarge‐Nanalysisfor1999,inwhichanindicatorrepresentingvoter’spreferencesaboutwhetherornottheHinduRamtempleshouldbebuiltwasnotastatisticallysignificantfactoruponvotechoice.Asnotedearlier,oneexplanationcouldbethatthequestionabouttheRamtempleintheIndianNESsurveyisdifferentfromthesurveyquestionaskedaboutthetempleintheNewDelhicasestudies.TheformerNESsurveyquestionaskstherespondentifshebelievesthatthetempleshouldbebuilt,whereasthewordingofthequestionforthecasestudiesismoredirectinaskingifthetemplewasafactorinvotechoice.

155
deeply devoted to Ram,” and that this was the main issue for him and him family in their
vote choice.
However, in 2004 after five years of the BJP-led government in power, this small
business owner noted his dissatisfaction in that, not only did the BJP not take action
about the Ram temple, but he was also motivated by Congress-leader Dr. Manmohan
Singh’s potential leadership. In the 2004 election, he switched his vote to Congress. Five
years later, in the 2009 election, he notes that while the Ram temple is still important to
him personally, it is no longer important to his political choice. Rather he says, “What is
important is if parties can deliver on specific issues well. Development and growth are
more important than religious issues.”236
In addition, by the 2009 election, this voter’s perception of ethnic conflict appears
to have changed. He notes, “If people start fighting over religious issues, this can turn
into conflict, and this can hinder progress.” At this time, ethnic conflict is viewed less as
a source of heightening in-group identification, and instead is viewed as having the
potential to negatively impact economic growth and development, echoing similar
concerns made by the Director of Human Resources.
Like the owner of the magazine stand, case 3 also works in the unorganized sector
and operates a small but busy outdoor stand where he sells and fixes backpacks near a
university. He is a middle caste Hindu whose small business also places him in Delhi’s
working class.
This small business owner voted for the BJP in the 1999 election, in part because
he hoped that the party would take action and build the Ram temple, and also because he
236NewDelhicasestudy1.

156
felt that Atal Bihari Vajpayee would be a good leader. However, after five years of BJP
rule, he was disappointed with the BJP’s performance and was concerned about the role
of BJP leader, L.K. Advani. He switched his vote to Congress in the 2004 election.
In the 2009 election, this voter emphasized his focus on party leadership in terms
of being able to generate employment, and threw his political support behind the
Congress party under the helm of Sonia Gandhi. In contrast to his views of the BJP in
1999, this voter now viewed the BJP under the leadership of L.K. Advani as “doomed,”
because “Advani would focus on making religious conflict.”237
My findings suggest that voters in this category are influenced by both ethnic
concerns, such as the Ram temple, and retrospective programmatic concerns, such as
economic growth and employment. This pattern of Weak Ethnic Voting most closely
resembles type 3 voting behavior in table 3.2, in which a voter is influenced by both the
perceived risk of group threat from ethnic conflict and the opportunities posed by
economic reforms and development, and as a result, changes in socio-economic
conditions in turn change the relative importance of ethnic group identity and interests
and retrospective programmatic interests on vote choice.
In conditions of moderate ethnic conflict in the 1999 election in Delhi, the
political salience of ethnic group identity and interests for this type of voter appears to
swamp out retrospective programmatic interests in explaining voter support for the BJP.
However, in conditions of a very high political economy of development and a low level
of ethnic conflict in the 2009 election in Delhi, retrospective programmatic interests
supersede ethnic interests in these voters’ political choices. Under the latter conditions,
237NewDelhicasestudy3.
157
these voters’ perception of and relationship to ethnic conflict begins to resemble the
views of some voters in the first category of retrospective programmatic voting.
3. Strong Ethnic Voting: The third pattern of voting behavior found in the New
Delhi cases, Strong Ethnic Voting, is characterized by voters who indicate that ethnic
group identity and interests are the predominant factor influencing their vote choice. For
this type of voting behavior, the political salience of ethnic identity and interests persists
in importance over time with regard to influencing political choices. Strong Ethnic
Voting best explains the voting behavior of one New Delhi voter in this study.
Case 20 is an upper middle class, middle caste Hindu woman voter working in a
highly skilled position in the public sector, who voted for the BJP in the 1999, 2004 and
2009 national elections. This voter indicates that while she is concerned about issues like
corruption, development and national security, she emphasizes that she “connects” with
the BJP’s vision of Hindutva, which she associates with advocating for Hindus. The voter
indicates that her continued support for the BJP over the three elections had less to do
with the party’s stated support for building Ram temple, and more broadly to do with her
belief in the BJP’s underlying support for Hindus and its vision of Hindutva. Of
Hindutva, she says, “I connect to it. Other parties support other religions. [The] BJP is
trying to protect Hindus.238 For this voter, the notion that the BJP “protects” Hindus is a
powerful influence in her support for the party over three national elections.
Although I interviewed only one New Delhi voter who fit into this third category
of voting behavior, in interviews with other New Delhi case study respondents, two
voters said that they knew of members of their own family, who were often older, and
238NewDelhicasestudy20.
158
who privately indicated that the BJP’s explicit support for Hindus through advocating
Hindutva, coupled with their belief that Congress focuses too much on Muslims, strongly
influences their decision to vote for the BJP.239
In this pattern of Strong Ethnic Voting, the political salience of ethnic group
identity and interests persists as a predominant factor guiding a voter’s political choices.
For this pattern of voting behavior, it appears that a voter’s perception of group threat
from ethnic conflict does not ebb and flow, as it does for weak ethnic voters, but rather it
remains a strong ongoing concern influencing her vote choice. At the same time, this type
of voter appears less focused on or influenced by the opportunities arising from changing
conditions in the political economy of development.
This pattern of Strong Ethnic Voting most closely resembles type 2 voting
behavior in table 3.2, in which the perceived threat from ethnic group conflict remains
high, increasing an individual’s sense of in-group identification, and thus vote choice and
the evaluation of an ethnic party is predominantly influenced by ethnic group identity and
interests.
4. Party Loyalty: The fourth pattern of voting behavior identified in the New
Delhi cases, Party Loyalty, is characterized by voters who indicate a predominant focus
on party loyalty, either stemming from the individual voter or the voter’s family.240 Six
voters from the New Delhi cases fall into this category of party loyalty.
239NewDelhicases35and24,whoarebothintheir30sandworkingintheprivatesector,indicatedthattheyknewoffamilymemberswhowerefroman“oldergeneration,”andwhosupportedtheBJPforthesereasons.240ThesurveyquestionnaireusedforthecasestudyanalysiswasnotdesignedtoidentifyormeasurethestrengthofpartyidentificationinthewaythistermisusedintheAmericanpoliticsliterature.Rather,Iamusingtheterm,partyloyalty,moresimplytorefertorespondentswhoindicatethatpartyloyalty,ratherthanaparticularethnicorprogrammaticinterestperse,isthedrivingfactorintheirsupportforaparticularpoliticalparty.

159
What is different about this category of voting behavior compared to the other
three categories described above is that these voters generally do not emphasize either
ethnic group identity and interests, or retrospective programmatic interests, as the key
factors in their vote choice. Rather, their focus is almost entirely on voting for a particular
party.
Cases 22 and 28 are BJP voters who fall into this category of party loyalty. Case
22 is a middle caste Hindu who works as a lab technician in a public institution of higher
education. Case 28 is a scheduled caste Hindu who works as part of the cleaning staff at
the same institution. Case 22 indicates that, while programmatic issues such as
development, corruption, employment and prices are issues of concern, the most
important factor in his vote choice is that his family always votes for the BJP. In addition,
this voter indicated that the BJP’s support for building the Ram temple was not a factor in
his vote choice. Interestingly, he did not think that the BJP leader, L.K Advani would be
a particularly good leader for India, because he associated him with the Rath Yatra to
mobilize support for constructing the Ram temple in 1990 and the ensuing ethnic
violence that followed. Yet, despite his concerns, this voter voted for the BJP in all three
elections.241
Similarly, case 28 also indicates that he votes for the BJP because his family votes
for the party. Unlike the previous voter, this voter was not able or willing to identify any
particular political interests or concerns. Rather, he said that he is influenced by his uncle,
who has a connection with the BJP and tells his family that they should vote for the party.
241NewDelhicasestudy22.

160
While neither of these voters indicated that patronage played a role in their vote
choice, another New Delhi voter, case 27, noted during her interview that the BJP had
distributed blankets to her neighborhood in the run-up to the 1999 election.242 The New
Delhi case studies do not provide clear evidence about the role and degree of patronage
for these voters. For this category of voting behavior, it appears that neither mechanism
posited in ERV theory adequately explains voting behavior, as neither ethnic group
identity and interests nor retrospective programmatic interests play an important role in
explaining voter support for an ethnic party. Rather, family or individual party loyalty
appears to be the primary influence guiding voters’ political choices. This pattern of Party
Loyalty voting most closely resembles type 4 voting behavior in table 3.2, though it is
important to note that it is unclear the degree to which party patronage plays a factor in
these voters’ political choices.
In summary, the above analysis of New Delhi case studies reveals four patterns of
individual voting behavior to explain variation in voter support for the BJP: 1)
Retrospective Programmatic Voting, 2) Weak Ethnic Voting, 3) Strong Ethnic Voting,
and 4) Party Loyalty. I posit that ERV can explain the first three of these patterns of
urban voting behavior in New Delhi, representing the different ways in which ERV’s
mechanisms impact individual voting behavior, through differences in an individual
voter’s assessment of and relationship to ethnic group conflict and economic reforms and
development, which result in differences in the relative influence of ethnic group identity
and interests and retrospective programmatic interests on vote choice and explaining
individual voter support for an ethnic party. 242NewDelhicasestudy27isaswingvoterwhofitsthefirstpatternofvotingbehavior.ShevotedfortheBJPin1999becauseshethoughtitcouldaddressrisingprices,crime,andherconcernsaboutemploymentforheradultchildren.SheswitchedhervotetotheCongresspartyin2004and2009.

161
Chapter6:EthnicPoliticsandVotingBehaviorinGujaratandAhmedabad
Located in western India, the state of Gujarat is a place of contrasts. Often
considered the premier business state in India, the highly industrialized state is known for
its long history of trade and corresponding mercantile culture of non-violent conflict
resolution.243 The state is the third most urbanized state in the country with over forty
percent of Gujaratis living in urban areas.244 Gujarat is also famous as the birthplace of
Mahatma Gandhi245 where, upon returning to India from South Africa, Gandhi chose the
city of Ahmedabad to live and mobilize his vision of a non-violent independence
movement against the British Raj.
Yet, in recent years, Gujarat, and in particular Ahmedabad, Gujarat’s largest city,
and India’s fifth largest city, has become known for episodes of some of the most deadly
Hindu-Muslim violence in India. This research project does not seek to answer the
question of why Gujarat in particular has had such a stormy history of Hindu and Muslim
243Yagnik,AchyutandSuchitraSheth,TheShapingofModernGujarat:Plurality,HindutvaandBeyond.NewDelhi:PenguinBooks,2005.LocatedonthecoastoftheIndianoceanwithmultipleharborsandports,thepresentareaofGujaratisbelievedtohaveahistoryofactivemaritimetradeacrossAsiagoingbackoverathousandyears,(pgs.18‐38).244Gujarathastwentycitieswithapopulationofover100,000andfourcities,Ahmedabad,Surat,VadodaraandRajkot,withapopulationoveronemillion.The2011CensusofIndiaestimatesGujarat’slevelofurbanizationat44percent.SeeCensusofIndiawebsite,http://censusindia.gov.in/2011census/censusinfodashboard/stock/profiles/en/IND024_Gujarat.pdfGujarat’surbanpopulationisprojectedtoincreasetotwo‐thirdsofthetotalpopulationby2030.AfterDelhi,thestateofTamilNaduhasthehighesturbanpopulationwith53percent.See,India’sUrbanAwakening:BuildingInclusiveCities,SustainingEconomicGrowth,McKinseyGlobalInstitute:April2010,p.15.245GandhiwasborninthetownofPortbandarin1869,whichatthetimewaslocatedintheBritishprovinceofBombayPresidency,butisnowlocatedinthestateofGujarat.
162
relations.246 Rather, in this chapter I seek to examine voting behavior in Gujarat and
Ahmedabad, in order to examine the factors affecting voter support for the BJP over time
in an urbanized state with a historical context of violent ethnic conflict.
As a highly industrialized state with one of the country’s fastest urbanization
rates, and a political system dominated by the Congress and BJP parties, Gujarat shares
some characteristics in common with Delhi that make it a good place for comparing
urban voting behavior. Unlike in Delhi, where the BJP’s fortunes went from capturing all
the Lok Sabha parliamentary seats in 1999 to losing all the seats in 2009, the BJP in
Gujarat has remained the dominant party in power for nearly two decades.
This chapter presents an empirical analysis of voting behavior in Gujarat and an
in-depth analysis of voting behavior in Ahmedabad, and tests Ethnically Mediated
Retrospective Voting (ERV) theory as a plausible means of explaining variation in urban
electoral support for the BJP over the 1999, 2004 and 2009 national elections. The
chapter is comprised of three main sections: 1) an overview of the history and political
context of Gujarat relevant for this study, 2) an analysis of Indian National Election
Study (NES) survey data of Gujarat voters for the 1999, 2004 and 2009 elections, and 3)
an examination of case studies of individual voters and voting behavior in the city of
Ahmedabad.
246Severalauthorshaveaddressedthisimportanttopic.See,Varshney,Ashutosh,EthnicConflictandCivicLife:HindusandMuslimsinIndia.NewHaven:YaleUniversityPress,2005.Wilkinson,Steven,VotesandViolence:ElectoralCompetitionandEthnicRiotsinIndia.Cambridge:CambridgeUniversityPress,2004.Shani,Ornit,Communalism,CasteandHinduNationalism:TheViolenceinGujarat.Cambridge:CambridgeUniversityPress,2007.

163
Gujarat
Gujarat’s early industrialization and urbanization is strongly tied to its history
as a center of cotton production and processing in the 1800s, followed by the rise of its
textile industry in the mid-19th and early 20th century.247 Two important factors in the
development of Gujarat’s textile industry are the American Civil War, in which
demand for Western Indian cotton exploded, and the rise of textile mills, particularly
in Ahmedabad, creating the capacity for cotton to be not only produced but also to be
processed and manufactured locally.248 From 1861 to 1946, the number of textile mills
in Ahmedabad increased from one to seventy-four, resulting in large-scale urban
migration for millwork, and the emergence of a large urban working class and a
burgeoning smaller middle class.
From a political perspective, Gandhi’s leadership and mobilization to achieve
political independence and social reforms from his home base in the city of
Ahmedabad resulted in the development of a strong state-level grass roots Congress
party organization. The Indian National Congress Party under Gandhi’s leadership
working with Gujarat lawyer and Congress leader, Vallabhbhai Patel,249 were integral
pillars of Hindu-Muslim harmony in Gujarat in the first half of the 20th century.250 By
247YagnikandSheth,p.101.Foragoodintroductiontotheriseofthetextileindustry,seechapter5,IndustrializationandSwadeshi,pgs.98‐131.248Ibid,p.106.DuringtheAmericanCivilWar,theSouthimposeditsowncottonembargodisruptingcottonsuppliestoEngland.Asaresult,demandforcottonfromGujaratgreatlyintensified.249Vallabhbhai(Sardar)PatelwasaleaderoftheIndianNationalCongressknownforhisleadershipintheIndianindependencemovementandtheintegrationofpost‐independenceIndia.250Varshney,Ashutosh,EthnicConflictandCivicLife:HindusandMuslimsinIndia,chapter9.VarshneyidentifiestheroleofGandhi’spoliticalleadership,theCongressparty,businessguilds(mahajans)andlaborunionsaskeyfactorsinpromotingintercommunalcivicactivityandinturnHindu‐MuslimpeaceinAhmedabadinthefirsthalfofthe20thcentury.
164
the middle part of the 20th century, Gujarat had become an industrialized, urbanizing
state with a strong Gandhian influence promoting Hindu-Muslim harmony.
However, over the past forty years, four primary countervailing forces have
deeply affected the social fabric and political trajectory of Gujarat, and Ahmedabad in
particular. These forces can be described as 1) the decline of the Congress party at the
state level, 2) major episodes of Hindu-Muslim violent conflict, 3) the decline of the
textile industry in the 1980s, and 4) the rise of the BJP in the 1990s to become the
political dominant player in the state.
In 1969, Congress party infighting lead to a split of the party between Prime
Minister Indira Gandhi and regional party leadership, marking a period of decline and
weakening party organization in Gujarat.251 The year, 1969, also witnessed the first of
several of episodes of severe large-scale Hindu-Muslim violent conflict in Gujarat.252
The 1969 riots in Ahmedabad are considered one of the worst cases of Hindu-Muslim
violence in post-Independence India.253
The 1970s saw continuing cracks in the role and influence of the Congress
Party in Gujarat. In 1974, the Nav Nirman riots across the state exposed deep
frustration with Congress political leadership about rising prices of essential
commodities and the widespread belief that the problem was the result of collusion
251Ibid,pgs.241‐242.252Foradetaileddescriptionofthe1969riotsinAhmedabad,seeShah,Ghanshyam,“CommunalRiotsinGujarat:ReportofaPreliminaryInvestigation,”EconomicandPoliticalWeekly,January1970,pgs.187‐200.Thenumberofpeoplekilledrangesfrom1000(Shah)to600(Varshney).253YagnikandSheth,p.230.Itisimportanttonotethatthe1969riotswerenotthefirstinstanceofviolenceinAhmedabad.See,Spodek,Howard,“FromGandhitoViolence:Ahmedabad’s1985RiotsinHistoricalPerspective,”ModernAsianStudies,23(4),1989.SpodekcitessmalleroutbreaksofviolenceinAhmedabadin1941,1942,1946,1956,1958and1964.

165
and price rigging by Congress politicians and traders.254 What began as initial student
protests in Ahmedabad turned into broad based protests and rioting across urban
Gujarat, killing 100 people. The Nav Nirman riots deteriorated into a major political
crisis, leading to the resignation of the Congress Chief Minister Chimanbhai Patel, and
the imposition of presidential rule on Gujarat from the central government.255
The following year, in June 1975, Prime Minister Indira Gandhi declared an
internal emergency lasting eighteen months and jailed her political opponents,
including leaders of the Bharatiya Jana Sangh (BJS) party, the precursor to the BJP.
The fallout from the Nav Nirman protests and Gandhi’s internal emergency created an
opening for the Jana Sangh party to broaden its base with frustrated and angry upper
caste and middle class urban voters in Gujarat. The Jana Sangh, as part of a coalition
of opposition parties, collectively called the Janata Party, defeated Congress and came
to power in Gujarat in the 1975 state assembly election and again in the 1977 national
election, which also marked the first time that a non-Congress government ruled in
India.256
After the defeat of the Congress party in Gujarat to the Janata Party in the 1977
national election, Gujarat Congress leader, Madhavsinh Solanki, developed and
successfully implemented the “KHAM” formula, a caste and religion based electoral
254Jones,DawnandRodneyJones,“UrbanUpheavalinIndia:The1974NavNirmanRiotsinGujarat,”AsianSurvey,16(4),November1976.NavNirmanmeans“socialreconstruction.”255Ibid,p.1029.ChristopheJaffrelotnotesthattheNavNirmanstudentprotestswerefusedintoacampaignbytheJanaSanghPartyandtheRSS’sstudentwing,theAkhilBharatiyaVidhyarthiParishad(AVBP)againstrisingprices.SeeJaffrelot,TheHinduNationalistMovementinIndia,p.258.256StatisticalReportonGeneralElection,1975totheLegislativeAssemblyofGujarat,NewDelhi:ElectionCommissionofIndia,http://eci.nic.in/eci_main1/ElectionStatistics.aspx.ForbackgroundontheemergencyseeFrankel,India’sPoliticalEconomy19472004,pgs.544‐546,649‐652.TheJanataPartycoalitioncollapsedin1980.Forbackgroundonthe1975assemblyelectionsinGujarat,seeShah,Ghanshyam,“The1975GujaratAssemblyElectioninIndia,”AsianSurvey,vol.16(3),March1976.

166
strategy targeting the caste groups, Kshatriyas (a warrior caste), Harijans (Scheduled
Castes, also known as Dalits), Adivasis (Scheduled Tribes), and Muslims.257 The
KHAM strategy worked extremely well electorally in 1980 against the newly created
BJP (the first time the BJP competed electorally in Gujarat), with Congress winning
both the national and state level elections in Gujarat.258
In 1985, Gujarat Chief Minister Solanki again targeted the KHAM caste and
religion groups in the state assembly elections. Shortly before the state assembly
election, Solanki announced an eighteen percent increase in the quota of reserved
spaces in educational institutions and government jobs for OBCs from 10 percent to 28
percent.259 The KHAM strategy again proved a successful electoral strategy for
Congress, who won the Gujarat assembly election.
However, while the KHAM strategy worked well electorally for Congress in
the 1980 and 1985 elections in Gujarat, socially the KHAM strategy created an
enormous amount of resentment from the urban upper castes and middle class
Gujaratis, notably, the Brahmins, Banias and Patels.260 Beginning in February 1985
and for the following six months, Ahmedabad experienced another large scale major
episode of widespread violent conflict and rioting, first directed at Dalits (scheduled
257Shani,Ornit,Communalism,CasteandHinduNationalism:TheViolenceinGujarat,p.74.258Jaffrelot,p.74.TheBJPwascreatedonApril6,1980frommembersoftheJanataParty.SeeJaffrelot,p.315.TheCongresspartywonallbutoneofGujarat’stwenty‐sixLokSabhaparliamentaryseats,and140outof181stateassemblyseatsin1980.SeealsoAchyutandSheth,p.254.259Shani,p.79.260BrahminsaretraditionalhighcasteHindus.Baniasarefromthemerchantortradingcommunityandarealsoconsidereduppercaste.ThePatelsaretraditionallyfromalandowningcasteandhavebeenanupwardlymobilesocialgroup.

167
castes), but then turning into riots between Hindus and Muslims, killing about 275
people.261 More Hindu-Muslim riots broke out the following year in Ahmedabad.
Also during this time, Gujarat experienced a period of de-industrialization in
the 1980s resulting from a crisis in the textile mill industry. Writing about the mill
crisis in Ahmedabad, Ornit Shani notes that between 1979 and 1984, twelve textile
mills were closed, of which nine were closed in a period of six months, between 1983
and 1984, with an estimated 40,000-50,000 workers losing their mill jobs by 1985.262
The rapid closure of textile mills created a major shock to the labor market, where
mills were a predominant means of employment for many of the residents living in
Ahmedabad.
The political turbulence created by Congress party infighting, the deep
unpopularity and resentment of Congress policies particularly from the urban upper
caste and middle class about the KHAM strategy and reservations, and the major
economic upheaval created by the decline of the textile industry, created an
opportunity for the newly created BJP to mobilize and gain a foothold in Gujarat.263
In the late 1980s, Gujarat became the staging ground for Hindu nationalist
political mobilization efforts. During this time period, the BJP joined forces with the
Hindu nationalist organization, Vishwa Hindu Parishad (VHP), in a sustained political
mobilization effort centered on building the Ram temple in the city of Ayodhya.264 In
261Spodek,p.765.262Shani,Ornit,Communalism,CasteandHinduNationalism:TheViolenceinGujarat,p.39.Shaninotesthatmanyworkerslosttheirjobsduetotechnologicaladvancesofthepowerloom,seefootnote74,p.39.ThejoblossestimatesaretakenfromVarshney(40,000)andShani(50,000).263Varshney,p.243.264TheVishwaHinduParishad(VHP),alsoknownastheWorldHinduCouncil,wascreatedin1964bytheRashtriyaSwayamsevakSangh(RSS)topromoteandprotectHinduism.Throughoutthe

168
1987, the VHP launched an organized mass mobilization effort, the Ram-Janaki
Dharma Yatra, taking place throughout Gujarat with the goal of “transcending caste
and sect differences in the worship of Shri Rama and to affirm the unity of all
Hindus.”265
As described in Chapter Two, the most well known mobilization effort to
“liberate Ram Janmabhoomi” and build a Ram temple at Ayodhya was initiated by
BJP leader, L.K. Advani in the form of a Rath Yatra on September 25, 1990 in the city
of Somnath, Gujarat.266 Advani chose Somnath as the starting point of the Rath Yatra
because it symbolized a place where Hindu temples had been both demolished and
rebuilt.267 After driving around India for nearly a month, Advani was arrested on
October 23 in the state of Bihar. The BJP responded by launching a national protest
movement, which in turn triggered ethnic riots across the country, killing about 100
people in Gujarat.268
The political impact of the yatras in Gujarat was dramatic: the yatras and
associated Hindu-Muslim violent conflict that followed in their wake weakened the
political effectiveness of the KHAM electoral strategy, and reshaped social and
political alignments through the message of Hindu unity and pride. By 1990, the social
and political identity of Savarna (upper caste Hindus) versus Avarna (lower castes
Hindus and tribals) was reconstituted, emphasizing instead Hindus versus Muslims,
1980s,theVHPspearheadedeffortstobuildHindutemplesinordertobringHindusofallcastestogetherandbuildHinduunity.SeeJaffrelot,pgs.193,359‐360.265YagnikandSheth,p.258.266Jaffrelot,pgs.416‐420.267AccordingtoL.K.Advani’swebsite,SomnathwaschosenasthestartingpointforhisRathYatrabecauseitwasatSomnaththatHindutempleswereplunderedbyMusliminvaders.However,in1950,theHindutempleswererebuilt.Seehttp://www.lkadvani.in/eng/content/view/449/295/.268Jaffrelot,p.420.

169
through the BJP’s advocacy of Hindutva. In a state undergoing major socio-economic
changes, some upper caste middle class Gujaratis, no longer able to secure power
through caste identities alone, “began to find security within the ideology of Hindutva
through which they thought they could regain some measure of power and control.”269
In the 1991 Lok Sabha election, the BJP won twenty out of twenty-six seats in
Gujarat by focusing on Hindutva and support for building the Ram Temple, and also
criticizing the Congress Party over corruption and rising prices.270 The following year,
after the Babri Mosque was torn down by Hindu nationalists at the disputed site in
Ayodhya, Hindu-Muslim riots again broke out across Gujarat in December 1992,
including Ahmedabad, but the worst riots and violence took place in the city of
Surat.271 Varshney estimates that over the course of four days, 197 people were killed
in Surat, of which 175 were Muslims and 22 were Hindus.272
In 1995, for the first time in Gujarat a two party competition between the
Congress and the BJP defined the state assembly elections. The BJP swept the state
assembly elections, winning 121 out of 182 seats, and securing a greater percentage of
votes in all geographical regions of the state.273 The party did especially well in urban
areas, capturing 53.2 percent of the urban vote share, compared to 30.2 percent by
269YagnikandSheth,p.260.270StatisticalReportonGeneralElections,1991,totheTenthLokSabha,Volume1,NewDelhi:ElectionCommissionofIndia,http://eci.nic.in/eci_main/StatisticalReports/LS_1991/VOL_I_91.pdf.SeealsoShah,Ghanshyam,“TheBJP’sRiddleinGujarat,”inTheBJPandtheCompulsionofPoliticsinIndia,Eds.ThomasBlomHansenandChristopheJaffrelot.Oxford:OxfordUniversityPress,1998,p.257.271Shah,p.249.YagnikandSheth,p.264.272ForananalysisofthedifferenttrajectoriesofethnicviolenceinAhmedabadandSuratovertime,seeVarshney,EthnicConflictandCivicLife,chapters9‐10.273StatisticalReportonGeneralElections,1995,totheLegislativeAssemblyofGujarat,NewDelhi:ElectionCommissionofIndia,http://eci.nic.in/eci_main/statisticalreports/SE_1995/StatisticalReport‐GUJ95.pdf.

170
Congress.274 Though the BJP did not explicitly focus on Hindutva in its 1995 campaign
in Gujarat, survey research by Gujarati scholar, Ghanshyam Shah, suggests that the BJP’s
support for building the Ram temple and its advocacy of Hindutva were key factors for
many who voted for the BJP in the election.275
Over the next three years, the BJP in Gujarat experienced a period of intense
intraparty power struggles as different leaders fought to dominate the party.276 Yet,
despite the party infighting, the BJP was able to continue its dominance in Gujarat,
winning both the 1996 and 1998 Lok Sabha national elections, as well as the 1998 state
assembly election. The BJP continued to do well in urban areas, capturing 75 percent of
the urban vote share compared to 19 percent by Congress in the 1996 national election.277
This somewhat lengthy background about the history and political context of
Gujarat is included to highlight the major changes that have taken place in the state over
the past four decades, most notably the socio-political history of episodes of major
violent conflict between Hindus and Muslims and the rise of the BJP to become the
dominant political party by the mid-1990s, which helps to set the stage for examining
voting behavior in Gujarat and Ahmedabad in the 1999, 2004 and 2009 national
elections.
In the lead up to the 1999 national election, tensions in Gujarat were heightened
following instances of ethnic violence. Numerous instances of violence against Christians
in South Gujarat beginning in December 1998 and continuing through the first part of 274Shah,Ghanshyam,“BJP’sRisetoPower,”Economic&PoliticalWeekly,January13‐20,1996,p.166.275Ibid,p.169.276ForadiscussionoftheBJP’sintra‐partystrugglesduringthistime,seeShah,TheBJP’sRiddleinGujarat,pgs.261‐265.Patel,Priyavadan,“SectarianMobilisation,FactionalismandVotinginGujarat,”Economic&PoliticalWeekly,April21‐28,1999.277Patel,p.2429.

171
1999 were reported by the media and human rights group organizations.278 In addition, in
July 1999, during the Kargil war with Pakistan, the Hindu nationalist organization, VHP,
was accused of stoking communal tensions, which triggered two weeks of Hindu-Muslim
riots in Ahmedabad.279
The BJP campaigned in Gujarat on a slogan of “abki bari, Atal Bihari” (this time,
it’s Atal Bihari) referring to support for BJP leader, Prime Minister Atal Bihari Vajpayee,
at the center.280 Yet, at the state level, the BJP faced a record of paralyzing intraparty
factional infighting and a drastic economic slowdown: after seven years of eight percent
average economic growth from 1991-1992 to 1998-1999, economic growth in Gujarat
contracted eight percent in 1999-2000, to less than one percent.281
The 1999 election marked the increasing influence of BJP General-Secretary
Narendra Modi in state-level party politics, who was put in charge of the BJP’s state
278“Anti‐ChristianViolenceontheRiseinIndia–NewReportdetailspoliticsbehindextremistHinduAttacks,”HumanRightsWatch,October1,1999,http://www.hrw.org/news/1999/09/29/anti‐christian‐violence‐rise‐india.HumanRightsWatchreportedthatattacksonChristiansincreasedsignificantlythroughoutthecountrywhentheBJPcametopower,andthatthehighestnumberofreportsofviolencetargetedatChristiansoccurredinGujaratin1998and1999.SeealsoEngineer,AsgharAli,“TheBJPanditsRootsinGujarat,”InstituteofIslamicStudiesandCentreforStudyofSocietyandSecularism,http://www.csss‐isla.com/arch%20231.htm.279“CPDRReportSeesSaffronHandinAhmedabadRiots,”TheIndianExpress,August22,1999.ThenewsarticlesummarizesareportbytheCommitteefortheProtectionofDemocraticRights(CPDR)whichconcludesthattheVHPandBajrangDalfomentedHindu‐Muslimconflictduringatimeoftensionmarkedby1)theKargilconflict,2)acricketmatchbetweenIndiaandPakistan,and3)theannualJagannathrathyatraonJuly14th.Gandadhar,V.,“Wetrytorebuildmutualfaithandthenanotherriotstartsdestroyingourwork,”partofathree‐partseriesontheJuly1999riotsinAhmedabad,RediffNews,August5,1999,http://www.rediff.com/news/1999/aug/05abd.htm.280Patel,Priyavadan,“SectarianMobilization,CommunalPolarizationandFactionalism:ElectoralDominanceofHindutvaandVotinginGujarat,”Master’sThesis,DepartmentofPoliticalScience,FacultyofArts,TheM.S.UniversityofBaroda,2003,p.46.281 TheReserveBankofIndia’sHandbookofStatisticsonIndianEconomy,Table4,NetStateDomesticProductatFactorCost–StateWiseatcurrentprices,http://rbidocs.rbi.org.in/rdocs/Publications/PDFs/004T_HBS120911.pdf.Montel,Ahluwalia,“StateLevelPerformanceUnderEconomicReformsinIndia,”paperpresentedattheCentreforResearchonEconomicDevelopmentandPolicyReformConferenceonIndianEconomicProspects:AdvancingPolicyReformatStanfordUniversity,May2000.

172
campaign, and who would soon become the state’s Chief Minister.282 The Congress Party
joined forces with Shankarsinh Vaghela, once a primary actor within the BJP, but who
notoriously revolted from the party to start his own short-lived Rashtriya Janata Party.
However, Congress’s aging leadership was unable to provide a compelling challenge to
counter the BJP’s Hindu nationalist mobilization. The BJP won the 1999 national
election, increasing its vote share four percent, from 48.3 percent in 1998 to 52.5 in 1999,
and adding one more parliamentary seat from 19 to 20 (out of 26 seats).283
It is essential to address the ethnic violence that ravaged Gujarat in 2002,
considered by many to be one of worst episodes of ethnic violence in India since
Partition. On February 27, 2002, 59 Hindu activists were attacked and killed in an arson
fire on a train near the Godhra train station in Gujarat.284 The next day, the VHP issued a
statewide strike to protest the Godhra train attack and killing of Hindus. Over the ensuing
days and months, over a thousand people were killed in ethnic violence across the state,
directed mostly against Muslims.285286287
282V.Venkatesan,“ApracharakasChiefMinister,”Frontline,October13‐26,2001.Patel,Master’sThesis,p.46.283CSDSTeam,“ClearlineofcleavageinGujarat,”Frontline,November27‐December10,1999.284TheCommissionofInquiry,ReportofJusticeGTNanavatiandJusticeAkshayHMehta,PartI,SabarmatiExpressTrainIncidentatGodhra,September18,2008,http://home.gujarat.gov.in/homedepartment/downloads/godharaincident.pdf.Nineyearslater,31people,mostlyMuslims,wereconvictedofcriminalconspiracyandmurderintheGodhratrainkillings.See,“Godhraverdict:31convictedinSabarmatiExpressburningcase,”TimesofIndia,February22,2011.285“Gujaratriotstolltogoupfrom952to1,180,”TimesofIndia,February16,2009.Thedeathtollfigureincreasedby228peoplewhosestatuschangedfrommissingtodeceasedaftersevenyears.286Severalstudieshaveconcludedthatthe2002riotsinGujaratweretheresultofpre‐planned,organizedattacksandacomplicitstategovernmentapparatusthateitherdirectlyorindirectlycondonedtheattacksonMuslims.See,ConcernedCitizensTribunal–Gujarat,CrimesAgainstHumanity–AnInquiryintotheCarnageinGujarat,Vol.I,Mumbai:CitizensforJusticeandPeace,2002.HumanRightsWatch,WeHaveNoOrderstoSaveYou,StateParticipationandComplicityinCommunalViolenceinGujarat,Vol.14No.3,April2002.Jaffrelot,Christophe,“CommunalRiotsinGujarat:TheStateatRisk?,”HeidelbergPapersinSouthAsianandComparativePolitics,SouthAsiaInstitute,UniversityofHeidelberg,July2003.Engineer,AsgharAli,Ed.TheGujaratCarnage.NewDelhi:OrientLongman,2003.InternationalReligiousFreedomReport2003,BureauofDemocracy

173
A few months after the riots started, Chief Minister Narendra Modi, on July 19th
dissolved the state assembly and called for early state elections to be held in Gujarat, ten
months before the elections were scheduled to take place.288 However, the Indian
Election Commission objected, declaring that an election in Gujarat could not be
organized and conducted since so many voters were still living in relief camps.289 After
repeated appeals by BJP leaders to hold early elections in Gujarat, including a case
brought by the BJP to the Supreme Court, the Election Commission set an election date
for December. On December 12, 2002, the BJP won another landslide state election,
capturing 126 out of 181 assembly seats.290
Two years later, Gujarati politics scholar, Priyavadan Patel, called the 2004
national election the first somewhat “normal” election the BJP had ever contested in
Gujarat since coming to power (i.e. no Kargil war, no large-scale ethnic rioting, or
HumanRightsandLabor,U.S.DepartmentofState,http://www.state.gov/j/drl/rls/irf/2003/24470.htm.287OnApril10,2012,theSupremeCourt‐appointedSpecialInvestigationTeam(SIT)declaredthatitfoundnoevidencetoprosecuteNarendraModi,topbureaucrats,orpoliceofficersinamassacrethattookplaceintheGulbergSocietyneighborhoodofAhmedabad,oneoftheworstaffectedareasinthe2002riots.“SITfindsnoproofagainstModi,sayscourt,”TheHindu,April10,2012.288Bunsha,Dionne,“GujaratGamePlan,”Frontline,August3‐16,2002.289Approximately100,000peopleweredisplacedandlivinginreliefcampswithinthefirstweekoftheriots.DasguptaManas,“Noplanstoclosecamps:Modi,”TheHindu,April1,2002.Jaffrelot,TheStateatRisk,p.9.290Kumar,Sanjay,“GujaratAssemblyElections2002–AnalysingtheVerdict,”Economic&PoliticalWeekly,January23,2003.UsingCSDSpost‐pollingsurveydata,KumarfindsthatthelargestnumberofassemblyseatsandincreaseinvotesharefortheBJPoccurredindistrictsaffectedbytheriots(table3).However,Kumarnotesthatthoughtheethnicriotsappearedtohavemadeadifferenceintheelectoraloutcome,theywerenottheentirestoryinthe2002election.Accordingtothesurveydata,twenty‐ninepercentofallvotersindicatedthattheyweresatisfiedwiththestategovernment’sperformanceoverthepastfiveyears,outofwhichseventy‐sevenpercentvotedfortheBJP(table5).AllsocialgroupsexceptMuslimsidentifiedeconomicdevelopmentasthemostimportantpriorityforthenewgovernment(MuslimsidentifiedHindu‐Muslimharmonyastheirhighestpriority(table15).

174
intense intra-party power struggles).291 In the lead-up to the election, Hindu nationalist
organizations such as the VHP stayed away from the electoral process.292
BJP Chief Minister, Narendra Modi, in addition to campaigning on the national
“India Shining” slogan in 2004, focused on state and local level development progress on
water, roads, power, and industrial development, while promoting a “Vibrant Gujarat”
through the creation in 2003 of a new global investor’s summit designed to attract foreign
investment into the state.293 The Congress Party focused on the BJP’s development
performance, seeking to frame the party as weak on development.294 Congress’s message
earned it six more parliamentary seats, but it was not enough. The BJP won the 2004
national election in Gujarat, but its vote share decreased to 47.3 percent compared to 52.5
percent in the 1999 election. The BJP party captured a total of 14 seats, compared to
Congress’s 12 seats.
Within a period of ten years, the social and economic landscape in 1999 compared
to 2009 in Gujarat changed significantly. The 1999 national election had taken place
under conditions of low economic growth and a very high level of ethnic conflict and
violence. Ten years later, the 2009 national election took place under conditions of high
economic growth and a medium level of ethnic conflict. Over a period of two years, from
2007 to 2009, Gujarat had experienced double-digit levels of economic growth (i.e. 11.8
291Patel,Priyavadan,“Gujarat–Anti‐incumbencyBegins,”Economic&PoliticalWeekly,December18,2004p.5475.292Desai,Darshan,“DivorcecouldbepainfulforBJP,VHP,”TimesofIndia,June8,2005.293Timmons,Heather,“ADivisiveIndianOfficialIsLovedbyBusiness,”TheNewYorkTimes,February8,2011.“IsitTimetoacknowledgetheGujarat‘miracle?,”TheEconomicTimes,January16,2011.294Patel,“Gujarat–Anti‐incumbencyBegins,”p.5475.

175
percent in 2008-2009, and 16.9 percent in 2007-2008).295 At the same time, while ethnic
tensions were still present in Gujarati society, no accounts of large-scale ethnic violence
had occurred.296
Narendra Modi focused the 2009 national election campaign again primarily on
issues of development and the economy, emphasizing the growth of the state’s domestic
product during his tenure, while claiming that the development success in Gujarat could
be unlocked across the country if the BJP came to power at the center.297 Modi
highlighted the success in bringing the Nano car project, touted as the people’s car, to
Gujarat as a means of bringing employment opportunities to the state.298 The VHP again
largely stayed out of the campaign process.
The Congress party sought to highlight the weaknesses of the BJP on
development and focus on concern for aam aadmi (the common man).299 However, the
BJP’s ability to point to higher growth rates and securing development projects like the
Nano car, combined with Congress’ weak party leadership, hindered its ability to pose a
major threat to Modi’s incumbent government. The BJP won the 2009 national election
in Gujarat, capturing 15 out the states 26 Lok Sabha seats, and continued to perform well
295TheReserveBankofIndia’sHandbookofStatisticsonIndianEconomy,Table4,NetStateDomesticProductatFactorCost–StateWiseatcurrentprices.296Engineer,AsgharAli,India:CommunalRiots:2009,SouthAsiaCitizen’sWeb,January2,2010,athttp://www.sacw.net/article1315.html.297Jani,Mahashweta,“Gujarat:BJPScrapesThrough,”Economic&PoliticalWeekly,September26,2009,p.135.Shah,Ghanshyam,“Modi’spoliticalcraft:ReplicaofAssemblyElections,”UnpublishedPaper.298TheNanocarwasconceivedbyRatanTataasapeople’scarforIndia’semergingmiddleclasswithastartingpriceof100,000rupees,orapproximatelyUS$2,200.AftermajorviolentprotestsbyfarmersinthestateofWestBengalforcedTataMotorstoshutdownitsNanoassemblyplant,thecompanyrelocateditsplanttoSanand,Gujarat.Siddiqui,Tanvir,“InGujarat,BJPridestheNano,”TheIndianExpress,April8,2009.BerlandKaul,Allison,“Industrialization,PeasantMobilizationandtheConflictoverLandAcquisitioninIndia:TheCaseoftheNanoCar,”Paperpresentedatthe2010AnnualMeetingoftheAmericanPoliticalScienceAssociation,Washington,DC,September,2‐5,2010.InterviewwithMahashwetaJani,February12,2011.299Shah,“Modi’spoliticalcraft,”p.9.

176
in urban areas.300 Table 6.1 summarizes the national election results for the Congress and
BJP parties in Gujarat for the 1999, 2004 and 2009 national elections. The table shows
the continued dominance of the BJP, though somewhat declining overall vote share,
during the 1999-2009 timeframe in Gujarat.
Table 6.1 Gujarat National Election Results, 1999-2009 Lok Sabha National Elections 1999 2004 2009 Congress percentage of vote share 45.4 43.8 43.4 Congress M.P. seats won 6 12 11 BJP percentage of vote share 52.5 47.3 46.6 BJP M.P. seats won 20 14 15
Source: Election Commission of India.
In summary, this section offers a contextual narrative of the rise and political
dominance of the BJP within the context of a two party rivalry in a highly industrialized,
urbanizing state. Unlike in Delhi, in which we find a precipitous rise followed by a steep
decline in the BJP’s political fortunes during the 1999-2009 timeframe, the BJP has
remained the dominant political force in Gujarat and in Ahmedabad. I posit that both
ethnic and programmatic interests are central to understanding the nature of voter support
for the BJP in Gujarat and in Ahmedabad over this timeframe. The following two
sections examine voting behavior in Gujarat and in Ahmedabad and tests Ethnically
Mediated Retrospective Voting (ERV) theory as a plausible means of explaining
variation in urban electoral support for the BJP in the 1999, 2004 and 2009 national
elections.
300TheBJPwon54.6percentoftheurbanvotesharecomparedto40.2percentbyCongressinthe2009nationalelection.Jani,“Gujarat:BJPScrapesThrough,”p.135.

177
Gujarat:IndianNationalElectionSurveyAnalysis,1999,2004and2009
This section presents an analysis of voting behavior in Gujarat in three Indian
national elections, 1999, 2004, and 2009, using survey data from the Indian National
Election Studies (NES). This data comes from the same source that was used to analyze
voting behavior in Delhi in the previous chapter.
For the following analysis, I again employ the typology of independent variables
described in the research design chapter – one group representing indicators of ethnic
group identity and interests, and a second group representing indicators of retrospective
programmatic interests. 301 The dependent variable for this analysis is vote choice; a
binary, or dichotomous, dependent variable coded 0 for individuals who voted for the
Congress Party, and 1 for individuals who voted for the BJP.
Gujarat,1999Election
Under conditions of a drastic economic slowdown and recent violent ethnic
conflict, the BJP swept the 1999 national election in Gujarat, increasing its vote share to
52.5 percent, the highest level since it came to power in the state in 1991.
The National Election Study conducted a post-poll election survey after the 1999
election in Gujarat using the same methodology and survey questionnaire that was used
in Delhi. However, the sample size for the 1999 NES survey in Gujarat is larger than in
Delhi. The 1999 NES in Gujarat sampled a total of 482 voters, of which 101 respondents
refused to answer who they voted for, 6 respondents indicated that they did not remember
301LiketheNESdatausedforDelhi,someofthesurveyquestionsaskedarenotalwaysconsistentovertheyears.Thus,whileitispossibletomakebroadcomparisonsoftheimpactofthesetwotypesofindicatorsacrossspaceandtime,thedatalimitationsmeanthatitisnotalwayspossibletomakecomparisonsoftheimpactofalltheindicatorsacrossallthreeelections.

178
whom they voted for, and 3 respondents voted for a small regional party. Subtracting
these respondents leaves a sample size of 372 respondents (compared to a sample size of
n=63 for the Delhi 1999 NES).
With a sample size of over 300, the following analysis of the 1999 NES election
survey data in Gujarat includes a logistic regression model using indicators of ethnic
group identity and interests and retrospective programmatic interests. In addition, in order
to compare voting behavior in Gujarat and Delhi in the 1999 election, I also discuss the
differences in sample proportions for select indicators. A full list of the descriptive
statistics for the Gujarat 1999 election analysis is listed in table 2, Appendix B.
The main logistic regression model includes indicators of ethnic group identity
and interests (i.e., caste, religion, Hindu Ram temple views, and Social Harmony), and
indicators of retrospective programmatic interests (i.e. corruption, national security,
and prices). The model also includes indicators for age, class and religiosity. The
indicator, central government performance, which is akin to a broad job approval
rating of government performance, is not included in the model because it is
significantly correlated with the indicator for national security (.52).302 In addition,
because the indicators for social harmony and law and order have moderately high
correlation (.41), the main model includes the former indicator, while a second model
includes the latter indicator. Table 6.2 on the following page provides the logistic
regression results.
302Acorrelationmatrixtestindicatedthattheindicatorforcentralgovernmentperformancewassignificantlycorrelatedwiththeindicatorfornationalsecurity:.52.WhenIranthemainmodelandincludedthevariable,centralgovernmentperformance,statadroppedtwovariablesfromthemodel,indicatingthatthevariablespredictperfectly.

179
Vote choice 1999 = ß0 + ß1Agei + ß2 Class (Rich)i + ß3Caste (Upper Caste)i+ ß4Religion (Hindu)i + ß5Religiosityi + ß6RamTempleviewsi + ß7SocialHarmonyi + ß8Corruptioni + ß9Pricesi + ß10Securityi + ei Table 6.2 Logit Regression Results, Gujarat 1999 Election
(1) (2) Age -0.001
(0.016) 0.017
(0.015) Class (Rich) 0.938
(0.716) 1.728* (0.805)
Caste (Upper Caste) 1.406* (0.572)
1.809** (0.627)
Religion (Hindu) 1.992* (1.182)
1.424 (1.037)
Religiosity 0.738 (0.632)
0.685 (0.619)
Ram Temple Views 0.744** (0.292)
0.348 (0.254)
Social Harmony (Hindu-Muslim)
1.927** (0.539)
-
Corruption 0.584 (0.521)
1.245** (0.479)
Prices 1.003 (0.993)
1.486 (0.924)
Law & Order - 0.923* (0.453)
National Security 2.827** (0.599)
1.937** (.471)
Constant -6.762** (1.628)
-5.941** (1.378)
Observations 154 178 Pseudo R-squared .45 .43
Source: Indian NES Survey (1999) Significance: * = at 5%; ** = at 1%; standard errors are in parentheses. Dependent Variable is vote choice, coded 0 for Congress, and 1 for the BJP
The results of the main model show that the ethnic identity and interests
indicators for caste (upper caste), religion (Hindu), Ram temple views, and Hindu-
Muslim social harmony have a positive and statistically significant impact on the
likelihood of voting for the BJP, holding all else constant. 303 Religiosity, age and wealth
are not statistically significant indicators of voter support for the BJP. The retrospective
303Thep‐valueforthereligioncoefficientis.09slightlyabovethe5%significancelevel.
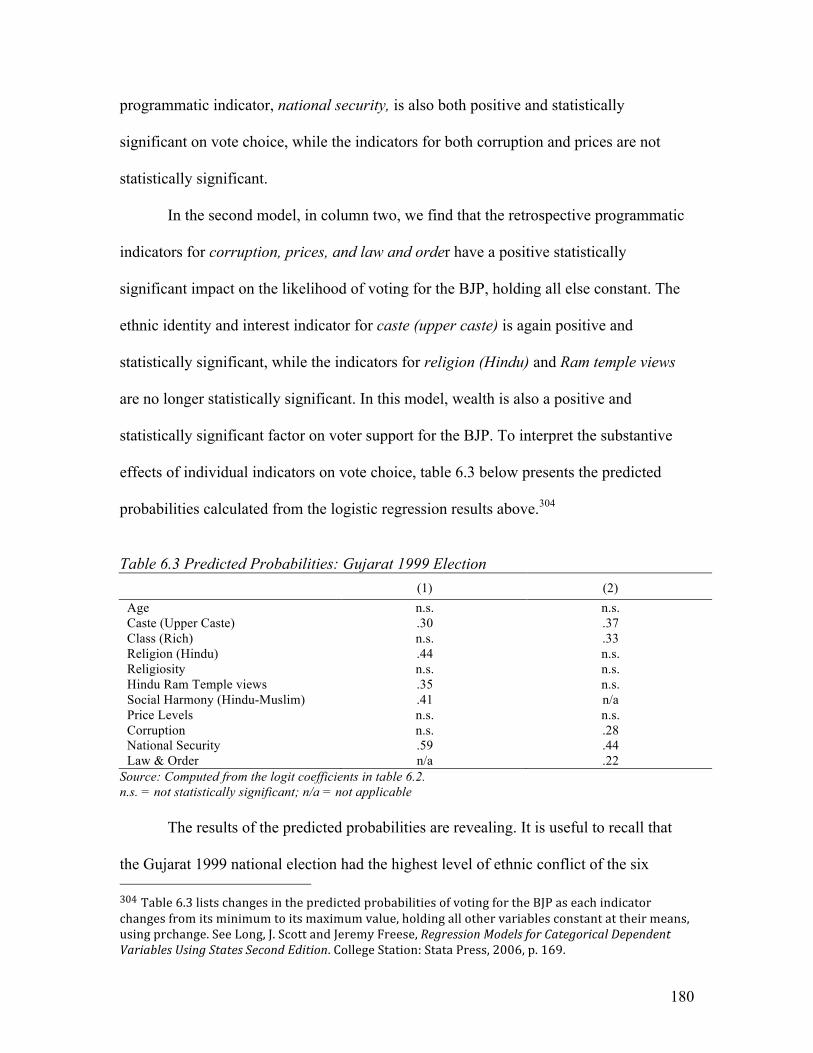
180
programmatic indicator, national security, is also both positive and statistically
significant on vote choice, while the indicators for both corruption and prices are not
statistically significant.
In the second model, in column two, we find that the retrospective programmatic
indicators for corruption, prices, and law and order have a positive statistically
significant impact on the likelihood of voting for the BJP, holding all else constant. The
ethnic identity and interest indicator for caste (upper caste) is again positive and
statistically significant, while the indicators for religion (Hindu) and Ram temple views
are no longer statistically significant. In this model, wealth is also a positive and
statistically significant factor on voter support for the BJP. To interpret the substantive
effects of individual indicators on vote choice, table 6.3 below presents the predicted
probabilities calculated from the logistic regression results above.304
Table 6.3 Predicted Probabilities: Gujarat 1999 Election
(1) (2) Age n.s. n.s. Caste (Upper Caste) .30 .37 Class (Rich) n.s. .33 Religion (Hindu) .44 n.s. Religiosity n.s. n.s. Hindu Ram Temple views .35 n.s. Social Harmony (Hindu-Muslim) .41 n/a Price Levels n.s. n.s. Corruption n.s. .28 National Security .59 .44 Law & Order n/a .22
Source: Computed from the logit coefficients in table 6.2. n.s. = not statistically significant; n/a = not applicable
The results of the predicted probabilities are revealing. It is useful to recall that
the Gujarat 1999 national election had the highest level of ethnic conflict of the six 304Table6.3listschangesinthepredictedprobabilitiesofvotingfortheBJPaseachindicatorchangesfromitsminimumtoitsmaximumvalue,holdingallothervariablesconstantattheirmeans,usingprchange.SeeLong,J.ScottandJeremyFreese,RegressionModelsforCategoricalDependentVariablesUsingStatesSecondEdition.CollegeStation:StataPress,2006,p.169.

181
different elections scenarios studied in this research project (i.e. three national elections,
1999, 2004 and 2009, in two different locations, Gujarat and Delhi). Predicted
probabilities in the main model show that the ethnic group indicator for caste (upper
caste) increases the likelihood of voting for the BJP by 30 percentage points. The ethnic
group indicator for religion (Hindu) increases the likelihood of voting for the BJP by 44
percentage points.
Table 6.3 also indicates the large effects of ethnic group interests on vote choice:
voter opinion about building the Ram temple, and concerns about social harmony related
to Hindu-Muslims relations each have significant substantive impacts on the likelihood of
voting for the BJP, by 35 and 41 percentage points respectively. These results suggest
that ethnic group identity and interests were major factors in influencing voter support
for the BJP in the 1999 national election in Gujarat.
Predicted probabilities from the main model also show that a positive assessment
of the incumbent BJP led government’s performance on national security increases the
likelihood of voting for the BJP by 59 percentage points. Although national security is
considered a programmatic indicator for this research study, in practice, national security
concerns can sometimes fuse with local ethnic group concerns, such as when the Kargil
conflict with Pakistan was associated with stoking ethnic tensions and rioting in
Ahmedabad July 1999.
The results in table 6.3 show that there is more to the story. Voters in Gujarat also
cared about retrospective programmatic issues in this election, most notably, corruption.
The predicted probabilities from the second model indicate the substantive impact of
concerns about corruption on vote choice: a higher level of voter satisfaction with the
182
incumbent government’s efforts to reduce corruption increases the likelihood of voting
for the BJP by 28 percentage points. This result is most readily understood in light of
long standing voter concern and frustration in Gujarat about corruption in the Congress
party (a major factor in the Nav Nirman riots).
The above analysis of 1999 Gujarat election survey data indicates that ethnic
group identity and interests were very strong factors in explaining voter support for the
BJP, but that voters were also influenced by programmatic concerns, notably concerns
about corruption. How does this compare to voting behavior in the 1999 election in
Delhi? By contrast, Delhi had experienced a moderate level of ethnic group conflict
combined with a high level of economic growth during the 1999 election. The following
table lists the differences in sample proportions of select ethnic indicators for Gujarat and
Delhi for the 1999 election. Column three “Yes” presents the proportion of voters with a
particular characteristic (i.e., upper caste), or who answered in the affirmative to a
particular question and voted for the BJP, while column four “No” presents the
proportion of voters who do not have the particular characteristic, or who answered in the
negative to a particular question and voted for the BJP. The percentage can be derived by
multiplying each proportion by 100.

183
Table 6.4 Differences of sample proportions for select indicators for BJP voters, Gujarat and Delhi, 1999 election
State Indicator Yes No Difference in proportions
Gujarat Caste (upper caste) .76 .36 -.40** Hindu Ram Temple views .55 .41 -.14** Social Harmony (Hindu-Muslim) .77 .34 -.43** Delhi Caste (upper caste) .68 .24 -.44**
Hindu Ram Temple views .37 .29 -.08** Social Harmony (Hindu-Muslim) .56 .18 -.38**
Source: Indian NES Survey (1999) Significance: * = at 5%; ** = at 1% N = 372 for Gujarat; 63 for Delhi
If we first look at indicator for caste (uppercaste) we find that the difference in
the sample proportions of upper caste versus non-upper caste voters who voted for the
BJP is slightly higher for Delhi voters (.44) than for Gujarati voters (.40). However, if we
look at the percentage upper caste voters who voted for the BJP in each state, we see that
a higher percentage of upper caste voters voted for the BJP in Gujarat (.76) than in Delhi
(.68). This suggests that, on average, a greater percentage of upper caste voters voted for
the BJP in Gujarat than in Delhi in the 1999 election.
The table also highlights differences regarding ethnic group interests relating to
Hindu Ram temple views and Hindu-Muslim social harmony between voters in Delhi an
in Gujarat. We find that the percentage of voters who highlighted the importance of
building the Ram temple and improving Hindu-Muslim social relations and voted for the
BJP is markedly higher in Gujarat (55 percent and 77 percent), than in Delhi (37 percent
and 56 percent). These results suggest that ethnic group interests relating to the Ram
temple and Hindu-Muslim relations were more distinguishing factors of voter support for
the BJP in Gujarat than in Delhi in the 1999 election.
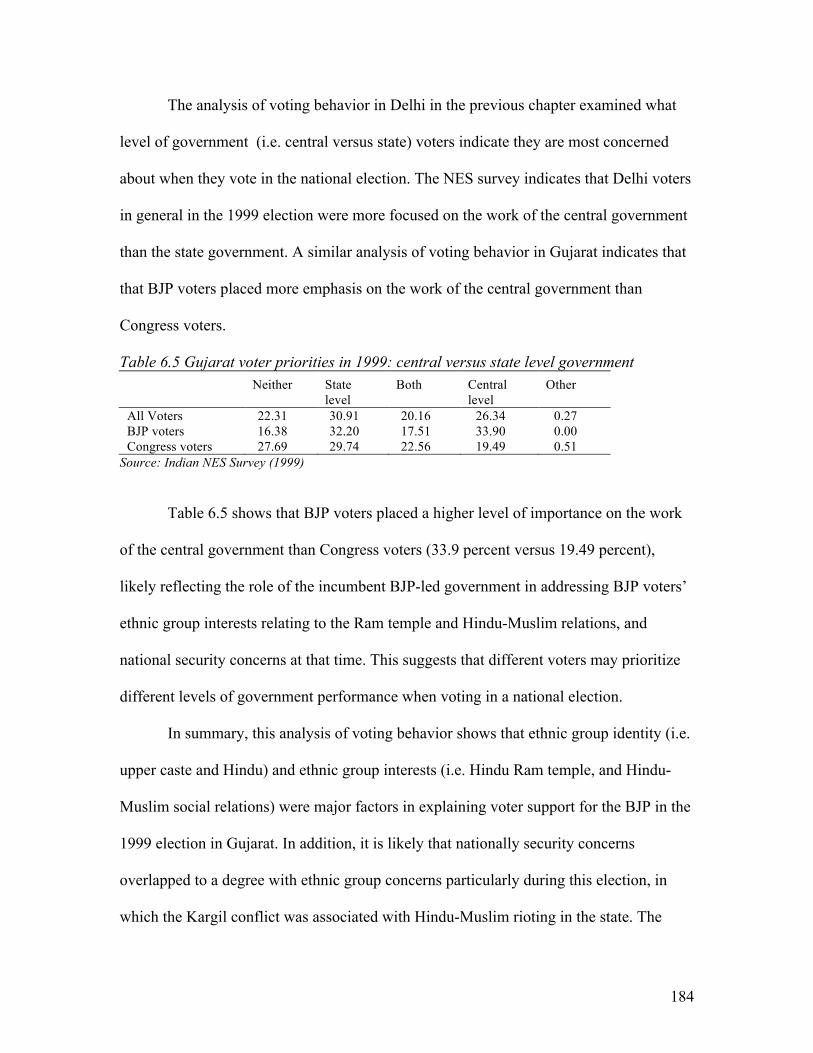
184
The analysis of voting behavior in Delhi in the previous chapter examined what
level of government (i.e. central versus state) voters indicate they are most concerned
about when they vote in the national election. The NES survey indicates that Delhi voters
in general in the 1999 election were more focused on the work of the central government
than the state government. A similar analysis of voting behavior in Gujarat indicates that
that BJP voters placed more emphasis on the work of the central government than
Congress voters.
Table 6.5 Gujarat voter priorities in 1999: central versus state level government Neither State
level Both Central
level Other
All Voters 22.31 30.91 20.16 26.34 0.27 BJP voters 16.38 32.20 17.51 33.90 0.00 Congress voters 27.69 29.74 22.56 19.49 0.51
Source: Indian NES Survey (1999)
Table 6.5 shows that BJP voters placed a higher level of importance on the work
of the central government than Congress voters (33.9 percent versus 19.49 percent),
likely reflecting the role of the incumbent BJP-led government in addressing BJP voters’
ethnic group interests relating to the Ram temple and Hindu-Muslim relations, and
national security concerns at that time. This suggests that different voters may prioritize
different levels of government performance when voting in a national election.
In summary, this analysis of voting behavior shows that ethnic group identity (i.e.
upper caste and Hindu) and ethnic group interests (i.e. Hindu Ram temple, and Hindu-
Muslim social relations) were major factors in explaining voter support for the BJP in the
1999 election in Gujarat. In addition, it is likely that nationally security concerns
overlapped to a degree with ethnic group concerns particularly during this election, in
which the Kargil conflict was associated with Hindu-Muslim rioting in the state. The

185
analysis also showed that retrospective programmatic concerns relating to corruption was
also an important factor in vote choice.
In the context of Gujarat’s weak political economy of development marked by a
drastic economic slowdown in 1999, and a very high level of ethnic conflict arising from
the Kargil conflict with Pakistan and Hindu-Muslim riots in Gujarat, these empirical
findings of voting behavior in Gujarat in 1999 support ERV theory’s prediction that the
relative influence ethnic group identity and interests are strong factors in explaining
voting behavior and voter support for the BJP, while retrospective programmatic interests
are somewhat less influential, most closely represented by scenario 2 in table 3.1.
Gujarat,2004Election
After widespread Hindu-Muslim rioting and violence gripped Gujarat in early
2002, followed by a BJP sweep in the state’s assembly election, a period of less ethnic
violence but continued heightened ethnic tensions followed in the lead up to the 2004
national election. Within a period of five years, Gujarat’s economy had rebounded from a
growth rate of less than one percent in 1999-2000, to a growth rate of 8.9 percent in
2004-2005.305 Within a period of eleven years, the state’s poverty level declined from a
quarter (24.2 percent) of its population in 1993-95, to 12.5 percent by 2004-2005.306 The
BJP won the 2004 national elections in Gujarat, but it lost six Lok Sabha seats,
decreasing from 20 to 14, and reducing its vote share by five percent.
305TheReserveBankofIndia’sHandbookofStatisticsonIndianEconomy,Table4,NetStateDomesticProductatFactorCost–StateWiseatcurrentprices.306ReserveBankofIndia’sHandbookofStatisticsonIndianEconomy,Table162:NumberandPercentageofPopulationBelowPovertyLine.The2004‐2005povertylevelisthemostrecentavailable.

186
The 2004 post poll national election survey includes 1106 respondents in Gujarat
and uses the same methodology and questionnaire that was used for the 2004 NES in
Delhi. Of the 1106 voters sampled, 193 respondents declined to answer who they voted
for, and 19 indicated that they didn’t know who they voter for. Seventeen respondents
voted for a small regional party. Subtracting these respondents leaves a sample size of
877 respondents who either voted for the BJP or the Congress party.
Since the questionnaire used for the 2004 NES in Delhi and in Gujarat is the same
and the sample size is appropriate, the analysis of the 2004 NES in Gujarat is able to
employ the same logistic regression model and indicators that are used for the Delhi 2004
analysis to test for the effects of ethnic group identity and interests and retrospective
programmatic interests on the likelihood of voting for the BJP.
The following model includes indicators of ethnic group identity and interests: (i.e.,
caste, religion, ram temple views, and social harmony), and indicators of retrospective
programmatic voting (i.e., personal financial conditions, employment, development,
corruption, national security and central government performance).307 The indicator for
central government performance is included in the main model in column one. This
indicator is removed in the second and third models, in order to better ascertain which
retrospective programmatic issues are driving vote choice. Because of the moderately
high correlation between indicators for national security and corruption (.49), and for
national security and development (.55), I retain the indicators for corruption and
307 AsnotedinChapterFour,duetothedifferencesinthesurveyquestionsaskedbetweenthe1999and2004IndianNESsurveys,someoftheindicatorsincludedinthe2004modelaredifferentfromtheindicatorsusedinthe1999model.Specifically,surveyquestionsaboutavoter’sretrospectiveassessmentaboutpricelevelsandlawandorderareincludedinthe1999NESsurvey,butarenotincludedinthe2004NESsurvey,whereasquestionsaboutvoter’sretrospectiveassessmentaboutemploymentanddevelopmentareincludedinthe2004NESsurveybutnotinthe1999NESsurvey.
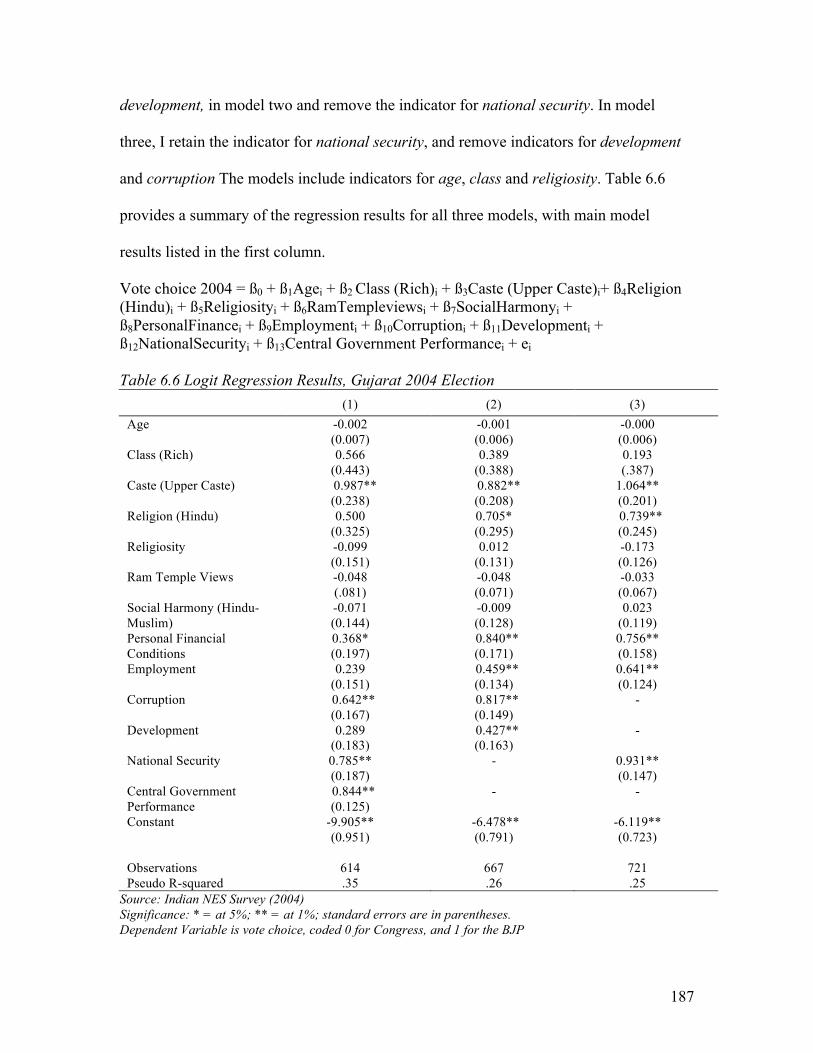
187
development, in model two and remove the indicator for national security. In model
three, I retain the indicator for national security, and remove indicators for development
and corruption The models include indicators for age, class and religiosity. Table 6.6
provides a summary of the regression results for all three models, with main model
results listed in the first column.
Vote choice 2004 = ß0 + ß1Agei + ß2 Class (Rich)i + ß3Caste (Upper Caste)i+ ß4Religion (Hindu)i + ß5Religiosityi + ß6RamTempleviewsi + ß7SocialHarmonyi + ß8PersonalFinancei + ß9Employmenti + ß10Corruptioni + ß11Developmenti + ß12NationalSecurityi + ß13Central Government Performancei + ei Table 6.6 Logit Regression Results, Gujarat 2004 Election
(1) (2) (3) Age -0.002
(0.007) -0.001 (0.006)
-0.000 (0.006)
Class (Rich) 0.566 (0.443)
0.389 (0.388)
0.193 (.387)
Caste (Upper Caste) 0.987** (0.238)
0.882** (0.208)
1.064** (0.201)
Religion (Hindu) 0.500 (0.325)
0.705* (0.295)
0.739** (0.245)
Religiosity -0.099 (0.151)
0.012 (0.131)
-0.173 (0.126)
Ram Temple Views -0.048 (.081)
-0.048 (0.071)
-0.033 (0.067)
Social Harmony (Hindu-Muslim)
-0.071 (0.144)
-0.009 (0.128)
0.023 (0.119)
Personal Financial Conditions
0.368* (0.197)
0.840** (0.171)
0.756** (0.158)
Employment 0.239 (0.151)
0.459** (0.134)
0.641** (0.124)
Corruption 0.642** (0.167)
0.817** (0.149)
-
Development 0.289 (0.183)
0.427** (0.163)
-
National Security 0.785** (0.187)
- 0.931** (0.147)
Central Government Performance
0.844** (0.125)
- -
Constant -9.905** (0.951)
-6.478** (0.791)
-6.119** (0.723)
Observations 614 667 721 Pseudo R-squared .35 .26 .25
Source: Indian NES Survey (2004) Significance: * = at 5%; ** = at 1%; standard errors are in parentheses. Dependent Variable is vote choice, coded 0 for Congress, and 1 for the BJP
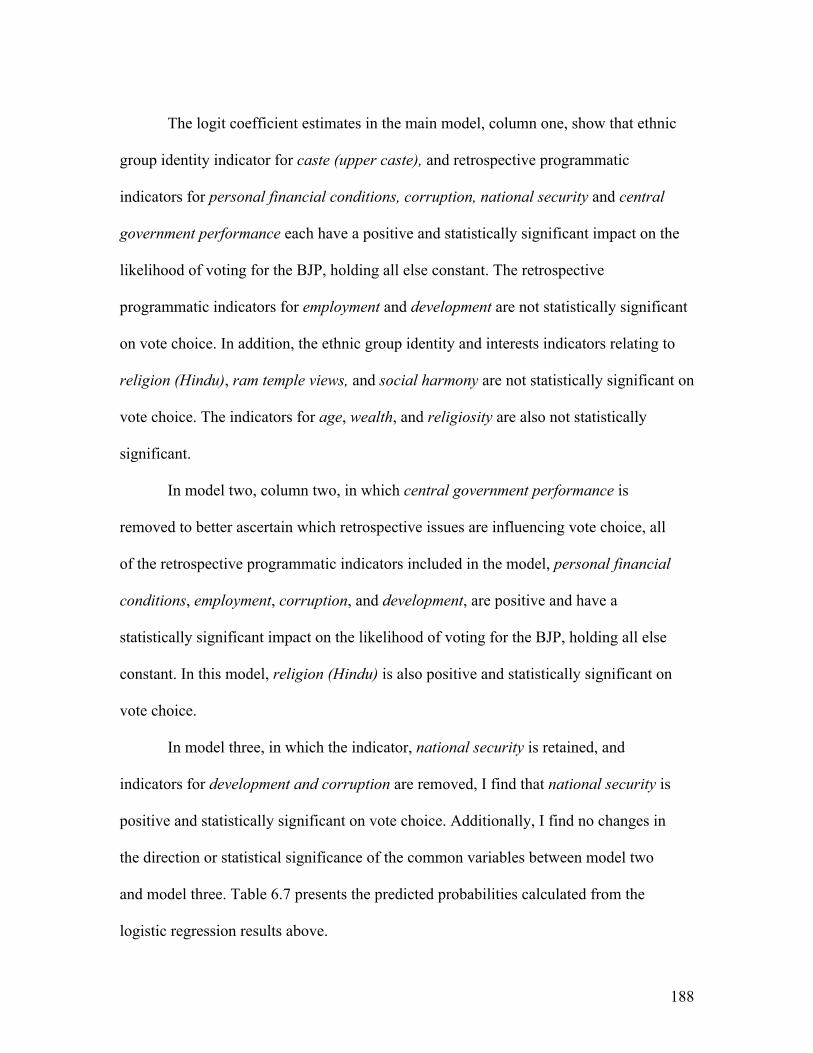
188
The logit coefficient estimates in the main model, column one, show that ethnic
group identity indicator for caste (upper caste), and retrospective programmatic
indicators for personal financial conditions, corruption, national security and central
government performance each have a positive and statistically significant impact on the
likelihood of voting for the BJP, holding all else constant. The retrospective
programmatic indicators for employment and development are not statistically significant
on vote choice. In addition, the ethnic group identity and interests indicators relating to
religion (Hindu), ram temple views, and social harmony are not statistically significant on
vote choice. The indicators for age, wealth, and religiosity are also not statistically
significant.
In model two, column two, in which central government performance is
removed to better ascertain which retrospective issues are influencing vote choice, all
of the retrospective programmatic indicators included in the model, personal financial
conditions, employment, corruption, and development, are positive and have a
statistically significant impact on the likelihood of voting for the BJP, holding all else
constant. In this model, religion (Hindu) is also positive and statistically significant on
vote choice.
In model three, in which the indicator, national security is retained, and
indicators for development and corruption are removed, I find that national security is
positive and statistically significant on vote choice. Additionally, I find no changes in
the direction or statistical significance of the common variables between model two
and model three. Table 6.7 presents the predicted probabilities calculated from the
logistic regression results above.
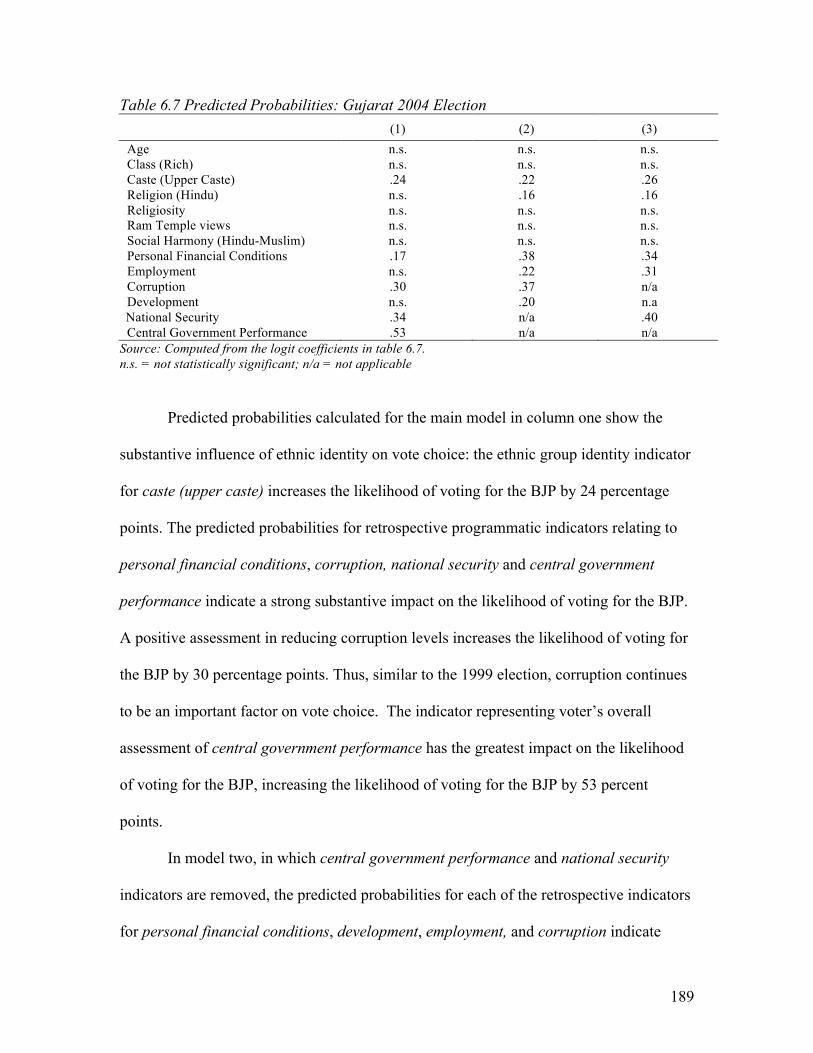
189
Table 6.7 Predicted Probabilities: Gujarat 2004 Election (1) (2) (3) Age n.s. n.s. n.s. Class (Rich) n.s. n.s. n.s. Caste (Upper Caste) .24 .22 .26 Religion (Hindu) n.s. .16 .16 Religiosity n.s. n.s. n.s. Ram Temple views n.s. n.s. n.s. Social Harmony (Hindu-Muslim) n.s. n.s. n.s. Personal Financial Conditions .17 .38 .34 Employment n.s. .22 .31 Corruption .30 .37 n/a Development n.s. .20 n.a National Security .34 n/a .40 Central Government Performance .53 n/a n/a
Source: Computed from the logit coefficients in table 6.7. n.s. = not statistically significant; n/a = not applicable
Predicted probabilities calculated for the main model in column one show the
substantive influence of ethnic identity on vote choice: the ethnic group identity indicator
for caste (upper caste) increases the likelihood of voting for the BJP by 24 percentage
points. The predicted probabilities for retrospective programmatic indicators relating to
personal financial conditions, corruption, national security and central government
performance indicate a strong substantive impact on the likelihood of voting for the BJP.
A positive assessment in reducing corruption levels increases the likelihood of voting for
the BJP by 30 percentage points. Thus, similar to the 1999 election, corruption continues
to be an important factor on vote choice. The indicator representing voter’s overall
assessment of central government performance has the greatest impact on the likelihood
of voting for the BJP, increasing the likelihood of voting for the BJP by 53 percent
points.
In model two, in which central government performance and national security
indicators are removed, the predicted probabilities for each of the retrospective indicators
for personal financial conditions, development, employment, and corruption indicate
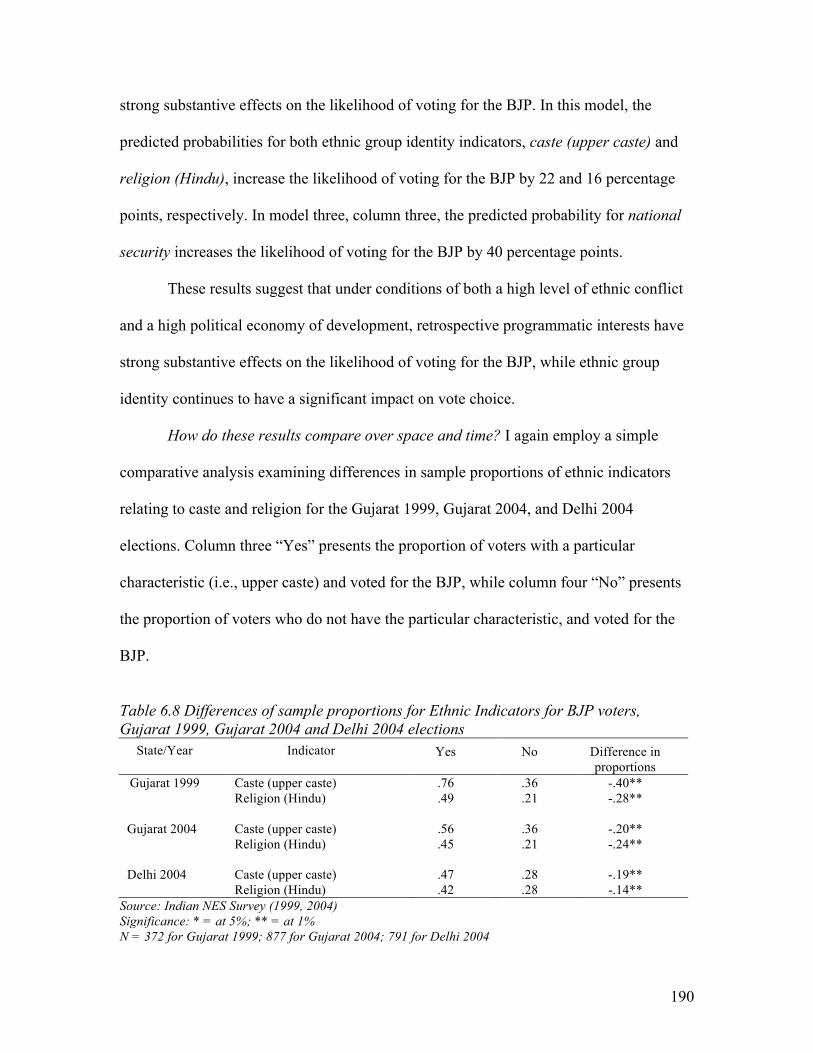
190
strong substantive effects on the likelihood of voting for the BJP. In this model, the
predicted probabilities for both ethnic group identity indicators, caste (upper caste) and
religion (Hindu), increase the likelihood of voting for the BJP by 22 and 16 percentage
points, respectively. In model three, column three, the predicted probability for national
security increases the likelihood of voting for the BJP by 40 percentage points.
These results suggest that under conditions of both a high level of ethnic conflict
and a high political economy of development, retrospective programmatic interests have
strong substantive effects on the likelihood of voting for the BJP, while ethnic group
identity continues to have a significant impact on vote choice.
How do these results compare over space and time? I again employ a simple
comparative analysis examining differences in sample proportions of ethnic indicators
relating to caste and religion for the Gujarat 1999, Gujarat 2004, and Delhi 2004
elections. Column three “Yes” presents the proportion of voters with a particular
characteristic (i.e., upper caste) and voted for the BJP, while column four “No” presents
the proportion of voters who do not have the particular characteristic, and voted for the
BJP.
Table 6.8 Differences of sample proportions for Ethnic Indicators for BJP voters, Gujarat 1999, Gujarat 2004 and Delhi 2004 elections
State/Year Indicator Yes No Difference in proportions
Gujarat 1999 Caste (upper caste) .76 .36 -.40** Religion (Hindu) .49 .21 -.28** Gujarat 2004 Caste (upper caste) .56 .36 -.20** Religion (Hindu) .45 .21 -.24** Delhi 2004 Caste (upper caste) .47 .28 -.19** Religion (Hindu) .42 .28 -.14**
Source: Indian NES Survey (1999, 2004) Significance: * = at 5%; ** = at 1% N = 372 for Gujarat 1999; 877 for Gujarat 2004; 791 for Delhi 2004

191
The results of the sample proportions above indicate that ethnic identity relating
to being upper caste or Hindu is more of a distinguishing feature of voter support for the
BJP in Gujarat in the 1999 election compared to in the 2004 election. The results also
suggest that ethnic identity relating to being upper caste or Hindu is more of a
distinguishing feature of voter support for the BJP in Gujarat than in Delhi in the 2004
election. With Gujarat experiencing a much higher level of ethnic conflict than Delhi in
both the 1999 and 2004 elections, these results support ERV’s prediction that the relative
influence of ethnic group identity on vote choice and explaining voter support for the BJP
would be generally stronger in Gujarat than in Delhi.
In summary, the analysis of voting behavior in the 2004 national election in
Gujarat shows that the effects of ethnic group identity associated with being upper caste
and Hindu continues to be significantly associated with voter support for the BJP in
Gujarat, although the above comparative analysis examining differences in sample
proportions of ethnic indicators relating to caste and religion over time suggests that
being upper caste or Hindu was more of a distinguishing feature associated with BJP
support in the 1999 election than compared to in the 2004 election in Gujarat.
The results from the logistical regression analysis and predicted probabilities also
indicate that a range of retrospective programmatic concerns, relating to personal
financial conditions, development, employment, corruption and national security, had
strong substantive effects on the likelihood of voting for the BJP in the 2004 election in
Gujarat.

192
Under conditions marked by a lessoning of violent ethnic conflict (i.e. no Kargil
War, no ethnic rioting in the state) but continued heightened ethnic tensions, and a
stronger political economy of development with high economic growth, these empirical
findings of voting behavior in the 2004 election in Gujarat, I argue, support ERV theory’s
prediction that retrospective programmatic interests would play a stronger role in
explaining voter support for the BJP, while ethnic group identity and interests also
continue to have a strong, though relatively less extreme, influence in explaining voter
support for the BJP, compared to in the 1999 election, most closely represented by
scenario 1 in table 3.1
Gujarat,2009Election
The 2009 national election witnessed a continuing dominance of the BJP in
Gujarat. The state experienced five years of strong economic growth from 2004 to
2009, and although violent ethnic conflict was significantly abated, ethnic tensions
between Hindus and Muslims remained a prevalent aspect of Gujarati society. The
BJP, which had become deeply associated with the state’s chief minister, Narendra
Modi, captured an additional seat and won the 2009 election.
The 2009 post-poll national elections survey used for the following analysis
sampled 954 respondents in Gujarat. Subtracting the 31 respondents who indicated that
they voted for a small regional party leaves a sample size of 923 respondents who either
voted for the BJP or the Congress party. A full list of the descriptive statistics for the
Gujarat 2009 election analysis is listed in table 6, Appendix B.
As noted in the analysis of voting behavior in Delhi in the 2009 election in
Chapter 5, the interview schedule used in the 2009 NES is different from the 2004

193
NES, with important implications for data analysis.309 Due to the nature of the 2009
election survey data, which includes variables with very different sample sizes, the
first logistic regression model includes only variables which have the full sample size
to test for the effects of ethnic group identity interests and retrospective programmatic
interests on the likelihood of voting for the BJP. Then, to better ascertain which
retrospective issues are influencing vote choice, I remove the indicator central
government performance, and add individual indicators of retrospective programmatic
voting to the model, which each have a much reduced sample size. The results are
listed in models, 2, 3, and 4.
The main logit model in column one includes indicators of ethnic group
identity: (i.e., caste and religion), and one indicator of retrospective programmatic
voting (i.e., central government performance). The model also includes indicators for
age, class and religiosity. Table 6.9 provides a summary of the logistic regression
results.
309Whilethesamesetofsurveyquestionswasaskedtoallrespondentsinthe2004NES,bycontrast,fivesetsofquestionnaires,includingbothcommonquestionsanduniquequestions,wererandomlyadministeredtorespondentsinthe2009NES.Thus,somesurveyquestions(i.e.class,caste,religion,religiosity,age,centralgovernmentperformance)wereadministeredtoallrespondents,whileothers(includingmanywhichwereaskedtoallrespondentsin2004)wererandomlyadministeredtoone‐fifthofallrespondents.Asaresultofthissplitsampleinterviewschedule,theGujarat2009surveydatausedinthisanalysisincludessomevariableswithasamplesizeof1000,andothervariableswithasamplesizecloserto200.
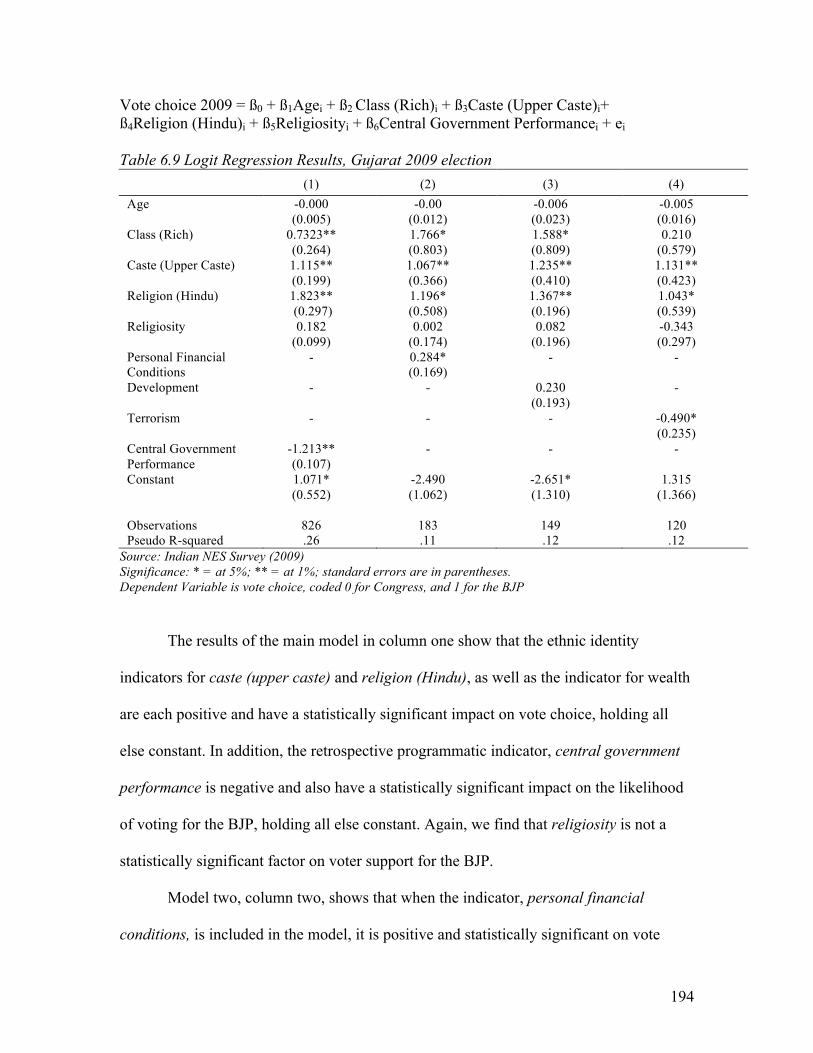
194
Vote choice 2009 = ß0 + ß1Agei + ß2 Class (Rich)i + ß3Caste (Upper Caste)i+ ß4Religion (Hindu)i + ß5Religiosityi + ß6Central Government Performancei + ei Table 6.9 Logit Regression Results, Gujarat 2009 election
(1) (2) (3) (4) Age -0.000
(0.005) -0.00
(0.012) -0.006 (0.023)
-0.005 (0.016)
Class (Rich) 0.7323** (0.264)
1.766* (0.803)
1.588* (0.809)
0.210 (0.579)
Caste (Upper Caste) 1.115** (0.199)
1.067** (0.366)
1.235** (0.410)
1.131** (0.423)
Religion (Hindu) 1.823** (0.297)
1.196* (0.508)
1.367** (0.196)
1.043* (0.539)
Religiosity 0.182 (0.099)
0.002 (0.174)
0.082 (0.196)
-0.343 (0.297)
Personal Financial Conditions
- 0.284* (0.169)
-
-
Development - - 0.230 (0.193)
-
Terrorism - - -
-0.490* (0.235)
Central Government Performance
-1.213** (0.107)
-
- -
Constant 1.071* (0.552)
-2.490 (1.062)
-2.651* (1.310)
1.315 (1.366)
Observations 826 183 149 120 Pseudo R-squared .26 .11 .12 .12
Source: Indian NES Survey (2009) Significance: * = at 5%; ** = at 1%; standard errors are in parentheses. Dependent Variable is vote choice, coded 0 for Congress, and 1 for the BJP
The results of the main model in column one show that the ethnic identity
indicators for caste (upper caste) and religion (Hindu), as well as the indicator for wealth
are each positive and have a statistically significant impact on vote choice, holding all
else constant. In addition, the retrospective programmatic indicator, central government
performance is negative and also have a statistically significant impact on the likelihood
of voting for the BJP, holding all else constant. Again, we find that religiosity is not a
statistically significant factor on voter support for the BJP.
Model two, column two, shows that when the indicator, personal financial
conditions, is included in the model, it is positive and statistically significant on vote

195
choice. In model three, column three, when the indicator development is included, we
find that it is not statistically significant on vote choice. Lastly, in model four, column
four, when the indicator terrorism is included, representing voter assessment of
government performance in addressing the 2009 Mumbai terrorist attacks, it is negative
and has a statistically significant impact on the likelihood of voting for the BJP. Table
6.10 presents the predicted probabilities calculated from the logistic regression results
above.
Table 6.10 Predicted Probabilities, Gujarat 2009 election
(1) (2) (3) (4) Age n.s. n.s. n.s. n.s. Class (Rich) .17 .38 .35 n.s. Caste (Upper Caste) .26 .26 .30 .27 Religion (Hindu) .40 .27 .32 .24 Religiosity n.s. n.s. n.s. n.s. Personal Financial Conditions n/a .27 n/a n/a Development n/a n/a n.s. n/a Terrorism n/a n/a n/a -.35 Central Govt. Performance -.68 n/a n/a n/a
Source: Computed from the logit coefficients. n.s. = not statistically significant; n/a = not applicable
The predicted probabilities in the main model show that ethnic identity indicators
for caste (upper caste) and religion (Hindu) increase the likelihood of voting for the BJP
by 26 and 40 percentage points respectively. This suggests that being upper caste and
Hindu continues to have strong effects on the likelihood of voting for the BJP in Gujarat.
Additionally, a high level of wealth also significantly increases the likelihood of voting
for the BJP by 17 percentage points. The retrospective programmatic indicator, central
government performance, has a large negative impact on vote choice: a high level of
satisfaction with the performance of the incumbent Congress-led UPA government is
associated with a 68 percentage point decrease in the likelihood of voting for the BJP.

196
The results of model two, when the retrospective programmatic indicator,
personal financial conditions, is added to the model, is initially somewhat surprising:
personal financial conditions is associated with a 27 percentage point increase in the
likelihood of voting for the BJP. In other words, the predicted probabilities suggest that a
positive assessment of government performance related to personal financial conditions is
associated with a 27 percentage point increase in the likelihood of voting for the BJP. If
voters in Gujarat are focused only on central government performance, then it is hard to
explain why a positive assessment of the Congress-led central government performance
on this programmatic issue would be associated with a higher likelihood of voter support
for the BJP in the 2009 election.
However, a look at the priorities of BJP and Congress voters indicates important
shifts with regard to emphasizing the work of state government versus the central
government over time. In the 1999 election, BJP supporters in Gujarat on average
indicated that they placed a significantly higher degree of importance on the work of the
incumbent-led BJP government at the center than Congress supporters (33.9 percent
versus 19.49 percent).
In the 2009 election, the priorities shifted: BJP voters on average placed greater
importance on the work of the BJP-led state level government, whereas Congress
supporters now placed greater importance on the work of the Congress-led central
government. Table 6.11 summarizes Gujarati voters’ priorities with regard to the work of
the state and central government in the 2009 election.

197
Table 6.11 Gujarat voter priorities in 2009: central versus state level government Neither State
level Both Central
level Other
All Voters 3.25 30.23 22.10 26.87 1.19 BJP voters 3.42 45.30 22.65 11.54 1.26 Congress voters 3.08 14.73 21.54 42.64 1.28
Source: Indian NES Survey (2009)
The table shows that 45 percent of BJP voters were more focused on the work of
the state level government in the 2009 election in Gujarat, compared to 11 percent of BJP
voters who prioritized the work of the central government. Congress voter priorities were
the complete inverse of BJP voters in Gujarat: over 42 percent of Congress voters
focused on the work of the central level government, while about 14 percent of Congress
voters indicated that they focused more on the work of the state level government.
Further analysis of BJP voters in the 2009 election in Gujarat indicates that BJP
voters who indicated that personal financial conditions in India were either “better” or
“much better” compared to five years ago were on average more likely to emphasize the
work of state level government rather than the central level government.310 Thus, I posit
that the positive value of the predicted probability for personal financial conditions is, in
part, a retrospective programmatic assessment of state level performance of the BJP-led
government.311 This is again suggestive of an interesting extension of ERV that different
voters may prioritize and focus on different levels of government performance when
voting in a national election.
310Acrosstabulationoftherelationshipofthevariablepersonalfinancialconditionswiththevariablevoterpriorities,regardingcentralversusstatelevelgovernment,showsthatforty‐threepercentofBJPvoterswhoindicatedthatpersonalfinancialconditionswere“better”werefocusedontheworkofthestatelevelgovernment.Only9percentofBJPvoterswhoindicatedthatpersonalfinancialconditionswere“better”emphasizedtheworkofthecentrallevelgovernment.TheremainingBJPvoterseitherfocusedonbothlevelsofgovernmentordeclinedtospecify.311InthenextsectionfocusingoncasestudiesofindividualvotersinAhmedabad,IfindthatfiftypercentofvotersinterviewedindicatethattheiropinionofBJPChiefMinisterNarendraModiaffectstheirvotechoiceinthenationalelections.

198
In the results of model three, when the retrospective programmatic indicator
development is added to the model, only ethnic identity indicators for caste and religion,
and a high level of wealth, have any substantive effects on the likelihood for voting for
the BJP. The results of model four, show that terrorism is associated with a large
negative substantive effect on voter support for the BJP: the more satisfied one is with
government performance in handling the 2009 Mumbai terror attacks, the less likely one
is to vote for the BJP by 35 percentage points. This suggests that a retrospective
programmatic assessment of government performance on issues relating to terrorism and
national security continues to be a very important factor of vote choice and distinguishing
voter support for the BJP in Gujarat.
As noted in the Delhi 2009 election analysis, the 2009 NES survey administered a
distinctly different question on the Ram temple issue compared to the 1999 and 2004
surveys. The table below presents the results from the 2009 NES survey question: What
would you suggest be built on the site [at Ayodhya]?312
Table 6.12 What should be built at the Ayodhya site? (Gujarat 2009)
Neither Mosque Temple Both No opinion All Voters 13 9 29 28 20 Congress voters 9 5 9 12 11 BJP voters 4 4 20 16 9
Source: Indian NES Survey (2009) Figures above are in number of respondents.
The results show that a larger number of BJP voters surveyed favor a Hindu
temple to be built at the Ayodhya site over other options. By comparison, BJP voters
312Inthe1999and2004survey,adifferentbutrelatedquestionwasasked:OnthesitewhereBabriMasjidwassituatedonlyRamtempleshouldbebuilt(agree,noopinion,disagree).Thisquestionwasaskedtoallsurveyrespondentsinthe2004survey,whereastheAyodhya‐relatedquestionwasaskedtoonlyone‐fifthoftherespondentsinthe2009survey.Thesamplesizeforthisquestionis99.

199
surveyed in the 2009 election in Delhi were more inclined to favor both a temple and a
mosque to be built at the Ayodhya site. Although this is a very small sample size, it is
somewhat suggestive that the ethnic group interest relating to building the Ram temple
was a factor for some BJP voters in the 2009 election in Gujarat.313
The analysis of 2009 election survey data for Gujarat shows that ethnic group
identity indicators for religion (Hindu) and caste (upper caste) have a strong impact on
the likelihood of voting for the BJP. Additionally, the analysis has shown that
retrospective programmatic indicators relating to central government performance,
personal financial conditions, and terrorism also have statistically significant and strong
substantive effects on the likelihood of voting for the BJP. In addition, the analysis
indicates that a high level of wealth is associated with a higher likelihood of voting for
the BJP.
How do these results compare over time? Table 6.13 presents the results of the
difference in sample proportions for indicators of caste and religion in the 1999, 2004
and 2009 elections for BJP voters in Gujarat. Column 3 presents the proportion of voters
with a particular characteristic (i.e. being upper caste) who voted for the BJP, while
column 4 presents the proportion of voters who do not have the characteristic (i.e. non
upper-caste) and voted for the BJP.
313However,Ramtempleviews,wasnotstatisticallysignificantinthepreviousanalysisofthe2004electioninGujarat.Thus,wecannotsaywiththisverysmallsamplesizethatthisfindingholdsanystatisticalsignificance.

200
Table 6.13 Differences of sample proportions for indicators of caste and religion for BJP voters, Gujarat 1999, 2004 and 2009 elections
Year Indicator Yes No Difference in proportions
1999 Caste (upper caste) .76 .36 -.40** Religion (Hindu) .49 .21 -.28**
2004 Caste (upper caste) .56 .36 -.20** Religion (Hindu) .45 .21 -.24**
2009 Caste (upper caste) .69 .43 -.26** Religion (Hindu) .54 .27 -.27**
Source: Indian NES Survey (1999, 2004, 2009) Significance: * = at 5%; ** = at 1% N = 372 (1999); 877 (2004); 923(2009)
While the differences with respect to these ethnic indicators for BJP voters
markedly narrowed between the 1999 election and the 2004 election, the 2009 results
show a slight increase in the degree of difference in upper caste versus non-upper caste
voter support for the BJP, and Hindu versus non-Hindu voter support for the BJP.
If we look at the indicator for caste (upper caste), we find that 76 percent of upper
caste voters voted for the BJP in the 1999 election. Five years later, this percentage of
upper caste voters who voted for the BJP was markedly reduced to 56 percent in the 2004
election. Yet, by the 2009 election, the number of upper caste voters who voted for the
BJP increased to 69 percent. Though we find a marked decrease in the proportion of
upper caste voters who voted for the BJP from 1999 to 2004, this overall trend from 1999
to 2009 suggests that being upper caste continues to be a distinguishing characteristic of
BJP voters in Gujarat.
The same is true when we look at the results for the indicator for religion (Hindu).
Though we find a slight decrease in the proportion of Hindu voters who voted for the BJP
from 1999 to 2004, the overall trend indicates a generally consistent proportion of Hindus
who voted for the BJP from 1999 to 2009.

201
By contrast, the percentage of Hindus who voted for the BJP in the 2009 election
in Delhi is markedly lower than in Gujarat (i.e. 42 percent in Delhi versus 54 percent in
Gujarat), and has decreased incrementally over the 1999-2009 timeframe. Thus, within
the context of the BJP’s ethno-political mobilization efforts to support the construction of
the Ram temple, which was keenly felt in Gujarat, and ongoing ethnic tensions between
Hindus and Muslims, we find that Hindus continue to be a strong base of support for the
BJP in Gujarat.
The analysis of voting behavior in the 2009 election in Gujarat shows that, while
being upper caste or Hindu was more of a distinguishing feature associated with BJP
support in the 1999 election compared to the 2004 election in Gujarat, the relative
influence of ethnic group identity continues to play a significant impact on voting
behavior and explaining voter support for the BJP in Gujarat in the 2009 election. In
addition, the analysis shows retrospective programmatic interests, in particular relating to
personal financial conditions and national security, were also important factors
influencing voter support for the BJP.
Under conditions of a high level of political economy of development and a
medium level of ethnic conflict, which characterized the context of the 2009 election in
Delhi, ERV predicts that retrospective programmatic interests would have a strong
influence in explaining voter support for the BJP, while ethnic group identity and
interests would also have a strong, though somewhat less extreme, influence in
explaining voter support for the BJP. Though the overall level of ethnic conflict declined
from 1999 to 2009, these findings suggest that ethnic identity continues to be a strong,
though less extreme, factor influencing voting behavior in Gujarat. In summary, these

202
empirical results indicate the strong influence of both ethnic and programmatic interests
in explaining voter support for the BJP in Gujarat in 2009. These empirical results I argue
support ERV theory as a plausible means of explaining voter support for the BJP in
Gujarat in the 2009 election, most closely represented by scenario 1 in 3.1.
Ahmedabad:CaseStudiesAnalysis,1999‐2009
This section presents an analysis of case studies of 37 voters in Ahmedabad, the
largest city in Gujarat and the fifth largest city in India. The first section of this chapter
addressed the history of episodes of violent ethnic conflict that have taken place in
Gujarat. Ahmedabad, in particular, has experienced several episodes of large-scale ethnic
violence over the past four decades, most notably in 1969, 1985-86, 1990, 1992 and
2002.314
Ahmedabad has long been divided economically into the more affluent and newer
western bank, and the older working class and poorer eastern bank, with the Sabarmati
River separating the two sections.315 However, after the 2002 riots, ghettoization
increased markedly, with the east side home to Muslims and Dalits, and the west side
home to Hindus.316 Thus, unlike the New Delhi cases, which are examples of urban
voting behavior in a large Indian city with low to moderate levels of ethic conflict and
violence, the Ahmedabad cases provide insight into urban voting behavior in the context
314ThislistdoesnotincludeeveryepisodeofethnicviolenceinAhmedabadoverthepast40years.315Burman,“TheTwoBanksoftheRiver,”Economic&PoliticalWeekly,September18,1976.SeealsoYagnikandSheth,TheShapingofModernGujarat,pgs.229‐230.Theeasternbankitselfhastwosections,the“oldcity”builtinthe15thcenturyduringtheeraoftheGujaratSultanateneartheriver,andtheeasternbeltontheeastsideoftheoldcity,developedinthe20thcenturytohouselaborersworkinginthetextilemills.Thetwosectionsoftheeasternbanktogetheraredistinctlydifferenteconomicallyandsociallyfromthemoreaffluentwestbank.316InterviewwithMahashwetaJani,February12,2011.
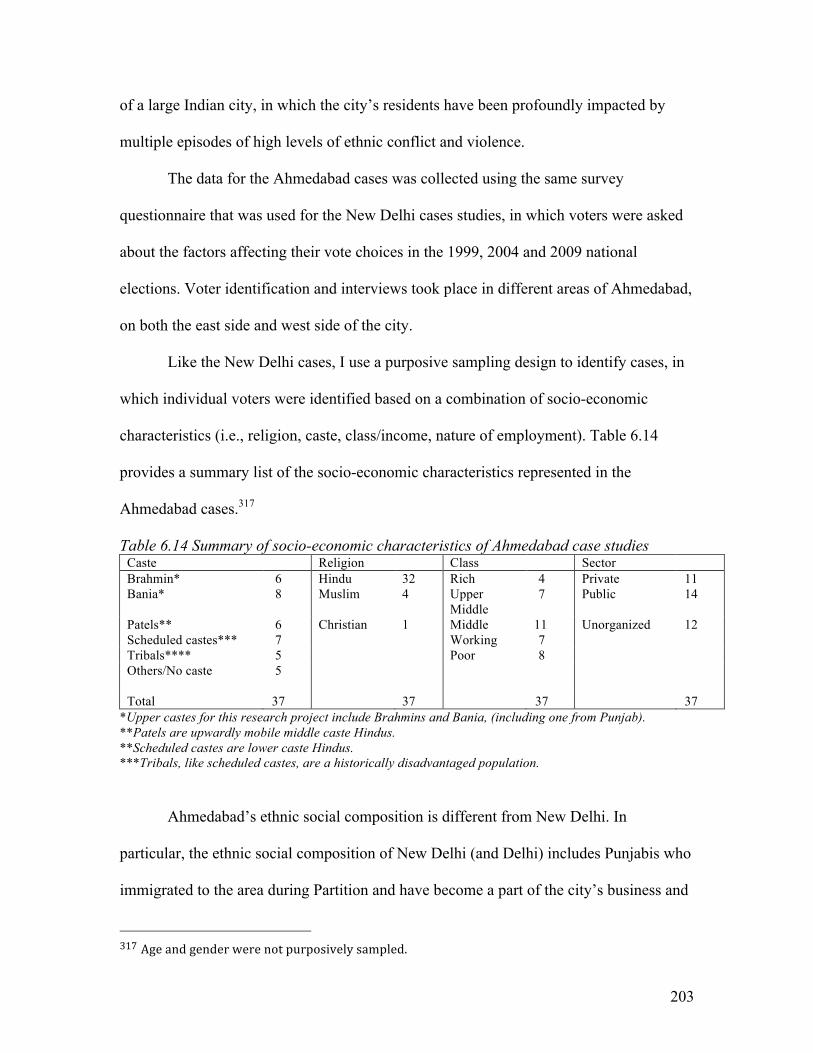
203
of a large Indian city, in which the city’s residents have been profoundly impacted by
multiple episodes of high levels of ethnic conflict and violence.
The data for the Ahmedabad cases was collected using the same survey
questionnaire that was used for the New Delhi cases studies, in which voters were asked
about the factors affecting their vote choices in the 1999, 2004 and 2009 national
elections. Voter identification and interviews took place in different areas of Ahmedabad,
on both the east side and west side of the city.
Like the New Delhi cases, I use a purposive sampling design to identify cases, in
which individual voters were identified based on a combination of socio-economic
characteristics (i.e., religion, caste, class/income, nature of employment). Table 6.14
provides a summary list of the socio-economic characteristics represented in the
Ahmedabad cases.317
Table 6.14 Summary of socio-economic characteristics of Ahmedabad case studies Caste Religion Class Sector Brahmin* 6 Hindu 32 Rich 4 Private 11 Bania* 8 Muslim 4
Upper Middle
7 Public 14
Patels** 6 Christian 1 Middle 11 Unorganized 12 Scheduled castes*** 7 Working 7 Tribals**** 5 Poor 8 Others/No caste 5 Total 37 37 37 37
*Upper castes for this research project include Brahmins and Bania, (including one from Punjab). **Patels are upwardly mobile middle caste Hindus. **Scheduled castes are lower caste Hindus. ***Tribals, like scheduled castes, are a historically disadvantaged population.
Ahmedabad’s ethnic social composition is different from New Delhi. In
particular, the ethnic social composition of New Delhi (and Delhi) includes Punjabis who
immigrated to the area during Partition and have become a part of the city’s business and
317Ageandgenderwerenotpurposivelysampled.

204
trading community. They are often associated with supporting the BJP. Ahmedabad (and
Gujarat) also has its own prominent “bania”318 merchant and trading community, but in
addition, it also has an ethnic group known as the Patels, or Patidars.
The Patels are historically from agricultural and landowning communities, whose
wealth and social status increased in the 20th century, partly as a result of their
participation in India’s Green and White Revolutions to increase agricultural and milk
production.319 Many members of the Patel community left their original communities and
have since become part of the urban educated middle class. Patels are estimated to make
up about twenty percent of the population.320 Together, the Brahmins and Banias, and the
Patels, resented the reservation policies advocated by the Congress party in the 1980s,
and were considered an important political voting block for the newly emerging BJP
during that time. All three castes are included in the Ahmedabad case study sample.
Table 6.15 on the following page presents the details of each voter interviewed for this
study and their corresponding vote choices for the 1999, 2004 and 2009 national
elections.
318IamusingthenowcommonlyusedtermBania.However,theoriginaltermforthiscastegroupisVaniya.YagnikandShethnote,“TraderswerecalledVanikorVanijah,whichevolvedoverthecenturiestoVaniya,acastetermwhichtodayreferstobothHindusandJains…Thecommonlyused‘Baniya”isacorruptionofVaniyausedfirstbythePortugueseandthenbytheDutchandEnglishasacollectivenounforallGujaratitradersirrespectiveofreligion,”p.21.319Ibid,p.235.320Patel,Priyavadan,“SectarianMobilization,CommunalPolarizationandFactionalism,”p.14.

205
Table 6.15 Ahmedabad Cases
Table 6.15 shows that voter support for the BJP in the Ahmedabad cases remained
strong and even gained in strength from 1999 to 2009. In the 1999 election, nineteen
voters voted for the BJP; five years later, the number increased to 20. In the 2009
election, the number of voters increased to 22. By contrast, voter support for the BJP in
the New Delhi cases reduced sharply during the same timeframe. Table 6.16 shows the
contrast in voter support for the BJP in the Ahmedabad and New Delhi cases in the 1999,
2004 and 2009 national elections. These patterns of voter support for the BJP in the New
Delhi and Ahmedabad case studies broadly reflect the trends in voter support for the BJP
in Gujarat and Delhi during this timeframe.

206
Table 6.16 Ahmedabad and New Delhi Cases: number of BJP voters Election Year
Ahmedabad New Delhi
1999 19 19 2004 20 10 2009 22 6
A couple of general points of comparison between the Ahmedabad cases and the
New Delhi cases are worth noting. First, in the New Delhi cases, a majority of upper
caste Hindus switched their vote away from the BJP from 1999 to 2009. By contrast, in
the Ahmedabad cases, I found continued upper caste support for the BJP during the 1999
to 2009 timeframe. In the 1999 election, 11 out of 14 upper caste respondents voted for
the BJP. In the 2009 election, 12 out of 14 upper caste respondents voted for the BJP. The
majority of the upwardly mobile Patels, 4 out of 6, also consistently voted for the BJP.
Only one upper caste respondent, an upper income Kashmiri Brahmin, switched his vote
away from the BJP to Congress during this timeframe. Thus, the upper caste Brahmins
and Banias, and the Patels, are a strong vote block for the BJP for the Ahmedabad voters
interviewed for this study.
In addition to this generally stable trend of upper caste support for the BJP, the
Ahmedabad cases indicate that several lower income voters, from a scheduled caste or
tribe, switched their support toward the BJP in later elections. In particular, five low-
income respondents working in the unorganized sector voted for the Congress party in
the 1999 election, but indicated that they switched their vote to the BJP in later
elections.321 Taking together these two trends, we find in the Ahmedabad cases both a
stable trend in upper caste support for the BJP, combined with individuals from other
321ThefivecasesthatswitchedtheirvotefromtheCongresspartytotheBJParecases36,18,19,20and37.

207
caste and income groups in the city, namely lower income and lower caste voters, who
shifted their support toward the BJP.
A second notable difference between the New Delhi cases and the Ahmedabad
cases is the presence (or absence) of Muslim voter support for the BJP. Two Muslim
respondents interviewed in New Delhi indicated that they voted for the BJP. By contrast
no Muslim respondents interviewed in Ahmedabad indicated that they had voted for the
BJP in any of the three national elections.
Lastly, a notable similarity is that the Ahmedabad cases do not present a pattern
linking higher levels of religiosity with increased voter support for the BJP, for either the
voters who consistently voted for the BJP over the three elections, or the voters who
switched their vote to the BJP.322 This result suggests that religiosity is not a particularly
good indicator of BJP support in Ahmedabad, and is consistent with similar results found
in the New Delhi cases.
In the New Delhi case studies analysis, I discovered four patterns of urban voting
behavior to explain changes in electoral support for the BJP from 1999 to 2009: 1)
Retrospective Programmatic Voting, 2) Weak Ethnic voting, 3) Strong Ethnic Voting, and
4) Party loyalty. My analysis of the Ahmedabad case studies finds these four
predominant patters of urban voting behavior to explain changes in electoral support for
the BJP in Ahmedabad from 1999 to 2009. The following table presents a summary of
322Ofthe18AhmedabadcaserespondentswhoconsistentlyvotedfortheBJPinallthreenationalelections,eightvotersindicatedthatreligionhadremainedthesamelevelofimportance,whileanothereightvotersindicatedthatreligionhadincreasedinimportance.Twovotersdeclinedtoanswerthequestion.Forthefiveswingvoters,onevoterindicatedthatreligionwasnotimportanttohim,onevoterindicatedthatreligionhadincreasedinimportance,andathirdvoterindicatedthatreligionhadremainedthesamelevelofimportance.Twoswingvotersdeclinedtocomment.

208
the number of voters for each of the four types of vote patterns for the New Delhi and the
Ahmedabad case studies.
Table 6.17 Summary of Vote Patterns: Ahmedabad and New Delhi Cases
Vote Pattern Ahmedabad New Delhi Type 1: Retrospective Programmatic Voting 19 19 Type 2: Weak Ethnic Voting 6 8 Type 3: Strong Ethnic Voting 5 1 Type 4: Party Loyalty Voting 6 6 Inconclusive 1 1 Total 37 35
The above table shows that the number of retrospective programmatic voters as
well as loyal party voters is the same. However, the number of strong ethnic voters is
clearly different: the Ahmedabad cases include five strong ethnic voters, whereas the
New Delhi cases include only one strong ethnic voter. What do these four patterns of
voting behavior look like with regard to electoral support for the BJP over time? Table
6.18 shows the number of voters for each voting pattern of respondents who voted for the
BJP in the 1999 and the 2009 elections in New Delhi and in Ahmedabad.
Table 6.18 Vote Patterns of BJP voters in Ahmedabad and New Delhi, 1999 & 2009
City/Vote Pattern 1999 Election 2009 Election Ahmedabad Type 1: Retrospective Programmatic Voting 7 11 Type 2: Weak Ethnic Voting 6 6 Type 3: Strong Ethnic Voting 4 3 Type 4: Party Loyalty Voting 2 2 Total BJP Vote 19 22 New Delhi Type 1: Retrospective Programmatic Voting 11 2 Type 2: Weak Ethnic Voting 5 1 Type 3: Strong Ethnic Voting 1 1 Type 4: Party Loyalty Voting 2 2 Total BJP Vote 19 6

209
Table 6.18 begins to uncover the differences in the voting patterns underlying
electoral support for the BJP over time in each city. In the 1999 election, ethnic voting –
both weak ethnic and strong ethnic voting – explains more than half of voter support for
the BJP in the Ahmedabad cases, but about one-third of voter support for the BJP in the
New Delhi cases. In the 2009 election, ethnic voting continues to explain nearly half of
all voter support for the BJP in the Ahmedabad cases, but about one-third of voter
support for the BJP in the New Delhi cases. This suggests that ethnic voting is generally
more influential in explaining voter support for the BJP in the Ahmedabad cases than in
the New Delhi cases. The following section provides a discussion of the four patterns of
voting behavior in the context of the Ahmedabad cases and provides examples of
individual Ahmedabad voters interviewed who exemplify each pattern.
1. Retrospective Programmatic Voting: The first pattern of voting behavior,
Retrospective Programmatic Voting, is characterized by voters who indicate that their
assessment of party performance on specific programmatic issues is the main driver in
their vote choices. Nineteen Ahmedabad case respondents fall into this category of voting
behavior. A particularly strong finding in the New Delhi cases is that nearly all the voters
from the private sector fall into this pattern of voting behavior. By contrast, though a
majority of Ahmedabad respondents with an upper-middle class income or higher and
working in the private sector fall into this category of voting behavior, we also find that
several very low income respondents working in the unorganized sector also display this
pattern of voting behavior.
Case 25 is an upper caste Hindu who owns a large business, representing a very
high income voter from the private sector, and falls into this category of Retrospective

210
Programmatic Voting. When asked if the dispute over the Ram temple in Ayodhya was a
factor in his vote choice, this entrepreneur and business owner responded that he
“recoiled from it,” as well at the BJP’s use of Hindutva.323 Instead, he voted for the BJP
in the 1999 election, because he felt that, “India’s security was in better hands with the
BJP than in Congress.” In the following 2004 and 2009 elections, this large business
owner continued to vote for the BJP, but he said that his ongoing support was largely
based on his positive perception of the party’s ability to handle the economy.
I also found this pattern of Retrospective Programmatic Voting from Ahmedabad
respondents who were employed in the public sector. Case 8 is a science teacher who
voted for the BJP in all three national elections. This voter indicated that political
corruption and national security were the main factors in his vote choice in the 1999 and
2004 elections, while a focus on employment and rising prices were the overarching
interests influencing his vote choice in the 2009 election. Expressing a similar view with
other Ahmedabad voters interviewed for this research, the respondent linked his opinion
and assessment of Chief Minister Modi’s performance at the state level to his vote choice
in the national elections: “If the BJP performs at the Center level like [it does] at the
State,” he noted, “the BJP at the Center is fine.”324325
These two cases provide examples of Retrospective Programmatic Voting
behavior from Ahmedabad voters who work in either the private or public sector, and
323Ahmedabadcasestudy25.324Ahmedabadcasestudy8.325ThesurveyquestionnairefortheAhmedabadcasestudyincludesthefollowingquestion:“DoesyouropinionofChiefMinisterModiaffectyourvotechoiceintheNational/LokSabhaelection?”TheresponsewasnearlysplitbetweenthenumberofrespondentswhorespondedthattheiropinionofModididaffecttheirvotechoiceinthenationalelections(17/37)andthenumberofrespondentswhosaidtheiropinionofModididnotaffecttheirvotechoiceinthenationalelections(16/37).Fourcaserespondentsdidnotanswerthisquestion.

211
with at least a middle class income or higher, whose support for the BJP is largely based
on retrospective programmatic interests.
In addition to these cases of middle or higher income retrospective programmatic
urban voters working in the private or public sector, my case study research identified a
different type of voter in Ahmedabad, who I suggest can be considered a “burgeoning”
retrospective programmatic voter, with a distinctly different socio-economic profile: the
very low-income urban voter who works in the unorganized sector. This type of urban
voter was interviewed both in New Delhi and Ahmedabad (i.e. 12 voters, six for each
city) and represents individuals with very low levels of income, (i.e. approximately U.S.
$1-2 dollars per day).326
The case study interviews revealed that an underlying commonality for this group
of voters in both cities is their near total emphasis on prospects for improved livelihood.
When asked their views about ethnic identity and interests such as Hindutva or the Ram
temple, these voters indicated that they did not focus on these issues when voting, but
instead were concerned about items such as water, sanitation (specifically, access to
toilets), and electricity.
Five Ahmedabad case respondents from this socio-economic group switched their
vote away from the Congress to the BJP in later elections.327 All five of these voters
interviewed make a living as small food or vegetable vendors, and the majority are poor
(though one is working class) and lower caste. Cases 36 and 37 are voters who operate
small vegetable stands and fall into this category of “burgeoning” retrospective
326IntheNewDelhicases,thoughtwoMuslimvotersfromthissocio‐economicstratumvotedfortheBJPinasingleelection,thesevotersmoreoftenvotedfortheCongressparty.327ThefivecasesthatswitchedtheirvotefromtheCongresspartytotheBJParecases36,18,19,20and37.
212
programmatic voting. Case 36, a widow in her 60s, whose family income from two
vegetable stands provides the equivalent of approximately $3-4 dollars per day, indicated
that she had long associated the Congress party with Indira Gandhi, and voted for the
Congress in the 1999 and 2004 elections. But she also indicated that toilets and electricity
had recently come to her neighborhood and she gave the BJP credit for these
improvements and voted for them in the 2009 election, saying that she was “starting to
link changes she sees in the neighborhood to who is in power – BJP or Congress.” She
said that her opinion of Narendra Modi had influenced whom she votes for in the national
election.
Similarly, case 37, who operates one vegetable stand and earns about $1-2 dollars
per day, had also associated the Congress party with Indira Gandhi and working for the
poor. But she switched her voted to the BJP in the 2004 election. “After Modi came, it
was only about him.” Like case respondent 36, this voter linked Modi’s coming to power
with bringing water and toilets to her neighborhood. Thus, she associated the BJP with
Narendra Modi, and Narendra Modi with the possibility of a better livelihood.
While none of these voters indicated that political patronage, such as money,
gifts, employment, or other direct, immediate, exclusive payoff, played a role in their
vote choices, my findings do not provide clear evidence about the role of patronage for
these voters.
Unlike middle and higher income programmatic voters who highlighted concerns
about broader issues such as development, inflation, or national security as primary
factors in their vote choice, these low income urban voters emphasized concerns relating
to better access to public goods provisions, such as water, sanitation, and electricity, and
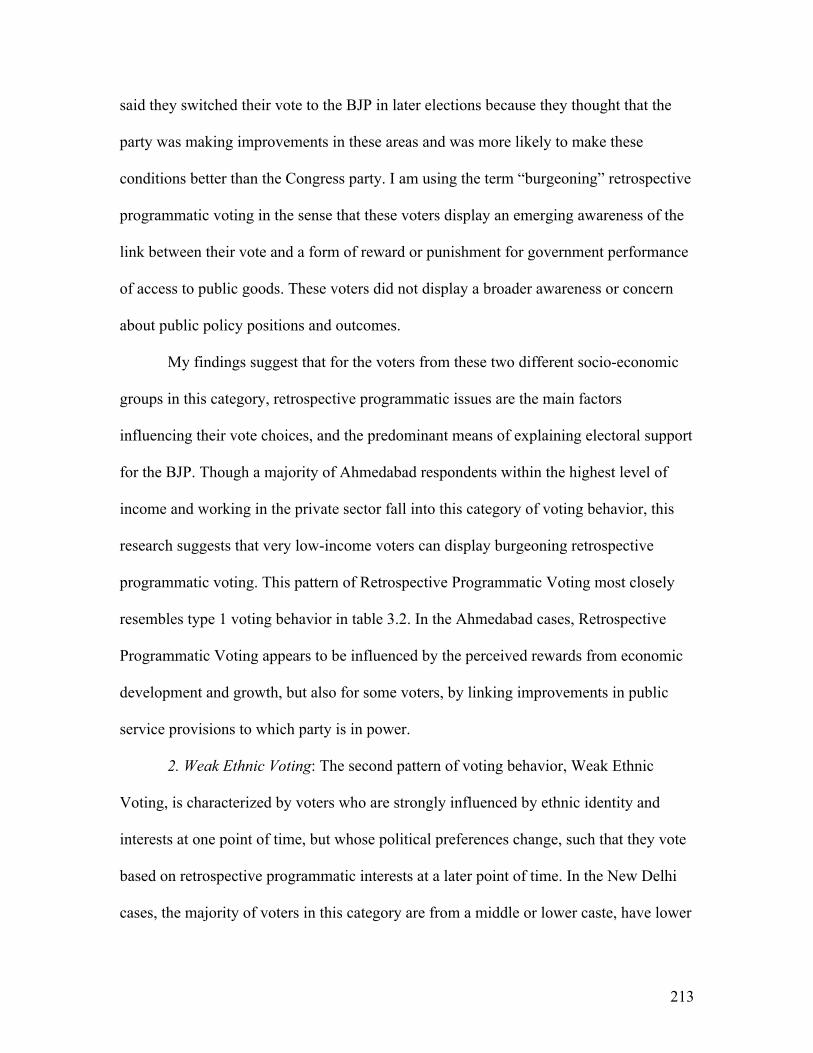
213
said they switched their vote to the BJP in later elections because they thought that the
party was making improvements in these areas and was more likely to make these
conditions better than the Congress party. I am using the term “burgeoning” retrospective
programmatic voting in the sense that these voters display an emerging awareness of the
link between their vote and a form of reward or punishment for government performance
of access to public goods. These voters did not display a broader awareness or concern
about public policy positions and outcomes.
My findings suggest that for the voters from these two different socio-economic
groups in this category, retrospective programmatic issues are the main factors
influencing their vote choices, and the predominant means of explaining electoral support
for the BJP. Though a majority of Ahmedabad respondents within the highest level of
income and working in the private sector fall into this category of voting behavior, this
research suggests that very low-income voters can display burgeoning retrospective
programmatic voting. This pattern of Retrospective Programmatic Voting most closely
resembles type 1 voting behavior in table 3.2. In the Ahmedabad cases, Retrospective
Programmatic Voting appears to be influenced by the perceived rewards from economic
development and growth, but also for some voters, by linking improvements in public
service provisions to which party is in power.
2. Weak Ethnic Voting: The second pattern of voting behavior, Weak Ethnic
Voting, is characterized by voters who are strongly influenced by ethnic identity and
interests at one point of time, but whose political preferences change, such that they vote
based on retrospective programmatic interests at a later point of time. In the New Delhi
cases, the majority of voters in this category are from a middle or lower caste, have lower

214
incomes than retrospective programmatic voters, and half of the respondents work in the
unorganized sector.
However, the distribution of weak ethnic voting behavior in the Ahmedabad cases
is more widespread among socio-economic groups. Of the six weak ethnic voters in
Ahmedabad, four voters are upper caste and work in the private sector, one voter is upper
caste middle class and works in the public sector, and one voter is upper caste middle
class and works in the unorganized sector. This distribution of Weak Ethnic Voting
suggests that, under conditions of a high level of ethnic conflict, the relative political
salience of ethnic group identity and interests can supersede retrospective programmatic
interests, including for some high income voters who share similar socio-economic
characteristics with retrospective programmatic voters. However, similar to weak ethnic
voters in the New Delhi cases, in later elections, as Gujarat experienced increasingly
higher levels of economic growth and development, this category of Ahmedabad voters
became less focused on ethnic issues and identified programmatic issues, particularly
development, concerns about rising prices, and corruption, as much stronger factors
influencing their vote choice.
Cases 15 and 30 are voters who fall into this category of Weak Ethnic Voting.
Case 15 comes from a bania (merchant) family and owns a medium-sized curbside
grocery store. Case 30 is a Patel who manages client relations for a private accounting
firm. Both of their stated incomes place them in a middle class income group. These two
voters emphasized that the Ram temple issue along with positive views of BJP party

215
leadership under Atal Bihari Vajpayee were key factors in their support for the BJP in the
1999 election.328
In later elections, however, these voters indicated that they shifted their focus and
that concerns about development had become a much more important factor influencing
their vote choice. They both linked Chief Minister Modi’s performance at the state level
with improved development conditions, and indicated that their opinion of Modi and his
performance at the state level in turn affected their vote choice in national elections.
Responding to a question about his views about the BJP in the 2009 national election, the
grocery story owner said, “When I go to vote, I think more about Gujarat and what Modi
is doing.”329 The narratives of these two Ahmedabad voters, who indicate the importance
of the Ram temple issue as a key political issue in the 1999 election, but distinctly change
their focus to programmatic issues such as economic development when voting in later
elections, is very similar to the narratives of weak ethnic voters in the New Delhi cases.
The Ahmedabad case studies also include weak ethnic voters who indicated that
the BJP’s advocacy of Hindutva, rather than the Ram temple issue, was a critical factor in
their support for the party in the 1999 election. Cases 12 and 22 are voters who indicated
the importance of Hindutva in voting for the BJP in the 1999 election, but then went on to
focus on programmatic issues in the later elections. Case 12 is an upper caste Hindu who
owns his own transport business where he manages about sixty employees. He explained
that his father was a member of the Hindu nationalist organization, the RSS, and it
[Hindutva] is “in his blood.” When asked why he voted for the BJP in the 1999 election,
328Ahmedabadcasestudies15and30.329Ahmedabadcasestudy15.

216
he said, “It’s not Ram Mandir per se, because Ram is not an end. It’s Hindutva, there
were concerns that Hindus were losing their identity. It was important to gather them.”330
Case 22 is an upper caste Hindu and a clerk in a government telephone office,
who also indicated that Hindutva was important to him in the 1999 election. He spoke of
his support of Hindutva in terms of both responding to Muslim extremism and Congress’
use of Muslims as vote banks. He noted, “Congress always gives more to Muslims. We
felt that it [Hindutva] was necessary.”331 For these two voters, the BJP’s advocacy of
Hindutva was a key factor in their support for the party in the 1999 election.
Yet, like other weak ethnic voters, these two respondents indicated that
programmatic issues began to take precedence in later elections. The transport business
owner said that when the BJP came to power in 1999, they didn’t deliver on their
promises relating to their (Hindu nationalist) goals. By the 2009 election, his focus had
shifted to economic development, concerns about rising prices, and corruption in politics.
The government telephone office employee also noted that during their five-year
term in power the BJP did not deliver on their promises. In later elections, he noted that
concerns about rising prices and corruption in politics, which he strongly associated with
the Congress party, were the predominant factors influencing his vote choice. Both of
these voters continued to vote for the BJP in later elections, but for distinctly different
reasons, namely, a focus on programmatic issues including, economic development,
rising prices and political corruption.
In this second pattern of voting behavior, Weak Ethnic Voting, I posit that a very
high level of Hindu-Muslim conflict in Ahmedabad in the lead up to the 1999 election in
330Ahmedabadcasestudy12.331Ahmedabadcasestudy22.

217
turn heightened the political salience of ethnicity on vote choice. While some weak ethnic
voters in Ahmedabad identified a strong desire to see the Ram temple built as a key
motivator in their support for the BJP in the 1999 election, others expressed deep
concerns about Hindu identity and unity through their support of the BJP’s position on
Hindutva.
My findings suggest that voters in this category of Weak Ethnic Voting are
influenced by both ethnic concerns, such as the Ram temple and Hindutva, and
retrospective programmatic concerns, such as economic development, managing prices
and combating political corruption in their vote choices. Similar to the New Delhi cases,
this pattern of Weak Ethnic Voting most closely resembles type 3 voting behavior in
table 3.2, in which a voter is influenced by both the perceived risk of group threat from
ethnic conflict and the opportunities posed by economic reforms and development, and as
a result, changes in socio-economic conditions in turn change the relative importance of
ethnic group identity and interests and retrospective programmatic interests on vote
choice.
For this type of voting behavior, the conditions of a very high level of Hindu-
Muslim conflict in the 1999 election in Ahmedabad, lead to a heightened political
salience of ethnic group identity and interests, which appears to swamp out retrospective
programmatic interests in explaining voter support for the BJP. In the subsequent 2004
and 2009 national elections, as the severity of ethnic conflict was reduced somewhat,
combined with a high political economy of development, which many voters associated
with BJP Chief Minister, Narendra Modi, retrospective programmatic interests appear to
supersede ethnic interests in these voter’s political choices.
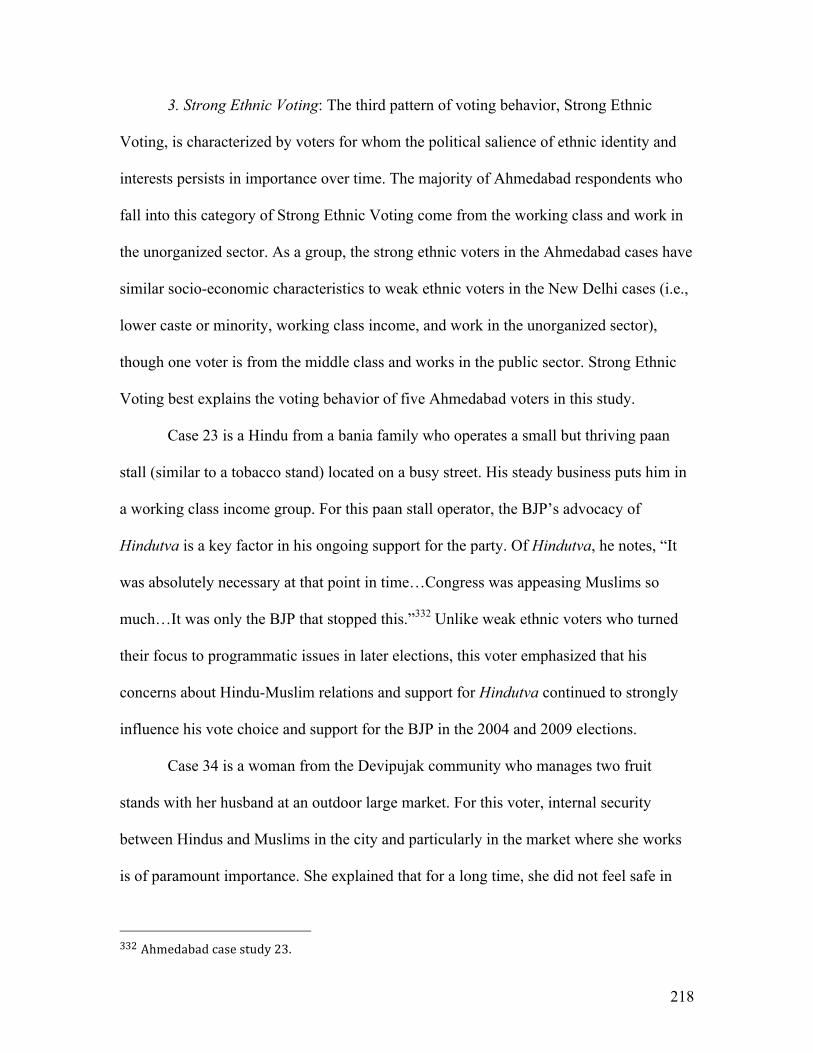
218
3. Strong Ethnic Voting: The third pattern of voting behavior, Strong Ethnic
Voting, is characterized by voters for whom the political salience of ethnic identity and
interests persists in importance over time. The majority of Ahmedabad respondents who
fall into this category of Strong Ethnic Voting come from the working class and work in
the unorganized sector. As a group, the strong ethnic voters in the Ahmedabad cases have
similar socio-economic characteristics to weak ethnic voters in the New Delhi cases (i.e.,
lower caste or minority, working class income, and work in the unorganized sector),
though one voter is from the middle class and works in the public sector. Strong Ethnic
Voting best explains the voting behavior of five Ahmedabad voters in this study.
Case 23 is a Hindu from a bania family who operates a small but thriving paan
stall (similar to a tobacco stand) located on a busy street. His steady business puts him in
a working class income group. For this paan stall operator, the BJP’s advocacy of
Hindutva is a key factor in his ongoing support for the party. Of Hindutva, he notes, “It
was absolutely necessary at that point in time…Congress was appeasing Muslims so
much…It was only the BJP that stopped this.”332 Unlike weak ethnic voters who turned
their focus to programmatic issues in later elections, this voter emphasized that his
concerns about Hindu-Muslim relations and support for Hindutva continued to strongly
influence his vote choice and support for the BJP in the 2004 and 2009 elections.
Case 34 is a woman from the Devipujak community who manages two fruit
stands with her husband at an outdoor large market. For this voter, internal security
between Hindus and Muslims in the city and particularly in the market where she works
is of paramount importance. She explained that for a long time, she did not feel safe in
332Ahmedabadcasestudy23.

219
the market, and she attributed the BJP’s coming to power with more internal security
between Hindus and Muslims.333 She emphasized the importance of the BJP’s ability to
bring security between Hindus and Muslims as the key factor in her continued support for
the BJP.
Case 9 is a middle class Hindu woman who works as a Principal in a public high
school. Like several weak ethnic voters, this voter discussed her desire to see the Ram
temple built as the main reason why she supported the BJP in the 1999 election.334
However, unlike the pattern of weak ethnic voters, she noted that the Ram temple issue
continued to be an important issue for her politically in the 2004 and 2009 elections and
was the main factor influencing her continued support for the BJP.
In this pattern of Strong Ethnic Voting, the political salience of ethnic group
identity and interests remains heightened and is the predominant factor influencing a
voter’s political choices. My findings in Ahmedabad suggest that, for many voters who
are in this category of voting behavior, the perception of group threat from ethnic conflict
remains a persistent ongoing concern influencing their vote choice. My case study
research in Ahmedabad did not provide a clear explanation why some very low income
voters working in the unorganized sector in Ahmedabad display burgeoning retrospective
programmatic voting behavior, while other low income voters working in the
unorganized sector display strong ethnic voting behavior. I hope to conduct further
research to explore the factors influencing burgeoning retrospective programmatic voting
333Ahmedabadcasestudy34.334Ahmedabadcasestudy9.
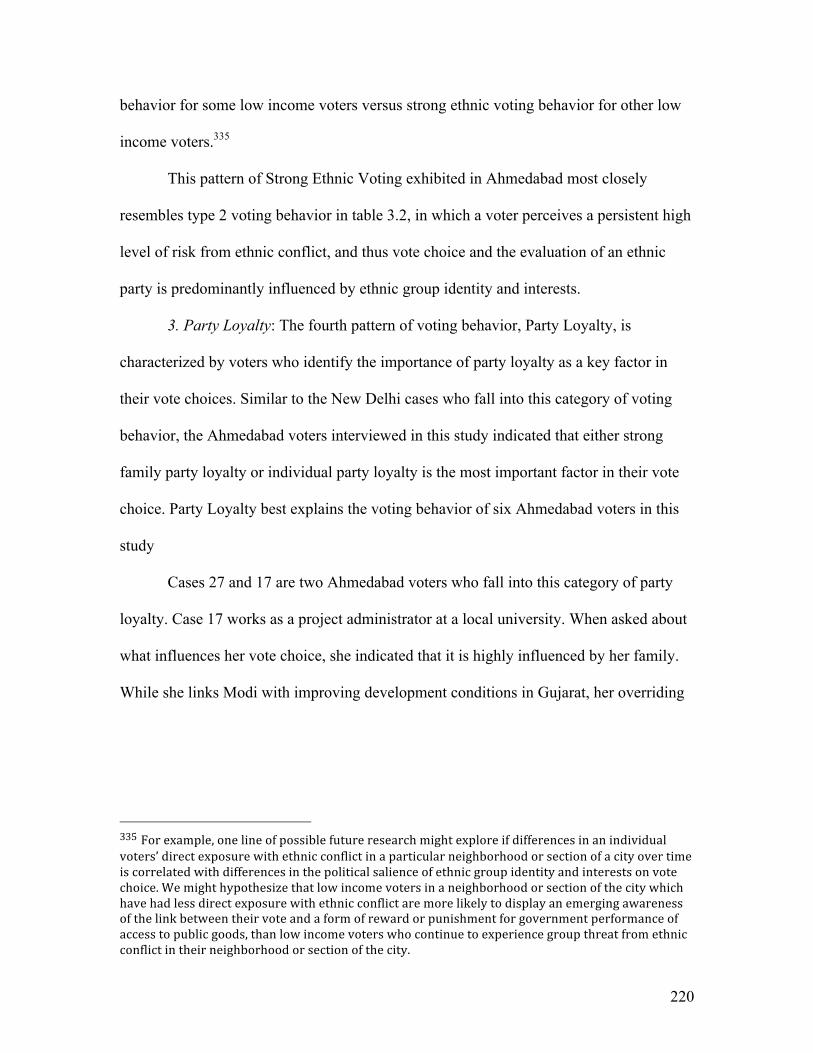
220
behavior for some low income voters versus strong ethnic voting behavior for other low
income voters.335
This pattern of Strong Ethnic Voting exhibited in Ahmedabad most closely
resembles type 2 voting behavior in table 3.2, in which a voter perceives a persistent high
level of risk from ethnic conflict, and thus vote choice and the evaluation of an ethnic
party is predominantly influenced by ethnic group identity and interests.
3. Party Loyalty: The fourth pattern of voting behavior, Party Loyalty, is
characterized by voters who identify the importance of party loyalty as a key factor in
their vote choices. Similar to the New Delhi cases who fall into this category of voting
behavior, the Ahmedabad voters interviewed in this study indicated that either strong
family party loyalty or individual party loyalty is the most important factor in their vote
choice. Party Loyalty best explains the voting behavior of six Ahmedabad voters in this
study
Cases 27 and 17 are two Ahmedabad voters who fall into this category of party
loyalty. Case 17 works as a project administrator at a local university. When asked about
what influences her vote choice, she indicated that it is highly influenced by her family.
While she links Modi with improving development conditions in Gujarat, her overriding
335Forexample,onelineofpossiblefutureresearchmightexploreifdifferencesinanindividualvoters’directexposurewithethnicconflictinaparticularneighborhoodorsectionofacityovertimeiscorrelatedwithdifferencesinthepoliticalsalienceofethnicgroupidentityandinterestsonvotechoice.Wemighthypothesizethatlowincomevotersinaneighborhoodorsectionofthecitywhichhavehadlessdirectexposurewithethnicconflictaremorelikelytodisplayanemergingawarenessofthelinkbetweentheirvoteandaformofrewardorpunishmentforgovernmentperformanceofaccesstopublicgoods,thanlowincomevoterswhocontinuetoexperiencegroupthreatfromethnicconflictintheirneighborhoodorsectionofthecity.

221
sentiment is her, “love for the [BJP] party,” which she expressed several times as the
main reason why she votes for the BJP.336
Case 27 votes for the BJP because of his personal sense of loyalty to the party and
party ideology. This voter is an upper caste Hindu who owns his own engineering and
design consulting firm and expressed deep concerns about the legacy of corruption in the
Congress party. By contrast, he identified BJP leader Atal Bihari Vajpayee who is
“unpurchaseable.”337 This voter did not identify specific ethnic or programmatic issues as
key factors in influencing his support for the BJP. Rather, he emphasized ideological
loyalty in describing why he votes for the BJP.
For this fourth category of voting behavior, neither mechanism posited in ERV
theory adequately explains the voting behavior of these two respondents. Rather, a
different mechanism related to a voter’s individual or family loyalty to a particular party
appears to be guiding these voters’ political choices. This pattern of Party Loyalty most
closely resembles type 4 voting behavior in table 3.2, in which some other type of
interests other than ethnic or programmatic interests, such as party loyalty, influences
vote choice and the decision to vote for an ethnic party.
In conclusion, the Ahmedabad case studies reveal four patterns of voting behavior
to explain variation in voter support for the BJP: 1) Retrospective Programmatic Voting,
2) Weak Ethnic Voting, 3) Strong Ethnic Voting, and 4) Party Loyalty. Similar to the
New Delhi voters interviewed for this study, I posit that ERV is able to explain three out
of four patterns of voting behavior (i.e., retrospective programmatic voting, weak ethnic
voting, and strong ethnic voting), which represent differences in an individual voter’s
336Ahmedabadcasestudy17.337Ahmedabadcasestudy27.

222
assessment of the potential threat from ethnic group conflict and the reward from
economic reforms and development, and have a subsequent role in the relative influence
of ethnic group identity and interests and retrospective programmatic interests on vote
choice and the nature of support for an ethnic party at the individual level.

223
Chapter7:Conclusion
In many new and maturing democracies, and in countries struggling to establish
democracy, ethnic parties are an important actor in electoral politics. Existing research
has shown that ethnic parties and ethnic political participation can be a stable and
peaceful presence in democracies. Yet, examples exist of ethnic parties associated with
ethnic conflict or ethnic violence.
The Bharatiya Janata Party is an example of an ethnic party, which has been
associated with ethnic violence in the past. The seeds of this study began with a focus on
the BJP, the only ethnic party that competes at the national level in India, in order to
understand what factors influence voter support for this ethnic party.
Since urban areas often represent the focal point of socio-economic changes
relating to economic growth and development, examining voting behavior through a
focus on urban voter support for the BJP, I posited, would provide a unique lens for a
research project seeking to understand the factors affecting voter support for an ethnic
party in a rapidly developing country context.
Existing theories to explain why voters vote for the BJP focus predominantly on
either ethnic factors, such as caste or religion, or programmatic factors, such as the
economy or corruption. Yet, my initial field research suggested that both ethnic and
programmatic factors influence voter support for this party. Additionally, I found
variation in the relative influence of ethnic interests and programmatic interests in
explaining voter support for the BJP over space and time.

224
This final chapter provides a summary of this dissertation study and its key
findings. I begin with a brief review of the main questions guiding this study and the
theoretical framework I offer to address these questions. I next discuss the research
findings as they relate to an examination of voting behavior over space and time. I
conclude with a discussion of the implications of these findings for the study of Indian
politics and questions for future research on the study of voting behavior and the nature
of voter support for ethnic parties in developing country contexts.
My interest in voting behavior and understanding the factors that influence voter
support for an ethnic party, such as the BJP, in a rapidly developing country context gave
rise to three broad questions guiding this dissertation study. First, how do ethnic and
programmatic interests influence voting behavior and help us understand variation in
voter support for an ethnic party such as the BJP? Second, what conditions increase the
salience of ethnic factors in voters’ political choices? Third, what conditions increase the
salience of programmatic factors in voters’ political choices?
To answer these questions, I present a theory of voting behavior, Ethnically
Mediated Retrospective Voting (ERV), which posits the conditions under which ethnic
interests and retrospective programmatic interests influence voters’ political choices, as a
means of explaining variation in voter support for the BJP.
ERV can be understood as a theory of retrospective voting which is adapted to
explain voting behavior and the factors affecting voter support for an ethnic party in a
rapidly developing country context, which aims to account for the impact of 1) changes
in the perceived level of ethnic group conflict, and 2) changes brought about by rapid
economic growth and reform, on voters’ political choices.

225
ERV first posits that an increase in the perceived level of ethnic group conflict in
turn creates the conditions for an increase in the political salience of ethnic group identity
and interests. Second, ERV posits that changes resulting from economic reform and
economic growth create the conditions for increasing retrospective programmatic
demands by voters.
The mechanisms of ERV together posit different generalized scenarios of voting
behavior to explain voter support for an ethnic party in different socio-economic
conditions, listed in table 3.1 These scenarios of voting behavior represent the ways in
which ERV’s two mechanisms predict the relative influence of ethnic and programmatic
interests in explaining overall voter support for an ethnic party under different socio-
economic conditions.
This dissertation also tests the proposition that ERV’s mechanisms impact
individual voting behavior in different ways. I posit four types of individual voting
behavior, listed in table 3.2, based on differences in an individual voter’s assessment of
in-group threat from ethnic group conflict and the reward from economic growth and
development, which in turn affects the relative influence of ethnic group identity and
interests and retrospective programmatic interests on vote choice and explaining
individual voter support for an ethnic party.
I employ a mixed-method strategy of data collection and analysis referred to as
“nested analysis,” which includes data analysis of voting behavior in the states of Delhi
and Gujarat in three Indian national elections, 1999, 2004 and 2009, using Indian
National Election Survey (NES) data, and case study analysis of individual urban voters
and their voting behavior in the cities of New Delhi, Delhi and Ahmedabad, Gujarat. This

226
research design provides the means to examine both the way in which ethnic and
programmatic interests influence voter support for the BJP at the societal level, and also
how these factors influence voting behavior and voter support for the BJP for the
individual voter.
SummaryofResearchFindings
My findings indicate that ethnic interests and retrospective programmatic interests
are both important factors in explaining voter support for the BJP over space and time.
The analysis of voting behavior in Delhi and Gujarat indicates that the condition of a high
level of perceived ethnic conflict is associated with a heightened political salience of
ethnic identity and interests. In particular, in the 1999 election, which had the highest
level of ethnic conflict for each state, the relative influence of ethnic interests on vote
choice and explaining voter support for the BJP was markedly higher in both Gujarat and
Delhi than compared to in the 2004 and 2009 elections.
Additionally, I find that in Gujarat, which has a socio-political history of episodes
of ethnic violence between Hindus and Muslims, and which also keenly felt the BJP’s
ethno-nationalist mobilization strategy during the 1990s, the relative influence of ethnic
group identity and interests in explaining voter support for the BJP is comparatively
higher than in Delhi, which has generally experienced low to moderate levels ethnic
conflict between Muslims and Hindus.
The analysis of voting behavior in Delhi and Gujarat also indicates that the
condition of a strong political economy of development is associated with an increase in
retrospective programmatic demands guiding voters’ political choices. I find that during

227
the 2009 election, which witnessed the strongest levels of economic growth and
development in both Delhi and Gujarat, the relative influence of retrospective
programmatic interests on vote choice and explaining voter support for the BJP is higher
in both Delhi and Gujarat than compared to in the 1999 election. The analysis of voting
behavior in Delhi and Gujarat indicate that retrospective programmatic concerns on
issues such as development and personal financial conditions had particularly strong
effects on vote choice in the 2009 election. Though it is difficult to make direct
comparisons of the strength of retrospective programmatic variables over time due to
differences in models in the large-N analysis, the findings from the case study analysis in
both cities suggest an increasing influence in the role of retrospective programmatic
interests to explain individual voter support for the BJP from 1999 to 2009.
In addition to finding evidence of the effects of ERV’s individual propositions on
voting behavior, the findings from the large-N analysis of voting behavior over time in
Delhi and Gujarat provide evidence to support the proposition that ERV’s combined
mechanisms are able to explain changes in the relative influence of ethnic interests and
retrospective programmatic interests on voting behavior and voter support for the BJP at
the societal level under different socio-economic conditions, as hypothesized in table 3.1.
In the context of a high political economy of development, and a moderate level
of ethnic group conflict, which characterized the context of the 1999 election in Delhi,
my findings indicate that both ethnic group identity and interests and retrospective
programmatic interests were strong factors in explaining voting behavior and voter
support for the BJP, most closely represented by scenario 1 in table 3.1

228
Ten years later, under conditions of a very high level of political economy of
development and a low level of ethnic conflict, which characterized the context of the
2009 election in Delhi, my findings indicate that the relative influence of retrospective
programmatic interests were strong factors in explaining voting behavior and voter
support for the BJP, while the political salience of ethnic group identity and interests
were less influential, most closely represented by scenario 3 in table 3.1
In the context of a weak political economy of development combined with a very
high level of ethnic conflict in Gujarat in the 1999 election, my findings indicate that the
relative influence ethnic group identity and interests were strong factors in explaining
voting behavior and voter support for the BJP, while retrospective programmatic interests
were somewhat less influential, most closely represented by scenario 2 in table 3.1
Ten years later, in the context of a high political economy of development, and a
medium level of ethnic group conflict in Gujarat in the 2009 election, my findings
indicate that the influence of both ethnic group identity and interests and retrospective
programmatic interests were strong factors in explaining voting behavior and voter
support for the BJP, most closely represented by scenario 1 in table 3.1
These findings suggest that ERV provides a plausible means for explaining
changes in the relative influence of ethnic and programmatic interests on voting behavior
and voter support for an ethnic party, such as the BJP, in different socio-economic
conditions.
The findings from the case study analysis of individual voting behavior over time
in New Delhi and Ahmedabad provides evidence to support the proposition that ERV’s

229
mechanisms impact individual voter’s political choices in different ways, as hypothesized
in table 3.2.
In both the New Delhi and the Ahmedabad case studies, I find evidence of four
patterns of individual voting behavior which explain changes in electoral support for the
BJP, namely, 1) Retrospective Programmatic Voting, 2) Weak Ethnic Voting, 3) Strong
Ethnic Voting, and 4) Party Loyalty. These patterns of voting behavior illustrate
differences in an individual voter’s assessment of and relationship to ethnic group
conflict and economic reforms and development, which in turn result in differences in the
relative influence of ethnic group identity and interests and retrospective programmatic
interests on vote choice and explaining individual voter support for an ethnic party.
The case study findings of voters who engage in Retrospective Programmatic
Voting in New Delhi and Ahmedabad suggest that they place a high value on the role of
economic reforms and development, and also on the importance of good governance.
This pattern of Retrospective Programmatic Voting most closely resembles type 1 voting
behavior in table 3.2, in which a voter is generally more influenced by the opportunities
posed by economic reforms and development than in-group threat posed by ethnic
conflict, and thus vote choice and the evaluation of an ethnic party is predominantly
influenced by retrospective programmatic interests.
Voters who engage in Weak Ethnic Voting in the Ahmedabad and New Delhi
cases are influenced by both ethnic concerns, such as Hindutva or the Ram temple, and
retrospective programmatic concerns, such as economic development or personal
financial conditions. This pattern of Weak Ethnic Voting most closely resembles type 3
voting behavior in table 3.2, in which a voter is influenced by both the perceived risk of

230
group threat from ethnic conflict and the opportunities posed by economic reforms and
development, and as a result, changes in socio-economic conditions in turn change the
relative importance of ethnic group identity and interests and retrospective programmatic
interests on vote choice.
For voters who engage in Strong Ethnic Voting in the Ahmedabad and New Delhi
cases, I found that ethnic interests are the predominant factor influencing a voter’s
political choices. For these voters, the perception of group threat from ethnic conflict
does not appear to ebb and flow, as it does for weak ethnic voters, but persists as a strong
ongoing concern over time. This pattern of Strong Ethnic Voting most closely resembles
type 2 voting behavior in table 3.2, in which the perceived threat from ethnic group
conflict remains generally high, increasing an individual’s sense of in-group
identification, and thus vote choice and the evaluation of an ethnic party is predominantly
influenced by ethnic group identity and interest
For voters in the category, Party Loyalty, neither ethnic interests nor retrospective
programmatic interests play a strong role in explaining voter support for an ethnic party.
For these particular voters, the focus is almost entirely on voting for a particular party.
This pattern of Party Loyalty voting most closely resembles type four voting behavior in
table 3.2, in which some other type of interests other than ethnic or programmatic
interests influence vote choice and the decision to vote for an ethnic party.
By comparison, the findings from both the large-N analysis of voting behavior in
Delhi and Gujarat, and the case study analysis of voting behavior in New Delhi and
Ahmedabad, indicate that the degree of a voter’s religiosity is not a good predictor of
voter support for an ethnic party.

231
ContributionstothestudyofIndianPolitics
In this section, I discuss two areas in which my research findings seek to engage
the study of Indian electoral politics and voting behavior in India going forward. First, the
research findings suggest the possibility of testing ERV as a plausible means for
examining and explaining voting behavior and the nature of voter support for ethnic
parties in other Indian states.
For example, Bihar is one of India’s poorest and largest states, with a current
population of 100 million. For fifteen years, the state was governed by the Rashtriya
Janata Dal Party, a party associated with the interests of OBCs and Muslims. During this
time, Lalu Prasad Yadav and his wife, Rabri Devi, alternatively ruled the state largely
through caste-based patronage politics. By 2004, the last year of their long tenure, Lalu
Prasad Yadav was under investigation for multiple corruption charges, while the state’s
economic growth rate was less than one percent.
In 2005, the Rashtriya Janata Dal party lost to the BJP-Janata Dal (United)
alliance. During the BJP-Janata Dal (U) alliance’s tenure, from 2005 to 2009, Bihar’s
average state GDP increased dramatically to 11 percent.
In the 2010 state assembly election, the BJP-Janata Dal (U) alliance won a second
term. Post-election analysis focused on the alliance government’s positive performance
on development issues, such as improving the state’s transportation infrastructure, the
coalition’s ongoing focus on development issues during the 2010 campaign, and a
strategy to appeal to certain ethnic groups (particularly low caste Hindus and Muslims)
through various welfare measures, as key factors behind the incumbent’s ability to win a
second term.

232
ERV posits that under the condition of a strong level of economic reforms and
development, an increasing number of voters can engage in retrospective programmatic
appeals in their political choices to explain voting behavior and in turn voter support for
an ethnic party. Thus, under the conditions of an increasingly stronger political economy
of development in Bihar over the past five years, we could hypothesize that an increasing
number of voters in Bihar engaged in a retrospective programmatic assessment of the
BJP-Janata Dal (U) tenure during the 2010 state assembly elections, which contributed to
continued support for the BJP-Janata Dal (U) alliance. However, a much more in-depth
empirical analysis of survey data from the recent state elections in Bihar is needed to
parse out the way in which both ethnic and programmatic interests influenced voter
support for the BJP-Janata Dal (U) alliance in order for this coalition to win a second
term.
Second, the research findings suggest that voters in India may prioritize and focus
on different levels of government performance when voting in a national election.
For example, in Gujarat, BJP voters in the 1999 election were on average more
focused on the work of the BJP-led central government. Ten years later, BJP voters in the
2009 election were on average significantly more focused on the work of the BJP-led
state government led by the popular Chief Minister, Narendra Modi.
In Delhi, both BJP and Congress voters in the 1999 election were generally more
focused on the work of the central government. Five years later, Congress voters had
become much more focused on the work of the Congress-led state government. These
findings suggest a possible extension of ERV, that Indian voters make retrospective
programmatic assessments of different levels of government. More research is needed to

233
understand the factors influencing a voter’s decision to focus on the work of one level of
government over another level of government at a given point of time.
FinalThoughts
The findings of this study shows that ethnic interests and programmatic interests
are both critical factors in explaining why voters vote for an ethnic party, such as the BJP.
If we focus only on the role of ethnic interests or on the role of programmatic interests,
we are missing a critical part of the complexity of voting behavior and explaining voter
support for an ethnic party in a developing country.
This complexity of voting behavior is evident both at the societal level and at the
level of the individual voter. At the societal level, this study finds that changes in socio-
economic conditions related to ethnic conflict and the political economy of development
impact the relative influence of ethnic interests and programmatic interests in explaining
overall voter support for an ethnic party.
The findings also suggest that individual voters may assess the potential threat
from ethnic group conflict and the reward from economic reforms and development
differently, which in turn results in differences in the relative influence of ethnic and
programmatic interests on vote choice and explaining individual voter support for an
ethnic party.
In developing and testing Ethnically Mediated Retrospective Voting as a means of
explaining voter support for the BJP in two highly urbanized areas in India, this study
seeks to broaden the way in which we conceptualize voting behavior and our
understanding of the nature of voter support for an ethnic party in a developing country

234
context. While this dissertation has sought to provide answers to questions about the
nature of voter support for an ethnic party, many questions remain.
In this study, party system competition is held constant, as both Gujarat and Delhi
have a two party system. Wilkinson indicates that the nature of party system competition
and the effective number of parties competing for votes at the town and state level play a
pivotal role in determining the electoral incentives for political elites to prevent or allow
violence. A question for further research is to examine how the nature of party systems
and party competition impacts the salience of ethnic interests and programmatic interests
on voting behavior and the nature of voter support for an ethnic party.
This study also sought to examine the role of programmatic voter-party linkages
in explaining voting behavior and voter support for an ethnic party in two highly
urbanized areas in India. Scholars have begun to study voter-party linkage formation and
change in countries such as Argentina, Brazil, and India. A question for future research is
to examine how changes in programmatic voter-party linkage formation impacts the
nature of voter support for an ethnic party in other developing country contexts.
While the scope of this dissertation is designed to focus on explaining voting
behavior and why voters vote for an ethnic party in two highly urbanized locations in
India, ERV could be a useful framework for examining voting behavior and the nature of
voter support for ethnic parties in other developing country contexts.
As more election survey data and other forms of data are generated about voting
behavior in developing countries in the future, scholars will be in an increasingly better
position to conduct research and analysis about voting behavior and to gain more insight
into the factors influencing electoral support for ethnic parties in developing countries.

235
AppendixA.IndianNationalElectionStudy(NES)Questions
Table 1. Indian National Election Study (NES) 1999 Questions Subject Question Reponses/Categories Religion What is your religion? Hindu, Muslim,
Christian, Sikh, Buddhist, Jain, Parsi, Other
Caste What is your caste? Scheduled Caste, Scheduled Tribe, Other Backward Castes, Upper Caste
Class Composite NES data from income and household items
Low, Middle, High
Religiosity Do you Worship (practice Puja, Namaz, Ardas)? Yes, No Social Harmony (Hindu-Muslim Relations
Regarding the work done by the government during the last one and a half years, in this government’s rule, please tell me whether you agree or disagree whether Hindu-Muslim brotherhood has gone up
Agree, Disagree, No Opinion
Hindu Ram Temple Views
Please tell me whether you agree or disagree whether on the site where Babri Masjid was situated only the Ram Temple should be built.
Agree, Disagree, No Opinion
Price Levels Regarding the work done by the government during the last one and a half years, in this government’s rule, please tell me whether you agree or disagree whether price levels have increased than before.
Agree, Disagree, No Opinion
Law and Order Regarding the work done by the government during the last one and a half years, in this government’s rule, please tell me whether you agree or disagree whether ordinary people, life and property are safer now than before.
Agree, Disagree, No Opinion
Corruption Regarding the work done by the government during the last one and a half years, in this government’s rule, please tell me whether you agree or disagree whether corruption has come down than before.
Agree, Disagree, No Opinion
National Security
Regarding the work done by the government during the last one and a half years, in this government’s rule, please tell me whether you agree or disagree whether the nation’s security has deteriorated?
Agree, Disagree, No Opinion
Central Government Performance
What is your assessment of the work done by the central government (in Delhi) in the last one and a half years?
Not at all satisfied, Somewhat satisfied, Very satisfied, Don’t Know

236
Table 2. Indian National Election Study (NES) 2004 Questions Subject Question Reponses/Categories Religion What is your religion? Hindu, Muslim,
Christian, Sikh, Buddhist, Jain, Parsi, Other
Caste What is your caste? Scheduled Caste, Scheduled Tribe, Other Backward Castes, Upper Caste
Class Composite NES data from income and household items
Very Poor, Poor, Lower, Middle, Rich
Religiosity How often do to you worship (practice Puja, Namaz, Ardas)?
Never, On Festivals, Weekly, Daily
Social Harmony (Hindu-Muslim Relations
During the last five years, have conditions regarding Hindu-Muslim brotherhood improved or deteriorated?
Improved, Same, Deteriorated, No Opinion
Hindu Ram Temple Views
Please tell me whether you agree or disagree whether on the site where Babri Masjid was situated only the Ram Temple should be built.
Fully Agree, Somewhat Agree, Somewhat Disagree, Fully Disagree, No Opinion
Personal Financial Conditions
During the past five years, has your financial situation improved, worsened, or has it remained the same?
Worsened, Same, Improved, Don’t Know
Employment During the last five years, have conditions regarding employment opportunities improved or deteriorated?
Improved, Same, Deteriorated, No Opinion
Development During the last five years, have conditions regarding development of the country improved or deteriorated?
Improved, Same, Deteriorated, No Opinion
Corruption During the last five years, have conditions regarding curbing corruption improved or deteriorated?
Improved, Same, Deteriorated, No Opinion
National Security
During the last five years, have conditions regarding security of the country/National Security improved or deteriorated?
Improved, Same, Deteriorated, No Opinion
Central Government Performance
What is your opinion of the performance of the NDA Government during the last five years?
Fully dissatisfied, Somewhat dissatisfied, Somewhat satisfied, Fully satisfied

237
Table 3. Indian National Election Study (NES) 2009 Questions Subject Question Reponses/Categories Religion What is your religion? Hindu, Muslim,
Christian, Sikh, Buddhist, Jain, Animism, No Religion, Other
Caste What is your caste? Scheduled Caste, Scheduled Tribe, Other Backward Castes, Upper Caste
Class Composite NES data from income and household items
Very Poor, Poor, Lower, Middle, Rich
Religiosity How often do you worship (practice Puja, Namaz, Ardas)?
Never, On Festivals, Weekly, Daily
Hindu Ram Temple Views
What would you suggest be built on the site [of the disputed structure (Babri Masjid) at Ayodhya]? A Hindu Temple or a Muslim Mosque?
Neither Both Only Mosque Only Temple No Opinion Other
Personal Financial Conditions
As compared to five years ago, how is the economic condition of your household today?
Much Better Better Same Worse Much Worse No Opinion
Development As compared to five years ago, how would you say the economic condition of India has become?
Much Better Better Same Worse Much Worse No Opinion
National Security
After the Mumbai terror attacks the government took steps to curb terrorism. What is your opinion about the steps taken after the Mumbai attacks?
Fully dissatisfied Somewhat dissatisfied Somewhat satisfied, Fully satisfied
Central Government Performance
What is your opinion of the performance of the Congress-led UPA Government during the last five years?
Fully dissatisfied, Somewhat dissatisfied, Somewhat satisfied, Fully satisfied

238
AppendixB.DescriptiveStatisticsforDelhiandGujaratAnalysis:1999,2004and2009elections Table 1. Descriptive Statistics for Delhi 1999 Election Analysis
Indicator Coded Percent of Voters
BJP Vote %
Congress Vote %
Religion Hindu Non-Hindu
97 3
43 0
57 100
Caste Upper Caste Non-Upper Caste
68 32
68 24
32 76
Class Rich Non-Rich
25 75
61 33
39 67
Religiosity Yes No
83.5 16.5
42 33
58 67
Social Harmony
Agree (social harmony improved) Disagree (social harmony deteriorated)
62 38
56 18
44 82
Hindu Ram Temple Views
Agree (only build Ram temple) Disagree (not only Ram temple)
70.5 29.5
37 29
63 71
Price Levels Agree (prices have increased) Disagree (prices have not increased)
83 17
31 61
69 39
Law and Order Agree (people are safer) Disagree (people are not safer)
59 41
64 17
36 83
Corruption Agree (corruption has come down) Disagree (corruption has not improved)
51 49
59 23
41 77
National Security Agree (national security has worsened) Disagree (national security has improved)
46 54
16 62
84 38
Central Government Performance
Not at all satisfied Somewhat satisfied Very satisfied
44 23 33
4 43 89
96 57 11

239
Table 2. Descriptive Statistics for Gujarat 1999 Election Analysis Indicator Coded Percent
of Voters BJP Vote %
Congress Vote %
Religion Hindu Non-Hindu
95 5
49 21
51 73
Caste Upper Caste Non-Upper Caste
30 70
76 36
24 64
Class Rich Non-Rich
17 83
65 45
35 55
Religiosity Yes No
88 12
51 25
49 75
Social Harmony Agree (social harmony improved) Disagree (social harmony deteriorated)
41 59
77 34
23 66
Hindu Ram Temple Views
Agree (only Ram temple) Disagree (not only Ram temple)
72 28
55 41
45 59
Price Levels Agree (prices have increased) Disagree (prices have not increased)
90 10
42 89
58 11
Law and Order Agree (people are safer) Disagree (people are not safer)
46 54
72 33
28 67
Corruption Agree (corruption has come down) Disagree (corruption has not improved)
42 58
68 35
32 65
National Security Agree (national security has worsened) Disagree (national security has improved)
46 54
27.5 68
72.5 32
Central Government Performance
Not at all satisfied Somewhat satisfied Very satisfied
41 36 23
20 65 86
80 35 14
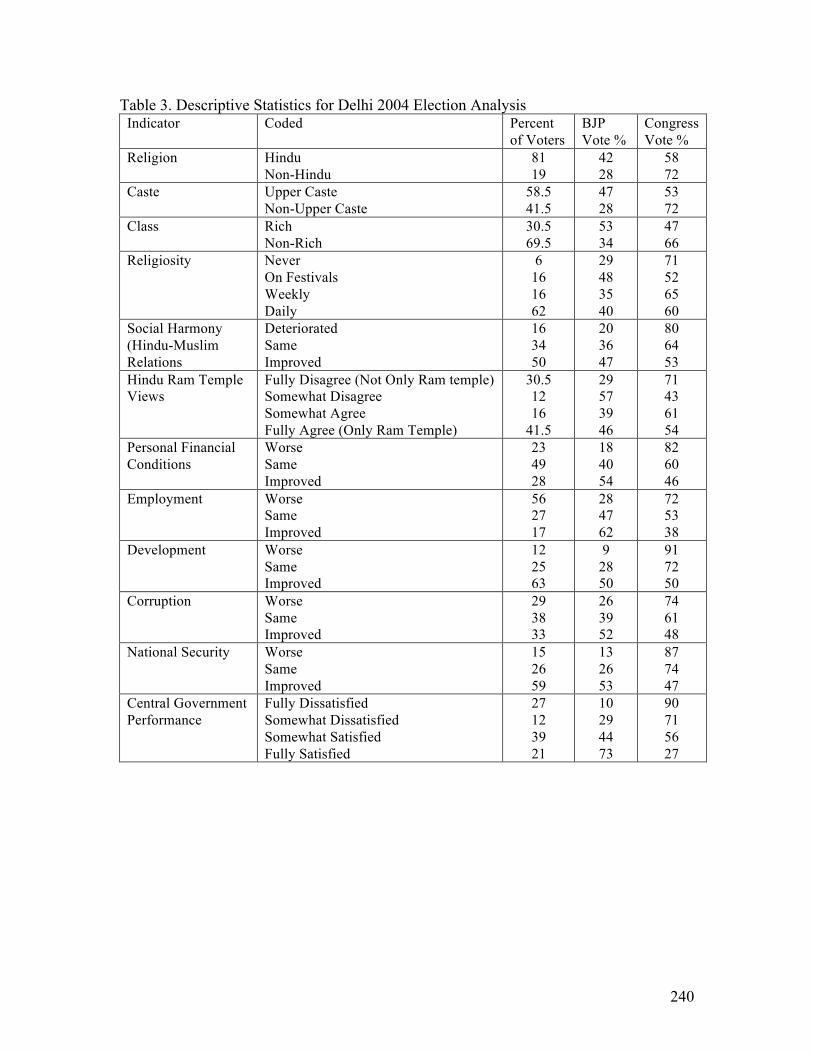
240
Table 3. Descriptive Statistics for Delhi 2004 Election Analysis Indicator Coded Percent
of Voters BJP Vote %
Congress Vote %
Religion Hindu Non-Hindu
81 19
42 28
58 72
Caste Upper Caste Non-Upper Caste
58.5 41.5
47 28
53 72
Class Rich Non-Rich
30.5 69.5
53 34
47 66
Religiosity Never On Festivals Weekly Daily
6 16 16 62
29 48 35 40
71 52 65 60
Social Harmony (Hindu-Muslim Relations
Deteriorated Same Improved
16 34 50
20 36 47
80 64 53
Hindu Ram Temple Views
Fully Disagree (Not Only Ram temple) Somewhat Disagree Somewhat Agree Fully Agree (Only Ram Temple)
30.5 12 16
41.5
29 57 39 46
71 43 61 54
Personal Financial Conditions
Worse Same Improved
23 49 28
18 40 54
82 60 46
Employment Worse Same Improved
56 27 17
28 47 62
72 53 38
Development Worse Same Improved
12 25 63
9 28 50
91 72 50
Corruption Worse Same Improved
29 38 33
26 39 52
74 61 48
National Security Worse Same Improved
15 26 59
13 26 53
87 74 47
Central Government Performance
Fully Dissatisfied Somewhat Dissatisfied Somewhat Satisfied Fully Satisfied
27 12 39 21
10 29 44 73
90 71 56 27
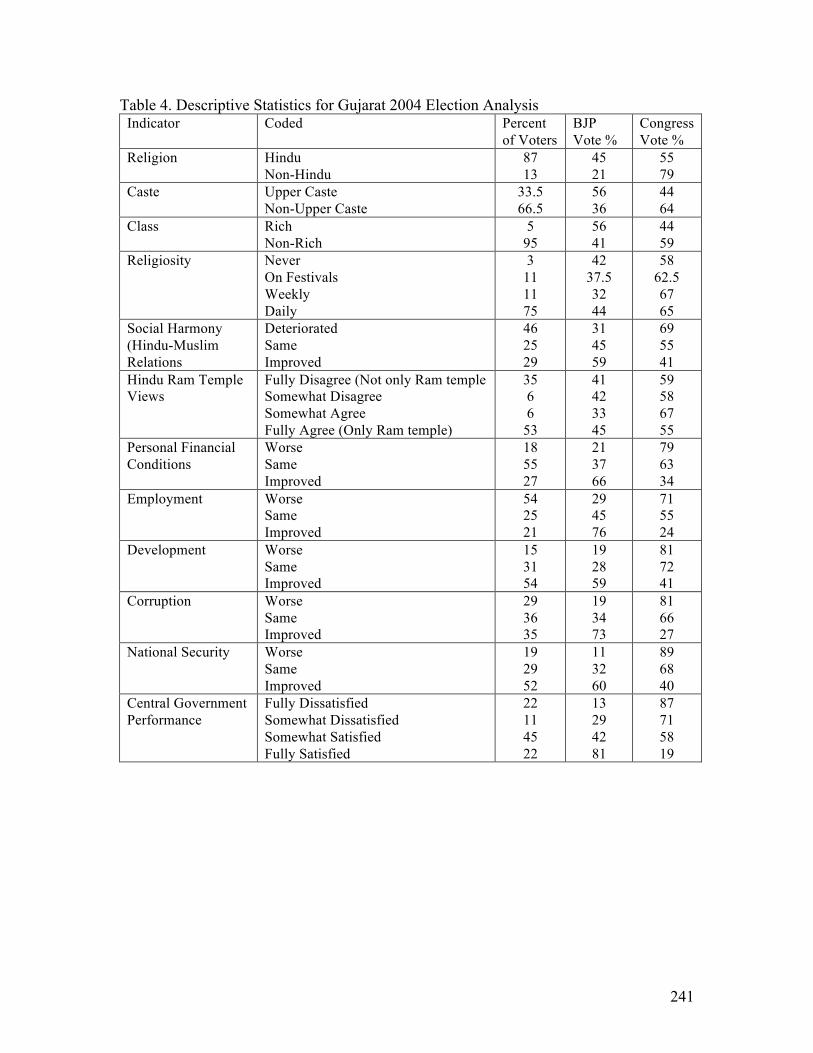
241
Table 4. Descriptive Statistics for Gujarat 2004 Election Analysis Indicator Coded Percent
of Voters BJP Vote %
Congress Vote %
Religion Hindu Non-Hindu
87 13
45 21
55 79
Caste Upper Caste Non-Upper Caste
33.5 66.5
56 36
44 64
Class Rich Non-Rich
5 95
56 41
44 59
Religiosity Never On Festivals Weekly Daily
3 11 11 75
42 37.5 32 44
58 62.5 67 65
Social Harmony (Hindu-Muslim Relations
Deteriorated Same Improved
46 25 29
31 45 59
69 55 41
Hindu Ram Temple Views
Fully Disagree (Not only Ram temple Somewhat Disagree Somewhat Agree Fully Agree (Only Ram temple)
35 6 6
53
41 42 33 45
59 58 67 55
Personal Financial Conditions
Worse Same Improved
18 55 27
21 37 66
79 63 34
Employment Worse Same Improved
54 25 21
29 45 76
71 55 24
Development Worse Same Improved
15 31 54
19 28 59
81 72 41
Corruption Worse Same Improved
29 36 35
19 34 73
81 66 27
National Security Worse Same Improved
19 29 52
11 32 60
89 68 40
Central Government Performance
Fully Dissatisfied Somewhat Dissatisfied Somewhat Satisfied Fully Satisfied
22 11 45 22
13 29 42 81
87 71 58 19
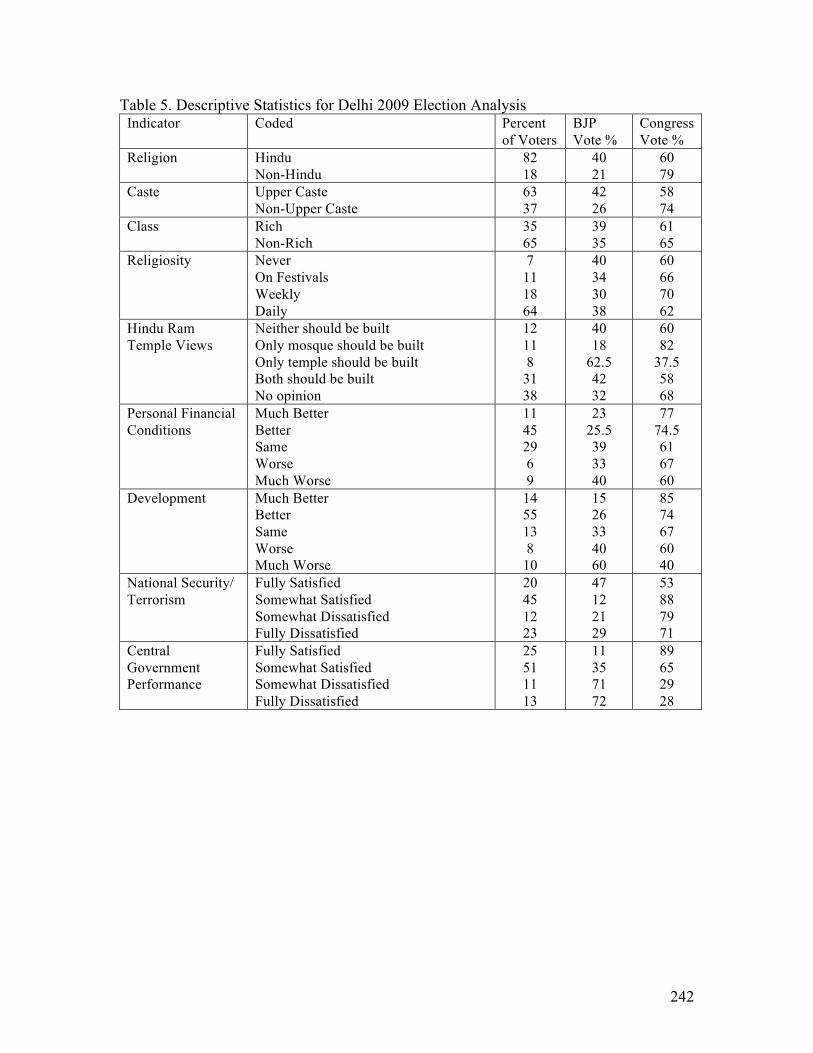
242
Table 5. Descriptive Statistics for Delhi 2009 Election Analysis Indicator Coded Percent
of Voters BJP Vote %
Congress Vote %
Religion Hindu Non-Hindu
82 18
40 21
60 79
Caste Upper Caste Non-Upper Caste
63 37
42 26
58 74
Class Rich Non-Rich
35 65
39 35
61 65
Religiosity Never On Festivals Weekly Daily
7 11 18 64
40 34 30 38
60 66 70 62
Hindu Ram Temple Views
Neither should be built Only mosque should be built Only temple should be built Both should be built No opinion
12 11 8
31 38
40 18
62.5 42 32
60 82
37.5 58 68
Personal Financial Conditions
Much Better Better Same Worse Much Worse
11 45 29 6 9
23 25.5 39 33 40
77 74.5 61 67 60
Development Much Better Better Same Worse Much Worse
14 55 13 8
10
15 26 33 40 60
85 74 67 60 40
National Security/ Terrorism
Fully Satisfied Somewhat Satisfied Somewhat Dissatisfied Fully Dissatisfied
20 45 12 23
47 12 21 29
53 88 79 71
Central Government Performance
Fully Satisfied Somewhat Satisfied Somewhat Dissatisfied Fully Dissatisfied
25 51 11 13
11 35 71 72
89 65 29 28

243
Table 6. Descriptive Statistics for Gujarat 2009 Election Analysis Indicator Coded Percent
of Voters BJP Vote %
Congress Vote %
Religion Hindu Non-Hindu
86 14
54 27
46 73
Caste Upper Caste Non-Upper Caste
32 68
69 43
31 57
Class Rich Non-Rich
11 89
63 49
37 51
Religiosity Never On Festivals Weekly Daily
5 10 19 66
49 38 48 54
51 62 52 46
Hindu Ram Temple Views
Neither should be built Only mosque should be built Only temple should be built Both should be built No Opinion
15 7
32 30 18
31 44 69 57 45
69 56 31 43 55
Personal Financial Conditions
Much Better Better Same Worse Much Worse
13 40 32 9 6
50 58 40 31 22
50 42 60 69 78
Development Much Better Better Same Worse Much Worse
18 46 27 6 3
59 54 34 50 60
41 46 66 50 40
National Security/ Terrorism
Fully Satisfied Somewhat Satisfied Somewhat Dissatisfied Fully Dissatisfied
30 46 12 12
33 41.5 67 70
67 58.5 33 30
Central Government Performance
Fully Satisfied Somewhat Satisfied Somewhat Dissatisfied Fully Dissatisfied
36 40 11 13
20 58 76 89
80 42 24 11

244
AppendixC.SurveyQuestionnaireforNewDelhiandAhmedabadCaseStudies Respondent Code Number: _________ I would like to begin by asking you some questions about the 1999 Lok Sabha Election. Recall that the BJP-led National Democratic Alliance government was in power briefly in 1998, leading up to the 1999 national election. 1. Going into the 1999 Lok Sabha election, what were your views of the BJP? Did you think they were a strong party or a weak party in 1999? 2. In 1999, Atal Bihari Vajpayee was the leader of the BJP. What did you think of Atal Bihari Vajpayee at that time? 3. Going into the 1999 Lok Sabha election, what were your views of the Congress party. Did you think they were a strong party or a weak party in 1999? 4. In 1999, Sonia Gandhi was the leader of the Congress. What did you think of Sonia Gandhi at that time? 5. In 1999, what were your views of former Congress Prime Minister P. V. Narasimha Rao and his past performance as leader of the Congress party from 1991-1995? 6. Now, I would like to ask you about Hindutva. In 1999, had you heard of the term Hindutva used in political slogans? (yes, no, don’t know) If yes, what did the term Hindutva mean to you in 1999?

245
7. In the 1999 election, was the mandir/masjid dispute in Ayodhya a factor in your vote choice? If yes, ask: Why was it important to you? 8. I would like to ask you, in the 1999 election: A) Were any of the following issues important to you in your vote choice. List: yes, no, or no opinion. B) What would you say was the most important issue(s) in the 1999 election. a) Reducing corruption b) National Security c) Employment or rising prices d) Development of the country e) Party Leadership f) Mandir/Masjid Dispute g) Other issues 9. Whom did you vote for in the 1999 Lok Sabha election?
1. Congress Party 2. BJP 3. Other (write in name of other political party) 4. Don’t Know
Now I would like to hear your views about the 2004 Lok Sabha election. Recall that the BJP-led National Democratic Alliance was in power for a full five-year term from 1999 to 2004. 1. When you went to cast your vote in 2004 Lok Sabha election, did you think the BJP had performed well or not well from 1999-2004? Was your view of the BJP the same or different from your views of the BJP in 1999?

246
2. When you went to cast your vote in 2004, what was your view of the Congress Party? In 2004, was your view of the Congress the same or different from your view of Congress in 1999? 3. I would like to ask you, in the 2004 election: A) Were any of the following issues important to you in your vote choice. List: yes, no, or no opinion. B) What would you say was the most important issue(s) in the 2004 election. a) Reducing corruption b) National Security c) Employment or rising prices d) Development of the country e) Party Leadership f) Mandir/Masjid Dispute g) Other issues 4. Whom did you vote for in the 2004 Lok Sabha election?
1. Congress Party 2. BJP 3. Other (write in name of other political party) 4. Don’t Know
I would now like to ask you some questions about the 2009 Lok Sabha election. Recall that the Congress-led United Progressive Alliance was in power for a full five-year term from 2004 to 2009. 1. When you went to cast your vote in the 2009 Lok Sabha election, did you think the Congress had performed well or not well from 2004 to 2009? Compared to 1999, were your views of Congress the same or different in 2009?

247
2. In 2009, Sonia Gandhi was the leader of the Congress. What did you think of Sonia Gandhi? Did you think Mrs. Gandhi would be a good leader? 3. What did you think of Prime Minister Manmohan Singh? Did you think that Dr. Singh would be a good leader? 4. When you went to cast your vote in 2009, what was your view of the BJP? In 2009, was your view of the BJP the same or different from your view of the BJP in 1999? 5. In 2009, L.K. Advani was the leader of the BJP. What did you think of L.K. Advani? Did you think Mr. Advani would be a good leader? 6. In the 2009 national election, was the mandir/masjid dispute in Ayodhya a factor in your vote choice? 7. I would like to ask you your feelings about Hindutva in 2009. Were your views of Hindutva the same or different in 2009 compared to 1999. 8. I would like to ask you, in deciding who to vote for in the 2009 national election: A) Were any of the following issues important to you in your vote choice. List: yes, no, or no opinion. B) What would you say was the most important issue(s) in the 2009 election? a) Reducing corruption b) National Security c) Employment or rising prices d) Development of the country e) Party Leadership f) Mandir/Masjid dispute g) Other issues

248
9. Who did you vote for in the 2009 Lok Sabha election?
1. Congress Party 2. BJP 3. Other (write in name of other political party)
Now I have some final broad based questions I would like to ask you about what is important to you as a voter. 1. Over the past ten years, have religious, ethnic or caste issues, such as the Mandir/Masjid dispute, become more important or less important to you in your vote choice? Indicate, more important, less important, the same. If voter responds “the same,” ask: Are they always important to you, or are always not important to you? If voter responds “more” or “less,” ask: why? 2. Over the course of the last 10 years, has your level of awareness of politics and political parties changed (increased or decreased) or has it stayed the same? If it has changed, ask: what do you think has contributed to the change in your level of political awareness? (examples: access to TV, newspapers, a cell phone, computer, education, etc.) 3. Does your opinion of Chief Minister Sheila Dixit affect your vote choice in the National/Lok Sabha elections? [For Delhi Case Studies] 3. I would like to hear your opinions related to state level politics in Gujarat and Chief Minister Narendra Modi: [For Ahmedabad Case Studies]
a) Have you ever voted for Narendra Modi in the assembly elections? b) In general, are you currently satisfied or unsatisfied with Modi’s government? Why or why not?
c) You may have heard the recent remarks by Darul Uloom vice-chancellor, Maulana Ghulam Mohammed Vastenvi, who said that eight years has passed since the violence in 2002 and that it was time for Gujarat to move forward. Do you agree or disagree with this opinion/sentiment?
249
d) Does your opinion of Chief Minister Modi affect your vote choice in the National/Lok Sabha elections?
4. Looking back over the course of the last three national elections from 1999, 2004 and 2009, in your mind, what issues or concerns have increased in importance to you in your vote choices? 5. Finally, what are your general views of the BJP today?

250
Personal Data (Not to include name) Gender: Male Female Age: 20-29 30-39 40-49 50-59 60-69 70-79 Type of Employment/Sector: Specific job: Caste/Caste Group: Religion: Over the past ten years, has religion personally remained: more, less, or about the same, level of importance to you? Level of Education Total Monthly household Income (in Rs.):
1. up to Rs. 1000 2. Rs. 1001-Rs.2000 3. Rs. 2001-3000 4. Rs. 3001-4000 5. Rs. 4000-12,000 6. Rs. 12,000-20,000 7. Rs. 20,000-Rs.40,000 8. Rs. 40,000-100,000 9. Rs. 100,000-400,000 10. Rs. 400,000-750,000 11. Rs.750,000 and above
List of household items: List yes or no, and how many Bicycle Scooter Telephone Black and White Television Color Television Cable Connection Car Fridge
251
Bibliography
1. Academic Works Acemoglu, Daron and James Robinson. Economic Origins of Dictatorship and Democracy. Cambridge: Cambridge University Press, 2006. Ahmad, Imtiaz and Helmut Reifeld, eds. Middle Class Values in India & Western Europe. New Delhi: Social Sciences Press, 2002. Andersen, Walter and Mahender Sumar Saini. “The Congress Split in Delhi: The Effect of Factionalism on Organizational Performance and System Level Interactions.” Asian Survey 11, no.11 (1971): 1084-1100. Andersen, Walter and Shridhar Damle. The Brotherhood in Saffron: The Rashtriya Swayamsevak Sangh and Hindu Revivalism. Boulder: Westview Press, 1987. Banfield, Edward and James Q. Wilson. City Politics. Boston: Harvard University Press, 1963. Bates, Robert. “Ethnic Competition and Modernization in Contemporary Africa.” Comparative Political Studies 6, no. 4 (1974): 457-483. Berelson, Bernard, Paul Lazarsfeld and William McPhee. Voting. Chicago: University of Chicago Press, 1954. Berland Kaul, Allison. “Industrialization, Peasant Mobilization and the Conflict over Land Acquisition in India: The Case of the Nano Car.” Paper presented at the 2010 Annual Meeting of the American Political Science Association, Washington, DC, September, 2-5, 2010. Bardhan, Pranab. The Political Economy of Development in India. Oxford: Basil Blackwell, 1984. Bhagat, R.B. “Emerging Pattern of Urbanisation in India.” Economic & Political Weekly August 20, 2011. Bobo, Lawrence and Vincent Hutchings. “Perceptions of Racial Group Competition: Extending Blumer’s Theory of Group Position to a Multiracial Context.” American Sociological Review, 61, no. 6 (1996): 951-972. Birnír, Jóhanna Kristin. Ethnicity and Electoral Politics. Cambridge: Cambridge University Press, 2007.

252
Brass, Paul. Ethnicity and Nationalism: Theory and Comparison. New Delhi: Sage Publications, 1991. Burham, Walter Dean. “Party Systems and the Political Process.” In The American Party Systems: States of Political Development Second Edition. Edited by William Nisbet Chambers and Walter Dean Burnham. New York: Oxford University Press, 1975. Burman. “The Two Banks of the River.” Economic & Political Weekly September 18, 1976. Calvo, Ernesto, and Maria Victoria Murillo. “Who Delivers? Partisan Clients in the Argentine Electoral Market.” American Journal of Political Science 48, no. 4 (2004). Campbell, Angus, Philip Converse, Warren Miller, and Donald Stokes. The American Voter. Chicago: University of Chicago Press, 1960. Chandra, Kanchan “Ethnic parties and democratic stability.” Perspectives on Politics 3, no. 4 (2005): 235-252. Chandra, Kanchan. “What is Ethnicity and Does it Matter.” Annual Review of Political Science 9 (2006): 397-424. Chandra, Kanchan. Why Ethnic Parties Succeed – Patronage and Ethnic Head Counts in India. Cambridge: Cambridge University Press, 2004. Chandra. Kanchan. “Why Ethnic Parties Succeed: A Comparative Study of the Bahujan Samaj Party.” PhD Dissertation, Harvard University, 2000. Chhibber, Pradeep. “Are National Elections Any More Than Aggregations of State-Level Verdicts?” Economic & Political Weekly September 2009. Chhibber, Pradeep. Democracy Without Associations: Transformation of the Party System and Social Cleavages in India. Ann Arbor: University of Michigan Press, 1999. Chhibber, Pradeep. “Who Voted for the Bharatiya Janata Party?,” British Journal of Political Science 27, no. 4 (1997): 619-659. Chhibber, Pradeep and Irfan Nooruddin. “Do Party Systems Count? The Number of Parties and Government Performance in the Indian States,” Comparative Political Studies 37, no. 2 (2004): 152-187. Chhibber, Pradeep and John Petrocik. “The Puzzle of Indian Politics: Social Cleavages and the Indian Party System.” British Journal of Political Science 19, no. 2 (1989): 191-2010.

253
Dahl, Robert. Who Governs? New Haven: Yale University Press, 1961. Dalrymple, William. The Last Mughal: The Fall of a Dynasty, Delhi, 1987. London: Bloomsbury Publishing, 2006. Davis James and J. Vernon Henderson. “Evidence on the political economy of the urbanization process.” Journal of Urban Economics 53, no 1 (2003): 98-125. Deshpande, Satish. Contemporary India – A Sociological View. New Delhi: Penguin Books India, 2003. DeVotta Neil. “From ethnic outbidding to ethnic conflict: the institutional bases for Sri Lanka’s separatist war.” Nations and Nationalism 11, no. 1 (2005): 141-159. Diekhoff, Alain and Christophe Jaffrelot, eds. Revisiting Nationalism – Theories and Processes. New York: Palgrave Macmillan Press, 2005. Downs, Anthony. An Economic Theory of Democracy. New York: Harper and Row, 1957. Dunning, Thad and Lauren Harrison. “Cross-Cutting Cleavages and Ethnic Voting: An Experimental Study of Cousinage in Mali.” American Political Science Review 104, no. 1 (2010): 21-39. Eldersveld, S.J., and Bashiruddin Ahmed. Citizens and Politics: Mass Political Behavior in India. Chicago: University of Chicago, 1978. Engineer, Asghar Ali, ed. The Gujarat Carnage. New Delhi: Orient Longman, 2003. Falcao, Vanita Leah. “Urban Patterns of Voting and Party Choices.” Economic & Political Weekly September 26, 2009. Fearon, James and David Laitin. “Explaining interethnic cooperation.” American Political Science Review 90, no. 4 (1996): 715-35. Fernandes, Leela and Patrick Heller. “Hegemonic Aspirations – New Middle Class Politics and India’s Democracy in Comparative Perspective. Critical Asian Studies 38, no. 4 (2006):495-522. Fernandes, Leela. India’s New Middle Class – Democratic Politics in an Era of Economic Reform. Minneapolis: University of Minnesota Press, 2006. Fiorina, Morris. Retrospective Voting in American National Elections. New Haven: Yale University Press, 1981.
254
Frankel, Francine. India’s Political Economy 1947-2004, second edition. Oxford: Oxford University Press, 2005. Gerring, John. Case Study Research – Principles and Practices. Cambridge: Cambridge University Press, 2007 George, Alexander and Andrew Bennett. Case Studies and Theory Development in the Social Sciences. Cambridge: MIT Press, 2005. Gould, Harold and Sumit Ganguly, eds. India Votes - Alliance Politics and Minority Governments in the Ninth and Tenth General Elections. Boulder: Westview Press, 1993. Green, Donald and Ian Shapiro. Pathologies of Rational Choice Theory: A Critique of Applications in Political Science. New Haven: Yale University Press, 1994. Hagopian, Frances, Carlos Gervasoni and Juan Andrews Moraes. “From Patronage to Program – The Emergence of Party-Oriented Legislators in Brazil.” Comparative Political Studies 42, no. 3 (2009): 360-391. Hagopian, Frances. “Parties and Voters in Emerging Democracies.” in The Oxford Handbook of Comparative Politics, edited by Carles Boix and Susan Stokes. Oxford: Oxford University Press, 2007. Hansen, Thomas Blom and Christophe Jaffrelot, eds. The BJP and the Compulsions of Politics in India. Oxford: Oxford University Press, 1998. Hansen, Thomas Blom. The Saffron Wave: Democracy and Hindu Nationalism in Modern India. Princeton: Princeton University Press, 1999. Heath, Anthony. “Anatomy of BJP’s Rise to Power: Social, Regional and Political Expansion in 1990s.” Economic & Political Weekly August 21, 1999. Heath, Anthony and Roger Jeffery, eds. Diversity and Change in Modern India: Economic, Social and Political Approaches. London: Oxford University Press, 2010. Heath, Anthony and Sanjay Kumar, “Why Did Dalits Desert the Bahujan Samaj Party in Uttar Pradesh?” Economic & Political Weekly July 14, 2012. Horowitz, Donald. Ethnic Groups in Conflict. Berkeley: University of California Press, 1985. Huntington, Samuel. Political Order in Changing Societies. New Haven: Yale University Press, 1968. Huntington, Samuel. The Third Wave: Democratization in the Late Twentieth Century. Norman: University of Oklahoma Press, 1991.

255
Jaffrelot, Christophe. “Communal Riots in Gujarat: The State at Risk?” Heidelberg Papers in South Asian and Comparative Politics, South Asia Institute, University of Heidelberg, July, 2003. Jaffrelot, Christophe. The Hindu Nationalist Movement in India. New York: Columbia University Press, 1996. Jaffrelot, Christophe. India’s Silent Revolution: The Rise of the Lower Castes in North India. New York: Columbia University Press and London: Hurst, 2003. Jani, Mahashweta. “Gujarat: BJP Scrapes Through.” Economic & Political Weekly September 26, 2009. Jobe, Jared, Roger Tourangeau and Albert Smith. “Contributions of Survey Research to the Understanding of Memory.” Applied Cognitive Psychology 7, no. 7 (1993): 567-584. Jones, Dawn and Rodney Jones. “Urban Upheaval in India: The 1974 Nav Nirman Riots in Gujarat.” Asian Survey 16, no. 4 (1976): 1012-1033. Kaufmann, Karen. The Urban Voter Group Conflict and Mayoral Voting Behavior in American Cities. Ann Arbor: University of Michigan Press, 2004. Kaufmann, Karen, John Petrocik and Daron Shaw. Unconventional Wisdom – Facts and Myths about American Voters. Oxford: Oxford University Press, 2008. Key, V.O., Jr. The Responsible Electorate: Rationality in Presidential Voting, 1936-1960. Cambridge: Belknap Press of Harvard University Press, 1966. King, Gary, Robert Keohane and Sidney Verba. Designing Social Inquiry: Scientific Inference in Qualitative Research. Princeton: Princeton University Press, 2004. Kinnvall, Caterina. Globalization and Religious Nationalism in India – The Search for Ontological Security. New York: Routledge Press, 2006. Kitschelt, Herbert. “Linkages between Citizens and Politicians in Democratic Countries.” Comparative Political Studies 33, no. 6-7 (2000): 845-879 Kohli, Atul. “Politics of Economic Growth in India, 1980-2005, Parts I and II.” Economic & Political Weekly April 1, 2006. Kumar, Sanjay. “Delhi Assembly Elections: 2008.” Economic & Political Weekly February 7, 2009. Kumar, Sanjay. “Gujarat Assembly Elections 2002 – Analysing the Verdict.” Economic & Political Weekly January 23, 2003.

256
Kumar, Sanjay. “Patterns of Political Participation: Trends and Perspective.” Economic & Political Weekly September 26, 2009. Kumar, Sanjay. “Religious Practices among Indian Hindus: Does that Influence their Political Choices.” Japanese Journal of Political Science 10 no. 3 (2009): 313-332. Kumar, Sanjay, Dhananjai Joshi and Abhay Datar. “Assembly Elections in Delhi: Second Innings for Congress.” Economic & Political Weekly February 7, 2004. Imtiaz, Ahmad, and Helmut Reifeld. Middle Class Values in India & Western Europe. New Delhi: Social Sciences Press, 2002. Laitin, David. Hegemony and Culture. Chicago: University of Chicago Press, 1986. Lazarsfeld, Paul, Bernard Berelson, and Hazel Gaudet. The People's Choice: How the Voter Makes Up His Mind in a Presidential Campaign. New York: Columbia University Press, 1948. Lichbach, Mark I., and Alan S. Zuckerman. Comparative Politics: Rationality, Culture and Structure. Cambridge: Cambridge University Press, 1997. Lieberman, Evan. “Nested Analysis as a Mixed-Method Strategy for Comparative Research.” American Political Science Review 99, no. 3, 2005: 435-452. Lipset, Martin Seymour. Political Man – The Social Bases of Politics, expanded and updated edition. Baltimore: Johns Hopkins Press, 1983. Lipset, Seymour Martin. “Some Social Requisites of Democracy: Economic Development and Political Legitimacy.” American Political Science Review 53, no. 1 (1959): 69-105. Lipset, Seymour Martin and Stein Rokkan. Party Systems and Voter Alignments: Cross-National Perspectives. New York: The Free Press, 1967. Lokniti Team. “National Election Study 2009: A Methodological Note.” Economic & Political Weekly September 26, 2009. Lokniti Team. “National Election Study 2004 Introduction.” Economic & Political Weekly December 18, 2004. Long, J. Scott and Jeremy Freese. Regression Models for Categorical Dependent Variables Using States Second Edition. College Station: Stata Press, 2006. Malik, Yogendra and V.B. Singh. Hindu Nationalists in India: The Rise of the Bharatiya Janata Party. Boulder: Westview Press, 1994.

257
Meyer, Ralph and David Malcolm. “Effects of Economic Change and New Party Formation.” Asian Survey 33, no. 3 (1993): 507-519. Meyer, Ralph. “How Do Indians Vote?” Asian Survey 29, no. 1 (1989): 1111-1122. Miller, Sam. Delhi: Adventures in a Megacity. New York: St. Martin’s Press, 2009. Misra, B.B. The Indian middle classes; their growth in modern times. London: Oxford University Press, 1961. Mohanty, Biswajit. “Delhi Elections: The ‘Local’ Matters.” Economic & Political Weekly September 26, 2009. Morris, Irwin, Joe Oppenheiner and Karol Soltan, eds. Politics from Anarchy to Democracy: Rational Choice in Political Science. Stanford: Stanford University Press, 2004. Munck, Gerardo and Richard Snyder. “Debating the Direction of Comparative Politics: An Analysis of Leading Journals.” Comparative Political Studies 40, no. 1 (2007): 5-31. Nussbaum, Martha. The Clash Within: Democracy, Religious Violence and India’s Future. Cambridge: Harvard University Press, 2007. Palshikar, Suhas. “Tentative Emergence of a New and Tentative Coalition?” Economic & Political Weekly May 23, 2009. Parenti, Michael. “Ethnic Politics and the Persistence of Ethnic Identification.” American Political Science Review 61, no. 3 (1967): 717-726. Patel, Priyavadan. “Gujarat – Anti-incumbency Begins.” Economic & Political Weekly December 18, 2004. Patel, Priyavadan. “Sectarian Mobilization, Communal Polarization and Factionalism: Electoral Dominance of Hindutva and Voting in Gujarat.” Master’s Thesis, University of Baroda, 2003. Patel, Priyavadan. “Sectarian Mobilisation, Factionalism and Voting in Gujarat.” Economic & Political Weekly April 21-28, 1999. Pearson, Margaret. China’s New Business Elite: The Political Consequences of Economic Reform. Berkeley and Los Angeles: University of California Press, 1997. Piven, Frances Fox and Richard Cloward. Why Americans Still Don’t Vote and Why Politicians Want It That Way. Boston: Beacon Press, 2000.
258
Posner, Daniel. Institutions and Ethnic Politics in Africa. Cambridge: Cambridge University Press, 2005. Posner, Daniel. “The Political Salience of Cultural Difference: Why Chewas and Tumbukas are Allies in Zambia and Adversaries in Malawi.” American Political Science Review 98, no. 4 (2004): 529-545. Rai, Praveen. “Issues in General Election 2009.” Economic & Political Weekly September 26, 2009. Raj, Pushkar. “Delhi: Benefitting from Two-Layered Incumbency.” Economic & Political Weekly December 18, 2004. Rabushka, Alvin and Kenneth Shepsle. Politics in plural societies: A theory of democratic instability. Columbus: Charles Merrill, 1972. Rudolph, Lloyd and Susanne Hoeber Rudolph. In Pursuit of Lakshmi – The Political Economy of the Indian State. Chicago: University of Chicago Press, 1987. Scott, James. “Corruption, Machine Politics and Political Change.” The American Political Science Review 63, no. 4 (1969): 1142-1158. Shah, Ghanshyam. “BJP’s Rise to Power.” Economic & Political Weekly January 13-20, 1996. Shah, Ghanshyam. “Communal Riots in Gujarat: Report of a Preliminary Investigation.” Economic & Political Weekly January 1970. Shah, Ghanshyam, “Modi’s political craft: Replica of Assembly Elections.” Unpublished Paper, 2011. Shah, Ghanshyam. “The 1975 Gujarat Assembly Elections in India.” Asian Survey 16, no. 3 (1976): 270-282. Shani, Ornit. Communalism, Caste and Hindu Nationalism – The Violence in Gujarat. Cambridge: Cambridge University Press, 2007. Shastri, Sandeep, K. C. Suri and Yogendra Yadav, eds. Electoral Politics in Indian States: Lok Sabha Elections in 2004 and Beyond. Delhi: Oxford University Press, 2009. Sheth, D.L. “Secularisation of Caste and Making of New Middle Class.” Economic & Political Weekly August 21-29, 1999. Smith, Anthony. Nationalism – Theory, Ideology, History. Cambridge: Cambridge University Press, 2001.
259
Smith, Anthony. Nationalism and Modernism. New York: Routledge, 1998. Spodek, Howard. “From Gandhi to Violence: Ahmedabad’s 1985 Riots in Historical Perspective.” Modern Asian Studies, 23, no. 4 (1989): 765-795. Sridharan, Eswaran. “The Growth and Sectoral Composition of India’s Middle Class: Its Impact on the Politics of Economic Liberalization.” India Review 3, no. 4 (2004): 405-528 Stone, Arthur, Jaylan Turrkan, Christine Bachrach, Jared Jobe, Howard Kurtzman, Virginia Cain, eds. The Science of Self-report: Implications for Research and Practice. London: Lawrence Erbaum Associates, 2000. Söderlund, Peter. “Retrospective Voting and Electoral Volatility: A Nordic Perspective.” Scandinavian Political Studies 31, no. 2 (2008): 217-240. Tarrow, Sidney. “Bridging the Quantitative-Qualitative Divide.” In Rethinking Social Inquiry – Diverse Tools, Shared Standards. Edited by Brady, Henry and David Collier. Oxford: Rowman & Littlefield Publishers, 2004. Tariq Thachil. “Embedded Mobilization: Nonstate Service Provision as Electoral Strategy in India.” World Politics 63, no. 3 (2011): 434-469. Thachil, Tariq. “The Saffron Wave Meets The Silent Revolution: Why The Poor Vote For Hindu Nationalism In India.” PhD Dissertation, Cornell University, 2009. Uslaner, Eric. “Looking Forward and Backward: Prospective and Retrospective Voting in the 1980 Federal Elections in Canada.” British Journal of Political Science. 19, no. 4 (1989): 495-513. Vajpeyi, S.C. and S.P. Verma. “Administrative Set-Up of Delhi.” In Landmarks in Delhi Administration Post-Independence Era 1947-1997. Edited by S.C. Vajpeyi and S.P. Verma. New Delhi: Gyan Publishing House, 1998. Van Der Veer, Peter. “’God Must be Liberated!’ A Hindu Liberation Movement in Ayodhya,” Modern Asian Studies, 21, no. 2 (1987): 283-301. Varshney, Ashutosh. “Contested Meanings: India’s National Identity, Hindu Nationalism, and the Politics of Anxiety.” Daedalus, 122, no. 3 (1993): 227-261. Varshney, Ashutosh. Ethnic Conflict and Civic Life – Hindus and Muslims in India. New Haven: Yale University Press, 2002. Varshney Wilkinson Dataset on Hindu-Muslim Violence in India.

260
Verma Rahul. “What Determines Electoral Outcomes in India? Caste, Class or Voters’ Satisfaction with Government Performance?” Asian Survey 29, no 12 (2012): 270-297. Weiner, Myron. India at the Polls: The Parliamentary Elections of 1977. Washington DC: American Enterprise Institute for Public Policy Research, 1977. Weiner, Myron, ed. State Politics in India. Princeton: Princeton University Press, 1968. Weiner, Myron. The Politics of Scarcity. Chicago: University of Chicago Press, 1962. Weiner, Myron and John Osgood Field, eds. Electoral Politics in the Indian States: Party Systems and Cleavages. New Delhi: Manohar Book Service and Massachusetts Institute of Technology: 1975. Weiner, Myron and John Osgood Field. “India’s Urban Constituencies.” Comparative Politics 8, no. 2 (1976): 183-222. Wilkinson, Steven. Votes and Violence: Electoral competition and ethnic riots in India. Cambridge and New York: Cambridge University Press, 2004. Wilkinson, Steven. “Explaining Changing Patterns of Party-Voter Linkages in India,” in Patrons, Clients and Policies – Patterns of Democratic Accountability and Political Competition.“ Edited by Herbert Kitschelt and Steven Wilkinson. Cambridge: Cambridge University Press, 2007. Wilkinson, Steven, ed. Religious Politics and Communal Violence. Oxford: Oxford University Press, 2005. Wimmer, Andreas. Nationalist Exclusion and Ethnic Conflict – Shadows of Modernity. Cambridge: Cambridge University Press, 2002. Wolfinger, Raymond. “The Development and Persistence of Ethnic Voting.” American Political Science Review 59, no. 4 (1965): 896-908. Yadav, Yogendra. “Reconfiguration in Indian Politics State Assembly Elections 1993-1995.” Economic & Political Weekly January 13, 1996. Yadav, Yogendra and Suhas Palshikar. “Between Fortuna and Virtue: Explaining the Congress’ Ambiguous Victory in 2009.” Economic & Political Weekly September 26, 2009. Yagnik, Achyut and Suchitra Sheth. The Shaping of Modern Gujarat: Plurality, Hindutva and Beyond. New Delhi: Penguin Books, 2005.

261
2. Newspapers, Magazines, Newsletters, and Reports “16 Get Life for 1990 Delhi Riots.” Rediff India Abroad, September 8, 2006. “Anti-Christian Violence on the Rise in India – New Report details politics behind extremist Hindu Attacks.” Human Rights Watch, October 1, 1999. Bradburn, Norman, Lance Rips, and Steven Shevell. “Answering Autobiographical Questions: The Impact of Memory and Inference on Surveys.” Science, April 10, 1987. Bunsha, Dionne. “Gujarat Game Plan.” Frontline, August 3-16, 2002. “Case filed against Varun for inflammatory speech.” India Today, March 17, 2009. Chandhoke, Neeera. “The Tragedy of Ayodhya,” Frontline, June 24-July 7, 2000 Concerned Citizens Tribunal – Gujarat. Crimes Against Humanity – An Inquiry into the Carnage in Gujarat, Vol. I, Mumbai: Citizens for Justice and Peace, 2002. “CPDR Report Sees Saffron Hand in Ahmedabad Riots.” The Indian Express, August 22, 1999. CSDS Team. “Clear line of cleavage in Gujarat.” Frontline, November 27-December 10, 1999. Dasgupta Manas. “No plans to close camps: Modi.” The Hindu, April 1, 2002. Desai, Darshan. “Divorce could be painful for BJP, VHP.” Times of India, June 8, 2005. Drogin, Bob. “Deadly Religious Riots Spread to India’s Capital: Rampaging youths torch homes and shops, residents flee violence stemming from razing of mosque.” Los Angeles Times, December 12, 1992. Engineer, Asghar Ali. “India: Communal Riots: 2009.” South Asia Citizen’s Web, January 2, 2010. Engineer, Asghar Ali. “The BJP and its Roots in Gujarat.” Institute of Islamic Studies and Centre for Study of Society and Secularism, February 1-15, 2000. Gandadhar, V. “We try to rebuild mutual faith and then another riot starts destroying our work.” Rediff News, August 5, 1999. “Godhra verdict: 31 convicted in Sabarmati Express burning case.” Times of India, February 22, 2011.

262
“Gujarat riots toll to go up from 952 to 1,180.” Times of India, February 16, 2009. “How India Voted: Verdict 2009.” The Hindu, May 26, 2009. Human Rights Watch. We Have No Orders to Save You, State Participation and Complicity in Communal Violence in Gujarat, 14(3) April 2002. “In Gujarat, BJP rides the Nano.” The Indian Express, April 8, 2009. Kumar, Devesh. “Saffron Brigade Reacts Soberly.” The Economic Times, October 1, 2010, 2. Kumar, Rohit. “Vital Stats: Communal Violence in India (2005-2009).” PRS Legislative Research, June 15, 2001. “Land Divided, India United.” The Economic Times, October 1, 2010, front page. “Leaders ‘incited’ anti-Sikh riots.” BBC News, August 8, 2005. McKinsey Global Institute. India’s urban awakening: Building Inclusive Cities, Sustaining Economic Growth, April 2010. Montel, Ahluwalia. “State Level Performance Under Economic Reforms in India.” Centre for Research on Economic Development and Policy Reform Conference Paper on Indian Economic Prospects: Advancing Policy Reform, Stanford University, May 2000. Price, Gareth. “How the 2004 Lok Sabha Election was lost.” The Royal Institute for International Affairs Briefing Note, June 23, 2004. Qualitative & Multi-Method Research: Newsletter of the American Political Science Association Organized Section for Qualitative and Multi-Method Research. Rajalakshmi, T.K. “Assembly Elections Capital Contest: In Delhi, Congress hopes to benefit from popular disenchantment with the BJP’s dismal record in office in the territory.” Frontline 15(23), 1998. Ramakrishnan, Venkitesh. “A fresh polarization in Delhi.” Frontline 15(25), 1998. Ramakrishnan, Venkitesh. “The Hindutva Road.” Frontline 21(25), 2004. Saba, Naqvi. “A Beast Asleep?” Outlook India, March 5, 2012. Sanghvi, Vir. “The middle class leaves BJP behind.” Hindustan Times, June 13, 2009. Siddiqui, Tanvir. “In Gujarat, BJP rides the Nano.” The Indian Express, April 8, 2009.

263
“SIT finds no proof against Modi, says court.” The Hindu, April 10, 2012 Sridharan, Eswaran. “The Political Economy of the Middle Classes in Liberalising India.” Institute for South Asian Studies Working Paper 49, September 22, 2008. Timmons, Heather. “A Divisive Indian Official Is Loved by Business.” The New York Times, February 8, 2011. Tripathi, Purnima. “Reworking Strategies.” Frontline 21(3), 2004. V. Venkatesan. “A pracharak as Chief Minister.” Frontline 18(21), 2001. Yadav, Yogendra, Sanjay Kumar and Oliver Heath. “The BJP’s New Social Bloc.” Frontline 16(23), 1999. Yadav, Yogendra. “Are we going through an issueless election?” The Hindu, April 27, 2009. Yadav, Yogendra. “Whither Survey Research? Reflections of on the State of Survey Research on Politics in Most of the World.” Malcolm Adiseshiah Memorial Lecture, 2008. 3. Government Documents Census of India, 2001 Census of India, 2011 Constitution of India Election Commission of India. Statistical Report on General Elections, 1989, to the Ninth Lok Sabha, Volume 1, 1990. Election Commission of India. Statistical Report on General Elections, 1991 to the Tenth Lok Sabha, Vol. I, 1992. Election Commission of India. Statistical Report on General Elections, 1996 to the Eleventh Lok Sabha, Vol. I, 1996. Election Commission of India. Statistical Report on General Elections, 1998 to the 12th Lok Sabha, Vol. I, 1998. Election Commission of India. Statistical Report on General Elections, 1999 to the Thirteenth Lok Sabha, Vol. I, 1999.

264
Election Commission of India. Statistical Report on General Elections, 2004 to the 14th Lok Sabha, Vol. I, 2004. Election Commission of India. Archive of General Elections 2009. Election Commission of India. n.d. Statistical Report on General Elections, 1975 to the Legislative Assembly of Gujarat. Election Commission of India. n.d. Statistical Report on General Elections, 1995 to the Legislative Assembly of Gujarat. Government of National Capital Territory of Delhi, Planning Department. Economic Survey of Delhi 2005-2006. Government of National Capital Territory, Directorate of Economics and Statistics. Employment and Unemployment Situation in Delhi, National Sample Survey 64th Round (July 2007-June 2008) State Sample. Government of National Capital Territory of Delhi, Directorate of Economics and Statistics. Estimates of State Domestic Product 2010-2011. National Council of Applied Economic Research and the Department of Industrial Policy and Promotion, Ministry of Commerce & Industry. FDI in India and its Growth Linkages August 2009. Reserve Bank of India. Handbook of Statistics on Indian Economy 2010-2011. World Bank. Development Indicators for India, http://data.worldbank.org. 4. Party Documents 1998 Bharatiya Janata Party Election Manifesto 1999 National Democratic Alliance (NDA) Election Manifesto 2004 Bharatiya Janata Party Vision Document – 2004 2004 Congress Party Election Manifesto 2009 Bharatiya Janata Party Election Manifesto 2009 Congress Party Election Manifesto
Related Documents