unicef.ca/irc13

Welcome message from author
This document is posted to help you gain knowledge. Please leave a comment to let me know what you think about it! Share it to your friends and learn new things together.
Transcript
unicef.ca/irc13
Visit unicef.ca/irc13 for the full Report Card, infographics and background papers.
Editor-in-Chief: Lisa WolffCreative Director: Meghan D’MelloArt Director: Man Greig Farin
UNICEF Canada extends our gratitude to the young people whose quotes appear in this report, from workshops convened in 2015 by UNICEF Canada and the International Institute for Child Rights and Development, and from youth blogs posted at unicef.ca/blog.
Aussi disponible en francais.
Extracts from this publication (at unicef.ca/irc13) may be reproduced with due acknowledgement. Requests to utilize larger portions or the full publication should be addressed to [email protected].
We suggest the following citation:UNICEF Canada (2016). UNICEF Report Card 13: Canadian Companion, Fairness for Children. UNICEF Canada, Toronto.
For more information about UNICEF Canada: call 1 800 567 4483 or email [email protected] Registration No. 122680572 RR0001
CANADIAN COMPANION UNICEF REPORT CARD 13Fairness for Children: A league table of inequality in child well-being in rich countries
ii
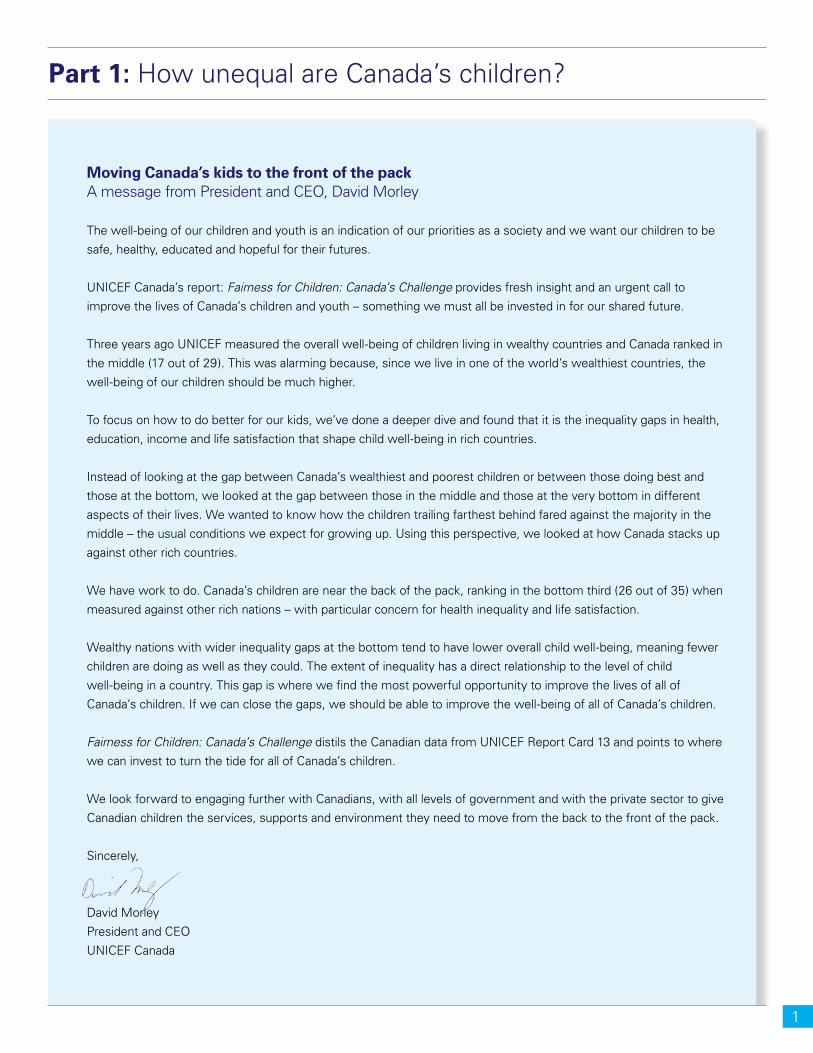
Moving Canada’s kids to the front of the packA message from President and CEO, David Morley
The well-being of our children and youth is an indication of our priorities as a society and we want our children to be
safe, healthy, educated and hopeful for their futures.
UNICEF Canada’s report: Fairness for Children: Canada’s Challenge provides fresh insight and an urgent call to
improve the lives of Canada’s children and youth – something we must all be invested in for our shared future.
Three years ago UNICEF measured the overall well-being of children living in wealthy countries and Canada ranked in
the middle (17 out of 29). This was alarming because, since we live in one of the world’s wealthiest countries, the
well-being of our children should be much higher.
To focus on how to do better for our kids, we’ve done a deeper dive and found that it is the inequality gaps in health,
education, income and life satisfaction that shape child well-being in rich countries.
Instead of looking at the gap between Canada’s wealthiest and poorest children or between those doing best and
those at the bottom, we looked at the gap between those in the middle and those at the very bottom in different
aspects of their lives. We wanted to know how the children trailing farthest behind fared against the majority in the
middle – the usual conditions we expect for growing up. Using this perspective, we looked at how Canada stacks up
against other rich countries.
We have work to do. Canada’s children are near the back of the pack, ranking in the bottom third (26 out of 35) when
measured against other rich nations – with particular concern for health inequality and life satisfaction.
Wealthy nations with wider inequality gaps at the bottom tend to have lower overall child well-being, meaning fewer
children are doing as well as they could. The extent of inequality has a direct relationship to the level of child
well-being in a country. This gap is where we find the most powerful opportunity to improve the lives of all of
Canada’s children. If we can close the gaps, we should be able to improve the well-being of all of Canada’s children.
Fairness for Children: Canada’s Challenge distils the Canadian data from UNICEF Report Card 13 and points to where
we can invest to turn the tide for all of Canada’s children.
We look forward to engaging further with Canadians, with all levels of government and with the private sector to give
Canadian children the services, supports and environment they need to move from the back to the front of the pack.
Sincerely,
David Morley
President and CEO
UNICEF Canada
Part 1: How unequal are Canada’s children?
1
Every child, in every society, has the right to a fair start in life… To the degree that any society is blind to this issue, it also fails to see its future self-interest. Because these disparities create lasting divisions – economic divisions and social divisions – that are not easily overcome. They can reverberate through generations, at great cost to us all.
Tony Lake, UNICEF Executive Director
Inequality has a child’s face
1 By 2009, the poorest 10 percent of families earned $21,000 and the wealthiest $246,000 (Save the Children Fund 2012).2 UNICEF Canada relies on the definition of ’children’ as children and adolescents from birth to age 18, consistent with article 1 of the United Nations Convention on the Rights
of the Child.
The income gap has widened over the past three decades in most high-income countries, including Canada 1. Inequality – in income, health and other aspects of the lives of Canadians – has become a defining characteristic of our society. A question that should be asked is, “how unequal are Canada’s children 2?” UNICEF’s Report Card 13 shows that by some measures they are more unequal that we would expect given Canada’s level of income inequality.
This ’Canadian Companion’ to the Report Card focuses on Canada’s performance: How far behind does Canada allow some children to fall? What does this mean for our progress as a nation? What will it take to close the gaps? In UNICEF Report Card 13, we put children in the inequality debates and ask Canadians to consider these questions.
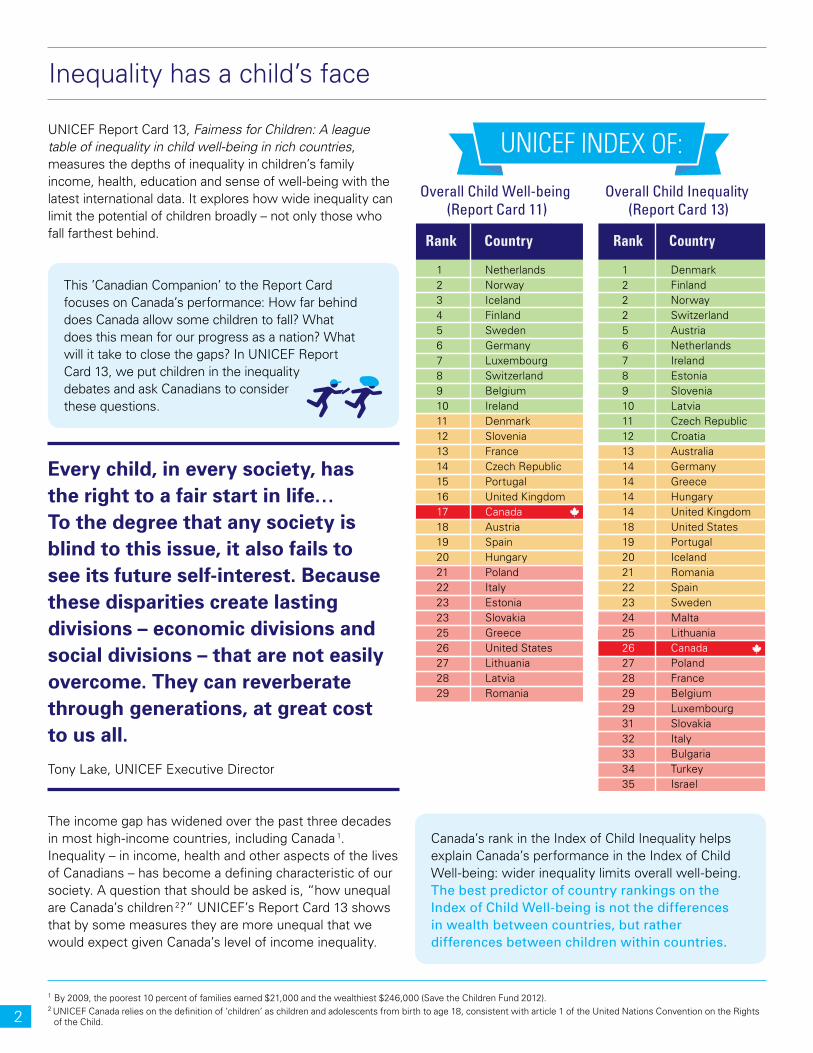
Canada’s rank in the Index of Child Inequality helps explain Canada’s performance in the Index of Child Well-being: wider inequality limits overall well-being. The best predictor of country rankings on the Index of Child Well-being is not the differences in wealth between countries, but rather differences between children within countries.
Overall Child Well-being (Report Card 11)
Overall Child Inequality (Report Card 13)
UNICEF INDEX OF:
1 Netherlands2 Norway3 Iceland4 Finland5 Sweden6 Germany7 Luxembourg8 Switzerland9 Belgium10 Ireland11 Denmark12 Slovenia13 France14 Czech Republic15 Portugal16 United Kingdom17 Canada18 Austria19 Spain20 Hungary21 Poland22 Italy23 Estonia23 Slovakia25 Greece26 United States27 Lithuania28 Latvia29 Romania
1 Denmark2 Finland2 Norway2 Switzerland5 Austria6 Netherlands7 Ireland8 Estonia9 Slovenia10 Latvia11 Czech Republic12 Croatia13 Australia14 Germany14 Greece14 Hungary14 United Kingdom18 United States19 Portugal20 Iceland21 Romania22 Spain23 Sweden24 Malta25 Lithuania26 Canada27 Poland28 France29 Belgium29 Luxembourg31 Slovakia32 Italy33 Bulgaria34 Turkey35 Israel
Rank Country Rank Country
UNICEF Report Card 13, Fairness for Children: A league table of inequality in child well-being in rich countries, measures the depths of inequality in children’s family income, health, education and sense of well-being with the latest international data. It explores how wide inequality can limit the potential of children broadly – not only those who fall farthest behind.
2
In 2013, Canada ranked in the middle of UNICEF’s Index of Child Well-being at 17 of 29 rich countries (UNICEF Office of Research 2013). The Index is a composite of national averages of key indicators including child poverty, health and education. Many of the 26 indicators had improved on average in Canada over the previous decade, but not at the pace of other rich countries. When children reported their own sense of well-being, Canada’s rank fell to 24 of 29 countries, a significant decline over the previous decade.
In Report Card 13, the focus shifts from national averages to the gaps between children at the bottom and children in the middle of our society, with the complementary UNICEF Index of Child Inequality. Canada ranks in the bottom third, at 26 of 35 nations 3. Canada is one of the more unequal societies for children; the gaps between Canada’s children in many aspects of their lives are wider than in many rich countries and wider than our moderate level of income inequality would predict. However, in some of the indicators we measure, the gaps are not much wider than higher ranking nations because the differences between nations are small. In some, Canada’s children achieve better absolute outcomes than higher-ranking, more equal nations. But the point is, wide gaps within rich countries are unnecessary and they come with a variety of unwelcome impacts.
Of equal concern is the general lack of progress to close the gaps. While income inequality may have levelled off over the past decade in Canada, some of the gaps between children have continued to widen. Canada is one of a handful of countries (including France, Iceland and
3 41 countries of the European Union (EU) and the Organisation for Economic Co-operation and Development (OECD)
© U
NIC
EF
CA
NA
DA
/201
0/S
RI U
TAM
I
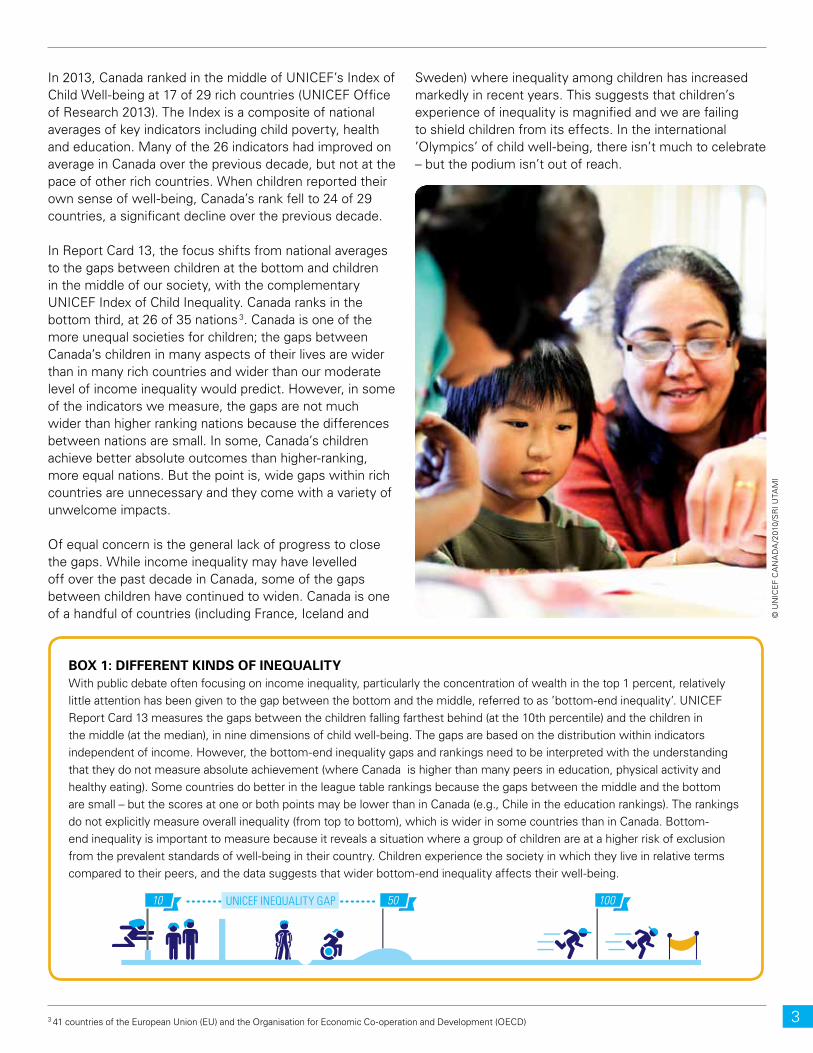
BOX 1: DIFFERENT KINDS OF INEQUALITYWith public debate often focusing on income inequality, particularly the concentration of wealth in the top 1 percent, relatively little attention has been given to the gap between the bottom and the middle, referred to as ’bottom-end inequality’. UNICEF Report Card 13 measures the gaps between the children falling farthest behind (at the 10th percentile) and the children in the middle (at the median), in nine dimensions of child well-being. The gaps are based on the distribution within indicators independent of income. However, the bottom-end inequality gaps and rankings need to be interpreted with the understanding that they do not measure absolute achievement (where Canada is higher than many peers in education, physical activity and healthy eating). Some countries do better in the league table rankings because the gaps between the middle and the bottom are small – but the scores at one or both points may be lower than in Canada (e.g., Chile in the education rankings). The rankings do not explicitly measure overall inequality (from top to bottom), which is wider in some countries than in Canada. Bottom-end inequality is important to measure because it reveals a situation where a group of children are at a higher risk of exclusion from the prevalent standards of well-being in their country. Children experience the society in which they live in relative terms compared to their peers, and the data suggests that wider bottom-end inequality affects their well-being.
10 50 100UNICEF INEQUALITY GAP
Sweden) where inequality among children has increased markedly in recent years. This suggests that children’s experience of inequality is magnified and we are failing to shield children from its effects. In the international ’Olympics’ of child well-being, there isn’t much to celebrate – but the podium isn’t out of reach.
3
Comparing inequality across rich countries
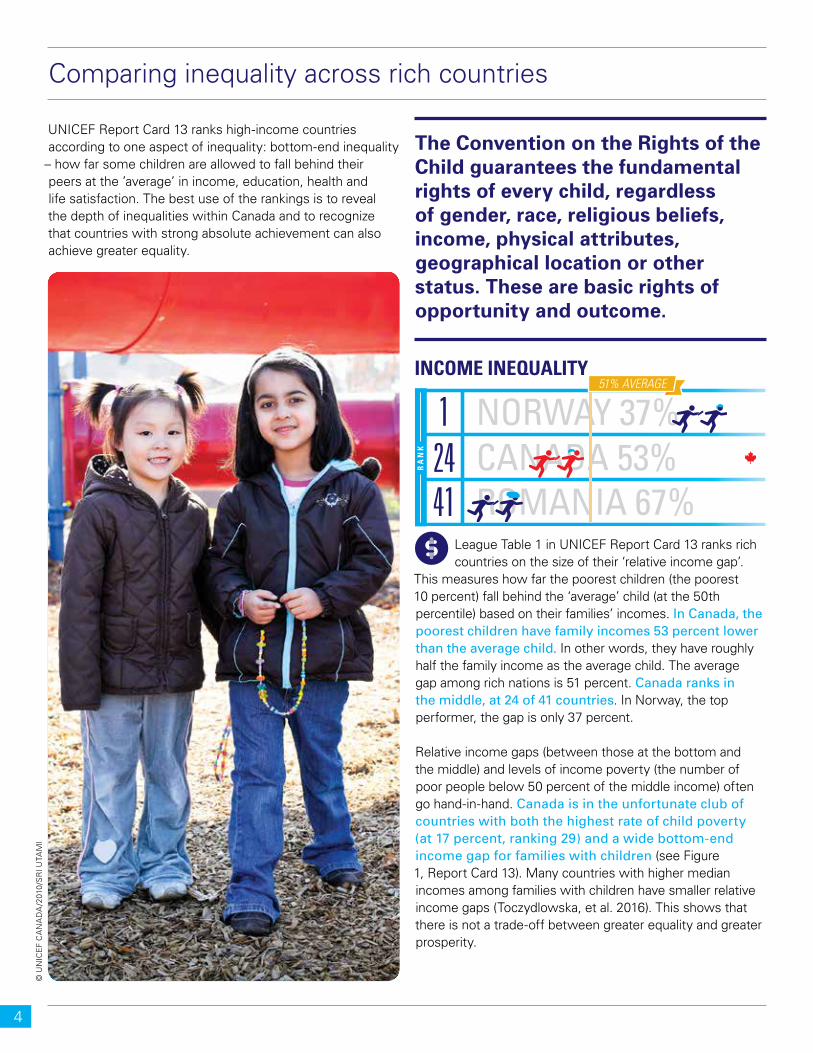
League Table 1 in UNICEF Report Card 13 ranks rich countries on the size of their ‘relative income gap’.
This measures how far the poorest children (the poorest 10 percent) fall behind the ‘average’ child (at the 50th percentile) based on their families’ incomes. In Canada, the poorest children have family incomes 53 percent lower than the average child. In other words, they have roughly half the family income as the average child. The average gap among rich nations is 51 percent. Canada ranks in the middle, at 24 of 41 countries. In Norway, the top performer, the gap is only 37 percent.
Relative income gaps (between those at the bottom and the middle) and levels of income poverty (the number of poor people below 50 percent of the middle income) often go hand-in-hand. Canada is in the unfortunate club of countries with both the highest rate of child poverty (at 17 percent, ranking 29) and a wide bottom-end income gap for families with children (see Figure 1, Report Card 13). Many countries with higher median incomes among families with children have smaller relative income gaps (Toczydlowska, et al. 2016). This shows that there is not a trade-off between greater equality and greater prosperity.
UNICEF Report Card 13 ranks high-income countries according to one aspect of inequality: bottom-end inequality
– how far some children are allowed to fall behind their peers at the ’average’ in income, education, health and life satisfaction. The best use of the rankings is to reveal the depth of inequalities within Canada and to recognize that countries with strong absolute achievement can also achieve greater equality.
INCOME INEQUALITY51% AVERAGE
NORWAY 37%12441
CANADA 53%ROMANIA 67%
RA
NK
The Convention on the Rights of the Child guarantees the fundamental rights of every child, regardless of gender, race, religious beliefs, income, physical attributes, geographical location or other status. These are basic rights of opportunity and outcome.
© U
NIC
EF
CA
NA
DA
/201
0/S
RI U
TAM
I
4

League Table 2 ranks rich countries on the size of their ‘educational achievement gap’. This measures
how far low-achieving students (with scores at the 10th percentile) fall behind the child with a median PISA score in reading, maths and science literacy at the age of 15. In Canada, the gap is 0.3 points 4. The average gap among rich nations is 0.5 points, with Canada placing close to the average and ranking 14 of 37 countries 5.
We also compare the proportion of students who fall below a standard proficiency level in all three subjects, which signifies profound educational disadvantage and a lack of basic skills. In Canada, 6 percent of children fall below this standard, which is much better than the league table average of 12 percent. Canada ranks in 6th place. Estonia is the best performer with only 3 percent of children falling below the standard, half the rate in Canada. Canada is among the 10 nations that manage to combine a smaller achievement gap with a lower proportion of children falling below the basic proficiency standard. Minimizing the achievement gap does not require countries to ’trade’ equality off against high academic performance (see UNICEF Report Card 13, Figure 2).
League Table 3 ranks rich countries on the size of the gap in children’s self-reported ‘health symptoms’.
Children aged 11, 13 and 15 were asked how often in the previous six months they had experienced headache, stomach ache, backache, feeling low, irritability or bad temper, feeling nervous, difficulties in getting to sleep or feeling dizzy. The response options were “about every day”, “more than once a week”, “about every week”, “about every month” and
“rarely or never”. In Canada, the health score of children at the bottom of the distribution is 29 percent lower than children in the middle. The gap isn’t much wider than the best performer (Austria with 24 percent) and it is close to the average gap among rich countries. However, because of the tight distribution Canada is among the bottom third of peer nations in health inequality, at 24 of 35 countries.
The proportion of children in Canada who report one or more health complaints everyday – an indication of absolute severity in health symptoms – is 23 percent. This is very close to the average among rich countries, which is 24 percent, but much higher than the low of 15 percent in Norway and Finland. Canada ranks in 16th place.
There are many dimensions of children’s health that could be measured. Self-reported health symptoms provides a poignant view of the frequency with which so many children navigate their daily lives feeling in poor physical and mental health; one quarter of children, on a daily basis. Frequent health complaints are usually an expression of stressful situations and relationships at home, at school or among peers (Currie, et al 2010). If the physical, mental and emotional resources children have to get through the day are significantly weakened, it influences other aspects of their development. A similar proportion of older youth (aged 15–24) is estimated to experience mental illness on an annual basis – the age group with the highest rate of mental illness in Canada (CAMH 2012). Although the links to mental illness in older youth are not entirely clear, adolescent health symptoms can persist into adulthood (Chzhen et. al. 2016a). Norway and Finland demonstrate that it is possible to at least halve the number of children who report feeling unwell every day.
4 The score-point differences in each subject are converted into cross-country z-scores, which are then averaged across subjects to provide an overall achievement gap for each country, with positive scores denoting lower inequality5 Figures between -0.5 and 0.5 are considered close enough to be indistinguishable from the average.
EDUCATION INEQUALITY
CHILE 1.91437
CANADA 0.3ISRAEL -2.0
10.5 AVERAGE
RA
NK
HEALTH INEQUALITY
AUSTRIA 24%12435
CANADA 29%ISRAEL 39%
28% AVERAGE
RA
NK
5
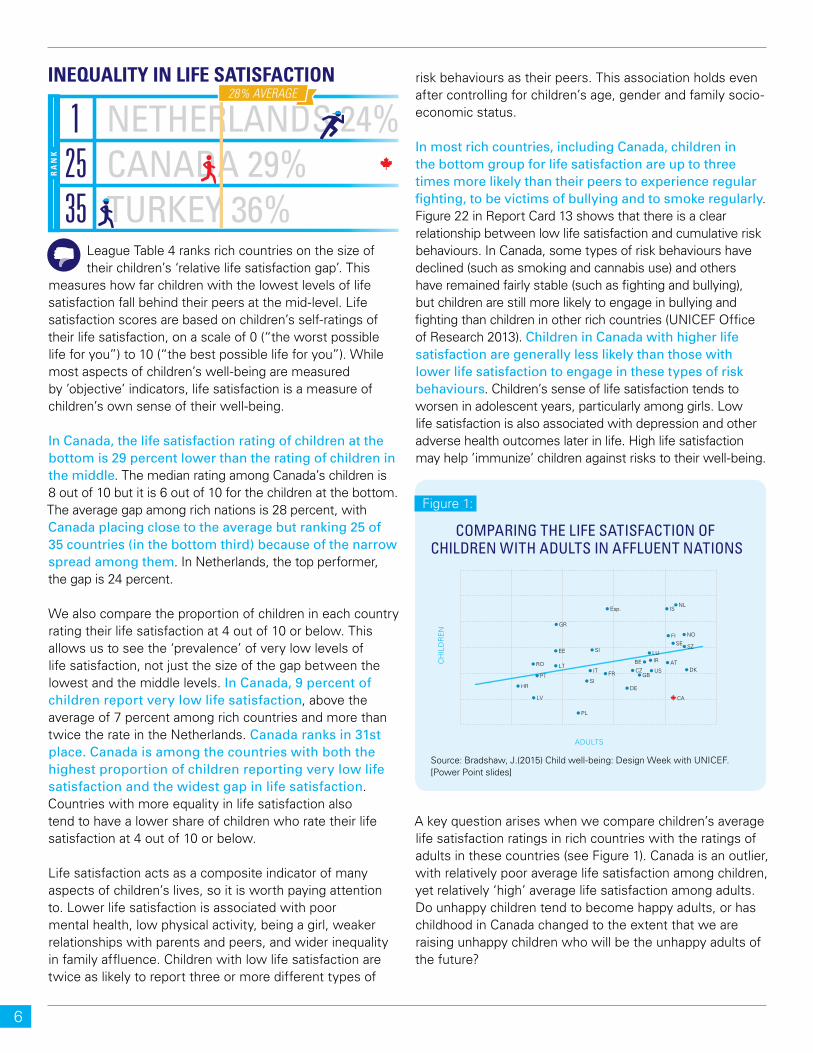
League Table 4 ranks rich countries on the size of their children’s ‘relative life satisfaction gap’. This
measures how far children with the lowest levels of life satisfaction fall behind their peers at the mid-level. Life satisfaction scores are based on children’s self-ratings of their life satisfaction, on a scale of 0 (“the worst possible life for you”) to 10 (“the best possible life for you”). While most aspects of children’s well-being are measured by ’objective’ indicators, life satisfaction is a measure of children’s own sense of their well-being.
In Canada, the life satisfaction rating of children at the bottom is 29 percent lower than the rating of children in the middle. The median rating among Canada’s children is 8 out of 10 but it is 6 out of 10 for the children at the bottom. The average gap among rich nations is 28 percent, with Canada placing close to the average but ranking 25 of 35 countries (in the bottom third) because of the narrow spread among them. In Netherlands, the top performer, the gap is 24 percent.
We also compare the proportion of children in each country rating their life satisfaction at 4 out of 10 or below. This allows us to see the ‘prevalence’ of very low levels of life satisfaction, not just the size of the gap between the lowest and the middle levels. In Canada, 9 percent of children report very low life satisfaction, above the average of 7 percent among rich countries and more than twice the rate in the Netherlands. Canada ranks in 31st place. Canada is among the countries with both the highest proportion of children reporting very low life satisfaction and the widest gap in life satisfaction. Countries with more equality in life satisfaction also tend to have a lower share of children who rate their life satisfaction at 4 out of 10 or below.
Life satisfaction acts as a composite indicator of many aspects of children’s lives, so it is worth paying attention to. Lower life satisfaction is associated with poor mental health, low physical activity, being a girl, weaker relationships with parents and peers, and wider inequality in family affluence. Children with low life satisfaction are twice as likely to report three or more different types of
risk behaviours as their peers. This association holds even after controlling for children’s age, gender and family socio-economic status.
In most rich countries, including Canada, children in the bottom group for life satisfaction are up to three times more likely than their peers to experience regular fighting, to be victims of bullying and to smoke regularly. Figure 22 in Report Card 13 shows that there is a clear relationship between low life satisfaction and cumulative risk behaviours. In Canada, some types of risk behaviours have declined (such as smoking and cannabis use) and others have remained fairly stable (such as fighting and bullying), but children are still more likely to engage in bullying and fighting than children in other rich countries (UNICEF Office of Research 2013). Children in Canada with higher life satisfaction are generally less likely than those with lower life satisfaction to engage in these types of risk behaviours. Children’s sense of life satisfaction tends to worsen in adolescent years, particularly among girls. Low life satisfaction is also associated with depression and other adverse health outcomes later in life. High life satisfaction may help ’immunize’ children against risks to their well-being.
A key question arises when we compare children’s average life satisfaction ratings in rich countries with the ratings of adults in these countries (see Figure 1). Canada is an outlier, with relatively poor average life satisfaction among children, yet relatively ‘high’ average life satisfaction among adults. Do unhappy children tend to become happy adults, or has childhood in Canada changed to the extent that we are raising unhappy children who will be the unhappy adults of the future?
INEQUALITY IN LIFE SATISFACTION
NETHERLANDS 24%12535
CANADA 29%TURKEY 36%
28% AVERAGE
RA
NK
COMPARING THE LIFE SATISFACTION OF CHILDREN WITH ADULTS IN AFFLUENT NATIONS
CH
ILD
RE
N
ADULTS
NLIS
NOFISE SZ
IRLU
BE
CZFRSI
IT
LV
HR
PT
LTDK
CA
PL
DE
GBUS
AT
Esp.
SI
GR
EE
RO
Figure 1:
Source: Bradshaw, J.(2015) Child well-being: Design Week with UNICEF. [Power Point slides]
6
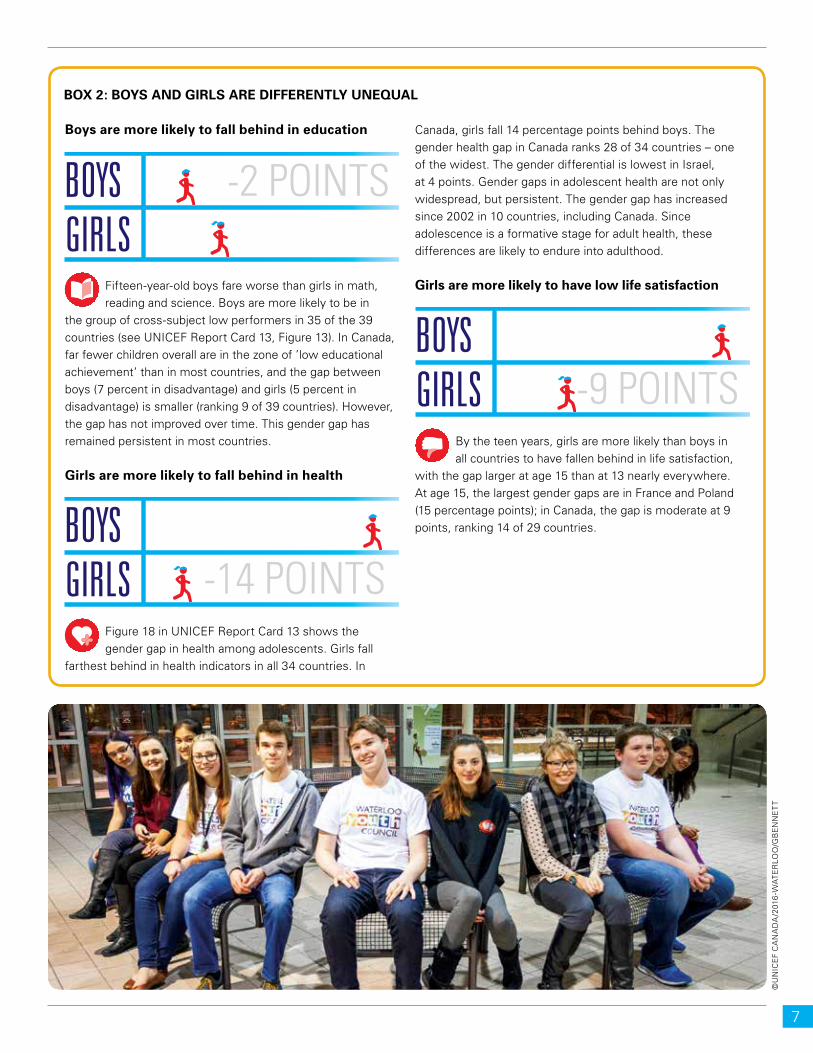
Boys are more likely to fall behind in education
Fifteen-year-old boys fare worse than girls in math, reading and science. Boys are more likely to be in
the group of cross-subject low performers in 35 of the 39 countries (see UNICEF Report Card 13, Figure 13). In Canada, far fewer children overall are in the zone of ’low educational achievement’ than in most countries, and the gap between boys (7 percent in disadvantage) and girls (5 percent in disadvantage) is smaller (ranking 9 of 39 countries). However, the gap has not improved over time. This gender gap has remained persistent in most countries.
Girls are more likely to fall behind in health
Figure 18 in UNICEF Report Card 13 shows the gender gap in health among adolescents. Girls fall
farthest behind in health indicators in all 34 countries. In
Canada, girls fall 14 percentage points behind boys. The gender health gap in Canada ranks 28 of 34 countries – one of the widest. The gender differential is lowest in Israel, at 4 points. Gender gaps in adolescent health are not only widespread, but persistent. The gender gap has increased since 2002 in 10 countries, including Canada. Since adolescence is a formative stage for adult health, these differences are likely to endure into adulthood.
Girls are more likely to have low life satisfaction
By the teen years, girls are more likely than boys in all countries to have fallen behind in life satisfaction,
with the gap larger at age 15 than at 13 nearly everywhere. At age 15, the largest gender gaps are in France and Poland (15 percentage points); in Canada, the gap is moderate at 9 points, ranking 14 of 29 countries.
BOYS GIRLS
-2 POINTS
BOYS GIRLS -9 POINTS
BOYS GIRLS -14 POINTS
BOX 2: BOYS AND GIRLS ARE DIFFERENTLY UNEQUAL
©U
NIC
EF
CA
NA
DA
/201
6-W
ATE
RLO
O/G
BE
NN
ET
T
7
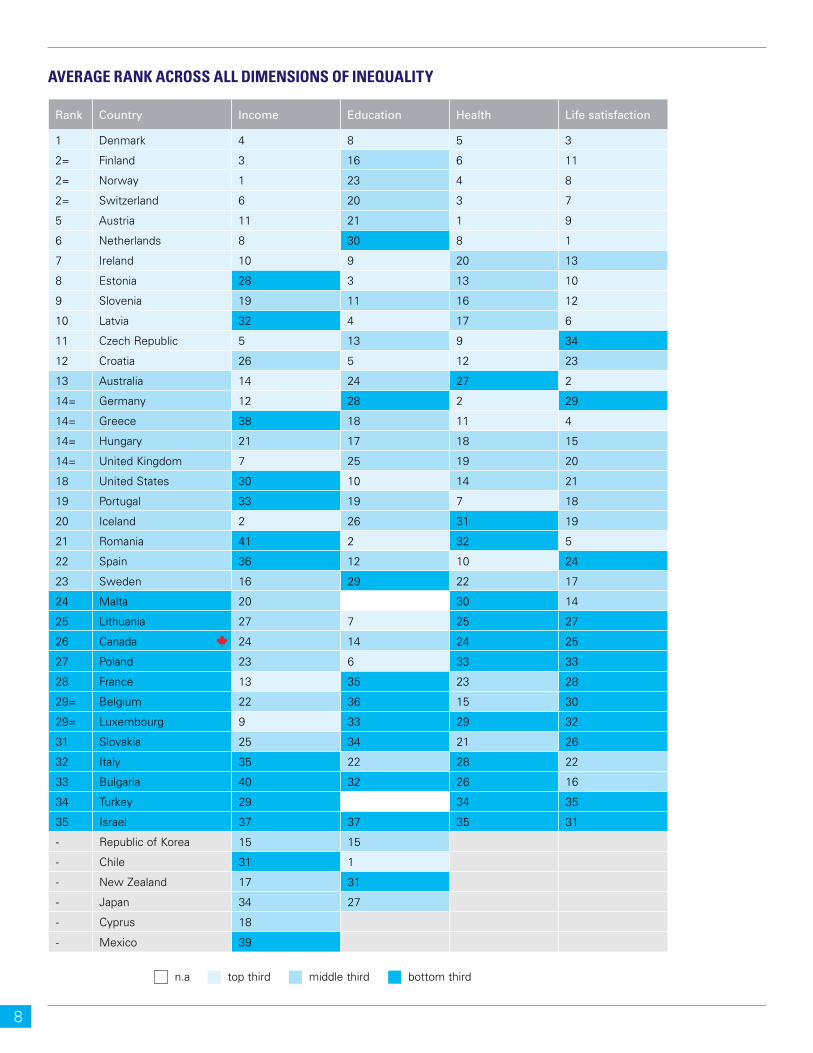
Rank Country Income Education Health Life satisfaction
1 Denmark 4 8 5 3
2= Finland 3 16 6 11
2= Norway 1 23 4 8
2= Switzerland 6 20 3 7
5 Austria 11 21 1 9
6 Netherlands 8 30 8 1
7 Ireland 10 9 20 13
8 Estonia 28 3 13 10
9 Slovenia 19 11 16 12
10 Latvia 32 4 17 6
11 Czech Republic 5 13 9 34
12 Croatia 26 5 12 23
13 Australia 14 24 27 2
14= Germany 12 28 2 29
14= Greece 38 18 11 4
14= Hungary 21 17 18 15
14= United Kingdom 7 25 19 20
18 United States 30 10 14 21
19 Portugal 33 19 7 18
20 Iceland 2 26 31 19
21 Romania 41 2 32 5
22 Spain 36 12 10 24
23 Sweden 16 29 22 17
24 Malta 20 30 14
25 Lithuania 27 7 25 27
26 Canada 24 14 24 25
27 Poland 23 6 33 33
28 France 13 35 23 28
29= Belgium 22 36 15 30
29= Luxembourg 9 33 29 32
31 Slovakia 25 34 21 26
32 Italy 35 22 28 22
33 Bulgaria 40 32 26 16
34 Turkey 29 34 35
35 Israel 37 37 35 31
- Republic of Korea 15 15
- Chile 31 1
- New Zealand 17 31
- Japan 34 27
- Cyprus 18
- Mexico 39
n.a top third middle third bottom third
AVERAGE RANK ACROSS ALL DIMENSIONS OF INEQUALITY
8
narrowing of the gap: the incomes at both the 10th percentile and the median grew, although those at the 10th percentile increased faster.
HOW HAS EDUCATIONAL INEQUALITY CHANGED?Despite widening income inequality, two-thirds of affluent nations managed to reduce inequality in educational achievement 6 while improving median test scores. Canada is the only country that experienced a decline in inequality in a negative way – through a fall in median test scores.
Only a quarter of rich countries, including Canada, experienced an increase in absolute educational disadvantage; the rest managed to decrease the proportion of children in disadvantage (the percentage of children who fall below PISA proficiency level 2 in all three subjects). Canada ranks 31 out of 41 countries, having experienced an increase from 5 to 6 percent of children. Again, the trend is negative but not enough to erode comparatively good performance. In Canada, widening gaps in children’s health and income may be affecting equality in educational achievement after many years of “buffering” socio-economic disadvantage by the education system.
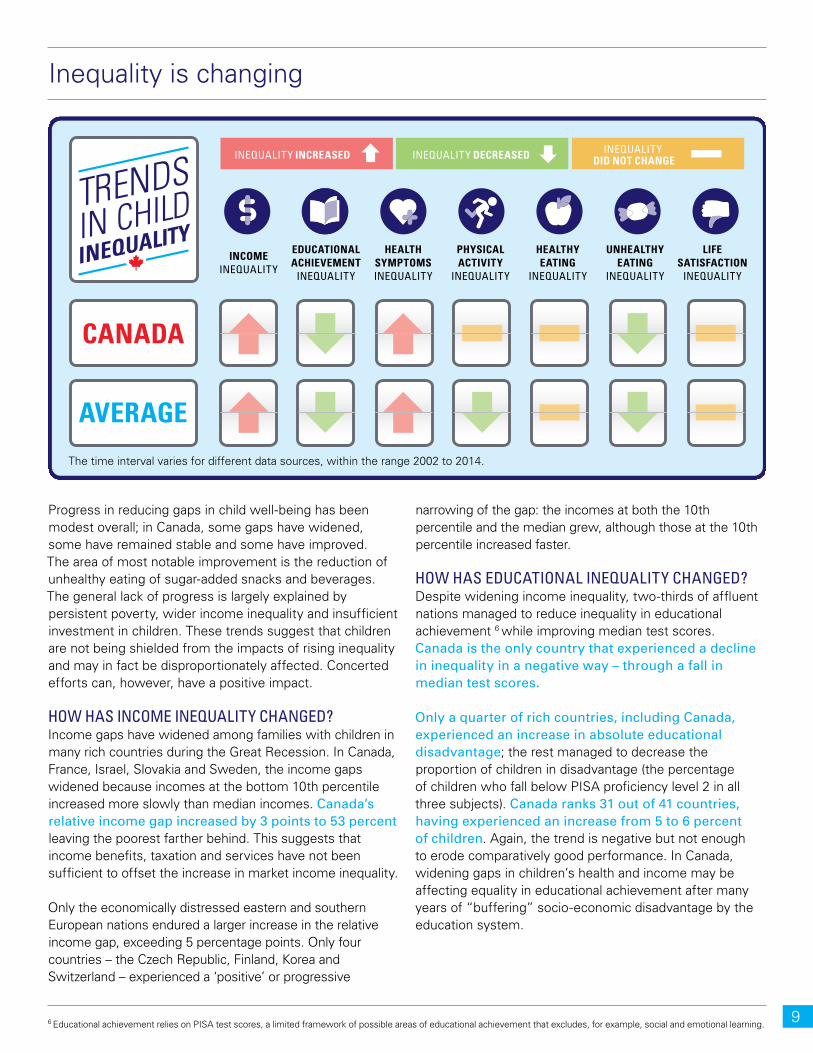
Progress in reducing gaps in child well-being has been modest overall; in Canada, some gaps have widened, some have remained stable and some have improved. The area of most notable improvement is the reduction of unhealthy eating of sugar-added snacks and beverages. The general lack of progress is largely explained by persistent poverty, wider income inequality and insufficient investment in children. These trends suggest that children are not being shielded from the impacts of rising inequality and may in fact be disproportionately affected. Concerted efforts can, however, have a positive impact.
HOW HAS INCOME INEQUALITY CHANGED? Income gaps have widened among families with children in many rich countries during the Great Recession. In Canada, France, Israel, Slovakia and Sweden, the income gaps widened because incomes at the bottom 10th percentile increased more slowly than median incomes. Canada’s relative income gap increased by 3 points to 53 percent leaving the poorest farther behind. This suggests that income benefits, taxation and services have not been sufficient to offset the increase in market income inequality.
Only the economically distressed eastern and southern European nations endured a larger increase in the relative income gap, exceeding 5 percentage points. Only four countries – the Czech Republic, Finland, Korea and Switzerland – experienced a ‘positive’ or progressive
Inequality is changing
6 Educational achievement relies on PISA test scores, a limited framework of possible areas of educational achievement that excludes, for example, social and emotional learning.
INCOMEINEQUALITY
INEQUALITY INCREASED INEQUALITY DECREASED INEQUALITY DID NOT CHANGE
EDUCATIONALACHIEVEMENT
INEQUALITY
HEALTHSYMPTOMSINEQUALITY
PHYSICALACTIVITY
INEQUALITY
HEALTHYEATING
INEQUALITY
UNHEALTHYEATING
INEQUALITY
LIFESATISFACTION
INEQUALITY
CANADA
AVERAGE
TRENDS
IN CHILDINEQUALITY
The time interval varies for different data sources, within the range 2002 to 2014.
9

Slovenia. The chances of falling behind in health are not the same for all children. In the majority of countries, those from less-affluent households have the poorest health outcomes (Chzhen, et al. 2016b). However, gender disparity is more widespread and persistent than income related disparity (see Box 3).
HOW HAS HEALTH INEQUALITY CHANGED?The UNICEF Index of Child Inequality measures gaps in children’s self-reported health symptoms. Three additional markers of child health – physical activity, healthy eating and unhealthy eating – present a fuller picture of the change in child health and health-related behaviours. These indicators are measured in adolescence, and exclude some important markers of young child health including infant mortality and low birthweight. Their value lies in what they tell us about the accumulated inequality in children’s living conditions that is likely to show up in the future health of Canada’s population.
In Canada, there are wide gaps between children in all health indicators. However, some of the widest gaps between Canada’s children (in unhealthy eating, healthy eating and physical activity) are smaller than in many peer nations. On the other hand, there is a smaller gap between Canada’s children in self-reported health symptoms but it is wider than in most peer nations (by a small margin).
The complexity of the drivers of health inequality is underlined by the fact that the vast majority of affluent nations have experienced rising inequality in some health-related outcomes, yet narrowed inequality in others. The gap in children’s health complaints widened in Canada; however, in other areas, the gaps have stabilized (physical activity and healthy eating) or narrowed (unhealthy eating). Most countries place in the top half for some indicators and in the bottom half for others. It is difficult to draw general conclusions about why exactly countries end up at the top or the bottom of the rankings in these four health indicators.
One thing is clear: overall improvement in health will be difficult to achieve without closing the gaps. National averages are highly correlated with the size of the gaps in these health-related measures (Chzhen, et al. 2016a). The wider the gaps in health indicators, the worse the overall averages. Children are more likely to report frequent poor health symptoms and there is lower average physical activity, lower average healthy eating and higher average unhealthy eating in countries where there are also wider inequalities in these measures. The relationship between the extent of inequality in and the average level of unhealthy eating is particularly strong (see UNICEF Report Card 13, Figure 19).
The gap in self-reported health symptoms widened in most countries including Canada, (see UNICEF Report Card 13, Figure 14). In Canada, the gap widened by 3 percentage points to 29 percent because the children at the bottom lost ground more than the children in the middle. In contrast, the largest increases in inequality (of at least 6 percentage points) occurred in Ireland, Malta, Poland and
7 The Health Behaviours in School Aged Children survey defines physical activity as “any activity that increases your heart rate and makes you get out of breath some of the time”. This definition is consistent with the Canadian Physical Activity Guidelines for Children and Youth aged 5-17.
Inequality in physical activity decreased in the majority of the countries and remained stable in Canada. Although the gap remains wide in Canada at 47 percentage points, it is not far from the smallest gap in Finland (43 percent). Pronounced reductions in inequality of 6 percentage points or more occurred in Finland, France, Malta, Norway and Spain (see UNICEF Report Card 13, Figure 15). Regular exercise is important for adolescent well-being. Children reported the number of days in the preceding week in which they engaged in physical activity for at least 60 minutes a day, as recommended by the World Health Organization 7. Children’s responses are on a scale from 0 to 7 days a week. The ’average’ Canadian child gets 60 minutes 5 days per week, but the children at the bottom of the distribution only 3 days. On average, 1 in 5 Canadian children meets the daily activity recommendation.
Inequality in healthy eating of fruits and vegetables narrowed in only a third of countries. It remained stable in a third of countries including Canada (at 46 percent), and increased in six (see Report Card 13, Figure 16). Canada’s gap is smaller than the average gap but still very wide. The gaps narrowed the most – by at least 6 percentage points
– in Malta, Hungary, Denmark, Norway and Spain. The persistence of the gaps in physical activity and healthy eating are likely related to persistent levels of poverty.
Inequality in unhealthy eating of snacks and beverages that are high in added sugar varies greatly, but declined in most countries including Canada. Excess consumption of added sugar in food and beverages is often linked to poor health outcomes – poor dental health, obesity and diabetes. Children reported how often during the past week they consumed “sweets (candy or chocolate)” and “Coke or other soft drinks that contain sugar”. The vast majority of countries, 25 of 34, reduced inequality in unhealthy eating by at least 2 percentage points (see UNICEF Report Card 13, Figure 17). In all cases, this came about because the rate of consumption at the bottom improved more than the
The growing gaps suggest that life is becoming more difficult for the most excluded children as social inequality has widened, and it is showing up in their physical and mental health.
10
BOX 3: DO CHILDREN NOTICE WHEN THEY ARE UNEQUAL? Life satisfaction and health symptom data suggest that wide social inequalities affect children’s sense of well-being. In rich countries, poverty deprives some children of basic conditions, but it is more commonly a problem of relativity – having access to fewer material resources and being excluded from activities seen to be ’normal’. Adolescents experience the world relative to their peers (Toczydlowska, et al. 2016). As well, different cultures or societies shape children’s expectations differently. Some cultures ’teach’ children to be satisfied with what they have while others place more importance on striving for better, including achieving high socio-economic status. Some children are more inclined to compare themselves to peers in their communities while others are more inclined to aspire to the extremes of celebrity status or the very affluent.
Greater income inequality seems to come with increased competition and anxiety (Pickett and Wilkinson 2007). The quality of relationships appears to be poorer in more unequal societies, including more bullying and more difficult relationships between children and parents. These relational problems have been attributed to the psychological consequences of inequality and the breakdown of social trust and cooperation (Elgar and Aitken 2011). Children may absorb the stress in families that are struggling to get by or competing to achieve. Inequality can be perceived even by children at young ages and translates to a stress reaction that seems to impede cognitive and social development.
Emerging research suggests that there is a generational increase in anxiety and depression as children have
become more oriented to goals of high income, status and appearance, echoing a broader cultural shift toward materialism and competition (Gray 2010). The decline of free, unstructured time for play and learning and an increase in pressure to achieve academically and economically may help explain the rising rates of anxiety in children 8 (Shaw et. al. 2015). At the same time, modern life doesn’t provide as wide and close a social network around children. Indigenous and racialized people have also described how children internalize discrimination from very early ages.
Opinion polling has found that Canadians are concerned that Canada is “turning into a society of winners and losers” and about making sure their children are “on the right side of the gap” (CCPA 2006). Canadians worry that their children will be the first generation to fare worse than their parents. Many families have adjusted by delaying childbirth, having smaller families and increasing work intensity.
8 There is a positive correlation between country rankings on the UNICEF Index of Child Well-being and rank scores measuring children’s degree of freedom to travel and play without adult supervision; countries with higher levels of independent mobility are also more likely on average to have higher levels of well-being though there will be other related factors that help explain that (Shaw et. al. 2015).
middle – a progressive scenario. The Netherlands, Slovenia and Iceland saw considerable reductions in the gap by more than 17 percentage points. The gap in Canada declined by a robust 10 points to 58 percent – the strongest positive trend in Canada among all of the indicators we measured in Report Card 13. The smallest gap is in Iceland (45 percent).
The relative gap in unhealthy eating decreased in more countries – and by a greater margin – than in any other health-related indicator in this report, albeit from a higher base. Nevertheless, in Canada as in most countries the gap in bottom-end inequality in unhealthy eating is wider than the gaps in the other three health indicators. Despite the decline in the gap, unhealthy weight among Canada’s children (1 in 3 boys and 1 in 4 girls) remains persistently high – underlining the need for more concerted measures to make healthy food available to children.
HOW HAS INEQUALITY IN LIFE SATISFACTION CHANGED?Inequality in life satisfaction remained stable in most countries, including Canada. UNICEF’s 2013 Index of Child Well-being revealed that children’s ‘overall’ life satisfaction had declined more in Canada than in most peer nations over the previous decade, to among the lowest levels at 24 of 29 nations. This may explain why the relative gap in life satisfaction did not widen – if both the middle and the bottom declined. As this coincided with an increase in overall income inequality in Canada, it raises the question:
Is children’s life satisfaction the canary in the inequality coalmine?
When childhood becomes a competitive sport or an unaffordable luxury, there are bound to be impacts on children’s sense of well-being.
11

‘overall’ child well-being (see UNICEF Report Card 13, Figure 8). These countries tend to perform lower on the UNICEF Index of Child Well-being (Toczydlowska, et al. 2016). It is not surprising that Canada ranks near the middle in bottom-end income inequality and in the middle for ‘overall’ child well-being.
UNICEF’s Index of Child Inequality adds another sightline on child inequality: countries with greater overall equality in child well-being also tend to rank higher in ‘overall’ child well-being. In fact, smaller gaps in health, education and life satisfaction are associated with higher overall outcomes in these areas. In other words, countries with lower bottom-end inequality in child well-being have fewer children living in poverty, fewer children with very low educational achievement, fewer children reporting frequent health complaints and fewer children reporting very low life satisfaction (see UNICEF Report Card 13, Figures 1–4). There is a consistent group of countries (Nordic countries, the Netherlands and Switzerland) that limit inequality and achieve high overall well-being – and some notable exceptions such as the U.S. and Chile.
WHY BROAD INEQUALITY MATTERS If income inequality at the bottom end seems to limit the well-being of children in different ways, how might
The family income, education, health and life satisfaction of children are in some ways inter-related aspects of their lives. Disadvantage in one area may lead to, or reinforce, disadvantage in another. UNICEF Report Card 13 league tables measure gaps in aspects of children’s lives independent of income. But if income strongly predicts children’s life chances – and income inequality has been widening in Canada – we could expect to see rising inequality in children’s outcomes. Some of these relationships are clearer than others at the bottom end of the distribution.There is emerging evidence that income inequality influences child well-being – possibly as much or more than the level of family or national income. While many questions remain, income inequality is likely to take on increasing importance in influencing child well-being.
WHY INCOME MATTERSAs in most affluent countries, the risk of poverty among children in Canada is higher than for any other group. Life ‘at the bottom’ is not only about having less income, but also about falling behind in school, being sick, and having poor nutrition, more risk behaviours, difficult relationships and lower life satisfaction. The relative child poverty rate has a strong influence on child well-being outcomes (Toczydlowska, et al. 2016). While a child living in poverty is more likely to live a difficult life, countries with high rates of child poverty also tend to have weaker ‘overall’ child well-being. In particular, countries with more relative poverty including Canada tend to have higher rates of infant mortality and low birthweight, lower rates of immunization, fewer young people participating in further education, more overweight children and more difficult peer relationships (Pickett and Wilkinson 2007). In other words, some children are much farther behind the average and fewer children do well.
WHY BOTTOM-END INEQUALITY MATTERSWith income inequality rising in most rich countries (OECD 2015), the focus on child poverty must widen to address new concerns, including how wider overall income inequality may further influence the life chances of children to achieve equality of opportunity and grow up out of poverty, and how the outcomes of all children may be affected (OECD 2011).
UNICEF’s measure of income inequality tells us something different than child poverty; it measures ‘how far’ the poorest children – in the bottom 10 percent of the income distribution – are from the average. Countries with wider bottom-end income inequality also tend to have lower
Looking across the dimensions of inequality
DK
NOFI
NL
UK
HRCZLV
DE
AU SIAT
BEMT
ROUS
GR
ES
SECAHU
TR
IL
CH
IEEE
BGIT
FRLUSK
PL LT
ISPT
BOTTOM-END INEQUALITY AND CHILD WELL-BEING OUTCOMES
LOW
ER
CH
ILD
WE
LL-B
EIN
GH
IGH
ER
CH
ILD
WE
LL-B
EIN
G
HIGHER INEQUALITY LOWER INEQUALITY
Figure 2: (From fig. 30, UNICEF Report Card 13)
Equality does not have to come at the expense of absolute achievement.
12
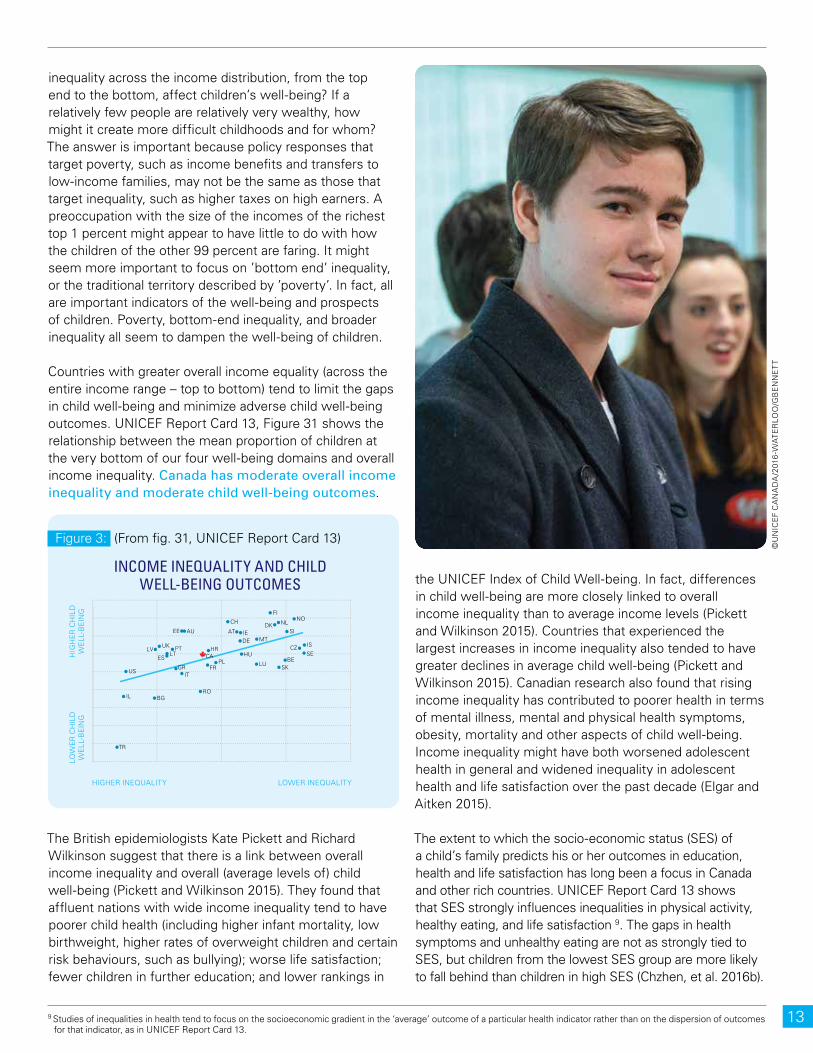
the UNICEF Index of Child Well-being. In fact, differences in child well-being are more closely linked to overall income inequality than to average income levels (Pickett and Wilkinson 2015). Countries that experienced the largest increases in income inequality also tended to have greater declines in average child well-being (Pickett and Wilkinson 2015). Canadian research also found that rising income inequality has contributed to poorer health in terms of mental illness, mental and physical health symptoms, obesity, mortality and other aspects of child well-being. Income inequality might have both worsened adolescent health in general and widened inequality in adolescent health and life satisfaction over the past decade (Elgar and Aitken 2015).
The extent to which the socio-economic status (SES) of a child’s family predicts his or her outcomes in education, health and life satisfaction has long been a focus in Canada and other rich countries. UNICEF Report Card 13 shows that SES strongly influences inequalities in physical activity, healthy eating, and life satisfaction 9. The gaps in health symptoms and unhealthy eating are not as strongly tied to SES, but children from the lowest SES group are more likely to fall behind than children in high SES (Chzhen, et al. 2016b).
inequality across the income distribution, from the top end to the bottom, affect children’s well-being? If a relatively few people are relatively very wealthy, how might it create more difficult childhoods and for whom? The answer is important because policy responses that target poverty, such as income benefits and transfers to low-income families, may not be the same as those that target inequality, such as higher taxes on high earners. A preoccupation with the size of the incomes of the richest top 1 percent might appear to have little to do with how the children of the other 99 percent are faring. It might seem more important to focus on ’bottom end’ inequality, or the traditional territory described by ’poverty’. In fact, all are important indicators of the well-being and prospects of children. Poverty, bottom-end inequality, and broader inequality all seem to dampen the well-being of children.
Countries with greater overall income equality (across the entire income range – top to bottom) tend to limit the gaps in child well-being and minimize adverse child well-being outcomes. UNICEF Report Card 13, Figure 31 shows the relationship between the mean proportion of children at the very bottom of our four well-being domains and overall income inequality. Canada has moderate overall income inequality and moderate child well-being outcomes.
The British epidemiologists Kate Pickett and Richard Wilkinson suggest that there is a link between overall income inequality and overall (average levels of) child well-being (Pickett and Wilkinson 2015). They found that affluent nations with wide income inequality tend to have poorer child health (including higher infant mortality, low birthweight, higher rates of overweight children and certain risk behaviours, such as bullying); worse life satisfaction; fewer children in further education; and lower rankings in
9 Studies of inequalities in health tend to focus on the socioeconomic gradient in the ‘average’ outcome of a particular health indicator rather than on the dispersion of outcomes for that indicator, as in UNICEF Report Card 13.
INCOME INEQUALITY AND CHILDWELL-BEING OUTCOMES
LOW
ER
CH
ILD
WE
LL-B
EIN
GH
IGH
ER
CH
ILD
WE
LL-B
EIN
G
HIGHER INEQUALITY LOWER INEQUALITY
MTIEAT
CH
FI
NLDKNO
DE
SI
CZ IS
SEBE
SKLU
HUHR
CAPL
FR
AU
PTLT
UKLV
ES
GRIT
RO
US
BG
TR
IL
EE
Figure 3: (From fig. 31, UNICEF Report Card 13)
©U
NIC
EF
CA
NA
DA
/201
6-W
ATE
RLO
O/G
BE
NN
ET
T
13
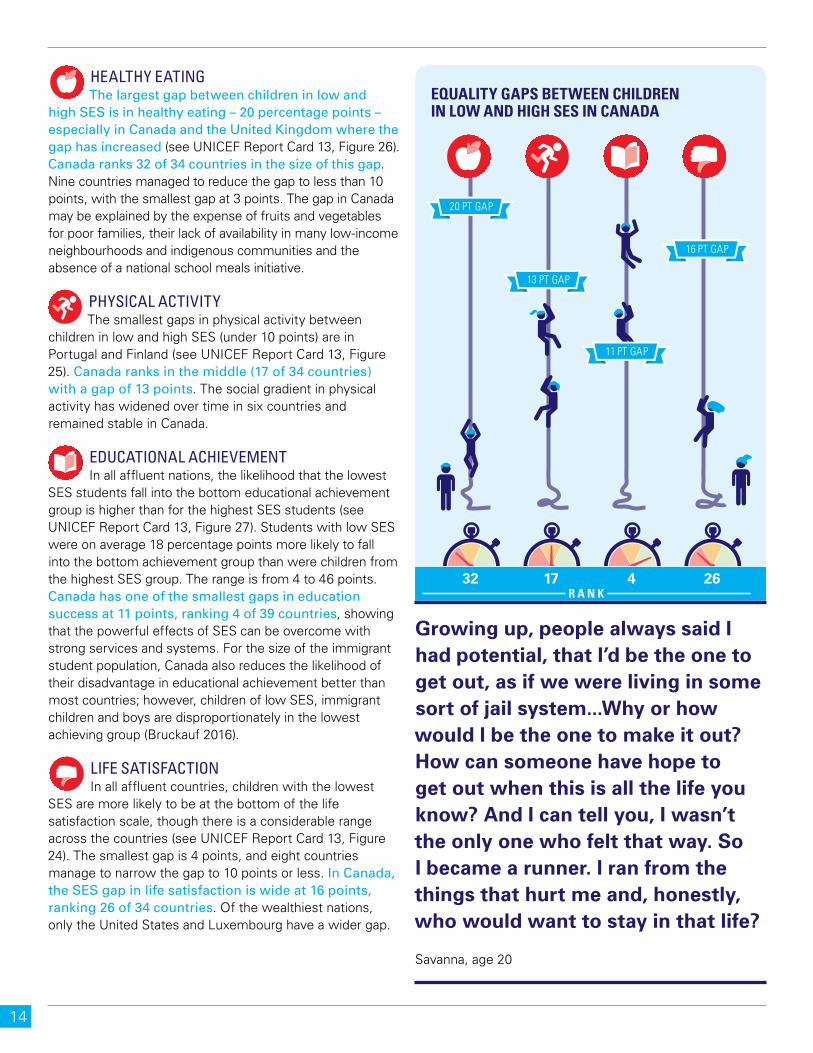
HEALTHY EATINGThe largest gap between children in low and
high SES is in healthy eating – 20 percentage points – especially in Canada and the United Kingdom where the gap has increased (see UNICEF Report Card 13, Figure 26). Canada ranks 32 of 34 countries in the size of this gap. Nine countries managed to reduce the gap to less than 10 points, with the smallest gap at 3 points. The gap in Canada may be explained by the expense of fruits and vegetables for poor families, their lack of availability in many low-income neighbourhoods and indigenous communities and the absence of a national school meals initiative.
PHYSICAL ACTIVITYThe smallest gaps in physical activity between
children in low and high SES (under 10 points) are in Portugal and Finland (see UNICEF Report Card 13, Figure 25). Canada ranks in the middle (17 of 34 countries) with a gap of 13 points. The social gradient in physical activity has widened over time in six countries and remained stable in Canada.
EDUCATIONAL ACHIEVEMENTIn all affluent nations, the likelihood that the lowest
SES students fall into the bottom educational achievement group is higher than for the highest SES students (see UNICEF Report Card 13, Figure 27). Students with low SES were on average 18 percentage points more likely to fall into the bottom achievement group than were children from the highest SES group. The range is from 4 to 46 points. Canada has one of the smallest gaps in education success at 11 points, ranking 4 of 39 countries, showing that the powerful effects of SES can be overcome with strong services and systems. For the size of the immigrant student population, Canada also reduces the likelihood of their disadvantage in educational achievement better than most countries; however, children of low SES, immigrant children and boys are disproportionately in the lowest achieving group (Bruckauf 2016).
LIFE SATISFACTIONIn all affluent countries, children with the lowest
SES are more likely to be at the bottom of the life satisfaction scale, though there is a considerable range across the countries (see UNICEF Report Card 13, Figure 24). The smallest gap is 4 points, and eight countries manage to narrow the gap to 10 points or less. In Canada, the SES gap in life satisfaction is wide at 16 points, ranking 26 of 34 countries. Of the wealthiest nations, only the United States and Luxembourg have a wider gap.
20 PT GAP
13 PT GAP
11 PT GAP
16 PT GAP
32 17 4 26
Growing up, people always said I had potential, that I’d be the one to get out, as if we were living in some sort of jail system...Why or how would I be the one to make it out? How can someone have hope to get out when this is all the life you know? And I can tell you, I wasn’t the only one who felt that way. So I became a runner. I ran from the things that hurt me and, honestly, who would want to stay in that life?
Savanna, age 20
EQUALITY GAPS BETWEEN CHILDREN IN LOW AND HIGH SES IN CANADA
14
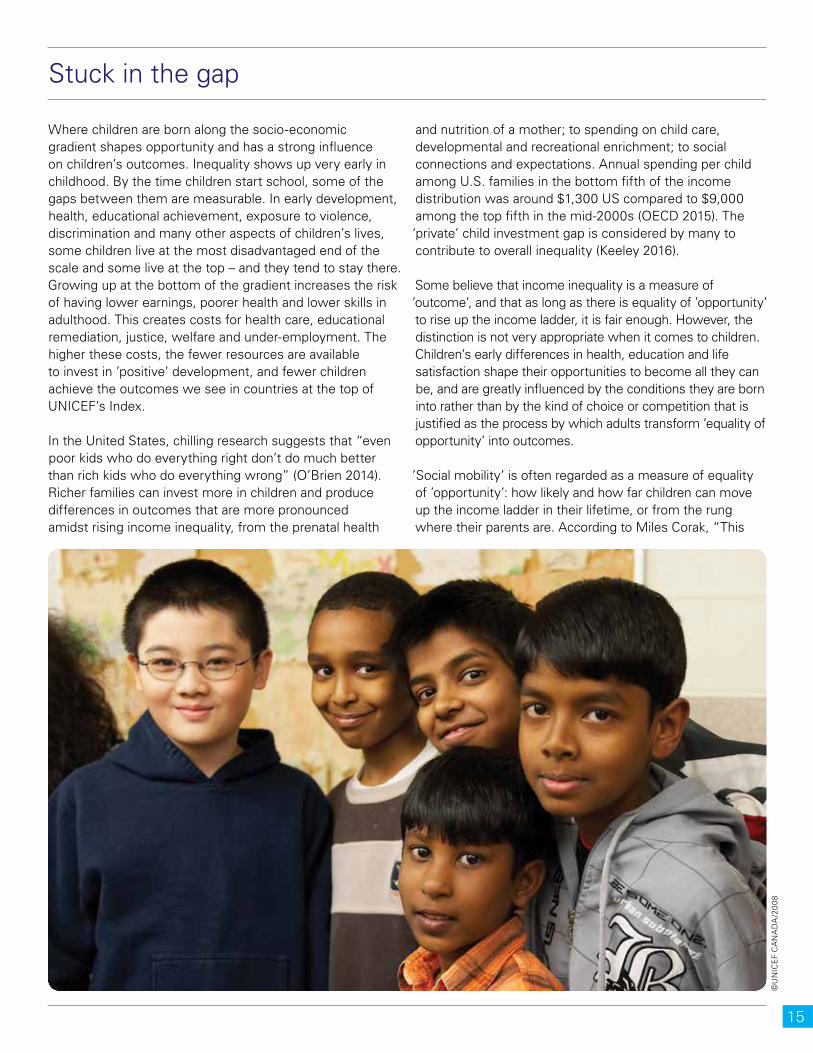
Where children are born along the socio-economic gradient shapes opportunity and has a strong influence on children’s outcomes. Inequality shows up very early in childhood. By the time children start school, some of the gaps between them are measurable. In early development, health, educational achievement, exposure to violence, discrimination and many other aspects of children’s lives, some children live at the most disadvantaged end of the scale and some live at the top – and they tend to stay there. Growing up at the bottom of the gradient increases the risk of having lower earnings, poorer health and lower skills in adulthood. This creates costs for health care, educational remediation, justice, welfare and under-employment. The higher these costs, the fewer resources are available to invest in ’positive’ development, and fewer children achieve the outcomes we see in countries at the top of UNICEF’s Index.
In the United States, chilling research suggests that “even poor kids who do everything right don’t do much better than rich kids who do everything wrong” (O’Brien 2014). Richer families can invest more in children and produce differences in outcomes that are more pronounced amidst rising income inequality, from the prenatal health
and nutrition of a mother; to spending on child care, developmental and recreational enrichment; to social connections and expectations. Annual spending per child among U.S. families in the bottom fifth of the income distribution was around $1,300 US compared to $9,000 among the top fifth in the mid-2000s (OECD 2015). The ‘private’ child investment gap is considered by many to contribute to overall inequality (Keeley 2016).
Some believe that income inequality is a measure of ’outcome’, and that as long as there is equality of ’opportunity’ to rise up the income ladder, it is fair enough. However, the distinction is not very appropriate when it comes to children. Children’s early differences in health, education and life satisfaction shape their opportunities to become all they can be, and are greatly influenced by the conditions they are born into rather than by the kind of choice or competition that is justified as the process by which adults transform ’equality of opportunity’ into outcomes.
’Social mobility’ is often regarded as a measure of equality of ’opportunity’: how likely and how far children can move up the income ladder in their lifetime, or from the rung where their parents are. According to Miles Corak, “This
Stuck in the gap
©U
NIC
EF
CA
NA
DA
/20
08
15
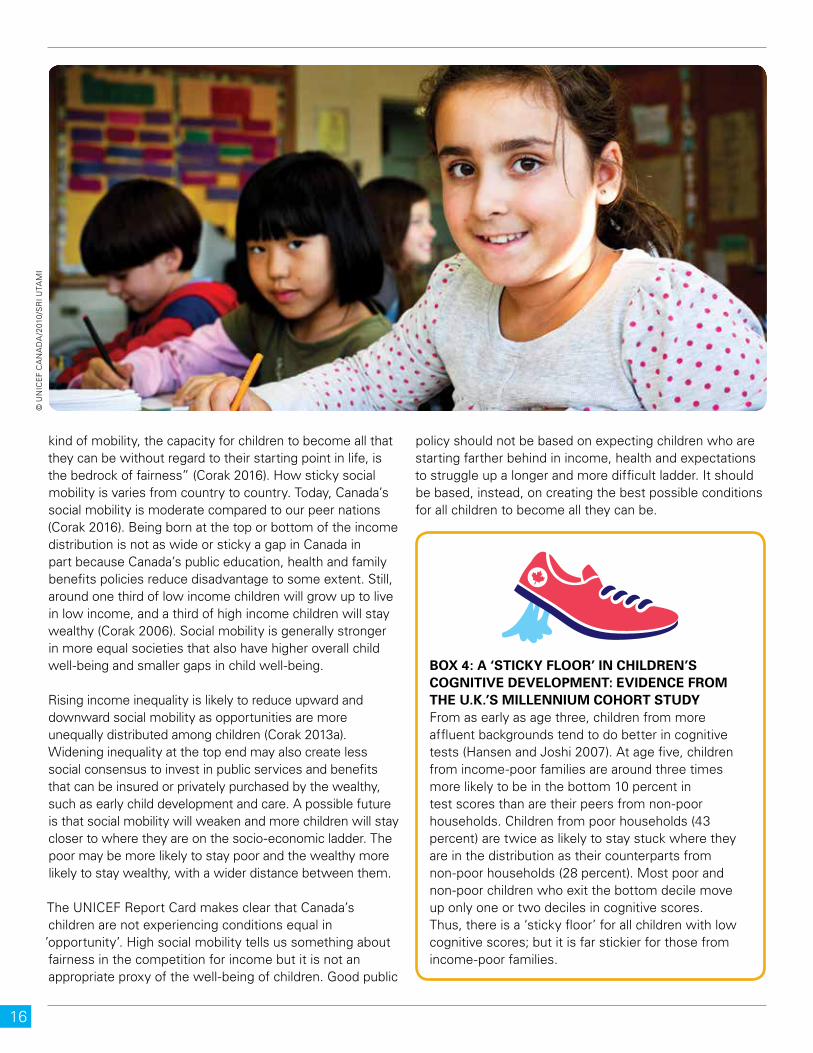
kind of mobility, the capacity for children to become all that they can be without regard to their starting point in life, is the bedrock of fairness” (Corak 2016). How sticky social mobility is varies from country to country. Today, Canada’s social mobility is moderate compared to our peer nations (Corak 2016). Being born at the top or bottom of the income distribution is not as wide or sticky a gap in Canada in part because Canada’s public education, health and family benefits policies reduce disadvantage to some extent. Still, around one third of low income children will grow up to live in low income, and a third of high income children will stay wealthy (Corak 2006). Social mobility is generally stronger in more equal societies that also have higher overall child well-being and smaller gaps in child well-being.
Rising income inequality is likely to reduce upward and downward social mobility as opportunities are more unequally distributed among children (Corak 2013a). Widening inequality at the top end may also create less social consensus to invest in public services and benefits that can be insured or privately purchased by the wealthy, such as early child development and care. A possible future is that social mobility will weaken and more children will stay closer to where they are on the socio-economic ladder. The poor may be more likely to stay poor and the wealthy more likely to stay wealthy, with a wider distance between them.
The UNICEF Report Card makes clear that Canada’s children are not experiencing conditions equal in ’opportunity’. High social mobility tells us something about fairness in the competition for income but it is not an appropriate proxy of the well-being of children. Good public
BOX 4: A ‘STICKY FLOOR’ IN CHILDREN’S COGNITIVE DEVELOPMENT: EVIDENCE FROM THE U.K.’S MILLENNIUM COHORT STUDYFrom as early as age three, children from more affluent backgrounds tend to do better in cognitive tests (Hansen and Joshi 2007). At age five, children from income-poor families are around three times more likely to be in the bottom 10 percent in test scores than are their peers from non-poor households. Children from poor households (43 percent) are twice as likely to stay stuck where they are in the distribution as their counterparts from non-poor households (28 percent). Most poor and non-poor children who exit the bottom decile move up only one or two deciles in cognitive scores. Thus, there is a ‘sticky floor’ for all children with low cognitive scores; but it is far stickier for those from income-poor families.
policy should not be based on expecting children who are starting farther behind in income, health and expectations to struggle up a longer and more difficult ladder. It should be based, instead, on creating the best possible conditions for all children to become all they can be.
© U
NIC
EF
CA
NA
DA
/201
0/S
RI U
TAM
I
16
Part 2: Facing the Challenge Head On
17

As in most affluent nations, the rate of growth in Canada’s economy has exceeded the rate of improvement in overall child well-being over the past few decades – the ’modernity paradox’ (Keating and Hertzman 1999; Jianghong, et al. 2008). Where is the dividend for children in the country’s economic progress? In Canada, the dividends have not been spread equitably. In fact, despite Canada’s relative economic strength, we have larger and in some ways widening disparities in children’s well-being. Among wealthy nations, differences in the size of the economy have little to do with child well-being outcomes. The distribution inside countries matters more. This suggests that growing the economy will not be enough to improve child well-being. To advance the well-being of children overall, we have to narrow the gaps.
Some adults wonder why disadvantaged children can’t “pull up their bootstraps” and grow up and out of poverty like they did. But childhood has changed. Canada today is more unequal. Incomes at the bottom haven’t grown as much as incomes at the middle. Incomes at the top have grown much higher. If low income is a sticky floor, and we’ve added more rungs to the ladder, the children at the
What it will take to close the gaps
BOX 5: PUT CHILDREN FIRSTIn all actions concerning children, whether undertaken by public or private social welfare institutions, courts of law, administrative authorities or legislative bodies, the best interests of the child shall be a primary consideration.
United Nations Convention on the Rights of the Child, 1989 (article 3)
© U
NIC
EF
CA
NA
DA
/201
0/S
RI U
TAM
I
bottom will be even less likely to climb to the heights. To be a relatively poor child is not as bad if income differences between children are small and “everyone is in it together” (Pickett and Wilkinson 2015).
Children are not responsible for the unequal conditions into which they are born. Blaming the individual for failing to take advantage of opportunity – to “beat the odds” – as a basis for accepting wide inequality hasn’t led to more productive, thriving children, economies and societies. The differences between countries occur not because parents are so different in their abilities to parent, or because children are so different from birth. The differences occur because social values and beliefs are different, so public policies and priorities are different.
sdf
UNICEF’s analysis invites Canadians to courageously ask, what kind of place is our country for its children? How much better can we be?
18

The fact that children do not fall as far behind in some countries as in others demonstrates that large gaps are not inevitable. The UNICEF Report Card does not compare children at the bottom to those at the top; we suggest that it is unfair that there are some very large gaps between children at the bottom and those in the middle.
Countries that manage this tend to perform well on both the UNICEF Index of Child Well-being and the Index of Child Inequality. Achieving greater equity and higher overall well-being for children are mutually reinforcing goals and not trade-offs, just as there is no trade off between equity and economic growth. A focus on ’evening the odds’ and distributing ’fairness’ in affluent nations seems to produce healthier, happier children and prosperous societies.
A FAIR START FOR ALL CHILDRENIt is unlikely that Canada will substantially lift the well-being of children unless we address broader income inequality. Dealing with that is heavy lifting, but some suggest that raising child well-being has less to do with targeted interventions than with a societal commitment to greater equality (Pickett and Wilkinson 2015). Will Canada be a great place to grow up if we fail to address income inequality?
On the other hand, we could limit the gaps children experience in different aspects of their lives. UNICEF
©U
NIC
EF
CA
NA
DA
/201
6-W
ATE
RLO
O/G
BE
NN
ET
T
sdf
The goal of any country should be at a minimum to limit how far some children fall behind while pushing for the best possible outcomes for all.
Report Card 13 looks behind the averages so that Canadians can see where we have work to do to shore up the lives of the children we are allowing to fall too far behind. Everything we measured in the UNICEF Index can be influenced by policy choices. Inequalities can be minimized or amplified and privilege or exclusion locked in. The relatively small gap in educational achievement shows that effective policies and services can go a good distance to create fairness for children.
© U
NIC
EF
CA
NA
DA
/201
0/S
RI U
TAM
I
19
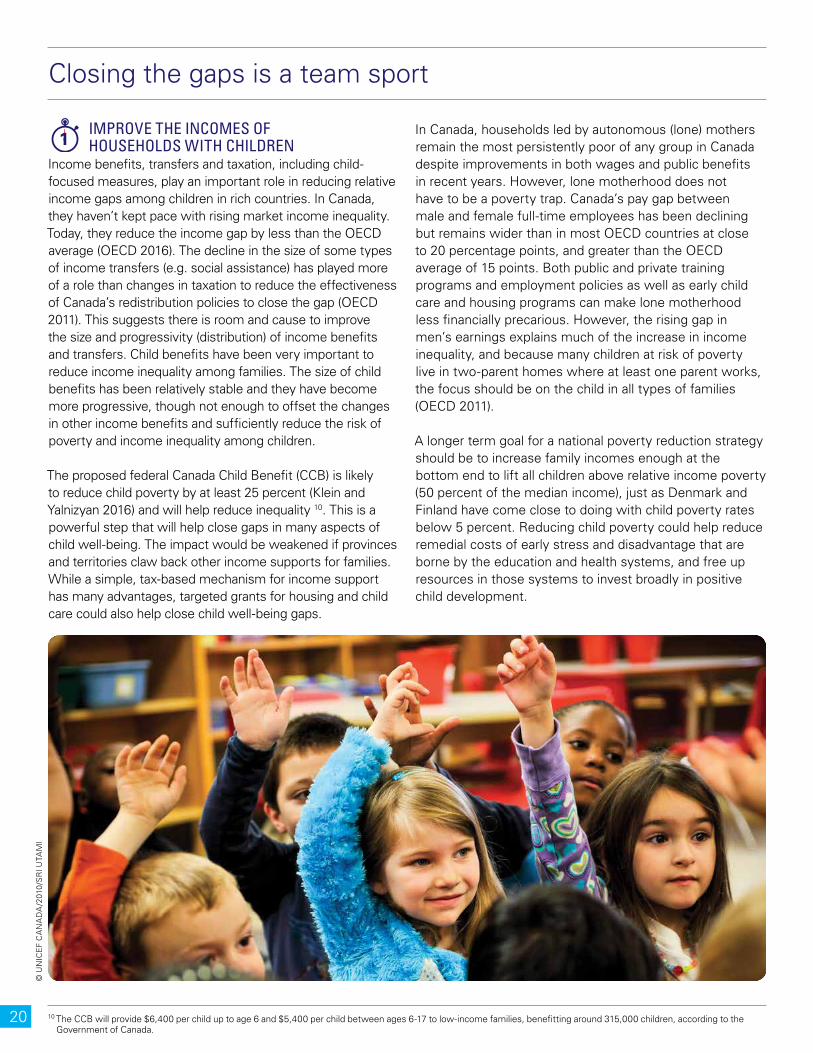
In Canada, households led by autonomous (lone) mothers remain the most persistently poor of any group in Canada despite improvements in both wages and public benefits in recent years. However, lone motherhood does not have to be a poverty trap. Canada’s pay gap between male and female full-time employees has been declining but remains wider than in most OECD countries at close to 20 percentage points, and greater than the OECD average of 15 points. Both public and private training programs and employment policies as well as early child care and housing programs can make lone motherhood less financially precarious. However, the rising gap in men’s earnings explains much of the increase in income inequality, and because many children at risk of poverty live in two-parent homes where at least one parent works, the focus should be on the child in all types of families (OECD 2011).
A longer term goal for a national poverty reduction strategy should be to increase family incomes enough at the bottom end to lift all children above relative income poverty (50 percent of the median income), just as Denmark and Finland have come close to doing with child poverty rates below 5 percent. Reducing child poverty could help reduce remedial costs of early stress and disadvantage that are borne by the education and health systems, and free up resources in those systems to invest broadly in positive child development.
IMPROVE THE INCOMES OF HOUSEHOLDS WITH CHILDREN
Income benefits, transfers and taxation, including child-focused measures, play an important role in reducing relative income gaps among children in rich countries. In Canada, they haven’t kept pace with rising market income inequality. Today, they reduce the income gap by less than the OECD average (OECD 2016). The decline in the size of some types of income transfers (e.g. social assistance) has played more of a role than changes in taxation to reduce the effectiveness of Canada’s redistribution policies to close the gap (OECD 2011). This suggests there is room and cause to improve the size and progressivity (distribution) of income benefits and transfers. Child benefits have been very important to reduce income inequality among families. The size of child benefits has been relatively stable and they have become more progressive, though not enough to offset the changes in other income benefits and sufficiently reduce the risk of poverty and income inequality among children.
The proposed federal Canada Child Benefit (CCB) is likely to reduce child poverty by at least 25 percent (Klein and Yalnizyan 2016) and will help reduce inequality 10. This is a powerful step that will help close gaps in many aspects of child well-being. The impact would be weakened if provinces and territories claw back other income supports for families. While a simple, tax-based mechanism for income support has many advantages, targeted grants for housing and child care could also help close child well-being gaps.
© U
NIC
EF
CA
NA
DA
/201
0/S
RI U
TAM
I
Closing the gaps is a team sport
1
10 The CCB will provide $6,400 per child up to age 6 and $5,400 per child between ages 6-17 to low-income families, benefitting around 315,000 children, according to the Government of Canada.
20
IMPROVE THE EDUCATIONAL OUTCOMES OF ALL LEARNERS
Canada’s education system has been doing a good deal of heavy lifting, helping students who bring in socio-economic disadvantage to achieve good outcomes. But more children, particularly boys, are having difficulty achieving and many are encountering challenges in making the transition from high school to post-secondary education and work. U.S. research finds that boys are more likely to drop out of school where there is wide bottom-end income inequality (Kearney and Levine 2016). Despite declining high school drop-out rates, the most excluded youth who view even middle-class life as unattainable may invest less in their future. In an increasingly complex social and economic environment, enabling more children to reach positive academic, social and emotional outcomes requires earlier support for the lowest achievers and disengaged children, and more innovative, flexible development, education and employment pathways as they progress through their school years. Examples are community-school outreach workers, youth mentoring programs and early parenting programs. The inclusion of culturally appropriate, quality education for indigenous children is an important priority of the federal government. The education system cannot meet these challenges alone but connecting more holistic child and youth services to schools may help children deal with integrated challenges in health and development along their lifecourse.
PURSUE EQUITABLE ACCESS TO PROGRAMS AND SERVICES FOR ALL CHILDRENSome of the differences in children’s outcomes are related to family income and SES, but the different sizes of gaps in education, health and life satisfaction and the variable changes over time demonstrate that other dynamics influence these. Closing gaps will require a stronger focus on gender, disability, culture and location. Progressive universalism should be the first principle in designing and delivering children’s services. This recognizes that the market does not provide all the development opportunities children need, that individual vulnerability is not always associated with income, that overall well-being is somewhat low, and that public support for quality services tends to be greater when they are universal.
START EARLIERBecause inequalities in child well-being show up
in the first few years of life, and spending on the early years is low in Canada compared to many other affluent nations, a fairer allocation of public budgets to support early child development is called for. How great might childhood be if the resources it takes to swim against the tide of broad social inequality could be invested less in remediating the disadvantages older children bring into the education, health, child welfare, justice and other community development systems and more in reducing early disadvantage? This could enable all boats to rise. The federal government has committed to a much-needed national early-years framework, which should connect prenatal care to early child health, learning and child care, and invest no less than the OECD average for early years investment. This would help reduce disadvantage that begins at the start and create a better continuum of supports for parents and children.
© U
NIC
EF
CA
NA
DA
/201
0/S
RI U
TAM
I
2
3
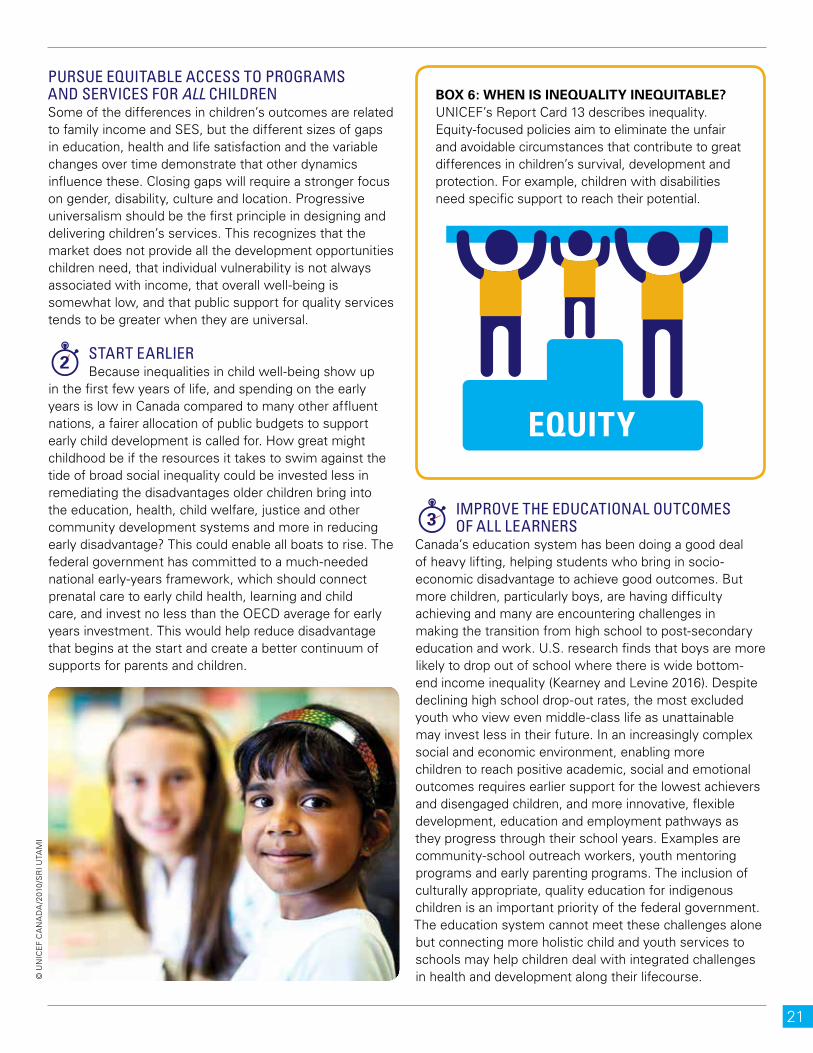
BOX 6: WHEN IS INEQUALITY INEQUITABLE?UNICEF’s Report Card 13 describes inequality. Equity-focused policies aim to eliminate the unfair and avoidable circumstances that contribute to great differences in children’s survival, development and protection. For example, children with disabilities need specific support to reach their potential.
21

PROMOTE AND SUPPORT HEALTH FOR ALL CHILDREN
Children in low income families and adolescent girls tend to have poorer health. Poor health symptoms, however, cut a wide swath linked to broader social trends such as more sedentary lifestyles, less sleep, more stress and increased social isolation. Progress in most aspects of children’s health has been too slow. In Canada, the average level of unhealthy consumption of sugary foods is quite favourable in contrast to most affluent nations and has been improving, but the inequality gap remains wide. A welcome strategy of the Government of Canada is to restrict the marketing of food and drink to children. And because the rate of unhealthy weight (obesity) in Canada remains persistently very high (UNICEF Office of Research 2013), there remains the need to increase the availability of healthy and affordable food to close the gaps in healthy eating and unhealthy weight. A universal healthy school food program should be developed to boost health and support learning. All levels of government should consider investing innovation and social infrastructure funding in the healthy food system around children to increase access and affordability. The federal government’s commitment to improve the Nutrition North program for indigenous communities is a welcome step.
Growing up now is different than even 10 years ago. The joys of playing outside, playing board games, not worrying about technology. Even parents now are so focused on technology; it’s not just the kids. Limiting technology usage would be great. Tavleen, age 18
TAKE CHILDREN’S VIEWS ON THEIR LIVES SERIOUSLY
Children’s low life satisfaction is in some ways a ’composite indicator’ of well-being. Taking low life satisfaction seriously requires listening to young people to better understand the roles that parents, teachers, community members, employers, and policymakers could play to support their sense of well-being. In particular, family support is a key influence on life satisfaction among Canada’s children. In more unequal labour markets, parents in all types of families work longer hours and struggle to balance work and child rearing (Corak 2013b). The federal government has signalled that family work-life balance is an important policy goal, and should be supported by the private sector to extend parental leave benefits in flexibility, duration and remuneration with dedicated secondary parent leave time, and expand flexible work policies to cover children of all ages. The performance of countries at the top of UNICEF’s Index suggests these policies are very good for children’s well-being and that Canada has a way to go to match them. As well, the persistent rates of domestic violence and children in state care and the prevalence of poor mental health, particularly affecting indigenous children, must be an urgent focus.
Family and friends close to you, in your home, affects your well-being. A lot of little factors impact your well-being.
Andrew, age 17
4
5
©U
NIC
EF
CA
NA
DA
/201
6-W
ATE
RLO
O/G
BE
NN
ET
T
22
ADDRESS INEQUALITIES IN ALL POLICIES AFFECTING CHILD WELL-BEING
It is clear that we need a stronger understanding of how different groups of children experience different challenges. For instance, in some dimensions of child well-being, gender differences account for wider gaps than income differences. The Government of Canada has committed to establish a National Commissioner for Children and Youth, who could provide support for child-sensitive decision-making. All levels of government should use ’child impact assessment’ to plan or examine policies, laws, programs and budgets for their impacts on children – whether or not they are likely to increase or decrease inequality or yield different impacts for different groups of children.
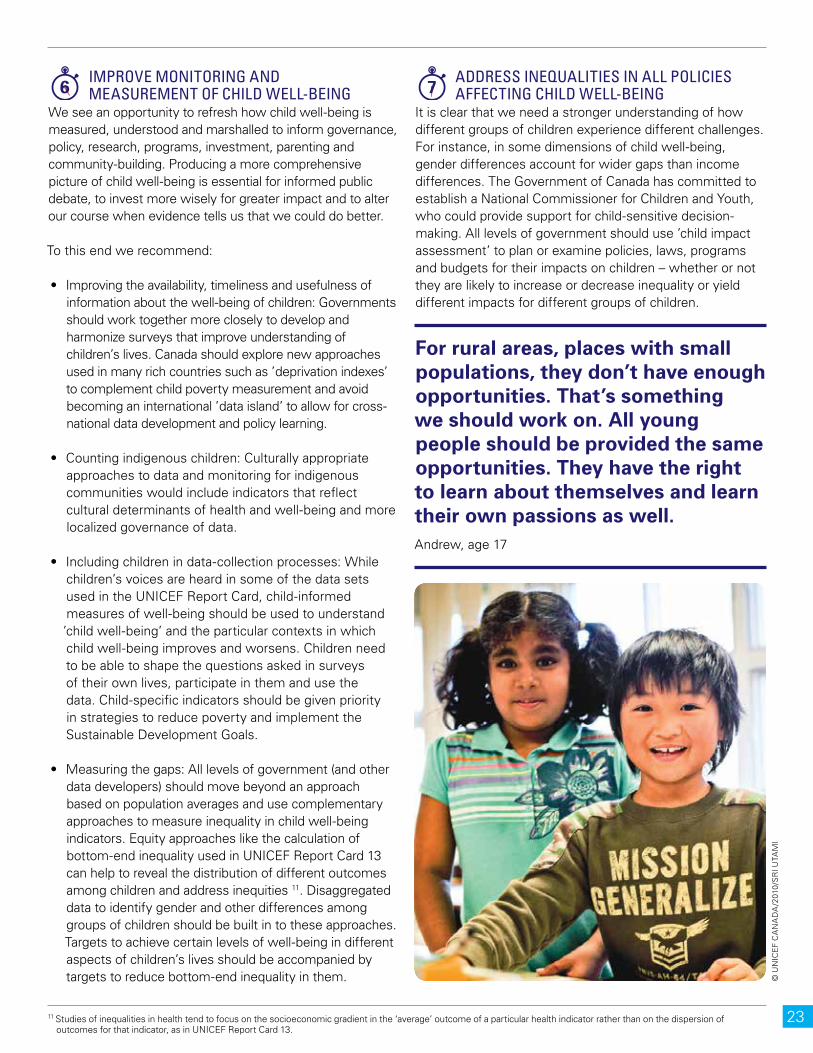
For rural areas, places with small populations, they don’t have enough opportunities. That’s something we should work on. All young people should be provided the same opportunities. They have the right to learn about themselves and learn their own passions as well.Andrew, age 17
IMPROVE MONITORING AND MEASUREMENT OF CHILD WELL-BEING
We see an opportunity to refresh how child well-being is measured, understood and marshalled to inform governance, policy, research, programs, investment, parenting and community-building. Producing a more comprehensive picture of child well-being is essential for informed public debate, to invest more wisely for greater impact and to alter our course when evidence tells us that we could do better.
To this end we recommend:
• Improving the availability, timeliness and usefulness of information about the well-being of children: Governments should work together more closely to develop and harmonize surveys that improve understanding of children’s lives. Canada should explore new approaches used in many rich countries such as ’deprivation indexes’ to complement child poverty measurement and avoid becoming an international ’data island’ to allow for cross-national data development and policy learning.
• Counting indigenous children: Culturally appropriate approaches to data and monitoring for indigenous communities would include indicators that reflect cultural determinants of health and well-being and more localized governance of data.
• Including children in data-collection processes: While children’s voices are heard in some of the data sets used in the UNICEF Report Card, child-informed measures of well-being should be used to understand ’child well-being’ and the particular contexts in which child well-being improves and worsens. Children need to be able to shape the questions asked in surveys of their own lives, participate in them and use the data. Child-specific indicators should be given priority in strategies to reduce poverty and implement the Sustainable Development Goals.
• Measuring the gaps: All levels of government (and other data developers) should move beyond an approach based on population averages and use complementary approaches to measure inequality in child well-being indicators. Equity approaches like the calculation of bottom-end inequality used in UNICEF Report Card 13 can help to reveal the distribution of different outcomes among children and address inequities 11. Disaggregated data to identify gender and other differences among groups of children should be built in to these approaches. Targets to achieve certain levels of well-being in different aspects of children’s lives should be accompanied by targets to reduce bottom-end inequality in them. ©
UN
ICE
F C
AN
AD
A/2
010/
SR
I UTA
MI
6 7
11 Studies of inequalities in health tend to focus on the socioeconomic gradient in the ‘average’ outcome of a particular health indicator rather than on the dispersion of outcomes for that indicator, as in UNICEF Report Card 13.
23
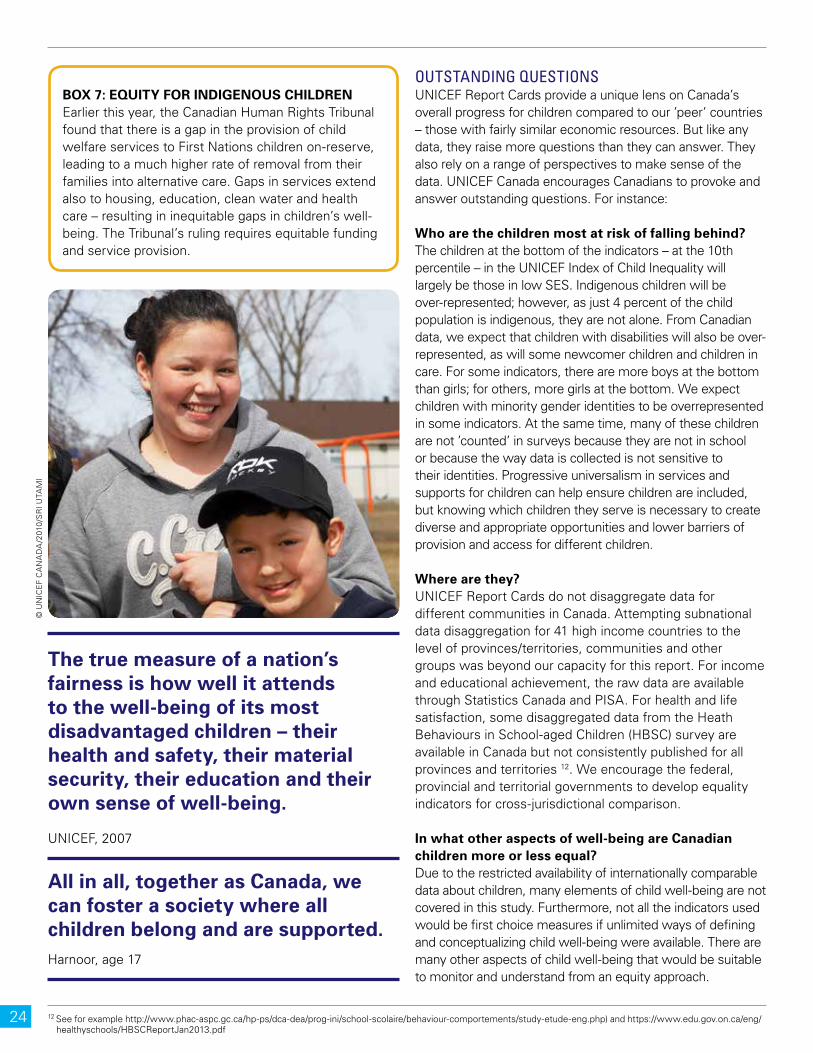
The true measure of a nation’s fairness is how well it attends to the well-being of its most disadvantaged children – their health and safety, their material security, their education and their own sense of well-being.
UNICEF, 2007
OUTSTANDING QUESTIONSUNICEF Report Cards provide a unique lens on Canada’s overall progress for children compared to our ’peer’ countries – those with fairly similar economic resources. But like any data, they raise more questions than they can answer. They also rely on a range of perspectives to make sense of the data. UNICEF Canada encourages Canadians to provoke and answer outstanding questions. For instance: Who are the children most at risk of falling behind? The children at the bottom of the indicators – at the 10th percentile – in the UNICEF Index of Child Inequality will largely be those in low SES. Indigenous children will be over-represented; however, as just 4 percent of the child population is indigenous, they are not alone. From Canadian data, we expect that children with disabilities will also be over-represented, as will some newcomer children and children in care. For some indicators, there are more boys at the bottom than girls; for others, more girls at the bottom. We expect children with minority gender identities to be overrepresented in some indicators. At the same time, many of these children are not ’counted’ in surveys because they are not in school or because the way data is collected is not sensitive to their identities. Progressive universalism in services and supports for children can help ensure children are included, but knowing which children they serve is necessary to create diverse and appropriate opportunities and lower barriers of provision and access for different children.
Where are they?UNICEF Report Cards do not disaggregate data for different communities in Canada. Attempting subnational data disaggregation for 41 high income countries to the level of provinces/territories, communities and other groups was beyond our capacity for this report. For income and educational achievement, the raw data are available through Statistics Canada and PISA. For health and life satisfaction, some disaggregated data from the Heath Behaviours in School-aged Children (HBSC) survey are available in Canada but not consistently published for all provinces and territories 12. We encourage the federal, provincial and territorial governments to develop equality indicators for cross-jurisdictional comparison.
In what other aspects of well-being are Canadian children more or less equal?Due to the restricted availability of internationally comparable data about children, many elements of child well-being are not covered in this study. Furthermore, not all the indicators used would be first choice measures if unlimited ways of defining and conceptualizing child well-being were available. There are many other aspects of child well-being that would be suitable to monitor and understand from an equity approach.
BOX 7: EQUITY FOR INDIGENOUS CHILDRENEarlier this year, the Canadian Human Rights Tribunal found that there is a gap in the provision of child welfare services to First Nations children on-reserve, leading to a much higher rate of removal from their families into alternative care. Gaps in services extend also to housing, education, clean water and health care – resulting in inequitable gaps in children’s well-being. The Tribunal’s ruling requires equitable funding and service provision.
All in all, together as Canada, we can foster a society where all children belong and are supported.Harnoor, age 17
© U
NIC
EF
CA
NA
DA
/201
0/S
RI U
TAM
I
12 See for example http://www.phac-aspc.gc.ca/hp-ps/dca-dea/prog-ini/school-scolaire/behaviour-comportements/study-etude-eng.php) and https://www.edu.gov.on.ca/eng/ healthyschools/HBSCReportJan2013.pdf
24
Does wide bottom-end inequality limit child well-being at the high end? Some will suggest that a certain degree of inequality is tolerable because “most kids are faring very well”. We would argue that every child matters. But what if it inequality
BOX 8: UNEQUAL FROM TOP TO BOTTOMMuch of the data in UNICEF Report Card 13 comes from the latest Health Behaviour in School-aged Children (HBSC) survey in 2014 13. The full set of international HBSC data includes 36 indicators related to child health. Canada is among the top five most unequal countries in half of these indicators (15 of 36) and among the top 10 most unequal countries in another 10 of the indicators. There are wide gaps between children at the bottom and children at the top in each of these indicators, not only gaps between children at the bottom and children in the middle measured in the UNICEF Report Card. The widest gaps from top to bottom are in multiple health complaints, drunkenness, cannabis use and fighting (WHO 2016).
13 The HBSC is administered in Canada by the Public Health Agency of Canada (PHAC) in collaboration with the World Health Organization (WHO). The 2014 survey included close to 30,000 Canadian children in Grades 6 through 10 in all provinces and territories.
also dampens the heights that children achieve? UNICEF Report Card 13 shows that countries with wider inequality in child well-being also tend to have lower overall or average outcomes in child well-being. This means that fewer children do as well as they might. But does it also mean that the heights the children at the top of the distribution achieve (i.e., at the 90th percentile) are likely to be lower? In other words, does wide inequality limit the highest possible outcomes in health, education and other aspects of well-being? This is entirely possible because many of the goods, services and other conditions that support good child development can’t be purchased, even by the wealthiest, though high income can help. Positive relationships with parents and peers are examples. These are shaped by broader social conditions, such as the prevalence of bullying, stress and parents’ working conditions. As well, if public resources have to remediate the disadvantages children bring into systems like education and health, there is less to invest in boosting positive developmental opportunities for all children.
CONCLUSIONUNICEF’s Fairness for Children: Canada’s Challenge report card provides a critical opportunity for improving the lives of Canada’s children – something we must all be invested in for our shared future. All children should grow up with the opportunity to reach their full potential. Inequalities hinder that opportunity, affecting not only the child but society as a whole. Canada is a society that has the resources, skill and knowledge needed to give our children the care and support they need. We can make Canada the best country to grow up in. Closing the gaps between Canada’s children is a team sport – for governments at all levels, service organizations, the private sector, families and children and youth – everyone has a role. When we work together, when we put children first, we all win.
What position does UNICEF play?As the UN agency for children, UNICEF works to shed light on and improve the situation of children around the world. We know the importance of partnerships when it comes to building a better world for children, and that only by working together can we hope to raise public awareness and achieve concrete results. Bringing our global experience, UNICEF Canada has been working in partnership with leading policy and investment specialists, child-serving organizations and governments across the country to provide clear and useful data on the state of children in Canada. We are also developing a platform to collaboratively and quickly design innovative solutions for the greatest challenges faced by our children and youth. This team believes it is entirely possible to vault Canada to the top of UNICEF’s Index of Child Well-being.
What can we learn by comparing children left behind to those in the middle, when the median outcomes are lower than they should be?Comparing children at the bottom to children at the median tells us something about equality. But when the median of an indicator is lower than it ’should’ be – that is, significantly lower than what top-performing peer nations achieve – it can also underestimate the progress Canada should make. What if we compared the gap between children at the bottom to the average level among high-income countries? In some indicators there would be a greater distance to the children left behind.
25
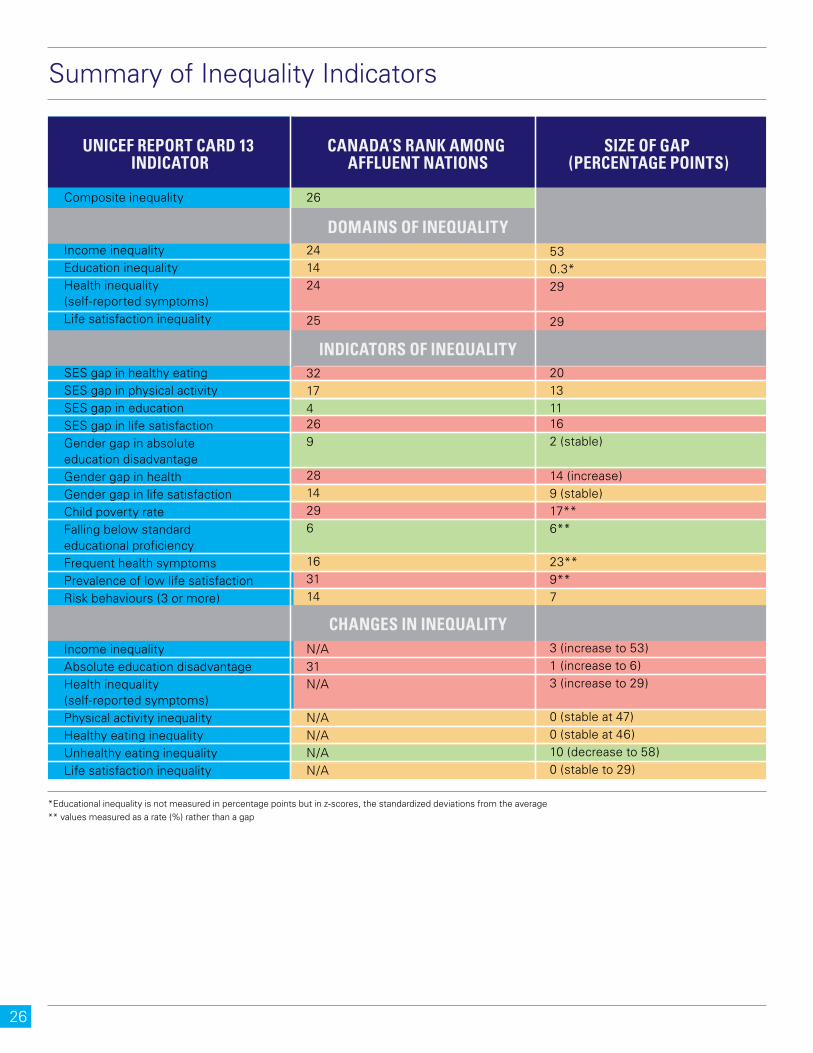
CHANGES IN INEQUALITY
INDICATORS OF INEQUALITY
UNICEF REPORT CARD 13 INDICATOR
CANADA’S RANK AMONG AFFLUENT NATIONS
DOMAINS OF INEQUALITY
SIZE OF GAP (PERCENTAGE POINTS)
Composite inequality
Income inequalityEducation inequalityHealth inequality (self-reported symptoms)Life satisfaction inequality
SES gap in healthy eatingSES gap in physical activitySES gap in educationSES gap in life satisfactionGender gap in absolute education disadvantageGender gap in healthGender gap in life satisfactionChild poverty rateFalling below standard educational proficiencyFrequent health symptomsPrevalence of low life satisfactionRisk behaviours (3 or more)
Income inequalityAbsolute education disadvantageHealth inequality (self-reported symptoms)Physical activity inequalityHealthy eating inequalityUnhealthy eating inequalityLife satisfaction inequality
26
241424
25
32174269
2814296
163114
N/A31N/A
N/AN/AN/AN/A
530.3*29
29
201311162 (stable)
14 (increase)9 (stable)17**6**
23**9**7
3 (increase to 53)1 (increase to 6)3 (increase to 29)
0 (stable at 47)0 (stable at 46)10 (decrease to 58) 0 (stable to 29)
Summary of Inequality Indicators
*Educational inequality is not measured in percentage points but in z-scores, the standardized deviations from the average** values measured as a rate (%) rather than a gap
26
Glossary
Absolute outcome The extent to which something that is being measured (such as the average math score of a population) is achieved.
Bottom-end inequality A calculation of inequality that compares the middle to the bottom 10% distributed across an indicator (the gap between the value at the median and the value at the 10th percentile as a percentage of the median).
Health Behaviour in School-aged Children (HBSC) survey An international survey of health and health related indicators among children and youth (see hbsc.org).
Income benefits, transfers and taxation Policy tools used by government to add or subtract from an individual’s or household’s income and which vary depending on the size of earning, household composition, and other factors.
Market income Before-tax income or gross income.
Programme for International Student Assessment (PISA) An international survey of educational achievement (see oecd.org/pisa).
Progressive universalism An approach to policies and services that provides the policy or service broadly across the target population, but includes specific, targeted supports to help particular groups who need it to benefit as much or more than the broader population.
Socio-economic status (SES) A description of an individual’s or family’s economic and social position in relation to others, based on income, education, and occupation.
Sustainable Development Goals In 2015, world leaders committed to 17 Sustainable Development Goals (SDGs) to help end extreme poverty, promote well-being and combat climate change by 2030 (see sustainabledevelopment.un.org).
27

Bruckauf, Z. (2016). ‘Falling Behind: Socio-demographic profiles of educationally disadvantaged youth. Evidence from PISA 2006–2012’, Innocenti Working Paper 2016-07. UNICEF Office of Research – Innocenti, Florence.
Caledon Institute of Social Policy (2016). ‘Some Implications of the Liberal Government’s Tax Changes’ Caledon Commentary. February 2016. Accessed on March 15, 2016 at http://www.caledoninst.org/Publications/PDF/1090ENG.pdf.
CAMH (2012). ‘Mental Illness and Addictions: Facts and Statistics’ Centre for Addiction and Mental Health, Toronto. Accessed March 15, 2016 at http://www.camh.ca/en/hospital/about_camh/newsroom/for_reporters/Pages/addictionmentalhealthstatistics.aspx
CCPA (2006). Growing Gap, Growing Concerns: Canadian Attitudes Toward Income Inequality. Canadian Centre for Policy Alternatives, November 20, 2006.
Chzhen, Y., Z. Bruckauf, K. Ng, D. Pavlova, T. Torsheim and M. Gaspar de Matos (2016a). ‘Inequalities in Adolescent Health and Life Satisfaction: Evidence from the Health Behaviour in School-Aged Children study’, Innocenti Working Paper 2016-09. UNICEF Office of Research – Innocenti, Florence.
Chzhen, Y., I. Moor, W. Pickett, G. Stevens and E. Toczydlowska (2016b). ‘Family Affluence and Inequality in Adolescent Health and Life Satisfaction: Evidence from the HBSC study 2002–2014’ Innocenti Working Paper 2016-10. UNICEF Office of Research – Innocenti, Florence.
Corak, M. (2006). ‘Do Poor Children Become Poor Adults? Lessons from a Cross Country Comparison of Generational Earnings Mobility’ IZA Discussion Paper No. 1993. Institute for the Study of Labor, Bonn.
Corak, M. (2013a). ‘Income Inequality, Equality of Opportunity, and Intergenerational Mobility’ Journal of Economic Perspectives. 27(3):79-102.
Corak, M. (2013b). ‘Public policies for equality and social mobility in Canada.’ Presented as part of Equality of Opportunity – a Canadian Dream? event. Canada 2020, Ottawa.
Corak, M. (2016). ‘Why Canada Should Foster a Second-Chance Society.’ The Globe and Mail. February 22, 2016. Accessed on March 15, 2016 at http://www.theglobeandmail.com/opinion/why-canada-should-foster-a-second-chance-society/article28820375/.
Currie, C., D. Currie, L. Menchini, D. Richardson, and C. Roberts (2010). ‘Comparing Inequality in the Well-Being of Children in Economically Advanced Countries: a methodology’ Innocenti Working Paper No. 2010-19. UNICEF Innocenti Research Centre, Florence.
Elgar, F. J. and N. Aitken (2010). ‘Income inequality, trust and homicide in 33 countries’ European Journal of Public Health. 21(2):241-246.
Elgar, F. J., T.-K. Pfortner, I. Moor, B. De Clercq and C. Currie. (2015). ‘Socioeconomic inequalities in adolescent health 2002-2010: A time-series analysis of 34 countries participating in the Health Behaviour in School-aged Children Study’ Lancet. 385:2088–95.
Gray, P. (2010). ‘The Decline of Play and Rise in Children’s Mental Disorders’ Psychology Today. January 26, 2010. Accessed March 15, 2016 at https://www.psychologytoday.com/blog/freedom-learn/201001/the-decline-play-and-rise-in-childrens-mental-disorders.
Hansen, K. and H. Joshi (2007). Millennium Cohort Study Second Survey: A user’s guide to initial findings. Centre for Longitudinal Studies, London.
Jianghong L., A. McMurray and F. Stanley (2008). ‘Modernity’s paradox and the structural determinants of child health and well-being’ Health Sociology Review. 17(1):64-77.
Kearney, M. and P. Levine. (2016). Income Inequality, Social Mobility and the Decision to Drop out of High School. Brookings Papers on Economic Development, March 2016.
Keating, D.P. & Hertzman, C. (1999) Modernity’s Paradox in Developmental Health and the Wealth of Nations: Social, Biological and Educational Dynamics, (ed.) Keating, D.P. & Hertzman, C., The Guilford Press. N.Y. 1999.Keeley, B. (2015). Income Inequality: The Gap between Rich and Poor. OECD Insights, OECD Publishing, Paris.
Sources
©U
NIC
EF
CA
NA
DA
/201
6-W
ATE
RLO
O/G
BE
NN
ET
T
28
Klein, S. and A. Yalnizyan (2016). Better is Always Possible: A Federal Plan to Tackle Poverty and Inequality. Canadian Centre for Policy Alternatives, Ottawa.
O’Brien, M. (2014). ‘Poor kids who do everything right don’t do better than rich kids who do everything wrong’ The Washington Post. October 18, 2014. Accessed March 15, 2016 at https://www.washingtonpost.com/news/wonk/wp/2014/10/18/poor-kids-who-do-everything-right-dont-do-better-than-rich-kids-who-do-everything-wrong/.
OECD (2011). Divided We Stand: Why Inequality Keeps Rising. OECD Publishing, Paris.
OECD (2015). In It Together: Why Less Inequality Benefits All. OECD Publishing, Paris.
Pickett, K.E. and R.G. Wilkinson (2007). ‘Child wellbeing and income inequality in rich societies: ecological cross sectional study’ British Medical Journal. 335:1080-1086.
Pickett, K.E. and R.G. Wilkinson (2015). ‘The Ethical and Policy Implications of Research on Income Inequality and Child Well-being’ Pediatrics. 135(Supp 2):S39-S47.
Richardson, D. and N. Ali (2014). ‘An Evaluation of International Surveys of Children’ OECD Social, Employment and Migration Working Papers, No. 146. OECD Publishing, Paris.
Save the Children Fund (2012). Born Equal: How reducing inequality could give our children a better future. Save the Children Fund, London.
Shaw, B., M. Bicket, B. Elliott, B. Fagan-Watson, E. Mocca, M. Hillman (2015). Children’s Independent Mobility: An International Comparison. Policy Studies Institute, London.Stewart, F. (2013). ‘Approaches towards Inequality and Inequity: Concepts, measures and policies’ Office of Research Discussion Paper No. 2013-01. UNICEF Office of Research, Florence.
Toczydlowska, E., Y. Chzhen, Z. Bruckauf and S. Handa (2016). ‘Income Inequality among Children in Europe 2008–2013’ Innocenti Working Paper 2016-15. UNICEF Office of Research – Innocenti, Florence.
UNICEF (2010). ‘The Children Left Behind: A league table of inequality in child well-being in the world’s rich countries’ Innocenti Report Card 9. UNICEF Innocenti Research Centre, Florence.
UNICEF Office of Research (2013). ‘Child Well-being in Rich Countries: A comparative overview’ Innocenti Report Card 11. UNICEF Office of Research, Florence.
WHO (2016). ‘Growing up Unequal: Gender and socioeconomic differences in young people’s health and well-being’. World Health Organization, Geneva.
The statistics cited in this Canadian Companion are rounded from those reported in UNICEF Report Card 13.
© U
NIC
EF
CA
NA
DA
/201
0/S
RI U
TAM
I
29

For more information about UNICEF Canada: call 1 800 567 4483 or email [email protected] Charitable Registration No. 122680572 RR0001 unicef.ca
Related Documents


![[PubOff] [Oct 23]](https://static.cupdf.com/doc/110x72/577cc2f71a28aba71194dc7c/puboff-oct-23.jpg)