Truck Driver Accidents 1 Occupational Vehicular Accidents: A Workers’ Compensation Analysis of Oregon Truck Drivers 1990-1997 By: Brian P. McCall, Ph.D. a Irwin B. Horwitz, Ph.D. b a University of Minnesota, Industrial Relations Center, 3-251 CarlSMgmt Bldg, Minneapolis, MN 55455. b University of Texas, School of Public Health – Houston, 1200 Herman Pressler W310, Houston, TX, 77030 Corresponding author: Irwin B. Horwitz University of Texas School of Public Health -- Houston 1200 Herman Pressler, Suite W310 Houston, TX 77030 (713) 500-9194 [email protected]

Welcome message from author
This document is posted to help you gain knowledge. Please leave a comment to let me know what you think about it! Share it to your friends and learn new things together.
Transcript
Truck Driver Accidents
1
Occupational Vehicular Accidents: A Workers’ Compensation Analysis of
Oregon Truck Drivers 1990-1997
By:
Brian P. McCall, Ph.D.a
Irwin B. Horwitz, Ph.D.b
a University of Minnesota, Industrial Relations Center, 3-251 CarlSMgmt Bldg, Minneapolis, MN 55455. b University of Texas, School of Public Health – Houston, 1200 Herman Pressler W310, Houston, TX, 77030
Corresponding author: Irwin B. Horwitz University of Texas School of Public Health -- Houston 1200 Herman Pressler, Suite W310 Houston, TX 77030 (713) 500-9194 [email protected]
bmccall
Text Box
HRRI Working Paper 05-03
Truck Driver Accidents
2
Abstract
This study used workers’ compensation data from Oregon from 1990-1997 to examine vehicular
accidents by truck drivers, and calculate rate estimates using baseline data derived from the U.S.
Bureau of Census’ Current Population Surveys. During this period, 1,168 valid injury claims due to
vehicular accidents were filed representing an accident rate of 50.3 (95% C.I. = 45.1-55.5) per 10,000
truck drivers annually. There were 19 work-related vehicular accident fatalities recorded in the data
over the 8 year period. Of all claimants, males constituted the majority (80.7%), most were 35 years of
age or younger (51.4%) and had less than 1 year of job tenure (51.0%). Truck driver injury rates due
to vehicular accidents were lowest during the 6:00 a.m. – 12.p.m. period. The average amount of
compensable lost work days per injury claim was 57.8 days, of which male claimants lost an average
of 60.5 days of work and females lost an average of 46.9 days of work. The amount of lost work days
due vehicular accident increased with the claimant’s age. A total of $11,642,635 was paid in claims
for vehicular accidents of truck drivers in Oregon over the time examined, averaging $9,966 per claim.
Sprains were the most frequently cited injury experienced from vehicular accidents.
Author Keywords: Vehicular accidents, driving, truck drivers, workers’ compensation, public health, workplace safety.
Truck Driver Accidents
3
Introduction Occupational vehicular accidents involving truck drivers represent a serious threat to both work
safety and public health. It has been estimated that from between 1980-1992, accidents involving
motor vehicles accounted for 23% of all industrial fatalities (Ore and Fosbroke, 1997). Many of the
studies which have broadly examined occupational vehicular accidents have usually confined their
analyses to fatality assessment (Karlson and Baker, 1978; Loomis, 1991; Jenkins et al. 1993). Other
research which has attempted to examine the specific occupation of truck drivers, has proven to be of
particular value because of the various factors affecting driving safety which can be assessed using a
profession where driving constitutes a primary job activity. For example, researchers have used data
from truck drivers to examine the effects of hours of work on fatigue (Arnold et al. 1997), as well
differences due to varying ranges of operation between short and long-haul drivers (Hanowski, et al.
1998; Hanowski et al., 2003). However, the methods of these previous studies on truck drivers have
been confined to surveys, focus groups, and on-board instrumentation, and not conducted on a large
population of truck drivers as a whole.
This study extends the literature on occupational vehicular accidents by analyzing all workers’
compensation injury claims due to vehicular accidents filed by truck drivers in Oregon during the
years 1990 through 1997. The use of such data has several advantages. First, important demographic
data which has been of significant interest to researchers of vehicular accidents, such as age (Jonah,
1986; Massie et al., 1994; Zhang et al., 1998; Claret et al., 2003) and gender (Massie et al., 1994; Li et
al., 1998) can be analyzed. Second, additional information that has been of interest such as time of
accident (Lenne et al., 1997), day of week of accident (Doherty et al., 1998) and event causing

Truck Driver Accidents
4
accident are recorded and can be examined. Third, other relevant facts, such as nature of injury, part of
body injured, disability time and medical costs associated with the accidents can be assessed.
Additionally, this study combined the Oregon administrative claim information with Oregon truck
driver employment data derived from the U.S. Department of Census’ Current Population Surveys as a
means of estimating truck driver injury rates and assessing the risks associated with potentially
influential accident factors.

Truck Driver Accidents
5
Methods
This study used workers’ compensation claim data that were provided by the Oregon Department
of Consumer and Business Information and Management Division for the period 1990 – 1997.
Records were kept for all claims that were disabling or potentially disabling (i.e. those that involved
either potential or actual lost work time), although the records were available for some claims that did
not actually result in disability. For this study only accepted vehicular accident claims from individuals
working as a truck driver (1990 U.S. Census Occupation Code 804) were analyzed.
The data set included information on claimant occupation and industry, claimant demographics
(e.g. age, gender), claimant work schedules, nature of reported injury, body part affected, compensated
days of lost work by claimant and claimant cost. Claim costs were tracked through 1999 and the cost
data reflect accumulated claim costs through this time. By the end of the observation period 95.0% of
all accepted injury claims of truck drivers due to vehicular accidents were closed and for these claims
the cost data was complete.
Data from the U.S. Bureau of the Census’ Current Population Survey (CPS) was used to estimate
Oregon employment levels for different demographic categories and time periods. The CPS is a
monthly survey of approximately 50,000 households that is used by the United States government to
assess, among other things, monthly unemployment rates. The CPS is a rotating survey with
households first surveyed for four months, not surveyed for the next eight months, and then surveyed
for an additional four months before permanently leaving the survey. Most of our employment
estimates are based on the monthly outgoing rotation group (CPS-MORG) files for 1990 through
Truck Driver Accidents
6
1997. These files contain data for all individuals participating in their fourth or eighth monthly survey.
For individuals in CPS-MORG, additional questions pertaining an individual’s employment are asked.
We further restricted this sample to those individuals who reported residing in Oregon and employed
as a truck driver at the time of the interview.
The injury rate due to a vehicular accident for a particular category of truck driver was calculated
by dividing the reported number of injuries from vehicular accident by the number of employed
trucker drivers in this particular category. Data for the numerator was obtained from the Oregon
workers’ compensation administrative data while the denominator is estimated using CPS sample data
for Oregon truckers. The vehicular accident injury rates were converted to injuries per 10,000 trucker
drivers by multiplying the rate by 10,000. Since estimates were employed in calculating injury rates,
95% confidence interval estimates are presented.
In some cases injury rates are reported in relation to a baseline employment category. The relative
rates are computed by forming the ratio of the injury rate of the particular employment category and
the injury rate of the baseline employment category. A ratio greater than one indicates that the
particular employment category has a higher injury rate than the baseline category. Since both the
numerator and denominator of this ratio are based on estimates 95% confidence intervals were
calculated using the delta method. In no case, for the relative rate estimates reported below, was the
lower confidence interval bound found to be less than one. All calculations reported in this paper were
made using Stata (release 7) software (Stata Corp., College Station TX).

Truck Driver Accidents
7
To estimate the fraction of Oregon truck drivers that work at particular times of day and days of
week, data from the May 1991 and May 1997 CPS Work Schedule Supplement Surveys (CPS-WSS).
These surveys contain supplemental questions pertaining to an individuals work schedule in addition
to the usual monthly survey questions. Only individuals in these work schedule supplements who
reported working as a truck drivers were included in the analysis. Since only 32 of the 2084 of these
truck drivers reported residing in Oregon, in order to increase the precision of our estimates, we used
the entire sample of truck drivers when estimating shift work, time of day, and day of week
employment fractions. Such estimates are valid when the characteristics of Oregon trucker drivers and
US truck drivers do not differ. We found no statistically significant differences in the age, gender and
industry of employment distributions between Oregon truck drivers and truck drivers residing in other
states.
Truck Driver Accidents
8
Results
Between 1990-1997, there were 1,210 claims filed by truck drivers in Oregon in which some form
of vehicular accident was cited as cause of injury. Of these claims, 1,168 (96.5%) were accepted as
valid and compensable through the workers’ compensation process. The average annual accepted
number of claim was 146, which ranged from a low of 122 claims in 1992 to a high of 157 in 1994.
Applying the CPS to obtain baselines for the number of truck drivers in Oregon by year, it was
estimated that the average rate of vehicular accidents experienced by these workers was 50.3 per
10,000 annually (95% CI = 45.1 – 55.5). The number of accidents by year for Oregon truck drivers, as
well as estimates of the yearly accident rates and corresponding confidence intervals are provided in
Table 1.
Of the accepted claims, 943 (80.7%) were filed by men, and 225 (19.3%) were filed by women.
Using data from the CPS-MORG , the estimated percentage of Oregon truck drivers that were female
over the same time period was 5.1%. The majority of claimants were under 35 years of age with 228
(19.5%) 25 years and under and 372 (31.9%) between 26 and 35. For the remaining claimants, 304
(26.0%) were aged between 36 and 45 years, 174 (14.9%) were between 46 and 55 years, 90 (7.7%)
were older than 55 years. The CPS-MORG data estimates that, over the same time period, 8.5% of
Oregon truck drivers were less than 25 years of age, 28.5 % were between ages 26 and 35, 28.5 %
were between ages 26 and 35, 32.8% were between ages 36 and 45, 19.1% were between ages 46 and
55, and 8.9% were older than 55.

Truck Driver Accidents
9
Of all truck drivers involved in accidents resulting in injury, the majority 596 (51.0%) had 1 year or
less of job tenure. Of the remaining claimants, 322 (27.6%) had over 1 year to 5 years of tenure, 83
(7.1%) had over 5 years to ten years of tenure, 28 (2.4%) had over 10 years to 15 years tenure, 22
(1.9%) had over 15 to 20 years of tenure, 15 (1.3%) had over 20 years of tenure, and for 102 (8.7%) of
the claims no information on tenure was recorded. The CPS-MORG contains no data on job tenure so
comparisons with all Oregon truck drivers over the same time period was not possible.
The time in which accidents occurred was recorded in the Oregon data, and analyzed in this study.
For 76 (6.5%) claims, however, time of accident data was missing. Among claims with valid time of
injury data, 474 (43.4%) injuries due to vehicular accidents occurred during the morning hours (6 a.m.
– 12 p.m.), 419 (38.4%) during the afternoon (12 p.m. – 6 p.m.), 100 (9.2%) during the evening (6
p.m. – 12 p.m.) and 99 (9.1%) at night (12 a.m. – 6 a.m.). Estimates from the CPS-WSS show that
49.8% of total truck driver work hours occur in the morning, 35.3% in the afternoon, 6.8% in the
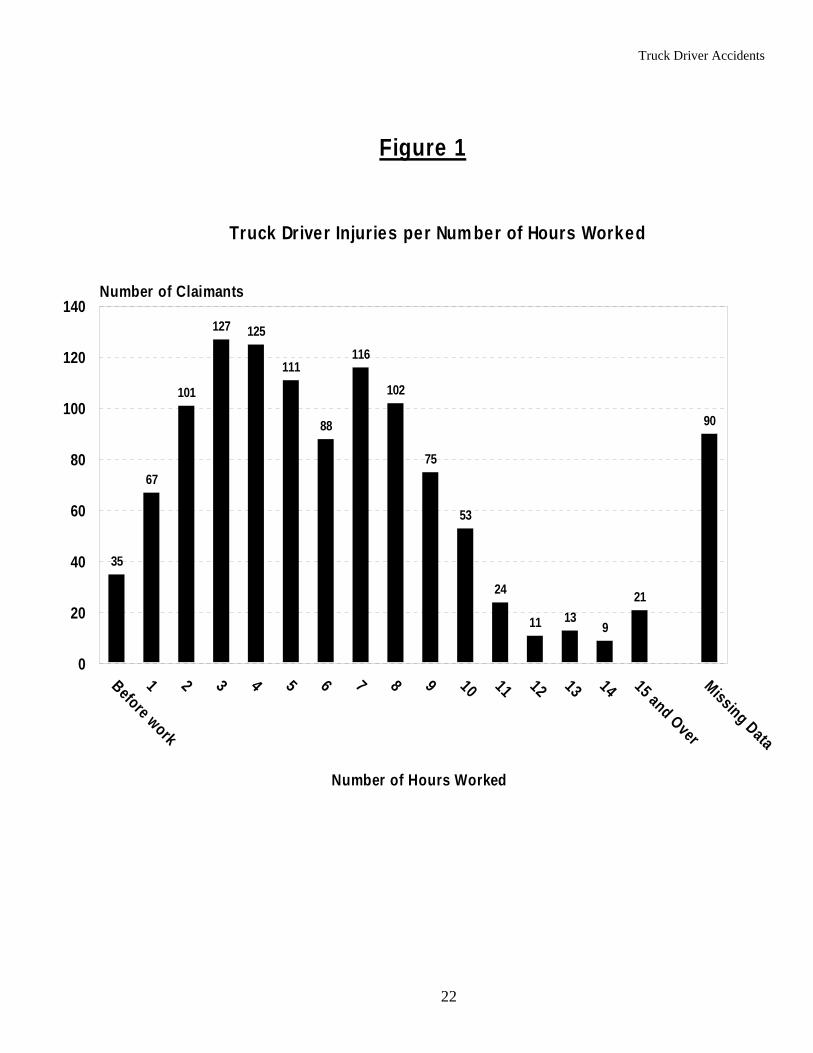
evening and 8.1% at night. The Oregon data also contained information on how many hours were
worked by the employee at the time the accident occurred, with most accidents occurring during the
third hour worked. Even using the CPS WSS to adjust for the daily number of hours worked by truck
divers in Oregon, the third hour of work still demonstrated the highest rate of accidents. A breakdown
of accidents by hours worked is provided in Figure 1.
It was also found that the fewest number of injuries due to vehicular accidents occurred on the
weekends with 65 (5.6%) reported on Saturdays and 25 (2.1%) on Sundays. In contrast, the average
number of injuries due to vehicular accidents occurring on a given weekday was about 216 (18.5%)
per day. However, adjusting for the fact that less truck drivers work on weekends using data from the

Truck Driver Accidents
10
CPS-WSS, the estimated odds ratio of a Saturday and Sunday injuries compared to Tuesday was 1.024
(95% CI 1.018-1.030) and 0.987 (95% CI 1.022-1.026), respectively.
The injuries suffered by Oregon truck drivers from vehicular accidents were examined by severity
as measured by the number of lost work days compensable by temporary total disability (TTD)
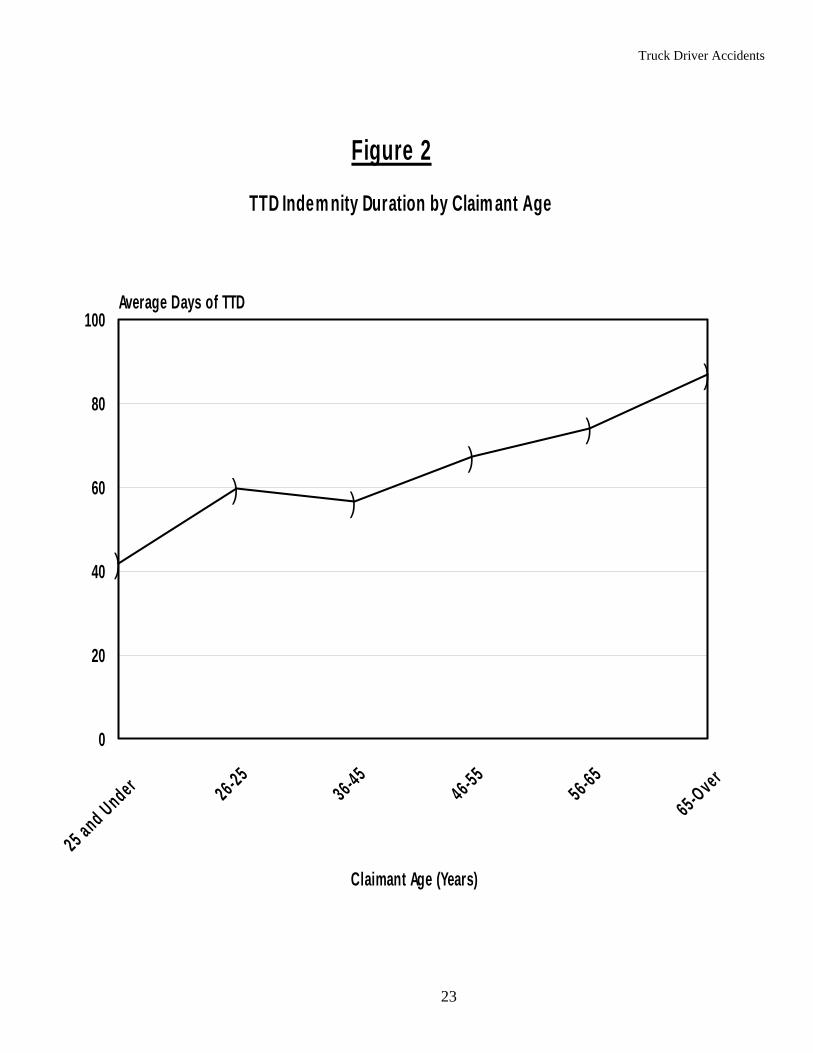
benefits. On average, truck drivers lost 57.8 days of work for injuries due to vehicular accidents, with
male claimants losing and average of 60.5 days and female claimants losing an average of 46.9 days.
The amount of days of lost work increased with age. Those under 25 years of age lost an average of
41.9 days. The amount of lost days increased to an average of 87.0 for those over the age of 65. The
upward trend of lost days with age is illustrated in Figure 2.
Claims in which the nature of injury was reported to be a fracture had greatest amount of lost work
days among all nature of injury categories with 124.7 days, while claims which reported the nature of
injury as a bruise had the shortest with 32.4 days. Injuries in which the affected part of body was the
pelvic area were had the most lost work days among all categories of body part injured with 173.0
days, while those reporting abdomen injuries had the least lost work days with 5.3 days; however, it
should be noted that the number of claims citing each of these body parts were 5 and 3 respectively.
For those categories of body part injured with 100 or more reported claims, back injuries lost an
average of 58.5 days of work, neck injuries lost an average of 43.9 days of work, and injuries affecting
multiple body parts lost an average of 68.3 days of work.
Claim costs, which can also be viewed as a measure of accident severity, were analyzed from the
workers’ compensation data. The total workers’ compensation costs associated with all claims of

Truck Driver Accidents
11
occupational vehicle accidents over the 1990-1997 period was $11,642,635, with the average total cost
of a claim being $9,966. Of this amount, an average of $3,041 was for TTD indemnification payments,
$4,677 for medical expenses, $1,962 for permanent partial disability (PPD) payments, and $285.18 for
vocational rehabilitation costs. The cost of claims for males was greater than for those by females,
with males averaging $10,821 per claim and females averaging $6,383 per claim. Claim costs were
also found to depend on the time of the accident. Total claim costs averaged $12,578 for injuries due
to a nighttime truck accident averaged, $10,970 for injuries due to a morning accident averaged,
$8,898 for injuries due to afternoon accidents and $4,244 for injuries due to evening accidents.
Injuries from accidents occurring on Fridays were associated with the highest average total claim costs
($14,105) followed by Tuesday($11,554), Wednesday ($11,034), Saturday ($8,791), Monday($7,567),
Sunday ($6,804), and Thursday($5,852).
Of all injury types reported from vehicular accidents, sprains were the most common and
constituted 628 (53.8%) of all claims. Multiple trauma was the next most frequently cited injury type
comprising 144 (12.3%)of the claims, followed by bruises with 94(8.1%) claims, fractures with 91
(7.8%) claims, non-classified traumatic injuries with 56 (4.8%), cuts and lacerations with 27 (2.3%)
claims, sprain and bruises with 24 (2.1%) claims, and dislocations with 19 (1.6%) claims. In the case
of 85 (9.2%) claims, the type of injury was unknown or unspecified. The claim rates by injury type per
10,000 workers is provided in Table 2, while the average number of lost work days and total claim
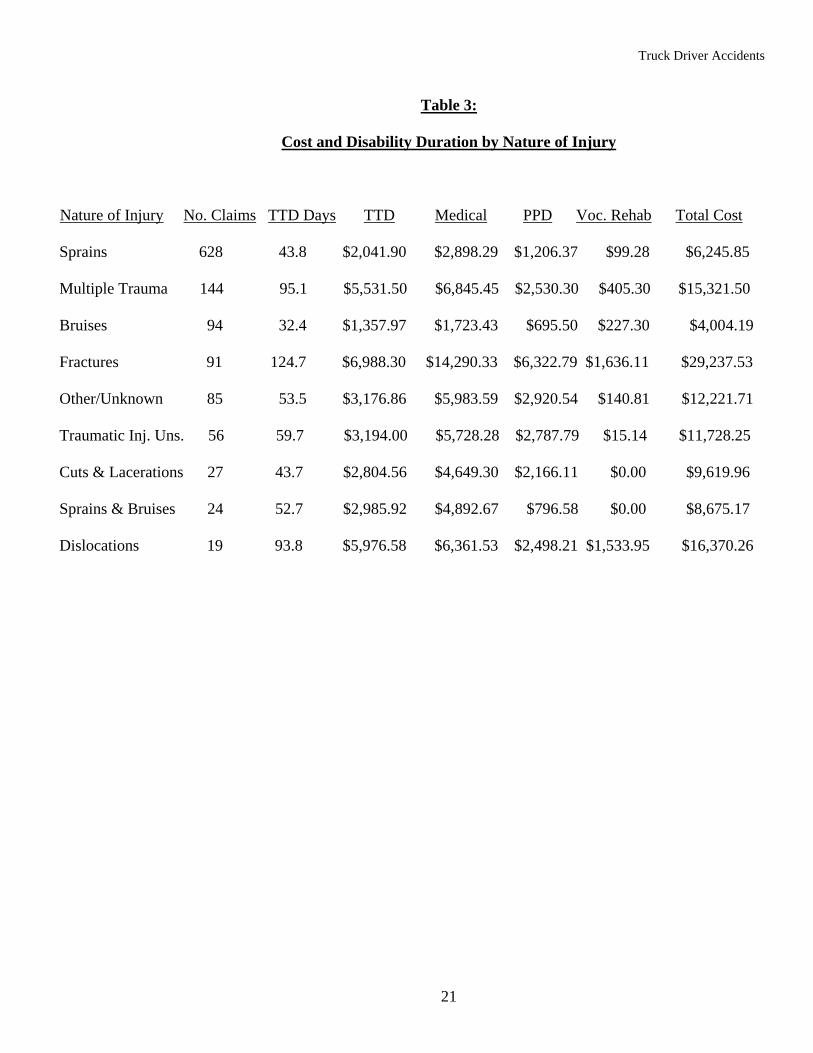
costs by injury type is shown in Table 3.

Truck Driver Accidents
12
The accidents experienced by truck drivers were further analyzed by the event which lead to the
injury. The most frequently cited cause of accident was “moving and standing vehicle” with 257
(22.0%) claims, followed by “jackknifed or overturned” with 173 (14.8%) claims, and moving in
intersection with 159 (13.6%) claims. Unspecified or non-classified “highway accidents” and
“transportation accidents” accounted for 99 (8.5%) claims, and the equivalent number of claims were
made for accidents in which “moving in the same direction” was reported. For 78 (6.7%) of the claims
“ran off the highway with no collision” was listed as cause of accident, for 67 (5.7%) claims
“collision between vehicles” was noted, while “moving in opposite directions” was attributed to 65
(5.6%) claims. Of the remaining claims, 64 (5.5%) were for “non-collision accidents,” 47 (4.0%) were
for “sudden stops and starts,” 29 (2.5%) were for “overturned,” 13 (1.1%) were for “struck stationary
object,” 5 (0.4%) were for “loss of control,” 4 (0.3%) were reported each for “mobile equipment
struck” and “fall from moving vehicle,” 3 (0.3%) each were for “re-entrant collision” and “struck by
shifting load,” 2 (0.2%) for “non-highway accident,” and 1 (0.1%) was for “fell and struck by
vehicle.”
Over the 1990-1997 period 19 (1.6%) of the reported truck driver accidents resulted in fatalities
with only one fatality being female. For 17 of the fatalities, 12 occurred during the morning hours (6
a.m. – 12 p.m.). The time of accident was not listed for two fatalities. Most fatalities were associated
with accidents that didn’t involve another vehicle, with 5 fatalities occurring because the truck
overturned or jackknifed, 5 occurring because the truck ran off the road, and 1 occurring because the
truck struck a stationary object.

Truck Driver Accidents
13
Discussion:
Overall, there were 1,168 accepted claims filed by truck drivers in Oregon for the 8-year period
examined, averaging 146 claims annually, and representing an estimated rate of 50.3 accidents per
10,000 truck drivers per year. In general, the rate was relatively stable over time, especially when
comparing the ranges of the 95% confidence intervals. The majority of claimants were male, and the
total cost of all medical and indemnity expenses was $11,642,635, in which the average claim amount
was about $9,966. On average, workers received 57.8 days of TTD indemnity payments due to lost
work per accident, and there were 19 fatalities recorded for truck drivers in work-related accidents.
One finding of this study was that truckers’ injuries due to vehicular accidents occurred
disproportionately among young workers, which is consistent with prior studies that reported higher
accident risks associated with young drivers (Massie et al. 1994, Li et al., 1998). Female trucker
drivers were also disproportionately injured from vehicular accidents although some of this is
accounted for by the fact that, on average, female truck drivers are younger. It is also important to note
that the amount of lost work days and total claim costs associated with injuries due to vehicular
accidents were markedly higher for male truck drivers than female truck drivers. Thus, while female
truck drivers appear more likely to be injured by a vehicular accident than males, when injured the
severity is greater for males than females. This latter result is inconsistent with previous evidence that
females are more likely to experience more severe injuries from accidents than males (Abdel-Aty and
Abdelwahab, 2001; Evans and Gerrish, 2001). This disagreement with past research may be partially
explainable because of possible differences in truck types driven by the two genders in the course of
their occupational duties as well as accident type experienced by these drivers, all of which have been

Truck Driver Accidents
14
found to affect the difference in severity of accidents between males and females (Ulfarsson and
Mannering, 2003). Unfortunately, the data did not contain information by which to control for these
factors. It was also found that younger workers involved in accidents took less time to recover from
their injuries and return to work than older workers, which is consistent with other studies that have
found higher mortality rates among older drivers involved in accidents attributable to age-related
increases in fragility (Li, Braver, Chen, 2003).
Injury rates due to vehicular accidents were lowest during the morning hours, and the least severe
injuries (as measured by claim costs) occurred during the evening. The number of accidents were
substantially less frequent on the weekends, however adjusting for the number of truck drivers
working on the weekends produced odds ratios which showed only a minor difference in risk for those
working on Saturday and Sunday relative to a given weekday (Tuesday). Although injury rates for
truck drivers due to vehicular accidents did not vary substantially by day of week, injuries occurring
on Friday were the most severe.
It was also found that sprains were the most frequently experienced injury type experienced by
truck drivers from occupational vehicular accidents, followed by multiple trauma, bruises, and
fractures. Fractures were the most severe of all non-fatal injuries, requiring almost 8 weeks of
indemnity per claim. Although infrequent, injuries to the pelvic region required the longest indemnity
time for all body parts affected averaging over 24 weeks per claim. Fatalities constituted 1.6% of all
accident claims, and most were not the result of collision with another vehicle.

Truck Driver Accidents
15
One limitation of this study is that workers’ compensation data do not indicate whether the truck
drivers involved in the accidents were at fault in the accident, or detail extra-mitigating circumstances
affecting the accidents (e.g., drug or alcohol use), and therefore while it is possible that the
disproportionate injury rates due vehicular accidents observed among young truck drivers may be due
to lack of experience, other confounding factors that cannot be discerned from the data may be
responsible for this observed relationship. Another limitation is that workers’ compensation data does
contain information on costs associated with vehicular damage, property damage, or injuries
associated with non-employed passengers or other persons or vehicles involved in the accidents. To
this extent, the amounts reported in this study are only those which apply to the disability, medical,
rehabilitation costs associated with the injuries sustained by the truck drivers involved in the recorded
accidents, and hence represents an underestimate of the complete costs associated with the incidents.
Last, because some truck driver accidents may not have resulted in an injury or a loss of work time, it
is likely that minor accidents went unreported in the workers’ compensation data, and hence the total
number of claims reported in this study is likely lower than the actual incidence of accidents
experienced by truck drivers for the time examined.
Truck Driver Accidents
16
References
Abdel-Aty, M.A., Abdelwahab, H.T. 2001. Development of artificial network neural models to predict
driver injury severity in traffic accidents at signalized intersections. Transportation Res. Record 1745,
6-13.
Arnold, P.K., Hartley, L.R., Corry, A., Hochstadt, D., Penna, F., Feyer, A.M. 1997. Hours of work,
and perceptions of fatigue among truck drivers. Accid. Anal. Prev. 29 (4), 471-477.
Claret, P.L., Castillo, J., Molen, J., Cavanillas, A.B., Martin, M.G., Vargas, R.G. 2003. Age and sex
differences in the risk of causing vehicle accidents in Spain, 1990-1999. Accid. Anal. Prev. 35, 261-
272.
Doherty, S.T., Andrey, J.C., MacGregor, C., 1998. The situational risks of young drivers: the influence
of passengers, time of day and day of week on accident rates. Acc. Anal. Prev. 30, 45-52.
Evans, L., Gerrish, P.H., 2001. Gender and age influence on fatality risk from the same physical
impact determined by using two-car crashes. Society of Automotive Engineers, Paper 011174.
Hanowski, R.J., Wierwille, W.W., Dingus, T.A., 2003. An on-road study to investigate fatigue in
local/short-haul trucking. Accid. Anal. Prev. 35 (2), 153-160.
Truck Driver Accidents
17
Hanowski, R.J., Wierwille, W.W., Gellatly, A.W., Early, N., Dingus, T.A. 1998. Impact of local/short
haul operations on driver fatigue: focus groups summary and analysis. FHWA Report no. FHWA-MC-
98-029. Offic3e of Motor Carriers, Federal Highway Administration, Washington, D.C.
Jenkins, E.L., Kisner, S.M., Fosbroke, D.E., Layne, L.A., Stout, N.A., Castillo, D.N., Cutlip, P.M.,
Cianfroncco, R., 1993. Fatal injuries to workers in the United States, 1980-1989: A decade of
surveillance. National Institute for Occupational Safety and Health, Cincinnati, OH.
Jonah, B.A., 1986. Accident risk and risk-taking behaviour among young drivers. Accid. Anal. Prev.
18, 255-271.
Karlson, T.A., Baker, S.P., 1978. Fatal occupational injuries associated with motor vehicles.
Proceedings of the 22nd Conference of the American Association for Automotive Medicine, Arlington
Heights, IL. 1, 229-241.
Lenne, M.G., Triggs, T.J., & Redman, J.R., 1997. Time of day variations in driving performance.
Accid. Anal. Prev. 29, 431-437.
Li, G., Baker, S.P., Langlois, J.A., Kelen, G.D., 1998. Are female drivers safer? An application of the
decomposition method. Epidemiology 9, 379-384.
Li, G., Braver, E.R., Chen, L. 2003. Fragility versus excessive crash involvement as determinants of
high death rates per vehicle-mile of travel among older drivers. Accid. Anal. Perv. 35, 227-235.

Truck Driver Accidents
18
Loomis, D.P., 1991. Occupation, injuries and fatal motor vehicle crashes in 20 states, 1986-1987. Am.
J. Pub. Health. 81, 733-735.
Massie, D.L., Campbell, K.L., Williams, A.F. 1994. Traffic accident involvement rates by age and
gender. Accid. Anal. Prev. 27, 73-87.
Ore, T., Fosbroke, D.E., 1997. Motor vehicle fatalities in the United States construction industry.
Accid. Anal. Prev. 29 (5), 613-625.
Ulfarsson, G. F., Mannering, F.L., 2003. Differences in male and female injury severities in sports-
utility vehicle, minivan, pickup, and passenger car accidents. Accid. Anal. Prev. 1-13.
Zhang, J., Fraser, S., Lindsay, J., Clarke K., and Mao, Y. 1998. Age-specific patterns of factors related
to fatal motor vehicle traffic crashes: focus on young and elderly drivers. Public Health 112, 289-295.

Truck Driver Accidents
19
Table 1: Claim Rates by Year Estimated Year Number of Claims Claim Rate per 10,000 95% CI
1990 146 82.5 48.0 – 117.0
1991 141 40.1 31.5 - 48.7
1992 122 41.5 30.1 - 52.9
1993 153 54.0 40.5 – 67.5
1994 157 54.7 38.8 – 70.6
1995 141 61.1 36.2 – 86.0
1996 156 56.9 37.1 – 76.7
1997 142 36.4 28.4 – 44.4

Truck Driver Accidents
20
Table 2:
Claim Rates by Nature of Injury Estimated Injury Type Number of Claims Rate per 10,000 95% C.I. Sprains 628 27.1 24.4 - 29.8
Multiple Trauma 144 6.2 5.6 – 6.8
Bruise 94 4.1 3.7 – 4.5
Fractures 91 3.9 3.1 - 4.7
Unknown 85 3.7 3.3 – 4.1
Traumatic Injuries NEC 56 2.4 2.1 – 2.7
Cuts & Lacerations 27 1.2 1.1 – 1.3
Sprain & Bruise 24 1.0 0.9 – 1.1
Dislocations 19 0.8 0.7 – 0.9
Truck Driver Accidents
21
Table 3:
Cost and Disability Duration by Nature of Injury
Nature of Injury No. Claims TTD Days TTD Medical PPD Voc. Rehab Total Cost
Sprains 628 43.8 $2,041.90 $2,898.29 $1,206.37 $99.28 $6,245.85
Multiple Trauma 144 95.1 $5,531.50 $6,845.45 $2,530.30 $405.30 $15,321.50
Bruises 94 32.4 $1,357.97 $1,723.43 $695.50 $227.30 $4,004.19
Fractures 91 124.7 $6,988.30 $14,290.33 $6,322.79 $1,636.11 $29,237.53
Other/Unknown 85 53.5 $3,176.86 $5,983.59 $2,920.54 $140.81 $12,221.71
Traumatic Inj. Uns. 56 59.7 $3,194.00 $5,728.28 $2,787.79 $15.14 $11,728.25
Cuts & Lacerations 27 43.7 $2,804.56 $4,649.30 $2,166.11 $0.00 $9,619.96
Sprains & Bruises 24 52.7 $2,985.92 $4,892.67 $796.58 $0.00 $8,675.17
Dislocations 19 93.8 $5,976.58 $6,361.53 $2,498.21 $1,533.95 $16,370.26
Truck Driver Accidents
22
Figure 1
Truck Driver Injuries per Num ber of Hours Worked
35
67
101
127 125
111
88
116
102
75
53
24
11 139
21
90
Before work
1 2 3 4 5 6 7 8 9 10 11 12 13 14 15 and Over
Missing Data
Number of Hours Worked
0
20
40
60
80
100
120
140Number of Claimants
Truck Driver Accidents
23
Figure 2
TTD Indem nity Duration by Claim ant Age
)
)
))
)
)
25 and Under 26-2536-45
46-5556-65
65-Over
Claimant Age (Years)
0
20
40
60
80
100Average Days of TTD
Related Documents


