RESEARCH ARTICLE Objective Detection of Retinal Vessel Pulsation William H. Morgan 1 *, Anmar Abdul-Rahman 4 , Dao-Yi Yu 1 , Martin L. Hazelton 2 , Brigid Betz-Stablein 2 , Christopher R. P. Lind 3 1 Lions Eye Institute, University of Western Australia, Nedlands, Australia, 2 Statistics and Bioinformatics Group, Institute of Fundamental Sciences, Massey University, Palmerston North, New Zealand, 3 Neurofinity, School of Surgery, University of Western Australia, Nedlands, Australia, 4 Department of Ophthalmology, Manukau Health, Auckland, New Zealand * [email protected] Abstract Purpose Retinal venous pulsation detection is a subjective sign, which varies in elevated intracranial pressure, venous obstruction and glaucoma. To date no method can objectively measure and identify pulsating regions. Method Using high resolution video-recordings of the optic disk and retina we measured fluctuating light absorption by haemoglobin during pulsation. Pulsation amplitude was calculated from all regions of the retinal image video-frames in a raster pattern. Segmented retinal images were formed by objectively selecting regions with amplitudes above a range of threshold values. These were compared to two observers manually drawing an outline of the pulsat- ing areas while viewing video-clips in order to generate receiver operator characteristics. Results 216,515 image segments were analysed from 26 eyes in 18 research participants. Using data from each eye, the median area under the receiver operator curve (AU-ROC) was 0.95. With all data analysed together the AU-ROC was 0.89. We defined the ideal threshold amplitude for detection of any pulsating segment being that with maximal sensitivity and specificity. This was 5 units (95% confidence interval 4.3 to 6.0) compared to 12 units before any regions were missed. A multivariate model demonstrated that ideal threshold amplitude increased with increased variation in video-sequence illumination (p = 0.0119), but between the two observers (p = 0.0919) or other variables. Conclusion This technique demonstrates accurate identification of retinal vessel pulsating regions with no areas identified manually being missed with the objective technique. The amplitude PLOS ONE | DOI:10.1371/journal.pone.0116475 February 2, 2015 1 / 10 OPEN ACCESS Citation: Morgan WH, Abdul-Rahman A, Yu D-Y, Hazelton ML, Betz-Stablein B, Lind CRP (2015) Ob- jective Detection of Retinal Vessel Pulsation. PLoS ONE 10(2): e0116475. doi:10.1371/journal. pone.0116475 Academic Editor: Bang V Bui, University of Mel- bourne, AUSTRALIA Received: September 23, 2014 Accepted: December 10, 2014 Published: February 2, 2015 Copyright: © 2015 Morgan et al. This is an open ac- cess article distributed under the terms of the Creative Commons Attribution License, which permits unrestricted use, distribution, and reproduction in any medium, provided the original author and source are credited. Data Availability Statement: All relevant data are within the paper and its Supporting Information files. Funding: This work was supported by the National Health and Medical Research Council NHMRC (https://www.nhmrc.gov.au), NHMRC Grant Refer- ence Number APP1020367 WHM, NHMRC Project Grant 102367 WHM, and NHMRC Development Grant 107310 WHM. The funders had no role in study design, data collection and analysis, decision to publish, or preparation of the manuscript. Competing Interests: WH Morgan and DY Yu have a provisional patent using some of these concepts

Welcome message from author
This document is posted to help you gain knowledge. Please leave a comment to let me know what you think about it! Share it to your friends and learn new things together.
Transcript
RESEARCH ARTICLE
Objective Detection of Retinal VesselPulsationWilliam H. Morgan1*, Anmar Abdul-Rahman4, Dao-Yi Yu1, Martin L. Hazelton2,Brigid Betz-Stablein2, Christopher R. P. Lind3
1 Lions Eye Institute, University of Western Australia, Nedlands, Australia, 2 Statistics and BioinformaticsGroup, Institute of Fundamental Sciences, Massey University, Palmerston North, New Zealand,3Neurofinity, School of Surgery, University of Western Australia, Nedlands, Australia, 4 Department ofOphthalmology, Manukau Health, Auckland, New Zealand
Abstract
Purpose
Retinal venous pulsation detection is a subjective sign, which varies in elevated intracranial
pressure, venous obstruction and glaucoma. To date no method can objectively measure
and identify pulsating regions.
Method
Using high resolution video-recordings of the optic disk and retina we measured fluctuating
light absorption by haemoglobin during pulsation. Pulsation amplitude was calculated from
all regions of the retinal image video-frames in a raster pattern. Segmented retinal images
were formed by objectively selecting regions with amplitudes above a range of threshold
values. These were compared to two observers manually drawing an outline of the pulsat-
ing areas while viewing video-clips in order to generate receiver operator characteristics.
Results
216,515 image segments were analysed from 26 eyes in 18 research participants. Using
data from each eye, the median area under the receiver operator curve (AU-ROC) was
0.95. With all data analysed together the AU-ROC was 0.89. We defined the ideal threshold
amplitude for detection of any pulsating segment being that with maximal sensitivity and
specificity. This was 5 units (95% confidence interval 4.3 to 6.0) compared to 12 units before
any regions were missed. A multivariate model demonstrated that ideal threshold amplitude
increased with increased variation in video-sequence illumination (p = 0.0119), but between
the two observers (p = 0.0919) or other variables.
Conclusion
This technique demonstrates accurate identification of retinal vessel pulsating regions with
no areas identified manually being missed with the objective technique. The amplitude
PLOSONE | DOI:10.1371/journal.pone.0116475 February 2, 2015 1 / 10
OPEN ACCESS
Citation: Morgan WH, Abdul-Rahman A, Yu D-Y,Hazelton ML, Betz-Stablein B, Lind CRP (2015) Ob-jective Detection of Retinal Vessel Pulsation. PLoSONE 10(2): e0116475. doi:10.1371/journal.pone.0116475
Academic Editor: Bang V Bui, University of Mel-bourne, AUSTRALIA
Received: September 23, 2014
Accepted: December 10, 2014
Published: February 2, 2015
Copyright: © 2015 Morgan et al. This is an open ac-cess article distributed under the terms of theCreative Commons Attribution License, which permitsunrestricted use, distribution, and reproduction in anymedium, provided the original author and source arecredited.
Data Availability Statement: All relevant data arewithin the paper and its Supporting Information files.
Funding: This work was supported by the NationalHealth and Medical Research Council NHMRC(https://www.nhmrc.gov.au), NHMRC Grant Refer-ence Number APP1020367 WHM, NHMRC ProjectGrant 102367 WHM, and NHMRC DevelopmentGrant 107310 WHM. The funders had no role instudy design, data collection and analysis, decision topublish, or preparation of the manuscript.
Competing Interests:WH Morgan and DY Yu havea provisional patent using some of these concepts
values are derived objectively and may be a significant advance upon subjective ophthal-
modynamometric threshold techniques.
IntroductionRetinal venous pulsation is an important and long recognised clinical sign,[1] which becomesabsent in subjects with elevated intracranial pressure,[2] [3] retinal venous occlusion[4, 5] andin many glaucoma patients.[6–8] Currently, its presence is subjectively determined by an ob-server, who may induce pulsation, if absent, by elevating the intraocular pressure. This was firstdescribed in 1853[1] and the threshold intraocular pressure required to induce venous pulsa-tion has been found to be strongly predictive of intracranial pressure[3], glaucoma progression[9] and severity of venous occlusion.[5] Unfortunately, the utility of venous pulsation assess-ment suffers from subjectivity, variability and the need for a skilled observer.[10]
There is a need for an observer-independent technique capable of objectively measuring anaspect of vessel pulsation across the optic disc and surrounding retina. Such a technique needsto be verified against expert clinical observation. Receiver operating characteristics have beenshown to be robust in assessing accuracy of image analysis techniques in the detection of clini-cal features.[11, 12]
Current recording techniques for assessing retinal vessel pulsation use either direct video re-cordings with an observer viewing the recordings and commenting upon the presence or ab-sence of pulsation,[13, 14] or use an image analysis technique detecting vessel diameters.[15]The latter technique requires an observer to outline the vessels of interest and diameter mea-surements are calculated from the video frames. It will measure vessel diameters on the retinalsurface but not on the optic disc.[15] We have recently described a modified photo-plethysmographic technique for measuring retinal vessel segment pulsatility, which also mea-sures pulsatility from optic disc surface vessels.[16] The reproducibility measurements withthis technique demonstrate a coefficient of variation 13% for vessel pulsation amplitude and4% for pulsation timing.
We modified this system to objectively measure vessel pulsation amplitude from sectors ofretinal images. This was done using short retinal video recordings, which can also be viewed byexperienced observers to manually ascertain vessel pulsation. We present results of our objec-tive technique and its comparison with two observers.
MethodsThis study was performed under the aegis and approval of the University of Western AustraliaHuman Ethics Committee adhering to the tenets of the Declaration of Helsinki. Written con-sent was obtained from each of the participants. Healthy adult research participants were re-cruited from the medical student body and relatives of patients treated at the Lions EyeInstitute.
The modified plethysmographic technique and principles have been described previously.[16] We briefly describe the technique along with the modifications. A pulse oximeter is con-nected to the patient so that the cardiac cycle timing was recorded on the audio trace of thevideo segments in a manner described previously.[17] This enables mathematical analysis ofthe periodic component in time with the cardiac cycle.
Participants were required to have clear ocular media, with no retinal or optic nerve pathol-ogy and normal visual fields as assessed by Humphrey standard automated perimetry or
Vessel Pulsation Detection
PLOS ONE | DOI:10.1371/journal.pone.0116475 February 2, 2015 2 / 10
described to allow prediction of intra-cranial pressurein a non-invasive manner. The patent is titled “METH-OD AND SYSTEM FOR DETERMINING INTRACRA-NIAL PRESSURE” and is filed with the AustralianPatents Office #2014900767. This does not alter theauthors' adherence to PLOS ONE policies on sharingdata and materials.
Frequency Doubling Perimetry (Humphrey—Zeiss, Dublin, Ca). Subjects were not excludedon the basis of smoking history or systemic hypertension. They all had visual field testing forone half hour prior, then dilated for another half hour. They rested and were not given caffeineduring this period. Blood pressure was not measured. Written consent was obtained from eachof the participants. The participant’s pupils were dilated with 1% Tropicamide. Following dila-tion a pulse oximeter (Nellcor N65, Covidien, Mansfield, MA) was applied to the right indexfinger. Each participant underwent video recording with a non-contact 60 dioptre indirect lensin the first instance. When there was excessive eye movement a Meditron ophthalmodynam-ometer (Meditron, Voeklingen, Germany) was used because it stabilises eye movements. Theophthalmodynamometer was used with a Goldmann three-mirror contact lens. Contact gelwas applied to the lens prior to contact with the cornea. The participant sat at a video slit-lamp(Carl Zeiss, West Germany) and had video recordings taken (Canon 5DMark III, Japan). Thiscamera has low noise at low light levels and allows video-recordings to be taken at lower lightlevels than our previous system.[18] This allowed some subjects to maintain fixation duringvideo recording with the 60dioptre lens. Several sequences of at least three cardiac cycles inlength were taken. In several subjects recordings were taken from both eyes. The camera has aninbuilt microphone and the pulse oximeter was placed 10cm from the camera so that it re-corded the pulse “beat” concurrently with the video recordings. The pulse oximeter audiotransmission time to camera is estimated at 0.3ms and the camera analog to digital conversionestimated to take 1ms leading to an approximate 1.3ms delay. The pulse oximeter was placedin an identical position for all recordings so that this time delay was constant and the audiopulse recorded used to mark the start point of each cardiac cycle.
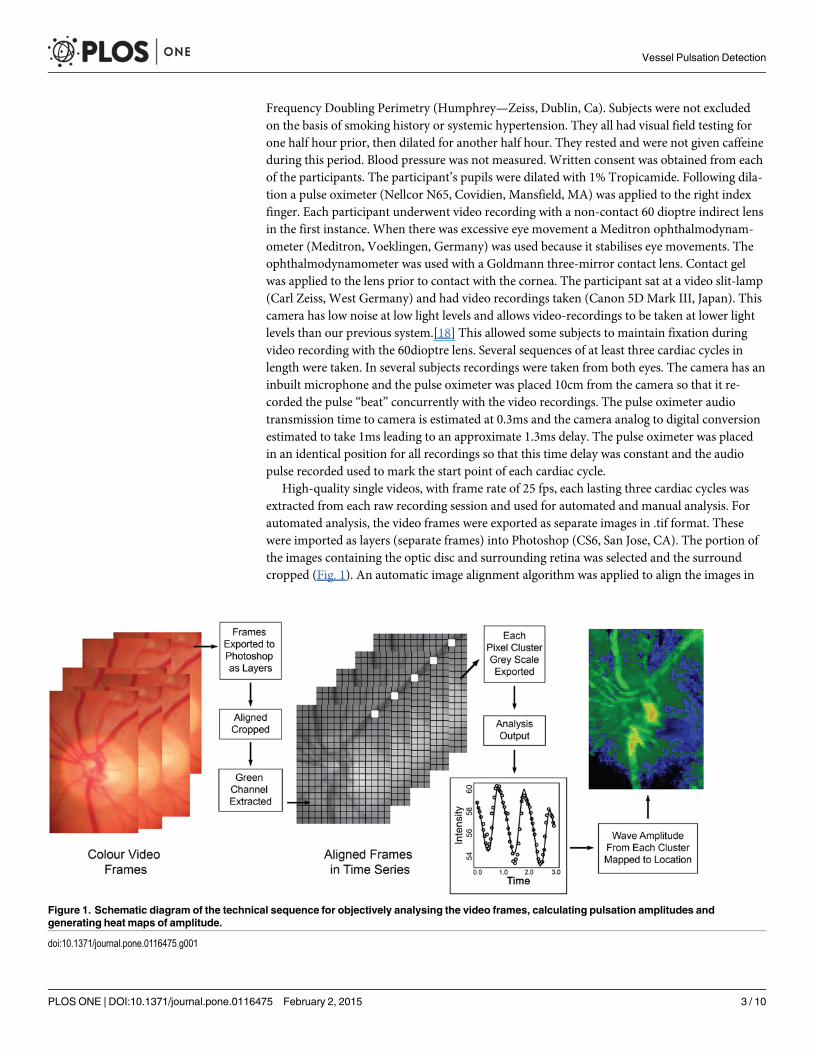
High-quality single videos, with frame rate of 25 fps, each lasting three cardiac cycles wasextracted from each raw recording session and used for automated and manual analysis. Forautomated analysis, the video frames were exported as separate images in .tif format. Thesewere imported as layers (separate frames) into Photoshop (CS6, San Jose, CA). The portion ofthe images containing the optic disc and surrounding retina was selected and the surroundcropped (Fig. 1). An automatic image alignment algorithm was applied to align the images in
Figure 1. Schematic diagram of the technical sequence for objectively analysing the video frames, calculating pulsation amplitudes andgenerating heat maps of amplitude.
doi:10.1371/journal.pone.0116475.g001
Vessel Pulsation Detection
PLOS ONE | DOI:10.1371/journal.pone.0116475 February 2, 2015 3 / 10
order to centre the optic disc and blood vessels. This algorithm uses a composite affine trans-formation, combining shear, linear and rotational shifts to match a reference layer to the otherlayers. This layered image set was kept aside and the degree of movement horizontally and ver-tically between the two most displaced image layers was used to calculate the degree of imagewobble. The aligned image series was then cropped again simply to remove extraneous por-tions of image that were not consistently visible in all layers.
These cropped aligned images from three cardiac cycles were imported into custom writtensoftware (written in R language)[19] where the green colour channel from each image layerwas extracted. The optical path length through haemoglobin and its relationship to the trans-mission of light is described by the Beer-Lambert law, which demonstrates that the path lengthis proportional to the negative logarithm of transmittance. Each image was broken into anarray of 5x5 pixel green channel intensity values. Each intensity value was transformed by tak-ing its negative logarithm so the resulting parameter would have a stronger linear relationshipto the optical path length. This transformation of the values also rendered variations in cameragamut linear rather than exponential. We calculated an approximation for optical path lengthabsorbance by hemoglobin in microns assuming that intensity recorded was associated withtransmittance, an extinction co-efficient of 12 L mmol-1 cm-1 at 550 nanometres for both oxyand de-oxy haemoglobin[16, 20] and an average hemoglobin concentration of 150g/L in ourparticipants along with a molar density of 64,500 grams haemoglobin per mole. We dividedthis result by 2 assuming that the bulk of light passes through and is reflected back through thesame vessel encountered meaning that the optic path length is twice the actual vessel depth.This resulted in a factor of 68, which was then multiplied with the negative logarithm. Themean of that 5x5 pixel cluster of transformed intensity values was stored. Our results are pre-sented in arbitrary units and we do not claim that they necessarily reflect accurate change invessel depth in microns.
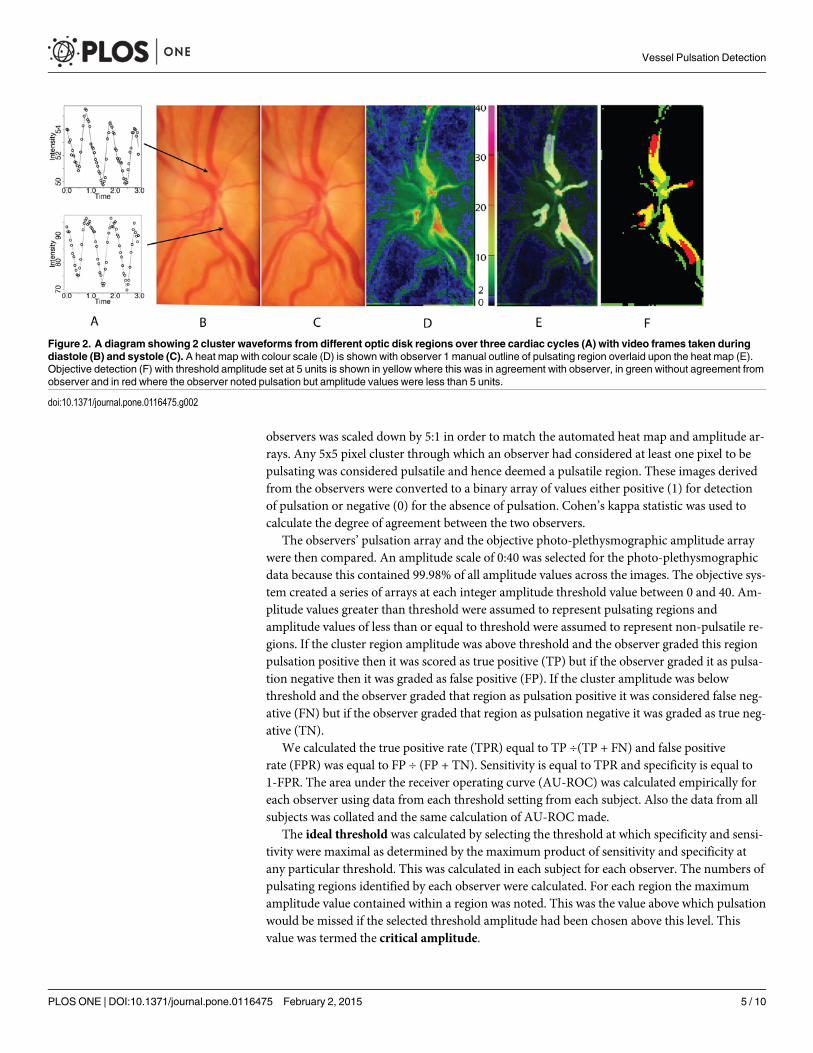
The software then created a three-dimensional matrix comprising a series of two-dimensional images as a stack containing the green channel information (Fig. 1). Each layer inthe stack contained information which mapped directly to corresponding video frame and sospatial coherence was maintained. The stack contained the time information and the alignedclusters were analysed using a harmonic regression assuming cardiac cycle periodicity. A linearspline term was incorporated in the regression to account for the effects of patient movementduring video capture. The fitted curves were differentiated and the maximum and minimumvalues extracted with amplitude calculated for each cluster region. An example of the curves,image and heat map of amplitudes are seen in Figs. 1 and 2. The amplitude values were storedin a separate array to be used for future comparison. Those arrays were used to generate heatmaps and one is shown in Fig. 2c with colour coded pixels representing the degree of amplitudemeasured at each cluster point on the image. Two original aligned image frames, one from di-astole and the other during systole are shown also in Fig. 2 for comparison and one can seehow the amplitude maps have peak values in the location of larger and more central veins.
Two observers viewed the raw three cardiac cycle video sequences. Both observers are expe-rienced ophthalmologists with Observer 1 having a large research interest and expertise in reti-nal venous pulsation with Observer 2 being newly introduced to this field. The observers weregiven a cropped frame on a computer screen, taken from the series analysed with which to out-line areas of visible pulsation using a cursor tool in Photoshop (Adobe Photoshop CS6, SanJose, CA). On an adjacent screen they viewed the original video clip of the three cardiac cyclesand were allowed to view this as often as they wished. The observers outlined correspondingsections on the selected video frame where pulsation was occurring. The section of image con-tained within their outline was considered to be pulsating by the observers and regions outsideof selected areas were deemed to be non-pulsatile by the observers. The image outlined by the
Vessel Pulsation Detection
PLOS ONE | DOI:10.1371/journal.pone.0116475 February 2, 2015 4 / 10
observers was scaled down by 5:1 in order to match the automated heat map and amplitude ar-rays. Any 5x5 pixel cluster through which an observer had considered at least one pixel to bepulsating was considered pulsatile and hence deemed a pulsatile region. These images derivedfrom the observers were converted to a binary array of values either positive (1) for detectionof pulsation or negative (0) for the absence of pulsation. Cohen’s kappa statistic was used tocalculate the degree of agreement between the two observers.
The observers’ pulsation array and the objective photo-plethysmographic amplitude arraywere then compared. An amplitude scale of 0:40 was selected for the photo-plethysmographicdata because this contained 99.98% of all amplitude values across the images. The objective sys-tem created a series of arrays at each integer amplitude threshold value between 0 and 40. Am-plitude values greater than threshold were assumed to represent pulsating regions andamplitude values of less than or equal to threshold were assumed to represent non-pulsatile re-gions. If the cluster region amplitude was above threshold and the observer graded this regionpulsation positive then it was scored as true positive (TP) but if the observer graded it as pulsa-tion negative then it was graded as false positive (FP). If the cluster amplitude was belowthreshold and the observer graded that region as pulsation positive it was considered false neg-ative (FN) but if the observer graded that region as pulsation negative it was graded as true neg-ative (TN).
We calculated the true positive rate (TPR) equal to TP ÷(TP + FN) and false positiverate (FPR) was equal to FP ÷ (FP + TN). Sensitivity is equal to TPR and specificity is equal to1-FPR. The area under the receiver operating curve (AU-ROC) was calculated empirically foreach observer using data from each threshold setting from each subject. Also the data from allsubjects was collated and the same calculation of AU-ROC made.
The ideal threshold was calculated by selecting the threshold at which specificity and sensi-tivity were maximal as determined by the maximum product of sensitivity and specificity atany particular threshold. This was calculated in each subject for each observer. The numbers ofpulsating regions identified by each observer were calculated. For each region the maximumamplitude value contained within a region was noted. This was the value above which pulsationwould be missed if the selected threshold amplitude had been chosen above this level. Thisvalue was termed the critical amplitude.
Figure 2. A diagram showing 2 cluster waveforms from different optic disk regions over three cardiac cycles (A) with video frames taken duringdiastole (B) and systole (C). A heat map with colour scale (D) is shown with observer 1 manual outline of pulsating region overlaid upon the heat map (E).Objective detection (F) with threshold amplitude set at 5 units is shown in yellow where this was in agreement with observer, in green without agreement fromobserver and in red where the observer noted pulsation but amplitude values were less than 5 units.
doi:10.1371/journal.pone.0116475.g002
Vessel Pulsation Detection
PLOS ONE | DOI:10.1371/journal.pone.0116475 February 2, 2015 5 / 10
For each series the average green channel intensity for the entire frame was calculated. Themean and standard deviation of intensity over the three cardiac cycles was calculated for eachvideo clip. The standard deviation was used as an index of how varied the illumination hadbeen during each video recording.
For each series of images, when the initial individual frames were aligned, the maximumvertical and horizontal displacement of the frames in pixels was noted prior to cropping the se-ries. Using Pythagoras’ formula, displacement was calculated as square root of vertical displace-ment squared plus horizontal displacement squared, yielding an index of image movementduring the recording.
Statistical AnalysisAll data is presented as a mean and standard deviation unless otherwise stated. All analysis wasperformed using R.[19] The comparison of observers’ identification of pulsation regions wascalculated using Cohen’s kappa statistic. Note that all the pixel cluster data from all images wasused. All data was tested for normality using the Shapiro-Wilk test, transformed when non-normal then retested. Area under the receiver operator characteristic curve were transformedusing a log(1 − AU-ROC) transform. Ideal threshold was transformed using a logarithmictransform. Linear mixed models were used to model the effect of explanatory variables upon ei-ther ROC AUC, ideal thresholds and critical amplitude.[21] The explanatory variables usedwere observer, image illumination variation (standard deviation), image movement, sex, ageand use of ophthalmodynamometry. Given that some patients had video recordings from botheyes and that all patients’ video recordings were viewed by the two observers, a random factorfor patient identity was used and a separate random factor for right and left eye was nestedwithin the former to account for correlations between right and left eye and correlations be-tween identical patients.
ResultsTwenty-six video recordings from 18 participants (10 male, 8 female) with mean age 52 years(sd 21) were taken. There were 13 right eyes and 13 left eyes with 16 recordings utilizing anophthalmodynamometer and 10 without. The subjects mean IOP was 16.5 (sd 2.8) mmHg.The ophthalmodynamometric force applied averaged 24 (sd 26) grams, creating a mean in-crease in IOP of 23mmHg using a previously published calibration constant.[22] The observersdetermined that all visible pulsation occurred within retinal veins except in one subject. Thissubject (subject 12) had ophthalmodynamometry applied and this induced arterial pulsationwithout visible venous pulsation.
The average raw image size was 405 pixels (sd 100) by 502 pixels (sd 174). A total of 216,5295x5 pixel clusters were analysed. The two observers viewed a mean 2.4 pulsating regions fromeach subject’s video sequence (sd 1.1) with Observer 1 seeing more (3.1) than Observer 2 (1.8).Cohen’s kappa for the detection of pulsating regions between observers was 0.98. The AU-ROC was averaged between the two observers for each individual and this data along with theaverage ideal threshold and other core data is presented in Table 1.
The AU-ROC data was skewed to the left so a log (1 − AU-ROC) transform was appliedwhich normalised the data. This data was then used to calculate the confidence intervals andalso the linear mixed modelling as described above. Choice of observer was not associated withAU-ROC (p = 0.0716). None of the other explanatory variables (image movement, use ofophthalmodynamometry, image illumination variation, sex or age) was found to influencethe AU-ROC with the minimum probability value being 0.1175. The mean of the average
Vessel Pulsation Detection
PLOS ONE | DOI:10.1371/journal.pone.0116475 February 2, 2015 6 / 10
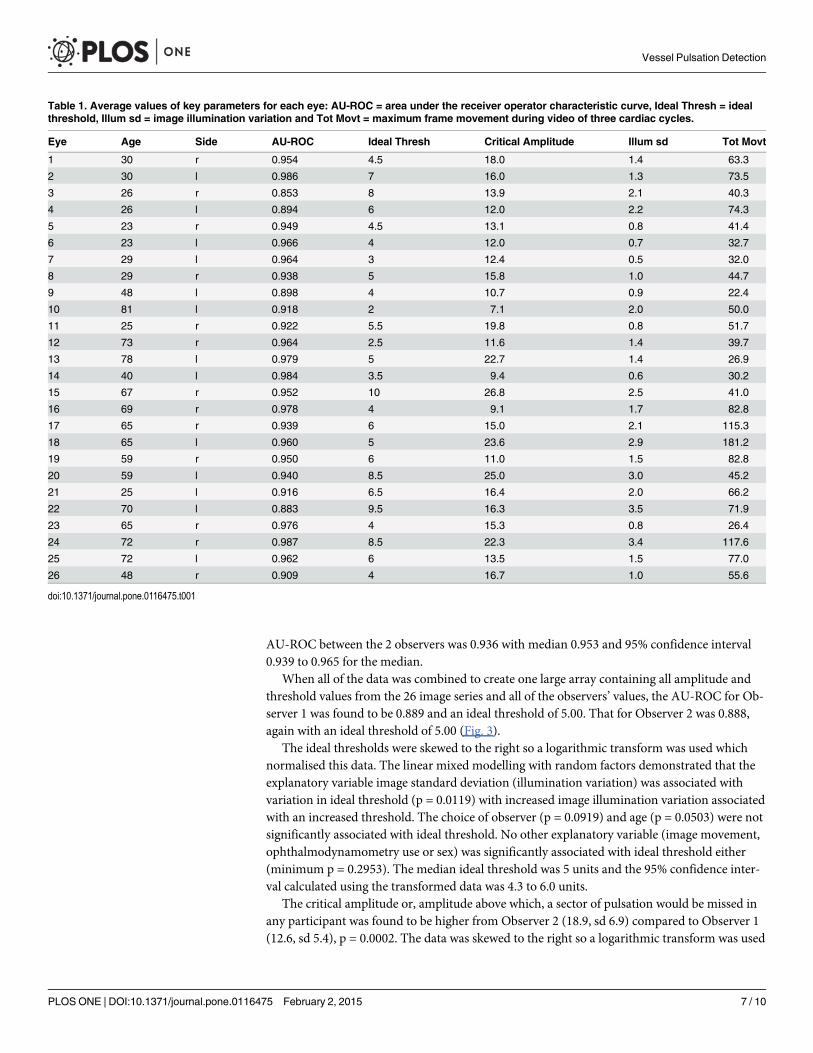
AU-ROC between the 2 observers was 0.936 with median 0.953 and 95% confidence interval0.939 to 0.965 for the median.
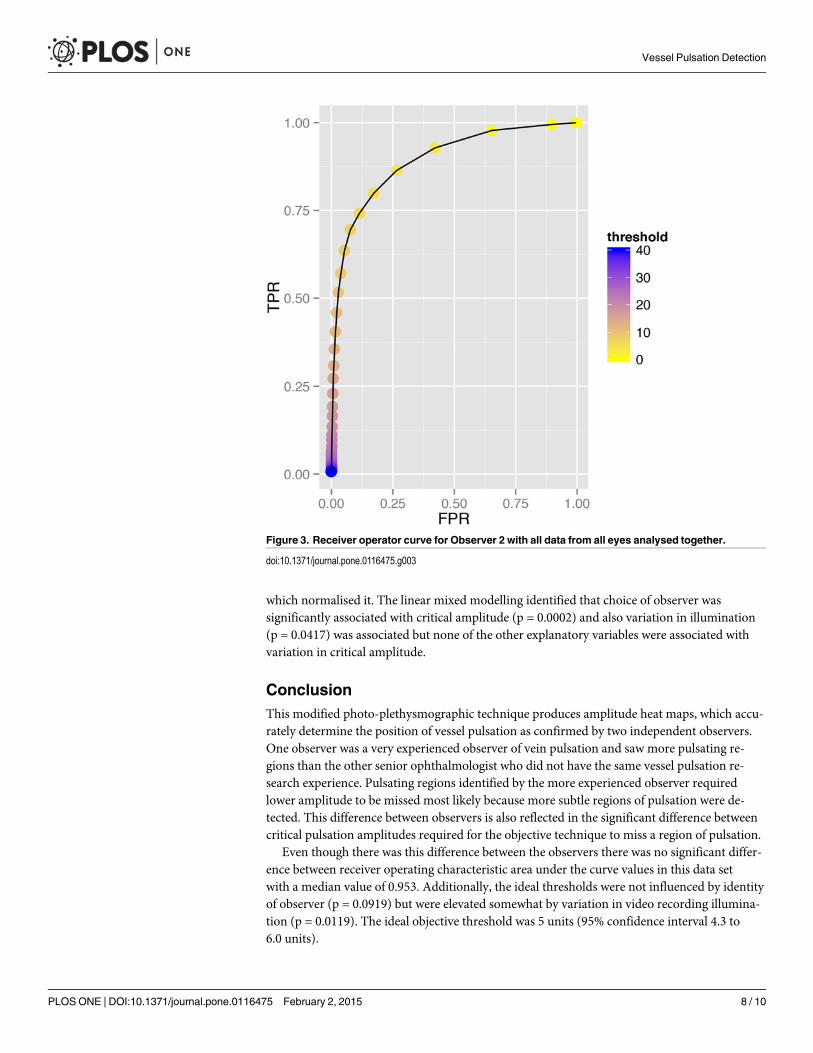
When all of the data was combined to create one large array containing all amplitude andthreshold values from the 26 image series and all of the observers’ values, the AU-ROC for Ob-server 1 was found to be 0.889 and an ideal threshold of 5.00. That for Observer 2 was 0.888,again with an ideal threshold of 5.00 (Fig. 3).
The ideal thresholds were skewed to the right so a logarithmic transform was used whichnormalised this data. The linear mixed modelling with random factors demonstrated that theexplanatory variable image standard deviation (illumination variation) was associated withvariation in ideal threshold (p = 0.0119) with increased image illumination variation associatedwith an increased threshold. The choice of observer (p = 0.0919) and age (p = 0.0503) were notsignificantly associated with ideal threshold. No other explanatory variable (image movement,ophthalmodynamometry use or sex) was significantly associated with ideal threshold either(minimum p = 0.2953). The median ideal threshold was 5 units and the 95% confidence inter-val calculated using the transformed data was 4.3 to 6.0 units.
The critical amplitude or, amplitude above which, a sector of pulsation would be missed inany participant was found to be higher from Observer 2 (18.9, sd 6.9) compared to Observer 1(12.6, sd 5.4), p = 0.0002. The data was skewed to the right so a logarithmic transform was used
Table 1. Average values of key parameters for each eye: AU-ROC = area under the receiver operator characteristic curve, Ideal Thresh = idealthreshold, Illum sd = image illumination variation and Tot Movt = maximum frame movement during video of three cardiac cycles.
Eye Age Side AU-ROC Ideal Thresh Critical Amplitude Illum sd Tot Movt
1 30 r 0.954 4.5 18.0 1.4 63.3
2 30 l 0.986 7 16.0 1.3 73.5
3 26 r 0.853 8 13.9 2.1 40.3
4 26 l 0.894 6 12.0 2.2 74.3
5 23 r 0.949 4.5 13.1 0.8 41.4
6 23 l 0.966 4 12.0 0.7 32.7
7 29 l 0.964 3 12.4 0.5 32.0
8 29 r 0.938 5 15.8 1.0 44.7
9 48 l 0.898 4 10.7 0.9 22.4
10 81 l 0.918 2 7.1 2.0 50.0
11 25 r 0.922 5.5 19.8 0.8 51.7
12 73 r 0.964 2.5 11.6 1.4 39.7
13 78 l 0.979 5 22.7 1.4 26.9
14 40 l 0.984 3.5 9.4 0.6 30.2
15 67 r 0.952 10 26.8 2.5 41.0
16 69 r 0.978 4 9.1 1.7 82.8
17 65 r 0.939 6 15.0 2.1 115.3
18 65 l 0.960 5 23.6 2.9 181.2
19 59 r 0.950 6 11.0 1.5 82.8
20 59 l 0.940 8.5 25.0 3.0 45.2
21 25 l 0.916 6.5 16.4 2.0 66.2
22 70 l 0.883 9.5 16.3 3.5 71.9
23 65 r 0.976 4 15.3 0.8 26.4
24 72 r 0.987 8.5 22.3 3.4 117.6
25 72 l 0.962 6 13.5 1.5 77.0
26 48 r 0.909 4 16.7 1.0 55.6
doi:10.1371/journal.pone.0116475.t001
Vessel Pulsation Detection
PLOS ONE | DOI:10.1371/journal.pone.0116475 February 2, 2015 7 / 10
which normalised it. The linear mixed modelling identified that choice of observer wassignificantly associated with critical amplitude (p = 0.0002) and also variation in illumination(p = 0.0417) was associated but none of the other explanatory variables were associated withvariation in critical amplitude.
ConclusionThis modified photo-plethysmographic technique produces amplitude heat maps, which accu-rately determine the position of vessel pulsation as confirmed by two independent observers.One observer was a very experienced observer of vein pulsation and saw more pulsating re-gions than the other senior ophthalmologist who did not have the same vessel pulsation re-search experience. Pulsating regions identified by the more experienced observer requiredlower amplitude to be missed most likely because more subtle regions of pulsation were de-tected. This difference between observers is also reflected in the significant difference betweencritical pulsation amplitudes required for the objective technique to miss a region of pulsation.
Even though there was this difference between the observers there was no significant differ-ence between receiver operating characteristic area under the curve values in this data setwith a median value of 0.953. Additionally, the ideal thresholds were not influenced by identityof observer (p = 0.0919) but were elevated somewhat by variation in video recording illumina-tion (p = 0.0119). The ideal objective threshold was 5 units (95% confidence interval 4.3 to6.0 units).
Figure 3. Receiver operator curve for Observer 2 with all data from all eyes analysed together.
doi:10.1371/journal.pone.0116475.g003
Vessel Pulsation Detection
PLOS ONE | DOI:10.1371/journal.pone.0116475 February 2, 2015 8 / 10
When each observer’s findings from 26 eyes were compiled together the AU-ROC was alsoalmost identical (0.88 versus 0.89). They were less than the median of the individual AU-ROCvalues probably because of variations in image illumination and other factors between the 26recordings.
The high AU-ROC indicates a high accuracy in detecting the location of pulsating regions.Further, the objective technique is robust because the ideal threshold was significantly lowerthan any of the critical thresholds. Using the ideal threshold of 5 units resulted in no pulsatingregions identified by either observer being missed by the objective technique.
These results demonstrate that this technique can accurately identify the presence and loca-tion of retinal vessel pulsation from cardiac cycle timed video recordings. The high AU-ROCsuggests that the pulsation amplitude calculated is indicating a useful measure of vessel pulsati-lity. This objective technique may be useful in settings where detection of retinal vein pulsationhas clinical utility, such as in the exclusion of elevated intracranial pressure[23], providing ad-ditional information concerning retinal vein occlusion[5] and prognostication in glaucoma.[9]One limitation of this work is that we studied normal volunteers, so any differences in patientswith ophthalmic or neurological disorders remains to be seen. The pulse transit time betweenthe heart and finger, where the pulse oximeter is located, can vary by a mean 38ms over 60secdue to blood pressure and other changes.[24] This is equivalent to the timing error of oneframe in a video sequence. This appears acceptable and in fact the error is likely to be less thanthis given that we record for approximately 3 seconds. This variation may reduce the accuracyof the calculated amplitude. Variation in illumination intensity probably also alters the accura-cy of calculated amplitude. These results relate principally to the detection of retinal venouspulsation. The arterial pulsation detected in one subject is encouraging but does not demon-strate that this technique can reliably detect arterial pulsation.
The amplitude values themselves are likely to be more useful than a global singular thresh-old measure gained by ophthalmodynamometry. They may also change during the course ofdisease. The amplitude heat maps do give an accurate spatial impression of location and degreeof pulsation. Individual amplitude values as well as heat maps may be useful in monitoringprogress of the above-mentioned disorders.
Author ContributionsConceived and designed the experiments: WHMAA-R D-YY MLH BB-S CRPL. Performedthe experiments: WHMAA-R. Analyzed the data: WHMAA-R D-YYMLH BB-S. Contributedreagents/materials/analysis tools: WHM AA-R D-YY MLH BB-S CRPL. Wrote the paper:WHMAA-R D-YY MLH BB-S CRPL.
References1. Coccius A (1853) Ueber Die Anwendung des Augen-Spiegels Nebst Angabe Eines Neuen Instru-
mentes. Leipzig: Verlag Von Immanuel Muller.
2. Gibbs FA (1936) Relationship between the pressure in the veins on the nerve head and the cerebrospi-nal fluid pressure. Arch Neurol Psychiatry 35: 292–295. doi: 10.1001/archneurpsyc.1936.02260020086006
3. Firsching R, Schutze M, Motschmann M, Behrens-BaumannW, Meyer-Schwickerath R (1998) Non-invasive measurement of intracranial pressure. Lancet 351: 523–524. doi: 10.1016/S0140-6736(05)78717-1 PMID: 9482475
4. Beaumont PE, Kang HK (1994) Ophthalmodynamometry and corticosteroids in central retinal vein oc-clusion. Aust N Z J Ophthalmol 22: 271–274. doi: 10.1111/j.1442-9071.1994.tb00796.x PMID:7727106
5. Jonas JB, Harder B (2007) Ophthalmodynamometric differences between ischemic vs nonischemic ret-inal vein occlusion. Am J Ophthalmol 143: 112–116. doi: 10.1016/j.ajo.2006.09.019 PMID: 17101111
Vessel Pulsation Detection
PLOS ONE | DOI:10.1371/journal.pone.0116475 February 2, 2015 9 / 10

6. MorganWH, Hazelton ML, Azar SL, House PH, Yu DY, et al. (2004) Retinal Venous Pulsation in Glau-coma and Glaucoma Suspects. Ophthalmology 111: 1489–1494. doi: 10.1016/j.ophtha.2003.12.053PMID: 15288976
7. Legler U, Jonas JB (2009) Frequency of spontaneous pulsations of the central retinal vein in glaucoma.J Glaucoma 18: 210–212. doi: 10.1097/IJG.0b013e318182edd2 PMID: 19295374
8. Stodtmeister R (2008) [The pulsation and the pressure of the central retinal vein and their relation toglaucoma damage and therapy]. Klin Monbl Augenheilkd 225: 632–636. doi: 10.1055/s-2008-1027233PMID: 18642206
9. Balaratnasingam C, MorganWH, Hazelton ML, House PH, Barry CJ, et al. (2007) Value of retinal veinpulsation characteristics in predicting increased optic disc excavation. Br J Ophthalmol 91: 441–444.doi: 10.1136/bjo.2006.105338 PMID: 17035270
10. Popovic DK, Lee S (2009) Noninvasive Monitoring of Intracranial Pressure. Recent Patents on Biomed-ical Engineering 2: 165–179. doi: 10.2174/1874764710902030165
11. Zou KH,Wells WM 3rd, Kikinis R, Warfield SK (2004) Three validation metrics for automated probabilis-tic image segmentation of brain tumours. Stat Med 23: 1259–1282. doi: 10.1002/sim.1723 PMID:15083482
12. Zou KH, O’Malley AJ, Mauri L (2007) Receiver-operating characteristic analysis for evaluating diagnos-tic tests and predictive models. Circulation 115: 654–657. doi: 10.1161/CIRCULATIONAHA.105.594929 PMID: 17283280
13. Seo JH, Kim TW,Weinreb RN, Kim YA, Kim M (2012) Relationship of intraocular pressure and frequen-cy of spontaneous retinal venous pulsation in primary open-angle glaucoma. Ophthalmology 119:2254–2260. doi: 10.1016/j.ophtha.2012.06.007 PMID: 22980741
14. Kim M, Lee EJ, Seo JH, Kim TW (2014) Relationship of spontaneous retinal vein pulsation with ocularcirculatory cycle. PLoS One 9: e97943. doi: 10.1371/journal.pone.0097943 PMID: 24844298
15. Golzan SM, Graham SL, Leaney J, Avolio A (2011) Dynamic association between intraocular pressureand spontaneous pulsations of retinal veins. Curr Eye Res 36: 53–59. doi: 10.3109/02713683.2010.530731 PMID: 21174598
16. MorganWH, Hazelton ML, Betz-Stablein BD, Yu D, Lind CR, et al. (2014) Photo-PlethysmographicMeasurement of Various Retinal Vascular Pulsation Parameters and Measurement of the VenousPhase Delay. Invest Ophthalmol Vis Sci. PMID: 25183767
17. Kain S, MorganWH, Yu DY (2010) New observations concerning the nature of central retinal vein pul-sation. Br J Ophthalmol 94: 854–857. doi: 10.1136/bjo.2009.169813 PMID: 19846411
18. MorganWH, Hazelton ML, Betz-Stablein BD, Yu DY, Lind CR, et al. (2014) Photoplethysmographicmeasurement of various retinal vascular pulsation parameters and measurement of the venous phasedelay. Invest Ophthalmol Vis Sci 55: 5998–6006. doi: 10.1167/iovs.14-15104 PMID: 25183767
19. R Core Development Team (2013) R: A Language and Environment for Statistical Computing. Vienna,Austria: R Foundation for Statistical Computing.
20. Zijlstra WG, Buursma A, Meeuwsen-van der Roest WP (1991) Absorption spectra of human fetal andadult oxyhemoglobin, de-oxyhemoglobin, carboxyhemoglobin, and methemoglobin. Clin Chem 37:1633–1638. PMID: 1716537
21. Pinheiro JC, Bates DM (2000) Mixed-Effects Models in S and S-PLUS. New York: Springer. 3–52 p.
22. MorganWH, Cringle SJ, Kang MH, Pandav S, Balaratnasingam C, et al. (2010) Optimizing the calibra-tion and interpretation of dynamic ocular force measurements. Graefes Arch Clin Exp Ophthalmol 248:401–407. doi: 10.1007/s00417-009-1288-y PMID: 20107829
23. Walsh TJ, Garden JW, Gallagher B (1969) Obliteration of retinal venous pulsations during elevation ofcerebrospinal-fluid pressure. Am J Ophthalmol 67: 954–956. PMID: 5785858
24. Foo JY, Wilson SJ, Dakin C, Williams G, Harris MA, et al. (2005) Variability in time delay between twomodels of pulse oximeters for deriving the photoplethysmographic signals. Physiol Meas 26: 531–544.doi: 10.1088/0967-3334/26/4/017 PMID: 15886446
Vessel Pulsation Detection
PLOS ONE | DOI:10.1371/journal.pone.0116475 February 2, 2015 10 / 10
Related Documents