J Sign Process Syst DOI 10.1007/s11265-008-0217-3 Retinal Vessel Radius Estimation and a Vessel Center Line Segmentation Method Based on Ridge Descriptors Changhua Wu · Jennifer J. Kang Derwent · Peter Stanchev Received: 20 January 2008 / Revised: 6 March 2008 / Accepted: 14 April 2008 © 2008 Springer Science + Business Media, LLC. Manufactured in The United States Abstract This paper studies the retinal vessel radius estimation and proposes a segmentation method for vessel center lines based on ridge descriptors. The study on radius estimation reveals that the radius estimation by the matched filters based on the second order deriv- atives of Gaussian kernels is only correct at the vessel center. The relation between the vessel radius and the scale of the Gaussian kernel in the estimation method based on the normalized largest curvature is also studied. The ridge descriptor proposed in this paper contains the normalized largest curvature and the orientations of gradients in the local neighborhood. For vessels of a certain scale, the distribution of the descriptors is assumed to be a normal distribution and is learned from a training set with known truth. Ves- sel center line segmentation can be then performed based on the distance between the ridge descriptor at candidate pixels and the learned model. Evalua- tion of the vessel center line segmentation based on the descriptors is done on both DRIVE and STARE databases using the receiver operating characteristic C. Wu (B ) · P. Stanchev Department of Computer Science, Kettering University, Flint, MI 48504, USA e-mail: [email protected] P. Stanchev e-mail: [email protected] J. J. Kang Derwent Department of Biomedical Engineering, Illinois Institute of Technology, 10 West 32nd Street, Chicago, IL 60616-3793, USA e-mail: [email protected] (ROC) curves. The areas under the ROC curves on DRIVE and STARE databases are 0.9584 and 0.9421 respectively. Keywords Retinal image · Ridge segmentation · Center line · Radius estimation · Scale space theory · Ridge descriptor 1 Introduction Retinal fundus assessment has been widely used by the medical community for diagnosing vascular and non-vascular pathology. Inspection of the retinal ves- sels may reveal hypertension, diabetes, arteriosclero- sis, cardiovascular disease and stroke [1]. Computer assisted image analysis of the retinal images is highly helpful in many cases. For example, the diagnosis of diabetic retinopathy, the leading cause of blindness in the West World, can be prevented with treatment at an early stage. Because of this, the World Health Organization recommends annual ocular screening, which can be greatly facilitated with the adoption of automatic tools [2]. One important task in the automated processing of retinal images is the segmentation of blood vessels. The vascular features such as radius, length, branching angle, and tortuosity have diagnostic relevance and can be used to monitor the progression of diseases [3]. For example, the vessel radius can be used to calculate the blood flow through the vessels. The change in blood flow may indicate the narrowing or growth of vessels, which is closely related to diabetes. However, accurate vessel segmentation in retinal images is difficult due to

Welcome message from author
This document is posted to help you gain knowledge. Please leave a comment to let me know what you think about it! Share it to your friends and learn new things together.
Transcript

J Sign Process SystDOI 10.1007/s11265-008-0217-3
Retinal Vessel Radius Estimation and a Vessel Center LineSegmentation Method Based on Ridge Descriptors
Changhua Wu · Jennifer J. Kang Derwent ·Peter Stanchev
Received: 20 January 2008 / Revised: 6 March 2008 / Accepted: 14 April 2008© 2008 Springer Science + Business Media, LLC. Manufactured in The United States
Abstract This paper studies the retinal vessel radiusestimation and proposes a segmentation method forvessel center lines based on ridge descriptors. The studyon radius estimation reveals that the radius estimationby the matched filters based on the second order deriv-atives of Gaussian kernels is only correct at the vesselcenter. The relation between the vessel radius and thescale of the Gaussian kernel in the estimation methodbased on the normalized largest curvature is alsostudied. The ridge descriptor proposed in this papercontains the normalized largest curvature and theorientations of gradients in the local neighborhood.For vessels of a certain scale, the distribution of thedescriptors is assumed to be a normal distribution andis learned from a training set with known truth. Ves-sel center line segmentation can be then performedbased on the distance between the ridge descriptorat candidate pixels and the learned model. Evalua-tion of the vessel center line segmentation based onthe descriptors is done on both DRIVE and STAREdatabases using the receiver operating characteristic
C. Wu (B) · P. StanchevDepartment of Computer Science,Kettering University, Flint, MI 48504, USAe-mail: [email protected]
P. Stancheve-mail: [email protected]
J. J. Kang DerwentDepartment of Biomedical Engineering,Illinois Institute of Technology,10 West 32nd Street, Chicago,IL 60616-3793, USAe-mail: [email protected]
(ROC) curves. The areas under the ROC curves onDRIVE and STARE databases are 0.9584 and 0.9421respectively.
Keywords Retinal image · Ridge segmentation ·Center line · Radius estimation · Scale space theory ·Ridge descriptor
1 Introduction
Retinal fundus assessment has been widely used bythe medical community for diagnosing vascular andnon-vascular pathology. Inspection of the retinal ves-sels may reveal hypertension, diabetes, arteriosclero-sis, cardiovascular disease and stroke [1]. Computerassisted image analysis of the retinal images is highlyhelpful in many cases. For example, the diagnosisof diabetic retinopathy, the leading cause of blindnessin the West World, can be prevented with treatmentat an early stage. Because of this, the World HealthOrganization recommends annual ocular screening,which can be greatly facilitated with the adoption ofautomatic tools [2].
One important task in the automated processing ofretinal images is the segmentation of blood vessels.The vascular features such as radius, length, branchingangle, and tortuosity have diagnostic relevance and canbe used to monitor the progression of diseases [3]. Forexample, the vessel radius can be used to calculate theblood flow through the vessels. The change in bloodflow may indicate the narrowing or growth of vessels,which is closely related to diabetes. However, accuratevessel segmentation in retinal images is difficult due to

C. Wu et al.
several reasons: the presence of noise, the low contrastbetween vessels and background, variation of vesselradius, brightness, and shape. The presence of lesion,exudates, and other pathological effects may createlarge abnormal regions, which add to the difficulty ofvessel segmentation.
Previous methods for vessel segmentation in reti-nal images can be generally divided into two groups[4]. The first group consists of rule-based methods,including vessel tracking [5–8], matched filter responses[9–12], grouping of edge pixels [13], model-based lo-cally adaptive threshold [14], model-fitting [15], topol-ogy adaptive snakes [16], probabilistic filtering [17],morphology-based techniques [3, 18, 19] and Hessianeigenvalue-based multi-scale filters [20, 21]. The secondgroup consists of supervised methods, which requirestraining on manually labeled images, such as the neuralnetwork scheme for pixel classification [22] and theridge based segmentation approach by Staal [4].
The segmentation of vessels can be represented intwo ways. One way is to mark out all vessel pixels.The other way is to find the vessel center lines andthe radius at each pixel of the center lines. In theexisting work, a couple of ways for estimating the vesselradius have been proposed. The most obvious way isto measure the distance between the parallel boundaryedges of a vessel. However, the accurate localizationof edges is not easy given the low contrast and noise.Methods based on the intensity profile of the crosssection other than the edges have been proposed. InChaudhuri et al. [10], the vessel radius is estimated fromthe standard deviation of the Gaussian kernel matchedto the vessel profile. In Frangi et al. [20] and Li [21], thevessel radius is estimated from the deviation σ of thesmoothing Gaussian kernel that produces the largestσ -normalized maximum second order derivative overmultiple scales. In Gang et al. [11], the second orderderivatives of multiple Gaussian kernels are used toconvolve with the image, and the vessel radius is esti-mated from the deviation of the Gaussian kernel thatproduces the maximum adjusted convolution response.Much of the literature on vessel radius estimation onlydiscusses the relation between the vessel radius andthe deviations of Gaussian kernels at the vessel center,while the relation between them at the points awayfrom the center line are not adequately examined.
This paper focuses on the vessel radius estimationand the segmentation of the vessel center lines. Thepaper examines the relation between the vessel radiusand the deviations of the Gaussian kernels in two pop-ular vessel radius estimation methods, and proposes anapproach for segmenting the vessel center lines basedon ridge descriptors. This paper is organized as follows.
Section 2 discusses in detail the responses of two com-monly used functions in the estimation of vessel radiusat pixels away from the vessel center lines and therelation between the deviation of the Gaussian kernelthat produces the largest response and the vessel radius.Section 3 proposes a novel descriptor for vessel centerlines. Section 5 presents an approach to segment thevessel center lines based on the distributions of ridgedescriptors learned from a given training set. Section 6discusses the experiment results and evaluates the per-formance of the proposed method. Section 7 concludesthis paper and discusses the future work.
2 Responses of Two Commonly Used Vessel RadiusEstimate Approaches
In the estimation of vessel radius, response functionsbased on multiple-scale convolution with the secondorder Gaussian functions and the normalized curva-tures are widely used. In this section, the responsefunctions of the two approaches are discussed in detail.The purpose is to have a thorough understanding ofthe responses not only at the vessel centers but also atpixels away from the centers.
The two response functions to be discussed are allbased on the inverted green channel and the assump-tion that the cross-section profile of a vessel in thegreen channel is Gaussian after intensity inversion andthat the deviation of the Gaussian profile is assumedto be equal to the vessel radius. Section 2.1 discussesthe response of the convolution with the second or-der Gaussian derivative in the multiple-scale matchedfilters [11, 12] and Section 2.2 discusses the responseof the normalized largest curvature commonly used inthe filters based on the eigenvalues of Hessian matrix[20, 21].
2.1 Response of Convolution with the Second OrderGaussian Derivative
In the multiple scale matched filters [11, 12], retinalimages are convoluted with an adjusted second-orderderivative of a Gaussian function:
f (x) = 1√2πσ t
(x2 − σ 2) e− x2
2σ2 (1)
where t is for adjusting the power of the deviation σ .The convolution, in other words, the response at thecenter of a vessel with radius equal to w is [11]:
h(t) =∫ ∞
−∞1√
2πσ t
(x2 − δ2
)e
−x2(w2+σ2)2w2σ2 dx (2)

Vessel radius estimation and center line segmentation
The value of t affects the relation between σ and w. Forsome values of t, the convolution hits maximum at aparticular scale and the relation between the σ of thatscale and the vessel radius can be determined. Moreparticularly, when t = 3.5, h(t) will hit maximum whenσ = w [11]. Therefore, we can have an estimate of theradius of a vessel by convolving it with the adjustedsecond order derivatives of Gaussian functions at mul-tiple scales and looking for the scale that produces themaximum response.
In the following part of this section, the relationbetween σ and w is further explored at pixels awayfrom the center. Consider a point p whose distancefrom the vessel center is α, if we use p as the origin,the cross profile of a vessel can be described by ashifted Gaussian signal (without loss of generality, theamplitude is assumed to be 1):
g(x) = e− (x−α)2
2w2 (3)
The convolution of g(x) and f (x) becomes
F(x) = 1√2πσ t
∫ ∞
−∞e− (τ−α)2
2w2((x − τ)2 − σ 2
)e− (x−τ )2
2σ2 dτ (4)
The above equation shows the responses at all positionsin the cross section of a vessel. The response at p isF(0):
F(0) = 1√2πσ t
∫ ∞
−∞
(τ 2 − σ 2
)e−
((τ−α)2
2w2 + τ2
2σ2
)
dτ (5)
= e− α2(1−σ2)
2w2
σ t(σ 2 + w2)3/2
{−σ 5w + σ 5wα2}
(6)
When considering the response at the center of a vessel,α = 0, then
F(0)α=0 = −σ 5−tw
(σ 2 + w2)3/2(7)
F(0)α=0 will have a peak. The σ that produces themaximum response is dependent on t. When t = 3.5, w
is equal to σ and the response at p can be expressed by
F(0)t=3.5 = e− α2(1−σ2)2w2
σ 1.5(α2 − 1
)
(σ 2 + w2)
√(σw
)2 + 1(8)
Unfortunately, F(0)t=3.5 does not have a maximum overσ , which means that the radius estimation of vessels isonly accurate at the vessel centers. Figure 1 shows two
Figure 1 Sample renderingof F(0)t=3.5. The first row isthe 3D rendering, where xaxis is the vessel radius w, they axis is σ and z axis is theresponse F(0)t=3.5. a α isequal to 0.5. b α is equalto 2. The second row is 2Ddrawing when particular α
and w are fixed. c α is 0.5and w is 3. d α is 2 and w is 5.
(a)
(c) (d)
(b)
Plot of F(0)
Th
e re
spo
nse
-1
-0.8
-0.6
-0.4
-0.2
0
Deviation of Gaussian kernel0 2 4 6 8 10 12 14 16
Plot of F(0)
Th
e re
spo
nse
0
200
400
600
800
1,000
Deviation of Gaussian kernel0 6 1082 4

C. Wu et al.
sample surfaces of F(0)t=3.5 when α is fixed and twocurves of F(0)t=3.5 when α and w are fixed.
The fact that only the response at the vessel centerhas peak indicates a challenge in estimating the vesselradius using the multiple-scale matched filters. Theerror in detecting vessel center lines may lead to wrongor inaccurate estimates.
2.2 Response of Normalized Maximum PrincipalCurvature
The filters proposed in Frangi et al. [20] and Li [21]use the eigenvalues of the Hessian matrix, which is thesecond order derivative in the Taylor expansion:
I(x0 + δx0) = I(x0) + δxT0 �0 +δxT
0 H0δx0 (9)
where δx0 is a small vector at x0, �0 is the gradient atx0, and H0 is the Hessian matrix at x0. H0 is defined as
H0 =[
Ixx(x0) Ixy(x0)
Iyx(x0) Iyy(x0)
](10)
The Hessian matrix H0 captures the second order pro-file at x0 and its eigenvalues are actually the two prin-cipal curvatures at x0 [20]. In the multiple scale filtersbased on Hessian matrix, the response is generallydepending on the magnitude of the largest absoluteeigenvalue of the Hessian matrix. For example, let|λ1| � |λ2| be the two normalized eigenvalues of theHessian matrix at scale s. The response proposed byLi [21] for two dimensional vessels is simply defined as
ψs(x) ={ |λ2| − |λ1| if λ2 < 0
0 otherwise(11)
The reason for condition λ2 < 0 is that the second orderderivative of Gaussian function is negative between −σ
and +σ . The final response is the maximum of theresponses on multiple scales T :
Ψ (x) = max{ψs(x) | s ∈ T } (12)
At each scale, the Hessian matrix is computed aftersmoothing the image with a Gaussian kernel. The scales that produces the maxima indicates the vessel radius.That is to say that there is a relation between thevessel radius and the deviation σ of the smoothingGaussian kernel used at scale s. The normalization ofthe eigenvalues is simply to multiply the eigenvaluesby σ 2.
The following part of this section will be dedicated tothe discussion of the relation between σ and the vessel
radius w at any given point of a vessel. As we know,the convolution of two Gaussian signals produces anew Gaussian signal. Therefore, if we assume the vesselprofile is Gaussian as shown in Eq. 3, then the vesselprofile after the convolution is
f (x) = 1√
2π(w2 + σ 2
)e− x2
2(w2+σ2) (13)
The curvature along the cross section of a vessel is thesecond order derivative of f (x):
f ′′(x) = x2 − (σ 2 + w2
)
√2π
√σ 2 + w25 e
− x2
2(σ2+w2) (14)
According to Linberg’s scale space theory [23], theeigenvalue of the Hessian matrix is normalized by σ 2.Then the output of the filters based on the Hessian-eigenvalue is dependent on the following response R:
R(σ, x) = σ 2 f ′′(x) = σ 2(x2 − (
σ 2 + w2))
√2π
√σ 2 + w25 e− x2
2(σ2+w2)
(15)
A interesting property of R is that for any value of x,R has a maximum value over σ , which means there isa particular σ that produces the maximum response atpoint x, see Fig. 2.
Figure 2 Sample rendering of R at a point 2 pixels away from thevessel center. x axis shows the σ , y axis shows the vessel radius,and z axis shows the value of R.

Vessel radius estimation and center line segmentation
Let σ 2 + w2 = t2, R(σ, x) can be rewritten as
R(t, x) =(t2 − w2
) (x2 − t2
)
√2π t5
e− x2
2t2 (16)
= 1√2π
{(x2 + w2
t3− 1
t− w2x2
t5
)e− x2
2t2
}(17)
The t that produces the maximal R(t, x) can be found atthe zero-crossing of the first order derivative:
d(R(t, x))
dt= 0 (18)
Let A = (x2 + w2
)t−3 − t−1 − w2x2t−5, we have
d(R(t, x))
dt= 1√
2π
(A′
te− x2
2t2 + Ax2t−3e− x2
2t2
)(19)
Therefore, Eq. 18 is equivalent to
A′t + Ax2t−3 = 0 (20)
and
A′t = −3
(x2 + w2
)t−4 + t−2 + 5w2x2t−6 (21)
Plug A′t and A into Eq. 20, and rearrange it, we get
the following equation:
t6 − (4x2 + 3w2
)t4 + (
6w2x2 + x4)
t2 − x4w2 = 0 (22)
This is a cubic polynomial equation, whose solu-tion is complicated and dependent on the value ofw and x. However, for any particular w and x,the equation can be solved using Cardano’s method(http://en.wikipedia.org/wiki/cubic_equation). The fol-lowing two special cases have quite simple solutions.
– When x = 0, we have t6 − 3w2t4 = 0. The solutionis t = √
3w. Since t2 = σ 2 + w2, we have σ = √2w,
which means at the vessel center lines, the scale thatuses a Gaussian kernel of deviation equal to
√2w
produces the largest response.– When x = w, we have t6 − 7w2t4 + 7w4t2 − w6 =
0. This equation has three roots, but only oneroot has practical meaning. The valid root ist =
√3 + 2
√2w. Therefore, the deviation of the
Gaussian kernel that produces the largest responseis
√2 + 2
√2w.
According to Cardano’s method (http://en.wikipedia.org/wiki/cubic_equation), the solution for t2 at pointsbetween the boundary and the center should be a poly-nomial function of x and w. For a particular vessel, w isa fixed, therefore solution for t2 is a polynomial function
0 0.5 1 1.5 2 2.5 3 3.5 4 4.5 51.4
1.5
1.6
1.7
1.8
1.9
2
2.1
2.2
The distance from the vessel center
The
rat
io b
etw
een
the
Gau
ssia
n de
viat
ion
and
vess
el r
adiu
s
Figure 3 The ratio between the σ that produces the maximumresponse and the vessel radius w at points whose distances fromthe center are 0, 1, 2, 3, 4 and 5 pixels. The vessel radius is5 pixels. The curve in this figure suggests that ratio is monotoni-cally increasing.
of x only. Figure 3 shows the ratio σ/w at differentvalues of x when w is equal to 5. It suggests that σ/w
is monotonically increasing with respect to x. If so, thenthe σ that produces the maximum response at any pointbetween the center and the boundary is in the range(√
2w√
2 + 2√
2w).
3 Ridge Descriptors
In this section, a new vessel segmentation approachbased on scale-space ridge descriptors is proposed.Ridges are defined as points where an image has anextremum in the direction of the largest surface cur-vature. In retinal images on which experiments of thispaper are conducted on, the center lines of vessels areactually overlapping with minima ridges due to the factthe vessel center has the lowest intensity in the crosssection of a vessel (though some large arteriolar vesselshave center reflection resulting in higher intensity inthe center, center reflex can be smoothed out by largeGaussian kernels.)
From now on, minima ridges are simply referred toas ridges. The descriptor includes both the gradientorientations (Fig. 6) and the adjusted maximum eigen-value of the Hessian matrix. The gradients are com-puted within an adaptive local window whose size isdependent on the vessel radius. Therefore the first stepis to estimate the radius of vessels, which is obtained

C. Wu et al.
using the adjusted maximum eigenvalue of Hessianmatrix, defined in Eq. 15. Let σ be the deviation ofthe Gaussian kernel that produces the largest response,then the radius of the vessel is
√2σ according to the
discussion in the previous section. The reason that theHessian-based approach is chosen is that the responseR has a peak value at any position away from the vesselcenter while the response in the multiscale matchedfilters does not. Since the radius of most vessels in theimages in both DRIVE and STARE database is lessthan 6 pixels, we set the σ of the Gaussian kernels atscales from 0.5 to 6 with an interval of 0.5 to achievesubpixel accuracy. The scale selection should be depen-dent on the resolution of the images.
Let r be the estimated radius of a vessel, p be a pixelof a ridge, and v be the unit vector along the ridge. Thelocal patch around p is first smoothed by a Gaussiankernel with deviation σ = √
2/2r for suppressing noise,then it is rotated so that the ridge is in horizontaldirection. The rotation angle is simply the angle be-tween v and the horizontal direction. After the rotation,the local patch is re-sampled at an interval of 0.20rin both the horizontal and vertical directions. Linearinterpolation is used when the sampling point falls inbetween pixels. The re-sampling produces a 11 × 21grid, shown in Fig. 4. The grid captures the local profileof vessels and is irrelevant to the vessel directions andscales. Therefore, it improves the accuracy of gradientcomputation especially for the small vessels.
The scale-space ridge descriptor is a 19 dimensionvector. The first 9 elements record the orientations ofgradients starting at column 3 and every other columnin the second row of the grid. Similarly, the second9 elements record the orientations of the gradients inthe second row from the bottom of the grid. The lastelement records the maximum response of the adjustedlargest eigenvalue of the Hessian matrix.
Figure 4 The grid for sampling the vessel profile.
4 The Training of Models Based on Ridge Descriptors
With the ridge descriptors, we can built a set of distribu-tion models of the ridge descriptors and use the modelsfor segmenting vessel center lines. Assuming that thedistribution of the ridge descriptors at the center linesfor vessels of each particular radius is normal. Thenthe mean and the covariance of the distribution can belearned from the manual vessel segmentation providedin the training set of DRIVE database.
In order to build the distribution model of the ridgedescriptors of the vessel center lines using the trainingset, the vessel center lines should be found first. Thevessel center lines can be found by the checking thecommon pixels between the manual segmentation andthe ridges. The ridge detection method used in this pa-per is described in Kalitzin [24]. As has been discussedearlier, ridges are defined as points where an imageI(x) has an extremum in the direction of the largestcurvature. In other words, ridges are points in the imagewhere the first order derivative in the direction of thelargest curvature changes sign. The direction of thelargest curvature is the eigenvector corresponding tothe largest eigenvalue λ of the Hessian matrix H andthe largest eigenvalue is the largest curvature. The signof λ indicates whether a local minima (λ > 0) or a localmaxima (λ < 0) is found. To improve the accuracy,derivatives are computed after convolving the imagewith a Gaussian kernel of deviation σ . Convolving theimage with Gaussian kernels of various σ can be used tofind the ridge of multiple scales according to the scale-space theory [23]. After computing the gradients andthe eigenvalues of Hessian matrices, for each pixel x, ascalar ρ(x, σ ) can be computed as follows
ρ(x, σ ) = −1
2sign(λ)|sign(�I(x + εv, σ ) · v)
−sign(�I(x − εv, σ ) · v)| (23)
where � is a gradient operator and v is the unit-vectorin the direction of the largest curvature. Parameter ε
controls the spacial accuracy of the point set to bedetected. In the continuous case, ε can be infinitelysmall. Since images are discrete, the natural choicefor ε is 1. When x + εv falls in between pixels, linearinterpolation is used to get the gradient. All the imageprocessing discussed in this paper is on the green chan-nel of the color retinal images, since the contrast in thegreen channel is larger than that in the red and bluechannels. Figure 5 shows the green channel of a retinalimage and the ridges detected when σ = 1.
For each pixel p in the ridge, the vessel radius at pis estimated by finding the deviation of the Gaussian

Vessel radius estimation and center line segmentation
Figure 5 a The greenchannel of a fundus image.The radius of the FOV is 540pixels. b The local minimalridges of a, σ = 1.0 pixel. Dueto noise, some pixels in thecenter of the image aredetected as ridge pixels. Asubset of the ridges coincidewith the vessels center lines.
(a) (b)
kernel that produces the largest response as defined inEq. 15. Then the ridge descriptor at p is computed. LetDr be the set of all descriptors for ridge pixels wherethe vessel radius is equal to r. Then the centroid of themodel for vessels whose radius is r is the mean vectorof Dr and the covariance matrix of vectors in Dr is usedas the covariance matrix of the model. In this way, wehave built statistical models for vessels of all radius.
5 Model-Based Vessel Center Segmentation
As we can see from the training stage, the models webuilt is best suitable for segmenting the pixels nearthe center lines. We assume that with center linessegmented and radius estimated, it would be relativelyeasy to find all vessel pixels quite accurately. In thesegmentation stage, the image is smoothed by Gaussiankernels of multiple scales and the response R is com-puted at each scale. If the maximum R at a pixel is posi-tive, then this pixel becomes a candidate of ridge pixels(in retinal images, vessels are darker than background).
For each ridge pixel candidate, the ridge descriptoris computed in the same way as in the training process.Let d be the descriptor computed at pixel p and r is theestimated vessel radius at p. Then we can compare dwith the corresponding model. There are two ways toevaluate the fitness between a descriptor and a givenmodel. One way is computing the density d given themodel. Due to the fact that smaller vessels are usuallymore subject to noise, the distribution of descriptorsof small vessels are less concentrated than that of thedescriptors of larger vessels. So the density would bebiased in favor of the larger vessels. To eliminate this
bias, we compute the following value for each candidategiven its ridge descriptor d:
v = (d − μr) ∗∑−1
r∗(d − μr)
′ (24)
where μr and �r are the centroid and the covariancematrix of the model for vessels of radius equal to r.The magnitude of v indicates how far the descriptorat the current pixel is from the centroid μr. Larger v
means the current pixel is more unlikely to be a pixelon a vessel center line, vice versa. Thresholding on v
will provide a segmentation of the vessel center lines.For a given threshold t, all candidates whose v valuesare smaller than t can be marked as vessel center linepixels. According to the way the ridge descriptors arecomputed, if the vessel radius is r, then the vessel radiuson the smoothed local patch would be (1 + √
2/2)r.Since the gradients of the local descriptor are computed
y
x
+r
r
Figure 6 The gradient model of 2D vessels. The magnitude of thegradients increases from the center of the vessel to the boundary.

C. Wu et al.
Figure 7 The samplesegmentation results of twoimages in the test set ofDRIVE database. The retinalimages are shown in the firstcolumn (a, e). The secondcolumn is the manualsegmentation (b, f). Thesegmentation using threshold10 is shown in the thirdcolumn (c, g). The lastcolumn shows the resultsafter removing some smallconnected components (d, h).
(a) (b) (c) (d)
(e) (f) (g) (h)
at location of distance 0.8r from the sampling gridcenter, not only pixels on the vessel center lines butalso the pixels whose distance from the center lines isno more than (1 + √
2/2)r − 0.8r ≈ 0.58r are expectedto have descriptors resulting low v values, therefore
being segmented as center line pixels. After removingsmall connected components, the final result of vesselcenter lines are detected by finding the common pixelsin the segmentation and the detected ridge pixels usingmethod in Section 4 (Fig. 6).
Figure 8 The segmentationresults using the modeltrained on the training set ofthe DRIVE database. a ROCcurve of the segmented vesselcenter lines on the DRIVEtest set. The area under ROCcurve is 0.9584. b Thepercentage of the center linesof small vessels segmented ateach threshold level in theDRIVE database. c ROCcurves on the STAREdatabase. The area under theROC curve is 0.9421. d Thepercentage of the center linesof small vessels segmented inthe STARE dataset.
0 0.1 0.2 0.3 0.4 0.5 0.6 0.7 0.8 0.9 10.1
0.2
0.3
0.4
0.5
0.6
0.7
0.8
0.9
1
Fraction of False Positives
Fra
ctio
n of
Tru
e P
ositi
ves
ROC curve of filtered result
0 20 40 60 80 100 1200
0.1
0.2
0.3
0.4
0.5
0.6
0.7
0.8
0.9
1
The threshold levelsThe
per
cent
age
of s
mal
l ves
sel r
idge
s se
gmen
ted
(a) (b)
0 0.1 0.2 0.3 0.4 0.5 0.6 0.7 0.8 0.9 10.2
0.3
0.4
0.5
0.6
0.7
0.8
0.9
1
Fraction of False Positives
Fra
ctio
n of
Tru
e P
ositi
ves
ROC curve of filtered result
0 20 40 60 80 100 1200.2
0.3
0.4
0.5
0.6
0.7
0.8
0.9
1
(c) (d)
Vessel radius estimation and center line segmentation
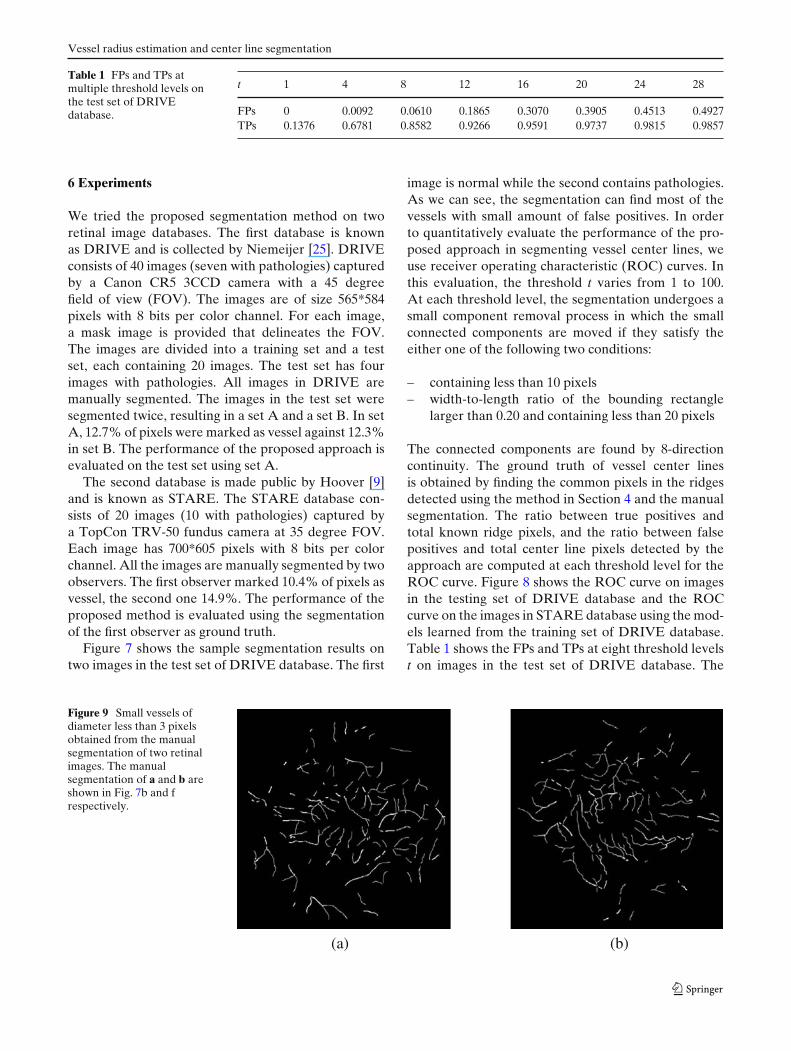
Table 1 FPs and TPs atmultiple threshold levels onthe test set of DRIVEdatabase.
t 1 4 8 12 16 20 24 28
FPs 0 0.0092 0.0610 0.1865 0.3070 0.3905 0.4513 0.4927TPs 0.1376 0.6781 0.8582 0.9266 0.9591 0.9737 0.9815 0.9857
6 Experiments
We tried the proposed segmentation method on tworetinal image databases. The first database is knownas DRIVE and is collected by Niemeijer [25]. DRIVEconsists of 40 images (seven with pathologies) capturedby a Canon CR5 3CCD camera with a 45 degreefield of view (FOV). The images are of size 565*584pixels with 8 bits per color channel. For each image,a mask image is provided that delineates the FOV.The images are divided into a training set and a testset, each containing 20 images. The test set has fourimages with pathologies. All images in DRIVE aremanually segmented. The images in the test set weresegmented twice, resulting in a set A and a set B. In setA, 12.7% of pixels were marked as vessel against 12.3%in set B. The performance of the proposed approach isevaluated on the test set using set A.
The second database is made public by Hoover [9]and is known as STARE. The STARE database con-sists of 20 images (10 with pathologies) captured bya TopCon TRV-50 fundus camera at 35 degree FOV.Each image has 700*605 pixels with 8 bits per colorchannel. All the images are manually segmented by twoobservers. The first observer marked 10.4% of pixels asvessel, the second one 14.9%. The performance of theproposed method is evaluated using the segmentationof the first observer as ground truth.
Figure 7 shows the sample segmentation results ontwo images in the test set of DRIVE database. The first
image is normal while the second contains pathologies.As we can see, the segmentation can find most of thevessels with small amount of false positives. In orderto quantitatively evaluate the performance of the pro-posed approach in segmenting vessel center lines, weuse receiver operating characteristic (ROC) curves. Inthis evaluation, the threshold t varies from 1 to 100.At each threshold level, the segmentation undergoes asmall component removal process in which the smallconnected components are moved if they satisfy theeither one of the following two conditions:
– containing less than 10 pixels– width-to-length ratio of the bounding rectangle
larger than 0.20 and containing less than 20 pixels
The connected components are found by 8-directioncontinuity. The ground truth of vessel center linesis obtained by finding the common pixels in the ridgesdetected using the method in Section 4 and the manualsegmentation. The ratio between true positives andtotal known ridge pixels, and the ratio between falsepositives and total center line pixels detected by theapproach are computed at each threshold level for theROC curve. Figure 8 shows the ROC curve on imagesin the testing set of DRIVE database and the ROCcurve on the images in STARE database using the mod-els learned from the training set of DRIVE database.Table 1 shows the FPs and TPs at eight threshold levelst on images in the test set of DRIVE database. The
Figure 9 Small vessels ofdiameter less than 3 pixelsobtained from the manualsegmentation of two retinalimages. The manualsegmentation of a and b areshown in Fig. 7b and frespectively.
(a) (b)

C. Wu et al.
areas under the ROC curves on DRIVE and STAREdatabases are 0.95848 and 0.9421 respectively.
To evaluate the performance of the proposed ap-proach in segmenting the center lines of small vessels,for each given manual segmentation in the test set ofDRIVE database and the manual segmentation in theSTARE database, a binary image that contains thevessels of diameter less than 3 pixels is created throughmorphological operation. Figure 9 shows two sampleimages of small vessels. The percentage of small vesselcenter lines segmented at each threshold level is shownin Fig. 8(b) and (d).
The proposed method is programmed using Matlaband experiments discussed above are carried on a HPa1710n desktop with two AMD64 processor at 2.2 Ghzand 3 GB memory. It takes 895 s to build the ridgedescriptor models on the 20 images in the training setof the DRIVE database and 3360 s to compute thev defined in Eq. 24 for all ridge candidates in the 20images of the testing set of the DRIVE database. Thetime cost increases quickly with the increased numberof scales and the size of the smoothing Gaussian kernelat each scale.
7 Conclusion and Future Work
In this paper, the responses of two vessel radius estima-tion approaches at any point in the cross section of avessel is studied. The study reveals that the responseof the convolution with the adjusted second orderGaussian derivative does not have maxima except atthe vessel center, and that the response of normalizedmaximum principal curvature has maxima at any pointin the cross section of a vessel. The study indicates thatfor the multiple scale matched filter that uses the con-volution with the second order Gaussian derivative, theradius estimate is only valid at the vessel center. For theapproach that uses the normalized maximum principalcurvature, the study shows the relation between thescales of the Gaussian kernels and the vessel radius isdependent on distance from the vessel center.
This paper also proposed a new vessel ridge seg-mentation approach based on a scale-space descrip-tor, which captures the normalized maximum principalcurvature and the orientations of local gradients. Thesegmentation is based on multiple-scale models learnedfrom a training set with ground truth given. Evaluationof the performance on images in DRIVE and STAREdatabases shows that the ridge-descriptor can success-fully segment the vessel center lines very accurately.Most of the existing approaches focuses on the segmen-tation of all vessel pixels and no quantitative evaluation
on their performance in the segmentation of smallvessels are given. The ROC curves on segmentingall vessel pixels can not reflect the performance onsmall vessels since the pixels belonging to small vesselsare only a relatively small portion of all vessel pixels.While focusing on the vessel center lines, this approachproposed in this paper have demonstrated performancein segmenting the vessel center lines including thecenter lines of small vessels, though quantitative com-parison with the existing methods are not available.The future work would be to monitor the vessel radiusand the vessel growth in patients with pathologies soas to find the relation between the development ofpathologies and the vessel deformation. The final goalwould be early detection of certain diseases based onanalyzing the retinal images.
Acknowledgements The authors would like to thank Prof. IlyaKudish in the Department of Mathematics at Kettering Univer-sity. The discussion with Prof. Kudish is very helpful.
References
1. Kanski, J. J. (1989). Clinical ophthalmology: A systematicapproach. London: Butterworth-Heinemann.
2. Klonoff, D. C., & Schwartz, D. M. (2000). An economicanalysis of interventions for diabetes. Diabetes Care, 23(3),390–404.
3. Martinez-Perez, M. E., Hughes, A. D., Stanton, A. V., Thom,S. A., Chapman, N., Bharah, A. B., et al. (2002). Retinalvascular tree morphology: A semi-automatic quantification.IEEE Transactions on Biomedical Engineering, 49(8), 912–917, August.
4. Staal, J., Abrmoff, M. D., Niemeijer, M., Viergever, M. A.,& van Ginneken, B. (2004). Ridge-based vessel segmentationin color images of the retina. IEEE Transactions on MedicalImaging, 23(4), 501–509, April.
5. Chutatape, O., Zheng, L., & Krishman, S. (1998). Retinalblood vessel detection and tracking by matched gaussian andkalman filters. In Proceedings of IEEE international confer-ence of engineering in medicine and biology society (Vol. 20,pp. 3144–3149).
6. Tolias, Y. A., & Panas, S. M. (1998). A fuzzy vessel trackingalgorithm for retinal images based on fuzzy clustering. IEEETransactions on Medical Imaging, 17, 263–273, April.
7. Can, A., Turner, J., Tanenbaum, H., & Roysam, B. (1999).Rapid automated tracing and feature extraction from reti-nal fundus images using direct exploratory algorithms. IEEETransactions on Biomedical Engineering, 3(2), 125–138.
8. Gagnon, L., Lalonde, M., Beaulieu, M., & Boucher, M.-C.(2001). Procedure to detect anatomical structures in opti-cal fundus images. In Proceedings of SPIE medical imaging:Image processing (Vol. 4322, pp. 1218–1225).
9. Hoover, A., Kouznetsova, V., & Goldbaum, M. (2000). Lo-cating blood vessels in retinal images by piecewise thresholdprobing of a matched filter response. IEEE Transactions onMedical Imaging, 19(3), 203–210.
10. Chaudhuri, S., Chatterjee, S., Katz, N., Nelson, M., &Goldbaum, M. (1989). Detection of blood vessels in retinal
Vessel radius estimation and center line segmentation
images using two-dimensional matched filters. IEEE Trans-actions on Medical Imaging, 8(3), 263–269, September.
11. Gang, L., Chutatape, O., & Krishnan, S. M. (2002). Detectionand measurement of retinal vessels in fundus images usingamplitude modified second-order Gaussian. IEEE Transac-tions on Biomedical Engineering, 49(2), 168–172, February.
12. Sofka, M., & Stewar, C. V. (2005). Retinal vessel extractionusing multiscale matched filters confidence and edge mea-sures. Technical Report 05-20, The Department of ComputerScience, Rensselaer Polytechnic Institute, 16 August 2005.
13. Pinz, A., Bernogger, S., Datlinger, P., & Kruger, A. (1998).Mapping the human retina. IEEE Transactions on MedicalImaging, 17(4), 606–619, August.
14. Jiang, X., & Mojon, D. (2003). Adaptive local thresholding byverification-based multi-threshold probing with applicationto vessel detection in retinal images. Transactions on PatternAnalysis and Machine Intelligence, 25(1), 131–137, January.
15. Mahadevan, V., Narasimha-Iyer, H., Roysam, B., &Tanenbaum, H. (2004). Robust model-based vasculaturedetection in noisy biomedical imagings. IEEE Transactionon Information Technology in Biomedicine, 8(3), 360–376.
16. McInerney, T., & Terzopoulos, D. (2000). T-snakes: Topol-ogy adaptive snakes. Medical Image Analysis, 4(2), 73–91.
17. Wu, C., & Agam, G. (2007). Probabilistic retinal vessel seg-mentation. In Proceedings of SPIE international symposiumon medical imaging. San Diego, California, Feburary.
18. Zana, F., & Klein, J. C. (2001). Segmentation of vessel-like patterns using mathematical morphology and curvatureevaluation. IEEE Transactions on Image Processing, 10(7),1010–1019 (July).
19. Leandro, J., Cesar, J. R., & Jelinek, H. (2001). Blood vesselssegmentation in retina: Preliminary assessment of the mathe-matical morphology and of the wavelet transform techniques.In Proceedings of XIV Brazilian symposium on computergraphics and image processing, (pp. 84–90), 15–18 October.
20. Frangi, A. F., Niessen, W. J., Vincken, K. L., & Viergever,M. A. (1998). Multiscale vessel enhancement filtering. Lec-ture Notes in Computer Science, 1496, 130–137.
21. Li, Q. (2003). Selective enhancement filters for vessels andairway walls in two- and three-dimensional CT scans. MedicalPhysics, 30(8), 2040–2051.
22. Sinthanayothin, C., Boyce, J., Cook, H., & Williamson, T.(1999). Automated localisation of the optic disc, fovea,and retinal blood vessels from digital colour fundusimages. British Journal of Ophthalmol, 83(8), 902–910,August.
23. Lindeberg, T. (1998). Edge detection and ridge detection withautomatic scale selection. International Journal of ComputerVision, 30(2), 117–156.
24. Kalitzin, S. N., Staal, J., ter Haar Romeny, B. M., &Viergever, M. A. (2001). A computational method for seg-menting topological point-sets and application to imageanalysis. IEEE Transactions on Pattern Analysis and MachineIntelligence, 23(5), 447–459, May.
25. Niemeijer, M., Staal, J., van Ginneken, B., Loog, M., &Abrmoff, M. (2004). Comparative study of retinal vesselsegmentation methods on a new publicly available database.In J. M. Fitzpatrick & M. Sonka (Eds.), Proceedings ofSPIE medical imaging (Vol. 5370, pp. 648–656). Bellingham:SPIE.
Changhua Wu obtained his Bachelor degree in Engineering andMaster degree in Computer Science from Hangzhou Instituteof Electronic Engineering in 1998 and 2001 respectively. Dr.Wu obtained his Ph.D degree in computer science from IlliniosInstitute of Technology in 2005. His current research interestsinclude image processing, computer vision, computer graphics,human computer interface, robotics, and sensor networks. He isa professional member of IEEE and ACM.
Jennifer J. Kang Derwent is an associate professor of BiomedicalEngineering at the Illinois Institute of Technology. Dr. KangDerwent received a B.S. degree in Mathematics, a M.S. inApplied Mathematics and a Ph.D. in Biomedical Engineeringfrom Northwestern University. Dr. Kang Derwent was a Post-doctoral Research Fellow in the Department of Ophthalmologyand Visual Sciences at the University of Illinois at Chicago. Herprofessional research interest includes retinal electrophysiology,blood flow, ocular drug delivery and neural engineering.

C. Wu et al.
Peter Stanchev is a professor at Kettering University, US,and professor and chair at the Institute of Mathematics andInformatics, Bulgarian Academy of Sciences. His research inter-ests include multimedia systems, multimedia semantics, and med-ical systems. Stanchev has a PhD in mathematics and computerscience from Sofia University.
Related Documents