Obesity, body size, and risk of postmenopausal breast cancer: the Women’s Health Initiative (United States) Libby M. Morimoto 1 , Emily White 1, *, Z. Chen 2 , Rowan T. Chlebowski 3 , Jennifer Hays 4 , Lewis Kuller 5 , Ana Marie Lopez 6 , JoAnn Manson 7 , Karen L. Margolis 8 , Paola C. Muti 9 , Marcia L. Stefanick 10 & Anne McTiernan 1 1 Fred Hutchinson Cancer Research Center, Seattle, WA, USA; 2 University of Arizona, Tucson, AZ, USA; 3 Harbor- UCLA Research and Education Institute, Torrance, CA, USA; 4 Center for Women’s Health, Department of Medicine, Baylor College of Medicine, Houston, TX, USA; 5 University of Pittsburgh, Pittsburgh, PA, USA; 6 University of Arizona, Tucson, AZ, USA; 7 Brigham and Women’s Hospital, Boston, MA, USA; 8 Hennepin County Medical Center, Minneapolis, MN, USA; 9 WNY Vanguard Clinical Center, Buffalo, NY, USA; 10 SCRDP, Palo Alto, CA, USA Received 12 November 2001; accepted in revised form 30 April 2002 Key words: body size, breast neoplasms, hormone replacement therapy, obesity, weight gain. Abstract Objective: Body size is an important modifiable risk factor for breast cancer. Although obesity has generally been found to be associated with increased risk for postmenopausal breast cancer, there remain questions concerning the role of body fat distribution, lifetime weight history, and effects within specific subgroups of women. Methods: We assessed the relationship of several anthropometric measures and risk of postmenopausal breast cancer in 85,917 women aged 50–79 at entry in the Women’s Health Initiative Observational Study. Women were enrolled during 1993–1998 at 40 clinics in the US and 1030 developed invasive breast cancer by April 2000. Upon entry, trained clinical center staff measured each woman’s height, weight, and waist and hip circumference. Results: Anthropometric factors were not associated with breast cancer among women who had ever used hormone replacement therapy (HRT). Among HRT non-users, heavier women (baseline body mass index (BMI) >31.1) had an elevated risk of postmenopausal breast cancer (relative risk ðRRÞ¼ 2:52; 95% confidence interval ðCIÞ¼ 1:62–3.93), compared to slimmer women (baseline BMI 22:6). The elevation in risk associated with increasing BMI appeared to be most pronounced among younger postmenopausal women. Change in BMI since age 18, maximum BMI, and weight were also associated with breast cancer in HRT non-users. While both waist and hip circumference were associated with breast cancer risk, their ratio, a measure of fat distribution, was not (RR ¼ 1:33; 95% CI ¼ 0:88–2.01). Conclusions: Our study confirms previously reported findings that generalized obesity is an important risk factor for postmenopausal breast cancer, but only among women who have never taken HRT. Lifetime weight gain is also a strong predictor of breast cancer. Waist to hip ratio, a measure of weight distribution, does not appear to be related to postmenopausal breast cancer risk. Introduction Body size is an important modifiable risk factor for breast cancer. Although obesity has generally been found to be associated with increased risk for post- menopausal breast cancer, questions concerning the role of body fat distribution, lifetime weight history, weight change, and effects within specific subgroups of women remain. While several studies have evaluated these relationships, results have been mixed, and the anthro- pometric measure that is the best predictor of breast cancer risk remains unclear. It is generally accepted that the relationship between body mass index (BMI, or weight/height 2 ) and breast cancer risk is modified by menopausal status, with higher BMI associated with decreased risk for premeno- pausal women and increased risk for postmenopausal * Address correspondence to: Emily White, 1100 Fairview Avenue North, MP 900, PO Box 19024, Seattle, Washington 98109-1024, USA. Ph.: (206) 667-4685; Fax: (206) 667-5977, Email: ewhite@fhcrc. org Cancer Causes and Control 13: 741–751, 2002. 741 Ó 2002 Kluwer Academic Publishers. Printed in the Netherlands.

Welcome message from author
This document is posted to help you gain knowledge. Please leave a comment to let me know what you think about it! Share it to your friends and learn new things together.
Transcript
Obesity, body size, and risk of postmenopausal breast cancer:
the Women’s Health Initiative (United States)
Libby M. Morimoto1, Emily White1,*, Z. Chen2, Rowan T. Chlebowski3, Jennifer Hays4, Lewis Kuller5, Ana MarieLopez6, JoAnn Manson7, Karen L. Margolis8, Paola C. Muti9, Marcia L. Stefanick10 & Anne McTiernan11Fred Hutchinson Cancer Research Center, Seattle, WA, USA; 2University of Arizona, Tucson, AZ, USA; 3Harbor-UCLA Research and Education Institute, Torrance, CA, USA; 4Center for Women’s Health, Department of Medicine,Baylor College of Medicine, Houston, TX, USA; 5University of Pittsburgh, Pittsburgh, PA, USA; 6University ofArizona, Tucson, AZ, USA; 7Brigham and Women’s Hospital, Boston, MA, USA; 8Hennepin County Medical Center,Minneapolis, MN, USA; 9WNY Vanguard Clinical Center, Buffalo, NY, USA; 10SCRDP, Palo Alto, CA, USA
Received 12 November 2001; accepted in revised form 30 April 2002
Key words: body size, breast neoplasms, hormone replacement therapy, obesity, weight gain.
Abstract
Objective: Body size is an important modifiable risk factor for breast cancer. Although obesity has generally beenfound to be associated with increased risk for postmenopausal breast cancer, there remain questions concerning therole of body fat distribution, lifetime weight history, and effects within specific subgroups of women.Methods: We assessed the relationship of several anthropometric measures and risk of postmenopausal breast cancerin 85,917 women aged 50–79 at entry in the Women’s Health Initiative Observational Study. Women were enrolledduring 1993–1998 at 40 clinics in the US and 1030 developed invasive breast cancer byApril 2000. Upon entry, trainedclinical center staff measured each woman’s height, weight, and waist and hip circumference.Results: Anthropometric factors were not associated with breast cancer among women who had ever used hormonereplacement therapy (HRT). AmongHRT non-users, heavier women (baseline bodymass index (BMI)>31.1) had anelevated risk of postmenopausal breast cancer (relative risk ðRRÞ ¼ 2:52; 95% confidence interval ðCIÞ ¼ 1:62–3.93),compared to slimmer women (baseline BMI � 22:6). The elevation in risk associated with increasing BMI appeared tobe most pronounced among younger postmenopausal women. Change in BMI since age 18, maximum BMI, andweight were also associated with breast cancer in HRT non-users. While both waist and hip circumference wereassociatedwith breast cancer risk, their ratio, ameasure of fat distribution, was not (RR ¼1:33; 95%CI ¼ 0:88–2.01).Conclusions: Our study confirms previously reported findings that generalized obesity is an important risk factor forpostmenopausal breast cancer, but only among women who have never taken HRT. Lifetime weight gain is also astrong predictor of breast cancer. Waist to hip ratio, a measure of weight distribution, does not appear to be related topostmenopausal breast cancer risk.
Introduction
Body size is an important modifiable risk factor forbreast cancer. Although obesity has generally beenfound to be associated with increased risk for post-menopausal breast cancer, questions concerning the role
of body fat distribution, lifetime weight history, weightchange, and effects within specific subgroups of womenremain. While several studies have evaluated theserelationships, results have been mixed, and the anthro-pometric measure that is the best predictor of breastcancer risk remains unclear.It is generally accepted that the relationship between
body mass index (BMI, or weight/height2) and breastcancer risk is modified by menopausal status, withhigher BMI associated with decreased risk for premeno-pausal women and increased risk for postmenopausal
* Address correspondence to: Emily White, 1100 Fairview Avenue
North, MP 900, PO Box 19024, Seattle, Washington 98109-1024,
USA. Ph.: (206) 667-4685; Fax: (206) 667-5977, Email: ewhite@fhcrc.
org
Cancer Causes and Control 13: 741–751, 2002. 741� 2002 Kluwer Academic Publishers. Printed in the Netherlands.
women [1]. However, the results from prospectivestudies exploring BMI and postmenopausal breastcancer have been inconsistent [2–9]. Even less clear isthe role of body fat distribution in postmenopausalbreast cancer risk; some studies conclude that abdom-inal adiposity may be a more important predictor ofpostmenopausal breast cancer risk than generalizedobesity [4, 5, 10–14], while others find no evidence ofsuch a relationship [15–20]. More recently, studies haveargued that the relative change in weight is the impor-tant anthropometric measure in postmenopausal breastcancer risk, since adult weight gain generally reflectsincreases in body fat and may be a better measure oftrue adiposity [2, 7, 21–26].The purpose of this study was to estimate the relative
risk of breast cancer occurrence according to variousmeasures of adiposity: (1) measures of general obesity(BMI and weight); (2) measures of fat distribution (waistcircumference, hip circumference, waist to hip ratio); (3)obesity at various ages (self-reported BMI at age 18 andat age 50); and (4) weight change (change in BMI fromage 18 to baseline and from age 50 to baseline). Mostexposures were measured objectively in a clinical settingand all data were collected before onset of breast cancer.Another objective was to evaluate whether the associ-ation between these measures and risk of breast cancerwas modified by various co-factors, such as age, use ofhormone replacement therapy (HRT), and family his-tory of breast cancer.
Materials and methods
The Women’s Health Initiative Observational Studycohort
The Women’s Health Initiative is an ongoing, ethnicallyand geographically diverse, multicenter clinical trial andobservational study designed to address some of themajor causes of morbidity and mortality in postmeno-pausal women. Details of the scientific rationale, eligi-bility requirements and other aspects of the design of theWHI have been published elsewhere [27]. Women wereenrolled in the Observational Study (OS) between 1October 1993 and 31 December 1998 at 40 geographi-cally dispersed clinical centers (n ¼ 93, 717). Cohorteligibility was limited to postmenopausal women aged50–79 at enrollment.
Measurement of exposures
All exposures in this analysis were collected at entry(baseline) into the Observational Study. A standardized
written protocol, centralized training of clinic staff, andperiodic quality assurance visits by the CoordinatingCenter were used to assure uniform administration ofdata collection instruments.Cohort members completed self-administered ques-
tionnaires on personal demographic information, med-ical history, reproductive history, smoking and alcohol,family history, personal habits, thoughts and feelings,diet assessed by a semi-quantitative food-frequencyquestionnaire [28], and recreational physical activity.Age at menopause was determined as the youngest ageat which the participant experienced any of the follow-ing: last menstrual bleeding, removal of both ovaries, orbeginning of hormone replacement therapy (HRT).Recreational physical activity was assessed by questionson the frequency and duration of several types ofrecreational activity, and MET (metabolic equivalents)scores were computed as the product of days per week,minutes per day, and the MET value for each activity[29]. A family history of breast cancer was quantified asthe number of first-degree relatives (mother, sister(s),daughter(s)) who had breast cancer. Lifetime use ofHRT and oral contraceptives and current medicationand supplement use was ascertained through interviewdata. A participant was considered a current or formerHRT user if she used an estrogen-containing pill orpatch for at least 3 months postmenopausally. Womenwho used estrogen-containing creams or suppositorieswere not considered users.During the baseline clinic visit, trained and certified
Clinical Center staff performed anthropometric mea-surements. Weight was measured to the nearest 0.1 kg,and height was recorded to the nearest 0.1 cm. Body-mass index was calculated as weight in kilogramsdivided by the square of height in meters. Waistcircumference at the natural waist or narrowest part ofthe torso and hip circumference at the maximal circum-ference were measured to the nearest 0.1 cm. The waistto hip ratio was computed as the ratio of these twomeasurements. BMI at ages 18 and 50, and maximumBMI were calculated from self-administered question-naires that asked about height at age 18, and weight atage 18, 50, and maximum weight.
Follow-up and ascertainment of cases
WHI OS follow-up is conducted by annual mailed self-administered questionnaires (except for year 3, whenparticipants attend a clinical follow-up visit). Partici-pants mail their completed questionnaires to their localclinical center for data entry and outcomes processing.The response rates for years 1–4 medical history updateswere 96%, 93%, and 91%, respectively. As of 29
742 L.M. Morimoto et al.
February 2000, 1.9% of the participants have been lostto follow-up, and an additional 0.6% have stoppedfollow-up. About 1.2% of the OS participants have died.Cases of breast cancer were identified from annual
mailed follow-up questionnaires or from non-routinecontacts by the participant or proxy. Medical recordswere obtained and reviewed by a clinic physician toverify fact of cancer, site, and whether it was in situ orinvasive. Documents are forwarded to the coordinatingcenter for coding of histology, extent of disease, andestrogen and progesterone receptor status. Only invasivebreast cancer cases centrally confirmed by the coordi-nating center (or cases that were locally confirmed by aclinic physician but not yet reviewed centrally) wereincluded in this analysis. In situ cases were excluded fromanalysis to avoid potential misclassification of outcome.
Statistical analyses
The following participants were excluded from the orig-inal cohort of 93,717: women who had a history of breastcancer at study enrollment (n ¼ 5434); women whoseage at menopause was undeterminable and were youn-ger than age 55 at baseline (n ¼ 566); women who had abilateral mastectomy (n ¼ 181); and women who had nofollow-up time (had no outcome or medical update by 30April 2000 (n ¼ 1619). Our final analysis included 85,917women, among whom 1030 cases of breast cancer wereidentified. Follow-up time for each woman was accruedfrom enrollment to the date of diagnosis of breast cancer,death fromanon-breast cancer cause, loss to follow-up, oradministrative censor date (4 April 2000). Mean length offollow-up for the cohort was 34.8 months.Anthropometric measurements outside a predeter-
mined reasonable range (height: 90–220 cm, weight:30–200 kg, waist: 35–200 cm, hip: 40–200 cm) wereconsidered outliers and excluded from analysis. Anthro-pometric variables (height, weight, waist circumference,hip circumference, waist to hip ratio, BMI at baseline,and BMI at age 18) were divided into quintiles based onthe reported values of the entire cohort. Cutpoints forBMI at baseline were also used to categorize BMI atage 50 and maximum BMI in order to allow a directcomparison of relative risks for different measures ofadiposity. The weight gain variables were divided intocategories of negative/no weight gain and quartiles ofreported weight gain.Data were analyzed using Cox proportional hazards
regression to analyze the association between eachanthropometric exposure and risk of breast cancer.Multivariate-adjusted relative risks (RR) and 95%confidence intervals (CI) were used to assess associa-tions. Standard breast cancer risk factors included as
adjustment variables were age, education, age at meno-pause, age at first birth, first-degree family history ofbreast cancer, smoking, age at menarche, race, alcoholconsumption, recreational physical activity, and kilo-calories of dietary energy. For some variables, addi-tional models were also fitted making adjustments forother anthropometric variables (weight change variableswere further adjusted for BMI at the earlier time point;waist and hip circumference and waist to hip ratio werefurther adjusted for baseline BMI). All adjustmentvariables were included in the model as categoricalvariables. Tests for trend (p-value) were performed bycoding each anthropometric exposure as a grouped(quintiles) linear variable. All tests of statistical signifi-cance were two-sided.Effect modification by HRT use (never users, n ¼
32,5471; current/former users, n ¼ 53,370), decades ofage (50–59 years, n ¼ 27,177; 60–69 years, n ¼ 38,063;70–79 years, n ¼ 20,677), and first-degree family historyof breast cancer (yes, n=12,274; no, n¼ 70,982) wasassessed. A p-value for interaction was calculated as thesignificance of the interaction of the dichotomous groupvariable and the anthropometric trend variable for HRTuse and family history. The p-value for the likelihoodratio test was calculated as the significance of interactionfor decades of age.
Validity study
Three of the WHI clinical centers (Pittsburgh, Birming-ham, Tucson) participated in the WHI OsteoporosisSubstudy. At these centers 6044 women had total bodyfat (percent and grams) and regional body fat compo-sition measured by dual-energy X-ray absorptiometry(DXA) [30]. Because DXA is a more accurate estimationof a woman’s body fat, we computed the Pearsoncorrelation coefficient between the DXA measures andbaseline anthropometric measurements. The most com-monly reported DXA measure to estimate body fat,total percent fat, was moderately correlated with BMI(0.75) and waist circumference (0.70). The highestcorrelation with BMI was total grams of body fat(0.90); the highest correlation with waist circumferencewas grams of trunk fat (0.88). Waist to hip ratio wasonly moderately correlated with DXA measurementgrams of trunk fat (0.42) and percent of total fatlocalized on trunk (0.52).
Results
The distribution of sociodemographic, reproductive,and health behavior factors between cases of breast
Obesity, body size and breast cancer 743
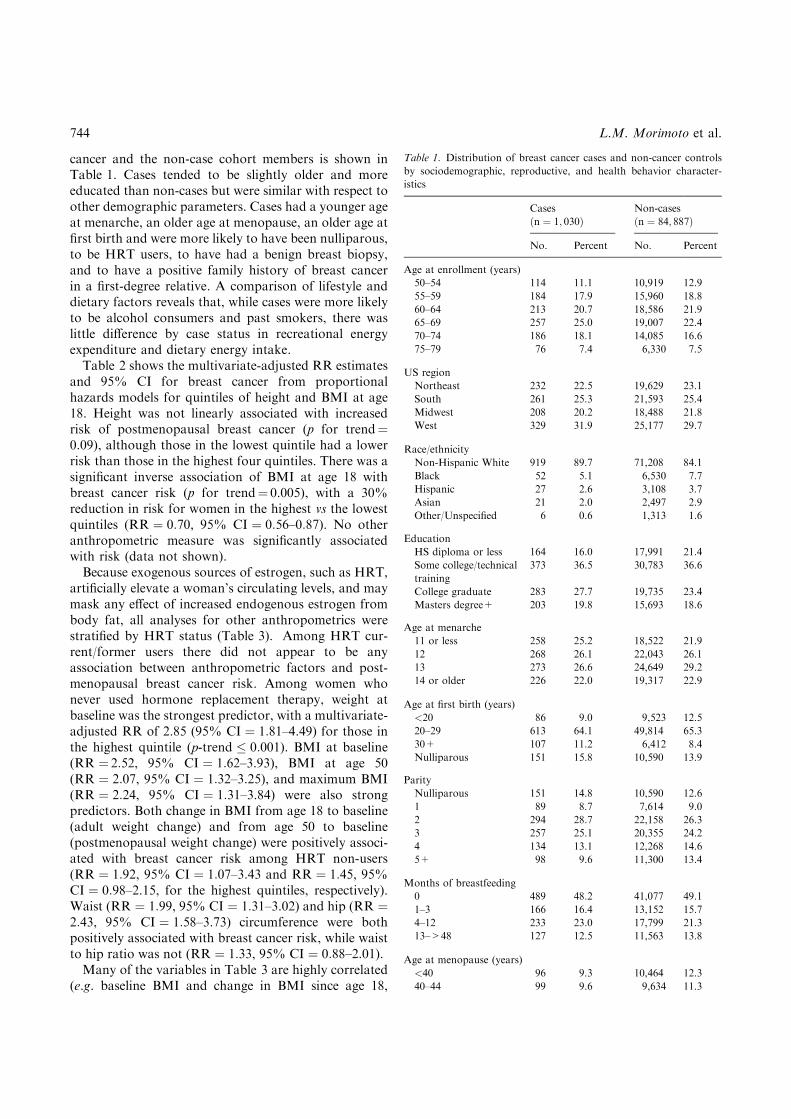
cancer and the non-case cohort members is shown inTable 1. Cases tended to be slightly older and moreeducated than non-cases but were similar with respect toother demographic parameters. Cases had a younger ageat menarche, an older age at menopause, an older age atfirst birth and were more likely to have been nulliparous,to be HRT users, to have had a benign breast biopsy,and to have a positive family history of breast cancerin a first-degree relative. A comparison of lifestyle anddietary factors reveals that, while cases were more likelyto be alcohol consumers and past smokers, there waslittle difference by case status in recreational energyexpenditure and dietary energy intake.Table 2 shows the multivariate-adjusted RR estimates
and 95% CI for breast cancer from proportionalhazards models for quintiles of height and BMI at age18. Height was not linearly associated with increasedrisk of postmenopausal breast cancer (p for trend¼0.09), although those in the lowest quintile had a lowerrisk than those in the highest four quintiles. There was asignificant inverse association of BMI at age 18 withbreast cancer risk (p for trend¼ 0.005), with a 30%reduction in risk for women in the highest vs the lowestquintiles (RR ¼ 0:70, 95% CI ¼ 0:56–0:87). No otheranthropometric measure was significantly associatedwith risk (data not shown).Because exogenous sources of estrogen, such as HRT,
artificially elevate a woman’s circulating levels, and maymask any effect of increased endogenous estrogen frombody fat, all analyses for other anthropometrics werestratified by HRT status (Table 3). Among HRT cur-rent/former users there did not appear to be anyassociation between anthropometric factors and post-menopausal breast cancer risk. Among women whonever used hormone replacement therapy, weight atbaseline was the strongest predictor, with a multivariate-adjusted RR of 2.85 (95% CI ¼ 1:81–4.49) for those inthe highest quintile (p-trend � 0:001). BMI at baseline(RR ¼ 2:52, 95% CI ¼ 1:62–3.93), BMI at age 50(RR ¼ 2:07, 95% CI ¼ 1:32–3.25), and maximum BMI(RR ¼ 2:24, 95% CI ¼ 1:31–3.84) were also strongpredictors. Both change in BMI from age 18 to baseline(adult weight change) and from age 50 to baseline(postmenopausal weight change) were positively associ-ated with breast cancer risk among HRT non-users(RR ¼ 1:92, 95% CI ¼ 1:07–3.43 and RR ¼ 1:45, 95%CI ¼ 0:98–2.15, for the highest quintiles, respectively).Waist (RR ¼ 1:99, 95% CI ¼ 1:31–3.02) and hip (RR ¼2:43, 95% CI ¼ 1:58–3.73) circumference were bothpositively associated with breast cancer risk, while waistto hip ratio was not (RR ¼ 1:33, 95% CI ¼ 0:88–2.01).Many of the variables in Table 3 are highly correlated
(e.g. baseline BMI and change in BMI since age 18,
Table 1. Distribution of breast cancer cases and non-cancer controls
by sociodemographic, reproductive, and health behavior character-
istics
Cases Non-cases
ðn ¼ 1; 030Þ ðn ¼ 84; 887Þ
No. Percent No. Percent
Age at enrollment (years)
50–54 114 11.1 10,919 12.9
55–59 184 17.9 15,960 18.8
60–64 213 20.7 18,586 21.9
65–69 257 25.0 19,007 22.4
70–74 186 18.1 14,085 16.6
75–79 76 7.4 6,330 7.5
US region
Northeast 232 22.5 19,629 23.1
South 261 25.3 21,593 25.4
Midwest 208 20.2 18,488 21.8
West 329 31.9 25,177 29.7
Race/ethnicity
Non-Hispanic White 919 89.7 71,208 84.1
Black 52 5.1 6,530 7.7
Hispanic 27 2.6 3,108 3.7
Asian 21 2.0 2,497 2.9
Other/Unspecified 6 0.6 1,313 1.6
Education
HS diploma or less 164 16.0 17,991 21.4
Some college/technical
training
373 36.5 30,783 36.6
College graduate 283 27.7 19,735 23.4
Masters degree+ 203 19.8 15,693 18.6
Age at menarche
11 or less 258 25.2 18,522 21.9
12 268 26.1 22,043 26.1
13 273 26.6 24,649 29.2
14 or older 226 22.0 19,317 22.9
Age at first birth (years)
<20 86 9.0 9,523 12.5
20–29 613 64.1 49,814 65.3
30+ 107 11.2 6,412 8.4
Nulliparous 151 15.8 10,590 13.9
Parity
Nulliparous 151 14.8 10,590 12.6
1 89 8.7 7,614 9.0
2 294 28.7 22,158 26.3
3 257 25.1 20,355 24.2
4 134 13.1 12,268 14.6
5+ 98 9.6 11,300 13.4
Months of breastfeeding
0 489 48.2 41,077 49.1
1–3 166 16.4 13,152 15.7
4–12 233 23.0 17,799 21.3
13–>48 127 12.5 11,563 13.8
Age at menopause (years)
<40 96 9.3 10,464 12.3
40–44 99 9.6 9,634 11.3
744 L.M. Morimoto et al.
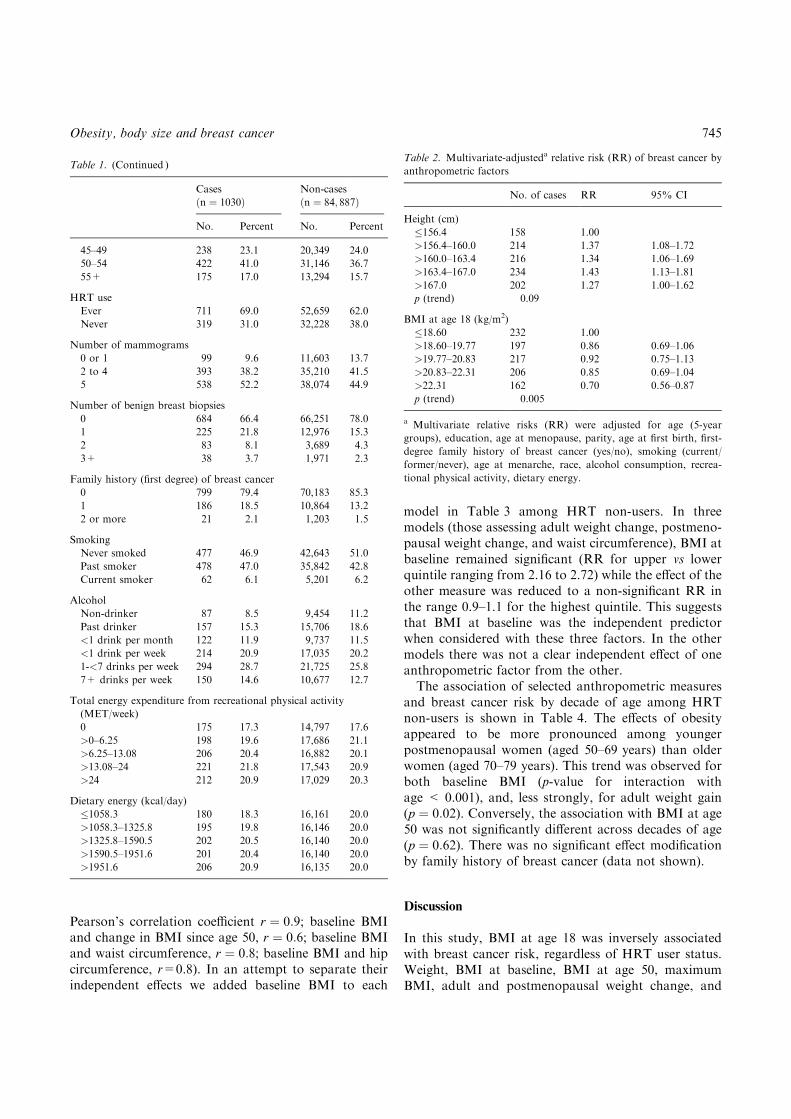
Pearson’s correlation coefficient r ¼ 0:9; baseline BMIand change in BMI since age 50, r ¼ 0:6; baseline BMIand waist circumference, r ¼ 0:8; baseline BMI and hipcircumference, r=0.8). In an attempt to separate theirindependent effects we added baseline BMI to each
model in Table 3 among HRT non-users. In threemodels (those assessing adult weight change, postmeno-pausal weight change, and waist circumference), BMI atbaseline remained significant (RR for upper vs lowerquintile ranging from 2.16 to 2.72) while the effect of theother measure was reduced to a non-significant RR inthe range 0.9–1.1 for the highest quintile. This suggeststhat BMI at baseline was the independent predictorwhen considered with these three factors. In the othermodels there was not a clear independent effect of oneanthropometric factor from the other.The association of selected anthropometric measures
and breast cancer risk by decade of age among HRTnon-users is shown in Table 4. The effects of obesityappeared to be more pronounced among youngerpostmenopausal women (aged 50–69 years) than olderwomen (aged 70–79 years). This trend was observed forboth baseline BMI (p-value for interaction withage < 0.001), and, less strongly, for adult weight gain(p ¼ 0:02). Conversely, the association with BMI at age50 was not significantly different across decades of age(p ¼ 0:62). There was no significant effect modificationby family history of breast cancer (data not shown).
Discussion
In this study, BMI at age 18 was inversely associatedwith breast cancer risk, regardless of HRT user status.Weight, BMI at baseline, BMI at age 50, maximumBMI, adult and postmenopausal weight change, and
Table 1. (Continued )
Cases Non-cases
ðn ¼ 1030Þ ðn ¼ 84; 887Þ
No. Percent No. Percent
45–49 238 23.1 20,349 24.0
50–54 422 41.0 31,146 36.7
55+ 175 17.0 13,294 15.7
HRT use
Ever 711 69.0 52,659 62.0
Never 319 31.0 32,228 38.0
Number of mammograms
0 or 1 99 9.6 11,603 13.7
2 to 4 393 38.2 35,210 41.5
5 538 52.2 38,074 44.9
Number of benign breast biopsies
0 684 66.4 66,251 78.0
1 225 21.8 12,976 15.3
2 83 8.1 3,689 4.3
3+ 38 3.7 1,971 2.3
Family history (first degree) of breast cancer
0 799 79.4 70,183 85.3
1 186 18.5 10,864 13.2
2 or more 21 2.1 1,203 1.5
Smoking
Never smoked 477 46.9 42,643 51.0
Past smoker 478 47.0 35,842 42.8
Current smoker 62 6.1 5,201 6.2
Alcohol
Non-drinker 87 8.5 9,454 11.2
Past drinker 157 15.3 15,706 18.6
<1 drink per month 122 11.9 9,737 11.5
<1 drink per week 214 20.9 17,035 20.2
1-<7 drinks per week 294 28.7 21,725 25.8
7+ drinks per week 150 14.6 10,677 12.7
Total energy expenditure from recreational physical activity
(MET/week)
0 175 17.3 14,797 17.6
>0–6.25 198 19.6 17,686 21.1
>6.25–13.08 206 20.4 16,882 20.1
>13.08–24 221 21.8 17,543 20.9
>24 212 20.9 17,029 20.3
Dietary energy (kcal/day)
�1058.3 180 18.3 16,161 20.0
>1058.3–1325.8 195 19.8 16,146 20.0
>1325.8–1590.5 202 20.5 16,140 20.0
>1590.5–1951.6 201 20.4 16,140 20.0
>1951.6 206 20.9 16,135 20.0
Table 2. Multivariate-adjusteda relative risk (RR) of breast cancer by
anthropometric factors
No. of cases RR 95% CI
Height (cm)
�156.4 158 1.00
>156.4–160.0 214 1.37 1.08–1.72
>160.0–163.4 216 1.34 1.06–1.69
>163.4–167.0 234 1.43 1.13–1.81
>167.0 202 1.27 1.00–1.62
p (trend) 0.09
BMI at age 18 (kg/m2)
�18.60 232 1.00
>18.60–19.77 197 0.86 0.69–1.06
>19.77–20.83 217 0.92 0.75–1.13
>20.83–22.31 206 0.85 0.69–1.04
>22.31 162 0.70 0.56–0.87
p (trend) 0.005
a Multivariate relative risks (RR) were adjusted for age (5-year
groups), education, age at menopause, parity, age at first birth, first-
degree family history of breast cancer (yes/no), smoking (current/
former/never), age at menarche, race, alcohol consumption, recrea-
tional physical activity, dietary energy.
Obesity, body size and breast cancer 745
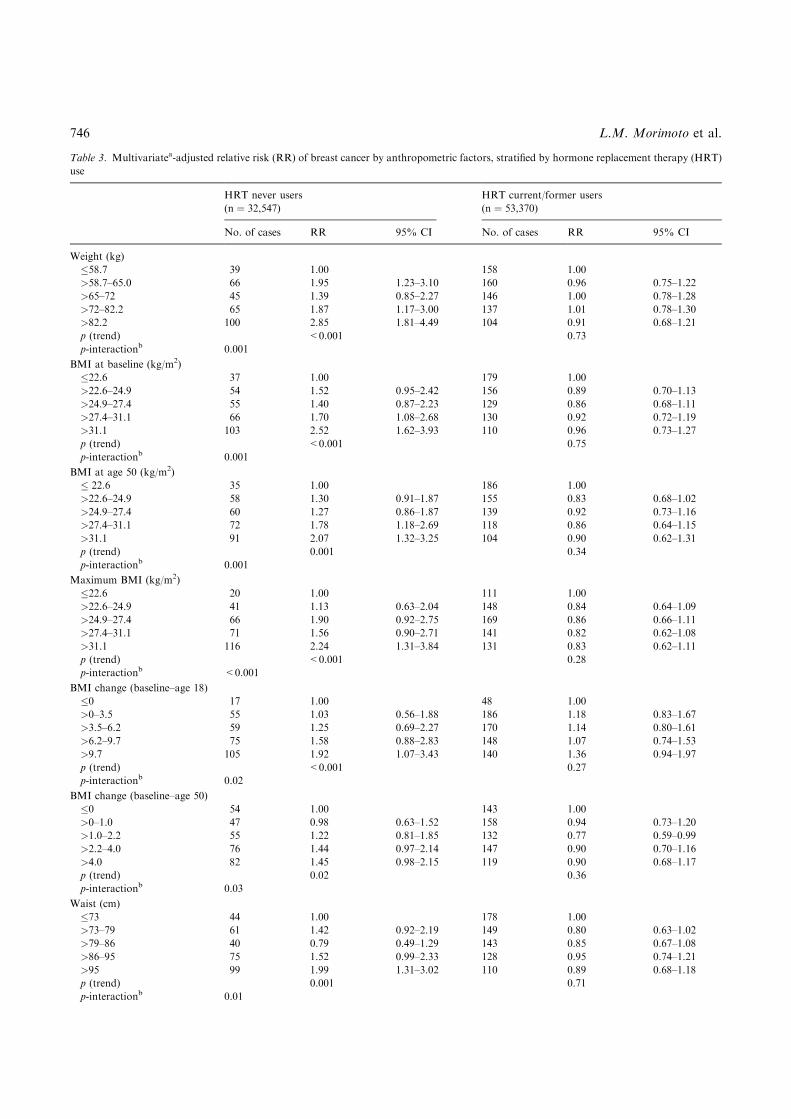
Table 3. Multivariatea-adjusted relative risk (RR) of breast cancer by anthropometric factors, stratified by hormone replacement therapy (HRT)
use
HRT never users HRT current/former users
(n ¼ 32,547) (n ¼ 53,370)
No. of cases RR 95% CI No. of cases RR 95% CI
Weight (kg)
�58.7 39 1.00 158 1.00
>58.7–65.0 66 1.95 1.23–3.10 160 0.96 0.75–1.22
>65–72 45 1.39 0.85–2.27 146 1.00 0.78–1.28
>72–82.2 65 1.87 1.17–3.00 137 1.01 0.78–1.30
>82.2 100 2.85 1.81–4.49 104 0.91 0.68–1.21
p (trend) <0.001 0.73
p-interactionb 0.001
BMI at baseline (kg/m2)
�22.6 37 1.00 179 1.00
>22.6–24.9 54 1.52 0.95–2.42 156 0.89 0.70–1.13
>24.9–27.4 55 1.40 0.87–2.23 129 0.86 0.68–1.11
>27.4–31.1 66 1.70 1.08–2.68 130 0.92 0.72–1.19
>31.1 103 2.52 1.62–3.93 110 0.96 0.73–1.27
p (trend) <0.001 0.75
p-interactionb 0.001
BMI at age 50 (kg/m2)
� 22:6 35 1.00 186 1.00
>22.6–24.9 58 1.30 0.91–1.87 155 0.83 0.68–1.02
>24.9–27.4 60 1.27 0.86–1.87 139 0.92 0.73–1.16
>27.4–31.1 72 1.78 1.18–2.69 118 0.86 0.64–1.15
>31.1 91 2.07 1.32–3.25 104 0.90 0.62–1.31
p (trend) 0.001 0.34
p-interactionb 0.001
Maximum BMI (kg/m2)
�22.6 20 1.00 111 1.00
>22.6–24.9 41 1.13 0.63–2.04 148 0.84 0.64–1.09
>24.9–27.4 66 1.90 0.92–2.75 169 0.86 0.66–1.11
>27.4–31.1 71 1.56 0.90–2.71 141 0.82 0.62–1.08
>31.1 116 2.24 1.31–3.84 131 0.83 0.62–1.11
p (trend) <0.001 0.28
p-interactionb <0.001
BMI change (baseline–age 18)
�0 17 1.00 48 1.00
>0–3.5 55 1.03 0.56–1.88 186 1.18 0.83–1.67
>3.5–6.2 59 1.25 0.69–2.27 170 1.14 0.80–1.61
>6.2–9.7 75 1.58 0.88–2.83 148 1.07 0.74–1.53
>9.7 105 1.92 1.07–3.43 140 1.36 0.94–1.97
p (trend) <0.001 0.27
p-interactionb 0.02
BMI change (baseline–age 50)
�0 54 1.00 143 1.00
>0–1.0 47 0.98 0.63–1.52 158 0.94 0.73–1.20
>1.0–2.2 55 1.22 0.81–1.85 132 0.77 0.59–0.99
>2.2–4.0 76 1.44 0.97–2.14 147 0.90 0.70–1.16
>4.0 82 1.45 0.98–2.15 119 0.90 0.68–1.17
p (trend) 0.02 0.36
p-interactionb 0.03
Waist (cm)
�73 44 1.00 178 1.00
>73–79 61 1.42 0.92–2.19 149 0.80 0.63–1.02
>79–86 40 0.79 0.49–1.29 143 0.85 0.67–1.08
>86–95 75 1.52 0.99–2.33 128 0.95 0.74–1.21
>95 99 1.99 1.31–3.02 110 0.89 0.68–1.18
p (trend) 0.001 0.71
p-interactionb 0.01
746 L.M. Morimoto et al.
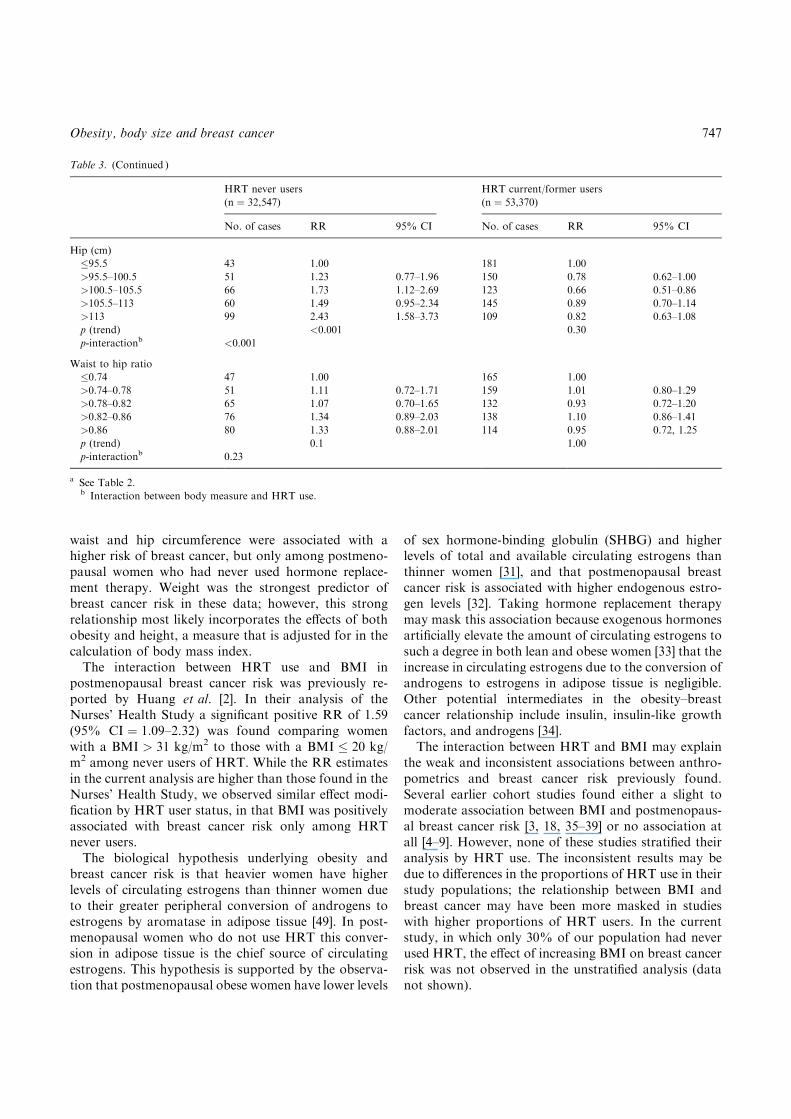
waist and hip circumference were associated with ahigher risk of breast cancer, but only among postmeno-pausal women who had never used hormone replace-ment therapy. Weight was the strongest predictor ofbreast cancer risk in these data; however, this strongrelationship most likely incorporates the effects of bothobesity and height, a measure that is adjusted for in thecalculation of body mass index.The interaction between HRT use and BMI in
postmenopausal breast cancer risk was previously re-ported by Huang et al. [2]. In their analysis of theNurses’ Health Study a significant positive RR of 1.59(95% CI ¼ 1:09–2.32) was found comparing womenwith a BMI > 31 kg/m2 to those with a BMI � 20 kg/m2 among never users of HRT. While the RR estimatesin the current analysis are higher than those found in theNurses’ Health Study, we observed similar effect modi-fication by HRT user status, in that BMI was positivelyassociated with breast cancer risk only among HRTnever users.The biological hypothesis underlying obesity and
breast cancer risk is that heavier women have higherlevels of circulating estrogens than thinner women dueto their greater peripheral conversion of androgens toestrogens by aromatase in adipose tissue [49]. In post-menopausal women who do not use HRT this conver-sion in adipose tissue is the chief source of circulatingestrogens. This hypothesis is supported by the observa-tion that postmenopausal obese women have lower levels
of sex hormone-binding globulin (SHBG) and higherlevels of total and available circulating estrogens thanthinner women [31], and that postmenopausal breastcancer risk is associated with higher endogenous estro-gen levels [32]. Taking hormone replacement therapymay mask this association because exogenous hormonesartificially elevate the amount of circulating estrogens tosuch a degree in both lean and obese women [33] that theincrease in circulating estrogens due to the conversion ofandrogens to estrogens in adipose tissue is negligible.Other potential intermediates in the obesity–breastcancer relationship include insulin, insulin-like growthfactors, and androgens [34].The interaction between HRT and BMI may explain
the weak and inconsistent associations between anthro-pometrics and breast cancer risk previously found.Several earlier cohort studies found either a slight tomoderate association between BMI and postmenopaus-al breast cancer risk [3, 18, 35–39] or no association atall [4–9]. However, none of these studies stratified theiranalysis by HRT use. The inconsistent results may bedue to differences in the proportions of HRT use in theirstudy populations; the relationship between BMI andbreast cancer may have been more masked in studieswith higher proportions of HRT users. In the currentstudy, in which only 30% of our population had neverused HRT, the effect of increasing BMI on breast cancerrisk was not observed in the unstratified analysis (datanot shown).
Table 3. (Continued )
HRT never users HRT current/former users
(n ¼ 32,547) (n ¼ 53,370)
No. of cases RR 95% CI No. of cases RR 95% CI
Hip (cm)
�95.5 43 1.00 181 1.00
>95.5–100.5 51 1.23 0.77–1.96 150 0.78 0.62–1.00
>100.5–105.5 66 1.73 1.12–2.69 123 0.66 0.51–0.86
>105.5–113 60 1.49 0.95–2.34 145 0.89 0.70–1.14
>113 99 2.43 1.58–3.73 109 0.82 0.63–1.08
p (trend) <0.001 0.30
p-interactionb <0.001
Waist to hip ratio
�0.74 47 1.00 165 1.00
>0.74–0.78 51 1.11 0.72–1.71 159 1.01 0.80–1.29
>0.78–0.82 65 1.07 0.70–1.65 132 0.93 0.72–1.20
>0.82–0.86 76 1.34 0.89–2.03 138 1.10 0.86–1.41
>0.86 80 1.33 0.88–2.01 114 0.95 0.72, 1.25
p (trend) 0.1 1.00
p-interactionb 0.23
a See Table 2.b Interaction between body measure and HRT use.
Obesity, body size and breast cancer 747
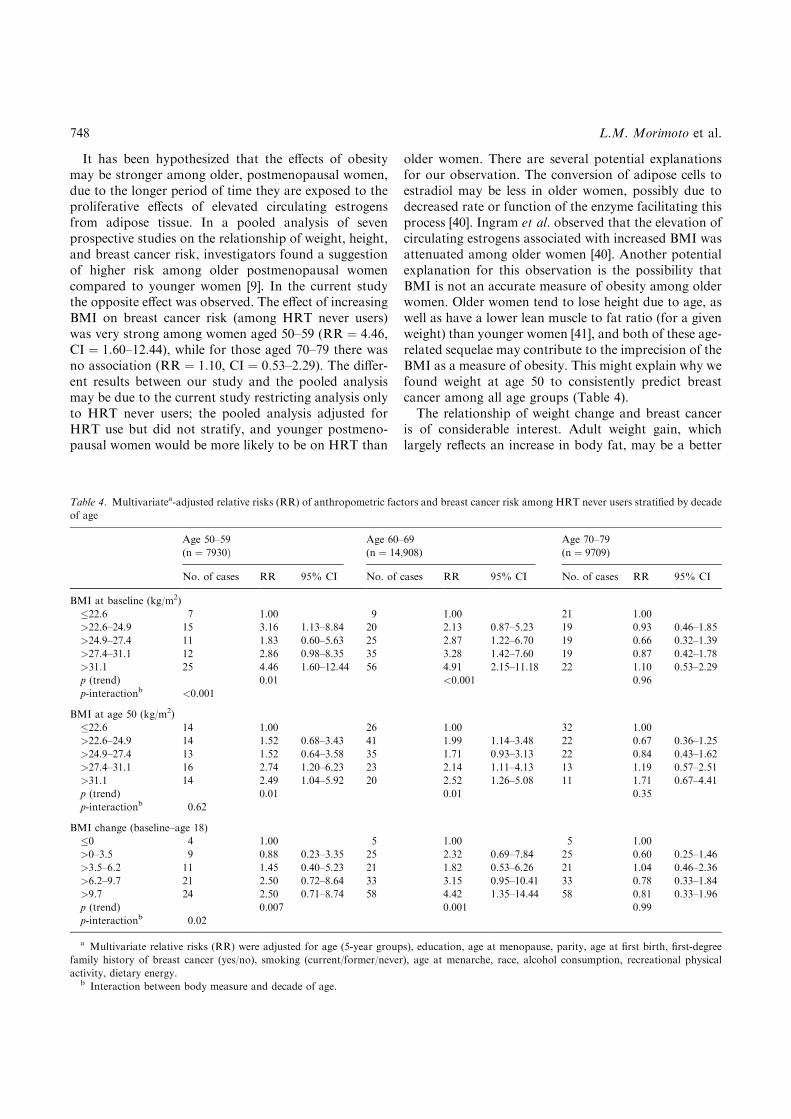
It has been hypothesized that the effects of obesitymay be stronger among older, postmenopausal women,due to the longer period of time they are exposed to theproliferative effects of elevated circulating estrogensfrom adipose tissue. In a pooled analysis of sevenprospective studies on the relationship of weight, height,and breast cancer risk, investigators found a suggestionof higher risk among older postmenopausal womencompared to younger women [9]. In the current studythe opposite effect was observed. The effect of increasingBMI on breast cancer risk (among HRT never users)was very strong among women aged 50–59 (RR ¼ 4:46,CI ¼ 1:60–12.44), while for those aged 70–79 there wasno association (RR ¼ 1:10, CI ¼ 0:53–2.29). The differ-ent results between our study and the pooled analysismay be due to the current study restricting analysis onlyto HRT never users; the pooled analysis adjusted forHRT use but did not stratify, and younger postmeno-pausal women would be more likely to be on HRT than
older women. There are several potential explanationsfor our observation. The conversion of adipose cells toestradiol may be less in older women, possibly due todecreased rate or function of the enzyme facilitating thisprocess [40]. Ingram et al. observed that the elevation ofcirculating estrogens associated with increased BMI wasattenuated among older women [40]. Another potentialexplanation for this observation is the possibility thatBMI is not an accurate measure of obesity among olderwomen. Older women tend to lose height due to age, aswell as have a lower lean muscle to fat ratio (for a givenweight) than younger women [41], and both of these age-related sequelae may contribute to the imprecision of theBMI as a measure of obesity. This might explain why wefound weight at age 50 to consistently predict breastcancer among all age groups (Table 4).The relationship of weight change and breast cancer
is of considerable interest. Adult weight gain, whichlargely reflects an increase in body fat, may be a better
Table 4. Multivariatea-adjusted relative risks (RR) of anthropometric factors and breast cancer risk among HRT never users stratified by decade
of age
Age 50–59 Age 60–69 Age 70–79
(n ¼ 7930Þ (n ¼ 14;908) (n ¼ 9709)
No. of cases RR 95% CI No. of cases RR 95% CI No. of cases RR 95% CI
BMI at baseline (kg/m2)
�22.6 7 1.00 9 1.00 21 1.00
>22.6–24.9 15 3.16 1.13–8.84 20 2.13 0.87–5.23 19 0.93 0.46–1.85
>24.9–27.4 11 1.83 0.60–5.63 25 2.87 1.22–6.70 19 0.66 0.32–1.39
>27.4–31.1 12 2.86 0.98–8.35 35 3.28 1.42–7.60 19 0.87 0.42–1.78
>31.1 25 4.46 1.60–12.44 56 4.91 2.15–11.18 22 1.10 0.53–2.29
p (trend) 0.01 <0.001 0.96
p-interactionb <0.001
BMI at age 50 (kg/m2)
�22.6 14 1.00 26 1.00 32 1.00
>22.6–24.9 14 1.52 0.68–3.43 41 1.99 1.14–3.48 22 0.67 0.36–1.25
>24.9–27.4 13 1.52 0.64–3.58 35 1.71 0.93–3.13 22 0.84 0.43–1.62
>27.4–31.1 16 2.74 1.20–6.23 23 2.14 1.11–4.13 13 1.19 0.57–2.51
>31.1 14 2.49 1.04–5.92 20 2.52 1.26–5.08 11 1.71 0.67–4.41
p (trend) 0.01 0.01 0.35
p-interactionb 0.62
BMI change (baseline–age 18)
�0 4 1.00 5 1.00 5 1.00
>0–3.5 9 0.88 0.23–3.35 25 2.32 0.69–7.84 25 0.60 0.25–1.46
>3.5–6.2 11 1.45 0.40–5.23 21 1.82 0.53–6.26 21 1.04 0.46–2.36
>6.2–9.7 21 2.50 0.72–8.64 33 3.15 0.95–10.41 33 0.78 0.33–1.84
>9.7 24 2.50 0.71–8.74 58 4.42 1.35–14.44 58 0.81 0.33–1.96
p (trend) 0.007 0.001 0.99
p-interactionb 0.02
a Multivariate relative risks (RR) were adjusted for age (5-year groups), education, age at menopause, parity, age at first birth, first-degree
family history of breast cancer (yes/no), smoking (current/former/never), age at menarche, race, alcohol consumption, recreational physical
activity, dietary energy.b Interaction between body measure and decade of age.
748 L.M. Morimoto et al.
variable to assess adiposity and its metabolic conse-quences than body weight itself [2]. In the currentanalysis, adult weight gain (change in BMI from age 18to baseline) and postmenopausal weight gain (change inBMI from age 50 to baseline) were assessed, and bothwere significantly associated with breast cancer riskamong non-HRT users. Our results indicating that adultweight change is a predictor of postmenopausal breastcancer confirm findings from several previous cohorts[2, 7, 21–24, 42]. The current estimates are comparableto those found in the only other study to stratify byHRT use, the Nurses’ Health Study, in which a RR of1.99, CI ¼ 1:43–2.76, among women who had neverused postmenopausal hormones with a lifetime weightgain of 20 kg compared to no change. However, in ourstudy, when baseline BMI was included in the modelwith each measure of weight gain, baseline BMIremained an independent predictor while the effect ofchange in BMI was reduced to a relative risk near 1.0.The current analysis suggests, therefore, that the ef-fect of weight gain is secondary to its relation tocurrent weight. However, one cannot separate withcertainty the independent effects of highly correlatedvariables.Abdominal adiposity might contribute to the risk of
postmenopausal breast cancer beyond that attributableto general obesity alone. Abdominal adiposity is asso-ciated with decreased SHBG concentration [43]. Becausethe bioavailability of estradiol is dependent upon thepercentage of serum estradiol that is bound to SHBG,decreases in SHBG have been significantly related togreater bioavailability of estradiol [12]. It has also beenproposed that abdominal adiposity may be associatedwith increased conversion of androgen to estrogen inadipose tissue [11]. Other studies, however, have foundthat it is total fat mass that is related to sex steroidhormone metabolism, while central adiposity is relatedto insulin-glucose and growth factor metabolism [44].In this study, waist and hip circumference were
strongly associated with breast cancer risk (althoughthe relationship with waist circumference appears to bedue to its high correlation with BMI). Waist to hip ratiowas not significantly related to breast cancer risk. Thisfinding contributes more evidence to the ongoing debatesurrounding the role of central adiposity and postmeno-pausal breast cancer risk. Earlier studies have exploredthis relationship and produced mixed results. Threeprospective studies have found that waist to hip ratio ispositively associated with postmenopausal breast cancerrisk, even after adjusting for the effects of BMI [4, 10, 45],and some have found that this relationship is intensifiedamong older, heavier women [4], women with a familyhistory of breast cancer [46], or women who had never
used HRT [45]. In this study there was no association ofwaist to hip ratio and breast cancer risk, even amongthese subgroups. Other prospective [17, 20, 22] and case–control [15, 16, 47] studies have found similarly nonsig-nificant results. However, only one previous studystratified their analysis by HRT use [45] or excludedHRT users from analysis [20].Varying definitions of central adiposity may partially
explain the conflicting results. Some studies [4, 18, 45]used measures of waist and hip circumference, whileothers [19, 21] used various skinfold measures to assesscentral adiposity. All but two [18, 20] of the previouscohort studies used self-reported measures of waist andhip circumference, which has some measurement error[48]. To our knowledge the current analysis is the largestprospective study with clinic-based measurements toaddress this question.Our failure to find an association between central
adiposity and breast cancer risk may not necessarilyreflect the absence of an association, but rather theinability of waist to hip ratio to accurately measurecentral adiposity. While the measures BMI and waistcircumference were highly correlated with DXA mea-sures of total grams of body fat and trunk fat, waistto hip ratio was not highly correlated to any DXAmeasure. No clinical measurement was highly correlatedwith percent of body fat localized on the trunk,suggesting that current anthropometric measurementsmay not be able to capture central adiposity. Waistcircumference, which was highly correlated with totalgrams of trunk fat in this study, may provide a moredirect measure of abdominal fat, and was associatedwith breast cancer risk in this study as well as otherprospective studies [10, 45]. Other measures of adiposity,such as computerized tomography or magnetic reso-nance imaging, may provide even more valid measures,but these measures may be too expensive for mostpopulation-based studies.There are several other limitations affecting the
current study. Although measures of baseline BMI andwaist to hip ratio were calculated from clinical mea-surements, our measures involving height and weight atearlier ages were taken from questionnaire data and maynot be as accurate. Although the WHI ObservationStudy has a large enrollment of women, the amountof follow-up time for this analysis is short (mean ¼2:9 years). The additional person-years accrued as thestudy progresses will give future analyses more precisionand power to examine associations not possible in thecurrent study, such as effect modification by ethnicity orthe association between DXA measures and breastcancer. Future blood analyses may provide informationconcerning biologic mechanisms.
Obesity, body size and breast cancer 749
In summary, we found that obesity was associatedwith an increased risk of postmenopausal breast canceronly among women who have never taken hormonereplacement therapy. This risk may be elevated over two-fold for women in the upper quintile of obesity comparedwith those in the lowest, based on several measures ofobesity. The elevation in risk associated with increasingBMI appeared to be more pronounced among youngerpostmenopausal women, compared to older women. Thereason for this finding is unclear, however, and theobservation is uncorroborated. Central adiposity, mea-sured as the ratio of waist to hip circumference, wasunrelated to breast cancer in the current analysis. Thecurrent analysis, based on a large prospective study withclinic-based measurement, provides further support thatit is obesity in general and not body fat distribution (asmeasured by waist to hip ratio) that increases risk ofbreast cancer in postmenopausal women.
Acknowledgements
This work was supported by NIH contract # N01-WH-2-2110. The authors are grateful for the assistance of thefaculty and staff at the WHI Clinical CoordinatingCenter.
References
1. Hunter DJ, Willett WC (1993) Diet, body size, and breast cancer.
Epidemiol Rev 15: 110–132.
2. Huang Z, Hankinson SE, Colditz GA, et al. (1997) Dual effects of
weight and weight gain on breast cancer risk. JAMA 278: 1407–
1411.
3. Galanis DJ, Kolonel LN, Lee J, Le Marchand L (1998) Anthro-
pometric predictors of breast cancer incidence and survival in a
multi-ethnic cohort of female residents of Hawaii, United States.
Cancer Causes Control 9: 217–224.
4. Folsom AR, Kaye SA, Prineas RJ, Potter JD, Gapstur SM,
Wallace RB (1990) Increased incidence of carcinoma of the breast
associated with abdominal adiposity in postmenopausal women.
Am J Epidemiol 131: 794–803.
5. Ballard-Barbash R, Schatzkin A, Carter CL, et al. (1990) Body fat
distribution and breast cancer in the Framingham Study. J Natl
Cancer Inst 82: 286–290.
6. den Tonkelaar I, Seidell JC, Collette HJ, de Waard F (1994) A
prospective study on obesity and subcutaneous fat patterning in
relation to breast cancer in post-menopausal women participating
in the DOM project. Br J Cancer 69: 352–357.
7. van den Brandt PA, Dirx MJ, Ronckers CM, van den Hoogen P,
Goldbohm RA (1997) Height, weight, weight change, and post-
menopausal breast cancer risk: the Netherlands Cohort Study.
Cancer Causes Control 8: 39–47.
8. De Stavola BL, Wang DY, Allen DS, et al. (1993) The association
of height, weight, menstrual and reproductive events with breast
cancer: results from two prospective studies on the island of
Guernsey (United Kingdom). Cancer Causes Control 4: 331–340.
9. van den Brandt PA, Spiegelman D, Yaun SS, et al. (2000) Pooled
analysis of prospective cohort studies on height, weight, and breast
cancer risk. Am J Epidemiol 152: 514–527.
10. Kaaks R, Van Noord PA, Den Tonkelaar I, Peeters PJ, Riboli E,
Grobbee DE (1998) Breast-cancer incidence in relation to height,
weight and body-fat distribution in the Dutch ‘‘DOM’’ cohort. Int
J Cancer 76: 647–651.
11. Schapira DV, Kumar NB, Lyman GH (1991) Obesity, body fat
distribution, and sex hormones in breast cancer patients. Cancer
67: 2215–2218.
12. Bruning PF, Bonfrer JM, Hart AA, et al. (1992) Body measure-
ments, estrogen availability and the risk of human breast cancer: a
case–control study. Int J Cancer 51: 14–19.
13. Mannisto S, Pietinen P, Pyy M, Palmgren J, Eskelinen M, Uusitupa
M (1996) Body-size indicators and risk of breast cancer according
to menopause and estrogen-receptor status. Int J Cancer 68: 8–13.
14. Ng EH, Gao F, Ji CY, Ho GH, Soo KC (1997) Risk factors
for breast carcinoma in Singaporean Chinese women: the role of
central obesity. Cancer 80: 725–731.
15. Petrek JA, Peters M, Cirrincione C, Rhodes D, Bajorunas D
(1993) Is body fat topography a risk factor for breast cancer? Ann
Intern Med 118: 356–362.
16. Franceschi S, Favero A, La Vecchia C, et al. (1996) Body size
indices and breast cancer risk before and after menopause. Int J
Cancer 67: 181–186.
17. Lapidus L, Helgesson O, Merck C, Bjorntorp P (1998) Adipose
tissue distribution and female carcinomas. A 12-year follow-up of
participants in the population study of women in Gothenburg,
Sweden. Int J Obes 12: 361–368.
18. Sonnenschein E, Toniolo P, Terry MB, et al. (1999) Body fat
distribution and obesity in pre- and postmenopausal breast cancer.
Int J Epidemiol 28: 1026–1031.
19. den Tonkelaar I, Seidell JC, Collette HJ (1995) Body fat
distribution in relation to breast cancer in women participating
in the DOM-project. Breast Cancer Res Treat 34: 55–61.
20. Muti P, Stanulla M, Micheli A, et al. (2000) Markers of insulin
resistance and sex steroid hormone activity in relation to breast
cancer risk: a prospective analysis of abdominal adiposity, sebum
productio, and hisutism (Italy).Cancer Causes Control 11: 721–730.
21. Ballard-Barbash R, Schatzkin A, Taylor PR, Kahle LL (1990)
Association of change in body mass with breast cancer. Cancer Res
50: 2152–2155.
22. Brinton LA, Swanson CA (1992) Height and weight at various
ages and risk of breast cancer. Ann Epidemiol 2: 597–609.
23. Barnes-Josiah D, Potter JD, Sellers TA, Himes JH (1995) Early
body size and subsequent weight gain as predictors of breast cancer
incidence (Iowa, United States). Cancer Causes Control 6: 112–118.
24. Ziegler RG, Hoover RN, Nomura AM, et al. (1996) Relative
weight, weight change, height, and breast cancer risk in Asian-
American women. J Natl Cancer Inst 88: 650–660.
25. London SJ, Colditz GA, Stampfer MJ, Willett WC, Rosner B,
Speizer FE (1989) Prospective study of relative weight, height, and
risk of breast cancer. JAMA 262: 2853–2858.
26. Trentham-Dietz A, Newcomb PA, Egan KM, et al. (2000) Weight
change and risk of postmenopausal breast cancer (United States).
Cancer Causes Control 11: 533–542.
27. The Women’s Health Initiative Study Group (1998) Design of the
Women’s Health Initiative clinical trial and observational study.
Control Clin Trials 19: 61–109.
28. Patterson RE, Kristal AR, Tinker LF, Carter RA, Bolton MP,
Agurs-Collins T (1999) Measurement characteristics of the Wom-
en’s Health Initiative food frequency questionnaire. Ann Epidemiol
9: 178–187.
750 L.M. Morimoto et al.
29. Ainsworth BE, Haskell WL, Leon AS, et al. (1993) Compendium
of physical activities: classification of energy costs of human
physical activities. Med Sci Sports Exerc 25: 71–80.
30. Lohman TG (1996) Dual energy X-ray absorptiometry. In: Roche
AF, Heymsfied SB, Lohman TG, eds. Human Body Composition.
Champaign, IL: Human Kinetics, pp. 63–78.
31. Potischman N, Swanson CA, Siiteri P, Hoover RN (1996) Reversal
of relation between body mass and endogenous estrogen concen-
trations with menopausal status. J Natl Cancer Inst 88: 756–758.
32. Hankinson SE, Willett WC, Manson JE, et al. (1998) Plasma sex
steroid hormone levels and risk of breast cancer in postmenopausal
women. J Natl Cancer Inst 90: 1292–1299.
33. Chetkowski RJ (1986) Biologic effects of transdermal estradiol.
N Eng J Med, 314: 1615–1620.
34. McTiernan A, Ulrich C, Slate S, Potter J (1998) Physical activity
and cancer etiology: associations and mechanisms. Cancer Causes
Control 9: 487–509.
35. Yong LC, Brown CC, Schatzkin A, Schairer C (1996) Prospective
study of relative weight and risk of breast cancer: the Breast
Cancer Detection Demonstration Project follow-up study, 1979 to
1987–1989. Am J Epidemiol 143: 985–995.
36. de Waard F, Baanders-van Halewijn EA (1974) A prospective
study in general practice on breast-cancer risk in postmenopausal
women. Int J Cancer, 14: 153–160.
37. Tornberg SA, Holm LE, Carstensen JM (1988) Breast cancer risk
in relation to serum cholesterol, serum beta-lipoprotein, height,
weight, and blood pressure. Acta Oncol 27: 31–37.
38. Tretli S (1989) Height and weight in relation to breast cancer
morbidity and mortality. A prospective study of 570,000 women in
Norway. Int J Cancer 44: 23–30.
39. Whittemore AS, Paffenbarger RS, Anderson K, Lee JE (1985)
Early precursors of site-specific cancers in college men and women.
J Natl Cancer Inst 74: 43–51.
40. Ingram DM (1990) Oestrogen binding and risk factors for breast
cancer. Br J Cancer 61: 303–307.
41. Baumgartner RN (1998) Epidemiology of sarcopenia among the
elderly in NewMexico. (Erratum appears in Am J Epidemiol. 1999;
149:1161.). Am J Epidemiol 147: 755–763.
42. Lubin F, Ruder AM, Wax Y, Modan B (1985) Overweight and
changes in weight throughout adult life in breast cancer etiology. A
case–control study. Am J Epidemiol 122: 579–588.
43. Bruning PF (1987) Endogenous estrogens and breast cancer a
possible relationship between body fat distribution and estrogen
availability. J Steroid Biochem 27: 487–492.
44. Bjorntorp P (1993) Visceral obesity: a ‘‘civilization syndrome’’.
Obes Res 1: 206–222.
45. Huang Z, Willett WC, Colditz GA, et al. (1999) Waist circumfer-
ence, waist: hip ratio, and risk of breast cancer in the Nurses’
Health Study. Am J Epidemiol 150: 1316–1324.
46. Sellers TA, Kushi LH, Potter JD, et al. (1992) Effect of family
history, body-fat distribution, and reproductive on the risk of post-
menopausal breast cfactorsancer. N Engl J Med 326: 1323–1329.
47. Hall IJ, Newman B, Millikan RC, Moorman PG (2000) Body
size and breast cancer risk in black women and white women:
the Carolina Breast Cancer Study. Am J Epidemiol 151: 754–764.
48. Kushi LH, Kaye SA, Folsom AR, Soler JT, Prineas RJ (1988)
Accuracy and reliability of self-measurement of body girths. Am J
Epidemiol 128: 740–748.
49. Silteri PK (1987) Adipose tissue as a source of hormones. Am J
Clin Nutr 45: 277–282.
Obesity, body size and breast cancer 751
Related Documents