Phoenix Group Holdings Annual Report and Accounts 2015 …to finding innovative ways to deliver value OPEN

Welcome message from author
This document is posted to help you gain knowledge. Please leave a comment to let me know what you think about it! Share it to your friends and learn new things together.
Transcript

Phoenix Group HoldingsAnnual Report and Accounts 2015
… to finding innovative ways to deliver value
O P E N
PHO
ENIX
GRO
UP H
OLD
ING
S ANN
UAL REPORT AN
D ACC
OU
NTS 2015

STRATEGIC REPORT
Group at a glance 04
Chairman’s statement 06
Group Chief Executive Officer’s report
08
Operating structure 12
The marketplace 13
Our business model 14
Value generation 15
Our strategy and KPIs 16
Financial performance 24
Cash generation 24
Group IFRS 26
Group MCEV 29
Capital management 31
Capital resources 33
Risk management 34
Environmental reporting 40
2015 key performance indicators
CORPORATE GOVERNANCE
Chairman’s introduction 42
Board structure 43
Board of Directors 44
Executive management team 46
Corporate governance report 47
Directors’ remuneration report 57
Directors’ report 81
FINANCIALS
Statement of Directors’ responsibilities
86
Independent Auditor’s report 87
IFRS consolidated financial statements
95
Notes to the IFRS consolidated financial statements
102
Parent company accounts 188
Notes to the parent company financial statements
192
Asset disclosures 198
Additional Life Company asset disclosures
199
MCEV supplementary information 206
Statement of Directors’ responsibilities
207
Independent Auditor’s report 208
MCEV financial statements 209
Notes to the MCEV financial statements
213
ADDITIONAL INFORMATION
Shareholder information 222
Glossary 225
£225m Operating companies’ cash generation
£324mIFRS operating profit
£2,513mGroup MCEV
£205mIncremental MCEV
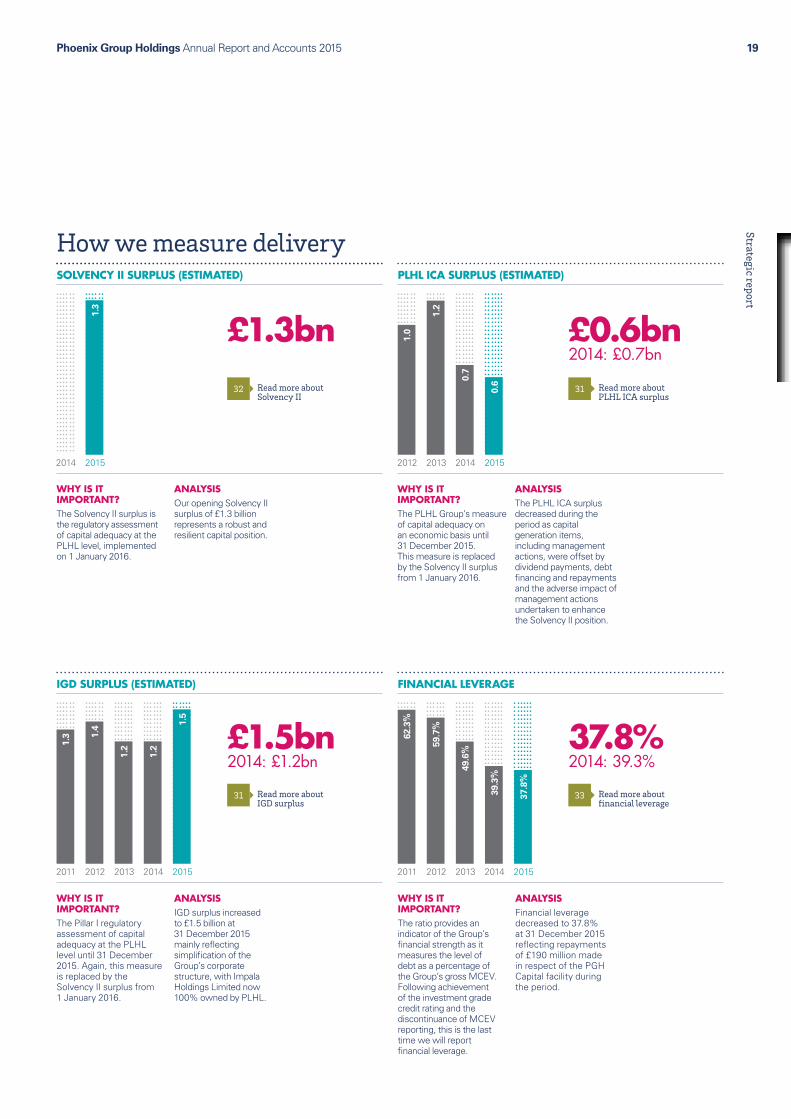
£1.3bnSolvency II surplus (estimated)
£0.6bnPLHL ICA surplus (estimated)
£1.5bnIGD surplus (estimated)
37.8%Financial leverage
96%Customer satisfaction score
18% FOS overturn rate
11 daysSpeed of pension transfer payouts – ORIGO
78%Employee engagement index

C L O S E Dfunds represent the whole of our business. Because of this we are able to focus all our energy and expertise on improving their performance without being distracted by the need to win new customers.

SOLUTION
We aim to be recognised as the ‘industry solution’ for the safe, innovative and profitable management of closed life funds.

L O N GMT E R
As closed funds run off over the long term we believe that a specialist operating model is critical for providing policyholders with a secure, stable and efficient service.

Our operating structure
Phoenix Group Holdings Annual Report and Accounts 201504
PHOENIX GROUP AT A GLANCE
Phoenix is the UK’s largest specialist closed life and pension fund consolidator, looking after c. 4.5 million policyholders.
OUR VISION
To be the saver-friendly, industry solution for the safe, innovative and profitable management of closed life funds.
OUR MISSION
To improve returns for policyholders while delivering value to shareholders.
c. 4.5m Policyholders
£47bnLife company assets
18% Total shareholder return in 2015
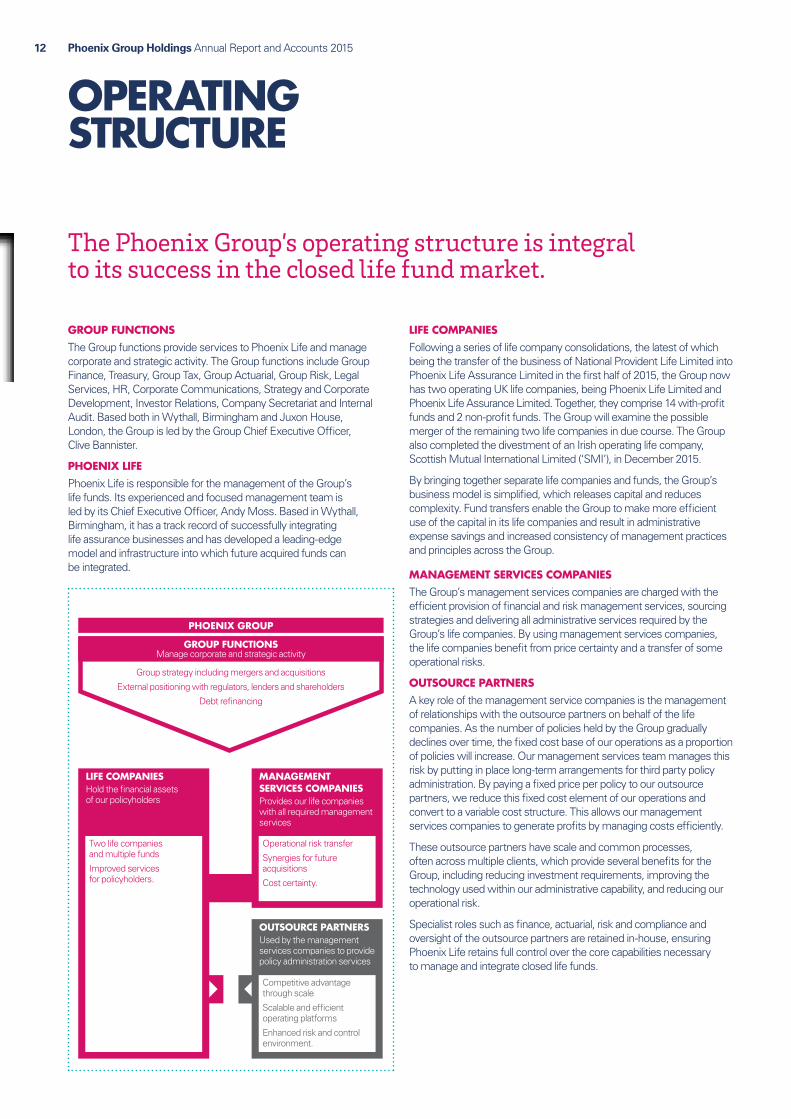
GROUP FUNCTIONS
The Group functions provide services to Phoenix Life and manage corporate and strategic activity. Based both in Wythall, Birmingham and Juxon House, London, the Group is led by the Group Chief Executive Officer, Clive Bannister.
Read more about our operating structure
12
PHOENIX GROUP
MANAGEMENT SERVICES COMPANIESResponsible for providing life companies with all required management services
LIFE COMPANIESHold the financial assets of our policyholders
OUTSOURCE PARTNERSUsed by the management services companies to provide policy administration services
GROUP FUNCTIONSManage corporate and strategic activity
PHOENIX LIFE
Phoenix Life is the Group’s core business segment and is responsible for the management of the Group’s life funds. Based in Wythall, Birmingham, it is led by its Chief Executive Officer, Andy Moss.

Phoenix Group Holdings Annual Report and Accounts 2015 05Strategic report
What we doHOW WE CREATE VALUEWe create value for our customers by maximising policyholder returns through our specialist expertise and innovative management of closed life funds. We create value for our shareholders by generating profits from the growth of our funds and releasing excess capital as dividends.
HOW WE MANAGE RISKWe operate a comprehensive risk management framework which identifies, assesses and mitigates the risks facing our Group.
HOW WE GOVERN OUR BUSINESSWe operate a robust governance structure embedded in an experienced management team, with independent Boards and Committees for the Group.
The following shows the Group’s original entities, their various acquisitions and key achievements over the years:
1782 Phoenix Assurance established
1806 London Life established
1835 NPI established
1836 Edinburgh & Glasgow Assurance established
1837 Scottish Provident established
1857 Pearl Loan Company established
1905 Britannic Assurance Company established
1996 Royal & Sun Alliance established
1999 Britannic acquires Alba Life
2001 Abbey National acquires Scottish Provident
2004 Resolution Life Group acquires UK life operations of Royal & Sun AllianceBritannic acquires life operations of Allianz Cornhill
2005 Pearl Group createdResolution Life Group acquires Swiss Life (UK) plcBritannic acquires Century Group and merges with Resolution Life Group to form Resolution plc
2006 Resolution plc acquires Abbey National’s life business
2008 Pearl Group acquires Resolution plc
2009 Liberty Acquisition Holdings (International) acquires Pearl Group
2010 Pearl Group renamed Phoenix Group Holdings and achieves Premium Listing on London Stock Exchange
2012 Transferred approximately £5 billion annuity liabilities to Guardian AssuranceTransferred business of NPI Limited to Phoenix Life Limited and London Life Limited to Phoenix Life Assurance Limited
2013 Successful debt re-terming and equity raising of £250 million
2014 Divestment of Ignis Asset Management Refinanced the Group’s remaining senior bank debt and PIK notes into a single £900 million facilityIssued £300 million unsecured 7 year bond
2015 Investment grade credit rating achieved from Fitch RatingsSolvency II full internal model approvedExchange of Tier 1 bonds into new subordinated notes
Read more about how we create value
15 Read more about how we govern our business
42Read more about how we manage risk
34
Our strategyWE HAVE FOUR AREAS OF STRATEGIC FOCUS:
Read more about our strategy and KPIs
16
DRIVE VALUEIn order to drive value, the Group looks to undertake management actions which reduce costs, release capital, accelerate cash flows or enhance economic value.
IMPROVE CUSTOMER OUTCOMESImproving customer
outcomes is central to our vision of being the saver-
friendly ‘industry solution’ for closed life funds.
MANAGE CAPITAL
The effective management of our risks and the efficient allocation of capital against
them is critical in allowing us to achieve our strategic and
operational objectives.
ENGAGE PEOPLEOur people underpin everything that we do. The Group specifically targets, recruits and develops top quality people to support the achievement of its strategic and operational objectives.
01 02
04 03
Our history
Phoenix Group Holdings Annual Report and Accounts 201506
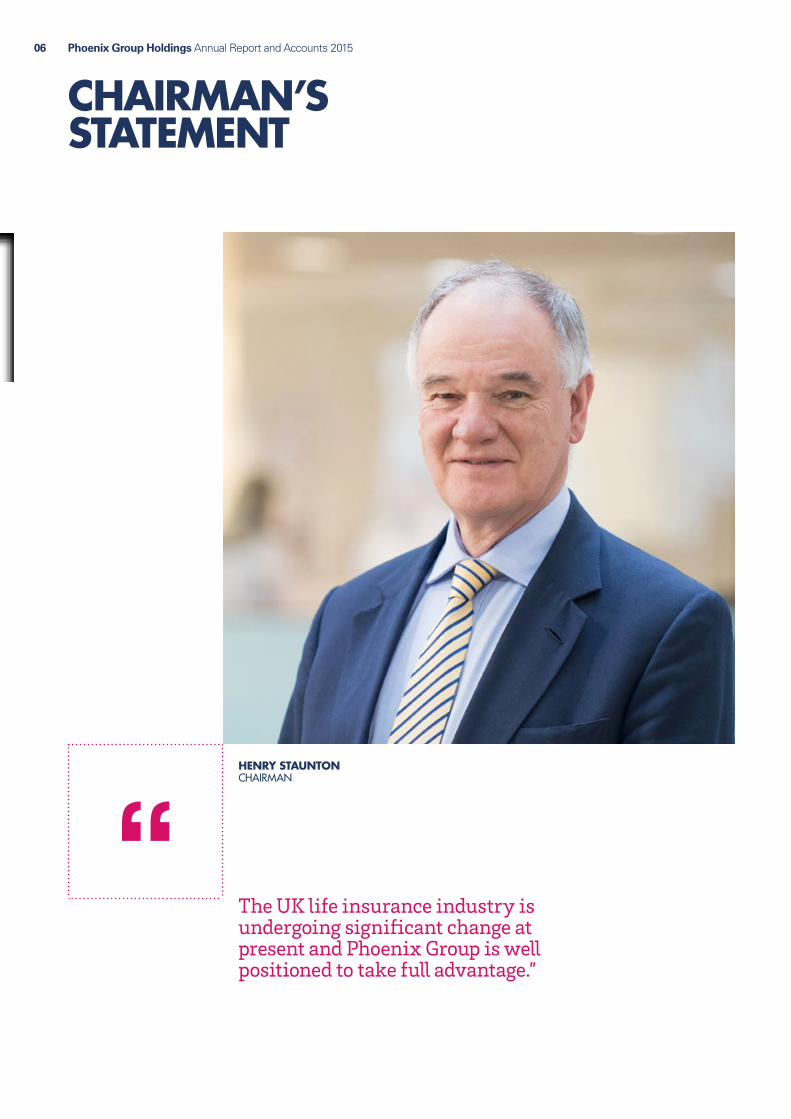
CHAIRMAN’S STATEMENT
The UK life insurance industry is undergoing significant change at present and Phoenix Group is well positioned to take full advantage.”
HENRY STAUNTON CHAIRMAN

Phoenix Group Holdings Annual Report and Accounts 2015 07Strategic report
I have joined Phoenix Group as Chairman at a time of great change for the UK life insurance sector. Over the past few months, the Group has seen the introduction of the new Solvency II capital regime as well as the publication of the Financial Conduct Authority’s (‘FCA’) thematic review of the fair treatment of long-standing customers in life insurance. Adapting to this regulatory change has involved a considerable amount of work for the Group, in particular in relation to Solvency II. It was therefore very pleasing when the Group received regulatory approval for its Internal Model application under the new capital regime.
There were a number of further important achievements by Phoenix during the course of the year. Most notably, the Group achieved an investment grade credit rating from Fitch Ratings, reducing the cost of our bank debt and broadening our access to the debt capital markets in future. In addition, we have navigated the new pension freedom changes, expanding the financial options available to our customers whilst continuing to offer a fair and timely service.
Phoenix Group has also remained focused on financial delivery and has continued its record of meeting or exceeding publicly stated targets. The Group has been particularly successful in continuing to add value for both customers and shareholders through management actions and I look forward to further progress in the coming years.
In November we sponsored an independent report by the Pensions Institute, titled ‘The Meaning of Life’, that considered the future of the traditional life company business model in the UK. As described in the report, recent changes to the regulation of pension provision, including the new pension freedom rules, were unanticipated and market participants have had little time to adapt. It is therefore far from certain what the future market will look like from the perspective of the industry as a whole, for the individual providers and for our customers. As the UK’s largest specialist consolidator of closed life funds, we believe that Phoenix has a key role to play in supporting customers through these changes.
It is also clear that the traditional life company business model must continue to adapt. We concur with the conclusions of the Pensions Institute that there will be further consolidation in the UK life sector as existing providers struggle with issues such as heightened regulatory scrutiny, increased capital requirements and shortages of skilled personnel to manage complex legacy products. Phoenix Group has the expertise and operating model in place to take advantage of this changing environment and I look forward to the Group examining further opportunities to grow the business. However, we will only make acquisitions that are value accretive, would at least sustain our current dividend per share and would support our investment grade credit rating.
The Board has recommended a final dividend for 2015 of 26.7p per share. This brings the total dividend for the 2015 financial year to 53.4p per share, in line with the dividend paid in respect of the 2014 financial year. Given the long-term run-off nature of the Group’s business, the Board believes it is prudent to maintain a stable, sustainable dividend while the Group builds its financial flexibility to execute its growth strategy and meet external challenges.
I can also announce that Tom Cross Brown will be stepping down from the Board at the time of the Annual General Meeting. Tom has been a Director of Phoenix Group Holdings since 2009 and has been involved with the Group in its various guises since 2005, helping to guide Phoenix through a number of restructurings to its present position at the forefront of the closed life fund industry. His expertise and knowledge of asset management and corporate transactions have been of enormous value to the Group during a period of rapid change. I would like to thank Tom both for his contribution to Phoenix over the past years and his personal help and support during my first few months as Chairman of the Group.
FinalIy, I would like to thank all my colleagues at Phoenix for their hard work and commitment. The ability of the Group to continue to meet its targets for cash generation and value creation is a testament to their dedication. I believe that the Group can look forward to 2016 with great confidence as it seeks to be a leading player in the consolidation of the UK closed life market.
HENRY STAUNTON CHAIRMAN
22 MARCH 2016
Phoenix Group Holdings Annual Report and Accounts 201508
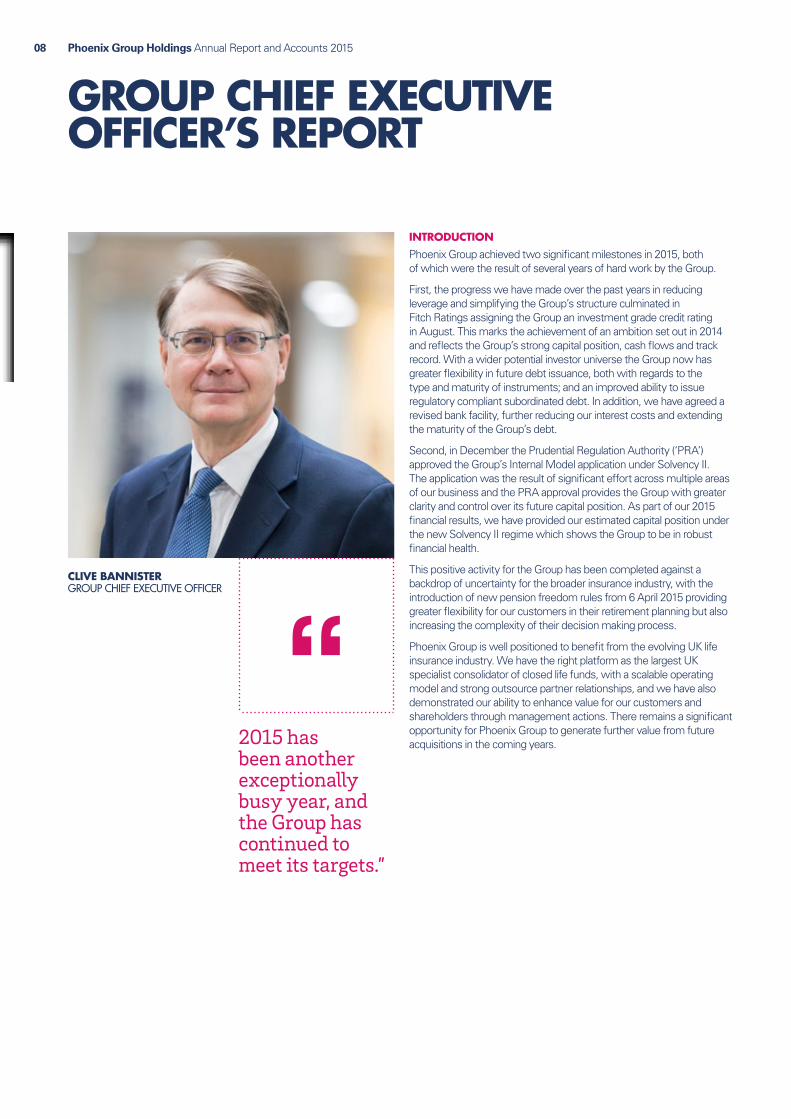
GROUP CHIEF EXECUTIVE OFFICER’S REPORT
INTRODUCTIONPhoenix Group achieved two significant milestones in 2015, both of which were the result of several years of hard work by the Group.
First, the progress we have made over the past years in reducing leverage and simplifying the Group’s structure culminated in Fitch Ratings assigning the Group an investment grade credit rating in August. This marks the achievement of an ambition set out in 2014 and reflects the Group’s strong capital position, cash flows and track record. With a wider potential investor universe the Group now has greater flexibility in future debt issuance, both with regards to the type and maturity of instruments; and an improved ability to issue regulatory compliant subordinated debt. In addition, we have agreed a revised bank facility, further reducing our interest costs and extending the maturity of the Group’s debt.
Second, in December the Prudential Regulation Authority (‘PRA’) approved the Group’s Internal Model application under Solvency II. The application was the result of significant effort across multiple areas of our business and the PRA approval provides the Group with greater clarity and control over its future capital position. As part of our 2015 financial results, we have provided our estimated capital position under the new Solvency II regime which shows the Group to be in robust financial health.
This positive activity for the Group has been completed against a backdrop of uncertainty for the broader insurance industry, with the introduction of new pension freedom rules from 6 April 2015 providing greater flexibility for our customers in their retirement planning but also increasing the complexity of their decision making process.
Phoenix Group is well positioned to benefit from the evolving UK life insurance industry. We have the right platform as the largest UK specialist consolidator of closed life funds, with a scalable operating model and strong outsource partner relationships, and we have also demonstrated our ability to enhance value for our customers and shareholders through management actions. There remains a significant opportunity for Phoenix Group to generate further value from future acquisitions in the coming years.2015 has
been another exceptionally busy year, and the Group has continued to meet its targets.”
CLIVE BANNISTER GROUP CHIEF EXECUTIVE OFFICER
Phoenix Group Holdings Annual Report and Accounts 2015 09Strategic report
FINANCIAL HIGHLIGHTSDELIVERY OF FINANCIAL TARGETSPhoenix Group has continued its track record of meeting or exceeding its financial targets.
2015 was a transitional year to the new Solvency II capital regime and our 2015 cash generation target incorporated assumptions regarding how the final Solvency II regulations were likely to be implemented. Against a full year cash generation target of £200 million to £250 million, the Group has generated £225 million of cash in 2015, meeting the target range. Against our long-term cash generation target of £2.8 billion for the period from 2014 to 2019, we have already delivered £1.2 billion.
Our MCEV decreased by £134 million to £2,513 million at 31 December 2015, versus £2,647 million at 31 December 2014. The decrease primarily reflects the payment of dividends in 2015, negative impacts from actions taken to optimise the Group’s Solvency II capital position and market movements during the last quarter of 2015, in particular widening credit spreads. However, these negative impacts have been partly offset by management actions that have enhanced MCEV. In March 2015, we announced an increased cumulative target of £400 million incremental embedded value from management actions between 2014 and 2016. The Group generated £205 million of incremental MCEV during 2015 and, having now achieved £466 million from management actions since 2014, has met this increased target a year ahead of schedule.
SOLVENCY II AND OUR CAPITAL POSITIONThe new Solvency II regime applies to the Group from 1 January 2016 and therefore the Solvency I Group capital measures, PLHL ICA and IGD, are no longer regulatory measures and will not be reported in future.
At 31 December 2015, our PLHL ICA surplus was estimated to be £0.6 billion, with headroom over our capital policy of £0.5 billion (2014: £0.7 billion surplus, £0.6 billion headroom). Our estimated IGD surplus was £1.5 billion at 31 December 2015, with headroom over our IGD capital policy of £0.7 billion (2014: £1.2 billion surplus, £0.5 billion headroom).
The PRA approved the Group’s Internal Model Application in December, and therefore the Group will report its Solvency II capital position based on the Internal Model and as calculated at the level of Phoenix Life Holdings Limited (‘PLHL’). In addition, the PRA also approved the Group’s use of matching adjustments and transitional measures in 2015.
Our estimated Solvency II surplus as at 31 December 2015 is £1.3 billion. This is the surplus over the Group’s Solvency Capital Requirement and demonstrates the resilience of the Group’s capital position under the new regime. Unlike open life businesses, we do not need to hold significant additional capital to support the writing of new insurance products. The Group’s Solvency II position is also relatively insensitive to market movements.
In addition, we have £706 million of cash at the holding company level, providing further support for our stable and sustainable dividend policy.
IFRS OPERATING PROFITThe Group achieved IFRS operating profits of £324 million in 2015 (2014: £483 million), reflecting the divestment of Ignis in 2014 and a reduced impact from management actions.
OPERATIONAL HIGHLIGHTS Despite the changes impacting the UK life insurance industry, Phoenix Group continued to streamline its business and create value. Key actions taken during 2015 include:
Ɛ The Part VII transfer of the business of National Provident Life Limited into Phoenix Life Assurance Limited. This fund merger reduces the number of UK life insurance companies within the Group to two and the Group will examine the possible merger of the remaining two life companies in due course.
Ɛ The recapture by Phoenix Life Assurance Limited of £1.4 billion of reinsured annuities from Opal Re, the Group’s captive Bermudan reinsurance company, and entering into a new reinsurance agreement with an external reinsurer which covers the bulk of the recaptured liabilities. This action significantly enhanced our Solvency II capital efficiency by reducing our exposure to longevity risk.
Ɛ An exchange offer of the Group’s Tier 1 notes into new subordinated notes with a maturity of 2025, with a 99% take-up rate by noteholders.
Ɛ The simplification of the Group’s corporate structure following the single silo bank facility put in place during 2014, with Impala Holdings Limited now 100% owned by PLHL. This Group simplification provided a more appropriate Group structure for the Solvency II capital regime.
Ɛ The divestment of the Group’s Irish subsidiary, Scottish Mutual International (‘SMI’), for £14 million. The small scale of SMI, which had only 3,000 remaining policyholders, had become inefficient and the divestment further simplified the Group’s structure.
Ɛ The acquisition of a £0.3 billion portfolio of equity release mortgages, in line with the strategy to diversify the asset portfolio by investing in new asset classes to support the Group’s annuity liabilities.
This is a strong list of achievements and we will continue to seek ways to add value for customers and shareholders alike during 2016.
REGULATORY AND LEGISLATIVE CHANGES2015 saw a number of key regulatory changes to the UK life insurance sector.
The ending of compulsory annuitisation of pension pots, announced at the time of the 2014 Budget, continues to have a significant impact across the UK life insurance industry. Phoenix Group only provides annuities for its own vesting policyholders and wrote a total of £485 million of annuities in 2015 compared with £545 million in 2014, a decline of 11%. £344 million of the annuities written in 2015 had guaranteed annuity rates (‘GARs’) that are often well above currently available market rates, with the remaining £141 million being non-GAR annuities. We continue to believe that the life-long certainty of income provided by annuities will remain an attractive option for certain customers and Phoenix Group aims to offer our customers an average non-GAR annuity rate that is at least 97.5% of the average of the top five open market providers.
Phoenix Group Holdings Annual Report and Accounts 201510
GROUP CHIEF EXECUTIVE OFFICER’S REPORT Continued
The FCA released its thematic review of the fair treatment of long-standing customers in life insurance earlier this month and, as the UK’s largest specialist closed life fund consolidator, we welcome the focus the review brings to the fair treatment of policyholders. Our customers and the outcomes of their policies are fundamental to our business model. However, we continue to seek ways to improve and we look forward to working with the FCA and industry as part of the subsequent consultation process.
There are also a number of ongoing reviews, including the recently announced FCA consultation on early exit charges. Over 80% of our unitised policies have no exit charge at all and to date we have seen no evidence that any of our customers incurring an exit charge is deterred from taking advantage of pension freedoms before their selected retirement date. However, we will work closely with the FCA as part of their consultation on the implementation of an appropriate cap on exit charges. In total, these charges amount to approximately £22 million for Phoenix policyholders over the age of 55, an average of only around 0.25% of unitised assets.
Finally, Phoenix Life has fully embraced the establishment of an Independent Governance Committee for contract-based workplace pensions. Consistent with the continuing focus on product governance within Phoenix, the Committee is reviewing data and considering proposals to ensure that customers in our workplace pension schemes are being treated fairly.
CUSTOMERSThe most important change impacting our customers this year has undoubtedly been the introduction of the new pension freedom rules from 6 April 2015. Phoenix Life has put in place an overarching Retirement Strategy in reaction to the new pensions legislation, with the aim of being in a position to meet the future demands of our customers.
As expected, the number of customer calls increased upon the introduction of the new rules. However, we were very pleased that the actions we took in advance to increase our capacity such as increasing resource levels, extending contact centre opening hours, providing online retirement packs and outbound calling ensured a good customer experience was maintained.
During 2015, around 43,000 customers requested full encashment of their pension savings, with an average pot size of £13,000. Phoenix Life provided detailed information to customers on their options as well as promoting the availability of the Government’s Pension Wise service. In addition, we continue to remind customers of the value of guaranteed annuity rates within their products and encourage them to take financial advice before making important decisions on their pension savings.
To ensure that Phoenix Life customers have access to the range of options available under the new pension freedom rules, Phoenix Life agreed a wider partnership agreement with Just Retirement. This provides customers with a range of products, including the ability to ‘shop around’ for standard and enhanced annuities as well as offering a drawdown pension product. Access to enhanced annuities can increase the annuity income received by up to 40% and customers are strongly encouraged to investigate these and other options before making a final decision. The new partnership therefore also offers customers the ability to access financial advice as they plan for their retirement.
There remains the risk of fraudsters targeting our customers and we therefore continue to take action to identify possible incidences of pension fraud where possible. Phoenix Group prevented policyholders from losing around £10 million to fraudulent schemes during 2015 and we have also been active in publicising the risk of pension fraud through specific campaigns in the media.
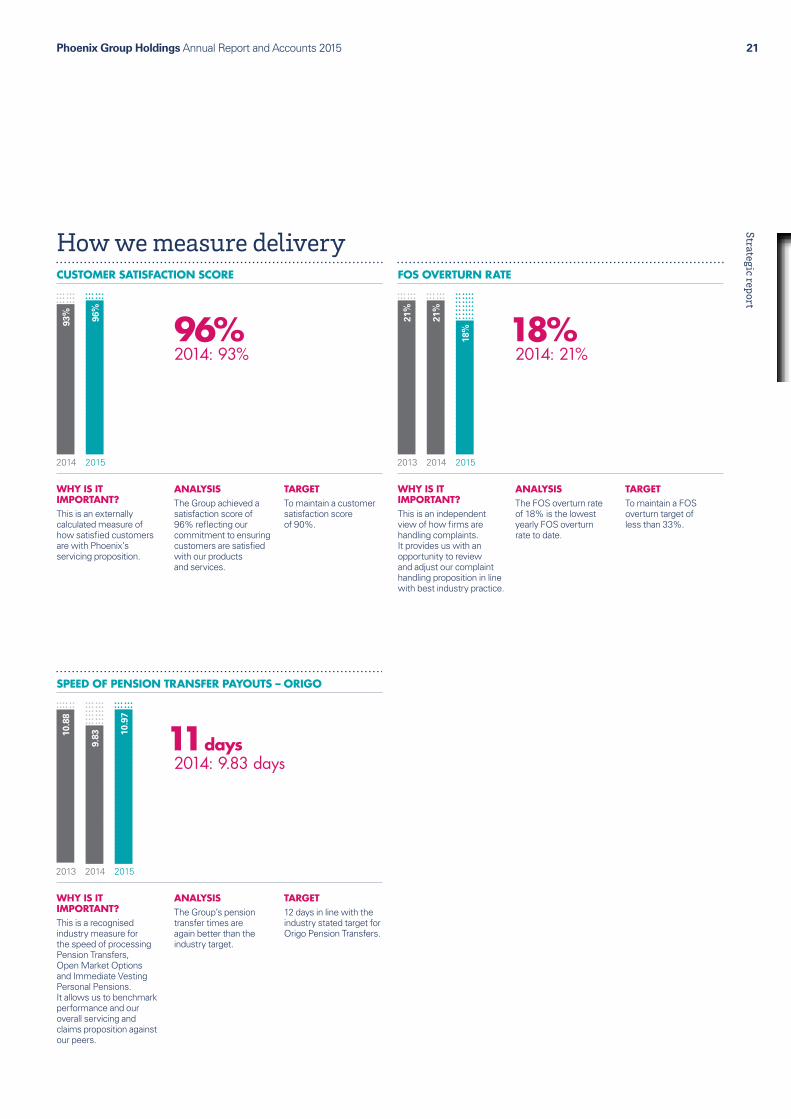
Despite all the changes implemented during the year, Phoenix Life has maintained a high level of customer service. We continue to deliver our Pensions Transfers and Open Market Options payments made through the Origo Faster Transfers system in under 11 days on average. Complaint handling is also a key area of focus and this is demonstrated by the level of overall volumes of incoming servicing complaints being only 0.3% of transactions, as well as a customer satisfaction rating of 96% for the year. With regard to the number of our decisions that are referred to and subsequently overturned by the Financial Ombudsman Service (‘FOS’), our overturn rate of 18% is the best performance recorded by Phoenix since FOS started publishing data in 2009.
The customer strategy at Phoenix Group is focused on improving customer outcomes. Security of our customer assets is foremost, followed by our aim to maximise returns wherever possible but primarily through enhanced distribution of the estate within the life funds. We delivered an additional £68 million of distributable estate through management actions, £18 million above our 2015 target, and have therefore directly benefited our with-profit policyholders through increased future bonuses.

Phoenix Group Holdings Annual Report and Accounts 2015 11Strategic report
PEOPLEPhoenix Group’s ability to attract, retain and motivate outstanding talent was, for the fourth year in succession, formally recognised in 2015 through our accreditation as one of the ‘UK’s Top Employers’. Employee engagement is essential for Phoenix Group, as retaining the actuarial and financial skills to manage closed life funds is critical for the execution of the Group’s strategy. The maintenance of our employee engagement survey result at 78% positions the Group positively against the Financial Services benchmark in 2015.
The Group’s Corporate Responsibility programme continues to be a key component of our business proposition. Employees take great personal responsibility and involve themselves in many varied initiatives. I am pleased to report that in excess of £174,000 was raised by the Group for charities in 2015. Of this, over £168,000 was donated to the Group’s main corporate charity partners – Midlands Air Ambulance Charity and London’s Air Ambulance – which has made a significant contribution to support their vital life-saving work. We very much look forward to working with the Air Ambulance charities during our third partnership year. The Group’s future Corporate Responsibility programme will continue to focus on the physical and mental wellbeing of our employees and our community programme will also play a key role in the engagement of staff, who can volunteer their time to a wide range of community projects.
2016 OUTLOOK AND PROSPECTSThe potential remains for our business to be impacted by economic headwinds and the uncertain and evolving regulatory environment. However, the Group’s financial performance during 2015 and the strength of our business model give me confidence in the resilience of the Group’s long-term cash flows and our ability to deliver value for all our stakeholders.
Now that Solvency II is in place, we have set a 2016 annual cash generation target of between £350 million and £450 million, a significant increase on 2015. We have also set a new, five year cash generation target of £2.0 billion from 2016 to 2020, matching the maturity of our revised bank facility. Furthermore, we expect a further £3.2 billion of cash generation from 2021 onwards. This is a clear demonstration of the long-term cash flow potential of the Group and how we seek to increase value over time.
We also continue to maintain robust Group solvency levels and have £706 million of cash at the holding company level, providing further support for our stable and sustainable dividend policy.
Finally, we continue to look for opportunities to simplify the Group and improve its resilience. This will include seeking to further diversify away from senior bank debt to longer-term, subordinated debt. This will allow the Group to both match its debt profile to its long-term cash flows whilst offering the opportunity to simplify the holding company structure further, reducing costs and complexity.
Following the removal of the requirement to publish Interim Management Statements, we will no longer formally release quarterly information on cash generation and the Group’s capital position. However, we will continue to ensure investors are kept properly informed on the Group’s development on a regular basis.
CONCLUSIONI believe that the impact of regulatory developments will change the landscape of the UK life insurance industry, providing Phoenix with a number of acquisition opportunities. Open life companies will reappraise their business models and strategies for their legacy policies. Following the achievement of the investment grade credit rating and continued financial delivery against our targets, the Group is well positioned to take advantage of these industry changes. I believe there are a number of potential acquisition and consolidation opportunities in the UK closed life sector and we will continue to review options within the framework of our existing commitment to stakeholders.
Irrespective of the wider ongoing challenges, our focus will remain on the continued delivery of strong organic performance across all of our key financial metrics and targets. We have consistently met or exceeded all of our public financial targets and this is a track record that we are committed to continuing.
I would like to thank my colleagues for their hard work during an exceptionally busy year. They have delivered strong financial performance, at the same time achieving a number of key milestones that have enhanced the Group’s strategic position. I look forward to capitalising on our renewed strength and firmly believe that we can continue to deliver value for all our stakeholders.
CLIVE BANNISTER GROUP CHIEF EXECUTIVE OFFICER
22 MARCH 2016
MANAGEMENT SERVICES COMPANIESProvides our life companies with all required management services
LIFE COMPANIESHold the financial assets of our policyholders
Two life companies and multiple funds
Improved services for policyholders.
OUTSOURCE PARTNERSUsed by the management services companies to provide policy administration services
Competitive advantage through scale
Scalable and efficient operating platforms
Enhanced risk and control environment.
Operational risk transfer
Synergies for future acquisitions
Cost certainty.
PHOENIX GROUP
Group strategy including mergers and acquisitions
External positioning with regulators, lenders and shareholders
Debt refinancing
GROUP FUNCTIONSManage corporate and strategic activity
Phoenix Group Holdings Annual Report and Accounts 201512
OPERATING STRUCTURE
The Phoenix Group’s operating structure is integral to its success in the closed life fund market.
GROUP FUNCTIONSThe Group functions provide services to Phoenix Life and manage corporate and strategic activity. The Group functions include Group Finance, Treasury, Group Tax, Group Actuarial, Group Risk, Legal Services, HR, Corporate Communications, Strategy and Corporate Development, Investor Relations, Company Secretariat and Internal Audit. Based both in Wythall, Birmingham and Juxon House, London, the Group is led by the Group Chief Executive Officer, Clive Bannister.
PHOENIX LIFEPhoenix Life is responsible for the management of the Group’s life funds. Its experienced and focused management team is led by its Chief Executive Officer, Andy Moss. Based in Wythall, Birmingham, it has a track record of successfully integrating life assurance businesses and has developed a leading-edge model and infrastructure into which future acquired funds can be integrated.
LIFE COMPANIES Following a series of life company consolidations, the latest of which being the transfer of the business of National Provident Life Limited into Phoenix Life Assurance Limited in the first half of 2015, the Group now has two operating UK life companies, being Phoenix Life Limited and Phoenix Life Assurance Limited. Together, they comprise 14 with-profit funds and 2 non-profit funds. The Group will examine the possible merger of the remaining two life companies in due course. The Group also completed the divestment of an Irish operating life company, Scottish Mutual International Limited (‘SMI’), in December 2015.
By bringing together separate life companies and funds, the Group’s business model is simplified, which releases capital and reduces complexity. Fund transfers enable the Group to make more efficient use of the capital in its life companies and result in administrative expense savings and increased consistency of management practices and principles across the Group.
MANAGEMENT SERVICES COMPANIESThe Group’s management services companies are charged with the efficient provision of financial and risk management services, sourcing strategies and delivering all administrative services required by the Group’s life companies. By using management services companies, the life companies benefit from price certainty and a transfer of some operational risks.
OUTSOURCE PARTNERSA key role of the management service companies is the management of relationships with the outsource partners on behalf of the life companies. As the number of policies held by the Group gradually declines over time, the fixed cost base of our operations as a proportion of policies will increase. Our management services team manages this risk by putting in place long-term arrangements for third party policy administration. By paying a fixed price per policy to our outsource partners, we reduce this fixed cost element of our operations and convert to a variable cost structure. This allows our management services companies to generate profits by managing costs efficiently.
These outsource partners have scale and common processes, often across multiple clients, which provide several benefits for the Group, including reducing investment requirements, improving the technology used within our administrative capability, and reducing our operational risk.
Specialist roles such as finance, actuarial, risk and compliance and oversight of the outsource partners are retained in-house, ensuring Phoenix Life retains full control over the core capabilities necessary to manage and integrate closed life funds.

Phoenix Group Holdings Annual Report and Accounts 2015 13Strategic report
THE MARKETPLACE
SUMMARYOverall, the potential remains for our business to be impacted by economic headwinds and the uncertain and evolving regulatory and legislative environment. Whilst the impact of these changes will change the landscape of the UK life insurance industry, it will also provide Phoenix with a number of consolidation opportunities, as open life companies are forced to reappraise their business models and strategies for their legacy policies.
The economic, regulatory, legislative and competitive landscape which the Group operates in is evolving at an unprecedented pace.
Economic landscapeWhilst the first half of 2015 showed positive investment market returns due to improving economic performance and an expectation of an eventual normalisation of monetary policy, gains seen in the first six months of the year were offset in the second half by a slowdown in the Chinese economy, falling oil prices and concerns over a potential rise in interest rates in the United States. The UK equity market index (FTSE All Share Total Return) closed 1.0% ahead of the 2014 position reflecting a relatively flat return.
Modest increases in UK gilt yields across all durations during 2015 positively impacted the Group’s IFRS results given short asset positions compared to the longer-term IFRS basis liabilities. On an MCEV basis, the increase in yields had a minor adverse impact. Credit spreads widened in the year which had a detrimental impact on the Group’s IFRS and MCEV results.
The Group’s 2015 results have also been adversely impacted by amendments to economic assumptions arising from a number of changes to asset portfolios undertaken to optimise the Group’s Solvency II capital position ahead of the implementation of the new regime.
The persistently low interest rate environment remained a challenge for the industry in 2015 but the Group has been proactive in mitigating against this by for example, matching the duration of assets and liabilities where practicable and entering into interest rate hedging arrangements where appropriate. In practice, the Group maintains a mix of fixed and variable rate instruments which it reviews regularly to ensure the overall exposure to interest rate risk is kept within the agreed profile for each fund.
Such regular monitoring is a key part of the Group’s management of its exposure to investment risks, and its importance has again been highlighted by the investment market volatility experienced in the early part of 2016.
Competitive landscapeThe Group estimates the market size of the UK closed life industry to be over £300 billion. One conclusion noted in the Pensions Institute’s independent report, titled “The Meaning of Life”, was that there will be further consolidation in the UK life sector as existing providers struggle with issues such as heightened regulatory scrutiny, increased capital requirements and shortages of skilled personnel to manage complex legacy products. Clearly, the traditional life company business model must continue to adapt and Phoenix Group has the expertise and business model in place to take advantage of this changing environment.
Regulatory and legislative landscapeThe Solvency II prudential framework which came into force on 1 January 2016, has updated, among other things, the existing EU life, non-life, reinsurance and insurance groups directives. The main aim of the framework is to protect policyholders through establishing prudential requirements better matched to the true risks of the business, taking into account other regulatory objectives of ensuring the financial stability of the insurance industry and stability of the markets.
In December 2015, the PRA approved the Group’s Internal Model Application under Solvency II which provided the Group with greater clarity and control over its future capital position. Our 2015 estimated capital position under the new Solvency II regime shows the Group to be in robust financial health.
The FCA released its thematic review of the fair treatment of long-standing customers in life insurance earlier this month. As the UK’s largest specialist closed life fund consolidator, we welcome the focus the review brings to the fair treatment of policyholders as our customers and the outcomes of their policies are fundamental to our business model.
The ending of compulsory annuitisation of pension pots and the introduction of new pension freedoms rules from 6 April 2015 has provided greater flexibility for our customers in their retirement planning but has also increased the complexity of their decision-making process. Phoenix has put in place a full product range for our customers, either provided directly or through partners, and our current experience demonstrates that our assumptions underpinning our financial planning in respect of take-up rates for vesting annuities remain appropriate.
There are also a number of ongoing reviews, including the recently announced FCA consultation on early exit charges and we will work closely with the FCA as part of their consultation on the implementation of an appropriate cap on exit charges.
Phoenix Group Holdings Annual Report and Accounts 201514
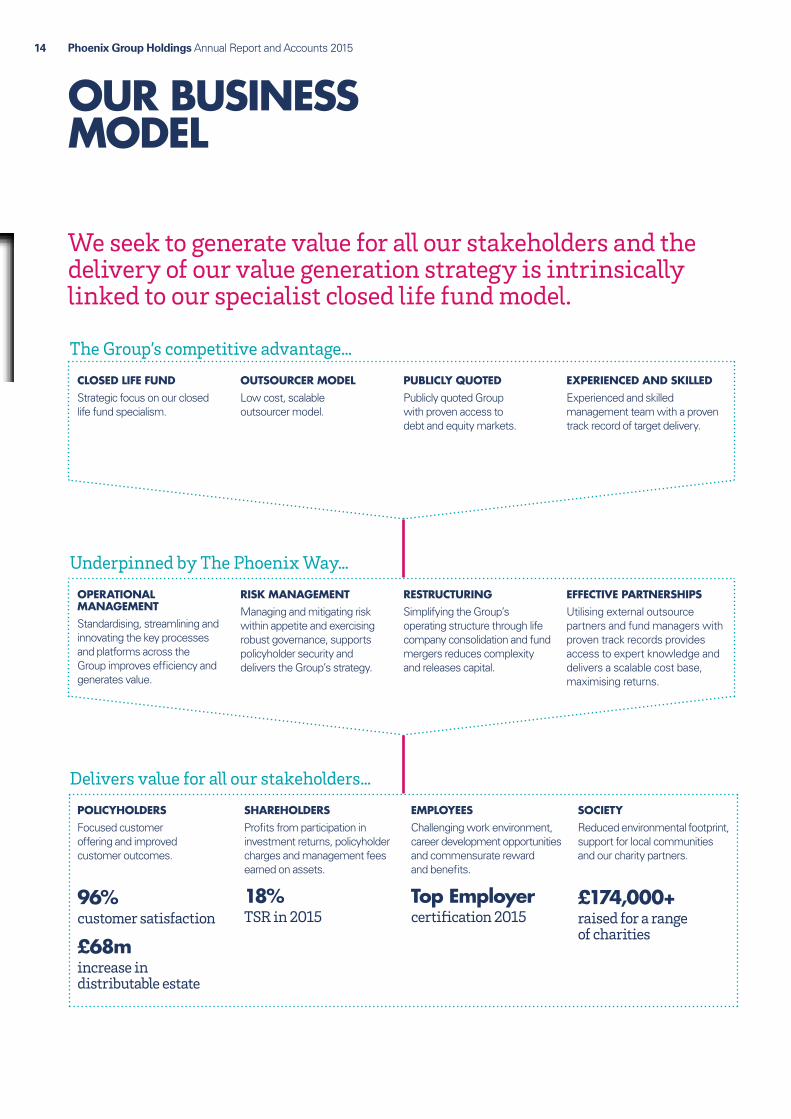
OUR BUSINESS MODEL
We seek to generate value for all our stakeholders and the delivery of our value generation strategy is intrinsically linked to our specialist closed life fund model.
Underpinned by The Phoenix Way…
OPERATIONAL MANAGEMENTStandardising, streamlining and innovating the key processes and platforms across the Group improves efficiency and generates value.
RISK MANAGEMENTManaging and mitigating risk within appetite and exercising robust governance, supports policyholder security and delivers the Group’s strategy.
RESTRUCTURINGSimplifying the Group’s operating structure through life company consolidation and fund mergers reduces complexity and releases capital.
EFFECTIVE PARTNERSHIPSUtilising external outsource partners and fund managers with proven track records provides access to expert knowledge and delivers a scalable cost base, maximising returns.
Delivers value for all our stakeholders…
POLICYHOLDERSFocused customer offering and improved customer outcomes.
96% customer satisfaction
£68m increase in distributable estate
SHAREHOLDERSProfits from participation in investment returns, policyholder charges and management fees earned on assets.
18% TSR in 2015
EMPLOYEESChallenging work environment, career development opportunities and commensurate reward and benefits.
Top Employer certification 2015
SOCIETYReduced environmental footprint, support for local communities and our charity partners.
£174,000+ raised for a range of charities
The Group’s competitive advantage…
CLOSED LIFE FUNDStrategic focus on our closed life fund specialism.
OUTSOURCER MODELLow cost, scalable outsourcer model.
PUBLICLY QUOTEDPublicly quoted Group with proven access to debt and equity markets.
EXPERIENCED AND SKILLEDExperienced and skilled management team with a proven track record of target delivery.

Phoenix Group Holdings Annual Report and Accounts 2015 15Strategic report
VALUE GENERATION
PHOENIX GROUP’S ACQUISITION STRATEGYPhoenix Group is well placed to find solutions for a range of sellers of life insurance businesses due to the Group’s flexible approach to acquisitions, in particular the Group’s appetite to acquire either life companies, funds or portfolios of businesses, and all product types across the with-profit, non-profit and unit-linked spectrums.
The UK life insurance sector is evolving and we believe the changing environment may result in sellers looking to dispose of various portions of their business. We are able to be flexible about the size and structure of any acquisition, which should provide us with a variety of opportunities.
Phoenix Group will assess potential acquisitions in light of the financial condition of the Group. The criteria we would target in making an acquisition are:
Ɛ Closed life. Any acquisition would focus on the closed life fund sector within the UK
Ɛ Value accretive
Ɛ Help to sustain dividends
Ɛ Gearing level supportive of an investment grade rating.
VALUE GENERATION THROUGH ACQUISITION AND CONSOLIDATION
Ɛ When a life company makes an acquisition, part of the purchase price represents the value of the insurance contracts which are anticipated to be released over a period of time.
Ɛ This Value in Force (‘VIF’) is the present value of future profits expected on the acquired portfolio.
Ɛ Cash flow is generated from the emergence of VIF into free surplus and the release of capital as the risk profile reduces over time.
Ɛ Phoenix can increase the value of the VIF and/or accelerate the release of capital through a variety of management actions. It can also further replenish VIF and cash flows through future acquisitions and the extraction of synergies.
As a standalone business and in the absence of further acquisitions which meet our target criterion, Phoenix is expected to continue to generate strong and predictable cash flows from the operating companies to support commitments at the holding companies including pension scheme contributions, debt servicing and shareholder dividends. However, in order to grow and maximise value for all stakeholders, we will continue to pursue opportunities which meet the criteria set out above as and when they arise.
VALUE GENERATION THROUGH MANAGEMENT ACTIONSManagement actions are one of the key areas of focus for Phoenix Life and another key source of value generation.
The Phoenix Way, which includes activities related to operational management, risk management, restructuring and effective partnerships, is the methodology used to deliver this value. Some actions which the Group has delivered in the past including funds mergers and the consolidation of our actuarial modelling into one platform, have not only generated value but led to significant improvements in the operations of our business.
Value from acquisitions combined with our ability to add value through management actions, are fundamental drivers of shareholder value accretion.
Phoenix Group’s value generation modelPotential value and source of cash acceleration and value generation will vary depending on specific target or management action
Internal sources/equity financing
Net economic value
Debt financing
Debt
Gearing level to support investment grade rating
VALUE CREATION THROUGH MANAGEMENT ACTIONS
Pre-acquisition economic value
Acquisition Operational management
Risk management
Restructuring Effective partnerships
Post-acquisition economic value
01 02
04 03
Phoenix Group Holdings Annual Report and Accounts 201516
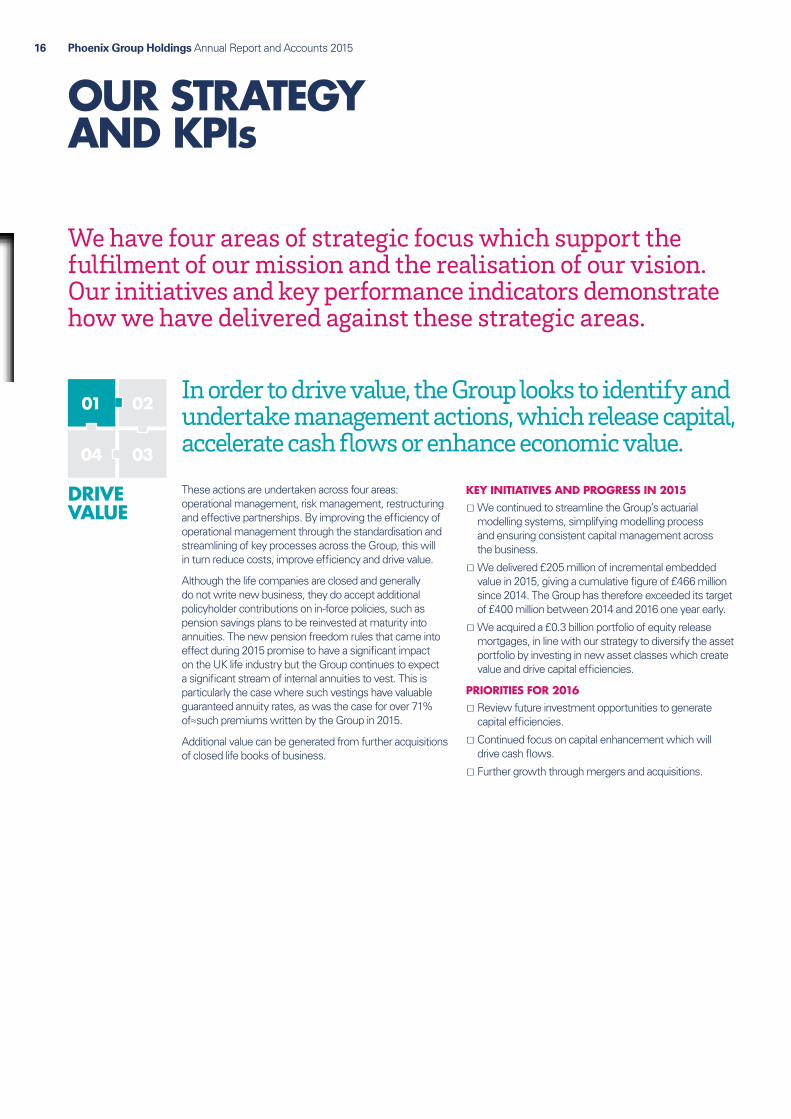
OUR STRATEGY AND KPIs
We have four areas of strategic focus which support the fulfilment of our mission and the realisation of our vision. Our initiatives and key performance indicators demonstrate how we have delivered against these strategic areas.
DRIVE VALUE
In order to drive value, the Group looks to identify and undertake management actions, which release capital, accelerate cash flows or enhance economic value.
These actions are undertaken across four areas: operational management, risk management, restructuring and effective partnerships. By improving the efficiency of operational management through the standardisation and streamlining of key processes across the Group, this will in turn reduce costs, improve efficiency and drive value.
Although the life companies are closed and generally do not write new business, they do accept additional policyholder contributions on in-force policies, such as pension savings plans to be reinvested at maturity into annuities. The new pension freedom rules that came into effect during 2015 promise to have a significant impact on the UK life industry but the Group continues to expect a significant stream of internal annuities to vest. This is particularly the case where such vestings have valuable guaranteed annuity rates, as was the case for over 71% of≈such premiums written by the Group in 2015.
Additional value can be generated from further acquisitions of closed life books of business.
KEY INITIATIVES AND PROGRESS IN 2015 Ɛ We continued to streamline the Group’s actuarial modelling systems, simplifying modelling process and ensuring consistent capital management across the business.
Ɛ We delivered £205 million of incremental embedded value in 2015, giving a cumulative figure of £466 million since 2014. The Group has therefore exceeded its target of £400 million between 2014 and 2016 one year early.
Ɛ We acquired a £0.3 billion portfolio of equity release mortgages, in line with our strategy to diversify the asset portfolio by investing in new asset classes which create value and drive capital efficiencies.
PRIORITIES FOR 2016 Ɛ Review future investment opportunities to generate capital efficiencies.
Ɛ Continued focus on capital enhancement which will drive cash flows.
Ɛ Further growth through mergers and acquisitions.

Phoenix Group Holdings Annual Report and Accounts 2015 17Strategic report
2011 2012 2013 2014 2015
OPERATING COMPANIES’ CASH GENERATION
810
690
817
567
225
2011 2012 2013 2014 2015
IFRS OPERATING PROFIT
387
429
439
483
324
2011 2012 2013 2014 2015
2,11
8
2,12
2 2,37
8 2,64
7
2,51
3
GROUP MCEV
Read more about cash generation
24 Read more about IFRS operating profit
26
Read more about Group MCEV
29
WHY IS IT IMPORTANT?Maintaining strong cash flow delivery underpins debt servicing and repayment as well as shareholder dividends.
ANALYSISWith cash generation of £225 million, the Group met its full year cash generation target for 2015 of £200 million to £250 million.
Cash remitted reflects free surplus within the life companies and the benefit of management actions implemented in the period. The reduction from the prior period reflects the retention of capital in the life companies in advance of the transition to the new Solvency II capital regime.
ANALYSISGroup IFRS operating profit has decreased by £159 million to £324 million principally due to the lower impact of management actions compared to the previous period.
TARGETTo generate cash flows of £2 billion between 2016 and 2020, of which £350 million to £450 million to be generated in 2016.
WHY IS IT IMPORTANT?MCEV has provided a consistent means of assessing our ability to increase value through the delivery of incremental management actions.
Following the implementation of Solvency II, this is the last time we will report MCEV.
ANALYSISWith cumulative incremental embedded value from management actions of £466 million, the Group has exceeded the cumulative incremental embedded value target of £400 million from 2014 – 2016.
The reduction of Group MCEV from the prior period primarily reflects dividend and financing costs, the adverse impacts of economic conditions and changes in asset portfolios ahead of Solvency II implementation, partly offset by management actions.
WHY IS IT IMPORTANT?Group IFRS operating profit is considered a more representative measure of performance than Group IFRS profit before tax as it provides long-term performance information unaffected by short-term economic volatility.
How we measure delivery
£225m2014: £567m
£2,513m2014: £2,647m
£324m2014: £483m
Phoenix Group Holdings Annual Report and Accounts 201518
OUR STRATEGY AND KPIsContinued
01 02
04 03
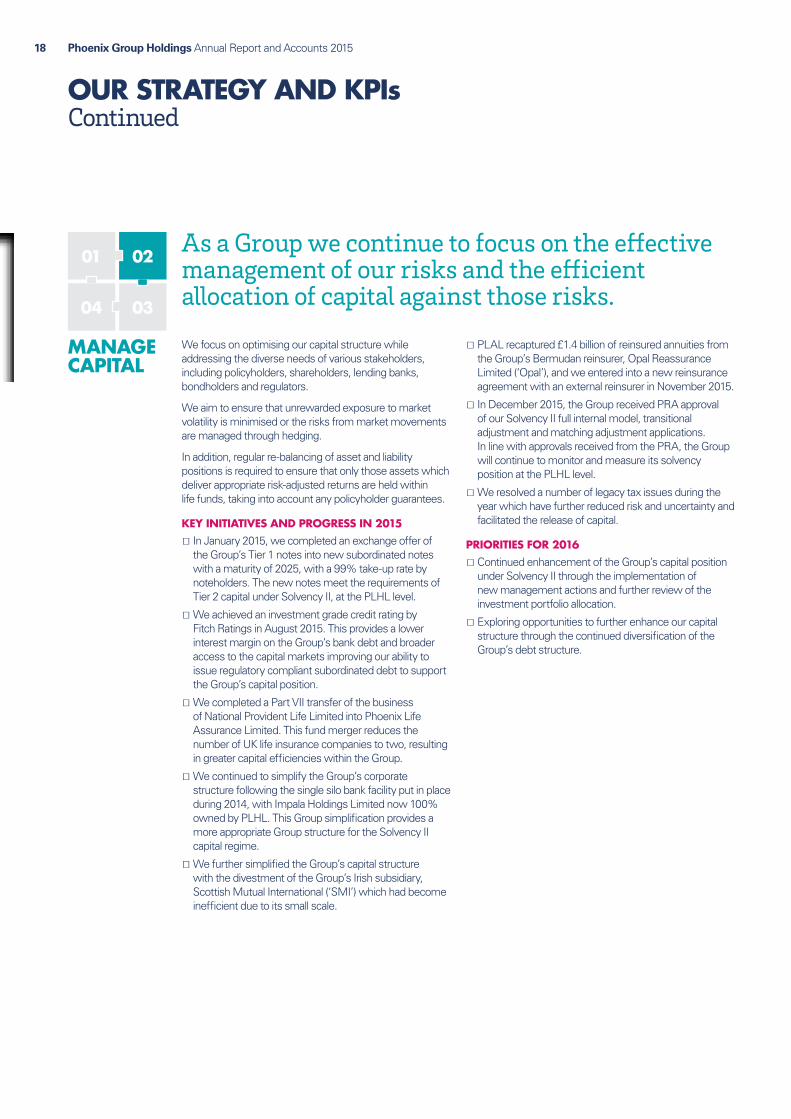
MANAGE CAPITAL
We focus on optimising our capital structure while addressing the diverse needs of various stakeholders, including policyholders, shareholders, lending banks, bondholders and regulators.
We aim to ensure that unrewarded exposure to market volatility is minimised or the risks from market movements are managed through hedging.
In addition, regular re-balancing of asset and liability positions is required to ensure that only those assets which deliver appropriate risk-adjusted returns are held within life funds, taking into account any policyholder guarantees.
KEY INITIATIVES AND PROGRESS IN 2015 Ɛ In January 2015, we completed an exchange offer of the Group’s Tier 1 notes into new subordinated notes with a maturity of 2025, with a 99% take-up rate by noteholders. The new notes meet the requirements of Tier 2 capital under Solvency II, at the PLHL level.
Ɛ We achieved an investment grade credit rating by Fitch Ratings in August 2015. This provides a lower interest margin on the Group’s bank debt and broader access to the capital markets improving our ability to issue regulatory compliant subordinated debt to support the Group’s capital position.
Ɛ We completed a Part VII transfer of the business of National Provident Life Limited into Phoenix Life Assurance Limited. This fund merger reduces the number of UK life insurance companies to two, resulting in greater capital efficiencies within the Group.
Ɛ We continued to simplify the Group’s corporate structure following the single silo bank facility put in place during 2014, with Impala Holdings Limited now 100% owned by PLHL. This Group simplification provides a more appropriate Group structure for the Solvency II capital regime.
Ɛ We further simplified the Group’s capital structure with the divestment of the Group’s Irish subsidiary, Scottish Mutual International (‘SMI’) which had become inefficient due to its small scale.
Ɛ PLAL recaptured £1.4 billion of reinsured annuities from the Group’s Bermudan reinsurer, Opal Reassurance Limited (‘Opal’), and we entered into a new reinsurance agreement with an external reinsurer in November 2015.
Ɛ In December 2015, the Group received PRA approval of our Solvency II full internal model, transitional adjustment and matching adjustment applications. In line with approvals received from the PRA, the Group will continue to monitor and measure its solvency position at the PLHL level.
Ɛ We resolved a number of legacy tax issues during the year which have further reduced risk and uncertainty and facilitated the release of capital.
PRIORITIES FOR 2016 Ɛ Continued enhancement of the Group’s capital position under Solvency II through the implementation of new management actions and further review of the investment portfolio allocation.
Ɛ Exploring opportunities to further enhance our capital structure through the continued diversification of the Group’s debt structure.
As a Group we continue to focus on the effective management of our risks and the efficient allocation of capital against those risks.
Phoenix Group Holdings Annual Report and Accounts 2015 19Strategic report
2014 2015
SOLVENCY II SURPLUS (ESTIMATED)
1.3
2011 2012 2013 2014 2015
1.3 1.
4
1.2
1.2
1.5
IGD SURPLUS (ESTIMATED)
2011 2012 2013 2014 2015
62.3
%
59.7
%
49.6
%
39.3
%
37.8
%
FINANCIAL LEVERAGE
2012 2013 2014 2015
1.0
1.2
0.7
0.6
PLHL ICA SURPLUS (ESTIMATED)
How we measure delivery
WHY IS IT IMPORTANT?The Solvency II surplus is the regulatory assessment of capital adequacy at the PLHL level, implemented on 1 January 2016.
WHY IS IT IMPORTANT?The Pillar I regulatory assessment of capital adequacy at the PLHL level until 31 December 2015. Again, this measure is replaced by the Solvency II surplus from 1 January 2016.
WHY IS IT IMPORTANT?The ratio provides an indicator of the Group’s financial strength as it measures the level of debt as a percentage of the Group’s gross MCEV. Following achievement of the investment grade credit rating and the discontinuance of MCEV reporting, this is the last time we will report financial leverage.
WHY IS IT IMPORTANT?The PLHL Group’s measure of capital adequacy on an economic basis until 31 December 2015. This measure is replaced by the Solvency II surplus from 1 January 2016.
£1.3bn £0.6bn2014: £0.7bn
£1.5bn2014: £1.2bn
37.8%2014: 39.3%
Read more about Solvency II
32
Read more about IGD surplus
31
Read more about PLHL ICA surplus
31
Read more about financial leverage
33
ANALYSISOur opening Solvency II surplus of £1.3 billion represents a robust and resilient capital position.
ANALYSISIGD surplus increased to £1.5 billion at 31 December 2015 mainly reflecting simplification of the Group’s corporate structure, with Impala Holdings Limited now 100% owned by PLHL.
ANALYSISFinancial leverage decreased to 37.8% at 31 December 2015 reflecting repayments of £190 million made in respect of the PGH Capital facility during the period.
ANALYSISThe PLHL ICA surplus decreased during the period as capital generation items, including management actions, were offset by dividend payments, debt financing and repayments and the adverse impact of management actions undertaken to enhance the Solvency II position.

01 02
04 03
Phoenix Group Holdings Annual Report and Accounts 201520
OUR STRATEGY AND KPIsContinued
Improving customer outcomes is central to our vision of being the saver-friendly ‘industry solution’ for closed life funds.
We have six key areas of focus related to our customer offering:
Ɛ Security: ensuring all policy promises and guarantees are delivered.
Ɛ Improving value and effective with-profits fund run-off: through accelerating estate distribution where possible and providing appropriate investment exposure.
Ɛ Effective service delivery: using our outsourced model to leverage expertise and ensure costs run off in line with policy volumes.
Ɛ Clear and effective communication: recognising the importance of clarity and simplicity for what can be complex products.
Ɛ Product governance: including a rolling review of our products to ensure they continue to deliver appropriate outcomes for our customers.
Ɛ Customer journey: improving customer experience wherever possible.
KEY INITIATIVES AND PROGRESS IN 2015 Ɛ We completed an enormous amount of work to implement the new pension freedom rules introduced by the Government. Our customers now have access to all of the new freedoms either within Phoenix Life or via one of our specialist partners.
Ɛ In March we established an Independent Governance Committee (‘IGC’) charged with overseeing the fair treatment of our customers in workplace pensions arrangements. During the course of the year, we have worked with the IGC to understand where those customers are at risk of receiving poor value from their products and formulated proposals seeking to address those areas.
Ɛ We have again achieved a positive customer satisfaction score based on the results of the satisfaction survey managed by Ipsos MORI (an external research firm). Customers surveyed were asked to give a satisfaction rating of between 1 and 5 to a number of questions asked (with a rating of 3 or above regarded as satisfied) and 96% was the percentage of all questions scoring a rating of 3 or above.
Ɛ Our Financial Ombudsman Service (‘FOS’) overturn rate was the lowest yearly overturn rate to date. The FOS overturn rate is the percentage of resolved cases where the FOS, upon reviewing a complaint, make a change to our original decision in favour of the customer.
Ɛ We beat the industry target related to the speed of pension transfer payouts in 2015. This is measured in the time in calendar days taken from when a transfer request is put on Origo (an electronic pension transfer system) to when the transfer is cleared and the receiving scheme receives the money in its bank account.
PRIORITIES FOR 2016 Ɛ Make ongoing improvements to customer outcomes, with a particular focus on strengthening communications with our customers.
Ɛ Continue to take actions to support customers as they approach retirement age, so that they are able to make fully informed decisions at the right time.
Ɛ Enhancement of our website, to encourage customer engagement with the products they hold with Phoenix.
Ɛ Ensure our products continue to deliver appropriate outcomes for our customers.
IMPROVE CUSTOMER OUTCOMES
Phoenix Group Holdings Annual Report and Accounts 2015 21Strategic report
2014 2015
93%
96%
CUSTOMER SATISFACTION SCORE
2013 2014 2015
21%
21%
18%
FOS OVERTURN RATE
2013 2014 2015
10.8
8
9.83 10
.97
SPEED OF PENSION TRANSFER PAYOUTS – ORIGO
How we measure delivery
96%2014: 93%
11 days2014: 9.83 days
18%2014: 21%
WHY IS IT IMPORTANT?This is an externally calculated measure of how satisfied customers are with Phoenix’s servicing proposition.
WHY IS IT IMPORTANT?This is an independent view of how firms are handling complaints. It provides us with an opportunity to review and adjust our complaint handling proposition in line with best industry practice.
WHY IS IT IMPORTANT?This is a recognised industry measure for the speed of processing Pension Transfers, Open Market Options and Immediate Vesting Personal Pensions. It allows us to benchmark performance and our overall servicing and claims proposition against our peers.
ANALYSISThe Group achieved a satisfaction score of 96% reflecting our commitment to ensuring customers are satisfied with our products and services.
ANALYSISThe FOS overturn rate of 18% is the lowest yearly FOS overturn rate to date.
ANALYSISThe Group’s pension transfer times are again better than the industry target.
TARGETTo maintain a customer satisfaction score of 90%.
TARGETTo maintain a FOS overturn target of less than 33%.
TARGET12 days in line with the industry stated target for Origo Pension Transfers.

Phoenix Group Holdings Annual Report and Accounts 201522
OUR STRATEGY AND KPIsContinued
01 02
04 03
Ensuring our workforce is engaged is central to the success of the Group. In 2015, we maintained our focus on ensuring our people were challenged, motivated and rewarded through opportunities for growth, both professionally and personally. For the fourth consecutive year, we were listed as one of the UK’s Top Employers, an accreditation awarded to the best companies to work for in the UK. We also achieved fourth place in the mid-sized category in Britain’s Healthiest Workplace (a benchmark in association with Pru Health, Mercer and The Telegraph).
We maintained an employee engagement index of 78%. This index is an aggregation of scores against a number of questions considered the most important for staff engagement and was completed by 88% of employees.
KEY INITIATIVES AND PROGRESS IN 2015 Ɛ We continued to grow our development offering for all employees with an increased emphasis on management and leadership development.
Ɛ The first cohort of our Open University Executive Education programme successfully completed 90-day business challenges. Set by our Executive Committee, the challenges delivered genuine business improvements as a result of delegates’ learning.
Ɛ We continued to build partnerships with prestigious business schools, including Ashridge and the London Business School, and a number of our most senior employees attended development programmes with them.
Ɛ Over 1,000 learning requests were supported by the Group which included professional qualifications, coaching and continuing professional development.
Ɛ Our Corporate Responsibility agenda played a key part in the engagement of our people and in 2015, we expanded our community programme to provide opportunities for teamwork and leadership development.
Ɛ Our employees contributed a total of 1,942 volunteering hours to charity and community projects.
Ɛ Staff-led fundraising activity during 2015 raised a total of over £174,000 for both our corporate partners and for other charities. Employees elected to extend our corporate charity partnership with Midlands Air Ambulance Charity and London’s Air Ambulance for a further two years and, during the first two years of the extended partnership, we have raised over £402,000.
PRIORITIES FOR 2016 Ɛ Continue to attract and retain the very best talent by focusing on developing our people and strengthening our internal succession pipeline through targeted management and leadership development intervention, with particular emphasis on increasing the number of high-potential female managers undertaking formal management development activity.
Ɛ Build upon our efforts to support the physical and mental wellbeing of our employees.
Ɛ Maintain support to our communities through employee volunteering, fundraising and engagement with community projects.
ENGAGE PEOPLE
Go online for the Group’s full Corporate Responsibility Reportwww.thephoenixgroup.com/CRreport2015

Phoenix Group Holdings Annual Report and Accounts 2015 23Strategic report
2011 2012 2013 2014 2015
74%
73% 76
%
78%
78%
EMPLOYEE ENGAGEMENT INDEX
78%2014: 78%
How we measure delivery
WHY IS IT IMPORTANT?We aim to ensure employees understand the purpose of their role and feel that their contribution is valued. The index provides an indicator of how well we are performing against these aims.
ANALYSISThe group maintained its employee engagement index at 78%.
TARGETTo maintain an employee engagement index above 72%.
DIVERSITYWe are committed to all forms of diversity and want to see greater equality of opportunity for all our employees. A key focus for 2016 will be to progress actions aimed, over time, at increasing the number of females in senior positions.
Key employee metrics and diversity statistics are summarised below.
2015 2014
Total workforce 741 748
Male 433 424
Female 308 324
Directors (includes Non‑Executive Directors) 10 10
Male 8 8
Female 2 2
Senior Managers 8 8
Male 7 7
Female 1 1
Workforce that is of Black, Asian or Minority Ethnic background 115 107
Phoenix Group Holdings Annual Report and Accounts 201524
FINANCIAL PERFORMANCECash generation
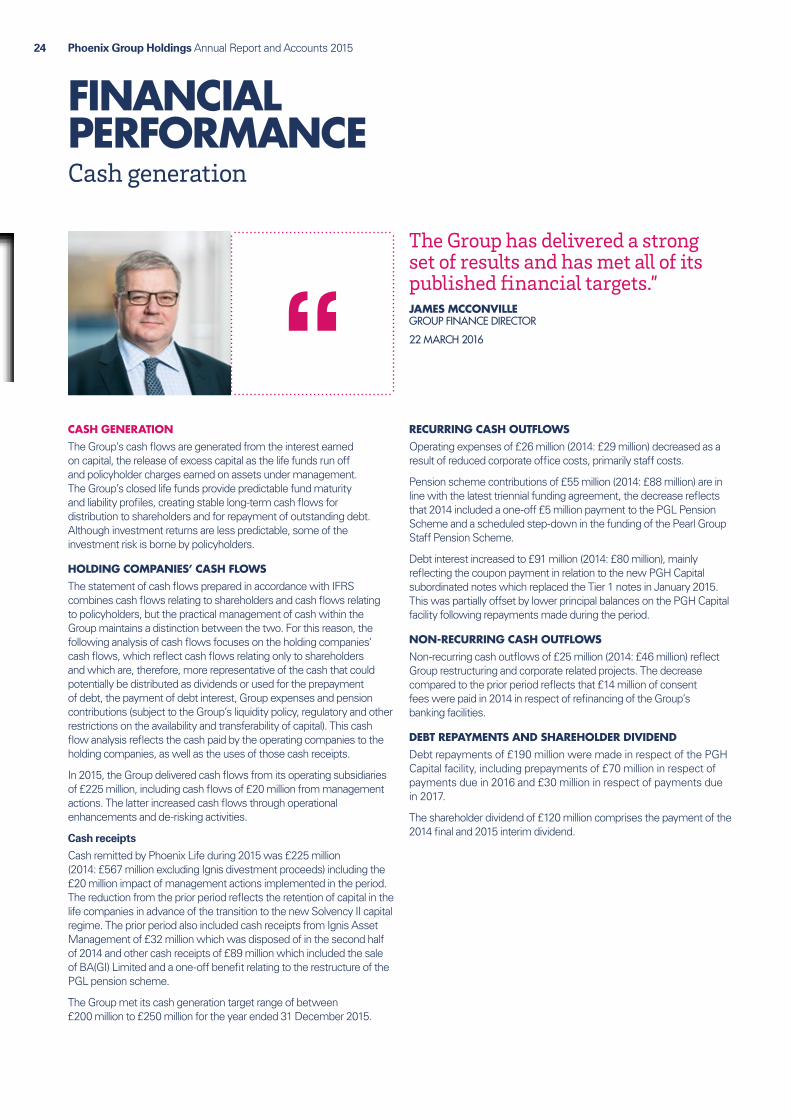
The Group has delivered a strong set of results and has met all of its published financial targets.”JAMES MCCONVILLE GROUP FINANCE DIRECTOR
22 MARCH 2016
CASH GENERATIONThe Group’s cash flows are generated from the interest earned on capital, the release of excess capital as the life funds run off and policyholder charges earned on assets under management. The Group’s closed life funds provide predictable fund maturity and liability profiles, creating stable long-term cash flows for distribution to shareholders and for repayment of outstanding debt. Although investment returns are less predictable, some of the investment risk is borne by policyholders.
HOLDING COMPANIES’ CASH FLOWSThe statement of cash flows prepared in accordance with IFRS combines cash flows relating to shareholders and cash flows relating to policyholders, but the practical management of cash within the Group maintains a distinction between the two. For this reason, the following analysis of cash flows focuses on the holding companies’ cash flows, which reflect cash flows relating only to shareholders and which are, therefore, more representative of the cash that could potentially be distributed as dividends or used for the prepayment of debt, the payment of debt interest, Group expenses and pension contributions (subject to the Group’s liquidity policy, regulatory and other restrictions on the availability and transferability of capital). This cash flow analysis reflects the cash paid by the operating companies to the holding companies, as well as the uses of those cash receipts.
In 2015, the Group delivered cash flows from its operating subsidiaries of £225 million, including cash flows of £20 million from management actions. The latter increased cash flows through operational enhancements and de-risking activities.
Cash receipts
Cash remitted by Phoenix Life during 2015 was £225 million (2014: £567 million excluding Ignis divestment proceeds) including the £20 million impact of management actions implemented in the period. The reduction from the prior period reflects the retention of capital in the life companies in advance of the transition to the new Solvency II capital regime. The prior period also included cash receipts from Ignis Asset Management of £32 million which was disposed of in the second half of 2014 and other cash receipts of £89 million which included the sale of BA(GI) Limited and a one-off benefit relating to the restructure of the PGL pension scheme.
The Group met its cash generation target range of between £200 million to £250 million for the year ended 31 December 2015.
RECURRING CASH OUTFLOWSOperating expenses of £26 million (2014: £29 million) decreased as a result of reduced corporate office costs, primarily staff costs.
Pension scheme contributions of £55 million (2014: £88 million) are in line with the latest triennial funding agreement, the decrease reflects that 2014 included a one-off £5 million payment to the PGL Pension Scheme and a scheduled step-down in the funding of the Pearl Group Staff Pension Scheme.
Debt interest increased to £91 million (2014: £80 million), mainly reflecting the coupon payment in relation to the new PGH Capital subordinated notes which replaced the Tier 1 notes in January 2015. This was partially offset by lower principal balances on the PGH Capital facility following repayments made during the period.
NON-RECURRING CASH OUTFLOWSNon-recurring cash outflows of £25 million (2014: £46 million) reflect Group restructuring and corporate related projects. The decrease compared to the prior period reflects that £14 million of consent fees were paid in 2014 in respect of refinancing of the Group’s banking facilities.
DEBT REPAYMENTS AND SHAREHOLDER DIVIDENDDebt repayments of £190 million were made in respect of the PGH Capital facility, including prepayments of £70 million in respect of payments due in 2016 and £30 million in respect of payments due in 2017.
The shareholder dividend of £120 million comprises the payment of the 2014 final and 2015 interim dividend.
Phoenix Group Holdings Annual Report and Accounts 2015 25Strategic report
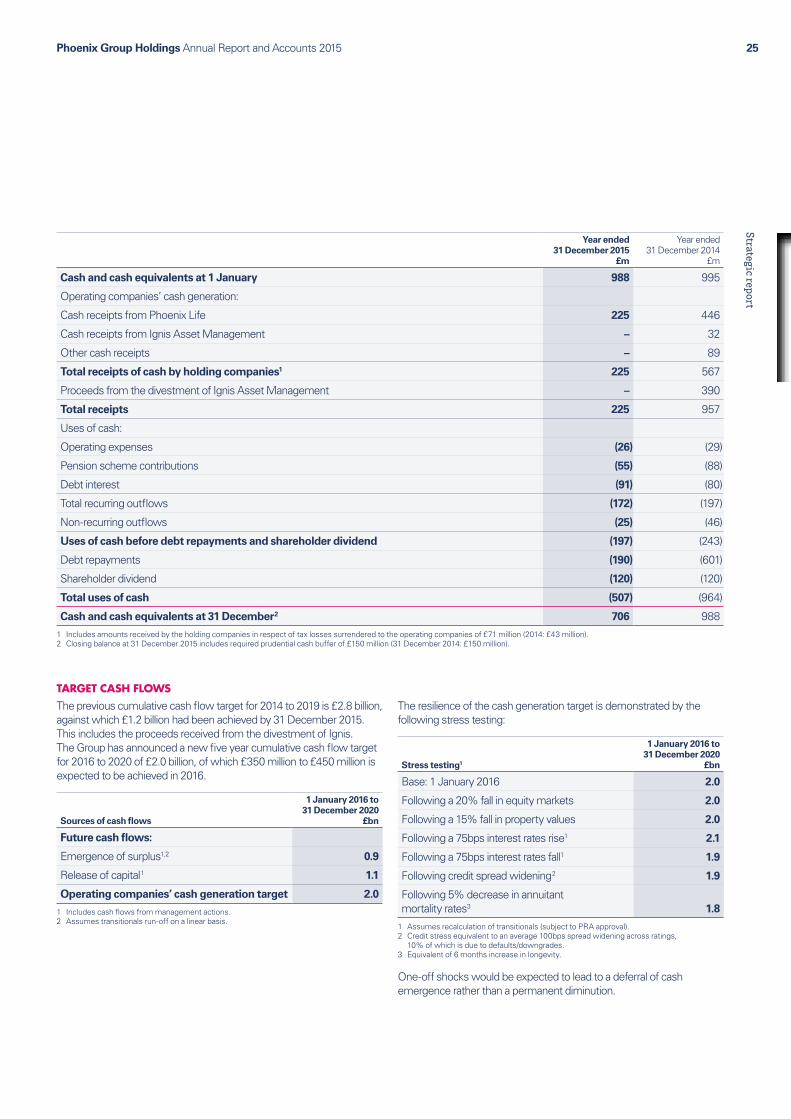
Year ended 31 December 2015
£m
Year ended31 December 2014
£m
Cash and cash equivalents at 1 January 988 995
Operating companies’ cash generation:
Cash receipts from Phoenix Life 225 446
Cash receipts from Ignis Asset Management – 32
Other cash receipts – 89
Total receipts of cash by holding companies1 225 567
Proceeds from the divestment of Ignis Asset Management – 390
Total receipts 225 957
Uses of cash:
Operating expenses (26) (29)
Pension scheme contributions (55) (88)
Debt interest (91) (80)
Total recurring outflows (172) (197)
Non-recurring outflows (25) (46)
Uses of cash before debt repayments and shareholder dividend (197) (243)
Debt repayments (190) (601)
Shareholder dividend (120) (120)
Total uses of cash (507) (964)
Cash and cash equivalents at 31 December 2 706 9881 Includes amounts received by the holding companies in respect of tax losses surrendered to the operating companies of £71 million (2014: £43 million).2 Closing balance at 31 December 2015 includes required prudential cash buffer of £150 million (31 December 2014: £150 million).
TARGET CASH FLOWSThe previous cumulative cash flow target for 2014 to 2019 is £2.8 billion, against which £1.2 billion had been achieved by 31 December 2015. This includes the proceeds received from the divestment of Ignis. The Group has announced a new five year cumulative cash flow target for 2016 to 2020 of £2.0 billion, of which £350 million to £450 million is expected to be achieved in 2016.
Sources of cash flows
1 January 2016 to 31 December 2020
£bn
Future cash flows:
Emergence of surplus 1,2 0.9
Release of capital 1 1.1
Operating companies’ cash generation target 2.0
1 Includes cash flows from management actions.2 Assumes transitionals run-off on a linear basis.
The resilience of the cash generation target is demonstrated by the following stress testing:
Stress testing1
1 January 2016 to 31 December 2020
£bn
Base: 1 January 2016 2.0
Following a 20% fall in equity markets 2.0
Following a 15% fall in property values 2.0
Following a 75bps interest rates rise 1 2.1
Following a 75bps interest rates fall 1 1.9
Following credit spread widening 2 1.9
Following 5% decrease in annuitant mortality rates3 1.8
1 Assumes recalculation of transitionals (subject to PRA approval).2 Credit stress equivalent to an average 100bps spread widening across ratings,
10% of which is due to defaults/downgrades.3 Equivalent of 6 months increase in longevity.
One-off shocks would be expected to lead to a deferral of cash emergence rather than a permanent diminution.
Phoenix Group Holdings Annual Report and Accounts 201526
FINANCIAL PERFORMANCEGroup IFRS
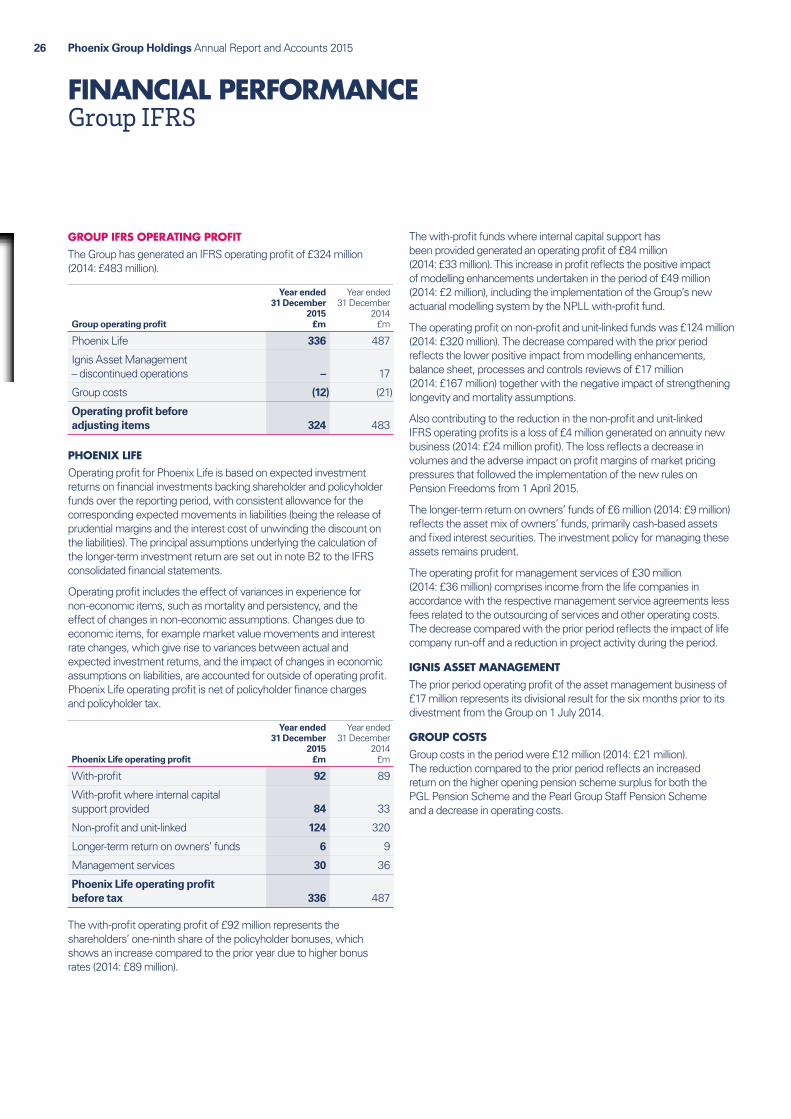
GROUP IFRS OPERATING PROFITThe Group has generated an IFRS operating profit of £324 million (2014: £483 million).
Group operating profit
Year ended 31 December
2015 £m
Year ended31 December
2014 £m
Phoenix Life 336 487
Ignis Asset Management – discontinued operations – 17
Group costs (12) (21)
Operating profit before adjusting items 324 483
PHOENIX LIFEOperating profit for Phoenix Life is based on expected investment returns on financial investments backing shareholder and policyholder funds over the reporting period, with consistent allowance for the corresponding expected movements in liabilities (being the release of prudential margins and the interest cost of unwinding the discount on the liabilities). The principal assumptions underlying the calculation of the longer-term investment return are set out in note B2 to the IFRS consolidated financial statements.
Operating profit includes the effect of variances in experience for non-economic items, such as mortality and persistency, and the effect of changes in non-economic assumptions. Changes due to economic items, for example market value movements and interest rate changes, which give rise to variances between actual and expected investment returns, and the impact of changes in economic assumptions on liabilities, are accounted for outside of operating profit. Phoenix Life operating profit is net of policyholder finance charges and policyholder tax.
Phoenix Life operating profit
Year ended 31 December
2015 £m
Year ended31 December
2014 £m
With-profit 92 89
With-profit where internal capital support provided 84 33
Non-profit and unit-linked 124 320
Longer-term return on owners’ funds 6 9
Management services 30 36
Phoenix Life operating profit before tax 336 487
The with-profit operating profit of £92 million represents the shareholders’ one-ninth share of the policyholder bonuses, which shows an increase compared to the prior year due to higher bonus rates (2014: £89 million).
The with-profit funds where internal capital support has been provided generated an operating profit of £84 million (2014: £33 million). This increase in profit reflects the positive impact of modelling enhancements undertaken in the period of £49 million (2014: £2 million), including the implementation of the Group’s new actuarial modelling system by the NPLL with-profit fund.
The operating profit on non-profit and unit-linked funds was £124 million (2014: £320 million). The decrease compared with the prior period reflects the lower positive impact from modelling enhancements, balance sheet, processes and controls reviews of £17 million (2014: £167 million) together with the negative impact of strengthening longevity and mortality assumptions.
Also contributing to the reduction in the non-profit and unit-linked IFRS operating profits is a loss of £4 million generated on annuity new business (2014: £24 million profit). The loss reflects a decrease in volumes and the adverse impact on profit margins of market pricing pressures that followed the implementation of the new rules on Pension Freedoms from 1 April 2015.
The longer-term return on owners’ funds of £6 million (2014: £9 million) reflects the asset mix of owners’ funds, primarily cash-based assets and fixed interest securities. The investment policy for managing these assets remains prudent.
The operating profit for management services of £30 million (2014: £36 million) comprises income from the life companies in accordance with the respective management service agreements less fees related to the outsourcing of services and other operating costs. The decrease compared with the prior period reflects the impact of life company run-off and a reduction in project activity during the period.
IGNIS ASSET MANAGEMENTThe prior period operating profit of the asset management business of £17 million represents its divisional result for the six months prior to its divestment from the Group on 1 July 2014.
GROUP COSTSGroup costs in the period were £12 million (2014: £21 million). The reduction compared to the prior period reflects an increased return on the higher opening pension scheme surplus for both the PGL Pension Scheme and the Pearl Group Staff Pension Scheme and a decrease in operating costs.
Phoenix Group Holdings Annual Report and Accounts 2015 27Strategic report
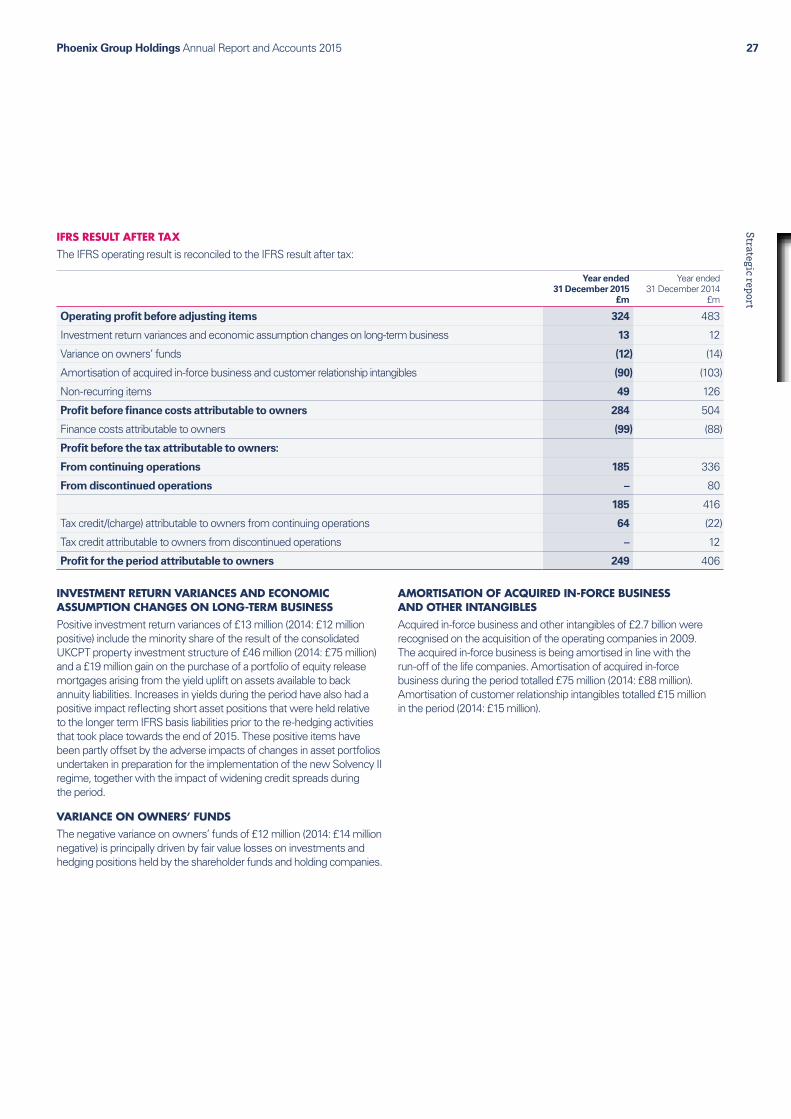
IFRS RESULT AFTER TAXThe IFRS operating result is reconciled to the IFRS result after tax:
Year ended 31 December 2015
£m
Year ended31 December 2014
£m
Operating profit before adjusting items 324 483
Investment return variances and economic assumption changes on long-term business 13 12
Variance on owners’ funds (12) (14)
Amortisation of acquired in-force business and customer relationship intangibles (90) (103)
Non-recurring items 49 126
Profit before finance costs attributable to owners 284 504
Finance costs attributable to owners (99) (88)
Profit before the tax attributable to owners:
From continuing operations 185 336
From discontinued operations – 80
185 416
Tax credit/(charge) attributable to owners from continuing operations 64 (22)
Tax credit attributable to owners from discontinued operations – 12
Profit for the period attributable to owners 249 406
INVESTMENT RETURN VARIANCES AND ECONOMIC ASSUMPTION CHANGES ON LONG-TERM BUSINESSPositive investment return variances of £13 million (2014: £12 million positive) include the minority share of the result of the consolidated UKCPT property investment structure of £46 million (2014: £75 million) and a £19 million gain on the purchase of a portfolio of equity release mortgages arising from the yield uplift on assets available to back annuity liabilities. Increases in yields during the period have also had a positive impact reflecting short asset positions that were held relative to the longer term IFRS basis liabilities prior to the re-hedging activities that took place towards the end of 2015. These positive items have been partly offset by the adverse impacts of changes in asset portfolios undertaken in preparation for the implementation of the new Solvency II regime, together with the impact of widening credit spreads during the period.
VARIANCE ON OWNERS’ FUNDSThe negative variance on owners’ funds of £12 million (2014: £14 million negative) is principally driven by fair value losses on investments and hedging positions held by the shareholder funds and holding companies.
AMORTISATION OF ACQUIRED IN-FORCE BUSINESS AND OTHER INTANGIBLESAcquired in-force business and other intangibles of £2.7 billion were recognised on the acquisition of the operating companies in 2009. The acquired in-force business is being amortised in line with the run-off of the life companies. Amortisation of acquired in-force business during the period totalled £75 million (2014: £88 million). Amortisation of customer relationship intangibles totalled £15 million in the period (2014: £15 million).
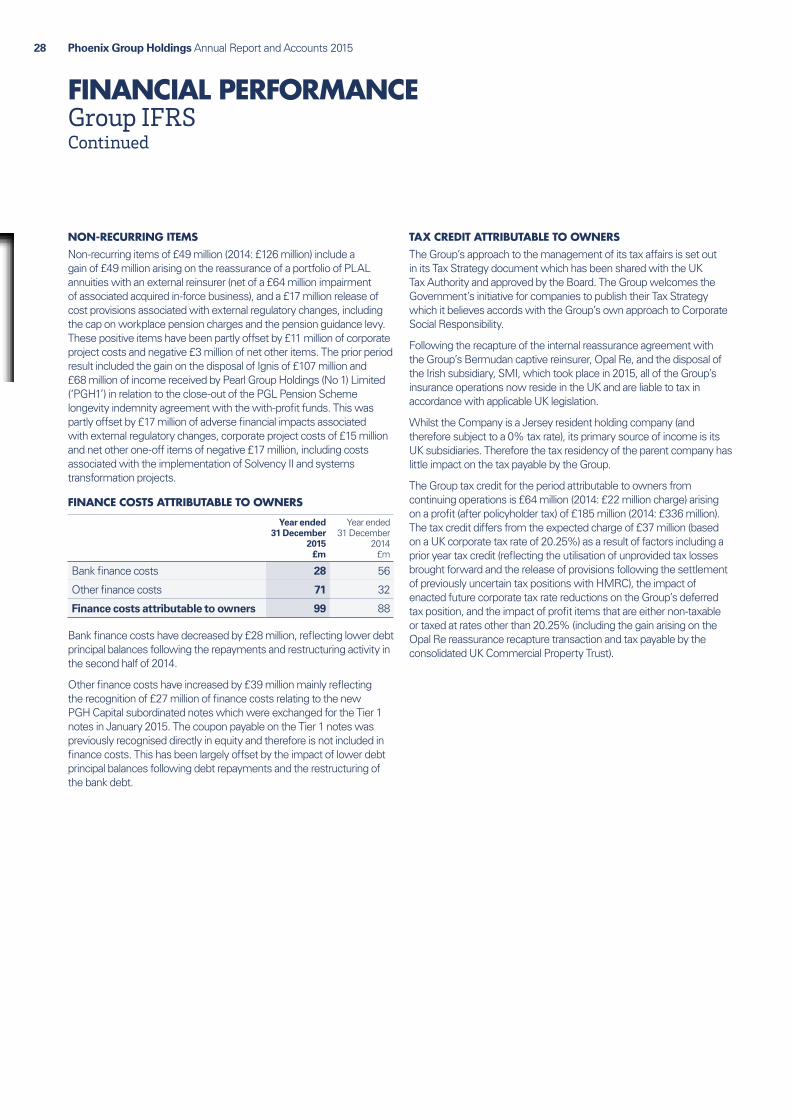
Phoenix Group Holdings Annual Report and Accounts 201528
FINANCIAL PERFORMANCEGroup IFRS Continued
NON-RECURRING ITEMSNon-recurring items of £49 million (2014: £126 million) include a gain of £49 million arising on the reassurance of a portfolio of PLAL annuities with an external reinsurer (net of a £64 million impairment of associated acquired in-force business), and a £17 million release of cost provisions associated with external regulatory changes, including the cap on workplace pension charges and the pension guidance levy. These positive items have been partly offset by £11 million of corporate project costs and negative £3 million of net other items. The prior period result included the gain on the disposal of Ignis of £107 million and £68 million of income received by Pearl Group Holdings (No 1) Limited (‘PGH1’) in relation to the close-out of the PGL Pension Scheme longevity indemnity agreement with the with-profit funds. This was partly offset by £17 million of adverse financial impacts associated with external regulatory changes, corporate project costs of £15 million and net other one-off items of negative £17 million, including costs associated with the implementation of Solvency II and systems transformation projects.
FINANCE COSTS ATTRIBUTABLE TO OWNERS
Year ended 31 December
2015 £m
Year ended31 December
2014 £m
Bank finance costs 28 56
Other finance costs 71 32
Finance costs attributable to owners 99 88
Bank finance costs have decreased by £28 million, reflecting lower debt principal balances following the repayments and restructuring activity in the second half of 2014.
Other finance costs have increased by £39 million mainly reflecting the recognition of £27 million of finance costs relating to the new PGH Capital subordinated notes which were exchanged for the Tier 1 notes in January 2015. The coupon payable on the Tier 1 notes was previously recognised directly in equity and therefore is not included in finance costs. This has been largely offset by the impact of lower debt principal balances following debt repayments and the restructuring of the bank debt.
TAX CREDIT ATTRIBUTABLE TO OWNERSThe Group’s approach to the management of its tax affairs is set out in its Tax Strategy document which has been shared with the UK Tax Authority and approved by the Board. The Group welcomes the Government’s initiative for companies to publish their Tax Strategy which it believes accords with the Group’s own approach to Corporate Social Responsibility.
Following the recapture of the internal reassurance agreement with the Group’s Bermudan captive reinsurer, Opal Re, and the disposal of the Irish subsidiary, SMI, which took place in 2015, all of the Group’s insurance operations now reside in the UK and are liable to tax in accordance with applicable UK legislation.
Whilst the Company is a Jersey resident holding company (and therefore subject to a 0% tax rate), its primary source of income is its UK subsidiaries. Therefore the tax residency of the parent company has little impact on the tax payable by the Group.
The Group tax credit for the period attributable to owners from continuing operations is £64 million (2014: £22 million charge) arising on a profit (after policyholder tax) of £185 million (2014: £336 million). The tax credit differs from the expected charge of £37 million (based on a UK corporate tax rate of 20.25%) as a result of factors including a prior year tax credit (reflecting the utilisation of unprovided tax losses brought forward and the release of provisions following the settlement of previously uncertain tax positions with HMRC), the impact of enacted future corporate tax rate reductions on the Group’s deferred tax position, and the impact of profit items that are either non-taxable or taxed at rates other than 20.25% (including the gain arising on the Opal Re reassurance recapture transaction and tax payable by the consolidated UK Commercial Property Trust).
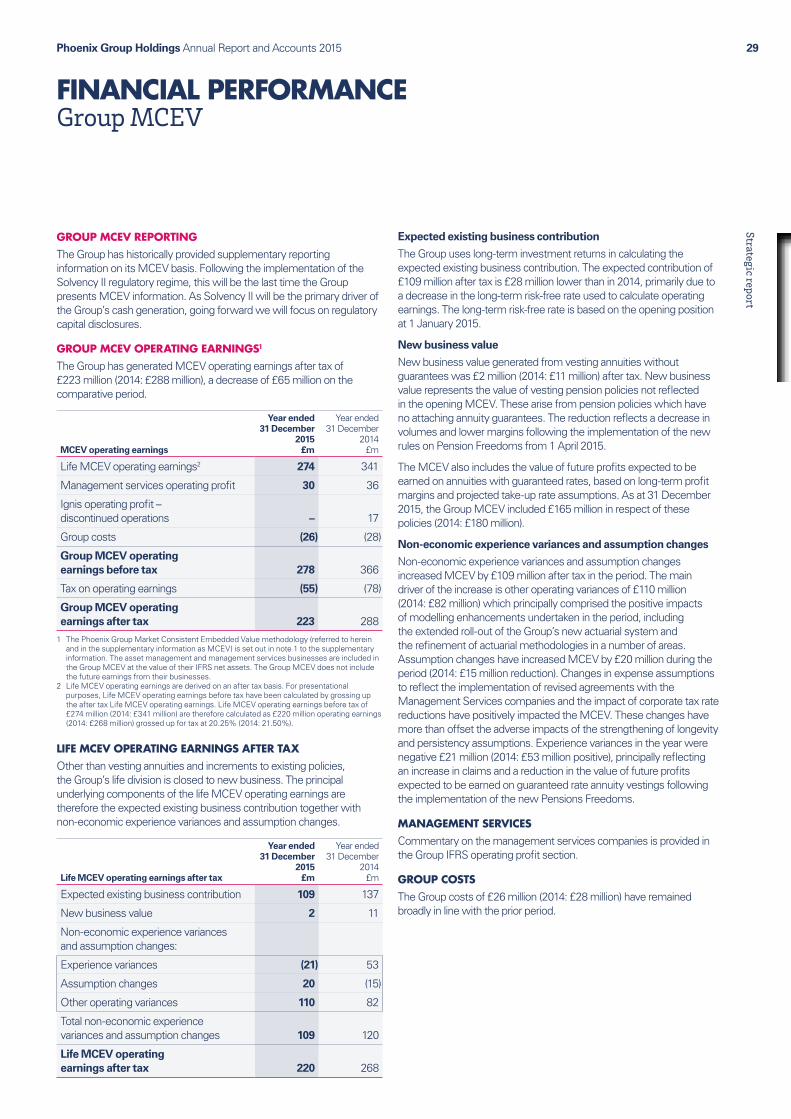
Phoenix Group Holdings Annual Report and Accounts 2015 29Strategic report
FINANCIAL PERFORMANCEGroup MCEV
GROUP MCEV REPORTINGThe Group has historically provided supplementary reporting information on its MCEV basis. Following the implementation of the Solvency II regulatory regime, this will be the last time the Group presents MCEV information. As Solvency II will be the primary driver of the Group’s cash generation, going forward we will focus on regulatory capital disclosures.
GROUP MCEV OPERATING EARNINGS1
The Group has generated MCEV operating earnings after tax of £223 million (2014: £288 million), a decrease of £65 million on the comparative period.
MCEV operating earnings
Year ended 31 December
2015 £m
Year ended31 December
2014 £m
Life MCEV operating earnings2 274 341
Management services operating profit 30 36
Ignis operating profit – discontinued operations – 17
Group costs (26) (28)
Group MCEV operating earnings before tax 278 366
Tax on operating earnings (55) (78)
Group MCEV operating earnings after tax 223 288
1 The Phoenix Group Market Consistent Embedded Value methodology (referred to herein and in the supplementary information as MCEV) is set out in note 1 to the supplementary information. The asset management and management services businesses are included in the Group MCEV at the value of their IFRS net assets. The Group MCEV does not include the future earnings from their businesses.
2 Life MCEV operating earnings are derived on an after tax basis. For presentational purposes, Life MCEV operating earnings before tax have been calculated by grossing up the after tax Life MCEV operating earnings. Life MCEV operating earnings before tax of £274 million (2014: £341 million) are therefore calculated as £220 million operating earnings (2014: £268 million) grossed up for tax at 20.25% (2014: 21.50%).
LIFE MCEV OPERATING EARNINGS AFTER TAXOther than vesting annuities and increments to existing policies, the Group’s life division is closed to new business. The principal underlying components of the life MCEV operating earnings are therefore the expected existing business contribution together with non-economic experience variances and assumption changes.
Life MCEV operating earnings after tax
Year ended 31 December
2015 £m
Year ended31 December
2014 £m
Expected existing business contribution 109 137
New business value 2 11
Non-economic experience variances and assumption changes:
Experience variances (21) 53
Assumption changes 20 (15)
Other operating variances 110 82
Total non-economic experience variances and assumption changes 109 120
Life MCEV operating earnings after tax 220 268
Expected existing business contribution
The Group uses long-term investment returns in calculating the expected existing business contribution. The expected contribution of £109 million after tax is £28 million lower than in 2014, primarily due to a decrease in the long-term risk-free rate used to calculate operating earnings. The long-term risk-free rate is based on the opening position at 1 January 2015.
New business value
New business value generated from vesting annuities without guarantees was £2 million (2014: £11 million) after tax. New business value represents the value of vesting pension policies not reflected in the opening MCEV. These arise from pension policies which have no attaching annuity guarantees. The reduction reflects a decrease in volumes and lower margins following the implementation of the new rules on Pension Freedoms from 1 April 2015.
The MCEV also includes the value of future profits expected to be earned on annuities with guaranteed rates, based on long-term profit margins and projected take-up rate assumptions. As at 31 December 2015, the Group MCEV included £165 million in respect of these policies (2014: £180 million).
Non-economic experience variances and assumption changes
Non-economic experience variances and assumption changes increased MCEV by £109 million after tax in the period. The main driver of the increase is other operating variances of £110 million (2014: £82 million) which principally comprised the positive impacts of modelling enhancements undertaken in the period, including the extended roll-out of the Group’s new actuarial system and the refinement of actuarial methodologies in a number of areas. Assumption changes have increased MCEV by £20 million during the period (2014: £15 million reduction). Changes in expense assumptions to reflect the implementation of revised agreements with the Management Services companies and the impact of corporate tax rate reductions have positively impacted the MCEV. These changes have more than offset the adverse impacts of the strengthening of longevity and persistency assumptions. Experience variances in the year were negative £21 million (2014: £53 million positive), principally reflecting an increase in claims and a reduction in the value of future profits expected to be earned on guaranteed rate annuity vestings following the implementation of the new Pensions Freedoms.
MANAGEMENT SERVICESCommentary on the management services companies is provided in the Group IFRS operating profit section.
GROUP COSTSThe Group costs of £26 million (2014: £28 million) have remained broadly in line with the prior period.
Phoenix Group Holdings Annual Report and Accounts 201530
FINANCIAL PERFORMANCEGroup MCEVContinued
RECONCILIATION OF GROUP MCEV OPERATING EARNINGS TO GROUP MCEV EARNINGSGroup MCEV operating earnings are reconciled to Group MCEV earnings as follows:
Year ended 31 December
2015 £m
Year ended31 December
2014 £m
Group MCEV operating earnings after tax 223 288
Economic variances on life business (221) 54
Economic variances on non-life business (8) (64)
Other non-operating variances on life business 98 (94)
Non-recurring items on non-life business (39) 317
Finance costs attributable to owners (91) (90)
Tax on non-operating earnings 64 –
Group MCEV earnings after tax 26 411
ECONOMIC VARIANCES ON LIFE BUSINESSNegative economic variances on life business of £221 million before tax (2014: positive £54 million) include the negative impact of the difference between actual short-term returns and the long-term investment return assumptions used to determine operating earnings and the adverse impact of widening credit spreads during the year. Also included here is the £98 million adverse impact of changes in asset portfolios undertaken in preparation for the implementation of the new Solvency II regime. This has been partly offset by a gain on the purchase of a portfolio of equity release mortgages and the resultant increase in liquidity premium, together with positive policyholder tax and inflation variances.
ECONOMIC VARIANCES ON NON-LIFE BUSINESSEconomic variances on non-life business are negative £8 million (2014: negative £64 million), principally driven by a net increase in the market value of the PGH Capital debt instruments of £4 million (2014: £24 million). The prior period result included losses of £27 million relating to an increase in the market value of the Tier 1 notes, which were exchanged for new PGH Capital subordinated notes in January 2015.
OTHER NON-OPERATING VARIANCES ON LIFE BUSINESSOther non-operating variances on life business increased Group MCEV by £98 million (2014: decrease £94 million) and principally comprise the partial release of provisions associated with external regulatory changes, including the cap on workplace pension charges and the pension guidance levy together with the positive impact arising on the reassurance of a portfolio of PLAL annuities with an external reinsurer of £19 million.
NON-RECURRING ITEMS ON NON-LIFE BUSINESSNon-recurring items on non-life business decreased MCEV by £39 million before tax (2014: increase £317 million). Non-recurring items include a loss of £22 million recognised on the exchange of the Tier 1 notes and related transaction expenses, together with corporate project costs of £13 million. Net negative other one-off items total £4 million.
Non-recurring items in the comparative period included a gain of £288 million on the divestment of Ignis and £68 million income received by PGH1 from the with-profit funds in relation to the close-out of the PGL Pension Scheme longevity indemnity agreement. Partly offsetting these items was £11 million of Group corporate project costs, debt issue costs of £16 million, with net other one-off items having a negative impact of £12 million.
FINANCE COSTS ATTRIBUTABLE TO OWNERS
Year ended 31 December
2015 £m
Year ended31 December
2014 £m
Bank finance costs 28 56
Other finance costs 43 8
Tier 1 notes coupon 20 26
Finance costs attributable to owners 91 90
Bank finance costs have decreased by £28 million, reflecting lower debt principal balances following repayments made and the restructuring activity completed in the second half of 2014.
Other finance costs have increased by £35 million, reflecting a full year of interest costs on the senior bond issued in July 2014, together with the finance costs accrued on the new PGH Capital subordinated notes, which were exchanged for the Tier 1 notes in January 2015.
Finance costs exclude the costs pertaining to the PLL subordinated debt, which are included in the life division’s result.
GROUP MCEVThe movement from opening to closing Group MCEV is shown below:
Movement in Group MCEV
Year ended 31 December
2015 £m
Year ended31 December
2014 £m
Group MCEV at 1 January 2,647 2,378
Group MCEV earnings after tax 26 411
Other comprehensive expense (40) (27)
Capital and dividend flows (120) (115)
Group MCEV at 30 December 2,513 2,647
Other comprehensive expense of £40 million includes pension contributions of £12 million (net of tax) in respect of the PGL Pension Scheme (2014: £16 million) and £32 million (net of tax) in respect of the Pearl Group Staff Pension Scheme (2014: £54 million), partly offset by a revaluation gain of £4 million on owner occupied property. The prior year comparative included an actuarial gain of £43 million (net of tax) in respect of the Pearl Group Staff Pension Scheme that was capped at the point at which the scheme returned to surplus on an IFRS basis.
Planned future contributions will cause a strain to the MCEV as pension surpluses are not recognised under the Group’s MCEV basis.
Capital and dividend flows in the period include external dividend payments of £120 million (2014: £120 million).

Phoenix Group Holdings Annual Report and Accounts 2015 31Strategic report
FINANCIAL PERFORMANCECapital management
CAPITAL MANAGEMENT FRAMEWORKThe Group’s capital management framework is designed to achieve the following objectives:
Ɛ To provide appropriate security for policyholders and meet all regulatory capital requirements while not retaining unnecessary excess capital.
Ɛ To ensure sufficient liquidity to meet obligations to policyholders and other creditors.
Ɛ To optimise the overall financial leverage ratio to maintain an investment grade credit rating.
Ɛ To meet the dividend expectations of shareholders as set by the Group’s dividend policy.
The framework comprises a suite of capital management policies that govern the allocation of capital throughout the Group to achieve these objectives under a range of stress conditions. The policy suite is defined with reference to policyholder security, creditor obligations, dividend policy and regulatory capital requirements.
Since 1 January 2016, regulatory capital adequacy for the Group is no longer monitored under the European Union Insurance Groups’ Directive (‘IGD’) or the PRA requirement for an Individual Capital Assessment (‘ICA’). The Group will now monitor its regulatory capital adequacy under the new Solvency II regime, details of which are included below.
REGULATORY CAPITAL REQUIREMENTSIGD SURPLUS (ESTIMATED)Each UK life company must maintain sufficient capital at all times to meet the regulatory capital requirements mandated by the PRA. Under the Solvency regime effective prior to 1 January 2016, these measures were aggregated under the European Union Insurance Groups’ Directive (‘IGD’) to calculate regulatory capital adequacy at a Group level.
The Group’s IGD assessment was made at the level of the highest EEA insurance group holding company, which is Phoenix Life Holdings Limited (‘PLHL’), a subsidiary of Phoenix Group Holdings. The estimated IGD surplus at 31 December 2015 was £1.5 billion (2014: £1.2 billion). The components of the estimated IGD calculation are shown below:
Year ended 31 December
2015 £bn
Year ended31 December
2014 £bn
Group capital resources (‘GCR’) 5.9 5.5
Group capital resource requirement (‘GCRR’) (4.4) (4.3)
IGD surplus (estimated) 1.5 1.2
The IGD surplus increased by £0.3 billion during the year as a result of the following factors:
Ɛ £0.3 billion positive impact arising from the simplification of the Group’s corporate structure, with PLHL now recognising 100% of the capital resources and requirements of Impala Holdings Limited and its subsidiaries;
Ɛ capital generation items of £0.3 billion, including capital benefits from management actions such as the Part VII transfer of the business of NPLL into PLAL and the acquisition of a portfolio of equity release mortgages; partly offset by; and
Ɛ dividend payments, debt financing and repayments of £0.3 billion.
The Group’s regulatory capital policy, prior to 1 January 2016, was to maintain GCR at the PLHL level of:
Ɛ 105% of the with-profit insurance component (‘WPICC’), being an additional capital requirement of with-profit funds plus; and
Ɛ 145% of the GCRR less the WPICC.
The Group’s headroom above the IGD regulatory capital policy at 31 December 2015 was £0.7 billion (2014: £0.5 billion).
PLHL ICA SURPLUS (ESTIMATED)In accordance with PRA requirements, effective prior to 1 January 2016, the Group undertook an ICA at the level of the highest EEA insurance group holding company, which is PLHL. This involved an assessment, on an economic basis, of the capital resources and requirements arising from the obligations and risks which exist outside the life companies.
As agreed with the PRA, the Group aimed to ensure that PLHL maintained an ICA surplus of at least £150 million. The estimated PLHL ICA position at 31 December 2015 is set out below:
Year ended 31 December
2015 £bn
Year ended31 December
2014 £bn
Capital resources 1 0.8 1.0
Capital resource requirements 2 (0.2) (0.3)
PLHL ICA surplus (estimated) 0.6 0.71 Capital resources includes the surplus over capital policy in the life companies and the
net assets of the holding companies less pension scheme obligations calculated on an economic basis.
2 Capital requirements relate to the risks arising outside of the life companies including those in relation to the Group’s staff pension schemes, offset by Group diversification benefits.
Headroom over the Group’s £150 million capital policy was £0.5 billion as at 31 December 2015 (2014: £0.6 billion).
The PLHL ICA surplus decreased during the year and reflects:
Ɛ dividend payments, debt financing and repayments of £0.3 billion;
Ɛ the adverse impact of management actions undertaken to enhance the Group Solvency II position ahead of implementation of the new regime of £0.2 billion; partly offset by; and
Ɛ capital generation items of £0.4 billion, including the positive impacts of other management actions delivered in the period of £0.2 billion.
The simplification of the Group structure did not impact the PLHL ICA surplus as the risk-based calculation has historically recognised 100% of the capital resources and requirements of Impala Holdings Limited and its subsidiaries.

Phoenix Group Holdings Annual Report and Accounts 201532
FINANCIAL PERFORMANCECapital management Continued
PLHL SOLVENCY II SURPLUS (ESTIMATED)In accordance with European Insurance and Occupational Pension Authority (‘EIOPA’) and PRA requirements, from 1 January 2016 the Group now undertakes a Solvency II capital adequacy assessment at the level of the highest EEA insurance group holding company, which is PLHL.
This involves a valuation in line with Solvency II principles of the Group’s own funds and a risk based assessment using an internal model of the Group’s solvency capital requirements (‘SCR’).
The Group’s own funds differ materially from IFRS equity for a number of reasons, including the exclusion of the Group’s bank debt held outside of the PLHL sub-group, the recognition of future shareholder transfers from the with-profit funds (but not the shareholder share of the estate), the treatment of certain subordinated debt instruments as capital items, and a number of valuation differences, most notably with regard to insurance liabilities and intangible assets.
The SCR is calibrated so that the likelihood of a loss exceeding the SCR is less than 0.5% over one year. This ensures that capital is sufficient to withstand a broadly ‘1 in 200 year event’ and is calculated in accordance with the Group’s PRA approved internal model. As a closed fund insurer, the Group does not need to hold capital to fund the writing of new business.
The estimated PLHL Solvency II surplus position at 31 December 2015 is set out below:
Year ended 31 December
2015 £bn
Own funds 1 5.8
Solvency capital requirement 2 (4.5)
Solvency II surplus (estimated) 3 1.3
1 Own funds includes the net assets of the life and holding companies calculated under Solvency II rules, pension scheme surpluses calculated on an IAS19 basis not exceeding the holding companies’ contribution to the Group SCR and qualifying subordinated liabilities. It is stated net of restrictions for assets which are non-transferrable and fungible between Group companies within a period of nine months.
2 Solvency capital requirements relate to the risks and obligations, to which the Group is exposed, calculated using an internal model, offset by Group diversification benefits.
3 Equates to a coverage ratio of 130% as at 31 December 2015.
These figures exclude surpluses arising in the Group’s with-profit funds and Group pension schemes of £0.5 billion. In the calculation of the Solvency II surplus, the SCR of the with-profit funds and Group pension schemes is included, but the related own funds are recognised only to a maximum of the SCR amount. Surpluses that arise in with-profit funds and Group pension schemes, whilst not included in the PLHL Solvency II surplus, are available to absorb economic shocks. This means that the headline surplus is highly resilient to economic stresses.
Excluding the SCR and own funds relating to unsupported with-profit funds and Group pension schemes, the estimated Solvency II Shareholder Capital coverage ratio is 154% as at 31 December 2015.
SENSITIVITY AND SCENARIO ANALYSISAs part of the Group’s internal risk management processes, the regulatory capital requirements are tested against a number of financial scenarios. The results of that stress testing are provided below and demonstrate the resilience of the PLHL Solvency II surplus.
Estimated PLHL Solvency II surplus
1 January 2016 £bn
Base: 1 January 2016 1.3
Following a 20% fall in equity markets 1.3
Following a 15% fall in property values 1.3
Following a 75bps interest rates rise 1 1.4
Following a 75bps interest rates fall 1 1.2
Following credit spread widening 2 1.2
Following 5% decrease in annuitant mortality rates3 1.1
1 Assumes recalculation of transitionals subject to PRA approval.2 Credit stress equivalent to an average 100bps spread widening across ratings, 10% of
which is due to defaults/downgrades.3 Equivalent of 6 months increase in longevity.
ShareholderCapital1
154%
Unsupported with-profit fundsand Group pension schemes2
£3.8
bn
£2.5
bn
£2.5
bn
£1.3
bn
£0.5
bn£2
.0bn
BREAKDOWN OF SOLVENCY II POSITION
Surplus
Own funds
SCR
1 The Shareholder Capital surplus excludes own funds and SCR of unsupported with-profit funds and Group pension schemes.
2 Unsupported with-profit funds and Group pension schemes refer to those funds whose Solvency II own funds exceed their SCR. Where a with-profit fund or Group pension scheme cannot cover its SCR, its own funds and SCR are included within the Shareholder Capital surplus.

Phoenix Group Holdings Annual Report and Accounts 2015 33Strategic report
FINANCIAL PERFORMANCECapital resources
LEVERAGEIn managing capital the Group seeks to optimise the level of debt on its balance sheet. The Group’s closed book business model allows it to operate with higher leverage than life companies that are still writing new business, as it does not need to fund upfront capital requirements and new business acquisition expenses.
FINANCIAL LEVERAGE RATIOThe Group monitors the level of debt in its statement of consolidated financial position by reference to the financial leverage ratio. The financial leverage ratio is used to determine the interest margin payable on the PGH Capital bank facility.
The financial leverage ratio as at 31 December 2015 decreased to 37.8% reflecting debt repayments in the period.
The financial leverage ratio is calculated as gross shareholder debt1 as a percentage of gross MCEV 2. Following the implementation of the Solvency II regime, MCEV will not be reported going forwards. This, together with the Group’s achievement of an investment grade credit rating during 2015, means that the financial leverage calculation will also not be reported in future periods.
Gross shareholder debt and shareholder debt (including hybrid debt) included in MCEV at 31 December 2015 are set out in the table below:
Year ended 31 December
2015 £m
Year ended31 December
2014 £m
PGH Capital facility 650 840
PGH Capital senior bond 300 300
PGH Capital subordinated notes3 396 –
PLL subordinated debt 200 200
Tier 1 notes4 6 394
Gross shareholder debt 1,552 1,734
Adjustments to include the following items at fair value:
PLL subordinated debt 12 12
PGH Capital senior bond 24 22
PGH Capital subordinated notes 4 –
Tier 1 notes4 – (7)
Shareholder debt included in MCEV 1,592 1,7611 Gross shareholder debt is defined as the notional face value of the shareholder and
hybrid debt.2 Gross MCEV is defined as the sum of Group MCEV and the value of shareholder and hybrid
debt as included in the MCEV.3 Total face value of the PGH Capital subordinated notes is £428 million (2014: £nil), of which
bonds with a face value of £32 million (2014: £nil) are held by Group companies.4 Total face value of the Tier 1 notes is £6 million (2014: £425 million), of which bonds with
a face value of £nil (2014: £31 million) are held by Group companies.
The Group’s gross shareholder debt decreased by £182 million to £1,552 million in the year. This reduction includes repayments of £190 million in respect of the PGH Capital facility, including prepayments of £70 million in respect of payments due in 2016 and £30 million in respect of payments due in 2017.
In January 2015, the Group announced the exchange of 99% of the Group’s Tier 1 notes for £428 million of new subordinated notes, issued by PGH Capital. As the new notes mature in 2025, the notes will be included in the financial leverage calculation at their notional face value of £396 million, excluding notes with a face value of £32 million held by Group companies.
In August 2015, Fitch Ratings assigned the Group an investment grade credit rating, which triggered a further 50bps margin reduction on the outstanding bank facility effective from 28 August 2015.
In March 2016, the Group agreed an amendment of its £900 million, 5 year unsecured bank facility into a £650 million unsecured revolving credit facility, maturing in June 2020. There are no mandatory or target amortisation payments associated with the facility but prepayments are permissible.
Further detail on shareholder debt is included in note E5 to the IFRS consolidated financial statements.
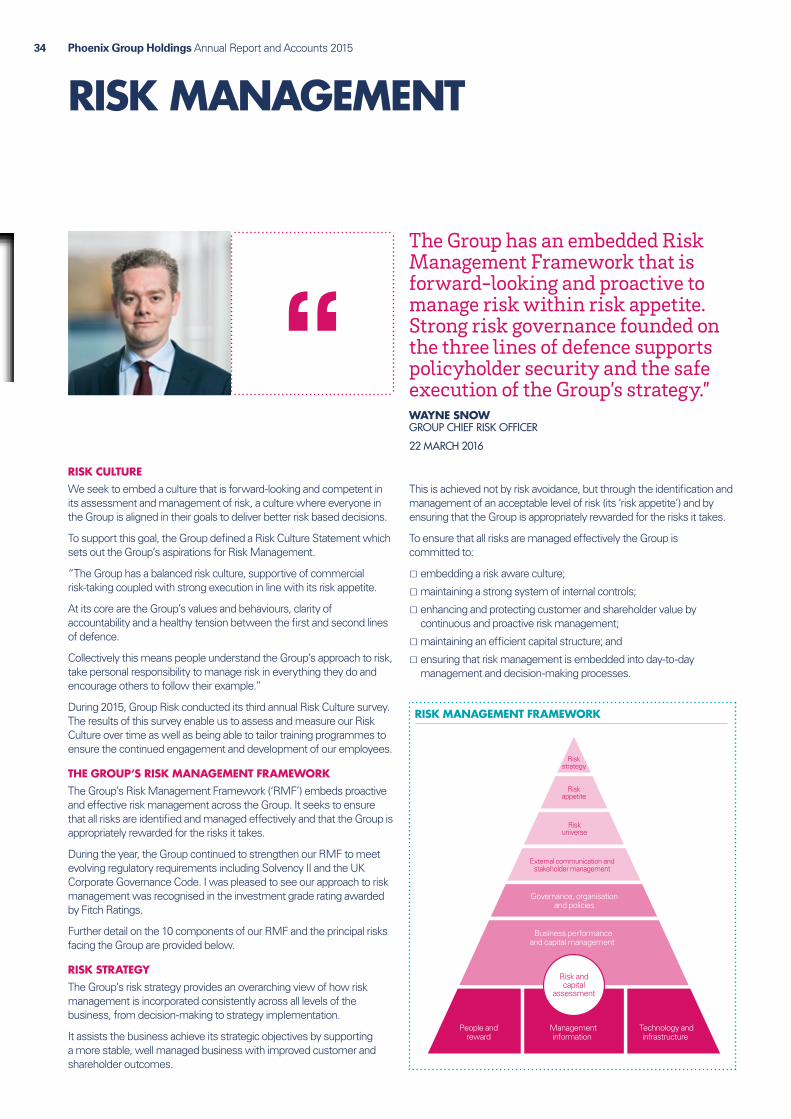
Phoenix Group Holdings Annual Report and Accounts 201534
RISK MANAGEMENT
The Group has an embedded Risk Management Framework that is forward-looking and proactive to manage risk within risk appetite. Strong risk governance founded on the three lines of defence supports policyholder security and the safe execution of the Group’s strategy.” WAYNE SNOW GROUP CHIEF RISK OFFICER
22 MARCH 2016
RISK CULTUREWe seek to embed a culture that is forward-looking and competent in its assessment and management of risk, a culture where everyone in the Group is aligned in their goals to deliver better risk based decisions.
To support this goal, the Group defined a Risk Culture Statement which sets out the Group’s aspirations for Risk Management.
“The Group has a balanced risk culture, supportive of commercial risk-taking coupled with strong execution in line with its risk appetite.
At its core are the Group’s values and behaviours, clarity of accountability and a healthy tension between the first and second lines of defence.
Collectively this means people understand the Group’s approach to risk, take personal responsibility to manage risk in everything they do and encourage others to follow their example.”
During 2015, Group Risk conducted its third annual Risk Culture survey. The results of this survey enable us to assess and measure our Risk Culture over time as well as being able to tailor training programmes to ensure the continued engagement and development of our employees.
THE GROUP’S RISK MANAGEMENT FRAMEWORK The Group’s Risk Management Framework (‘RMF’) embeds proactive and effective risk management across the Group. It seeks to ensure that all risks are identified and managed effectively and that the Group is appropriately rewarded for the risks it takes.
During the year, the Group continued to strengthen our RMF to meet evolving regulatory requirements including Solvency II and the UK Corporate Governance Code. I was pleased to see our approach to risk management was recognised in the investment grade rating awarded by Fitch Ratings.
Further detail on the 10 components of our RMF and the principal risks facing the Group are provided below.
RISK STRATEGY The Group’s risk strategy provides an overarching view of how risk management is incorporated consistently across all levels of the business, from decision-making to strategy implementation.
It assists the business achieve its strategic objectives by supporting a more stable, well managed business with improved customer and shareholder outcomes.
Riskstrategy
Riskappetite
Riskuniverse
External communication andstakeholder management
Governance, organisationand policies
Business performanceand capital management
People andreward
Managementinformation
Technology andinfrastructure
Risk andcapital
assessment
RISK MANAGEMENT FRAMEWORK
This is achieved not by risk avoidance, but through the identification and management of an acceptable level of risk (its ‘risk appetite’) and by ensuring that the Group is appropriately rewarded for the risks it takes.
To ensure that all risks are managed effectively the Group is committed to:
Ɛ embedding a risk aware culture;
Ɛ maintaining a strong system of internal controls;
Ɛ enhancing and protecting customer and shareholder value by continuous and proactive risk management;
Ɛ maintaining an efficient capital structure; and
Ɛ ensuring that risk management is embedded into day-to-day management and decision-making processes.
Phoenix Group Holdings Annual Report and Accounts 2015 35Strategic report
RISK APPETITE The Group’s risk appetite is the level of risk the Group is willing to accept in pursuit of its strategic objectives. The statements below encapsulate our risk appetite for policyholder security and conduct, earnings volatility, liquidity and our control environment:
Ɛ Capital – The Group and each life company will hold sufficient capital to meet regulatory requirements in a number of asset and liability stress scenarios.
Ɛ Cash flow – The Group will seek to ensure that it has sufficient cash flow to meet its financial obligations and will continue to do this in a volatile business environment.
Ɛ Embedded value – The Group will take action to protect embedded value.
Ɛ Regulation – The Group and each life company will, at all times, operate a strong control environment to ensure compliance with all internal policies and applicable laws and regulations, in a commercially effective manner.
Ɛ Conduct – Phoenix has zero appetite for deliberate acts of misconduct, including omissions that result in customer detriment, reputational damage and/or pose a risk to the Financial Conduct Authority (‘FCA’) statutory objectives.
The risk appetite and control framework supports the Group in operating within the boundaries of these statements by limiting the volatility of key parameters under a range of adverse scenarios agreed with the Board. Risk appetite limits are chosen which specify the maximum acceptable likelihood for breaching the agreed limits. Assessment against these limits is undertaken through extensive scenario and reverse stress testing.
RISK UNIVERSE A key element of effective risk management is ensuring that the business has a complete and robust understanding of the risks it faces. These risks are defined in the Group’s risk universe.
The risk universe allows the Group to deploy a common risk language, allowing for meaningful comparisons to be made across the business. There are three levels of risk universe categories. The highest risk universe category is Level 1 and includes:
Ɛ strategic risk;
Ɛ customer risk;
Ɛ financial soundness risk;
Ɛ market risk;
Ɛ credit risk;
Ɛ insurance risk; and
Ɛ operational risk.
Embedded within these categories, and Customer risk in particular, are the conduct risks faced by the Group and its customers. These risks are separately monitored and reported on across the organisation to ensure that conduct risk receives appropriate emphasis and oversight.
The Group has developed a PGH Board approved risk appetite statement to manage Conduct Risk. The appetite statement is supported by the assessment of all conduct related risks faced by the Group on a quarterly basis. This regular assessment and reporting enables us to be forward-looking and proactive in the management of conduct risk.
EXTERNAL COMMUNICATION AND STAKEHOLDER MANAGEMENTThe Group has a number of internal and external stakeholders, each of whom has an active interest in the Group’s performance, including how risks are managed. Significant effort is made to ensure that our stakeholders have appropriate, timely and accurate information to support them in forming views of the Group.
GOVERNANCE, ORGANISATION AND POLICIES GOVERNANCE Overall responsibility for approving, establishing and embedding the RMF rests with the Board. The Board recognises the critical importance of having an efficient and effective RMF and appropriate oversight of its operation. There is a clear organisational structure in place with documented, delegated authorities and responsibilities from the Group Board to the PLHL Board, the Boards of Phoenix Life and the Executive Committee.
The RMF is underpinned by the operation of a three lines of defence model with clearly defined roles and responsibilities for statutory boards and their committees, management oversight committees, Group Risk and Group Internal Audit.
First line: Management
Management of risk is delegated from the Board to the Group Chief Executive Officer, Executive Committee members and through to business managers. A series of business unit management oversight committees operate within the Group. They are responsible for implementation of the RMF, ensuring the risks associated with the business activities are identified, assessed, controlled, monitored and reported.
Second line: Risk Oversight
Risk oversight is provided by the Group Risk function and the Board Risk Committee. The Board Risk Committee comprises four independent Non-Executive Directors. It is supported by the Group Chief Risk Officer and met six times during 2015. During 2015, the Board further improved risk oversight with the establishment of a dedicated Risk Committee of the Phoenix Life Board to provide additional Board Committee focus on risk matters at Phoenix Life.
Third line: Independent Assurance
Independent verification of the adequacy and effectiveness of the internal controls and risk management is provided by the Group Internal Audit function, which is supported by the Board Audit Committee.
ORGANISATIONThe Group Chief Risk Officer manages the Group Risk function and has responsibility for the implementation and oversight of the Group’s RMF. The Group Risk function has responsibility for oversight over financial, operational and regulatory risk. The PRA/FCA relationship team manages the relationship and interactions with our primary regulators and reports to the Group Chief Risk Officer.
POLICIES The Group policy framework comprises a set of 30 policies that support the delivery of the Group’s strategy by establishing operating principles and expectations for managing the key risks to our business. The policy set contains the minimum control standards to which each business unit must adhere to and against which they report compliance.
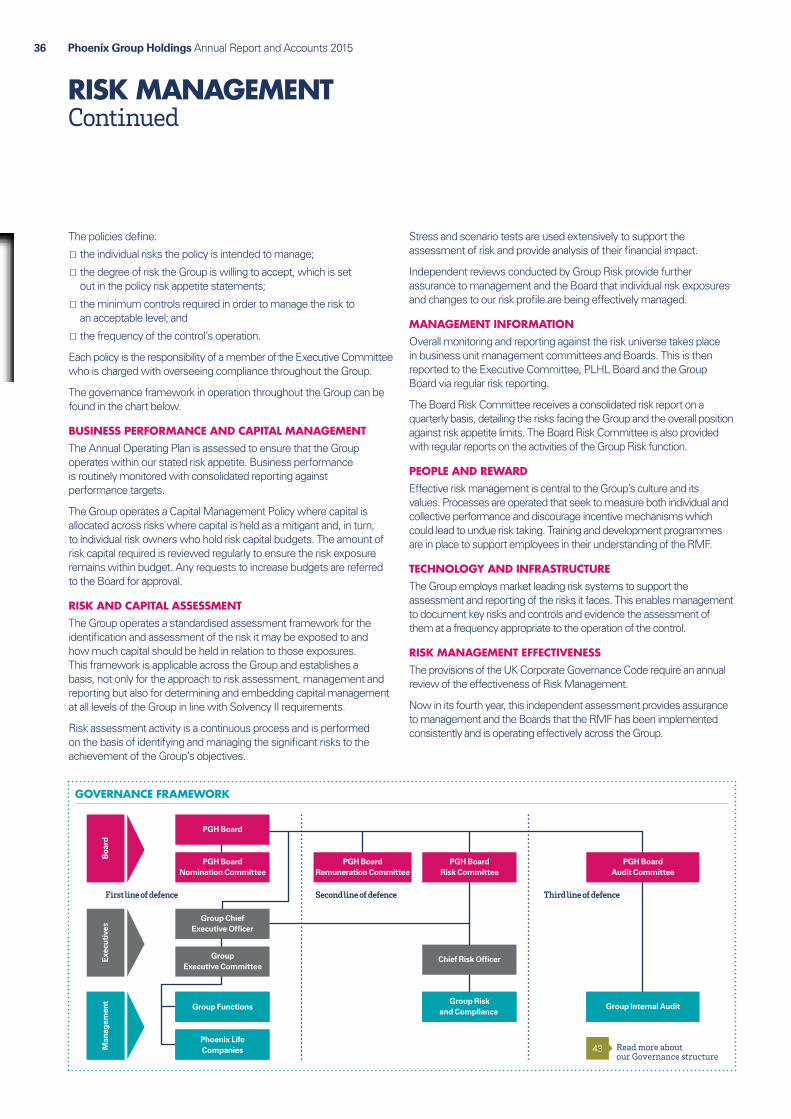
First line of defence Third line of defenceSecond line of defence
Boa
rdE
xecu
tive
sM
anag
emen
t
PGH Board
PGH BoardNomination Committee
Group Functions
Phoenix LifeCompanies
GroupExecutive Committee
Group ChiefExecutive Officer
Group Riskand Compliance
Chief Risk Officer
PGH BoardRemuneration Committee
PGH BoardRisk Committee
PGH BoardAudit Committee
Group Internal Audit
Phoenix Group Holdings Annual Report and Accounts 201536
RISK MANAGEMENT Continued
The policies define:
Ɛ the individual risks the policy is intended to manage;
Ɛ the degree of risk the Group is willing to accept, which is set out in the policy risk appetite statements;
Ɛ the minimum controls required in order to manage the risk to an acceptable level; and
Ɛ the frequency of the control’s operation.
Each policy is the responsibility of a member of the Executive Committee who is charged with overseeing compliance throughout the Group.
The governance framework in operation throughout the Group can be found in the chart below.
BUSINESS PERFORMANCE AND CAPITAL MANAGEMENT The Annual Operating Plan is assessed to ensure that the Group operates within our stated risk appetite. Business performance is routinely monitored with consolidated reporting against performance targets.
The Group operates a Capital Management Policy where capital is allocated across risks where capital is held as a mitigant and, in turn, to individual risk owners who hold risk capital budgets. The amount of risk capital required is reviewed regularly to ensure the risk exposure remains within budget. Any requests to increase budgets are referred to the Board for approval.
RISK AND CAPITAL ASSESSMENT The Group operates a standardised assessment framework for the identification and assessment of the risk it may be exposed to and how much capital should be held in relation to those exposures. This framework is applicable across the Group and establishes a basis, not only for the approach to risk assessment, management and reporting but also for determining and embedding capital management at all levels of the Group in line with Solvency II requirements.
Risk assessment activity is a continuous process and is performed on the basis of identifying and managing the significant risks to the achievement of the Group’s objectives.
Stress and scenario tests are used extensively to support the assessment of risk and provide analysis of their financial impact.
Independent reviews conducted by Group Risk provide further assurance to management and the Board that individual risk exposures and changes to our risk profile are being effectively managed.
MANAGEMENT INFORMATIONOverall monitoring and reporting against the risk universe takes place in business unit management committees and Boards. This is then reported to the Executive Committee, PLHL Board and the Group Board via regular risk reporting.
The Board Risk Committee receives a consolidated risk report on a quarterly basis, detailing the risks facing the Group and the overall position against risk appetite limits. The Board Risk Committee is also provided with regular reports on the activities of the Group Risk function.
PEOPLE AND REWARDEffective risk management is central to the Group’s culture and its values. Processes are operated that seek to measure both individual and collective performance and discourage incentive mechanisms which could lead to undue risk taking. Training and development programmes are in place to support employees in their understanding of the RMF.
TECHNOLOGY AND INFRASTRUCTUREThe Group employs market leading risk systems to support the assessment and reporting of the risks it faces. This enables management to document key risks and controls and evidence the assessment of them at a frequency appropriate to the operation of the control.
RISK MANAGEMENT EFFECTIVENESSThe provisions of the UK Corporate Governance Code require an annual review of the effectiveness of Risk Management.
Now in its fourth year, this independent assessment provides assurance to management and the Boards that the RMF has been implemented consistently and is operating effectively across the Group.
GOVERNANCE FRAMEWORK
Read more about our Governance structure
43
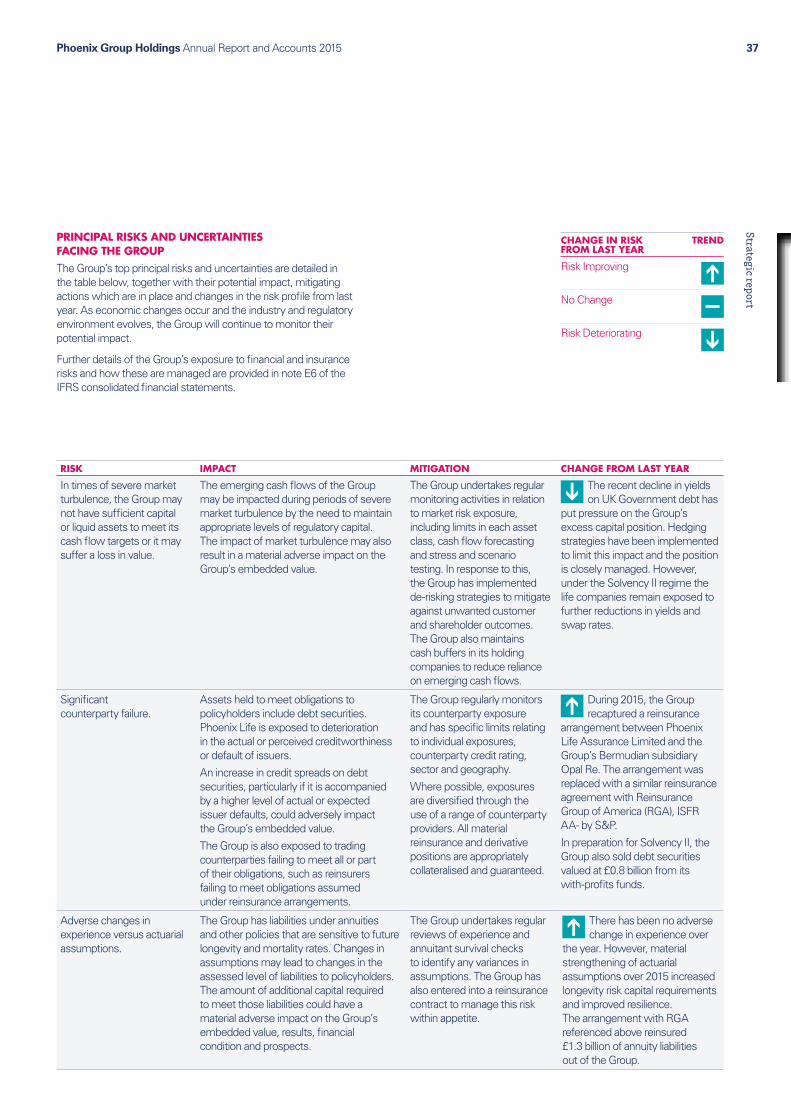
Phoenix Group Holdings Annual Report and Accounts 2015 37Strategic report
PRINCIPAL RISKS AND UNCERTAINTIES FACING THE GROUPThe Group’s top principal risks and uncertainties are detailed in the table below, together with their potential impact, mitigating actions which are in place and changes in the risk profile from last year. As economic changes occur and the industry and regulatory environment evolves, the Group will continue to monitor their potential impact.
Further details of the Group’s exposure to financial and insurance risks and how these are managed are provided in note E6 of the IFRS consolidated financial statements.
CHANGE IN RISK FROM LAST YEAR
TREND
Risk Improving
No Change
Risk Deteriorating
RISK IMPACT MITIGATION CHANGE FROM LAST YEAR
In times of severe market turbulence, the Group may not have sufficient capital or liquid assets to meet its cash flow targets or it may suffer a loss in value.
The emerging cash flows of the Group may be impacted during periods of severe market turbulence by the need to maintain appropriate levels of regulatory capital. The impact of market turbulence may also result in a material adverse impact on the Group’s embedded value.
The Group undertakes regular monitoring activities in relation to market risk exposure, including limits in each asset class, cash flow forecasting and stress and scenario testing. In response to this, the Group has implemented de-risking strategies to mitigate against unwanted customer and shareholder outcomes. The Group also maintains cash buffers in its holding companies to reduce reliance on emerging cash flows.
The recent decline in yields on UK Government debt has
put pressure on the Group’s excess capital position. Hedging strategies have been implemented to limit this impact and the position is closely managed. However, under the Solvency II regime the life companies remain exposed to further reductions in yields and swap rates.
Significant counterparty failure.
Assets held to meet obligations to policyholders include debt securities. Phoenix Life is exposed to deterioration in the actual or perceived creditworthiness or default of issuers.
An increase in credit spreads on debt securities, particularly if it is accompanied by a higher level of actual or expected issuer defaults, could adversely impact the Group’s embedded value.
The Group is also exposed to trading counterparties failing to meet all or part of their obligations, such as reinsurers failing to meet obligations assumed under reinsurance arrangements.
The Group regularly monitors its counterparty exposure and has specific limits relating to individual exposures, counterparty credit rating, sector and geography.
Where possible, exposures are diversified through the use of a range of counterparty providers. All material reinsurance and derivative positions are appropriately collateralised and guaranteed.
During 2015, the Group recaptured a reinsurance
arrangement between Phoenix Life Assurance Limited and the Group’s Bermudian subsidiary Opal Re. The arrangement was replaced with a similar reinsurance agreement with Reinsurance Group of America (RGA), ISFR AA- by S&P.
In preparation for Solvency II, the Group also sold debt securities valued at £0.8 billion from its with-profits funds.
Adverse changes in experience versus actuarial assumptions.
The Group has liabilities under annuities and other policies that are sensitive to future longevity and mortality rates. Changes in assumptions may lead to changes in the assessed level of liabilities to policyholders. The amount of additional capital required to meet those liabilities could have a material adverse impact on the Group’s embedded value, results, financial condition and prospects.
The Group undertakes regular reviews of experience and annuitant survival checks to identify any variances in assumptions. The Group has also entered into a reinsurance contract to manage this risk within appetite.
There has been no adverse change in experience over
the year. However, material strengthening of actuarial assumptions over 2015 increased longevity risk capital requirements and improved resilience. The arrangement with RGA referenced above reinsured £1.3 billion of annuity liabilities out of the Group.
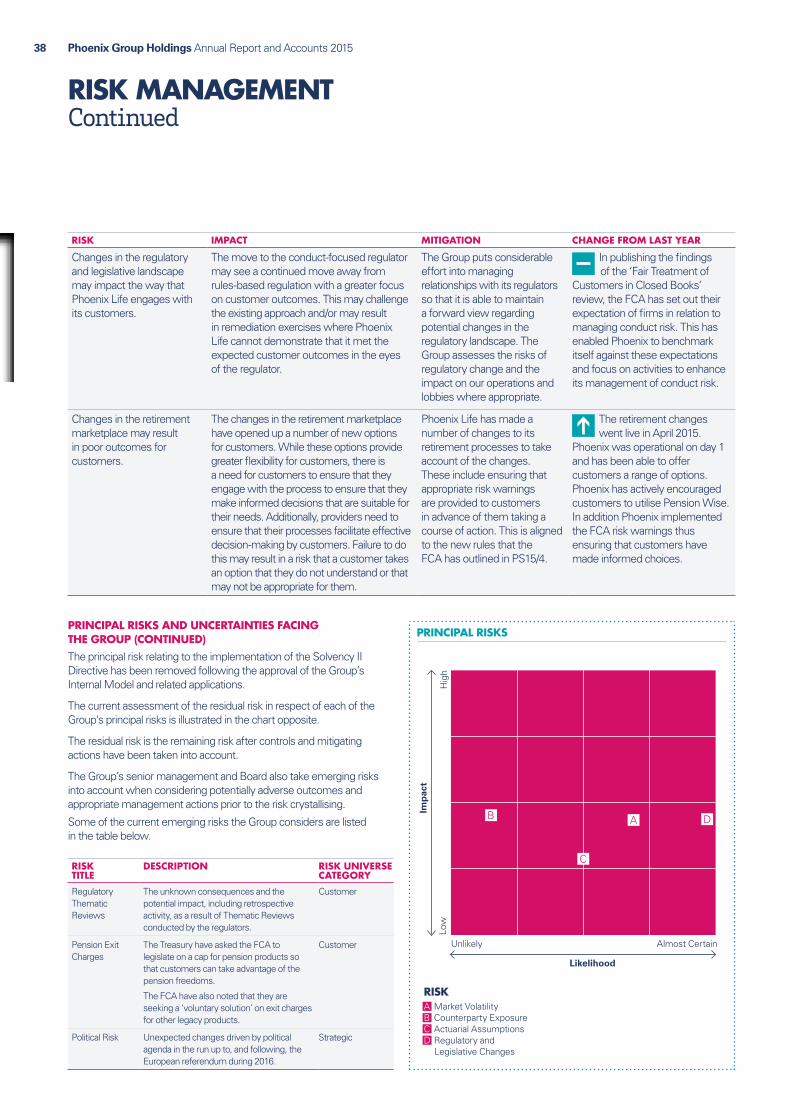
RISKA Market VolatilityB Counterparty ExposureC Actuarial AssumptionsD Regulatory and Legislative Changes
Low
Hig
h
Imp
act
Unlikely Almost Certain
Likelihood
B D
C
A
RISKA Market VolatilityB Counterparty ExposureC Actuarial AssumptionsD Regulatory and Legislative Changes
Low
Hig
h
Imp
act
Unlikely Almost Certain
Likelihood
B D
C
A
Phoenix Group Holdings Annual Report and Accounts 201538
RISK MANAGEMENT Continued
PRINCIPAL RISKS AND UNCERTAINTIES FACING THE GROUP (CONTINUED)The principal risk relating to the implementation of the Solvency II Directive has been removed following the approval of the Group’s Internal Model and related applications.
The current assessment of the residual risk in respect of each of the Group’s principal risks is illustrated in the chart opposite.
The residual risk is the remaining risk after controls and mitigating actions have been taken into account.
The Group’s senior management and Board also take emerging risks into account when considering potentially adverse outcomes and appropriate management actions prior to the risk crystallising.
Some of the current emerging risks the Group considers are listed in the table below.
RISK TITLE
DESCRIPTION RISK UNIVERSE CATEGORY
Regulatory Thematic Reviews
The unknown consequences and the potential impact, including retrospective activity, as a result of Thematic Reviews conducted by the regulators.
Customer
Pension Exit Charges
The Treasury have asked the FCA to legislate on a cap for pension products so that customers can take advantage of the pension freedoms.
The FCA have also noted that they are seeking a ‘voluntary solution’ on exit charges for other legacy products.
Customer
Political Risk Unexpected changes driven by political agenda in the run up to, and following, the European referendum during 2016.
Strategic
PRINCIPAL RISKS
RISK IMPACT MITIGATION CHANGE FROM LAST YEAR
Changes in the regulatory and legislative landscape may impact the way that Phoenix Life engages with its customers.
The move to the conduct-focused regulator may see a continued move away from rules-based regulation with a greater focus on customer outcomes. This may challenge the existing approach and/or may result in remediation exercises where Phoenix Life cannot demonstrate that it met the expected customer outcomes in the eyes of the regulator.
The Group puts considerable effort into managing relationships with its regulators so that it is able to maintain a forward view regarding potential changes in the regulatory landscape. The Group assesses the risks of regulatory change and the impact on our operations and lobbies where appropriate.
In publishing the findings of the ‘Fair Treatment of
Customers in Closed Books’ review, the FCA has set out their expectation of firms in relation to managing conduct risk. This has enabled Phoenix to benchmark itself against these expectations and focus on activities to enhance its management of conduct risk.
Changes in the retirement marketplace may result in poor outcomes for customers.
The changes in the retirement marketplace have opened up a number of new options for customers. While these options provide greater flexibility for customers, there is a need for customers to ensure that they engage with the process to ensure that they make informed decisions that are suitable for their needs. Additionally, providers need to ensure that their processes facilitate effective decision-making by customers. Failure to do this may result in a risk that a customer takes an option that they do not understand or that may not be appropriate for them.
Phoenix Life has made a number of changes to its retirement processes to take account of the changes. These include ensuring that appropriate risk warnings are provided to customers in advance of them taking a course of action. This is aligned to the new rules that the FCA has outlined in PS15/4.
The retirement changes went live in April 2015.
Phoenix was operational on day 1 and has been able to offer customers a range of options. Phoenix has actively encouraged customers to utilise Pension Wise. In addition Phoenix implemented the FCA risk warnings thus ensuring that customers have made informed choices.
Phoenix Group Holdings Annual Report and Accounts 2015 39Strategic report
VIABILITY STATEMENTIn accordance with the provision of section C.2.2 of the 2014 revision of the UK Corporate Governance Code, the Board has completed an assessment of the prospects and viability of the Group over a five-year period to December 2020. The Board has determined that the five-year period to December 2020 is an appropriate period for the assessment, this being the period covered by the Group’s Board-approved annual operating plan (‘AOP’).
In making the viability assessment, the Board has undertaken the following process:
Ɛ it reviewed what is mandatory in the context of viability;
Ɛ it reviewed the AOP which considers profits, liquidity, solvency and strategic objectives and the impacts of management actions on the Group;
Ɛ it completed stress testing to assess viability under severe but plausible scenarios, including two adverse stresses which represent the key financial risks to the Group as follows:
1. Market stress – a 1 in 10 year event combined market stress incorporating a fall in equity, property values and yields, with a widening of credit spreads.
2. Longevity stress – a 1 in 10 year event longevity and credit stress, which implies a 1.3 year increase in life expectancy for a 65 year old male alongside a widening of credit spreads.
Ɛ it considered the principal risks facing the Group which have the potential to impact on viability as discussed in the Risk report above.
Ɛ it completed a qualitative assessment of all strategic risks to the Group and contingent actions available that could be implemented should any risk materialise that threatens the Group’s resilience.
The Board has also made certain assumptions when making the assessment and these include the following:
Ɛ the stress occurs on 1 January 2016 with no allowance for any recovery; and
Ɛ that corporate acquisitions are not relevant, as any acquisition would only be progressed on the basis it was value accretive.
Based on the results of the procedures outlined above, the Board has a reasonable expectation that the Group will be able to continue in operation and meet its liabilities as they fall due over the five-year period of assessment.

Phoenix Group Holdings Annual Report and Accounts 201540
ENVIRONMENTAL REPORTING
This section includes mandatory reporting of greenhouse gas (‘GHG’) emissions pursuant to the Companies Act 2006 (Strategic and Directors’ Reports) Regulations 2013. Emissions disclosed relate to properties where the Group has operational control. The Group has no responsibility for any emission sources that are not included in our consolidated financial statements.
Emissions have arisen principally through the combustion of fuel and operation of facilities (Scope 1) and the consumption of purchased electricity, heat, steam and cooling, (Scope 2). Approximately 7% of 2015 emissions are estimated as full year data is not yet available for all properties. A sample of emissions from fuel use for transport, back-up generation and fluorinated gases were calculated and were determined to be non-material to the overall footprint, so have not been included.
The data reported is based on the main requirements of the ISO14064 Part 1 and the GHG Protocol Corporate Accounting and Reporting Standard (revised edition); data gathered for ongoing reporting against the UK Carbon Reduction Commitment (‘CRC’) scheme and energy and fuel consumption data for occupied properties has been used to calculate the carbon footprint. The Government’s Conversion Factors for Company Reporting 2015 have been used to convert energy data into CO2e emissions.
Due to organisational structure changes in 2014 following the divestment of Ignis Asset Management Limited to Standard Life Investments (Holdings) Limited, the Group has restated 2014 data to represent only properties where the Group has operational control. This is in line with the Greenhouse Gas Protocol’s guidance on organisational boundaries.
Go online for the Group’s full Corporate Responsibility Reportwww.thephoenixgroup.com/CRreport2015
GREENHOUSE GAS EMISSIONSGLOBAL GHG EMISSIONS DATA IN TONNES OF CO2e
Emissions from: 2015 2014 restated
Combustion of fuel and operation of facilities (Scope 1) 1,013 1,028
Electricity, heat, steam and cooling purchased for own use (Scope 2) 2,939 3,508
Total Carbon Footprint (tonnes of CO2e) 3,952 4,536
PHOENIX GROUP’S CHOSEN INTENSITY MEASUREMENT
2015 2014 restated
Emissions reported above normalised to per m2
0.09 tonnes CO2e/m2
0.10 tonnes CO2e/m2
Emissions reported above normalised to kg per m2
90 kg CO2e/m2
103 kg CO2e/m2
Emissions from Group corporate offices normalised to per FTE
5.4 tonnes of CO2e/
FTE6.1 tonnes of
CO2e/FTE
Our Corporate Responsibility programme supports our commitment to monitoring and reducing our environmental footprint.
41Phoenix Group Holdings Annual Report and Accounts 2015
CO
RP
OR
ATE
GO
VER
NA
NC
EThe Directors of Phoenix Group Holdings support the high standards of corporate governance contained in the UK Corporate Governance Code.
IN THIS SECTION
Chairman’s introduction 42
Board structure 43
Board of Directors 44
Executive management team 46
Corporate governance report 47
Directors’ remuneration report 57
Directors’ report 81
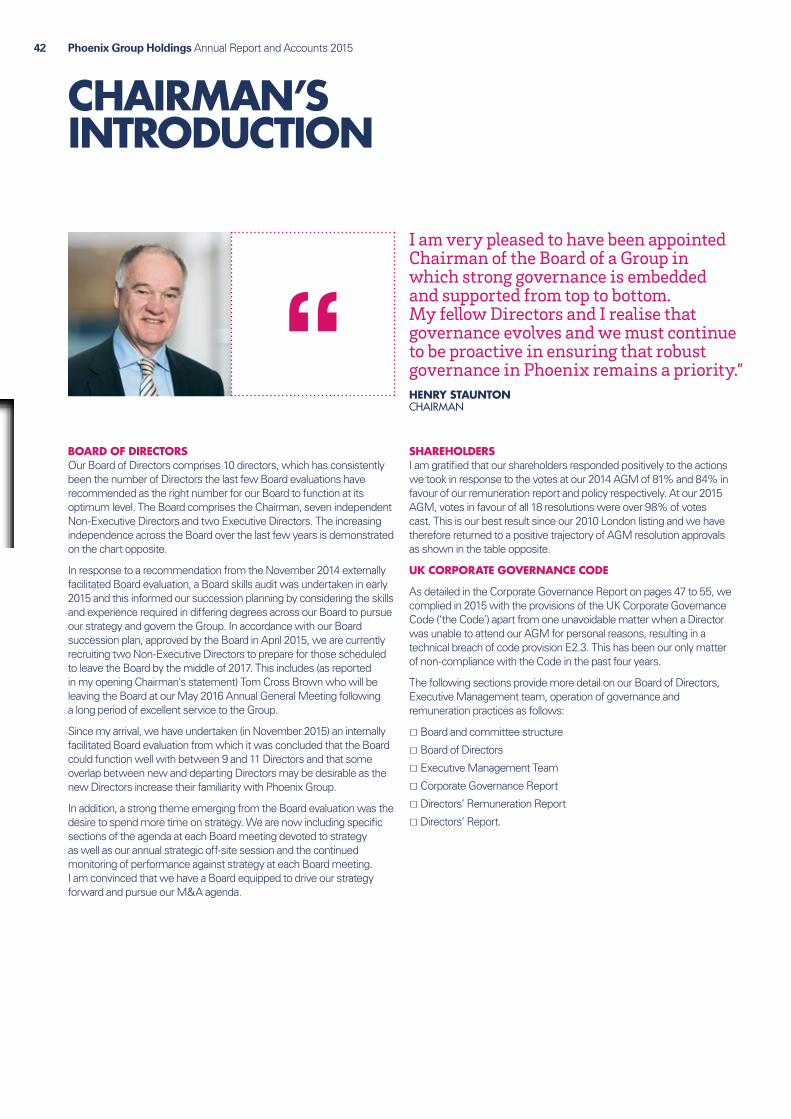
Phoenix Group Holdings Annual Report and Accounts 201542
CHAIRMAN’S INTRODUCTION
BOARD OF DIRECTORSOur Board of Directors comprises 10 directors, which has consistently been the number of Directors the last few Board evaluations have recommended as the right number for our Board to function at its optimum level. The Board comprises the Chairman, seven independent Non-Executive Directors and two Executive Directors. The increasing independence across the Board over the last few years is demonstrated on the chart opposite.
In response to a recommendation from the November 2014 externally facilitated Board evaluation, a Board skills audit was undertaken in early 2015 and this informed our succession planning by considering the skills and experience required in differing degrees across our Board to pursue our strategy and govern the Group. In accordance with our Board succession plan, approved by the Board in April 2015, we are currently recruiting two Non-Executive Directors to prepare for those scheduled to leave the Board by the middle of 2017. This includes (as reported in my opening Chairman’s statement) Tom Cross Brown who will be leaving the Board at our May 2016 Annual General Meeting following a long period of excellent service to the Group.
Since my arrival, we have undertaken (in November 2015) an internally facilitated Board evaluation from which it was concluded that the Board could function well with between 9 and 11 Directors and that some overlap between new and departing Directors may be desirable as the new Directors increase their familiarity with Phoenix Group.
In addition, a strong theme emerging from the Board evaluation was the desire to spend more time on strategy. We are now including specific sections of the agenda at each Board meeting devoted to strategy as well as our annual strategic off-site session and the continued monitoring of performance against strategy at each Board meeting. I am convinced that we have a Board equipped to drive our strategy forward and pursue our M&A agenda.
I am very pleased to have been appointed Chairman of the Board of a Group in which strong governance is embedded and supported from top to bottom. My fellow Directors and I realise that governance evolves and we must continue to be proactive in ensuring that robust governance in Phoenix remains a priority.”HENRY STAUNTONCHAIRMAN
SHAREHOLDERSI am gratified that our shareholders responded positively to the actions we took in response to the votes at our 2014 AGM of 81% and 84% in favour of our remuneration report and policy respectively. At our 2015 AGM, votes in favour of all 18 resolutions were over 98% of votes cast. This is our best result since our 2010 London listing and we have therefore returned to a positive trajectory of AGM resolution approvals as shown in the table opposite.
UK CORPORATE GOVERNANCE CODE
As detailed in the Corporate Governance Report on pages 47 to 55, we complied in 2015 with the provisions of the UK Corporate Governance Code (‘the Code’) apart from one unavoidable matter when a Director was unable to attend our AGM for personal reasons, resulting in a technical breach of code provision E2.3. This has been our only matter of non-compliance with the Code in the past four years.
The following sections provide more detail on our Board of Directors, Executive Management team, operation of governance and remuneration practices as follows:
Ɛ Board and committee structure
Ɛ Board of Directors
Ɛ Executive Management Team
Ɛ Corporate Governance Report
Ɛ Directors’ Remuneration Report
Ɛ Directors’ Report.

Phoenix Group Holdings Board and CommitteesThe main focus of the Phoenix Group Holdings Board is on Group strategy and performance, with input from board committees. The chart below sets out the composition and main activities of the Phoenix Group Holdings Board and its committees. More detailed operational and customer-focused matters are addressed at the subsidiary board and committee level.
Phoenix Group Holdings Annual Report and Accounts 2015 43Corporate governance
2011 2012 2013 2014 2015
14 14
11
10 10
7 (5
0%)
7 (5
0%)
6 (5
5%)
6 (6
0%)
7 (7
0%)
TOTAL NUMBER OF DIRECTORS
Total number of Directors
No/(%) of Independent Non-Executive Directors
BOARD STRUCTURE
AGM resolution approvalsNumber of resolutions
Percentage of votes in favour*
2015 AGM 18 98%
2014 AGM 19 80%
2013 AGM 20 96%
2012 AGM 21 97%
2011 AGM 24 96%
2010 AGM (first AGM) 22 87%* All resolutions passed by majority of at least this % of votes cast.
RISK COMMITTEEDavid Woods (Chair)Rene-Pierre AzriaAlastair BarbourTom Cross Brown
RISK COMMITTEERisk appetite and high-level risk mattersThe Group’s Risk Management Framework
PHOENIX GROUP HOLDINGS BOARDGroup StrategyGroup BudgetGroup Risk AppetitePerformance MonitoringExternal/Shareholder ReportingExternal DebtMajor transactions
NOMINATION COMMITTEEHenry Staunton (Chair)Ian CormackTom Cross Brown
NOMINATION COMMITTEEBoard appointmentsSenior executive appointmentsBoard and senior executive succession planning
AUDIT COMMITTEEAlastair Barbour (Chair)Isabel HudsonKory SorensonDavid Woods
AUDIT COMMITTEEFinancial ReportingInternal ControlsExternal AuditInternal Audit
REMUNERATION COMMITTEEIan Cormack (Chair)Isabel HudsonKory Sorenson
REMUNERATION COMMITTEEGroup remuneration frameworkExecutive Director remunerationEmployee share schemes
PHOENIX GROUP HOLDINGS BOARDHenry Staunton (Chair)Ian Cormack – SIDRene-Pierre AzriaClive Bannister*Alastair BarbourTom Cross BrownIsabel HudsonJames McConville*Kory SorensonDavid Woods
* Executive Directors

Phoenix Group Holdings Annual Report and Accounts 201544
BOARD OF DIRECTORS
RENÉ-PIERRE AZRIAINDEPENDENT NON-EXECUTIVE DIRECTOR
Committee membership Ɛ Risk Committee
Appointed to the Board2 September 2009
ExperienceRené-Pierre Azria is a senior partner at LionTree LLC, a US private advisory firm based in New York and specialising in strategic analysis and mergers and acquisitions. Prior to joining LionTree LLC, Mr Azria founded and managed Tegris LLC, also a mergers and acquisitions firm based in New York. Prior to founding Tegris LLC, Mr Azria was a worldwide partner with Rothschild & Co., based in New York. Prior to joining Rothschild & Co. in 1996, Mr Azria served as Managing Director of Blackstone Indosuez and President of the Financiere Indosuez Inc. in New York.
ALASTAIR BARBOURINDEPENDENT NON-EXECUTIVE DIRECTOR
Committee membership Ɛ Audit Committee (Chairman) Ɛ Risk Committee
Appointed to the Board1 October 2013
ExperienceAlastair Barbour has over 30 years audit experience with KPMG where he worked across the full spectrum of financial services clients from large general insurers and reinsurers to the life assurance and investment management sector, working on a range of operational and strategic issues. Mr Barbour is the former Head of Financial Services, Scotland for KPMG. He retired from KPMG in 2011 to build a Non-Executive career. He is a Director and Audit Committee Chairman of RSA Insurance Group plc, Standard Life European Private Equity Trust plc and Liontrust Asset Management plc (all London Stock Exchange listed companies). He is also a Director and Audit Committee Chairman of CATCo Reinsurance Opportunities Fund Ltd, a Bermuda-based investment company listed on the London Stock Exchange and of The Bank of N. T. Butterfield & Son Limited, a company listed in Bermuda.
HENRY STAUNTONCHAIRMAN
Committee membership Ɛ Nomination Committee (Chairman)
Appointed to the Board1 September 2015
ExperienceMr Staunton is Non-Executive Chairman of WH Smith plc, the leading FTSE250 retail group, and a Non-Executive Director of Capital & Counties Properties plc. He is also Non-Executive Chairman of the privately owned BrightHouse Group, the rent-to-own company, and a Non-Executive Director of ICBC Standard Bank, a subsidiary of ICBC.
From 2004 until 2013, Henry Staunton was a Non-Executive Director, Chairman of the Audit Committee and latterly Senior Independent Director and Vice Chairman of Legal & General Group plc, where he gained significant insight into the life and pensions industry. From 2008 to 31 December 2014 he was a Non-Executive Director of Merchants Trust plc, where he was the Senior Independent Director.
During his executive career he was Finance Director of ITV plc from 2003 to 2006, and Finance Director of Granada plc from 1993 to 2003. Prior to that he joined Price Waterhouse as a graduate trainee, rising to become a Senior Partner of the audit practice.
JAMES MCCONVILLEGROUP FINANCE DIRECTOR
Appointed to the Board28 June 2012
ExperienceBetween April 2010 and December 2011, Mr McConville was Chief Financial Officer of Northern Rock plc. Prior to that, between 1988 and 2010, he worked for Lloyds Banking Group plc (formerly Lloyds TSB Group plc) in a number of senior finance and strategy related roles, latterly as Finance Director of Scottish Widows Group and Director of Finance for the Insurance and Investments Division. During 2011 and 2012, Mr McConville was a Non-Executive Director of the life businesses of Aegon UK. In 2014, Mr McConville joined the board of Tesco Personal Finance plc as Non-Executive Director. Mr McConville qualified as a Chartered Accountant whilst at Coopers and Lybrand.
CLIVE BANNISTERGROUP CHIEF EXECUTIVE OFFICER
Appointed to the Board28 March 2011
ExperienceClive Bannister joined the Group in February 2011 as Group Chief Executive Officer. Prior to this, Mr Bannister was Group Managing Director of Insurance and Asset Management at HSBC Holdings plc. He joined HSBC in 1994 and held various leadership roles in planning and strategy in the Investment Bank (USA) and was Group General Manager and CEO of HSBC Group Private Banking. He started his career at First National Bank of Boston and prior to working at HSBC was a partner in Booz Allen Hamilton in the Financial Services Practice providing strategic support to financial institutions including leading insurance companies, banks and investment banks. Mr Bannister is also Chairman of the Museum of London.
The Group is governed by our Board of Directors. Biographical details of all Directors are shown below.

Phoenix Group Holdings Annual Report and Accounts 2015 45Corporate governance
IAN CORMACKSENIOR INDEPENDENT DIRECTOR
Committee membership Ɛ Remuneration Committee (Chairman) Ɛ Nomination Committee
Appointed to the Board2 September 2009
ExperienceMr Cormack is Non-Executive Chairman of Maven Income & Growth VCT 4 plc, a Senior Independent Director of both Partnership Assurance Group plc and Xchanging plc and a Non-Executive Director of Hastings Insurance Holdings plc. Mr Cormack was Chief Executive Officer of AIG, Inc. in Europe from 2000 to 2002 and prior to that he spent 32 years at Citibank where he was Chairman of Citibank International plc and Co-Head of the Global Financial Institutions Client Group at Citigroup.
KORY SORENSONINDEPENDENT NON-EXECUTIVE DIRECTOR
Committee membership Ɛ Audit Committee Ɛ Remuneration Committee
Appointed to the Board1 July 2014
ExperienceKory Sorenson is currently a Non-Executive Director of SCOR SE, Pernod Ricard SA, UNIQA Group and Aviva Insurance Limited. She also volunteers as a Director of the Institut Pasteur foundation in Paris. Ms Sorenson has over 20 years of financial services experience, most of which has been focused on insurance and banking. She was Managing Director, Head of Insurance Capital Markets of Barclays Capital from 2005 to 2010 and also held senior positions in the financial institutions divisions of Credit Suisse, Lehman Brothers and Morgan Stanley.
DAVID WOODSINDEPENDENT NON-EXECUTIVE DIRECTOR
Committee membership Ɛ Risk Committee (Chairman) Ɛ Audit Committee
Appointed to the Board18 February 2010
ExperienceDavid Woods is a Fellow of the Institute of Actuaries, Non-Executive Chairman of Standard Life UK Smaller Companies Trust plc and a Non-Executive Director of Murray Income Trust plc. He is also Chairman of the pension fund trustee companies responsible for the governance of all the UK defined benefits/pension schemes in the Sopra Steria Group and is a Director of Santander (UK) Group Pension Trustees Ltd.
TOM CROSS BROWNINDEPENDENT NON-EXECUTIVE DIRECTOR
Committee membership Ɛ Nomination Committee Ɛ Risk Committee
Appointed to the Board24 September 2009
ExperienceTom Cross Brown was Global Chief Executive of ABN AMRO Asset Management from 2000 to 2003, as well as Chairman of ABN AMRO Asset Management in the UK from 1997 to 2003. Prior to this, he spent 21 years with Lazard Brothers in London, latterly as Chief Executive Officer of Lazard Brothers Asset Management. Mr Cross Brown is Non-Executive Chairman of Just Retirement Group plc and is a Non-Executive Director of Artemis Alpha Trust plc.
ISABEL HUDSONINDEPENDENT NON-EXECUTIVE DIRECTOR
Committee membership Ɛ Audit Committee Ɛ Remuneration Committee
Appointed to the Board18 February 2010
ExperienceIsabel Hudson is Non-Executive Chairman of the National House Building Council and a Non-Executive Director of Standard Life PLC and BT Group plc. Ms Hudson is a former Non-Executive Director of MGM Advantage, The Pensions Regulator and QBE Insurance. Other roles previously held by Ms Hudson include Chief Financial Officer at Eureko BV and Executive Director of Prudential Assurance Company. Ms Hudson is an ambassador to Scope, a UK charity, and has 34 years of experience in the insurance industry in the UK and mainland Europe.
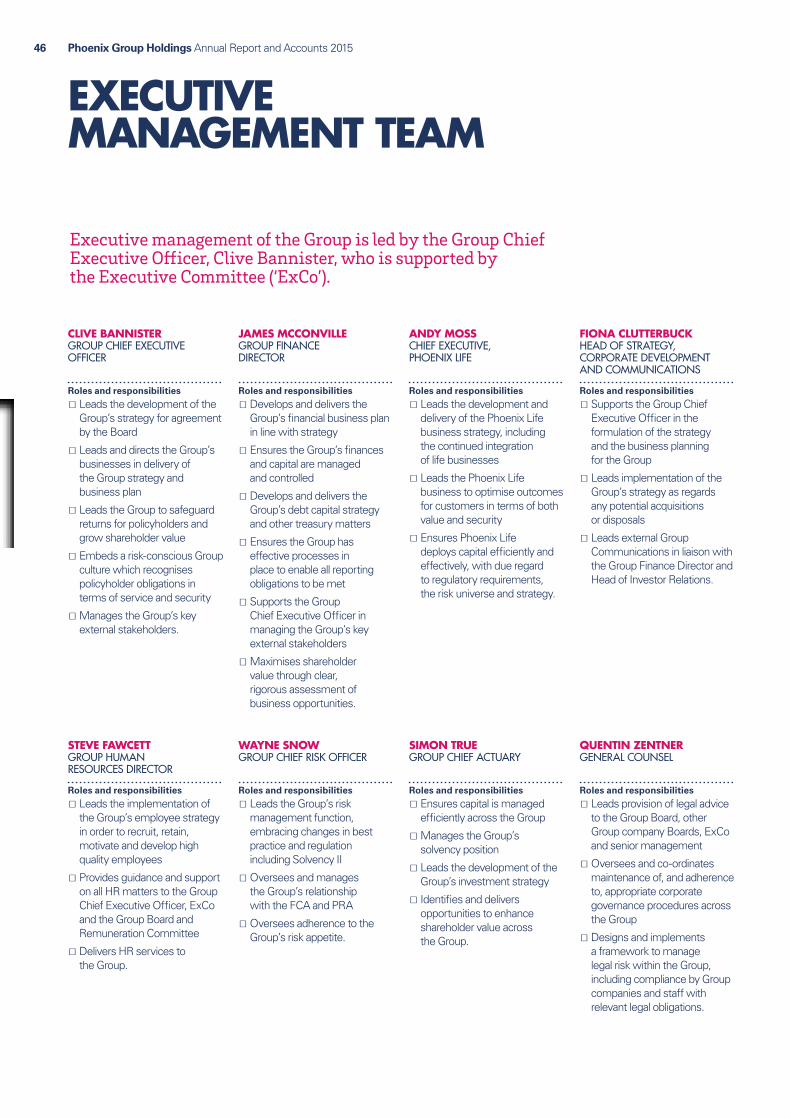
Phoenix Group Holdings Annual Report and Accounts 201546
EXECUTIVE MANAGEMENT TEAM
CLIVE BANNISTERGROUP CHIEF EXECUTIVE OFFICER
Roles and responsibilities
Ɛ Leads the development of the Group’s strategy for agreement by the Board
Ɛ Leads and directs the Group’s businesses in delivery of the Group strategy and business plan
Ɛ Leads the Group to safeguard returns for policyholders and grow shareholder value
Ɛ Embeds a risk-conscious Group culture which recognises policyholder obligations in terms of service and security
Ɛ Manages the Group’s key external stakeholders.
JAMES MCCONVILLEGROUP FINANCE DIRECTOR
Roles and responsibilities
Ɛ Develops and delivers the Group’s financial business plan in line with strategy
Ɛ Ensures the Group’s finances and capital are managed and controlled
Ɛ Develops and delivers the Group’s debt capital strategy and other treasury matters
Ɛ Ensures the Group has effective processes in place to enable all reporting obligations to be met
Ɛ Supports the Group Chief Executive Officer in managing the Group’s key external stakeholders
Ɛ Maximises shareholder value through clear, rigorous assessment of business opportunities.
ANDY MOSSCHIEF EXECUTIVE, PHOENIX LIFE
Roles and responsibilities
Ɛ Leads the development and delivery of the Phoenix Life business strategy, including the continued integration of life businesses
Ɛ Leads the Phoenix Life business to optimise outcomes for customers in terms of both value and security
Ɛ Ensures Phoenix Life deploys capital efficiently and effectively, with due regard to regulatory requirements, the risk universe and strategy.
FIONA CLUTTERBUCKHEAD OF STRATEGY, CORPORATE DEVELOPMENT AND COMMUNICATIONS
Roles and responsibilities
Ɛ Supports the Group Chief Executive Officer in the formulation of the strategy and the business planning for the Group
Ɛ Leads implementation of the Group’s strategy as regards any potential acquisitions or disposals
Ɛ Leads external Group Communications in liaison with the Group Finance Director and Head of Investor Relations.
STEVE FAWCETTGROUP HUMAN RESOURCES DIRECTOR
Roles and responsibilities
Ɛ Leads the implementation of the Group’s employee strategy in order to recruit, retain, motivate and develop high quality employees
Ɛ Provides guidance and support on all HR matters to the Group Chief Executive Officer, ExCo and the Group Board and Remuneration Committee
Ɛ Delivers HR services to the Group.
QUENTIN ZENTNERGENERAL COUNSEL
Roles and responsibilities
Ɛ Leads provision of legal advice to the Group Board, other Group company Boards, ExCo and senior management
Ɛ Oversees and co-ordinates maintenance of, and adherence to, appropriate corporate governance procedures across the Group
Ɛ Designs and implements a framework to manage legal risk within the Group, including compliance by Group companies and staff with relevant legal obligations.
WAYNE SNOWGROUP CHIEF RISK OFFICER
Roles and responsibilities
Ɛ Leads the Group’s risk management function, embracing changes in best practice and regulation including Solvency II
Ɛ Oversees and manages the Group’s relationship with the FCA and PRA
Ɛ Oversees adherence to the Group’s risk appetite.
SIMON TRUEGROUP CHIEF ACTUARY
Roles and responsibilities
Ɛ Ensures capital is managed efficiently across the Group
Ɛ Manages the Group’s solvency position
Ɛ Leads the development of the Group’s investment strategy
Ɛ Identifies and delivers opportunities to enhance shareholder value across the Group.
Executive management of the Group is led by the Group Chief Executive Officer, Clive Bannister, who is supported by the Executive Committee (‘ExCo’).

Phoenix Group Holdings Annual Report and Accounts 2015 47Corporate governance
CORPORATE GOVERNANCE REPORT
INTRODUCTIONThe Board is committed to high standards of corporate governance and the Group’s Corporate Governance policy is aligned to compliance with the UK Corporate Governance Code (‘the Code’) which sets standards of good practice for UK listed companies. It is the Board’s view that the Company has been fully compliant during 2015 with the provisions set down in the Code apart from provision E.2.3 due to one Director being unable to attend the AGM for personal reasons.
THE BOARDThe Board comprises the Non-Executive Chairman, the Group Chief Executive Officer, the Group Finance Director and seven independent Non-Executive Directors. Biographical details of all Directors are provided on pages 44 to 45.
A Chairman (10%)
B Executive Directors (20%)
C Non-Executive Directors (70%)
A
B
C
BOARD COMPOSITION
The Board skillset must be aligned to the Group strategy of enhancing value for shareholders and policyholders and taking forward the Group’s M&A agenda. The Board undertook a skills audit in the first half of 2015, evaluating the Directors’ skills against strategic requirements. The output has been used to inform succession and recruitment of Directors. A further skills audit will be undertaken in the first half of 2017, to ensure the Board skillset continues to be appropriate to the Group’s strategy and the external environment.
The Board considers that the following Directors are independent: Rene-Pierre Azria, Alastair Barbour, Ian Cormack, Tom Cross Brown, Isabel Hudson, Kory Sorenson and David Woods. The Board has considered the criteria proposed by the Code in assessing the independence of the Directors, in particular the following:
Ɛ The Board had previously considered Rene-Pierre Azria not to be independent as a firm he was connected with had undertaken services for two shareholders, each holding more than 3% of the Company’s issued share capital. Those two shareholders have each sold down their shareholding to less than 0.5% and are no longer significant shareholders. Therefore, the Board has concluded that Mr Azria can be considered independent as (a) he acts in a wholly independent manner in character and judgement and (b) none of the relationships or circumstances listed in provision B1.1 of the Code apply to Mr Azria.
Ɛ Tom Cross Brown is the non-executive Chairman of Just Retirement Group plc. The Group has an arrangement with Just Retirement whereby Phoenix customers may be referred to Just Retirement to enable them to explore enhanced annuities should they wish to do so. The decisions regarding this arrangement are not made by the Board of Phoenix Group Holdings and the relationship is not considered to impact the independent status of Tom Cross Brown.
Ɛ Isabel Hudson is a non-executive director of Standard Life PLC which has investment management arrangements with the Phoenix Life subsidiary companies. The decisions regarding these arrangements are not made by the Board of Phoenix Group Holdings and the relationship is not considered to impact the independent status of Isabel Hudson.
The remuneration of the Directors is shown in the Directors’ Remuneration Report on pages 57 and 80. The terms and conditions of appointment of Non-Executive Directors are on the Group’s website. In accordance with the provisions of the Articles and the Code, all Directors (except Tom Cross Brown, who is standing down from the Board) will submit themselves for election or re-election at the Company’s AGM on 11 May 2016.
The Board is responsible to the shareholders for the overall performance of the Group. The Board’s role is to provide entrepreneurial leadership within a framework of prudent and effective controls which enables risk to be assessed and managed. The Board has a schedule of matters reserved for its consideration and approval supported by a set of operating principles. These matters include:
Ɛ Group strategy and business plans
Ɛ Major acquisitions, investments and capital expenditure
Ɛ Financial reporting and controls
Ɛ Dividend policy
Ɛ Capital structure
Ɛ The constitution of Board committees
Ɛ Appointments to the Board and Board committees
Ɛ Senior executive appointments
Ɛ Key Group policies.
The schedule of matters reserved for the Board is available from the Group Company Secretary. Matters which are not reserved for the Board and also its committees under their terms of reference (which are available on the Group website), or for shareholders in general meetings, are delegated to the executive management under a schedule of delegated authorities approved by the Board.
The head office of the Company is in Jersey and, as such, the Board and its committees hold their meetings in Jersey.

Phoenix Group Holdings Annual Report and Accounts 201548
CORPORATE GOVERNANCE REPORT Continued
THE CHAIRMAN, GROUP CHIEF EXECUTIVE OFFICER AND SENIOR INDEPENDENT DIRECTORHenry Staunton is Chairman of the Board of Directors of the Company, having succeeded Howard Davies on 1 September 2015. There is a division of responsibility, approved by the Board, between the Chairman, who is responsible for the leadership and effective operation of the Board and the Group Chief Executive Officer, Clive Bannister, who is responsible to the Board for the overall management and operation of the Group. The Chairman’s other commitments are set out in his biographical details on page 44. The Chairman was appointed on the basis of committing two days per week to Phoenix.
The Senior Independent Director, appointed by the Board, is Ian Cormack. His role is to be available to shareholders whose concerns are not resolved through the normal channels or when such channels are inappropriate. He is also responsible for leading the annual appraisal of the Chairman’s performance by the Non-Executive Directors.
BOARD EFFECTIVENESSIn accordance with the Code, an evaluation of the performance of the Board and that of its Committees and individual Directors was undertaken in the latter part of 2015. The process was led by the Chairman and internally facilitated by the Company Secretary. The process involved completion by Directors of a questionnaire covering various aspects of Board, Committee and Director effectiveness followed by individual meetings between the Chairman and each Director, concluding in a Board report which was discussed by the Board in November 2015. Key outputs from the review are shown below:
KEY OUTPUTS FROM THE 2015 BOARD EFFECTIVENESS REVIEW: Ɛ A strong theme was the desire to spend more time on strategy.
Ɛ Much of the discussion related to proposals to improve Board processes and operations to facilitate better use of Directors’ time.
Ɛ The Board skillset is considered balanced and right, with a continued focus on required skills in capital markets and M&A.
An action list, with senior executive accountability, has been established to address the recommendations from the November 2015 evaluation.
The table below shows how the main recommendations from the November 2014 evaluation were addressed in 2015.
The output from the November 2015 Board and individual director reviews informed the review of the Board composition undertaken by the Board Nomination Committee in January 2016, leading to the Board’s recommendations to shareholders regarding re-election of Directors at the 2016 Annual General Meeting (‘AGM’).
All Directors receive a tailored induction on joining the Board in accordance with a process approved by the Board. The new Group Chairman, Henry Staunton, undertook a comprehensive induction before and following his appointment in September 2015. This included a focus on the new Solvency II reporting environment, applicable from 1 January 2016, as well as detailed strategic and operational briefings and information.
To ensure that the Directors maintain up-to-date skills and knowledge of the Company, all Directors receive regular presentations on different aspects of the Company’s business and on financial, legal and regulatory issues.

Phoenix Group Holdings Annual Report and Accounts 2015 49Corporate governance
OPERATION OF THE BOARDThe terms of appointment for the Directors state that they are expected to attend in person regular (at least six per year) and additional Board meetings of the Company and to devote appropriate preparation time ahead of each meeting. In January 2016, the Nomination Committee reviewed the time spent by Directors and concluded that the time required of (and given by) the Company’s Directors is considered at least at the level expected in their appointment terms and is believed to be high in comparison to other FTSE 250 companies.
Alastair Barbour, on account of being on the boards of a number of public companies listed in the UK and/or Bermuda and chairing the audit committee for all, has provided an analysis of his work commitments to the Nomination Committee, which shows the relatively low level of time commitment required for certain of his other roles and the complementary nature of his roles and the time committed to Phoenix (40 days in 2015, his second biggest role). The Nomination Committee and Board confirmed their satisfaction with the time and overall commitment given to Phoenix by Mr Barbour and all other directors.
The Board met seven times during 2015 and is scheduled to meet seven times in 2016 including for a two day strategy-setting meeting. Additional meetings will be held as required, and the Non-Executive Directors will hold meetings with the Chairman, without the Executive Directors being present, as they did on several occasions in 2015.
BOARD COMMITTEESThe Board has delegated specific responsibilities to four standing committees of the Board. The terms of reference of the committees can be found on the Company’s website.
KEY FOCUS AREAS AT BOARD MEETINGS Ɛ Reports from Chairs of Board committees and subsidiary Boards
Ɛ CEO Report
Ɛ Management Information Report
Ɛ Financial Reporting
Ɛ Strategy and Planning
Ɛ Consideration of corporate transactions
Ɛ Board and Board Committee changes and issues.
Board attendance 2015Board meetings
Maximum Actual
Chairman
Howard Davies¹ 5 5
Henry Staunton² 2 2
Executive Directors
Clive Bannister (CEO) 7 7
James McConville (FD) 7 7
Non-Executive Directors
René-Pierre Azria 7 7
Alastair Barbour 7 7
Ian Cormack 7 7
Tom Cross Brown 7 6
Isabel Hudson 7 7
Kory Sorenson 7 7
David Woods 7 71 Howard Davies resigned from the Board on 31 August 2015.2 Henry Staunton was appointed to the Board on 1 September 2015.
PROGRESS AGAINST ACTIONS FROM THE EXTERNALLY-FACILITATED 2014 BOARD EFFECTIVENESS REVIEW:
Action Status
Conduct skills audit over next 12 months. Skills Audit conducted, matching Board skills to the Group’s strategic requirements and reported to the Board in April 2015. The output has informed the skills required to replace those Directors due to vacate the Board over the next 18 months.
Provide clearer direction/priorities in Board papers which should be simplified and shortened where possible.
Addressed, with ongoing monitoring expected.
Provide more life assurance sector intelligence (acknowledging that this is addressed in detail at the regulated life company subsidiary boards).
Briefings provided to the Board on the commercial and regulatory environment facing the life assurance sector and the Senior Insurance Manager Regime; process established to provide Non-Executive Directors with ongoing media and press information on the life and pensions sector.
Conduct reviews of significant past decisions. Reviews of major recent decisions presented to the Board in April 2015 and October 2015.
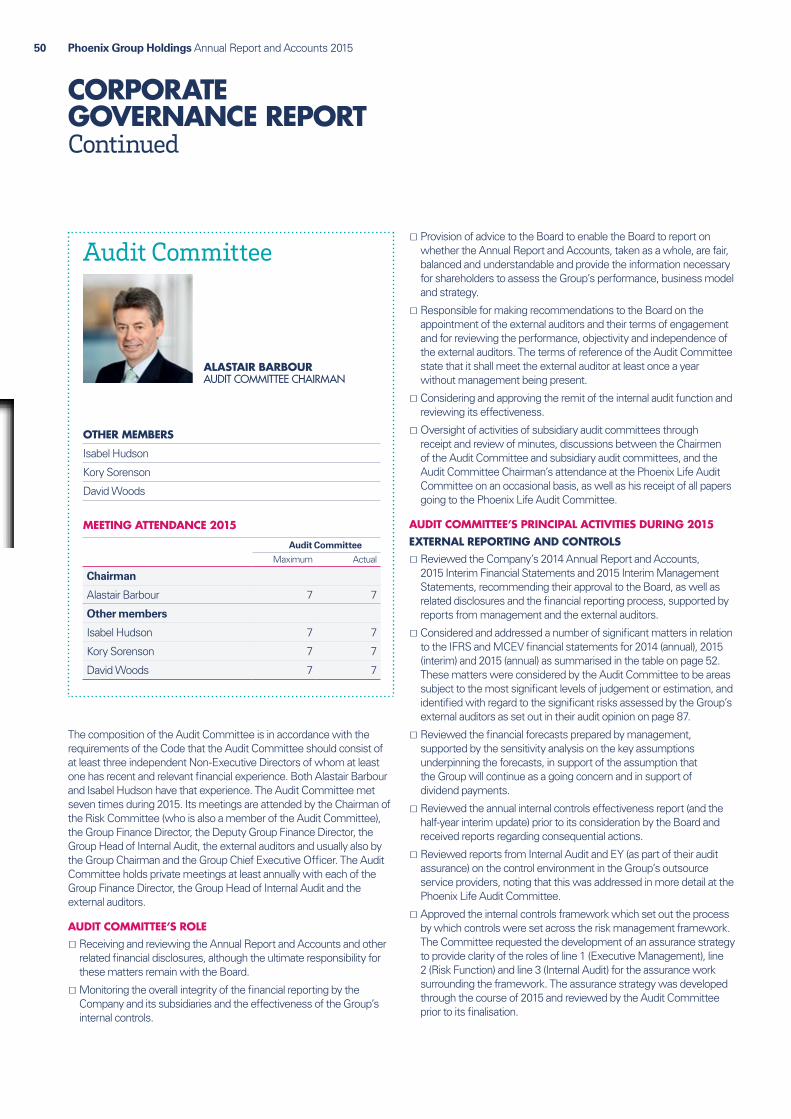
Phoenix Group Holdings Annual Report and Accounts 201550
CORPORATE GOVERNANCE REPORT Continued
Ɛ Provision of advice to the Board to enable the Board to report on whether the Annual Report and Accounts, taken as a whole, are fair, balanced and understandable and provide the information necessary for shareholders to assess the Group’s performance, business model and strategy.
Ɛ Responsible for making recommendations to the Board on the appointment of the external auditors and their terms of engagement and for reviewing the performance, objectivity and independence of the external auditors. The terms of reference of the Audit Committee state that it shall meet the external auditor at least once a year without management being present.
Ɛ Considering and approving the remit of the internal audit function and reviewing its effectiveness.
Ɛ Oversight of activities of subsidiary audit committees through receipt and review of minutes, discussions between the Chairmen of the Audit Committee and subsidiary audit committees, and the Audit Committee Chairman’s attendance at the Phoenix Life Audit Committee on an occasional basis, as well as his receipt of all papers going to the Phoenix Life Audit Committee.
AUDIT COMMITTEE’S PRINCIPAL ACTIVITIES DURING 2015EXTERNAL REPORTING AND CONTROLS
Ɛ Reviewed the Company’s 2014 Annual Report and Accounts, 2015 Interim Financial Statements and 2015 Interim Management Statements, recommending their approval to the Board, as well as related disclosures and the financial reporting process, supported by reports from management and the external auditors.
Ɛ Considered and addressed a number of significant matters in relation to the IFRS and MCEV financial statements for 2014 (annual), 2015 (interim) and 2015 (annual) as summarised in the table on page 52. These matters were considered by the Audit Committee to be areas subject to the most significant levels of judgement or estimation, and identified with regard to the significant risks assessed by the Group’s external auditors as set out in their audit opinion on page 87.
Ɛ Reviewed the financial forecasts prepared by management, supported by the sensitivity analysis on the key assumptions underpinning the forecasts, in support of the assumption that the Group will continue as a going concern and in support of dividend payments.
Ɛ Reviewed the annual internal controls effectiveness report (and the half-year interim update) prior to its consideration by the Board and received reports regarding consequential actions.
Ɛ Reviewed reports from Internal Audit and EY (as part of their audit assurance) on the control environment in the Group’s outsource service providers, noting that this was addressed in more detail at the Phoenix Life Audit Committee.
Ɛ Approved the internal controls framework which set out the process by which controls were set across the risk management framework. The Committee requested the development of an assurance strategy to provide clarity of the roles of line 1 (Executive Management), line 2 (Risk Function) and line 3 (Internal Audit) for the assurance work surrounding the framework. The assurance strategy was developed through the course of 2015 and reviewed by the Audit Committee prior to its finalisation.
ALASTAIR BARBOURAUDIT COMMITTEE CHAIRMAN
OTHER MEMBERS
Isabel Hudson
Kory Sorenson
David Woods
MEETING ATTENDANCE 2015
Audit Committee
Maximum Actual
Chairman
Alastair Barbour 7 7
Other members
Isabel Hudson 7 7
Kory Sorenson 7 7
David Woods 7 7
Audit Committee
The composition of the Audit Committee is in accordance with the requirements of the Code that the Audit Committee should consist of at least three independent Non-Executive Directors of whom at least one has recent and relevant financial experience. Both Alastair Barbour and Isabel Hudson have that experience. The Audit Committee met seven times during 2015. Its meetings are attended by the Chairman of the Risk Committee (who is also a member of the Audit Committee), the Group Finance Director, the Deputy Group Finance Director, the Group Head of Internal Audit, the external auditors and usually also by the Group Chairman and the Group Chief Executive Officer. The Audit Committee holds private meetings at least annually with each of the Group Finance Director, the Group Head of Internal Audit and the external auditors.
AUDIT COMMITTEE’S ROLE Ɛ Receiving and reviewing the Annual Report and Accounts and other related financial disclosures, although the ultimate responsibility for these matters remain with the Board.
Ɛ Monitoring the overall integrity of the financial reporting by the Company and its subsidiaries and the effectiveness of the Group’s internal controls.
Phoenix Group Holdings Annual Report and Accounts 2015 51Corporate governance
EXTERNAL AUDIT Ɛ Reviewed the effectiveness, engagement and remuneration of the external auditors, recommending their re-appointment to the Board and thence to shareholders.
Ɛ Reviewed and monitored the independence of the external auditors including their provision of non-audit services.
Ɛ Monitored the engagement of the external auditors for non-audit work in accordance with approved policy.
Ɛ Considered and agreed the timing for a tendering exercise for the external audit engagement – see ‘Auditor’s appointment’.
INTERNAL AUDIT Ɛ Reviewed the External Quality Assessment of the internal audit function (‘EQA’), undertaken by Independent Audit, the conclusion being that the internal audit function was effective in its role, and suggesting areas for development.
Ɛ Approved the Group Internal Audit Proposition for 2015–2016 which had been updated to reflect the recommendations of the EQA.
Ɛ Approved the annual update of the Group Internal Audit Charter (which was aligned to the CIIA Code for ‘Effective Internal Audit in Financial Services’) and the Group Internal Audit Plan (including its link to the Risk Management Framework), receiving regular reports to monitor progress against the plan. In line with the developing proposition, the Internal Audit Plan was split between static/risk policy audits and dynamic/thematic audits.
Ɛ Reviewed the internal audit control environment opinion which included Internal Audit’s view on the embedding of the risk management framework across the Group.
Ɛ Reviewed the report by the Internal Audit Function on internal audit effectiveness in the Group’s outsource service providers (‘OSPs’); and reviewed internal audit reports on information security in the OSPs, noting the extensive oversight in Phoenix and that more detailed OSP oversight was undertaken by the Phoenix Life Audit Committee.
Ɛ Noted an initial review of the potential role of internal audit in risk culture governance.
AUDIT COMMITTEE’S PERFORMANCE Ɛ Reviewed the Audit Committee’s performance, constitution and terms of reference, noting that all its duties had been addressed in accordance with its terms of reference, and that the Board would undertake its own review of the performance of the Board committees. The Audit Committee agreed, and recommended to the Board, a change to its terms of reference to reflect responsibility for reviewing the internal controls and assurance framework and remove duplication with the Risk Committee.
GENERAL Ɛ Reviewed arrangements for whistleblowing (and whistleblowing activity) should an employee wish to raise concerns, in confidence, about any possible improprieties; this being reviewed in the context of the market data available, requested by the Audit Committee and provided by EY.
Ɛ Reviewed and approved updates to the Group Tax Policy and the Group Liquidity & Funding Policy.
ASSESSMENT OF THE EFFECTIVENESS OF THE EXTERNAL AUDIT PROCESSThe effectiveness of the external audit process was assessed through the completion of an assessment questionnaire by the key divisions and Group functions within Phoenix Group. The feedback covered EY’s performance with regard to their audits under the IFRS, MCEV, Solvency I and Solvency II bases of reporting. To provide a more detailed analysis, the review was supported by the utilisation of an online questionnaire based tool provided by a third party supplier. The output from the review enabled management to identify key areas of focus to facilitate the audit process and enhanced understanding of the importance of various criteria with regard to the external auditor relationship for a future tender exercise. The Audit Committee contributed feedback to the exercise, considered the effectiveness of the process and reviewed the overall findings.
AUDITOR’S APPOINTMENT The current auditors, EY, were appointed in September 2009. However, EY have been auditors to significant parts of the Group for a longer period. In accordance with the requirements of The Statutory Audit Services for Large Companies Market Investigation (Mandatory Use of Competitive Tender Processes and Audit Committee Responsibilities) Order 2014, the Audit Committee has decided to undertake a competitive audit tender in 2016 to be effective for the 2017 statutory audit, which it considers in the best interests of its shareholders in light of the length of association with the current auditors.
AUDITOR’S INDEPENDENCEThe Company has adopted a Charter of Statutory Auditor Independence, which requires the Company and the external auditors to take measures to safeguard the objectivity and independence of the external auditors. These measures include a prohibition regarding non-audit services in respect of specific areas, such as secondments to management positions, or those which could create a conflict or perceived conflict. It also includes details of the procedures for the rotation of the external engagement partner. The Charter can be found on the Group’s website.

Phoenix Group Holdings Annual Report and Accounts 201552
CORPORATE GOVERNANCE REPORT Continued
SIGNIFICANT MATTERS CONSIDERED BY THE AUDIT COMMITTEE IN RELATION TO THE FINANCIAL STATEMENTS
Significant matters in relation to the 2015 IFRS financial statements and MCEV supplementary information How these issues were addressed
Review of the actuarial valuation process, to include the setting of actuarial assumptions and methodologies, and the robustness of actuarial data
Ɛ Management presented papers to the Phoenix Life Audit Committee detailing recommendations for the actuarial assumptions and methodologies to be used for the interim and year-end reporting periods with justification and benchmarking as appropriate. These assumptions and methodologies were debated and challenged by the Phoenix Life Audit Committee, focusing on longevity and persistency in relation to demographics and on credit in relation to economics, prior to their approval. The assumptions reflected methodology and model improvements from the new actuarial reporting system referred to in the 2014 Annual Report and largely implemented during 2015.
Ɛ A summary of these papers was presented for oversight review by the Audit Committee, and the Phoenix Life Audit Committee’s conclusions were reported to the Audit Committee through minutes of its meeting and a discussion between the Chairmen of the two committees. The Audit Committee discussed, and questioned management and EY on, the content of the summary papers and the Phoenix Life Audit Committee’s conclusions.
Ɛ The Audit Committee received and considered detailed written and verbal reporting from the external auditors setting out their observations and conclusions in respect of the assumptions, methodologies and actuarial models. Pension assumptions for use in the IAS 19 Employee Benefits valuations were reviewed and approved by the Audit Committee prior to the finalisation of the valuation reports.
Ɛ Economic assumptions for use in the MCEV valuation were reviewed and approved by the Audit Committee.
Ɛ The Audit Committee requested and received a dedicated training session to enhance its knowledge of the different bases of assumptions setting.
Tax provisioning and the recoverability of deferred tax assets
Ɛ As part of the interim and year-end reporting process, the Audit Committee considered presentations from management that provided an update on taxation risks and exposures, provisioning levels and matters pertaining to the recoverability of deferred tax assets.
Valuation of complex and illiquid financial assets
Ɛ Management presented papers setting out the basis of valuation of financial assets, including changes in methodology and assumptions, for the interim and year-end reporting periods to the Phoenix Life Audit Committee. The assumptions, valuations and processes, particularly for financial assets determined by valuation techniques using significant non-observable inputs (Level 3), were debated and challenged by the Phoenix Life Audit Committee prior to being approved.
Ɛ The valuation information was then presented for oversight review by the Audit Committee who considered and confirmed the appropriateness of the basis of valuation.
Operating Profit Ɛ The Audit Committee reviewed the allocation of key items to operating profit to ensure the allocations were in line with the Group’s operating profit framework and consistent with previous practice.
Assessment of whether the Annual Report and Accounts are fair, balanced and understandable
Ɛ The Audit Committee considered an analysis of the processes (which had been further developed during 2015) and conclusions in support of management’s conclusions that the Annual Report and Accounts are fair, balanced and understandable. In particular, the Audit Committee sought assurance as to the review processes that operated over the production of the Annual Report and Accounts.
Going concern analysis Ɛ A comprehensive going concern assessment was undertaken by the Audit Committee for the 2015 year end and 2015 interim reporting periods, based on an assessment by management of the Group’s liquidity for the going concern review period together with forecasts and a stress and sensitivity analysis. The analysis also confirmed that all regulatory and working capital requirements would be met under the base case and adverse stress scenarios throughout the going concern review period.
Viability Statement Ɛ The Audit Committee reviewed the processes to support the Viability Statement proposed by provision C2.2 in the UK Corporate Governance Code. The Committee decided that the period covered by the viability statement should be five years to align it to the Group’s business planning.

Remuneration Committee
Phoenix Group Holdings Annual Report and Accounts 2015 53Corporate governance
IAN CORMACKREMUNERATION COMMITTEE CHAIRMAN
OTHER MEMBERS
Isabel Hudson
Kory Sorenson
MEETING ATTENDANCE 2015
Remuneration Committee
Maximum Actual
Chairman
Ian Cormack 6 6
Other members
Isabel Hudson 6 6
Kory Sorenson 6 6
The composition of the Remuneration Committee accords with the requirements of the Code that the Remuneration Committee should consist of at least three independent Non-Executive Directors. The Remuneration Committee met six times during 2015.
The Remuneration Committee is responsible for making recommendations to the Board on the Company’s remuneration and compensation plans, policies and practices and for determining, within agreed terms of reference, specific remuneration packages for the Executive Directors. These include pension rights and executive incentive schemes to encourage superior performance. Details of the remuneration structure and the Remuneration Committee’s activities in 2015 are provided in the Directors’ Remuneration Report on pages 57 to 80.
FIT Remuneration Consultants provided advice to the Remuneration Committee in 2015 and are independent of the Group.
Read more about our remuneration structure and Remuneration Committee activities
57

Phoenix Group Holdings Annual Report and Accounts 201554
CORPORATE GOVERNANCE REPORT Continued
The establishment of a Risk Committee is not a requirement of the Code. However, the Board believes such a Committee is important to ensure the robust oversight of the management of risk within the Group. The composition of the Risk Committee, with a majority of independent Non-Executive Directors, is in accordance with the final recommendations of the report by Sir David Walker titled ‘A review of corporate governance in UK banks and other financial industry entities’. The Risk Committee met six times in 2015. Its meetings are attended by the Chairman of the Audit Committee (who is also a member of the Risk Committee), the Chief Risk Officer, the Group Head of Internal Audit and occasionally also by the Group Chairman and the Group Chief Executive Officer.
The Risk Committee advises the Board on risk appetite and tolerance in setting the future strategy, taking account of the Board’s overall degree of risk aversion, the current financial situation of the Group and the Group’s capacity to manage and control risks within the agreed strategy. It advises the Board on all high level risk matters. Details of the Risk Management Framework, for which the Risk Committee has oversight, are provided in the Risk Management section on pages 34 to 39.
RISK COMMITTEE’S PRINCIPAL ACTIVITIES DURING 2015 Ɛ Reviewed the Group’s risk appetite and recommended to the Board the Group’s overall risk management strategy.
Ɛ Approved the Group Risk Function’s 2016 plan and monitored progress against the 2015 Group Risk Function plan.
Ɛ Considered any breaches of the Group’s risk appetite.
Ɛ Monitored compliance with the Group’s principal risk policies, satisfying itself that action plans to address significant breaches of those policies were sufficient.
Ɛ Reviewed the Group’s risk profile, monitoring it against the risk categories of Market, Insurance, Credit, Financial Soundness, Customer and Operational with particular attention to risk appetite, risk trends, risk concentrations, provisions, experience against budget and key performance indicators for risk.
Ɛ Provided oversight of, and challenge to, the design and execution of the Group’s stress and scenario testing, including any changes of assumptions.
Ɛ Undertook horizon scanning to consider emerging risks that could impact the Group including more prominent badging of forward-looking work in risk papers as proposed by the November 2014 Board Evaluation Report.
Ɛ Conducted a detailed risk governance review which included the establishment of a dedicated Risk Committee of the Phoenix Life Board to provide additional Board Committee focus on risk matters.
Ɛ Agreed a set of operating principles for the Group and Phoenix Life Board Risk Committees to support their work in providing effective risk oversight of the Group.
DAVID WOODSRISK COMMITTEE CHAIRMAN
OTHER MEMBERS
René Pierre Azria
Alastair Barbour
Tom Cross Brown
MEETING ATTENDANCE 2015
Risk Committee
Maximum Actual
Chairman
David Woods 6 6
Other members
René Pierre Azria 6 6
Alastair Barbour 6 6
Tom Cross Brown 6 3
Read more about our Risk Management Framework
34
Risk Committee
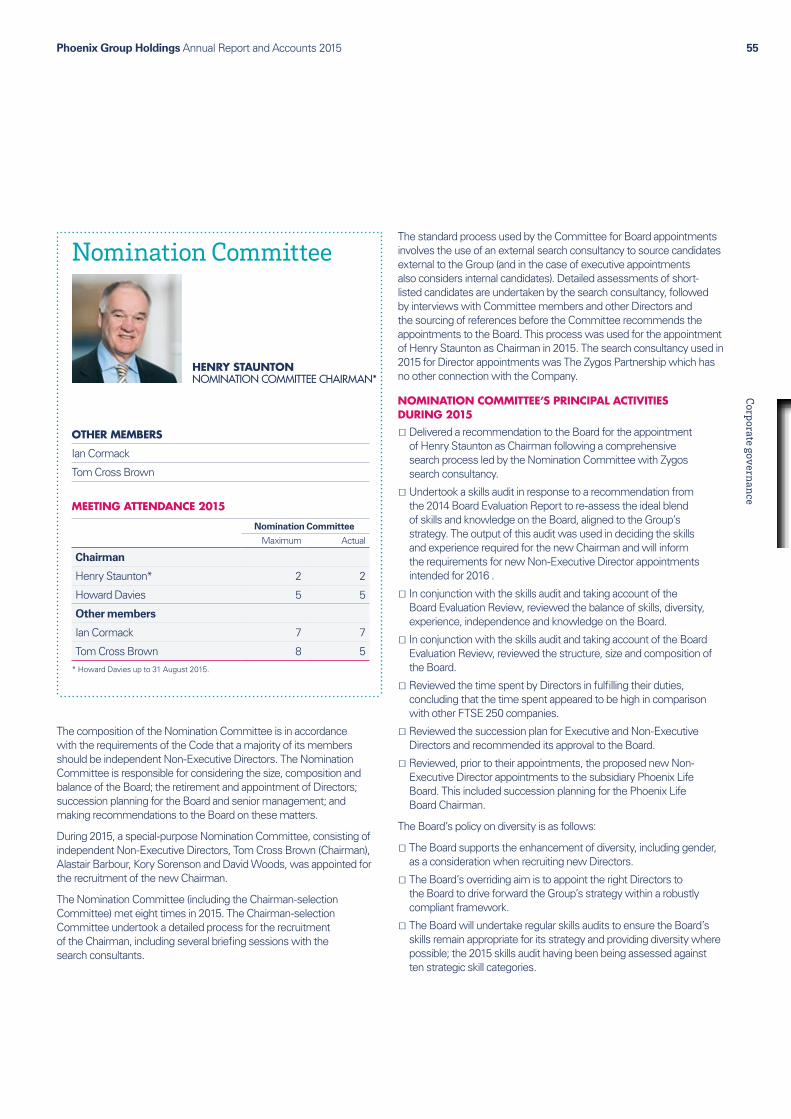
Phoenix Group Holdings Annual Report and Accounts 2015 55Corporate governance
The standard process used by the Committee for Board appointments involves the use of an external search consultancy to source candidates external to the Group (and in the case of executive appointments also considers internal candidates). Detailed assessments of short-listed candidates are undertaken by the search consultancy, followed by interviews with Committee members and other Directors and the sourcing of references before the Committee recommends the appointments to the Board. This process was used for the appointment of Henry Staunton as Chairman in 2015. The search consultancy used in 2015 for Director appointments was The Zygos Partnership which has no other connection with the Company.
NOMINATION COMMITTEE’S PRINCIPAL ACTIVITIES DURING 2015
Ɛ Delivered a recommendation to the Board for the appointment of Henry Staunton as Chairman following a comprehensive search process led by the Nomination Committee with Zygos search consultancy.
Ɛ Undertook a skills audit in response to a recommendation from the 2014 Board Evaluation Report to re-assess the ideal blend of skills and knowledge on the Board, aligned to the Group’s strategy. The output of this audit was used in deciding the skills and experience required for the new Chairman and will inform the requirements for new Non-Executive Director appointments intended for 2016 .
Ɛ In conjunction with the skills audit and taking account of the Board Evaluation Review, reviewed the balance of skills, diversity, experience, independence and knowledge on the Board.
Ɛ In conjunction with the skills audit and taking account of the Board Evaluation Review, reviewed the structure, size and composition of the Board.
Ɛ Reviewed the time spent by Directors in fulfilling their duties, concluding that the time spent appeared to be high in comparison with other FTSE 250 companies.
Ɛ Reviewed the succession plan for Executive and Non-Executive Directors and recommended its approval to the Board.
Ɛ Reviewed, prior to their appointments, the proposed new Non-Executive Director appointments to the subsidiary Phoenix Life Board. This included succession planning for the Phoenix Life Board Chairman.
The Board’s policy on diversity is as follows:
Ɛ The Board supports the enhancement of diversity, including gender, as a consideration when recruiting new Directors.
Ɛ The Board’s overriding aim is to appoint the right Directors to the Board to drive forward the Group’s strategy within a robustly compliant framework.
Ɛ The Board will undertake regular skills audits to ensure the Board’s skills remain appropriate for its strategy and providing diversity where possible; the 2015 skills audit having been being assessed against ten strategic skill categories.
HENRY STAUNTONNOMINATION COMMITTEE CHAIRMAN*
OTHER MEMBERS
Ian Cormack
Tom Cross Brown
MEETING ATTENDANCE 2015
Nomination Committee
Maximum Actual
Chairman
Henry Staunton* 2 2
Howard Davies 5 5
Other members
Ian Cormack 7 7
Tom Cross Brown 8 5* Howard Davies up to 31 August 2015.
The composition of the Nomination Committee is in accordance with the requirements of the Code that a majority of its members should be independent Non-Executive Directors. The Nomination Committee is responsible for considering the size, composition and balance of the Board; the retirement and appointment of Directors; succession planning for the Board and senior management; and making recommendations to the Board on these matters.
During 2015, a special-purpose Nomination Committee, consisting of independent Non-Executive Directors, Tom Cross Brown (Chairman), Alastair Barbour, Kory Sorenson and David Woods, was appointed for the recruitment of the new Chairman.
The Nomination Committee (including the Chairman-selection Committee) met eight times in 2015. The Chairman-selection Committee undertook a detailed process for the recruitment of the Chairman, including several briefing sessions with the search consultants.
Nomination Committee

Phoenix Group Holdings Annual Report and Accounts 201556
CORPORATE GOVERNANCE REPORT Continued
COMMUNICATION WITH SHAREHOLDERSThe Company places considerable importance on communication with shareholders and regularly engages with them on a wide range of issues.
The Company’s Investor Relations department is dedicated to facilitating communication with investors and analysts and an active investor relations programme is maintained.
During 2015 the Company’s Investor Relations department and management held the following activity:
Ɛ 11 days of roadshows meeting investors
Ɛ 7 institutional conferences holding one-on-one or group meetings with investors
Ɛ 120 face-to-face meetings with investors and analysts.
At these meetings a wide range of relevant issues including strategy, performance, management and governance are discussed. The Chairman, Senior Independent Director and Executive Directors are available to meet investors and analysts when required. Should major shareholders wish to meet newly appointed Directors, or any of the Directors generally, they are welcome to do so.
In addition, continued engagement is undertaken with shareholders and proxy advisers on evolving governance issues.
The Directors consider it important to understand the views of the market. Board members regularly receive copies of the latest analyst reports on the Company and the sector, as well as market feedback to further develop their knowledge and understanding of external views about the Company. The Chairman and the Non-Executive Directors provide feedback to the Board on topics raised with them by major shareholders. In addition, investor days are conducted periodically. The Company also undertakes perception studies, when appropriate, designed to determine the investment community’s view of the core business from both institutional fund managers and sell-side analysts.
The Company’s AGM provides another opportunity to communicate with its shareholders. At the 2015 meeting, the Company complied with the Code provisions relating to voting and the separation of resolutions. Shareholders were invited to ask questions during the meeting. It is intended that the same processes will be followed at the 2016 AGM. In line with the Code, details of proxy voting by shareholders will be made available at the meeting and will be posted on the Company’s website following the meeting.
The Company’s Annual Report and Accounts, together with the Company’s Interim Report, Interim Management Statements and other public announcements and presentations, are designed to present a fair, balanced and understandable view of the Group’s activities and prospects. These are available on the Company’s website at www.thephoenixgroup.com, along with a wide range of relevant information for private and institutional investors, including the Company’s financial calendar.
FINANCIAL REPORTING AND GOING CONCERNThe Directors have acknowledged their responsibilities in the Statement of Directors’ Responsibilities in relation to the IFRS financial statements for the year ended 31 December 2015.
The Group’s business activities, together with the factors likely to affect its future development, performance and position are set out in the Strategic Report on pages 4 to 40.
The financial position of the Group, its cash flows and liquidity position are described in the financial statements and notes.
The Board’s going concern assessment is included within the Directors’ report on page 82.
VIABILITY STATEMENTThe Viability Statement, as required by section C.2.2 of the Code, has been undertaken for a period of five years to align to the Group’s business planning and is contained in the Risk Management section on page 39.
REVIEW OF SYSTEM OF INTERNAL CONTROLSThe Code requires Directors to review the effectiveness of the Company’s risk management and internal control systems which includes financial, operational and compliance controls. The Board has overall responsibility for the Group’s risk management and internal control systems and for reviewing their effectiveness. The Group’s systems of internal controls are designed to manage rather than eliminate the risk of failure to achieve business objectives and can provide only reasonable and not absolute assurance against material misstatement or loss. The Board’s review of the period covered by this report, which was undertaken with the assistance of the Audit and Risk Committees, was completed on 22 March 2016. Where any significant weaknesses were identified, corrective actions have been taken, or are being taken and monitored.
The Board (and its subsidiary company boards) monitor internal controls on a continual basis, in particular through Audit and Risk Committees. There is an ongoing process for identifying, evaluating and managing the significant risks faced by the Group, which has been in place throughout the period covered by this report and up to the date of approval of the Annual Report and Accounts for 2015, in accordance with the ‘Guidance on Risk Management, Internal Control and Related Financial and Business Reporting’ published by the Financial Reporting Council.
Additional assurance is provided by the internal audit function, which operates and reports independently of management. The internal audit function provides objective assurance on risk mitigation and control to the Audit Committee.

Phoenix Group Holdings Annual Report and Accounts 2015 57Corporate governance
DIRECTORS’ REMUNERATION REPORT
Dear Shareholder, On behalf of the Board, I am pleased to present our Directors’ remuneration report for the year ended 31 December 2015. This report covers remuneration for Executive and Non‑Executive Directors of the Company.IAN CORMACKREMUNERATION COMMITTEE CHAIRMAN
22 MARCH 2016
LINKING REMUNERATION TO COMPANY PERFORMANCE2015 was a year of major achievements for Phoenix Group as set out in more detail in the Group Chief Executive Officer’s report at the beginning of this Annual Report and Accounts. Particular operational and financial highlights for the year included:
Ɛ Operating companies’ cash generation of £225 million
Ɛ Incremental Market Consistent Embedded Value (‘MCEV’) from management actions of £205 million, meeting the target of £400 million of management actions between 2014 and 2016, one year ahead of schedule
Ɛ The achievement of an investment grade credit rating from Fitch Ratings
Ɛ The approval of the Group’s Solvency II Internal Model by the Prudential Regulation Authority
Ɛ The accreditation, for the fourth successive year, that Phoenix has been formally recognised as one of the ‘UK’s Top Employers’
Ɛ Managing the new pension freedom changes introduced in April 2015, providing customers with greater choice with regard to their retirement options.
As a closed life business, success for the Company is not assessed in the same way as at many other companies but through the efficient delivery of management actions and maintenance of our capital strength both to ensure that we can meet our obligations to policyholders and to maintain dividends to shareholders.
Against each of these objectives, this was an exceptional year for the Company. To deliver this performance, management were asked not only to deliver on the targets originally set at the commencement of the year but also to deliver additional goals set by the Board during the year, primarily securing an investment grade credit rating (which, while an aspiration, had not been factored in the annual target setting process) and to revise the asset mix to reduce assets which carried a higher capital charge thereby permitting approval of our Solvency II Internal Model.
While fully committed to maintaining the integrity of the Company’s incentive arrangements at all times, the Committee considered the impact of these additional priorities set for management by the Board and concluded that, while not separately rewarding management for the delivery of these achievements (other than through the normal assessment of personal performance in respect of 30% of the Annual Incentive Plan (‘AIP’) opportunity), the Committee should equally ensure that such additional priorities should not inadvertently disadvantage the very high level of achievement from management in respect of the targets set at the start of the year.
There were three direct consequences of delivering on the Board’s additional priorities on the AIP:
Ɛ MCEV was included as a measure on the basis that it was a fair measure of the capital strength of the Company and, generally, positive actions by management improve it. As explained more fully on page 64 under the section headed ‘AIP Outcomes for 2015’, a consequence of our achieving an investment grade credit rating was that the value of bonds issued by the Company increased due to the positive market impact. The Committee clearly did not want to penalise management for this positive development.
Ɛ Similarly, management successfully adjusted the investment portfolio in line with the new priorities set by the Board to enable our Internal Model to be approved and so the Committee, again, excluded the direct negative consequences of the recalibration from the AIP out-turn.
Ɛ Cash distributed from the life company to the Company was included as a measure on the basis that it is both an effective measure of the capital strength of the life companies (distributions will only be approved by its independent Board if they are satisfied of its capital strength after meeting obligations to policyholders and elsewhere) and of the Company’s ability to pay dividends to its own shareholders. Although less cash was actually paid in the year, to ensure that risks are effectively managed and that the position on distributions is considered in light of the post-year end final accounts, the Committee’s practice has been to look at both the distributions made in the year, and also to credit potential distributions that were deferred to the following year where the cash generated related to the AIP year. Such potential distributions are then added to any target for the subsequent year to avoid double-counting.
In prior years, the Committee has defaulted to making as few adjustments as possible and has not excluded the negative impact on some elements of the AIP of a number of management actions which, while in the interests of shareholders overall, reduced some element of the AIP as such actions have more typically been reflected in the budget process. While the exercise of any judgment is inherently subjective and should be used sparingly, the Committee believes that the three adjustments above were both sufficiently significant as to warrant adjustment and that, without those adjustments, the AIP out-turn would not have reflected the true level of corporate and management performance.
Following the application of such steps the Corporate measure factor for 2015 (i.e. the AIP before assessment of the personal performance element) was determined on a formulaic basis at 85% of maximum.

Phoenix Group Holdings Annual Report and Accounts 201558
DIRECTORS’ REMUNERATION REPORT Continued
This produced an AIP out-turn for the Chief Executive Officer, after reflecting personal performance, of approximately 82% of maximum.
While, in principle, the Committee felt that a similar adjustment could have been made to the Long Term Incentive Plan (‘LTIP’), no such adjustment was made. The LTIP vesting level of 57% was approved.
REMUNERATION POLICY FOR 2016Looking ahead to 2016, the Committee concluded that:
Ɛ Neither Executive Director will receive a salary increase (this means that the Group Chief Executive Officer has not had any increase in salary since his date of joining approximately five years ago)
Ɛ No changes will be made to the target or maximum levels under our AIP or to the award levels under our LTIP.
The Committee has therefore not made any changes to the overall remuneration levels detailed in our Directors’ remuneration policy which was approved by our shareholders at the 2014 Annual General Meeting (‘AGM’).
The Phoenix business strategy involves corporate actions that can be considered price-sensitive activity. Indeed, much of 2013, 2014 and 2015 was spent in either a ‘closed’ or ‘prohibited’ period due to such potential activity (not all of which led to publicly announced actions but which included the sale of Ignis and the refinancing of the Group to secure investment grade status) which results in the Company not being able to transact or make decisions relating to shares.
This can impact the Group’s ability to manage its incentive plans effectively as, during such periods, we have been unable to allocate shares under the Deferred Bonus Share Scheme (‘DBSS’), and impacted employees were unable to exercise any vested DBSS share award. The same restrictions apply to our LTIP arrangements with grants under both plans (DBSS and LTIP) not being made until the Group emerged from the restrictions in September 2015.
Accordingly, the Company has made a number of minor technical changes to the rules of the DBSS to make it more formulaic. Commencing with the 2015 awards, DBSS awards will automatically vest on the dealing day following the third anniversary of the announcement of the Company’s results. The share price at the actual time of grant continues to be used to determine the number of shares awarded. This means that DBSS awards will vest on a consistent cycle, even if regulatory constraints delay the making of DBSS awards in any year. These changes can be made to the DBSS as it is a formulaic arrangement under which one-third of the AIP out-turn per individual is deferred. Equivalent changes to the LTIP have not been made.
The Committee has commissioned a broader review of incentives during 2016 to consider whether alternative approaches will be more suitable for Phoenix Group given the constraints outlined above. As part of that review, the Committee will also look at the developing approach of financial services regulators towards the design of executive remuneration. Specifically within the insurance industry, this includes the remuneration aspects of Solvency II and, in the wider regulated financial sector, the continuing development of regulators’ views towards the implementation of the remuneration aspects of CRD IV (the EU’s Capital Requirements Directive for regulated financial businesses).
The review will look at the structure of executive pay within Phoenix Group in the light of these ongoing regulatory developments and, whilst it is not proposed to increase the overall quantum of pay, will consider whether current structures remain appropriate in the new regulatory environment. Any outcomes from this review will be discussed with key shareholders and then disclosed in full in the 2016 Directors’ remuneration report.
As detailed on pages 60 and 61, important changes are also being made to the performance measures for 2016 AIP and for the 2016 LTIP award. In light of Solvency II, embedded value is expected to be a less relevant measure within the insurance industry and Phoenix will no longer be reporting MCEV; accordingly measures based on MCEV have been removed for 2016’s incentive plans and the other measures re-balanced.
The Board has noted that in the period since the Group’s Premium Listing on the London Stock Exchange in July 2010, the fee levels for Non-Executive Directors across the sector have increased significantly in recognition of the increased time commitment of Directors in regulated businesses. There has been no increase in the base fee levels for Non-Executive Directors since July 2010 and the Board has decided to increase the base fee for all Non-Executive Directors to £105,000 in 2016 to reflect these factors. This is against a background of significant time commitment and increasingly complex and onerous financial services requirements and related responsibilities. All other fees remain unchanged (i.e. Board Committee Chairmanship fees of £10,000 and no separate Board Committee membership fees).
Our Directors’ remuneration report for 2016 will include a re-statement of the Directors’ remuneration policy which, in line with the normal requirement for Directors’ remuneration policies to be renewed every three years, will be put to the Company’s shareholders for approval at the 2017 AGM.
SHAREHOLDER APPROVALAt the AGM on 11 May 2016, shareholders will be invited to approve the 2015 Directors’ remuneration report as set out in the following pages. For ease of reference, and consistent with our approach last year, the main summary policy tables from the Directors’ remuneration policy approved at the 2014 AGM are also set out as an Appendix to the Directors’ remuneration report, although we are not seeking further approval from shareholders for our policy at the 2016 AGM.
I hope that we can continue to rely on the support of our shareholders for the resolution on the 2015 Directors’ remuneration report which will be proposed at the 2016 AGM.
Yours sincerely,
IAN CORMACKREMUNERATION COMMITTEE CHAIRMAN
22 MARCH 2016

Phoenix Group Holdings Annual Report and Accounts 2015 59Corporate governance
ANNUAL IMPLEMENTATION REPORT – UNAUDITED INFORMATION IMPLEMENTATION OF REMUNERATION POLICY IN 2016
Element of Remuneration Policy Detail of Implementation of Policy for 2016
Overall positioning The Company’s overall positioning on remuneration for Executive Directors remains unchanged from 2015:
Ɛ An appropriate balance is maintained between fixed and variable components of remuneration.
Ɛ Our Remuneration Policy benchmarks the total target remuneration for the Executive Directors between FTSE 31-100 and FTSE 250 data sets, and remuneration for both Executive Directors are positioned appropriately between these data sets.
Base Salary Salaries in 2016 will remain unchanged from the 2014 and 2015 levels of £700,000 for the Group Chief Executive Officer and £440,000 for the Group Finance Director.
Benefits There are no proposed changes to the benefits offered to Executive Directors in 2016.
Pension There are no proposed changes to the pension benefits offered to Executive Directors in 2016.
INTRODUCTIONWe have presented this Directors’ remuneration report in accordance with the UK’s Large and Medium-sized Companies and Groups (Accounts and Reports) Regulations 2008 (the ‘UK regulations’). The Company complies with the reporting obligations within the UK regulations as a matter of good practice although it is not strictly required to do so as a non-UK incorporated quoted company. The Directors’ remuneration report also describes how the Board has complied with the provisions set out in the UK Corporate Governance Code relating to remuneration matters.
At our 2016 Annual General Meeting (‘AGM’) we will be holding an advisory vote on the Directors’ remuneration report.
The auditors have reported on certain parts of the Directors’ remuneration report and stated whether, in their opinion, those parts of the Directors’ remuneration report have been properly prepared in accordance with the Companies Act 2006. Those sections of the Directors’ remuneration report which have been subject to audit are clearly indicated.
DIRECTORS’ REMUNERATION POLICY The Directors’ remuneration policy (‘Remuneration Policy’) was approved by the Company’s shareholders at the Company’s AGM on 30 April 2014 and has effect for all payments made to Directors from that date.
The Company’s full Remuneration Policy is available within the Remuneration Committee (‘Committee’) section under Board Committees on the Company’s website. For information and ease of reference, the main summary policy tables from the Remuneration Policy are included in the Appendix to this Directors’ remuneration report. The information in the Appendix is not subject to the advisory vote on the Directors’ remuneration report at the 2016 AGM.

Phoenix Group Holdings Annual Report and Accounts 201560
DIRECTORS’ REMUNERATION REPORT Continued
Element of Remuneration Policy Detail of Implementation of Policy for 2016
Annual Incentive Plan (‘AIP’)¹ The AIP for 2016 will operate on a basis that is consistent with how the AIP operated in 2015, although there have been changes to the precise measures and weightings of the Corporate (financial and strategic) performance measures for 2016’s AIP to reflect our evolving business focus.
The AIP maximum potential and on-target levels remain unchanged at 150% of base salary and at 50% of maximum levels (75% of base salary) respectively. As in previous years, one-third of AIP outcomes for 2016 will be delivered as an award of deferred shares under the Deferred Bonus Share Scheme.
The overall weightings between Corporate and Personal performance measures for AIP in 2016 are unchanged from 2015:
Ɛ Corporate (financial and strategic) performance measures – 70%.
Ɛ Personal (individual objectives) – 30%.
The weightings of the AIP performance measures for 2016 are summarised below:
Performance Measure Weighting of Corporate Measure % of incentive potential
Corporate measure
Operating companies’ cash generation 50% 35%
IFRS operating earnings 25% 17.5%
Customer experience 25% 17.5%
Personal
Individual objectives 30%
TOTAL 100%
The changes made from 2015’s Corporate performance measures for AIP can be summarised as follows:
Ɛ In 2016, the highest weighting will be given to operating companies’ cash generation which remains core to our business and is linked directly to Phoenix Life free surplus under Solvency II. The overall weighting for cash generation has increased from 2015.
Ɛ 2015’s Corporate performance measures included both a Group Market Consistent Embedded Value (Group ‘MCEV’) and a Group MCEV operating earnings after tax measure. Due to Solvency II, embedded value metrics are expected to be less relevant measures within the insurance industry and Phoenix will no longer be reporting MCEV; accordingly MCEV will be removed as a measure under AIP 2016, and IFRS operating earnings will replace MCEV operating earnings.
Ɛ Greater weighting has been given to customer experience, reflecting the focus of the Board as well as of our regulators.
Ɛ Specific targets of employee engagement and expense management have been removed as Corporate performance measures, but are included as part of the objectives for the Personal performance element. Assessment of these items under the Personal element permits a more rounded assessment.
In addition, and as previously stated in the Remuneration Policy, there are three potential levels at which the performance measures and targets and related outcomes from AIP in 2016 may be moderated (downwards or upwards) by the Committee – more details are provided in the summary Remuneration Policy table set out in the Appendix to the Directors’ remuneration report.
Deferred Bonus Share Scheme (‘DBSS’)1
One-third of AIP outcomes for 2016 will be delivered as an award of deferred shares under the DBSS which will vest after a three-year period of deferral. For DBSS awards made in 2015 (in respect of 2014’s AIP outcome) and for DBSS awards to be made in subsequent years:
Ɛ The 3-year deferral period will run to the dealing day following the three-year anniversary of the announcement of the annual results by reference to which the relevant AIP outcome was determined.
Ɛ Dividend entitlements for the DBSS shares will accrue over the three-year deferral period.
Ɛ When DBSS awards are made, the number of shares will be calculated using the average share price for the 3 dealing days before the actual grant of awards.
Ɛ The DBSS awards will be made as soon as practicable following the announcement of the annual results by reference to which the relevant AIP outcome was determined, and whilst the granting of awards may be delayed due to ‘closed’ or ‘prohibited’ period constraints, the deferral period will begin as described above (i.e. three years from March).
Phoenix Group Holdings Annual Report and Accounts 2015 61Corporate governance
Element of Remuneration Policy Detail of Implementation of Policy for 2016
Long-Term Incentive (‘LTIP’)¹ Award levels for Executive Directors for 2016 are unchanged at 200% of base salary. When awards are made, the number of shares within awards is calculated using the average share price for the three dealing days before the grant of awards.
For all LTIP awards made from 2015 onwards, a holding period applies so that any LTIP awards for which the performance vesting requirements are satisfied will not be released for a further two years from the third anniversary of the original award date. Dividend accrual for LTIP awards will continue until the end of the holding period.
The weightings of the LTIP performance measures for 2016 are summarised below:
Performance Measure Weighting of Performance Measure
Cumulative cash generation 50%
TSR 50%
TOTAL 100%
These weightings represent a change from the weightings for 2015 LTIP awards, where MCEV growth had a 40% weighting, Cumulative cash generation 40% and TSR 20%. As explained above for AIP, under Solvency II, embedded value metrics are expected to be less relevant measures within the insurance industry and Phoenix will no longer be reporting MCEV; therefore MCEV growth has been removed for 2016’s LTIP awards and the other measures re-balanced accordingly.
Additionally, all 2016 LTIP awards are subject to a further underpin measure relating to debt and risk management within the Group, as detailed on page 68. This ’underpin’ will be extended for 2016 LTIP awards to include consideration of customer satisfaction and, to meet Solvency II requirements, in exceptional cases, personal performance. These measures and the relative weightings are considered to be appropriate for 2016’s LTIP awards. The application of a three-year performance period for each measure, is unchanged from 2015’s LTIP awards.
The relative TSR measure is calculated against the constituents of the FTSE 250 (excluding Investment Trusts), with vesting commencing at median (25% of this part of the award) and full vesting at upper quintile levels, subject to an underpin regarding underlying financial performance.
As in past years, the performance targets for Cumulative cash generation will be set by the Committee shortly before the LTIP awards are made. The Company will disclose the performance targets for the Cumulative cash generation measure for 2016’s LTIP awards in next year’s Directors’ remuneration report.
All-Employee Share Plans Executive Directors have the opportunity to participate in HMRC tax advantaged Sharesave and Share Incentive Plans (‘SIP’) on the same basis as all other UK employees. To align with market practice, the 2016 Sharesave grant will be offered at a 20% discount to market value rather than the previous 15%.
Shareholding requirements
Requirement levels are 200% of base salary level for the Group Chief Executive Officer and the Group Finance Director.
Where any vested LTIP awards are subject to a holding period requirement, the vested LTIP award shares (discounted for anticipated tax liabilities) will count towards the shareholding requirements.
Chairman and Non-Executive Directors’ fees
Fee levels for the Chairman will be at the same levels as for 2015. The new Chairman who was appointed in 2015 was appointed at the same level of fees as the outgoing Chairman. This level of Chairman’s fee is accordingly unchanged from October 2012.
Base fees for Non-Executive Directors have previously been set at £90,000 or £100,000 based on a range of factors. The Board decided to increase the base fee to a common £105,000. While the headline fee is relatively high, overall fee levels are appropriate as Board Committee chairmanship fees at Phoenix remain amongst the lowest in the insurance sector and, unusually, no separate Board Committee membership fees are paid.
The fee levels for 2016 are £325,000 for the Chairman, £105,000 for the role of Non-Executive Director with additional fees of: (i) £5,000 payable for the role of Senior Independent Director; and/or (ii) £10,000 payable where an individual also chairs the Audit, Remuneration or Risk Committee; and/or (iii) £20,000 payable where a Non-Executive Director also serves on the board of a subsidiary company and/or (iv) £10,000 payable for service on the Solvency II Model Governance Committee.
1 All incentive plans are subject to malus and/or clawback provisions. These provisions may be applied where the Committee considers it appropriate to do so following: Ɛ A review of the conduct, capability or performance of an individual Ɛ A review of the performance of the Company or a Group member Ɛ Any material misstatement of the Company’s or a Group member’s financial results for any period Ɛ Any material failure of risk management by an individual, a Group member or the Company Ɛ Any other circumstances that have a sufficiently significant impact on the reputation of the Company.

Phoenix Group Holdings Annual Report and Accounts 201562
DIRECTORS’ REMUNERATION REPORT Continued
BALANCE OF FIXED TO VARIABLE REMUNERATION FOR EXECUTIVE DIRECTORSThe balance of fixed to variable remuneration for the Executive Directors is illustrated in the Appendix to the Directors’ remuneration report where the disclosure for ‘Potential Rewards under Various Scenarios’ from the Remuneration Policy is included for information. The scenarios shown remain the same as for 2014 due to the underlying remuneration arrangements and participation levels remaining substantially unchanged.
DISTRIBUTION STATEMENTThe UK regulations require each quoted company to provide a comparison between profits distributed by way of dividend and overall expenditure on pay.
RELATIVE IMPORTANCE (£ millions)
120
120
Profits distributed by way of dividend (no change)
2015
2014
81
117
2015
2014
Overall expenditure on pay (% change -31%)
86 31
81
Group Ignis
Profit distributed by way of dividend has been taken as the dividend paid and proposed in respect of the relevant financial year. For 2015 this is the interim dividend paid (£60 million) and the recommended final dividend of 26.7p multiplied by the total share capital issued at the date of the Annual Report as set out in note D1 ‘Share capital’ in the notes to the consolidated financial statements. No share buy-backs were made in either year.
Overall expenditure on pay has been taken as the employee costs for continuing operations as set out in note C2 ‘Administrative expenses’ in the notes to the consolidated financial statements. The 2014 figure also includes £31 million from discontinued operations which relate to Ignis, which was disposed of on 1 July 2014. Expenditure on pay from continuing operations has decreased by 6% year on year.
PERFORMANCE GRAPH AND TABLEThe graph below shows the value to 31 December 2015, on a TSR basis, of £100 invested in Phoenix Group Holdings on 5 July 2010 (the date of the Company’s Premium Listing) compared with the value of £100 invested in the FTSE 250 Index (excluding Investment Trusts).
Source: Thomson Reuters Datastream
Phoenix Group HoldingsFTSE 250 Index (excluding investment trusts)
TOTAL SHAREHOLDER RETURN
Dec2015
Dec2014
Dec2010
Dec2012
Dec2011
Dec2013
Jul2010
240
220
200
180
160
140
120
100
80
60
The FTSE 250 Index (excluding Investment Trusts) is considered to be an appropriate comparator for this purpose as it is a broad equity index of which the Company is a constituent.
The UK regulations also require that a performance graph is supported by a table summarising aspects of the Group Chief Executive Officer’s remuneration for the period covered by the above graph (which will in due course be for a period of ten years).
Phoenix Group Holdings Annual Report and Accounts 2015 63Corporate governance
Group Chief Executive Officer Remuneration
Single figure of total remuneration
(£000)
Annual variable element award rates against
maximum opportunity (AIP)
Long-term incentive vesting rates against
maximum opportunity (LTIP)
2015 Clive Bannister 2,889 82% 57%
2014 Clive Bannister 3,104 1,3 68% 57%2
2013 Clive Bannister 2,737 69% 67%2
2012 Clive Bannister 1,583 69% n/a4
2011 Clive Bannister 5 1,333 73% n/a4
Jonathan Moss 5,6 704 n/a n/a
2010 Jonathan Moss 2,307 88% 100%1 Figures restated for 2014. See footnote 3 for detail. 2 The long-term incentive vesting rate for 2013 is shown at 67% and for 2014 is shown as 57%. In both years the Group Chief Executive Officer decided to waive voluntarily any entitlement
in excess of two-thirds of the shares which would otherwise have vested.3 The single figure of total remuneration for 2014 has been restated and now reflects the actual price of shares on the day the 2012 LTIP vested (23 September 2015: 836p per share) rather
than the three-month average share price to 31 December 2014 (769.93p per share) which was required to be used last year for the single figure of total remuneration, and also reflects the actual dividends accrued on the award until the date of vesting.
4 Long-term incentive vesting rates against maximum opportunity values are not applicable for 2011 and 2012 due to no awards vesting in those financial years.5 Jonathan Moss left the role of Group Chief Executive Officer on 7 February 2011 and left the Group on 29 March 2011. Clive Bannister joined Phoenix Group on 7 February 2011 and was
appointed to the Board as a Director on 28 March 2011.6 Jonathan Moss’ 2011 single figure of total remuneration does not include compensation for loss of office.
PERCENTAGE CHANGE IN PAY OF THE GROUP CHIEF EXECUTIVE OFFICER 2014 TO 2015In accordance with UK regulations, the table below provides a comparison of the percentage change in the prescribed pay elements of the Group Chief Executive Officer (salary, taxable benefits and annual incentive outcomes) between financial years 2014 and 2015 and the equivalent percentage changes in the average of all staff (representing all permanent staff during 2014 and 2015 on a matched basis). This group was selected as being representative of the wider workforce using the same process as was used for this comparison in last year’s accounts.
Year-on-year % change Salary Taxable Benefits Annual incentive Total
Group Chief Executive Officer 0.00 (0.61) 20.23 10.11
Staff 3.96 2.50 11.60 5.63
Overall, the data shows virtually unchanged levels of salary and benefits for the Group Chief Executive Officer; the increase in annual incentive is primarily due to him being awarded a higher rating on the Personal performance measures for AIP than in previous years, which has resulted in a higher AIP out-turn. Staff more generally have received higher overall remuneration due mainly to higher AIP outcomes than in 2014. The median level of salary increase for staff was 2.5% and is lower than the figure shown above which is based on averages.
VOTING OUTCOMES FROM THE 2015 AGMThe table below shows the votes cast to approve the Directors’ remuneration report for the year ended 31 December 2014 at the 2015 AGM held on 23 April 2015.
For Against Abstain
Number % of votes cast Number % of votes cast Number
To approve the Directors’ remuneration report for the year ended 31 December 2014 138,914,473 98.12 2,645,386 1.87 352,328
A vote to approve the Remuneration Policy was passed at the 2014 AGM held on 30 April 2014. Details of the votes cast in relation to this resolution were disclosed in the Company’s Directors’ remuneration report for 2014 which is available as part of the Phoenix Group Holdings Annual Report and Accounts 2014.

Phoenix Group Holdings Annual Report and Accounts 201564
DIRECTORS’ REMUNERATION REPORT Continued
IMPLEMENTATION REPORT – AUDITED INFORMATIONSINGLE FIGURE TABLE
Salary/fees¹ Benefits² Annual Incentive³Long-term incentives Pension6 Total
£000 2015 2014 2015 2014 2015 2014 2015420145
(restated) 2015 2014 201520145
(restated)
Clive Bannister4 700 700 16 16 861 716 1,189 1,5475 123 125 2,889 3,104
James McConville 440 440 16 35 566 475 679 1,5035 77 77 1,778 2,5301 The Executive Directors are entitled to adjust their salary/benefit combination under flexible benefits arrangements and the figures shown are before individual elections.2 Benefits for Clive Bannister comprise car allowance and private medical insurance totalling £16,175. Benefits for James McConville comprise car allowance and private medical insurance
totalling £15,940. 3 Annual incentive amounts are presented inclusive of any amounts which must be deferred into shares for three years (i.e. one-third of the AIP award). In 2015 and 2014, £287,000 and
£238,700 respectively of Clive Bannister’s incentive payment is subject to 3-year deferral delivered in shares, and £188,650 and £158,290 of James McConville’s incentive payment is subject to similar deferral. Details of the performance measures and targets applicable to the AIP for 2015 are set out below.
4 In accordance with the requirements of the UK regulations, the 2015 value for long-term incentives is an estimate of the vesting outcomes for LTIP awards granted in 2013 and which are due to vest on 15 November 2016 for Clive Bannister and James McConville. These estimated vesting levels are at 57% reflecting outcomes against the MCEV growth, Cumulative cash generation and TSR performance measures to 31 December 2015 and assumptions regarding dividends for the period until vesting. This vesting outcome is then applied to the average share price between 1 October 2015 and 31 December 2015 (873.4924p) to produce the estimated long-term incentives figures shown for 2015 in the above table. These assumptions will be trued up for actual share prices and dividends on vesting in the report for 2016. Details of the performance measures and targets applicable to the 2013 LTIP are set out on page 66.
5 For 2012’s LTIP grants which are reflected in the 2014 long-term incentives columns above, the performance conditions were met as to 84.24% of maximum. The Group Chief Executive Officer decided to waive voluntarily any entitlement in excess of two-thirds of the shares which would otherwise have vested. The 2014 long-term incentives values in the above table reflect the value of the Company’s shares on the date of vesting which, due to extended closed and prohibited periods, was 23 September 2015 (836p per share) multiplied by the number of shares vesting, whereas the equivalent figure within the published 2014 single figure table was an estimate which reflected the average share price between 1 October 2014 and 31 December 2014 (769.93p per share) and certain assumptions regarding the cumulative value of dividends on the number of shares vesting.
6 Clive Bannister and James McConville are entitled to each receive a Company pension contribution of 20% of base salary, which may at their own choice, be paid to their Group Personal Pension (‘GPP’) or received in cash. Pension contributions paid as cash supplements are reduced for the effect of employers’ National Insurance contributions. No Director participated in a defined benefit pension arrangement in the year.
The aggregate remuneration of all Executive and Non-Executive Directors under salary, fees, benefits, cash supplements in lieu of pensions and annual incentive was £3.937 million (2014: £3.771 million).
There were no payments made to former Directors and no payments for loss of office in the year.
AIP OUTCOMES FOR 2015 The Committee seeks to set suitable ranges for each measure in the context both of the Company’s own internal budgets and of external projections (whether through management guidance or consensus forecasts). As an entirely closed life business, targets are significantly impacted by management actions and year on year growth is not an inherent objective. The ranges are considered appropriate in that context.
As explained in the Committee Chairman’s letter, and as permitted under the AIP rules, in relation to the MCEV-based measures the Committee excluded the additional direct MCEV implications of securing an investment grade credit rating together with related Solvency II steps, the full negative impacts of which on MCEV were not reflected in the original AIP target setting process for 2015. The achievement of an investment grade rating was a significant step for the Company and had been a long-standing aspiration and the increase in liabilities for MCEV from the Company being required to value its listed bonds on a market value basis would have operated counter-intuitively if not excluded.
Group MCEV is a measure of the consolidated value of shareholders’ interests in an insurance group and the key components are net worth plus the value of in-force covered business, based on a market-consistent methodology where assets and liabilities are valued in line with market prices. Accordingly, listed debt is valued at the market value quoted on the reporting date. One consequence of achieving an investment grade rating was that the market value of the Group’s listed bonds increased even though there was no additional liability for the Group (as the market perceived our strength and, therefore, the likelihood of repayment to be higher). Consequently, as this increase in market value of debt reduced MCEV, the Committee concluded that it would be appropriate to exclude such impact from the AIP out-turn by adjusting the targets, otherwise the impact of such a significant step for the Group would have inadvertently penalised management.
Similarly, following clarity on the regulations under Solvency II and the actions necessary to ensure approvals in relation to full internal model approval and matching adjustment be obtained, management took the decision to change the credit portfolio by selling assets which attracted a high capital charge under the new regime, which were outside of the Group’s risk appetite or which were ineligible or inefficient for matching adjustment (such as callable bonds). Furthermore, management also reduced the longevity and credit exposure by reinsuring c.£1.3 billion of liabilities to an external reinsurer, both of which attract the highest level of risk capital under Solvency II for the Group. Accordingly, the Committee concluded again that it would operate contrary to the principles of the AIP if management was penalised for such actions which were clearly in the interests of the Group.
Phoenix Group Holdings Annual Report and Accounts 2015 65Corporate governance
It was felt appropriate to ensure that management was not disincentivised from bringing such opportunities to the Board. This could have been the case had appropriate adjustments to the 2015 AIP targets not been made for the additional costs required to deliver these important developments. The impact of the adjustments on the AIP Corporate measures is shown below.
Against the specific Corporate measures, out-turns were as follows:
Performance measure
Threshold performance level for
2015 AIP
Maximum performance level for
2015 AIPPerformance level
attained for 2015 AIP
% of 70% of incentive
potential based on Performance
Measure % achieved
Operating companies’ cash generation¹ £200m £300m £275m 25% 19%
Group MCEV2 £2,463m £2,574m £2,633m 25% 25%
Expense management £253m £237m £239m 15% 13%
Group MCEV operating earnings after tax £123m £246m £223m 15% 12%
Customer satisfaction3 3.5 rating 5 rating 4.7 rating 10% 8%
Employee engagement 72% 80% 78% 10% 8%
Total 85%1 Consistent with past practice, the performance level for operating companies’ cash generation has been credited with £50million which was generated within Phoenix Life. This ensures that,
at all times, management maintains sufficient capital in Phoenix Life given the implementation of Solvency II.2 Represents reported Group MCEV after adding back ordinary dividends.3 The rating is a score based on questions answered by customers in a satisfaction survey managed by Ipsos MORI. Customers surveyed were asked to give a satisfaction rating of between
1 and 5 to a number of questions (with a rating of 3 or above regarded as satisfied). The 4.7 rating (out of 5) in 2015 is the average score of all questions answered.
The table below shows the actual out-turn against the annual incentive maximum. For 2015 AIP, Corporate (financial and strategic) measures applied to 70% of incentive opportunity and Personal (individual objectives) measures applied to 30% of incentive opportunity.
Corporate Personal Total Maximum
Name
As a % ofmaximum corporate element
As a % ofsalary
As a % ofmaximum
personal element
As a %of salary
As a %of salary
As a %of salary
Clive Bannister 85.00 89.25 75.00 33.75 123.00 150.00
James McConville 85.00 89.25 87.50 39.38 128.63 150.00
In line with market best practice, the Company has disclosed both the actual performance targets for the specific Corporate (financial and strategic) performance measures used for the 2015 AIP and the relevant levels of attainment for those targets. Specific performance measures and targets for the Personal (individual objectives) performance elements of the 2015 AIP are not disclosed as these performance measures and targets are regarded as commercially sensitive by the Committee and are likely to remain so, although key achievements included the approval of the Group’s Internal Model under Solvency II and managing the introduction of the new Pension Freedoms, together with meeting the MCEV management actions target one year ahead of schedule.
In addition, whilst the performance measures for the AIP for 2016 have been disclosed (see Implementation of Remuneration Policy for 2016), the performance targets for these measures are regarded as commercially sensitive at the current time and accordingly are not disclosed. However, the Company intends to disclose the performance targets for the Corporate (financial and strategic) performance measures for 2016’s AIP retrospectively in next year’s Directors’ remuneration report on a similar basis to the disclosures made above in respect of 2015’s AIP Corporate (financial and strategic) performance measures.
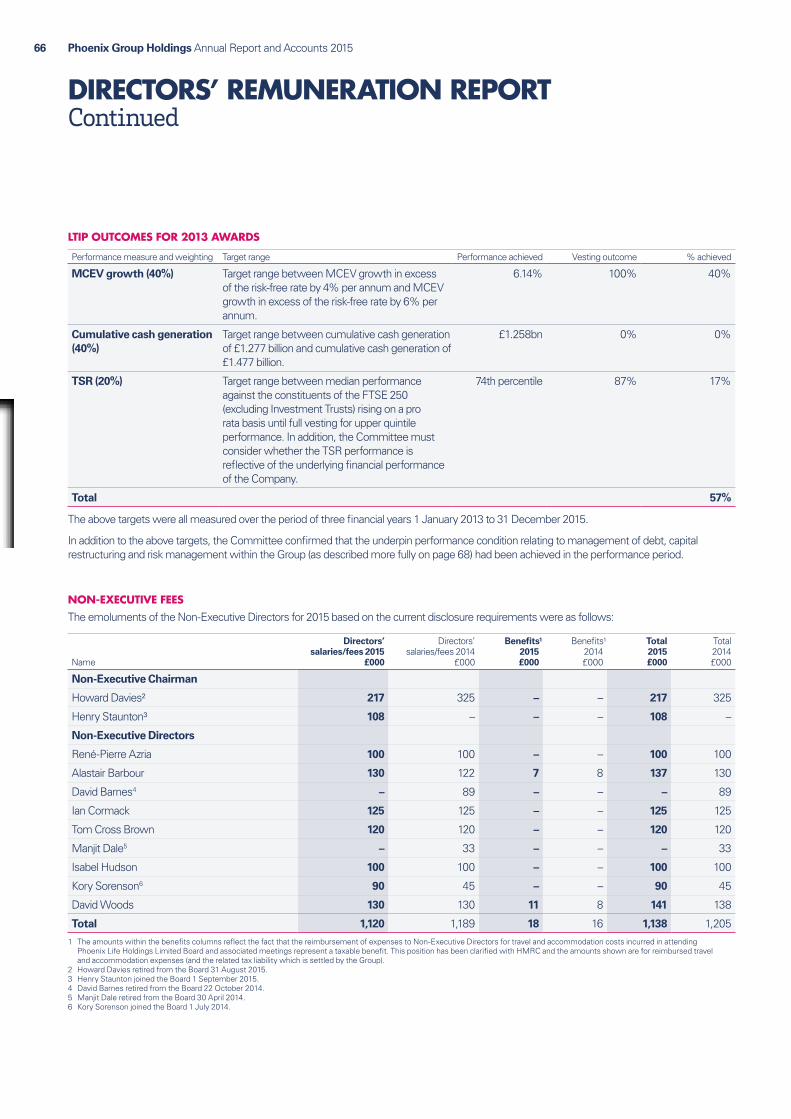
Phoenix Group Holdings Annual Report and Accounts 201566
DIRECTORS’ REMUNERATION REPORT Continued
LTIP OUTCOMES FOR 2013 AWARDS
Performance measure and weighting Target range Performance achieved Vesting outcome % achieved
MCEV growth (40%) Target range between MCEV growth in excess of the risk-free rate by 4% per annum and MCEV growth in excess of the risk-free rate by 6% per annum.
6.14% 100% 40%
Cumulative cash generation (40%)
Target range between cumulative cash generation of £1.277 billion and cumulative cash generation of £1.477 billion.
£1.258bn 0% 0%
TSR (20%) Target range between median performance against the constituents of the FTSE 250 (excluding Investment Trusts) rising on a pro rata basis until full vesting for upper quintile performance. In addition, the Committee must consider whether the TSR performance is reflective of the underlying financial performance of the Company.
74th percentile 87% 17%
Total 57%
The above targets were all measured over the period of three financial years 1 January 2013 to 31 December 2015.
In addition to the above targets, the Committee confirmed that the underpin performance condition relating to management of debt, capital restructuring and risk management within the Group (as described more fully on page 68) had been achieved in the performance period.
NON-EXECUTIVE FEESThe emoluments of the Non-Executive Directors for 2015 based on the current disclosure requirements were as follows:
Name
Directors’ salaries/fees 2015
£000
Directors’ salaries/fees 2014
£000
Benefits¹2015£000
Benefits¹2014 £000
Total2015 £000
Total2014 £000
Non-Executive Chairman
Howard Davies² 217 325 – – 217 325
Henry Staunton³ 108 – – – 108 –
Non-Executive Directors
René-Pierre Azria 100 100 – – 100 100
Alastair Barbour 130 122 7 8 137 130
David Barnes4 – 89 – – – 89
Ian Cormack 125 125 – – 125 125
Tom Cross Brown 120 120 – – 120 120
Manjit Dale5 – 33 – – – 33
Isabel Hudson 100 100 – – 100 100
Kory Sorenson6 90 45 – – 90 45
David Woods 130 130 11 8 141 138
Total 1,120 1,189 18 16 1,138 1,2051 The amounts within the benefits columns reflect the fact that the reimbursement of expenses to Non-Executive Directors for travel and accommodation costs incurred in attending
Phoenix Life Holdings Limited Board and associated meetings represent a taxable benefit. This position has been clarified with HMRC and the amounts shown are for reimbursed travel and accommodation expenses (and the related tax liability which is settled by the Group).
2 Howard Davies retired from the Board 31 August 2015.3 Henry Staunton joined the Board 1 September 2015.4 David Barnes retired from the Board 22 October 2014.5 Manjit Dale retired from the Board 30 April 2014.6 Kory Sorenson joined the Board 1 July 2014.
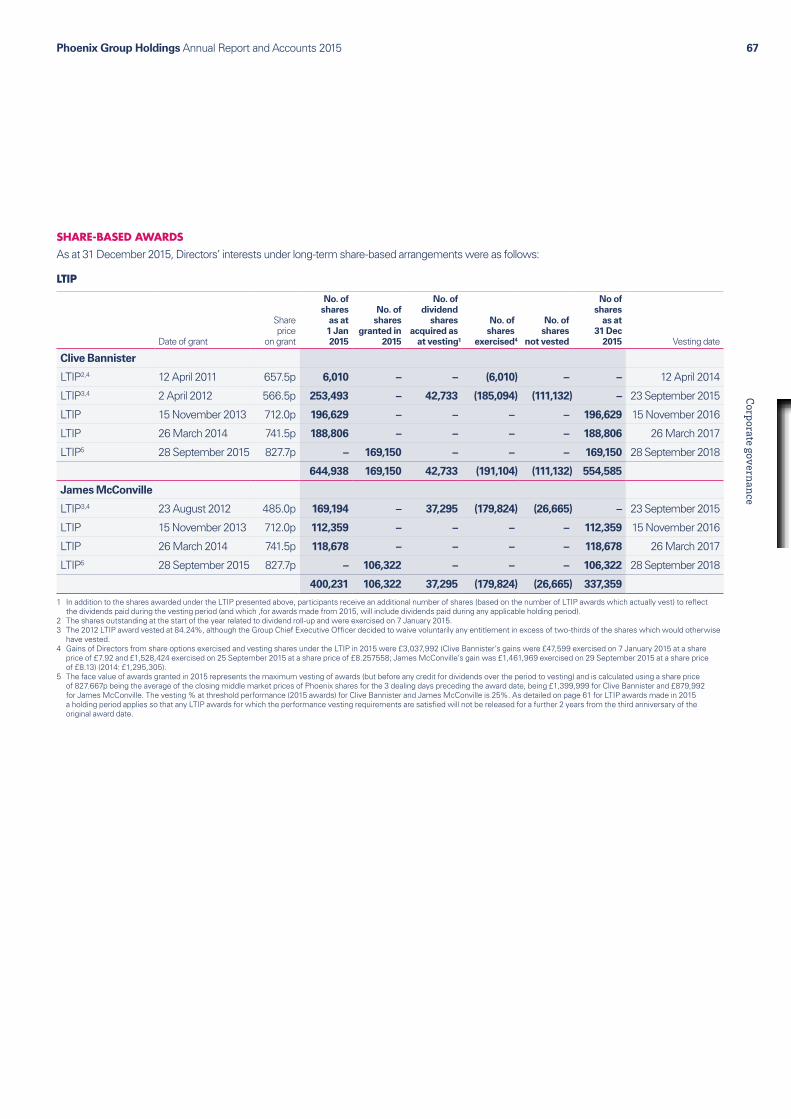
Phoenix Group Holdings Annual Report and Accounts 2015 67Corporate governance
SHARE-BASED AWARDSAs at 31 December 2015, Directors’ interests under long-term share-based arrangements were as follows:
LTIP
Date of grant
Share price
on grant
No. of shares
as at1 Jan2015
No. of shares
granted in 2015
No. of dividend
shares acquired as
at vesting¹
No. of shares
exercised4
No. of shares
not vested
No of shares
as at31 Dec
2015 Vesting date
Clive Bannister
LTIP2,4 12 April 2011 657.5p 6,010 – – (6,010) – – 12 April 2014
LTIP3,4 2 April 2012 566.5p 253,493 – 42,733 (185,094) (111,132) – 23 September 2015
LTIP 15 November 2013 712.0p 196,629 – – – – 196,629 15 November 2016
LTIP 26 March 2014 741.5p 188,806 – – – – 188,806 26 March 2017
LTIP5 28 September 2015 827.7p – 169,150 – – – 169,150 28 September 2018
644,938 169,150 42,733 (191,104) (111,132) 554,585
James McConville
LTIP3,4 23 August 2012 485.0p 169,194 – 37,295 (179,824) (26,665) – 23 September 2015
LTIP 15 November 2013 712.0p 112,359 – – – – 112,359 15 November 2016
LTIP 26 March 2014 741.5p 118,678 – – – – 118,678 26 March 2017
LTIP5 28 September 2015 827.7p – 106,322 – – – 106,322 28 September 2018
400,231 106,322 37,295 (179,824) (26,665) 337,359
1 In addition to the shares awarded under the LTIP presented above, participants receive an additional number of shares (based on the number of LTIP awards which actually vest) to reflect the dividends paid during the vesting period (and which ,for awards made from 2015, will include dividends paid during any applicable holding period).
2 The shares outstanding at the start of the year related to dividend roll-up and were exercised on 7 January 2015.3 The 2012 LTIP award vested at 84.24%, although the Group Chief Executive Officer decided to waive voluntarily any entitlement in excess of two-thirds of the shares which would otherwise
have vested. 4 Gains of Directors from share options exercised and vesting shares under the LTIP in 2015 were £3,037,992 (Clive Bannister’s gains were £47,599 exercised on 7 January 2015 at a share
price of £7.92 and £1,528,424 exercised on 25 September 2015 at a share price of £8.257558; James McConville’s gain was £1,461,969 exercised on 29 September 2015 at a share price of £8.13) (2014: £1,295,305).
5 The face value of awards granted in 2015 represents the maximum vesting of awards (but before any credit for dividends over the period to vesting) and is calculated using a share price of 827.667p being the average of the closing middle market prices of Phoenix shares for the 3 dealing days preceding the award date, being £1,399,999 for Clive Bannister and £879,992 for James McConville. The vesting % at threshold performance (2015 awards) for Clive Bannister and James McConville is 25%. As detailed on page 61 for LTIP awards made in 2015 a holding period applies so that any LTIP awards for which the performance vesting requirements are satisfied will not be released for a further 2 years from the third anniversary of the original award date.

Phoenix Group Holdings Annual Report and Accounts 201568
DIRECTORS’ REMUNERATION REPORT Continued
The performance conditions for the 2013, 2014 and 2015 awards are set out below:
Performance measure
2013 award (40% MCEV growth, 40% Cumulative cash generation and 20% TSR)
2014 award(40% MCEV growth, 40% Cumulative cash generation and 20% TSR)
2015 award(40% MCEV growth, 40% Cumulative cash generation and 20% TSR)
MCEV growth25% of this part vests at threshold performance rising on a pro rata basis until 100% vests.
Measured over three financial years commencing with the year of award.
Target range between MCEV growth in excess of the risk-free rate by 4% per annum and MCEV growth in excess of the risk-free rate by 6% per annum.
As the 2013 rights issue was known before the date of award, the base MCEV for 2013’s award increased by £211 million.
Target range as for 2013.
For this award, an additional £50 million was added to the base MCEV figure to increase the level of challenge.
Target range between MCEV growth in excess of the risk-free rate by 3% per annum and MCEV growth in excess of the risk-free rate by 5% per annum.
Cumulative cash generation25% of this part vests at threshold performance rising on a pro rata basis until 100% vests.
Measured over three financial years commencing with the year of award.
Target range of £1.277 billion to £1.477 billion.
Target range of £1.348 billion to £1.548 billion.
Target range of £841 million to £991 million.
TSR25% of this part vests at threshold performance rising on a pro rata basis until 100% vests. In addition, the Committee must consider whether the TSR performance is reflective of the underlying financial performance of the Company.
Measured over three financial years commencing with the year of award.
Target range between median performance against the constituents of the FTSE 250 (excluding Investment Trusts) rising on a pro rata basis until full vesting for upper quintile performance.
Target range as for 2013. Target range as for 2013.
Underpin: Notwithstanding the MCEV growth, Cumulative cash generation and TSR performance targets, if the Committee determines that the Group’s debt levels and associated interest costs have not remained within parameters acceptable to the Committee over the performance period, and that the Group has not made progress considered to be reasonable by it in executing any strategy agreed by the Board on debt management, capital structuring and risk management, the level of awards vesting will either be reduced or lapse in full.
As noted in the section describing the Implementation of Remuneration Policy in 2016, LTIP awards to be made in 2016 will be subject to Cumulative cash generation and Relative TSR performance measures similar to those described in the table above. The exact performance targets for Cumulative cash generation will be determined by the Committee shortly before the awards are made. Such targets will be disclosed in the 2016 Directors’ remuneration report.
The Committee remains committed to applying the performance conditions on the LTIP awards detailed above without adjustment to the extent this is practicable. In light of Solvency II, embedded value metrics are expected to be less relevant measures within the insurance industry and Phoenix will no longer be reporting MCEV. The Committee will ensure that any necessary amendments to this part of the relevant LTIP awards are, consistent with the shareholder approved Remuneration Policy, made on the basis of the Committee ensuring that any substitute performance measure for MCEV growth does not make the performance condition easier to satisfy than the original was intended to be. Any alterations to the performance measures for outstanding LTIP awards will be reported in the relevant Directors’ remuneration report and be subject to due engagement with key shareholders.

Phoenix Group Holdings Annual Report and Accounts 2015 69Corporate governance
DBSS
Date of grantShare price
on grant
No. of shares
as at1 Jan2015
No. of shares
granted in 2015
No. of dividend
sharesacquired
at vesting
No. of shares
exercised³
No. of shares
lapsed/waived
No of shares
as at31 Dec
2015Vesting
date
Clive Bannister
DBSS 2 April 2012 562.5p 41,452 – 12,439 (53,891) – – 23 September 2015
DBSS 27 March 2013 658.5p 36,748 – – – – 36,748 27 March 2016
DBSS 28 March 2014 652.0p 34,029 – – – – 34,029 28 March 2017
DBSS1,2 28 September 2015 827.7p – 28,840 – – – 28,840 19 March 2018
112,229 28,840 12,439 (53,891) – 99,617
James McConville
DBSS 27 March 2013 658.5p 11,999 – – – – 11,999 27 March 2016
DBSS 28 March 2014 652.0p 20,417 – – – – 20,417 28 March 2017
DBSS1,2 28 September 2015 827.7p – 19,124 – – – 19,124 19 March 2018
32,416 19,124 – – – 51,540
1 The face value of awards granted in 2015 is equivalent to 50% of the cash element of the 2014 AIP and is calculated using a share price of 827.667p, being the average closing market price on the 3 days preceding the award date giving £238,699 for Clive Bannister and £158,283 for James McConville.
2 As explained in the Implementation of Remuneration Policy in 2016 table on page 60, the DBSS award made in 2015 will vest on 19 March 2018, being the day following the third anniversary of the announcement of 2015’s annual results.
3 Gains of Directors from share options exercised and vesting shares under the DBSS in 2015 were £438,626, exercised on 29 September 2015 at a share price of £8.139129. This was the first vesting of the DBSS for Clive Bannister since its inception.
The DBSS is the share scheme used for the deferral of AIP. No performance conditions apply therefore other than being subject to continued employment. In addition to the shares awarded under the DBSS presented above, participants receive an additional number of shares to reflect the dividends paid during the vesting period (or until transfer of shares for DBSS awards made before 2014).
SHARESAVE
As at 1 Jan2015
Sharesgranted in
2015Sharesvested
Shareslapsed
As at31 Dec
2015Exercise
priceExercisable
fromDate ofexpiry
Clive Bannister – – – – – – – –
James McConville 1,607 – – – 1,607 £5.60 01 Jun 2016 30 Nov 2016
Gains of Directors from share options exercised under Sharesave 2015 were £nil (2014: £3,878). Sharesave options are granted with an option price that is a 15% discount to the three-day average share price when invitations are made. This is permitted by HMRC regulations for such options. For options in 2016 this discount will be 20%. Sharesave options are not subject to performance conditions. The Sharesave options granted to James McConville represent options granted for the then maximum monthly savings of £250 per calendar month for three years.
Aggregate gains of Directors from share options exercised and vesting shares under all share plans in 2015 were £3,476,618 (2014: £1,299,183).
During the year ended 31 December 2015, the highest mid-market price of the Company’s shares was 922p and the lowest mid-market price was 783.5p. At 31 December 2015, the Company’s share price was 917p.

Phoenix Group Holdings Annual Report and Accounts 201570
DIRECTORS’ REMUNERATION REPORT Continued
DIRECTORS’ INTERESTSThe number of shares held by each Director is shown below:
Name
As at 1 January 2015
or date of appointment
if later
As at 31 December 2015
or retirement if earlier
Total share plan interests as at
31 December 2015 – LTIP
Total share plan interests as at
31 December 2015 – DBSS
Total share plan interests as at
31 December 2015 – Sharesave
Clive Bannister 176,422 305,964 554,585 99,617 –
James McConville – 95,094 337,359 51,540 1,607
René-Pierre Azria 34,491 34,491 – – –
Alastair Barbour 3,000 3,000 – – –
Ian Cormack 3,650 3,650 – – –
Tom Cross Brown 1,988 1,988 – – –
Howard Davies 3,623 3,623 – – –
Isabel Hudson 3,880 3,880 – – –
Kory Sorenson 1,380 1,380 – – –
Henry Staunton – 20,000 – – –
David Woods 3,500 3,500 – – –
SHAREHOLDING REQUIREMENTSAs explained in the Remuneration Policy under the Shareholding Guidelines section, the Executive Directors are subject to shareholding requirements.
The extent to which Executive Directors have achieved the requirements by 31 December 2015 (using the share price on acquisition/vesting) can be summarised as follows:
Position
Shareholding Guideline
(% of salary)
Value of shares held at
31 December 2015(% of salary)
Clive Bannister 200% 339%
James McConville 200% 175%
The Executive Directors are required to sign a declaration that they have not and will not at any time during their employment with Phoenix Group, enter into any hedging contract in respect of their participation in the AIP, LTIP, Sharesave, SIP or any other incentive plan of the Company, or pledge awards in such plans as collateral, and additionally that they will neither enter into a hedging contract in respect of, nor pledge as collateral, any shares which are required to be held for the purposes of the Company’s Shareholding requirements or any vested LTIP award shares subject to a LTIP holding period.

Phoenix Group Holdings Annual Report and Accounts 2015 71Corporate governance
ADDITIONAL UNAUDITED INFORMATIONDIRECTORS’ SERVICE CONTRACTSThe dates of contracts and letters of appointment and the respective notice periods for Directors are as follows:
Executive Directors’ contracts
Name Date of appointment Date of contractNotice period from
either party (months)
Clive Bannister 28 March 2011 7 February 2011 12
James McConville 28 June 2012 28 May 2012 12
Subject to Board approval, Executive Directors are permitted to accept outside appointments on external boards as long as these are not deemed to interfere with the business of the Group. During 2015, Clive Bannister received £37,500 from Punter Southall Group and CHF60,000 from UniGestion in respect of two external directorships. James McConville received £112,000 from Tesco Personal Finance plc.
Non-Executive Directors’ contracts
NameDate of letter of
appointment Date of Joining the Board Appointment end dateUnexpired term
(months)
René-Pierre Azria 2 September 2009 2 September 2009 11 May 2016 2
Alastair Barbour 11 September 2013 1 October 2013 1 October 2016 7
Ian Cormack 2 September 2009 2 September 2009 11 May 2016 2
Tom Cross Brown 24 September 2009 24 September 2009 11 May 2016 2
Isabel Hudson 11 December 2009 18 February 2010 11 May 2016 2
Kory Sorenson 9 May 2014 1 July 2014 1 July 2017 14
Henry Staunton 19 August 2015 1 September 2015 1 September 2018 30
David Woods 21 December 2009 18 February 2010 11 May 2016 2
The above tables have been included to comply with UKLA Listing Rule 9.8.8. In the event of cessation of a Non-Executive Director’s appointment (excluding the Chairman) they would be entitled to a one month notice period. The Chairman, as detailed in his letter of appointment, would be entitled to a six months’ notice period.
REMUNERATION COMMITTEE GOVERNANCEThe Group established the Committee in 2010. The terms of reference of the Committee are available at www.thephoenixgroup.com. The main determinations of the Committee in 2015 in respect of the application of the Remuneration Policy are summarised in the Committee Chairman’s letter to shareholders at the start of the Directors’ remuneration report.
The table below shows the independent Non-Executive Directors who served on the Committee during 2015 and their date of appointment:
Member From To
Ian Cormack (Committee Chairman) 18 February 2010 To date
Isabel Hudson 18 February 2010 To date
Kory Sorenson 3 July 2014 To date
Under the Committee’s Terms of Reference, the Committee meets at least twice a year but more frequently if required. During 2015, six Committee meetings were held and details of attendance at meetings are set out in the Corporate Governance Report on page 47.
Consistent with the requirements of Solvency II, the Committee is responsible for establishing, implementing, overseeing and reviewing the firm-wide remuneration policy in the context of business strategy and changing risk conditions. The firm-wide remuneration policy focuses on ensuring sound and effective risk management so as not to encourage risk-taking outside of the Company’s risk appetite. None of the Committee members has any personal financial interest (other than as shareholders), conflicts of interests arising from cross-directorships or day-to-day involvement in running the business.
The Committee makes recommendations to the Board. No Director plays a part in any discussion about his or her own remuneration.

Phoenix Group Holdings Annual Report and Accounts 201572
DIRECTORS’ REMUNERATION REPORT Continued
ADVICEThe Committee received independent remuneration advice during the year from its appointed adviser, FIT Remuneration Consultants LLP (‘FIT’). FIT is a member of the Remuneration Consultants Group (the professional body for consultants) and adheres to its code of conduct. This appointment was made by the Committee following consideration of FIT’s experience in this sector. FIT provided no other services to the Group and accordingly the Committee was satisfied that the advice provided by FIT was objective and independent. FIT’s fees in respect of 2015 were £246,582. FIT’s fees were charged on the basis of the firm’s standard terms of business for advice provided.
The Committee also consulted with the Group Chief Executive Officer, Group HR Director and General Counsel who attended, by invitation, various Committee meetings during the year although no executive is ever permitted to participate in discussions or decisions regarding his or her own remuneration. Input is also sought from the Chief Risk Officer (without management present) and from representatives from finance, as appropriate.
APPROVAL This report in its entirety has been approved by the Remuneration Committee and the Board of Directors and signed on its behalf by
IAN CORMACKREMUNERATION COMMITTEE CHAIRMAN
22 MARCH 2016

Phoenix Group Holdings Annual Report and Accounts 2015 73Corporate governance
APPENDIX TO DIRECTORS’ REMUNERATION REPORT: FOR INFORMATION ONLY: THE SUMMARY REMUNERATION POLICY TABLE FROM THE DIRECTORS’ REMUNERATION POLICY APPROVED AT THE 2014 AGMRemuneration Policy tableElement and purpose Policy and operation Maximum Performance measures
Base salaryThis is the core element of pay and reflects the individual’s role and position within the Group with some adjustment to reflect their capability and contribution
Ɛ Base salaries are reviewed each year against companies of similar size and complexity and set by reference to the median data of comparators which the Remuneration Committee considers to be suitable, with consideration given to both relevant insurance companies and the FTSE 31-100 as a whole
Ɛ The Remuneration Committee does not strictly follow data but uses it as a reference point in considering, in its judgement, the appropriate level of salary having regard to other relevant factors including corporate and individual performance and any changes in an individual’s role and responsibilities, and the level of salary increase awarded to other employees of the Group
Ɛ Base salary is paid monthly in cash Ɛ Changes to base salaries normally take effect from 1 January
Ɛ The Remuneration Committee will apply the factors set out in the previous column in considering any salary adjustments during the duration of this policy and, in any event, no increase will be made if it would take an Executive Director’s salary above the median level of salaries for the Remuneration Committee’s assessment of that role in the FTSE 31-100 at or shortly prior to when any increase is considered
Ɛ N/A
Benefits1
To provide other benefits valued by recipient
Ɛ The Group provides market competitive benefits in kind. Details of the benefits provided in 2013 and 2014 are set out in the section below1. The Remuneration Committee reserves discretion to introduce new benefits where it concludes that it is in the interests of Phoenix Group to do so, having regard to the particular circumstances and to market practice
Ɛ Where appropriate, the Company will meet certain costs relating to Executive Director relocations
Ɛ It is not possible to prescribe the likely change in the cost of insured benefits or the cost of some of the other reported benefits year-to-year, but the provision of benefits will normally operate within an annual limit of 10% of an Executive Director’s base salary
Ɛ The Remuneration Committee will monitor the costs in practice and ensure that the overall costs do not increase by more than the Remuneration Committee considers to be appropriate in all the circumstances
Ɛ Relocation expenses are subject to a maximum limit of £150,000
Ɛ N/A
PensionTo provide retirement benefits and remain competitive within the market place
Ɛ The Group provides a competitive employer sponsored pension plan
Ɛ All Executive Directors are eligible to participate in the Group Personal Pension (‘GPP’). Executive Directors receive a contribution to GPP or they may opt to receive the contribution in cash if they are impacted by the relevant lifetime or annual limits
Ɛ Phoenix will honour the pensions obligations entered into under all previous policies in accordance with the terms of such obligations
Ɛ A contribution limit of 20% of base salary per annum per Executive Director has been set for the duration of this policy
Ɛ N/A
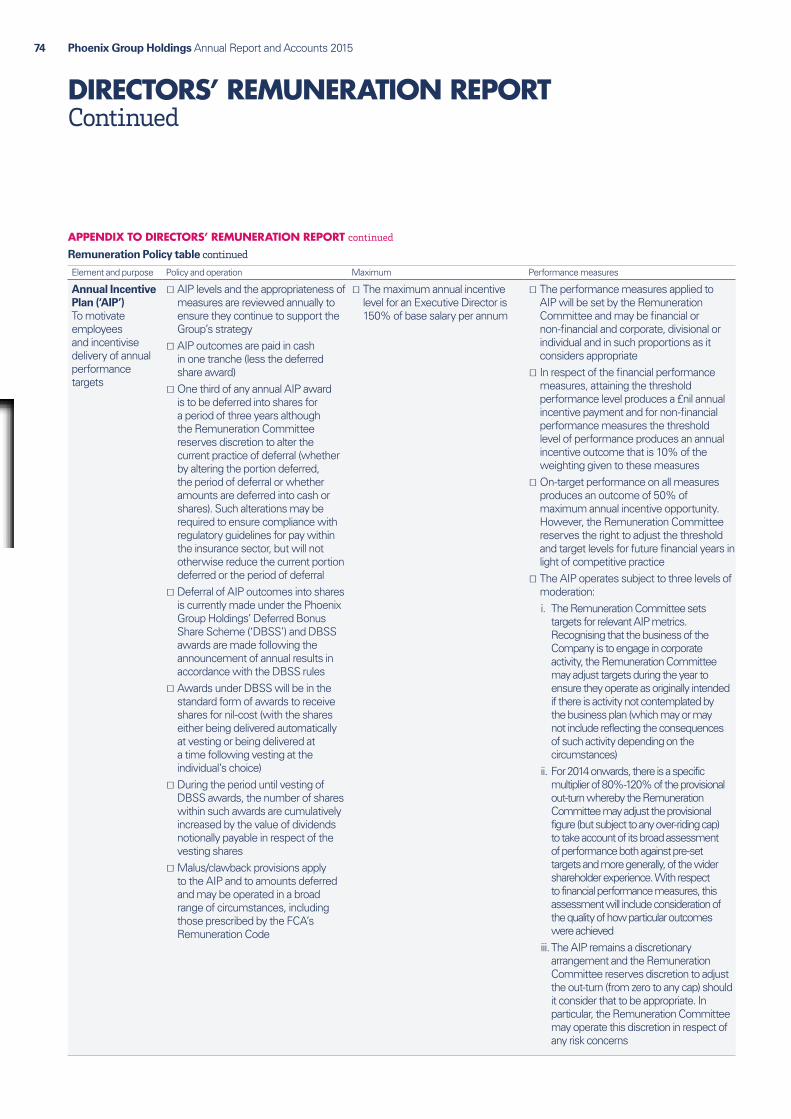
Phoenix Group Holdings Annual Report and Accounts 201574
DIRECTORS’ REMUNERATION REPORT Continued
Element and purpose Policy and operation Maximum Performance measures
Annual Incentive Plan (‘AIP’)To motivate employees and incentivise delivery of annual performance targets
Ɛ AIP levels and the appropriateness of measures are reviewed annually to ensure they continue to support the Group’s strategy
Ɛ AIP outcomes are paid in cash in one tranche (less the deferred share award)
Ɛ One third of any annual AIP award is to be deferred into shares for a period of three years although the Remuneration Committee reserves discretion to alter the current practice of deferral (whether by altering the portion deferred, the period of deferral or whether amounts are deferred into cash or shares). Such alterations may be required to ensure compliance with regulatory guidelines for pay within the insurance sector, but will not otherwise reduce the current portion deferred or the period of deferral
Ɛ Deferral of AIP outcomes into shares is currently made under the Phoenix Group Holdings’ Deferred Bonus Share Scheme (‘DBSS’) and DBSS awards are made following the announcement of annual results in accordance with the DBSS rules
Ɛ Awards under DBSS will be in the standard form of awards to receive shares for nil-cost (with the shares either being delivered automatically at vesting or being delivered at a time following vesting at the individual’s choice)
Ɛ During the period until vesting of DBSS awards, the number of shares within such awards are cumulatively increased by the value of dividends notionally payable in respect of the vesting shares
Ɛ Malus/clawback provisions apply to the AIP and to amounts deferred and may be operated in a broad range of circumstances, including those prescribed by the FCA’s Remuneration Code
Ɛ The maximum annual incentive level for an Executive Director is 150% of base salary per annum
Ɛ The performance measures applied to AIP will be set by the Remuneration Committee and may be financial or non-financial and corporate, divisional or individual and in such proportions as it considers appropriate
Ɛ In respect of the financial performance measures, attaining the threshold performance level produces a £nil annual incentive payment and for non-financial performance measures the threshold level of performance produces an annual incentive outcome that is 10% of the weighting given to these measures
Ɛ On-target performance on all measures produces an outcome of 50% of maximum annual incentive opportunity. However, the Remuneration Committee reserves the right to adjust the threshold and target levels for future financial years in light of competitive practice
Ɛ The AIP operates subject to three levels of moderation:i. The Remuneration Committee sets
targets for relevant AIP metrics. Recognising that the business of the Company is to engage in corporate activity, the Remuneration Committee may adjust targets during the year to ensure they operate as originally intended if there is activity not contemplated by the business plan (which may or may not include reflecting the consequences of such activity depending on the circumstances)
ii. For 2014 onwards, there is a specific multiplier of 80%-120% of the provisional out-turn whereby the Remuneration Committee may adjust the provisional figure (but subject to any over-riding cap) to take account of its broad assessment of performance both against pre-set targets and more generally, of the wider shareholder experience. With respect to financial performance measures, this assessment will include consideration of the quality of how particular outcomes were achieved
iii. The AIP remains a discretionary arrangement and the Remuneration Committee reserves discretion to adjust the out-turn (from zero to any cap) should it consider that to be appropriate. In particular, the Remuneration Committee may operate this discretion in respect of any risk concerns
APPENDIX TO DIRECTORS’ REMUNERATION REPORT continued
Remuneration Policy table continued
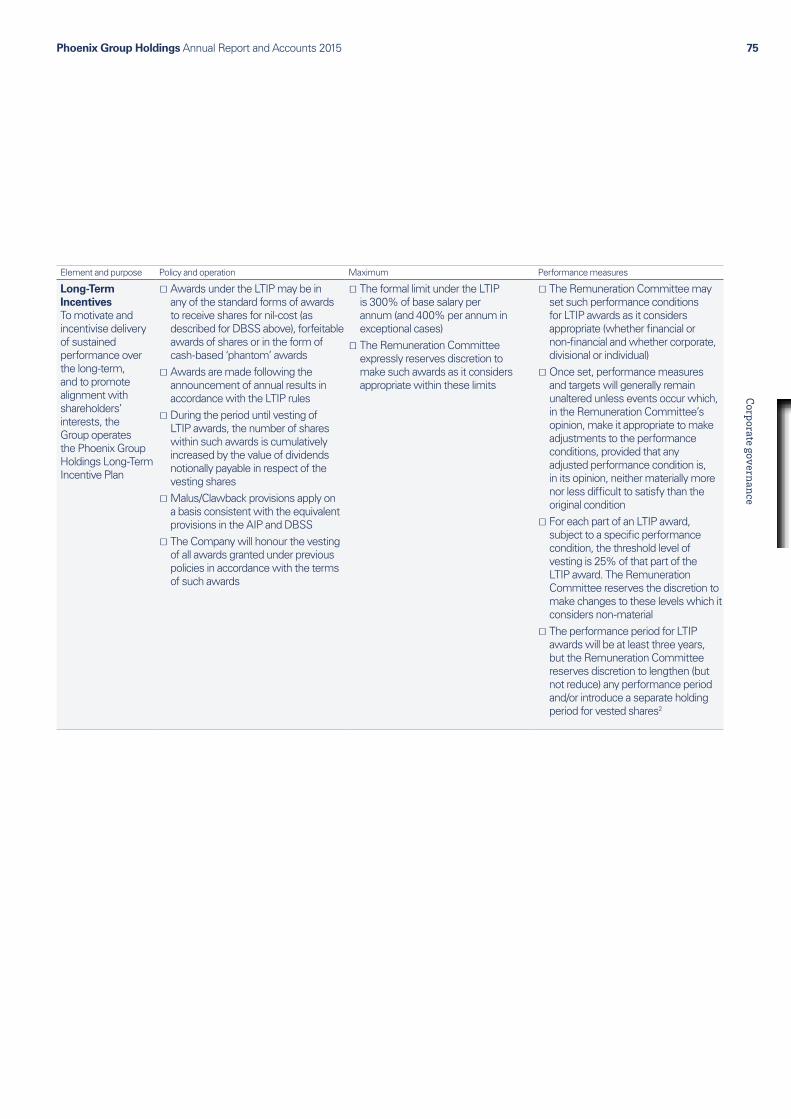
Phoenix Group Holdings Annual Report and Accounts 2015 75Corporate governance
Element and purpose Policy and operation Maximum Performance measures
Long-Term IncentivesTo motivate and incentivise delivery of sustained performance over the long-term, and to promote alignment with shareholders’ interests, the Group operates the Phoenix Group Holdings Long-Term Incentive Plan
Ɛ Awards under the LTIP may be in any of the standard forms of awards to receive shares for nil-cost (as described for DBSS above), forfeitable awards of shares or in the form of cash-based ‘phantom’ awards
Ɛ Awards are made following the announcement of annual results in accordance with the LTIP rules
Ɛ During the period until vesting of LTIP awards, the number of shares within such awards is cumulatively increased by the value of dividends notionally payable in respect of the vesting shares
Ɛ Malus/Clawback provisions apply on a basis consistent with the equivalent provisions in the AIP and DBSS
Ɛ The Company will honour the vesting of all awards granted under previous policies in accordance with the terms of such awards
Ɛ The formal limit under the LTIP is 300% of base salary per annum (and 400% per annum in exceptional cases)
Ɛ The Remuneration Committee expressly reserves discretion to make such awards as it considers appropriate within these limits
Ɛ The Remuneration Committee may set such performance conditions for LTIP awards as it considers appropriate (whether financial or non-financial and whether corporate, divisional or individual)
Ɛ Once set, performance measures and targets will generally remain unaltered unless events occur which, in the Remuneration Committee’s opinion, make it appropriate to make adjustments to the performance conditions, provided that any adjusted performance condition is, in its opinion, neither materially more nor less difficult to satisfy than the original condition
Ɛ For each part of an LTIP award, subject to a specific performance condition, the threshold level of vesting is 25% of that part of the LTIP award. The Remuneration Committee reserves the discretion to make changes to these levels which it considers non-material
Ɛ The performance period for LTIP awards will be at least three years, but the Remuneration Committee reserves discretion to lengthen (but not reduce) any performance period and/or introduce a separate holding period for vested shares2
Phoenix Group Holdings Annual Report and Accounts 201576
DIRECTORS’ REMUNERATION REPORT Continued
Element and purpose Policy and operation Maximum Performance measures
All-employee share plansTo encourage share ownership by employees, thereby allowing them to share in the long-term success of the Group and align their interests with those of the shareholders
Ɛ Executive Directors are able to participate in all-employee share plans on the same terms as other Group employees as required by HMRC legislation
Ɛ Sharesave – the Remuneration Committee has the facility to allow individuals to save up to a maximum of £500 each month (or such other level as permitted by HMRC legislation) for a fixed period of three or five years. At the end of the savings period, individuals may use their savings to buy ordinary shares in the Company at a discount of up to 20% (although for 2014 and past years this has been set at 15%) of the market price set at the launch of each scheme
Ɛ Share Incentive Plan (‘SIP’) – the Remuneration Committee has the facility to allow individuals to have the opportunity to purchase, out of their pre-tax salary, shares in the Company (up to such level as permitted by the Company in line with HMRC legislation) and receive up to two matching shares for every purchased share (although for 2014 and past years matching has been offered at one matching share for every six shares purchased). SIP also has the facility to allow for reinvestment of dividends in further shares, or the award of additional free shares (up to the limits as permitted by HMRC legislation)
Ɛ Consistent with normal practice, such awards are not subject to performance conditions
APPENDIX TO DIRECTORS’ REMUNERATION REPORT continued
Remuneration Policy table continued
Phoenix Group Holdings Annual Report and Accounts 2015 77Corporate governance
Element and purpose Policy and operation Maximum Performance measures
Shareholding GuidelinesTo encourage share ownership by the Executive Directors and ensure interests are aligned
Ɛ Executive Directors are expected to retain all shares (net of tax) which vest under the DBSS and under the LTIP (or any other discretionary long-term incentive arrangement introduced in the future) until such time as they hold a specified value of shares
Ɛ Only beneficially owned shares and vested share awards (discounted for anticipated tax liabilities) may be counted for the purposes of the guidelines. Share awards do not count prior to vesting (including DBSS awards)
Ɛ Once shareholding guidelines have been met, individuals are expected to retain these levels as a minimum. The Remuneration Committee will review shareholdings annually in the context of this policy
Ɛ 200% of base salary for the Group Chief Executive Officer, 100% of base salary for all other Executive Directors3
Ɛ N/A
Chairman and Non-Executive Director fees
Ɛ The fees paid to the Chairman and the fees of the other Non-Executive Directors are set to be competitive with other listed companies of equivalent size and complexity (both relevant insurance companies and the FTSE 31-100 as a whole)
Ɛ Fee levels are periodically reviewed. The Company does not adopt a quantitative approach to pay positioning and exercises judgement as to what it considers to be reasonable in all the circumstances as regards quantum
Ɛ Additional fees are paid to Non-Executive Directors who chair or sit on a board committee, or on boards of subsidiary entities or on the Solvency II Model Governance Committee and to the Senior Independent Director (‘SID’)
Ɛ Fees are paid monthly in cash Ɛ Fee levels for Non-Executive Directors are reviewed annually with any changes normally taking effect from 1 January
Ɛ The aggregate fees of the Chairman and Non-Executive Directors will not exceed the limit from time to time prescribed within the Company’s Articles of Association for such fees (currently £2 million per annum in aggregate)
Ɛ The Company reserves the right to vary the structure of fees within this limit including, for example, introducing time-based fees or reflecting the establishment of new board committees
Ɛ N/A
Footnotes to the above Remuneration Policy table1. Benefits in 2015 For details of benefits in 2015, please see note 1 to the ‘Single Figure of Remuneration Table’ on page 64.
2. Holding Period for LTIP awards from 2015 For LTIP awards from 2015 a two-year holding period has been introduced as explained in the ‘Implementation of Remuneration Policy in 2015’ table on page 61.
3. Shareholding Guidelines from 2015 These have been extended to 200% of base salary for all Executive Directors.

Phoenix Group Holdings Annual Report and Accounts 201578
DIRECTORS’ REMUNERATION REPORT Continued
RECRUITMENT REMUNERATION POLICYThe Company’s recruitment remuneration policy aims to give the Remuneration Committee sufficient flexibility to secure the appointment and promotion of high-calibre executives to strengthen the management team and secure the skill sets to deliver our strategic aims.
Ɛ In terms of the principles for setting a package for a new Executive Director, the starting point for the Remuneration Committee will be to apply the general policy for Executive Directors as set out above and structure a package in accordance with that policy. Consistent with the new UK regulations, the caps contained within the policy for fixed pay do not apply to new recruits, although the Remuneration Committee would not envisage exceeding these caps in practice.
Ɛ The AIP and LTIPs will operate (including the maximum award levels) as detailed in the general policy in relation to any newly appointed Executive Director.
Ɛ For an internal appointment, any variable pay element awarded in respect of the prior role may either continue on its original terms or be adjusted to reflect the new appointment as appropriate.
Ɛ For external and internal appointments, the Remuneration Committee may agree that the Company will meet certain relocation expenses as it considers appropriate.
Ɛ For external candidates, it may be necessary to make additional awards in connection with the recruitment to replace awards forfeited by the individual on leaving a previous employer. For such replacement awards, Phoenix Group will not pay more than is, in the view of the Remuneration Committee, necessary and will in all cases seek, in the first instance, to deliver any such awards under the terms of the existing incentive pay structure. It may, however, be necessary in some cases to make such awards on terms that are more bespoke than the existing annual and equity-based pay structures in Phoenix in order to secure a candidate. Details of any recruitment-related awards will be appropriately disclosed.
Ɛ All such replacement awards, whether under the AIP, LTIP or otherwise, will take account of the service obligations and performance requirements for any remuneration relinquished by the individual when leaving a previous employer. The Remuneration Committee will seek to make replacement awards subject to what are, in its opinion, comparable requirements in respect of, service and performance. However, the Committee may choose to relax this requirement in certain cases (such as where the service and/or performance requirements are materially completed), and where the Remuneration Committee considers it to be in the interest of shareholders or where such factors are, in the view of the Remuneration Committee, reflected in some other way, such as a significant discount to the face value of the awards forfeited. Exceptionally, where necessary, this may include a guaranteed or non pro-rated annual incentive in the year of joining.
Ɛ For the avoidance of doubt, such replacement awards are not subject to a formal cap. The Remuneration Committee has not placed a maximum limit on any such awards which it may be necessary to make as it is not considered to be in shareholders’ interests to set any expectations for prospective candidates regarding such awards. Any recruitment-related awards which do not replace awards with a previous employer will be subject to the limits for incentive pay as stated in the general policy.
A new Non-Executive Director would be recruited on the terms explained above in respect of the main policy for such Directors.

Phoenix Group Holdings Annual Report and Accounts 2015 79Corporate governance
TERMINATION POLICY SUMMARYIn practice, the facts surrounding any termination do not always fit neatly into defined categories for good or bad leavers. Therefore, it is appropriate for the Remuneration Committee to consider the suitable treatment on a termination having regard to all of the relevant facts and circumstances available at that time. This policy applies both to any negotiations linked to notice periods on a termination and any treatment which the Remuneration Committee may choose to apply under the discretions available to it under the terms of the AIP, DBSS and LTIP plans. The potential treatments on termination under these plans are summarised below.
Incentives Good leaver Bad leaver Exceptional events
If a leaver is deemed to be a ‘good leaver’; i.e. leaving through redundancy, serious ill health or death or otherwise at the discretion of the Remuneration Committee
If a leaver is deemed to be a ‘bad leaver’; typically voluntary resignation or leaving for disciplinary reasons
For example change in control or winding-up of the Company
AIP Pro-rated annual incentive. Pro-rating to reflect only the period worked. Performance metrics determined by the Remuneration Committee
No awards made Either the AIP will continue for the year or there will be a pro-rated annual incentive. Performance metrics determined by the Remuneration Committee
DBSS Deferred awards vest Deferred awards normally lapse Deferred awards vest
LTIP Will receive a pro-rated award subject to the application of the performance conditions at the normal measurement date
Remuneration Committee discretion to disapply pro-rating or to accelerate vesting to the date of leaving (subject to pro-rating and performance conditions)
All awards will normally lapse Will receive a pro-rated award subject to the application of the performance conditions at the date of the event. Remuneration Committee discretion to disapply pro-rating
The Company has power to enter into settlement agreements with executives and to pay compensation to settle potential legal claims. In addition, and consistent with market practice, in the event of termination of an Executive Director, the Company may pay a contribution towards the individual’s legal fees and fees for outplacement services as part of a negotiated settlement. Any such fees would be disclosed as part of the detail of termination arrangements. For the avoidance of doubt, the policy does not include an explicit cap on the cost of termination payments.

Phoenix Group Holdings Annual Report and Accounts 201580
DIRECTORS’ REMUNERATION REPORT Continued
POTENTIAL REWARDS UNDER VARIOUS SCENARIOSThe potential total rewards available to the Executive Directors, ignoring any change in share price and roll-up of dividends are:
TOTAL REMUNERATION OPPORTUNITY (£000)
1,733
856
3,307
100%
50% 30% 20%
26% 32% 42%
Group Chief Executive Officer – Clive Bannister
On-target
Maximum
Minimum
Group Finance Director – James McConville
1,096
544
2,085
100%
50% 30% 20%
26% 32% 42%
On-target
Maximum
Minimum
LTIP AIP Total fixed pay
Name Base salary£000
Benefits£000
Pension£000
Total fixed£000
Clive Bannister £700 £17 £140 £857
James McConville £440 £16 £88 £544
The above chart aims to show how the Remuneration Policy set out above for Executive Directors is applied using the following assumptions.
Minimum Consists of base salary, benefits and pension
Base salary is the salary to be paid in 2014
Benefits measured as benefits paid in 2013 as set out in the single figure table but excluding relocation payments for James McConville
Pension measured as the 20% of base salary receivable either as a pension contribution or as cash, and ignoring the reduction to payments made in cash for employer’s national insurance contributions
On-target Based on what the Director would receive if performance was on-target
Ɛ AIP: consists of the on-target annual incentive (75% of base salary)
Ɛ LTIP: consists of the threshold level of vesting (50% of base salary). The benefit of a single year’s participation in the Sharesave scheme is recognised using an expected value for the Sharesave options of 30%. The benefit of a single year’s participation in the SIP is recognised using one matching share for every six shares invested on the maximum value which can be invested.
Maximum Based on the maximum remuneration receivable:
Ɛ AIP: consists of the maximum annual incentive (150% of base salary)
Ɛ LTIP: assumes maximum vesting of awards and valued as on the date of grant (200% of base salary). Sharesave and SIP valued on the same basis as in the on-target column.

Phoenix Group Holdings Annual Report and Accounts 2015 81Corporate governance
DIRECTORS’ REPORT
The Directors of the Group present their report for the year ended 31 December 2015.
Phoenix Group Holdings is incorporated in the Cayman Islands (registered no. 202172) and has a Premium Listing on the London Stock Exchange. The Company is therefore not required to comply with the requirements of section 415 of the UK Companies Act 2006. However, the Directors support these enhanced standards for disclosure and have sought to comply voluntarily with these requirements.
SHAREHOLDERSDIVIDENDSDividends for the year are as follows:
Ordinary shares
Paid interim dividend 26.7p per share (2014: 26.7p per share)
Recommended final dividend 26.7p per share (2014: 26.7p per share)
Total ordinary dividend 53.4p per share (2014: 53.4p per share)
SHARE CAPITALThe issued share capital of the Company was increased by 329,162 ordinary shares during 2015 which related to the Company’s Sharesave Scheme. At 31 December 2015, the issued ordinary share capital totalled 225,419,446. Subsequently, 786 ordinary shares have been issued in 2016 in connection with the Company’s Sharesave Scheme to bring the total in issue to 225,420,232 at the date of this report.
Full details of the authorised, issued and fully paid share capital as at 31 December 2015 and movements in share capital during the period are presented in note D1 to the IFRS consolidated financial statements.
The rights and obligations attaching to the Company’s ordinary shares are set out in the Company’s Articles of Association (the ‘Company’s Articles’) which are available on the Company’s website at www.thephoenixgroup.com/about-us/corporate-governance/articles-of-association.aspx.
Where the Employee Benefit Trust (‘EBT’) holds shares for unvested awards, the voting rights for these shares are exercisable by the trustees of the EBT at their discretion, taking into account the recommendations of the Group. For shares that have vested into respective sub funds underneath the EBT, the voting rights are exercisable by the trustees of the respective sub funds at their discretion, taking into account the recommendations of the relevant participant of the respective sub funds.
RESTRICTIONS ON TRANSFER OF SHARESUnder the Company’s Articles, the Directors may in certain circumstances refuse to register transfers of shares. In particular, the Board of Directors may refuse to register the transfer of shares to a person who is a Non-Qualified Person (as defined in the Company’s Articles).
Certain restrictions on the transfer of shares may be imposed from time to time by applicable laws and regulations (for example, insider trading laws), and pursuant to the Listing Rules of the Financial Conduct Authority (‘FCA’) and the Group’s own share dealing rules whereby Directors and certain employees of the Group require the approval of the Company to deal in the Company’s ordinary shares.
SUBSTANTIAL SHAREHOLDINGSInformation provided to the Company pursuant to the FCA’s Disclosure and Transparency Rules is published on a Regulatory Information Service and on the Company’s website. As at 22 March 2016, the Company had been notified of the following significant holdings of voting rights in its shares.
Number of voting rights in
shares
Percentage of shares in
issue
Artemis Investment Management LLP 22,477,390 9.97
Black Rock, Inc. 11,984,110 5.31
Ameriprise Financial Inc. 11,277,894 5.00
FIL Limited 11,280,767 5.00
ANNUAL GENERAL MEETING (‘AGM’)The AGM of the Company will be held at 32 Commercial Street, St Helier, Jersey JE2 3RU on Wednesday, 11 May 2016 at 12.30pm.
A separate notice convening this meeting will be distributed to shareholders in due course and will include an explanation of the items of business to be considered at the meeting.
BOARDBOARD OF DIRECTORSThe membership of the Board of Directors during 2015 is given within the Corporate Governance Report on page 47 which is incorporated by reference into this report. Details of Directors and their connected persons’ beneficial and non-beneficial interests in the shares of the Company are shown in the Directors’ remuneration report.
During 2015 and up to the date of this report, the following changes to the Board took place:
Ɛ Howard Davies resigned from the Board on 31 August 2015
Ɛ Henry Staunton was appointed to the Board as Chairman with effect from 1 September 2015.
Details of related party transactions which took place during the year with Directors of the Company and consolidated entities where directors are deemed to have significant influence, are provided in the Directors’ remuneration report and in note I5 to the IFRS consolidated financial statements.
The rules about the appointment and replacement of Directors are contained in the Company’s Articles. These state that a Director may be appointed by an ordinary resolution of the shareholders or by a resolution of the Directors. If appointed by a resolution of the Directors, the Director concerned holds office only until the conclusion of the next AGM following the appointment.
Read more about our Board of Directors
44

Phoenix Group Holdings Annual Report and Accounts 201582
DIRECTORS’ REPORT Continued
In accordance with the UK Corporate Governance Code, Directors must stand for re-election annually. The Board of Directors will be unanimously recommending that all of the Directors, except Tom Cross Brown who is standing down from the Board, should be put forward for election/re-election at the forthcoming AGM to be held on 11 May 2016.
The Articles give details of the circumstances in which Directors will be treated as having automatically vacated their office and also state that the Company’s shareholders may remove a Director from office by passing an ordinary resolution.
The powers of the Directors are determined by Cayman Islands Company Law, Cayman Islands common law, the provisions of the Company’s Memorandum and Articles and by any valid directions given by shareholders by way of special resolution.
The Directors have been authorised to allot and issue securities and grant options over or otherwise dispose of shares under Article 14.
At the Company’s AGM held on 23 April 2015, shareholders granted the Company authority to purchase up to 10% of its issued ordinary shares. Any ordinary shares purchased under the authority would, subject to the Cayman Islands Companies Law (as amended), either be cancelled by operation of law or held in treasury. These authorities were not used during the year or up to the date of this report.
Subject to obtaining shareholder approval for the renewal of this authority at the forthcoming AGM, the Company is authorised to make purchases of its own shares under Article 20 and make payment for the redemption or purchase of its own shares in any manner permitted by the Cayman Islands Companies Law (as amended), applicable law or regulation, including without limitation, out of capital, profits, share premium or the proceeds of a new issue of shares. The Company held no treasury shares during the year or up to the date of this report.
DIRECTORS’ REMUNERATION AND INTERESTSA report on Directors’ remuneration is presented within the Directors’ remuneration report including details of their interests in shares and share options or any rights to subscribe for shares in the Company.
DIRECTORS’ INDEMNITIESFollowing shareholder approval on 15 March 2010, the Company entered into a deed of indemnity by way of deed poll with its Directors whereby the Company has agreed to indemnify each Director against all losses incurred by them in the exercise, execution or discharge of their powers or duties as a Director of the Company, provided that the indemnity shall not apply to the extent prohibited by any applicable law.
The deed of indemnity remains in force as at the date of signature of this Directors’ Report.
DIRECTORS’ CONFLICTS OF INTERESTThe Board has established procedures for handling conflicts of interest in accordance with Cayman Islands law and the Company’s Articles.
On an ongoing basis, Directors are responsible for informing the Company Secretary of any new, actual or potential conflicts that may arise.
All Directors and employees of the Company and its subsidiaries are subject to the Group conflicts of interest policy which has been established to provide a clear framework for an effective system of internal control to manage conflicts of interest throughout the Group.
DIRECTORS’ AND OFFICERS’ LIABILITY INSURANCEThe Company maintains Directors’ and Officers’ liability insurance cover which is renewed annually.
GOVERNANCEGOING CONCERN The Group’s business activities, together with the factors likely to affect its future development, performance and position are set out in the Strategic Report. The Strategic Report also provides details of any key events affecting the Company (and its consolidated subsidiaries) since the end of the financial year. The Strategic Report includes details of the Group’s cash flow and solvency position, including sensitivities for both. Principal risks and their mitigation are detailed on pages 37 to 38 and the viability statement is included on pages 39. In addition, the financial statements include, amongst other things, notes on the Group’s borrowings (note E5), management of its financial and insurance risk including market, credit and liquidity risk (note E6), its commitments and contingent liabilities (notes I7 and I8) and its capital position and management (note I4). The Strategic Report (on pages 4 to 40) sets out the business model and how we create value for shareholders and policyholders.
The Board has followed the new requirements of the UK Financial Reporting Council’s ‘Guidance on Risk Management, Internal Control and Related Financial and Business Reporting (September 2014) when performing its going concern assessment. As part of its comprehensive assessment of whether the Group and the Company are a going concern, the Board has undertaken a review of the liquidity and solvency of the Group under both normal and stressed conditions as at the date of preparation of the statement of consolidated financial position.
Having thoroughly considered the going concern assessment, including a detailed review of the regulatory capital and cash flow positions of each principal subsidiary company and the availability across the Group of a range of management actions, the Board has concluded that there are no material uncertainties that may cast significant doubt about the Group and the Company’s ability to continue as a going concern. The Directors have a reasonable expectation that the Group and the Company have adequate resources to continue in operational existence for the foreseeable future. Thus, they continue to adopt the going concern basis of accounting in preparing the annual financial statements.
CORPORATE GOVERNANCE STATEMENTThe disclosures required by section 7.2 of the FCA’s Disclosure and Transparency Rules can be found in the Corporate Governance Report on page 82 which is incorporated by reference into this Directors’ Report and comprises the Company’s Corporate Governance Statement. The UK Corporate Governance Code (the ‘Code’) applies to the Company and full details on the Company’s compliance with the Code are included in the Corporate Governance Report. The Code is available on the website of the Financial Reporting Council – www.frc.org.uk.
Read more about Directors’ remuneration
57
Phoenix Group Holdings Annual Report and Accounts 2015 83Corporate governance
GREENHOUSE GAS EMISSIONSAll disclosures concerning the Group’s greenhouse emissions are contained in the Environmental Report forming part of the Strategic Report on page 40.
FINANCIAL RISK MANAGEMENTThe Group operates a Risk Management Framework (‘RMF’) consisting of several components, as detailed in the Risk management section of the Strategic Report. The RMF provides a consistent approach to highlighting and controlling key risks throughout the organisation. This is achieved primarily through review and compliance, at a functional level, with the risk universe and related policies (and the risk appetites therein). At its highest level the RMF considers the following risks: strategic, market, credit, insurance, financial soundness , customer and operational. As a result, in preparing the consolidated financial statements, assessment is given to a broad range of risk categories.
MEMORANDUM AND ARTICLESChanges to the Company’s Memorandum and Articles require prior shareholder approval.
The Memorandum and Articles are available on the Company’s website at www.thephoenixgroup.com/about-us/corporate-governance/articles-of-association.aspx.
RE-APPOINTMENT OF THE AUDITORSErnst & Young LLP (‘EY’) has indicated its willingness to continue in office and a resolution that it is re-appointed will be proposed at the AGM on 11 May 2016.
There is no cap on auditor liability in place in relation to audit work carried out on the consolidated IFRS financial statements, MCEV supplementary information and the Group’s UK subsidiaries’ individual financial statements.
Details of fees paid to EY during 2015 for audit and non-audit work are disclosed in note C3 to the IFRS consolidated financial statements.
DISCLOSURE OF INFORMATION TO AUDITORSThe Directors who held office at the date of approval of this Directors’ Report confirm that, so far as they are aware, there is no relevant audit information of which the Company’s auditor is unaware and that each Director has taken all the steps that they ought to have taken as a Director to make themselves aware of any relevant audit information and to establish that the Company’s auditor is aware of that information.
GROUP COMPANY SECRETARYThe Group Company Secretary throughout the 2015 financial period was Gerald Watson.
CONTRACTUAL/OTHERSIGNIFICANT AGREEMENTS IMPACTED BY A CHANGE OF CONTROL OF THE COMPANY There are change of control clauses contained in certain of the Group’s financing agreements. The PGH Capital revolving credit facility has a provision which would enable the lending banks to require repayment of all amounts borrowed following a change of control. In addition, certain provisions of the Articles relating to the City Code on Takeovers and Mergers apply in connection with a takeover bid.
All of the Company’s employee share and incentive plans contain provisions relating to a change of control. Outstanding awards and options would normally vest and become exercisable on a change of control, subject to the satisfaction of any performance conditions and pro rata reduction as may be applicable under the rules of the employee share incentive plans.
Apart from the aforementioned, there are a number of agreements that take effect, alter or terminate upon a change of control of the Company, such as commercial contracts. None is considered to be significant in terms of their potential impact on the business of the Group.
ESSENTIAL CONTRACTS OR ARRANGEMENTS There are a number of relationships with third parties which are of significant value to the Group. Apart from the PGH capital revolving credit facility, £300 million unsecured bonds, the £200 million Phoenix Life Limited Tier 2 bonds and the £428 million subordinated notes, no single relationship is considered to be essential to the Group.
GROUP EMPLOYEESThe Group is committed to achieving equality of opportunity and the equal treatment of all our people and those applying to join us. To this end, all our people share an obligation to their colleagues, customers and business partners to provide a safe, fair and equitable working environment in which every individual can seek, obtain and continue employment without experiencing any unfair or unreasonable discrimination.
The Group recognises the need to treat people with disabilities fairly and equally including where an employee becomes disabled during their employment. Full and fair consideration is given to internal and external applications from disabled people for employment and further career opportunities, including training and development. Internal and external applicants are asked if they have any special requirements when invited to attend an interview and reasonable provisions are made to meet the applicant’s request. Applicants are considered on the basis of the job requirements and their ability and competencies, also taking into consideration any appropriate reasonable workplace adjustments.
The Group provides the opportunity for employees to participate in the Company’s all-employee share schemes, Sharesave and Share Incentive Plan, to facilitate share ownership in the Company.
Read more about Risk management
34

Phoenix Group Holdings Annual Report and Accounts 201584
DIRECTORS’ REPORT Continued
EMPLOYEE PRACTICEPhoenix Group continues to communicate with staff across a wide variety of channels, including regular news bulletins via the intranet, Executive Committee presentations and other face-to-face briefings. The staff briefings and Executive Committee presentations typically include updates on the Company’s strategy and plans, progress against key financial and operational targets, regulatory and risk management updates and review of economic or other factors which could affect the Company’s strategy and performance. Regular feedback mechanisms are also in place, ensuring communication at Phoenix is a continuous two-way dialogue.
The views and opinions of staff are sought through Phoenix’s annual Engagement Survey and more regular interim surveys and employee communication and engagement forums. Phoenix undertakes meaningful consultation with staff representatives on all major organisational changes and other matters affecting employees.
DISCLOSURES UNDER LISTING RULE 9.8.4RFor the purposes of Listing Rule 9.8.4C R, the information required to be disclosed under Listing Rule 9.8.4 R can be found within the following sections of the Report and Accounts:
Section Requirement Location
1 Statement of interest capitalised
Note E5 to the Consolidated Financial Statements
2 Publication of unaudited financial information
Not applicable
3 Deleted Not applicable
4 Details of long-term incentive schemes
Directors’ remuneration report
5 Waiver of emoluments by a Director
Directors’ remuneration report
6 Waiver of any future emoluments by a Director
Directors’ remuneration report
7 Non pre-emptive issue of equity for cash
Not applicable
8 As per 7, but for major subsidiary undertakings
Not applicable
9 Parent participation in any placing of a subsidiary
Not applicable
10 Contracts of significance Not applicable
11 Controlling shareholder provision of services
Not applicable
12 Shareholder dividend waiver Not applicable
13 Shareholder dividend waiver – future periods
Not applicable
14 Controlling shareholder agreements
Not applicable
STRATEGIC AND DIRECTORS’ REPORT APPROVALThe Board has prepared a Strategic Report which provides an overview of the development and performance of the Group’s business for the year ended 31 December 2015, covers the future developments in the business of Phoenix Group Holdings and its consolidated subsidiaries, and provides details of any important events affecting the Company and its subsidiaries after the year-end. For the purposes of compliance with DTR 4.1.5R(2) and DTR 4.1.8R, the required content of the ‘Management Report’ can be found in the Strategic Report and this Directors’ Report, including the sections of the Annual Report and Accounts incorporated by reference.
In addition, the Directors at the date of this report consider that the Annual Report and Accounts, taken as a whole, provides users (who have a reasonable knowledge of business and economic activities) the information necessary to assess the Group’s performance, business model and strategy and is fair, balanced and understandable.
The Strategic Report and the Directors’ Report were approved by the Board of Directors on 22 March 2016.
CLIVE BANNISTER JAMES MCCONVILLEGROUP CHIEF EXECUTIVE OFFICER GROUP FINANCE DIRECTOR
ST HELIER, JERSEY 22 MARCH 2016
Phoenix Group Holdings Annual Report and Accounts 2015 85
FINA
NC
IALS
IN THIS SECTION
Statement of Directors’ responsibilities 86
Independent Auditor’s report 87
IFRS consolidated financial statements 95
Notes to the IFRS consolidated financial statements 102
Parent company accounts 188
Asset disclosures 198
MCEV supplementary information 206

Phoenix Group Holdings Annual Report and Accounts 201586
STATEMENT OF DIRECTORS’ RESPONSIBILITIESIN RESPECT OF THE ANNUAL REPORTAND ACCOUNTS
STATEMENT OF DIRECTORS’ RESPONSIBILITIES IN RESPECT OF THE ANNUAL REPORT AND ACCOUNTS OF PHOENIX GROUP HOLDINGSThe Directors of Phoenix Group Holdings are responsible for the preparation of the Annual Report and Accounts, the Strategic Report, the Directors’ Report, the Directors’ remuneration report, the Group consolidated financial statements and the Company financial statements in accordance with applicable law and regulations.
The Directors have prepared the Group consolidated financial statements and the Company financial statements in accordance with International Financial Reporting Standards (‘IFRSs’) as issued by the International Accounting Standards Board (‘IASB’). The Directors must not approve the financial statements unless they are satisfied that they give a true and fair view of the state of affairs of the Group and the Company and of the profit or loss of the Group and the Company for that period.
In preparing these financial statements the Directors are required to:
Ɛ select suitable accounting policies and then apply them consistently;
Ɛ make judgements and accounting estimates that are reasonable and prudent;
Ɛ state whether IFRS, as adopted by the IASB, have been followed, subject to any material departures disclosed and explained in the Group and the Company financial statements; and
Ɛ prepare the financial statements on the going concern basis unless it is inappropriate to presume that the Group and the Company will continue in business.
The Directors are responsible for:
Ɛ keeping adequate accounting records that are sufficient to show and explain the Group’s and the Company’s transactions and disclose, with reasonable accuracy at any time, the financial position of the Group and the Company;
Ɛ safeguarding the assets of the Group and hence for taking reasonable steps for the prevention and detection of fraud and other irregularities; and
Ɛ preparing a Strategic Report, Directors’ Report, Directors’ Remuneration Report and Corporate Governance Statement in compliance with applicable laws and regulations.
The Directors as at the date of this report, whose names and functions are listed in the Board of Directors section on pages 44 and 45, confirm that, to the best of their knowledge:
Ɛ the Group’s consolidated financial statements and the Company financial statements, which have been prepared in accordance with IFRS as issued by the IASB, give a true and fair view of the assets, liabilities, financial position and profit of the Group and the Company; and
Ɛ the Directors’ Report and the Strategic Report include a fair review of the development and the performance of the business and the position of the Company and its consolidated subsidiaries taken as a whole, together with a description of the principal risks and uncertainties that they face.
In addition, the Directors as at the date of this report consider that the Annual Report and Accounts, taken as a whole, provides users (who have a reasonable knowledge of business and economic activities) with the information necessary for shareholders to assess the Group’s performance, business model and strategy, and is fair, balanced and understandable.
The Directors have elected to comply with certain Companies Act and Listing Rules (‘LR’) which would otherwise only apply to companies incorporated in the UK – namely:
Ɛ the Directors’ statement under LR 9.8.6R(3) (statement by the Directors that the business is a going concern);
Ɛ the Directors remuneration disclosures made under LR 9.8.4R(5) and (6); and
Ɛ the requirements of Schedule 8 to The Large and Medium-sized Companies and Groups (Accounts and Reports) Regulations 2008 of the United Kingdom pertaining to Directors’ remuneration that UK quoted companies are required to comply with.
CLIVE BANNISTER JAMES MCCONVILLEGROUP CHIEF EXECUTIVE OFFICER GROUP FINANCE DIRECTOR
ST HELIER, JERSEY 22 MARCH 2016
Phoenix Group Holdings Annual Report and Accounts 2015 87Financials
INDEPENDENT AUDITOR’S REPORT TO THEMEMBERS OF PHOENIX GROUP HOLDINGS
OUR OPINION ON THE FINANCIAL STATEMENTSIn our opinion:
Ɛ Phoenix Group Holdings’ consolidated financial statements and parent company financial statements (the ‘financial statements’) give a true and fair view of the state of the Group’s and of the parent company’s affairs as at 31 December 2015 and of the Group’s and of the parent company’s profit for the year then ended; and
Ɛ the financial statements have been properly prepared in accordance with International Financial Reporting Standards (‘IFRSs’) as issued by the International Accounting Standards Board (‘IASB’).
WHAT WE HAVE AUDITEDWe have audited the consolidated financial statements of Phoenix Group Holdings and its subsidiaries (collectively ‘the Group’) and the parent company for the year ended 31 December 2015, included within the Annual Report and Accounts, which comprise:
Group Parent company
Ɛ The consolidated income statement for the year then ended Ɛ The statement of comprehensive income for the year then ended
Ɛ The consolidated statement of comprehensive income for the year then ended
Ɛ The statement of financial position as at 31 December 2015
Ɛ The pro forma reconciliation of Group operating profit to results attributable to owners for the year then ended
Ɛ The statement of cash flows for the year then ended
Ɛ The statement of consolidated financial position as at 31 December 2015
Ɛ The statement of changes in equity for the year then ended
Ɛ The statement of consolidated cash flows for the year then ended Ɛ Related notes 1 to 17 to the financial statements
Ɛ The statement of consolidated changes in equity for the year then ended
Ɛ Related notes A1 to I9 to the consolidated financial statements
Certain required disclosures have been presented elsewhere in the Annual Report and Accounts, rather than in the notes to the financial statements. These have been cross-referenced from the financial statements and are identified as audited.
The financial reporting framework that has been applied in the preparation of the financial statements is IFRSs as issued by the IASB.
OVERVIEW OF OUR AUDIT APPROACH
Materiality Ɛ Overall Group materiality of £46m (2014: £41m) which represents 1.9% (2014: 1.7%) of total equity attributable to owners of the parent (‘Group equity’).
Audit scope Ɛ We performed an audit of the complete financial information of the Group Function and Insurance Companies and audit procedures on specific balances for Other Companies. These are explained further on page 91.
Ɛ The reporting units where we performed full or specific audit procedures accounted for more than 99% of the equity and operating profit of the Group.
Risks of material misstatement
Ɛ Valuation of insurance contract liabilities, comprising of the following risk areas:
Ɛ actuarial assumptions;
Ɛ actuarial modelling; and
Ɛ data.
Ɛ Valuation of complex and illiquid financial investments.

Phoenix Group Holdings Annual Report and Accounts 201588
INDEPENDENT AUDITOR’S REPORT TO THEMEMBERS OF PHOENIX GROUP HOLDINGSContinued
OUR ASSESSMENT OF RISK OF MATERIAL MISSTATEMENT We identified the risks of material misstatement described below as those that had the greatest effect on our overall audit strategy, the allocation of resources in the audit and the direction of the efforts of the audit team. In addressing these risks, we have performed the procedures below which were designed in the context of the financial statements as a whole and, consequently, we do not express any opinion on these individual areas.
Risk
Valuation of insurance contract liabilities (£40.9bn value of the risk; 2014: £43.9bn) Refer to the Audit Committee Report (page 50 to 52); Critical accounting estimates (page 103); Accounting policies and notes F1 and F2 of the consolidated financial statements (pages 140 to 142) We considered the valuation of insurance contract liabilities to be a significant risk for the Group. Specifically we considered the actuarial assumptions which are applied, as these involve complex and significant judgements about future events, both internal and external to the business, for which small changes can result in a material impact to the valuation. We considered the actuarial modelling used in the valuation process which should model the results appropriately based on the methodology and in accordance with the regulations. Additionally, the valuation process is conditional upon on the accuracy and completeness of the data used.
We have therefore split the risks relating to the valuation of insurance contract liabilities into the following risk areas:
Ɛ actuarial assumptions;
Ɛ actuarial modelling; and
Ɛ data.
We assessed management’s analysis of movements in insurance contract liabilities and obtained evidence to support large or unexpected movements. This provided important audit evidence over the valuation of insurance contract liabilities. Further additional audit procedures performed to respond to the specific risk areas are set out below:Risk Our response to the risk What we concluded to the Audit Committee
Actuarial assumptions There has been no change in our assessment of this risk from the prior year. Economic assumptions are set by management taking into account market conditions as at the valuation date. Non-economic assumptions such as future expenses, longevity and mortality are set based on past experience, market experience, market practice, regulations and expectations about future trends.
The assumptions that we consider to have the most significant impact are the rate of interest used for discounting liabilities, the allowance for expected credit default within the investment portfolio, life expectancy of policyholders and the lapse rates of policies.
These assumptions are used as inputs into a valuation model which uses standard actuarial methodologies.
In obtaining sufficient audit evidence to conclude on the appropriateness of actuarial assumptions, we:
Ɛ tested the design and operating effectiveness of key controls over management’s process for setting and updating actuarial assumptions;
Ɛ compared the methodology and assumptions used with those we would expect based on our knowledge of the Group, industry standards and regulatory and financial reporting requirements;
Ɛ assessed the results of management’s experience analysis, which supports the adopted assumptions and methodology, and checked that the assumptions used are consistent with this experience analysis;
Ɛ evaluated the choice of the industry standard Continuous Mortality Investigation (‘CMI’) model and the parameters used to ensure that it was appropriate given the demographics of policyholders; and
Ɛ benchmarked the demographic and economic assumptions against those of other industry participants.
We determined that the actuarial assumptions used by management are reasonable based on the analysis of the experience to date, industry practice and the financial and regulatory requirements.
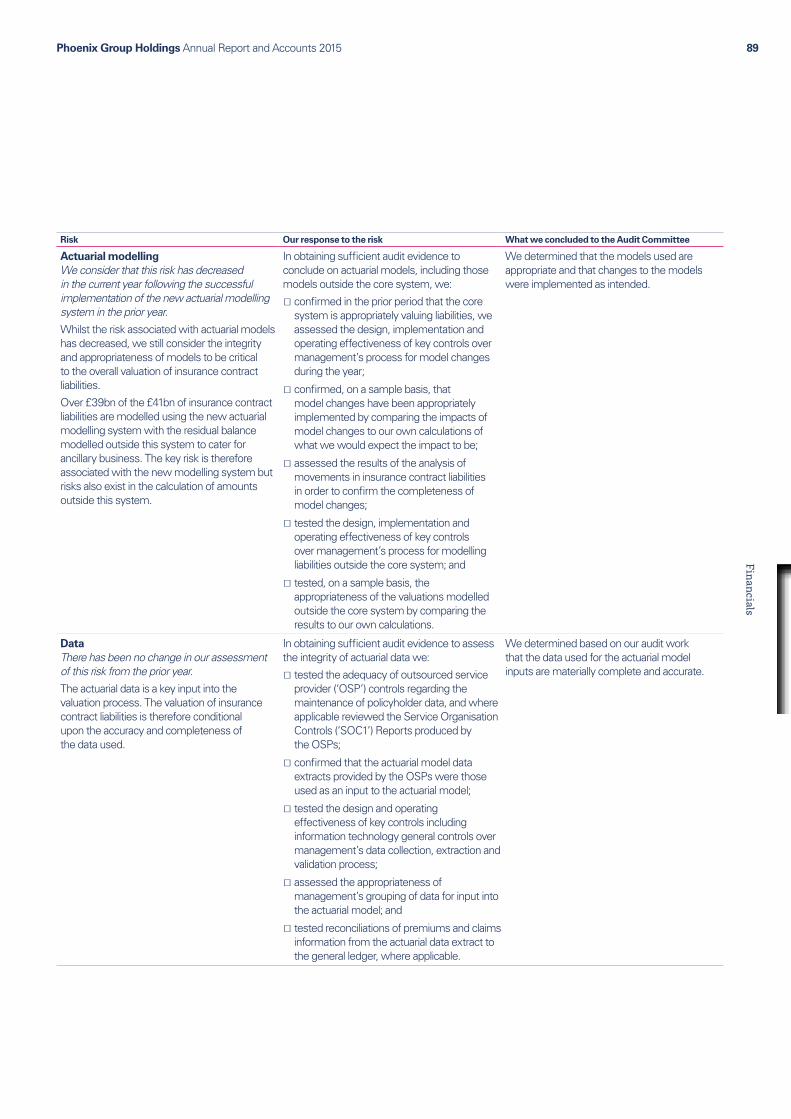
Phoenix Group Holdings Annual Report and Accounts 2015 89Financials
Risk Our response to the risk What we concluded to the Audit Committee
Actuarial modelling We consider that this risk has decreased in the current year following the successful implementation of the new actuarial modelling system in the prior year. Whilst the risk associated with actuarial models has decreased, we still consider the integrity and appropriateness of models to be critical to the overall valuation of insurance contract liabilities.
Over £39bn of the £41bn of insurance contract liabilities are modelled using the new actuarial modelling system with the residual balance modelled outside this system to cater for ancillary business. The key risk is therefore associated with the new modelling system but risks also exist in the calculation of amounts outside this system.
In obtaining sufficient audit evidence to conclude on actuarial models, including those models outside the core system, we:
Ɛ confirmed in the prior period that the core system is appropriately valuing liabilities, we assessed the design, implementation and operating effectiveness of key controls over management’s process for model changes during the year;
Ɛ confirmed, on a sample basis, that model changes have been appropriately implemented by comparing the impacts of model changes to our own calculations of what we would expect the impact to be;
Ɛ assessed the results of the analysis of movements in insurance contract liabilities in order to confirm the completeness of model changes;
Ɛ tested the design, implementation and operating effectiveness of key controls over management’s process for modelling liabilities outside the core system; and
Ɛ tested, on a sample basis, the appropriateness of the valuations modelled outside the core system by comparing the results to our own calculations.
We determined that the models used are appropriate and that changes to the models were implemented as intended.
DataThere has been no change in our assessment of this risk from the prior year.The actuarial data is a key input into the valuation process. The valuation of insurance contract liabilities is therefore conditional upon the accuracy and completeness of the data used.
In obtaining sufficient audit evidence to assess the integrity of actuarial data we:
Ɛ tested the adequacy of outsourced service provider (‘OSP’) controls regarding the maintenance of policyholder data, and where applicable reviewed the Service Organisation Controls (‘SOC1’) Reports produced by the OSPs;
Ɛ confirmed that the actuarial model data extracts provided by the OSPs were those used as an input to the actuarial model;
Ɛ tested the design and operating effectiveness of key controls including information technology general controls over management’s data collection, extraction and validation process;
Ɛ assessed the appropriateness of management’s grouping of data for input into the actuarial model; and
Ɛ tested reconciliations of premiums and claims information from the actuarial data extract to the general ledger, where applicable.
We determined based on our audit work that the data used for the actuarial model inputs are materially complete and accurate.
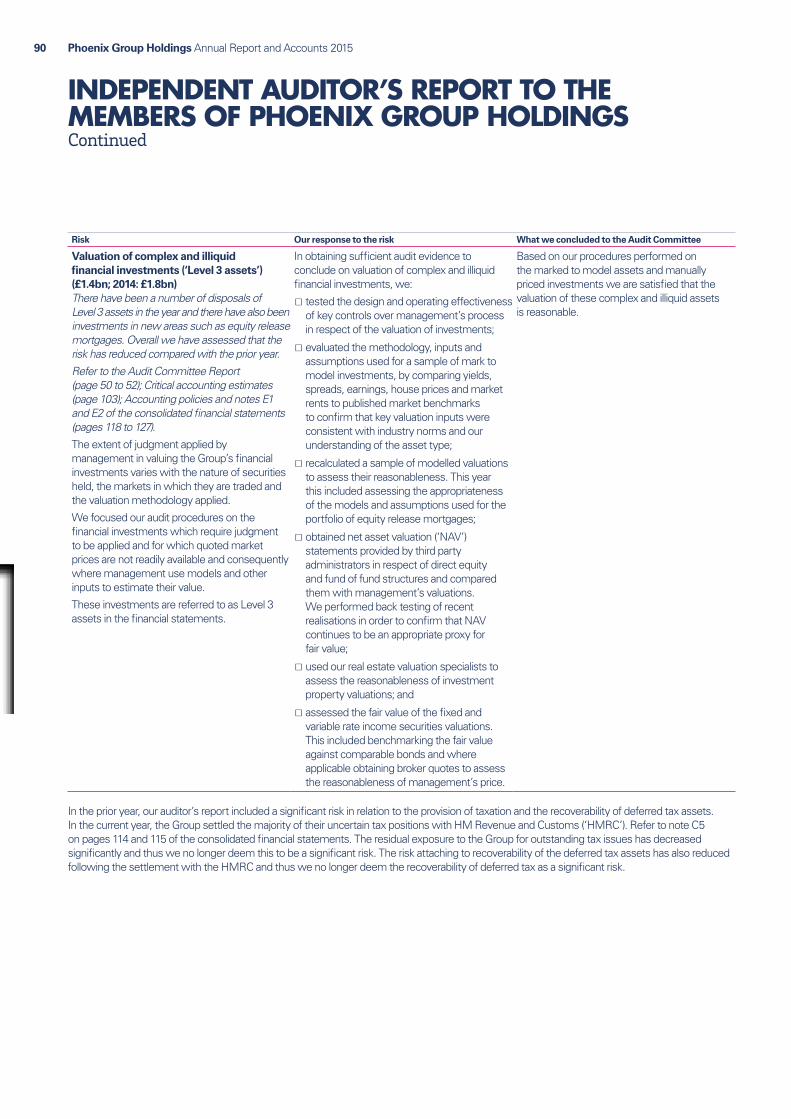
Phoenix Group Holdings Annual Report and Accounts 201590
INDEPENDENT AUDITOR’S REPORT TO THEMEMBERS OF PHOENIX GROUP HOLDINGSContinued
Risk Our response to the risk What we concluded to the Audit Committee
Valuation of complex and illiquid financial investments (‘Level 3 assets’) (£1.4bn; 2014: £1.8bn)There have been a number of disposals of Level 3 assets in the year and there have also been investments in new areas such as equity release mortgages. Overall we have assessed that the risk has reduced compared with the prior year.Refer to the Audit Committee Report (page 50 to 52); Critical accounting estimates (page 103); Accounting policies and notes E1 and E2 of the consolidated financial statements (pages 118 to 127).The extent of judgment applied by management in valuing the Group’s financial investments varies with the nature of securities held, the markets in which they are traded and the valuation methodology applied.
We focused our audit procedures on the financial investments which require judgment to be applied and for which quoted market prices are not readily available and consequently where management use models and other inputs to estimate their value.
These investments are referred to as Level 3 assets in the financial statements.
In obtaining sufficient audit evidence to conclude on valuation of complex and illiquid financial investments, we:
Ɛ tested the design and operating effectiveness of key controls over management’s process in respect of the valuation of investments;
Ɛ evaluated the methodology, inputs and assumptions used for a sample of mark to model investments, by comparing yields, spreads, earnings, house prices and market rents to published market benchmarks to confirm that key valuation inputs were consistent with industry norms and our understanding of the asset type;
Ɛ recalculated a sample of modelled valuations to assess their reasonableness. This year this included assessing the appropriateness of the models and assumptions used for the portfolio of equity release mortgages;
Ɛ obtained net asset valuation (‘NAV’) statements provided by third party administrators in respect of direct equity and fund of fund structures and compared them with management’s valuations. We performed back testing of recent realisations in order to confirm that NAV continues to be an appropriate proxy for fair value;
Ɛ used our real estate valuation specialists to assess the reasonableness of investment property valuations; and
Ɛ assessed the fair value of the fixed and variable rate income securities valuations. This included benchmarking the fair value against comparable bonds and where applicable obtaining broker quotes to assess the reasonableness of management’s price.
Based on our procedures performed on the marked to model assets and manually priced investments we are satisfied that the valuation of these complex and illiquid assets is reasonable.
In the prior year, our auditor’s report included a significant risk in relation to the provision of taxation and the recoverability of deferred tax assets. In the current year, the Group settled the majority of their uncertain tax positions with HM Revenue and Customs (‘HMRC’). Refer to note C5 on pages 114 and 115 of the consolidated financial statements. The residual exposure to the Group for outstanding tax issues has decreased significantly and thus we no longer deem this to be a significant risk. The risk attaching to recoverability of the deferred tax assets has also reduced following the settlement with the HMRC and thus we no longer deem the recoverability of deferred tax as a significant risk.

Phoenix Group Holdings Annual Report and Accounts 2015 91Financials
THE SCOPE OF OUR AUDIT There were no material scope changes from the prior year.
TAILORING THE SCOPEOur assessment of audit risk, our evaluation of materiality and our allocation of performance materiality determine our audit scope for each reporting unit (‘component’) within the Group. Taken together, this enables us to form an opinion on the consolidated financial statements. We take into account size, risk profile, the organisation of the Group and effectiveness of Group-wide controls, changes in the business environment and other factors when assessing the level of work to be performed at each entity.
In assessing the risk of material misstatement to the consolidated financial statements, and to ensure we had adequate quantitative coverage of significant accounts in the financial statements, we selected all three reporting components of the Group. The Group reporting components consists of Insurance Companies, Group Function and Other Companies. In the Insurance Companies component the most significant insurance companies are Phoenix Life Assurance Limited and Phoenix Life Limited. The Group Function consists of Group entities that primarily hold external debt and the pension schemes of the Group. The Other Companies are the service companies and Opal Reassurance Limited.
Of the three components selected, we performed an audit of the complete financial information of the Insurance Companies and the Group Function components (‘full scope components’) which were selected based on their size or risk characteristics. For the remaining Other Companies component (‘specific scope component’), we performed audit procedures on specific accounts within that component that we considered had the potential for the greatest impact on the significant accounts in the financial statements either because of the size of these accounts or their risk profile.
For the Other Companies component, we performed audit procedures on provisions and administrative expenses for the service companies and on cash and investments for Opal Reassurance Limited. The extent of audit work in respect of the Other Companies component was based on our assessment of the risks of material misstatement at a financial statement line level.
The reporting components where we performed audit procedures accounted for more than 99% of the Group equity and the Group’s operating profit. For the current year, the full scope components contributed 97% (2014: 98%) of the equity and 88% (2014: 93%) of the Group’s operating profit. The specific scope component contributed 2% (2014: 2%) of the Group’s equity and 11% (2014: 7%) of the Group’s operating profit.
The charts below illustrate the coverage obtained from the work performed by our audit teams.
A Insurance companies– full scope (93%)
B Group function – full scope (4%)
C Other companies – specific scope (2%)
D Out of scope (less than 1%)
A
B C
D
EQUITY
A Insurance companies– full scope (80%)
B Group function – full scope (8%)
C Other companies – specific scope (11%)
D Out of scope (less than 1%)
A
B
C
OPERATING PROFIT
D
INVOLVEMENT WITH COMPONENT TEAMS In establishing our overall approach to the Group audit, we determined the type of work that needed to be undertaken at each of the components by us, as the primary audit engagement team, or by the component auditors operating under our instruction.
The Group audit team provided detailed audit instructions to the component teams which included guidance on areas of focus, including the relevant risks of material misstatement detailed above, and set out the information required to be reported to the Group team.
The Group audit team is responsible for the audit of the Group Function. The Group team visited the full scope component of the Insurance Companies, and reviewed key work papers and participated in the planning and execution of the component team’s audit of the identified risks. The Group team attended the closing meetings with the management of the Insurance Companies and attended key audit committee meetings. For the specific scope component, the Group team have reviewed the audit procedures performed by the component team on the specific accounts.
The work performed on the components, together with the additional procedures performed at Group level, gave us appropriate evidence for our opinion on the consolidated financial statements as a whole.

Phoenix Group Holdings Annual Report and Accounts 201592
INDEPENDENT AUDITOR’S REPORT TO THEMEMBERS OF PHOENIX GROUP HOLDINGSContinued
OUR APPLICATION OF MATERIALITY We apply the concept of materiality in planning and performing the audit, in evaluating the effect of identified misstatements on the audit and in forming our audit opinion.
MATERIALITYThe magnitude of an omission or misstatement that, individually or in the aggregate, could reasonably be expected to influence the economic decisions of the users of the financial statements. Materiality provides a basis for determining the nature and extent of our audit procedures.
We determined materiality for the Group to be £46 million (2014: £41 million), which is 1.9% (2014: 1.7%) of Group equity. Our aim is that materiality should not exceed 2% of year-end Group equity. At the planning stage we set a slightly lower level of materiality to allow for forecasting error. Whilst profit before tax or operating profit are common bases used across the life insurance industry, we believe that the use of equity as the basis for assessing materiality is more appropriate given that the Group is a closed life assurance consolidator and as such equity provides a more stable, long-term measure of value. We note also that equity more closely correlates with key Group performance metrics such as Insurance Group Directive (‘IGD’) surplus and Market Consistent Embedded Value (‘MCEV’). However, as these measures are non-GAAP measures, we consider equity to be most appropriate.
During the course of our audit, we reassessed initial materiality and concluded that materiality assessed at planning stages of our audit remained appropriate.
PERFORMANCE MATERIALITYThe application of materiality at the individual account or balance level. It is set at an amount to reduce to an appropriately low level the probability that the aggregate of uncorrected and undetected misstatements exceeds materiality.
On the basis of our risk assessments, together with our assessment of the Group’s overall control environment, our judgement was that performance materiality was 50% (2014: 50%) of our planning materiality, namely £23.0 million (2014: £20.5 million).
Audit work at component locations for the purpose of obtaining audit coverage over significant financial statement accounts is undertaken based on a percentage of total performance materiality. The performance materiality set for each component is based on the relative scale and risk of the component to the Group as a whole and our assessment of the risk of misstatement at that component. In the current year, the range of performance materiality allocated to components was £4.6 million to £18.4 million (2014: £4.2 million to £13.7 million). In the prior year performance materiality was allocated separately to the two life companies but in the current year it was allocated to the Insurance Companies component taken as a whole.
REPORTING THRESHOLDAn amount below which identified misstatements are considered as being clearly trivial.
We agreed with the Audit Committee that we would report all uncorrected audit differences in excess of £2.3 million (2014: £2 million), which is set at 5% of planning materiality, as well as differences below that threshold that, in our view, warranted reporting on qualitative grounds.
We evaluate any uncorrected misstatements against both the quantitative measures of materiality discussed above and in light of other relevant qualitative considerations in forming our opinion.
SCOPE OF THE AUDIT OF THE FINANCIAL STATEMENTSAn audit involves obtaining evidence about the amounts and disclosures in the financial statements sufficient to give reasonable assurance that the financial statements are free from material misstatement, whether caused by fraud or error. This includes an assessment of whether the accounting policies are appropriate to the Group’s and the parent company’s circumstances and have been consistently applied and adequately disclosed; the reasonableness of significant accounting estimates made by the Directors; and the overall presentation of the financial statements. In addition, we read all the financial and non-financial information in the Annual Report and Accounts to identify material inconsistencies with the audited financial statements and to identify any information that is apparently materially incorrect based on, or materially inconsistent with, the knowledge acquired by us in the course of performing the audit. If we become aware of any apparent material misstatements or inconsistencies we consider the implications for our report.
RESPECTIVE RESPONSIBILITIES OF DIRECTORS AND AUDITORAs explained more fully in the Statement of Directors’ Responsibilities set out on page 86, the Directors are responsible for the preparation of the financial statements and for being satisfied that they give a true and fair view. Our responsibility is to audit and express an opinion on the financial statements in accordance with applicable law and International Standards on Auditing (UK and Ireland). Those standards require us to comply with the Auditing Practices Board’s Ethical Standards for Auditors.
Phoenix Group Holdings Annual Report and Accounts 2015 93Financials
Phoenix Group Holdings is a non-UK company and as such is not required to comply with the UK Companies Act 2006. As the Group is listed on the UK Stock Exchange, the Directors have voluntarily chosen to comply with the Companies Act 2006 and listing rules that apply to UK Companies and have engaged us to provide an opinion as if they were. Accordingly we have been engaged to:
Ɛ report as to whether the Strategic Report and Directors’ Report for the financial year for which the financial statements are prepared is consistent with the financial statements;
Ɛ report as to whether the information given in the Corporate Governance Statement with respect to internal control and risk management systems in relation to financial reporting processes is consistent with the financial statements;
Ɛ report as to whether the section in the Directors’ remuneration report that is described as audited has been properly prepared in accordance with the basis of preparation described therein; and
Ɛ report if we are not satisfied that:
Ɛ adequate accounting records have been kept (including returns from those branches which have not been visited); or
Ɛ the financial statements are in agreement with the records and returns; or
Ɛ we have obtained all the information and explanations which we consider necessary for the purposes of the audit.
This report is made solely to the Company’s members, as a body, in accordance with our engagement letter dated the 1 August 2014 and subsequent engagement letter dated the 10 March 2016. Our audit work has been undertaken so that we might state to the Company’s members those matters we are required to state to them in an auditor’s report and for no other purpose. To the fullest extent permitted by law, we do not accept or assume responsibility to anyone other than the Company and the Company’s members as a body, for our audit work, for this report, or for the opinions we have formed.
REPORT ON MATTERS PRESCRIBED BY OUR ENGAGEMENT LETTERIn our opinion:
Ɛ the information given in the Strategic Report and the Directors’ Report for the financial year for which the financial statements are prepared is consistent with the financial statements;
Ɛ the information given in the Corporate governance report set out on pages 47 to 56 with respect to internal control and risk management systems in relation to financial reporting processes is consistent with the financial statements; and
Ɛ the part of the Directors’ remuneration report that has been described as audited has been properly prepared in accordance with the basis of preparation as described therein.
MATTERS ON WHICH WE ARE REQUIRED TO REPORT BY EXCEPTION
ISAs (UK and Ireland) reporting
We are required to report to you if, in our opinion, financial and non-financial information in the Annual Report and Accounts is:
Ɛ materially inconsistent with the information in the audited financial statements; or
Ɛ apparently materially incorrect based on, or materially inconsistent with, our knowledge of the Group acquired in the course of performing our audit; or
Ɛ otherwise misleading.
In particular, we are required to report whether we have identified any inconsistencies between our knowledge acquired in the course of performing the audit and the Directors’ statement that they consider the Annual Report and Accounts taken as a whole is fair, balanced and understandable and provides the information necessary for shareholders to assess the entity’s performance, business model and strategy; and whether the Annual Report and Accounts appropriately addresses those matters that we communicated to the audit committee that we consider should have been disclosed.
We have no exceptions to report.
Listing rules review requirements
We are required to review:
Ɛ the Directors’ statement in relation to going concern set out on page 82 and the longer-term viability set out on page 39; and
Ɛ the part of the Corporate governance report relating to the company’s compliance with the provisions of the UK Corporate Governance Code specified for our review.
We have no exceptions to report.
Engagement letter reporting
We are required to report to you if, in our opinion:
Ɛ adequate accounting records have not been kept (including returns from those branches which have not been visited); or
Ɛ the financial statements are not in agreement with the accounting records and returns; or
Ɛ we have not received all the information and explanation which we require for the audit.
We have no exceptions to report.

Phoenix Group Holdings Annual Report and Accounts 201594
INDEPENDENT AUDITOR’S REPORT TO THEMEMBERS OF PHOENIX GROUP HOLDINGSContinued
STATEMENT ON THE DIRECTORS’ ASSESSMENT OF THE PRINCIPAL RISKS THAT WOULD THREATEN THE SOLVENCY OR LIQUIDITY OF THE ENTITY
ISAs (UK and Ireland) reporting
We are required to give a statement as to whether we have anything material to add or to draw attention to in relation to:
Ɛ the Directors’ confirmation in the Annual Report and Accounts that they have carried out a robust assessment of the principal risks facing the entity, including those that would threaten its business model, future performance, solvency or liquidity;
Ɛ the disclosures in the Annual Report and Accounts that describe those risks and explain how they are being managed or mitigated;
Ɛ the Directors’ statement in the Annual Report and Accounts about whether they considered it appropriate to adopt the going concern basis of accounting in preparing them, and their identification of any material uncertainties to the entity’s ability to continue to do so over a period of at least twelve months from the date of approval of the financial statements; and
Ɛ the Directors’ explanation in the Annual Report and Accounts as to how they have assessed the prospects of the entity, over what period they have done so and why they consider that period to be appropriate, and their statement as to whether they have a reasonable expectation that the entity will be able to continue in operation and meet its liabilities as they fall due over the period of their assessment, including any related disclosures drawing attention to any necessary qualifications or assumptions.
We have nothing material to add or to draw attention to.
ERNST & YOUNG LLP
LONDON 22 MARCH 2016
Notes:1. The maintenance and integrity of the Phoenix Group Holdings website is the responsibility of the Directors; the work carried out by the auditors does not involve consideration of these
matters and, accordingly, the auditors accept no responsibility for any changes that may have occurred to the financial statements since they were initially presented on the website.2. Legislation in the United Kingdom governing the preparation and dissemination of financial statements may differ from legislation in other jurisdictions.

Phoenix Group Holdings Annual Report and Accounts 2015 95Financials
CONSOLIDATED INCOME STATEMENTFor the year ended 31 December 2015
Notes2015
£m2014
£m
Gross premiums written 902 981Less: premiums ceded to reinsurers F3 (1,376) (1,792)Net premiums written (474) (811)
Fees 95 94Net investment income C1 1,064 6,034Total revenue, net of reinsurance payable 685 5,317
Gain on transfer of business I1.5 – 4Other operating income 7 9Net income 692 5,330
Policyholder claims (3,931) (3,724)Less: reinsurance recoveries 326 341Change in insurance contract liabilities 2,959 (1,990)Change in reinsurers’ share of insurance contract liabilities 1,003 1,651Transfer from/(to) unallocated surplus F2 84 (11)Net policyholder claims and benefits incurred 441 (3,733)
Change in investment contract liabilities (232) (408)Acquisition costs (7) (9)Change in present value of future profits G7 (6) (9)Amortisation and impairment of acquired in-force business G7 (148) (98)Amortisation of customer relationships G7 (15) (15)Administrative expenses C2 (430) (429)Net income attributable to unitholders (7) (8)Total operating expenses (404) (4,709)
Profit before finance costs and tax 288 621
Finance costs C4 (136) (156)Profit for the year before tax 152 465
Tax credit/(charge) attributable to policyholders’ returns C5 33 (129)Profit before the tax attributable to owners 185 336
Tax credit/(charge) C5 97 (151)Add: tax attributable to policyholders’ returns C5 (33) 129Tax credit/(charge) attributable to owners C5 64 (22)Profit from continuing operations for the year attributable to owners 249 314
Discontinued operationsProfit from discontinued operations, net of tax I1.1 – 92Profit for the year attributable to owners 249 406
Attributable to:Owners of the parent 201 310Non-controlling interests D3 48 96
249 406
Earnings per ordinary shareBasic (pence per share) B3.1 89.8p 137.7pDiluted (pence per share) B3.2 89.6p 137.5pEarnings per share from continuing operationsBasic (pence per share) B3.1 89.8p 96.7pDiluted (pence per share) B3.2 89.6p 96.5p

Phoenix Group Holdings Annual Report and Accounts 201596
STATEMENT OF COMPREHENSIVE INCOMEFor the year ended 31 December 2015
Notes2015
£m2014
£m
Profit for the year from continuing operations 249 314Profit from discontinued operations – 92
249 406Other comprehensive income/(expense):Items that are or may be reclassified to profit or loss: Foreign exchange rate movements – 10 Reclassification adjustments relating to foreign collective investment schemes disposed of in the period (10) –Items that will not be reclassified to profit or loss: Owner-occupied property revaluation gains G8 4 – Remeasurements of net defined benefit asset/liability G6 11 240 Tax (charge)/credit relating to other comprehensive income items C5 (5) 11Total other comprehensive income for the year – 261
Total comprehensive income for the year 249 667
Attributable to:Owners of the parent 201 571Non-controlling interests D3 48 96
249 667
PRO FORMA RECONCILIATION OF GROUP OPERATING PROFIT TO RESULT ATTRIBUTABLE TO OWNERSFor the year ended 31 December 2015
Notes2015
£m2014
£m
Operating profitPhoenix Life 336 487Ignis – discontinued operations – 17
336 504Group costs (12) (21)Total operating profit before adjusting items 324 483
Investment return variances and economic assumption changes on long-term business B2.2 13 12Variance on owners’ funds B2.3 (12) (14)Amortisation of acquired in-force business (75) (88)Amortisation of customer relationships (15) (15)Non-recurring items B1.2 49 126Profit before finance costs attributable to owners 284 504
Finance costs attributable to owners (99) (88)Profit before the tax attributable to owners From continuing operations 185 336 From discontinued operations – 80
B1.2 185 416Tax credit/(charge) attributable to owners from continuing operations 64 (22)Tax credit attributable to owners from discontinued operations – 12Profit for the year attributable to owners 249 406
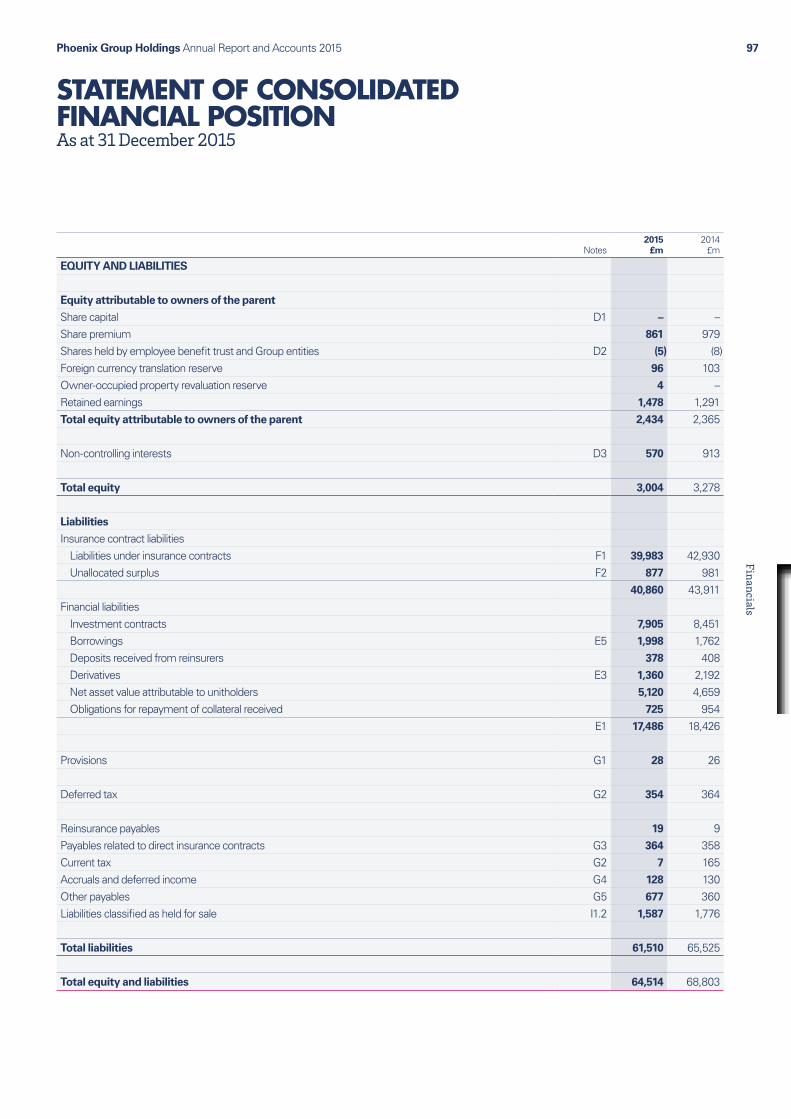
Phoenix Group Holdings Annual Report and Accounts 2015 97Financials
STATEMENT OF CONSOLIDATED FINANCIAL POSITIONAs at 31 December 2015
Notes2015
£m2014
£m
EQUITY AND LIABILITIES
Equity attributable to owners of the parent
Share capital D1 – –Share premium 861 979Shares held by employee benefit trust and Group entities D2 (5) (8)Foreign currency translation reserve 96 103Owner-occupied property revaluation reserve 4 –Retained earnings 1,478 1,291Total equity attributable to owners of the parent 2,434 2,365
Non-controlling interests D3 570 913
Total equity 3,004 3,278
Liabilities
Insurance contract liabilities Liabilities under insurance contracts F1 39,983 42,930 Unallocated surplus F2 877 981
40,860 43,911Financial liabilities Investment contracts 7,905 8,451 Borrowings E5 1,998 1,762 Deposits received from reinsurers 378 408 Derivatives E3 1,360 2,192 Net asset value attributable to unitholders 5,120 4,659 Obligations for repayment of collateral received 725 954
E1 17,486 18,426
Provisions G1 28 26
Deferred tax G2 354 364
Reinsurance payables 19 9Payables related to direct insurance contracts G3 364 358Current tax G2 7 165Accruals and deferred income G4 128 130Other payables G5 677 360Liabilities classified as held for sale I1.2 1,587 1,776
Total liabilities 61,510 65,525
Total equity and liabilities 64,514 68,803

Phoenix Group Holdings Annual Report and Accounts 201598
STATEMENT OF CONSOLIDATED FINANCIAL POSITIONAs at 31 December 2015Continued
Notes2015
£m2014
£m
ASSETS
Pension scheme asset G6 506 426
Intangible assets
Goodwill 39 39
Acquired in-force business 1,265 1,413
Customer relationships 202 217
Present value of future profits 17 23
G7 1,523 1,692
Property, plant and equipment G8 19 15
Investment property G9 1,942 1,858
Financial assets
Loans and receivables 577 196
Derivatives E3 1,498 2,558
Equities 12,351 13,168
Investment in joint venture – 133
Fixed and variable rate income securities 31,814 34,384
Collective investment schemes 3,826 3,583
E1 50,066 54,022
Insurance assets
Reinsurers’ share of insurance contract liabilities F1 3,954 2,772
Reinsurance receivables 29 67
Insurance contract receivables 9 8
3,992 2,847
Current tax G2 47 8
Prepayments and accrued income 335 405
Other receivables G10 474 750
Cash and cash equivalents G11 3,940 5,067
Assets classified as held for sale I1.2 1,670 1,713
Total assets 64,514 68,803
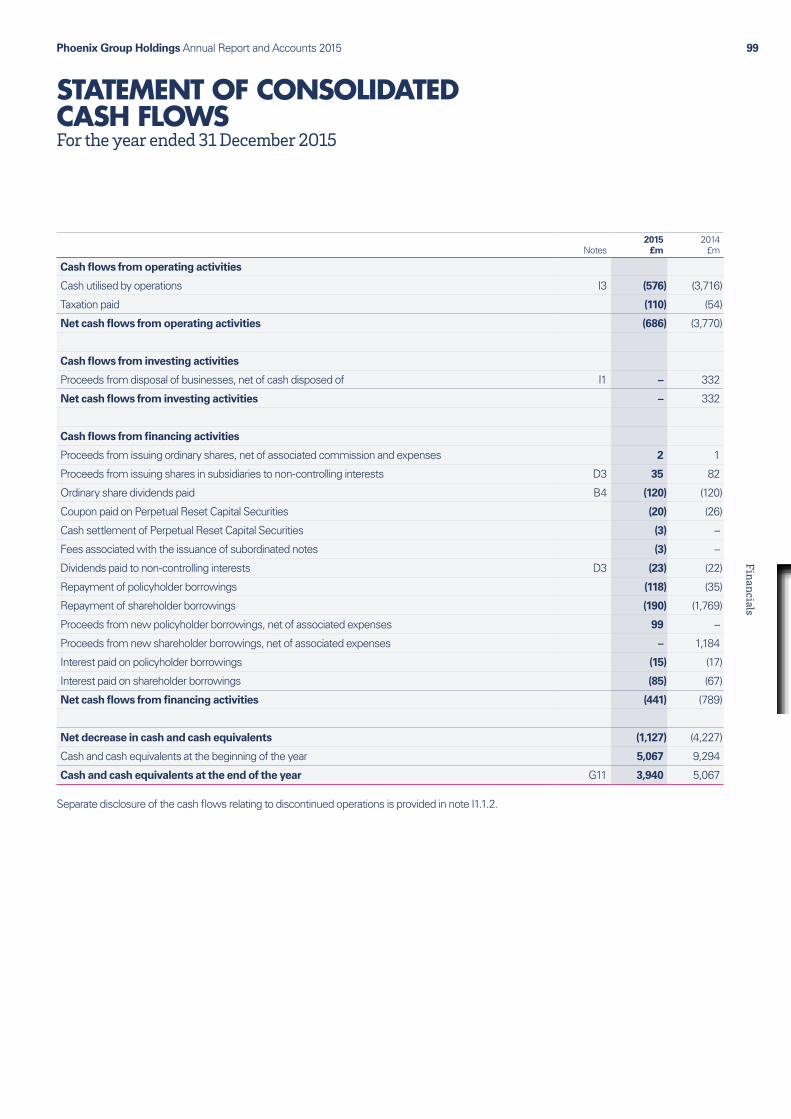
Phoenix Group Holdings Annual Report and Accounts 2015 99Financials
STATEMENT OF CONSOLIDATED CASH FLOWSFor the year ended 31 December 2015
Notes2015
£m2014
£m
Cash flows from operating activities
Cash utilised by operations I3 (576) (3,716)
Taxation paid (110) (54)
Net cash flows from operating activities (686) (3,770)
Cash flows from investing activities
Proceeds from disposal of businesses, net of cash disposed of I1 – 332
Net cash flows from investing activities – 332
Cash flows from financing activities
Proceeds from issuing ordinary shares, net of associated commission and expenses 2 1
Proceeds from issuing shares in subsidiaries to non-controlling interests D3 35 82
Ordinary share dividends paid B4 (120) (120)
Coupon paid on Perpetual Reset Capital Securities (20) (26)
Cash settlement of Perpetual Reset Capital Securities (3) –
Fees associated with the issuance of subordinated notes (3) –
Dividends paid to non-controlling interests D3 (23) (22)
Repayment of policyholder borrowings (118) (35)
Repayment of shareholder borrowings (190) (1,769)
Proceeds from new policyholder borrowings, net of associated expenses 99 –
Proceeds from new shareholder borrowings, net of associated expenses – 1,184
Interest paid on policyholder borrowings (15) (17)
Interest paid on shareholder borrowings (85) (67)
Net cash flows from financing activities (441) (789)
Net decrease in cash and cash equivalents (1,127) (4,227)
Cash and cash equivalents at the beginning of the year 5,067 9,294
Cash and cash equivalents at the end of the year G11 3,940 5,067
Separate disclosure of the cash flows relating to discontinued operations is provided in note I1.1.2.

Phoenix Group Holdings Annual Report and Accounts 2015100
STATEMENT OF CONSOLIDATED CHANGES IN EQUITYFor the year ended 31 December 2015
Sharecapital
(note D1)£m
Sharepremium
£m
Shares heldby the
employeebenefit
trust andGroup
entities(note D2)
£m
Foreigncurrency
translationreserve
£m
Owner-occupied property
revaluation reserve
£m
Retainedearnings
£mTotal
£m
Non-controlling
interests(note D3)
£mTotal
£m
At 1 January 2015 – 979 (8) 103 – 1,291 2,365 913 3,278
Profit for the year – – – 3 – 198 201 48 249
Other comprehensive (expense)/income for the year – – – (10) 4 6 – – –
Total comprehensive (expense)/income for the year – – – (7) 4 204 201 48 249
Issue of ordinary share capital, net of associated commissions and expenses – 2 – – – – 2 – 2
Dividends paid on ordinary shares – (120) – – – – (120) – (120)
Dividends paid to non-controlling interests – – – – – – – (23) (23)
Coupon paid to non-controlling interests, net of tax relief – – – – – – – (15) (15)
Credit to equity for equity-settled share-based payments – – – – – 4 4 – 4
Shares in subsidiaries subscribed for by non-controlling interests – – – – – – – 35 35
Exchange of non-controlling interests for subordinated notes – – – – – – – (388) (388)
Loss on exchange of non-controlling interests – – – – – (12) (12) – (12)
Shares distributed by employee benefit trust – – 9 – – (9) – – –
Shares acquired by employee benefit trust – – (6) – – – (6) – (6)
At 31 December 2015 – 861 (5) 96 4 1,478 2,434 570 3,004
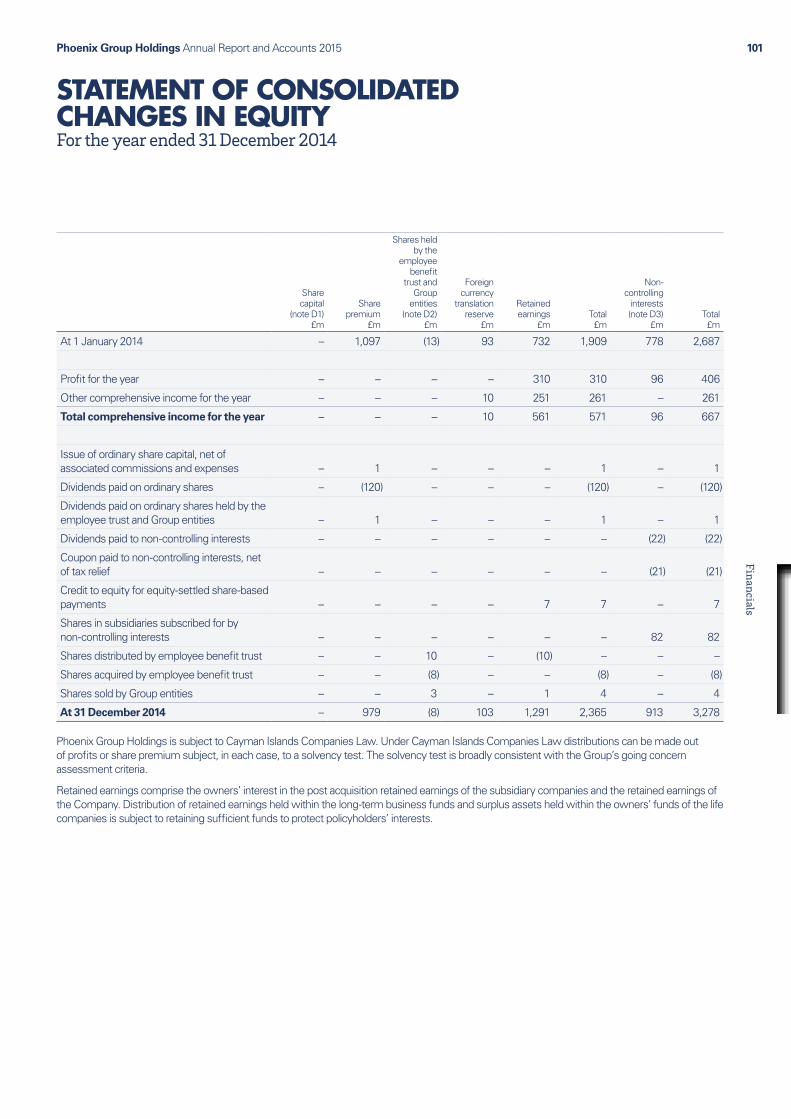
Phoenix Group Holdings Annual Report and Accounts 2015 101Financials
STATEMENT OF CONSOLIDATED CHANGES IN EQUITYFor the year ended 31 December 2014
Sharecapital
(note D1)£m
Sharepremium
£m
Shares heldby the
employeebenefit
trust andGroup
entities(note D2)
£m
Foreigncurrency
translationreserve
£m
Retainedearnings
£mTotal£m
Non-controlling
interests(note D3)
£mTotal£m
At 1 January 2014 – 1,097 (13) 93 732 1,909 778 2,687
Profit for the year – – – – 310 310 96 406
Other comprehensive income for the year – – – 10 251 261 – 261
Total comprehensive income for the year – – – 10 561 571 96 667
Issue of ordinary share capital, net of associated commissions and expenses – 1 – – – 1 – 1
Dividends paid on ordinary shares – (120) – – – (120) – (120)
Dividends paid on ordinary shares held by the employee trust and Group entities – 1 – – – 1 – 1
Dividends paid to non-controlling interests – – – – – – (22) (22)
Coupon paid to non-controlling interests, net of tax relief – – – – – – (21) (21)
Credit to equity for equity-settled share-based payments – – – – 7 7 – 7
Shares in subsidiaries subscribed for by non-controlling interests – – – – – – 82 82
Shares distributed by employee benefit trust – – 10 – (10) – – –
Shares acquired by employee benefit trust – – (8) – – (8) – (8)
Shares sold by Group entities – – 3 – 1 4 – 4
At 31 December 2014 – 979 (8) 103 1,291 2,365 913 3,278
Phoenix Group Holdings is subject to Cayman Islands Companies Law. Under Cayman Islands Companies Law distributions can be made out of profits or share premium subject, in each case, to a solvency test. The solvency test is broadly consistent with the Group’s going concern assessment criteria.
Retained earnings comprise the owners’ interest in the post acquisition retained earnings of the subsidiary companies and the retained earnings of the Company. Distribution of retained earnings held within the long-term business funds and surplus assets held within the owners’ funds of the life companies is subject to retaining sufficient funds to protect policyholders’ interests.
Phoenix Group Holdings Annual Report and Accounts 2015102
NOTES TO THE IFRS CONSOLIDATEDFINANCIAL STATEMENTS
A. SIGNIFICANT ACCOUNTING POLICIESA1. BASIS OF PREPARATIONThe consolidated financial statements for the year ended 31 December 2015 comprise the financial statements of Phoenix Group Holdings (‘the Company’) and its subsidiaries (together referred to as ‘the Group’).
The consolidated financial statements have been prepared on a going concern basis and on a historical cost basis except for investment property, owner-occupied property and those financial assets, financial liabilities and insurance and investment contracts with discretionary participation features (‘DPF’) that have been measured at fair value.
Statement of compliance
The consolidated financial statements have been prepared, in accordance with International Financial Reporting Standards (‘IFRSs’) as issued by the International Accounting Standards Board (‘IASB’). The financial statements are presented in sterling (£) rounded to the nearest million except where otherwise stated.
Assets and liabilities are offset and the net amount reported in the statement of consolidated financial position only when there is a legally enforceable right to offset the recognised amounts and there is an intention to settle on a net basis, or to realise the assets and settle the liability simultaneously. Income and expenses are not offset in the consolidated income statement unless required or permitted by an IFRS or interpretation, as specifically disclosed in the accounting policies of the Group.
Basis of consolidation
The consolidated financial statements include the financial statements of the Company and its subsidiary undertakings, including collective investment schemes, where the Group exercises overall control. In accordance with the principles set out in IFRS 10 Consolidated Financial Statements, the Group controls an investee if and only if the Group has all the following:
Ɛ power over the investee;
Ɛ exposure, or rights, to variable returns from its involvement with the investee; and
Ɛ the ability to use its power over the investee to affect its returns.
The Group considers all relevant facts and circumstances in assessing whether it has power over an investee, including relevant activities, substantive and protective rights, voting rights and purpose and design of an investee. The Group re-assesses whether or not it controls an investee if facts and circumstances indicate that there are changes to one or more of the three elements of control. Further details about the consolidation of subsidiaries, including collective investment schemes, is included in note H1.
A2. ACCOUNTING POLICIESThe principal accounting policies have been consistently applied in these consolidated financial statements. Where an accounting policy can be directly attributed to a specific note to the consolidated financial statements, the policy is presented within that note, with a view to enabling greater understanding of the results and financial position of the Group. All other significant accounting policies are disclosed below.
A2.1 Foreign currency transactions
Items included in the financial statements of each of the Group’s entities are measured using the currency of the primary economic environment in which the entity operates (the ‘functional currency’). The consolidated financial statements are presented in sterling, which is the Group’s presentation currency.
The results and financial position of all Group companies that have a functional currency different from the presentation currency are translated into the presentation currency as follows:
Ɛ assets and liabilities are translated at the closing rate at the period end;
Ɛ income, expenses and cash flows denominated in foreign currencies are translated at average exchange rates; and
Ɛ all resulting exchange differences are recognised through the statement of consolidated comprehensive income.
Foreign currency transactions are translated into the functional currency of the transacting Group entity using exchange rates prevailing at the date of translation. Foreign exchange gains and losses resulting from the settlement of such transactions and from the translation of monetary assets and liabilities denominated in foreign currencies are recognised in the consolidated income statement.
Translation differences on debt securities and other monetary financial assets measured at fair value through profit or loss are included in foreign exchange gains and losses. Translation differences on non-monetary items at fair value through profit or loss are reported as part of the fair value gain or loss.
Phoenix Group Holdings Annual Report and Accounts 2015 103Financials
A3. CRITICAL ACCOUNTING ESTIMATES AND JUDGEMENTSThe preparation of financial statements requires management to make judgements, estimates and assumptions that affect the application of policies and reported amounts of assets and liabilities, income and expenses. The estimates and associated assumptions are based on historical experience and various other factors that are believed to be reasonable under the circumstances, the results of which form the basis of the judgements about carrying values of assets and liabilities that are not readily apparent from other sources. Actual results may differ from these estimates.
Critical accounting estimates are those which involve the most complex or subjective judgements or assessments. The areas of the Group’s business that typically require such estimates are the measurement of insurance and investment contract liabilities, determination of the fair value of financial assets and liabilities, impairment tests for intangible assets, income tax assets and liabilities and pension scheme assets and liabilities. The determination of operating profit requires management to make judgements, detail of which is included below at A3.6.
A3.1 Insurance and investment contract liabilities
Insurance and investment contract liability accounting is discussed in more detail in the accounting policies in note F1 with further detail of the key assumptions made in determining insurance and investment contract liabilities included in note F4.
A3.2 Fair value of financial assets and liabilities
Financial assets and liabilities are measured at fair value and accounted for as set out in the accounting policies in note E1. Where possible, financial assets and liabilities are valued on the basis of listed market prices by reference to quoted market bid prices for assets and offer prices for liabilities. These are categorised as Level 1 financial instruments and do not involve estimates. If prices are not readily determinable, fair value is determined using valuation techniques including pricing models, discounted cash flow techniques or broker quotes. Financial instruments valued where valuation techniques based on observable market data at the period end are categorised as Level 2 financial instruments. Financial instruments valued using valuation techniques based on non-observable inputs are categorised as Level 3 financial instruments. Level 2 and Level 3 financial instruments therefore involve the use of estimates. Further details of the estimates made are included in note E2.
A3.3 Impairment of intangible assets
Intangible assets are subject to regular impairment reviews as detailed in the accounting policy in note G7. Impairments are measured as the difference between the carrying value of a particular asset and its recoverable amount. Impairments are recognised in the consolidated income statement in the period in which they occur. Further details of judgements made in testing intangible assets for impairment are included in note G7.
A3.4 Income tax assets and liabilities
Deferred tax assets are recognised to the extent that they are regarded as recoverable, that is to the extent that, on the basis of all the available evidence, it can be regarded as more likely than not that there will be suitable taxable profits against which the losses can be relieved. Forecasts of future profitability are made which by their nature involve management’s judgement.
The UK taxation regime applies separate rules to trading and capital profits and losses. The distinction between temporary differences that arise from items of either a capital or trading nature may affect the recognition of deferred tax assets.
The determination of tax provisions included in current tax liabilities involves the use of estimates and judgements.
The accounting policy for income taxes (both current and deferred) is discussed in more detail in the accounting policy in notes C5 and G2.
A3.5 Pension scheme assets and liabilities
The valuation of pension scheme assets and liabilities is determined using actuarial valuations that include a number of assumptions. As defined benefit pension schemes are long-term in nature, such assumptions are subject to significant uncertainty. Details of the key assumptions used are shown in note G6.
A3.6 Operating profit
Operating profit is the Group’s non-GAAP measure of performance. The Group is required to make judgements as to the appropriate longer-term rates of investment return for the determination of operating profit, as detailed in note B2, and as to what constitutes an operating or non-operating item in accordance with the accounting policy detailed in note B1.2.

Phoenix Group Holdings Annual Report and Accounts 2015104
NOTES TO THE IFRS CONSOLIDATEDFINANCIAL STATEMENTSContinued
A. SIGNIFICANT ACCOUNTING POLICIES continued
A4. ADOPTION OF NEW ACCOUNTING PRONOUNCEMENTS IN 2015The consolidated financial statements for the year ended 31 December 2015, set out on pages 95 to 101, were authorised by the Board of Directors for issue on 22 March 2016.
In preparing the consolidated financial statements, the Group has adopted the following amendments effective from 1 January 2015:
Ɛ Annual Improvements 2010 – 2012 cycle; and
Ɛ Annual Improvements 2011 – 2013 cycle.
A5. NEW ACCOUNTING PRONOUNCEMENTS NOT YET EFFECTIVEThe IASB has issued the following new or amended standards and interpretations which apply from the dates shown. The Group has decided not to early adopt any of these standards, interpretations or amendments where this is permitted. The impact on the Group of adoption is subject to evaluation:
Ɛ IFRS 9 Financial Instruments (2018). This standard will replace IAS 39 Financial Instruments: Recognition and Measurement. IFRS 9 was originally issued in November 2009 and introduced new requirements for the classification and measurement of financial assets. The standard was subsequently amended in October 2010 to include requirements for the classification and measurement of financial liabilities and for derecognition and in November 2013 to include new requirements for general hedge accounting. Another revised version was issued in July 2014 to include a) an expected credit loss impairment model (to replace the incurred loss model of IAS 39) and b) limited amendments to the classification and measurement requirements by introducing a ‘fair value through other comprehensive income’ option for certain simple debt instruments. Under IFRS 9, all financial assets will be measured either at amortised cost or fair value and the basis of classification will depend on the business model and the contractual cash flow characteristics of the financial assets. The Group expects to continue to value the majority of its financial assets at fair value through profit or loss on initial recognition, so as to eliminate or reduce any potential accounting mismatch. The expected impact remains subject to completion of a detailed review.
Ɛ IFRS 15 Revenue from Contracts with Customers (2018). IFRS 15 establishes a single comprehensive framework for determining whether, how and when revenue is recognised. The standard does not apply to insurance contracts and the financial instruments within the scope of IAS 39. The Group anticipates that the application of IFRS 15 in the future is likely to have limited impact on the measurement and presentation of amounts reported in respect of the Group’s financial statements.
Ɛ Annual Improvements to IFRS 2012–2014 cycle (2016).
Ɛ Clarification of Acceptable Methods of Depreciation and Amortisation (Amendments to IAS 16 and IAS 38) (2016).
Ɛ Disclosure initiative (Amendments to IAS 1) (2016).
Ɛ Disclosure initiative (Amendments to IAS 7) (2017).
Ɛ Recognition of Deferred tax assets for unrealised losses (Amendments to IAS 12) (2017).
Ɛ IFRS 16 Leases (2019). IFRS 16 will replace IAS 17 Leases. The new standard removes the classification of leases as either operating or finance leases for the lessee, thereby treating all leases as finance leases. This will result in the recognition of a right-to use asset and a lease liability for all of the Group’s previously classified operating leases. Short-term leases (less than 12 months) and leases of low-value assets are exempt from the requirements. The Group anticipates that the application of IFRS 16 in the future is likely to have limited impact on amounts reported in respect of the Group’s financial statements.
B. EARNINGS PERFORMANCEB1. SEGMENTAL ANALYSIS
The Group defines and presents operating segments based on the information which is provided to the Board, and therefore segmental information in this note is presented on a different basis from profit or loss in the consolidated financial statements.
An operating segment is a component of the Group that engages in business activities from which it may earn revenues and incur expenses, including revenues and expenses relating to transactions with other components of the Group.
For management purposes, the Group is organised into business units based on their products and services and only has the Phoenix Life operating segment during the reporting period. In the comparative period, the Group had two operating segments as follows:
Ɛ Phoenix Life – this segment provides a range of whole life, term assurance and pension products; and
Ɛ Ignis – this segment provided investment management services to the life companies within the Group and to third parties, covering both retail and institutional investors. The segment has been disposed of effective from 1 July 2014 (see note I1.1).
Segmental performance is evaluated based on profit or loss which, in certain respects, is presented differently from profit or loss in the consolidated financial statements. Revenues or expenses that are not directly attributable to a particular segment are allocated between segments where there is a reasonable basis for doing so.
Group financing (including finance costs) and owners’ taxes are managed on a Group basis and are not allocated to individual operating segments.
Inter-segment transactions are set on an arm’s length basis in a manner similar to transactions with third parties. Segmental results include those transfers between business segments which are then eliminated on consolidation.
Predominantly all revenues from external customers are sourced in the UK. No revenue transaction with a single customer external to the Group amounts to greater than 10% of the Group’s revenue.
Predominantly all non-current assets are located in the UK. There are no differences between the measurement of the assets and liabilities reflected in the primary statements and that reported for the segments.
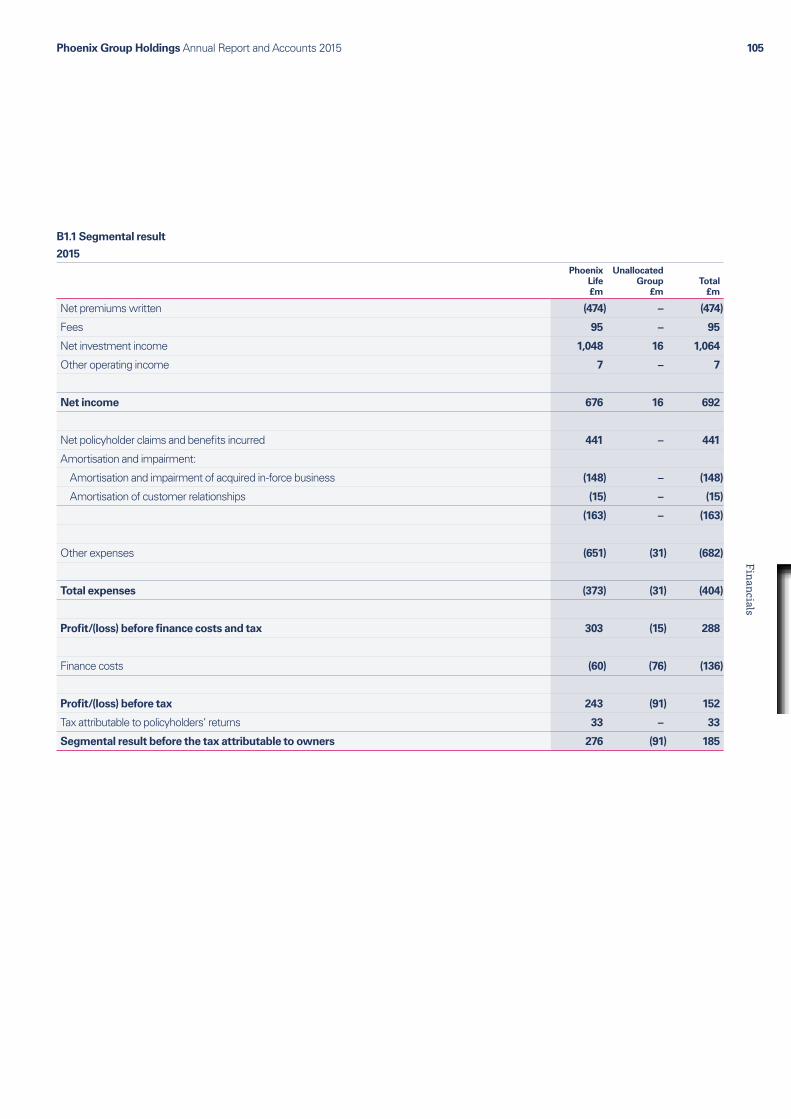
Phoenix Group Holdings Annual Report and Accounts 2015 105Financials
B1.1 Segmental result
2015Phoenix
Life £m
Unallocated Group
£mTotal
£m
Net premiums written (474) – (474)
Fees 95 – 95
Net investment income 1,048 16 1,064
Other operating income 7 – 7
Net income 676 16 692
Net policyholder claims and benefits incurred 441 – 441
Amortisation and impairment:
Amortisation and impairment of acquired in-force business (148) – (148)
Amortisation of customer relationships (15) – (15)
(163) – (163)
Other expenses (651) (31) (682)
Total expenses (373) (31) (404)
Profit/(loss) before finance costs and tax 303 (15) 288
Finance costs (60) (76) (136)
Profit/(loss) before tax 243 (91) 152
Tax attributable to policyholders’ returns 33 – 33
Segmental result before the tax attributable to owners 276 (91) 185

Phoenix Group Holdings Annual Report and Accounts 2015106
NOTES TO THE IFRS CONSOLIDATEDFINANCIAL STATEMENTSContinued
B. EARNINGS PERFORMANCE continued
B1. SEGMENTAL ANALYSIS continued
2014
Phoenix Life £m
Ignis £m
Unallocated Group
£mEliminations
£m
Discontinued operations
eliminations £m
Total £m
Net premiums written (811) – – – – (811)
Fees from:
External customers 94 26 – – (26) 94
Other segment – 38 – (38) – –
94 64 – (38) (26) 94
Net investment income 6,027 (6) 7 – 6 6,034
Other operating income 9 – – – – 9
Gain on transfer of business (18) – 129 – (107) 4
Net income 5,301 58 136 (38) (127) 5,330
Net policyholder claims and benefits incurred (3,733) – – – – (3,733)
Amortisation:
Amortisation of acquired in-force business (98) – – – – (98)
Amortisation of customer relationships and other intangibles (15) – – – – (15)
(113) – – – – (113)
Other expenses (926) (47) 25 38 47 (863)
Total expenses (4,772) (47) 25 38 47 (4,709)
Profit/(loss) before finance costs and tax 529 11 161 – (80) 621
Finance costs (91) – (65) – – (156)
Profit/(loss) before tax 438 11 96 – (80) 465
Tax attributable to policyholders’ returns (129) – – – – (129)
Segmental result before the tax attributable to owners 309 11 96 – (80) 336

Phoenix Group Holdings Annual Report and Accounts 2015 107Financials
B1.2 Reconciliation of operating profit before adjusting items to the segmental result
The Group has chosen to report a non-GAAP measure of performance being operating profit. Operating profit is considered to provide a comparable measure of the underlying performance of the Group’s business as it excludes the impact of short-term economic volatility and other one-off items. This measure incorporates an expected return, including a longer term return on financial investments backing shareholder and policyholder funds over the period, with consistent allowance for the corresponding expected movements in liabilities. Operating profit includes the effect of variances in experience for non-economic items, such as mortality and expenses, and the effect of changes in non-economic assumptions. It also incorporates the impacts of significant management actions where such actions are consistent with the Group’s core operating activities (for example, actuarial modelling enhancements and data reviews).
Impacts arising from the difference between the actual and expected experience for economic items (on both assets and liabilities) and the impacts of changes in economic assumptions on the valuation of liabilities are excluded from operating profit and are presented in profit before the tax attributable to owners (see section B2). Phoenix Life operating profit is net of policyholder finance charges and policyholder tax.
Operating profit also excludes the impact of the following items:
Ɛ amortisation and impairments of intangible assets;
Ɛ finance costs attributable to owners;
Ɛ gains or losses on the disposal of subsidiaries, associates or joint ventures (net of related costs of disposal);
Ɛ the financial impacts of mandatory regulatory change;
Ɛ integration, restructuring or other significant one-off projects; and
Ɛ any other items which, in the Directors’ view, should be disclosed separately by virtue of their nature or incidence to enable a full understanding of the Group’s financial performance.
2015Phoenix
Life £m
Unallocated Group
£mTotal
£m
Operating profit/(loss) before adjusting items 336 (12) 324
Investment return variances and economic assumption changes on long-term business 13 – 13
Variance on owners’ funds (7) (5) (12)
Amortisation of acquired in-force business (75) – (75)
Amortisation of customer relationships (15) – (15)
Non-recurring items 47 2 49
Financing costs attributable to owners (23) (76) (99)
Segmental result before the tax attributable to owners 276 (91) 185
Non-recurring items include:
Ɛ gain of £49 million (net of a £64 million impairment of associated acquired in-force business) arising as a result of the reassurance arrangement entered into with RGA International (see note F3.1);
Ɛ release of provisions associated with external regulatory changes, including the cap on workplace pension charges and the pension guidance levy, of £17 million;
Ɛ corporate project costs of £13 million; and
Ɛ net other one-off items (including Solvency II implementation and systems transformation costs) totalling a cost of £4 million.
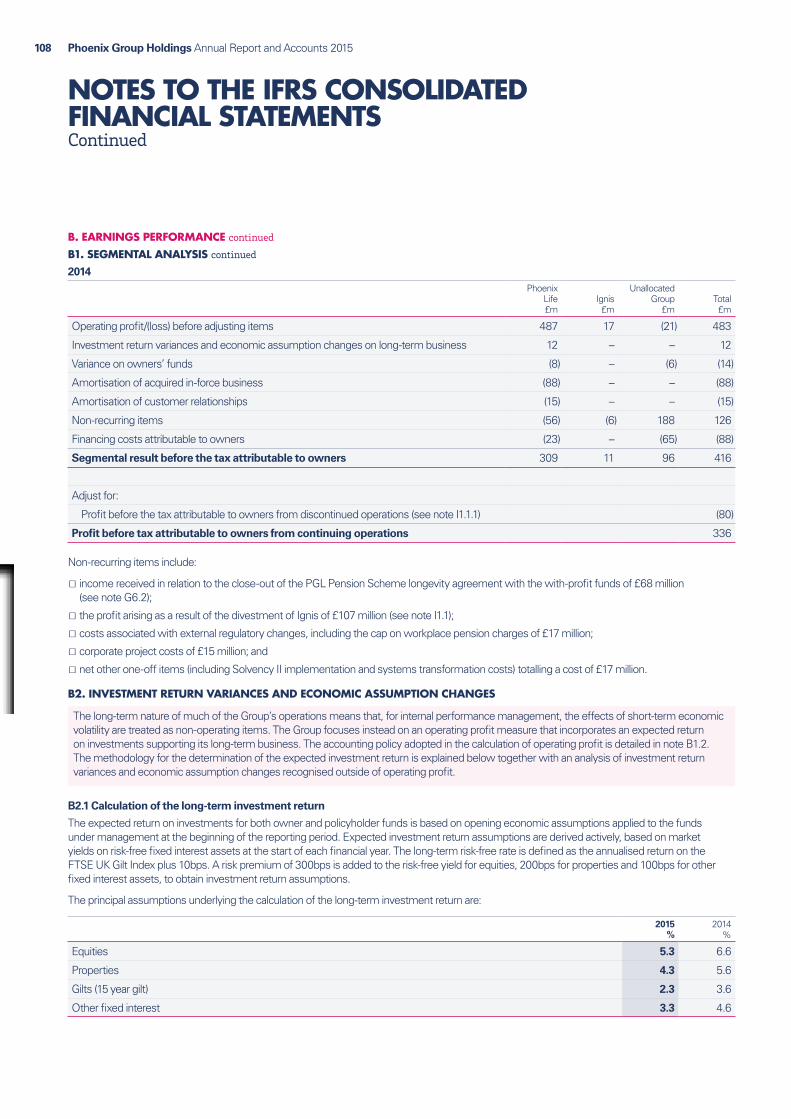
Phoenix Group Holdings Annual Report and Accounts 2015108
NOTES TO THE IFRS CONSOLIDATEDFINANCIAL STATEMENTSContinued
B. EARNINGS PERFORMANCE continued
B1. SEGMENTAL ANALYSIS continued
2014Phoenix
Life £m
Ignis £m
Unallocated Group
£mTotal £m
Operating profit/(loss) before adjusting items 487 17 (21) 483
Investment return variances and economic assumption changes on long-term business 12 – – 12
Variance on owners’ funds (8) – (6) (14)
Amortisation of acquired in-force business (88) – – (88)
Amortisation of customer relationships (15) – – (15)
Non-recurring items (56) (6) 188 126
Financing costs attributable to owners (23) – (65) (88)
Segmental result before the tax attributable to owners 309 11 96 416
Adjust for:
Profit before the tax attributable to owners from discontinued operations (see note I1.1.1) (80)
Profit before tax attributable to owners from continuing operations 336
Non-recurring items include:
Ɛ income received in relation to the close-out of the PGL Pension Scheme longevity agreement with the with-profit funds of £68 million (see note G6.2);
Ɛ the profit arising as a result of the divestment of Ignis of £107 million (see note I1.1);
Ɛ costs associated with external regulatory changes, including the cap on workplace pension charges of £17 million;
Ɛ corporate project costs of £15 million; and
Ɛ net other one-off items (including Solvency II implementation and systems transformation costs) totalling a cost of £17 million.
B2. INVESTMENT RETURN VARIANCES AND ECONOMIC ASSUMPTION CHANGES
The long-term nature of much of the Group’s operations means that, for internal performance management, the effects of short-term economic volatility are treated as non-operating items. The Group focuses instead on an operating profit measure that incorporates an expected return on investments supporting its long-term business. The accounting policy adopted in the calculation of operating profit is detailed in note B1.2. The methodology for the determination of the expected investment return is explained below together with an analysis of investment return variances and economic assumption changes recognised outside of operating profit.
B2.1 Calculation of the long-term investment return
The expected return on investments for both owner and policyholder funds is based on opening economic assumptions applied to the funds under management at the beginning of the reporting period. Expected investment return assumptions are derived actively, based on market yields on risk-free fixed interest assets at the start of each financial year. The long-term risk-free rate is defined as the annualised return on the FTSE UK Gilt Index plus 10bps. A risk premium of 300bps is added to the risk-free yield for equities, 200bps for properties and 100bps for other fixed interest assets, to obtain investment return assumptions.
The principal assumptions underlying the calculation of the long-term investment return are:
2015 %
2014 %
Equities 5.3 6.6
Properties 4.3 5.6
Gilts (15 year gilt) 2.3 3.6
Other fixed interest 3.3 4.6

Phoenix Group Holdings Annual Report and Accounts 2015 109Financials
B2.2 Life assurance business
Operating profit for life assurance business is based on expected investment returns on financial investments backing owners’ and policyholder funds over the reporting period, with consistent allowance for the corresponding expected movements in liabilities. Operating profit includes the effect of variance in experience for non-economic items, for example mortality, persistency and expenses, and the effect of changes in non-economic assumptions. Changes due to economic items, for example market value movements and interest rate changes, which give rise to variances between actual and expected investment returns, and the impact of changes in economic assumptions on liabilities, are disclosed separately outside operating profit.
The movement in liabilities included in operating profit reflects both the change in liabilities due to the expected return on investments and the impact of experience variances and assumption changes for non-economic items.
The effect of differences between actual and expected economic experience on liabilities, and changes to economic assumptions used to value liabilities, are taken outside operating profit. For many types of long-term business, including unit-linked and with-profit funds, movements in asset values are offset by corresponding changes in liabilities, limiting the net impact on profit. For other long-term business the profit impact of economic volatility depends on the degree of matching of assets and liabilities, and exposure to financial options and guarantees.
The investment return variances and economic assumption changes excluded from the long-term business operating profit are as follows:
2015 £m
2014 £m
Investment return variances and economic assumption changes on long-term business 13 12
Positive investment return variances and economic assumption changes on long-term business of £13 million (2014: £12 million) include the minority share of the result of the consolidated UKCPT property investment structure of £46 million (2014: £75 million) and a £19 million gain on the purchase of a portfolio of equity release mortgages arising from the yield uplift on assets available to back annuity liabilities. Increases in yields during the period have also had a positive impact reflecting short asset positions held relative to the longer term IFRS basis liabilities. These positive items have been partly offset by the adverse impacts of changes in asset portfolios undertaken in preparation for the implementation of the new Solvency II regime, together with the impact of widening credit spreads during the period.
B2.3 Owners’ funds
For non-long-term business including owners’ funds, the total investment income, including fair value gains, is analysed between a calculated longer-term return and short-term fluctuations.
The variances excluded from operating profit in relation to owners’ funds are as follows:
2015 £m
2014 £m
Variances on owners’ funds of:
Subsidiary undertakings (12) (19)
The Company – 5
(12) (14)
The negative variance on owners’ funds of subsidiary undertakings of £12 million (2014: £19 million) is principally driven by fair value losses on investments and hedging positions held by the shareholder funds and holding companies.

Phoenix Group Holdings Annual Report and Accounts 2015110
NOTES TO THE IFRS CONSOLIDATEDFINANCIAL STATEMENTSContinued
B. EARNINGS PERFORMANCE continued
B3. EARNINGS PER SHARE
The Group calculates its basic earnings per share based on the present shares in issue using the earnings attributable to ordinary equity holders of the parent, divided by the weighted average number of ordinary shares in issue during the year.
Diluted earnings per share are calculated based on the potential future shares in issue assuming the conversion of all potentially dilutive ordinary shares. The weighted average number of ordinary shares in issue is adjusted to assume conversion of dilutive share awards granted to employees and warrants.
B3.1 Basic earnings per share
The result attributable to owners of the parent for the purposes of computing earnings per share has been calculated as set out below. This is after adjusting for the result attributable to non-controlling interests.
2015 £m
2014 £m
Profit for the period 249 406
Share of result attributable to non-controlling interests (48) (96)
Profit attributable to owners of the parent 201 310
Analysed as:
Profit attributable to owners of the parent from continuing operations 201 218
Profit attributable to owners of the parent from discontinued operations – 92
The weighted average number of ordinary shares outstanding during the period is calculated as follows:
2015 Number million
2014 Number
million
Issued ordinary shares at beginning of the period 225 225
Effect of ordinary shares issued – 1
Own shares held by employee benefit trust and Group entities (1) (1)
Weighted average number of ordinary shares 224 225
Basic earnings per share is as follows:
2015 pence
2014 pence
Basic earnings per share from continuing operations 89.8 96.7
Basic earnings per share from discontinued operations – 41.0
Total basic earnings per share 89.8 137.7
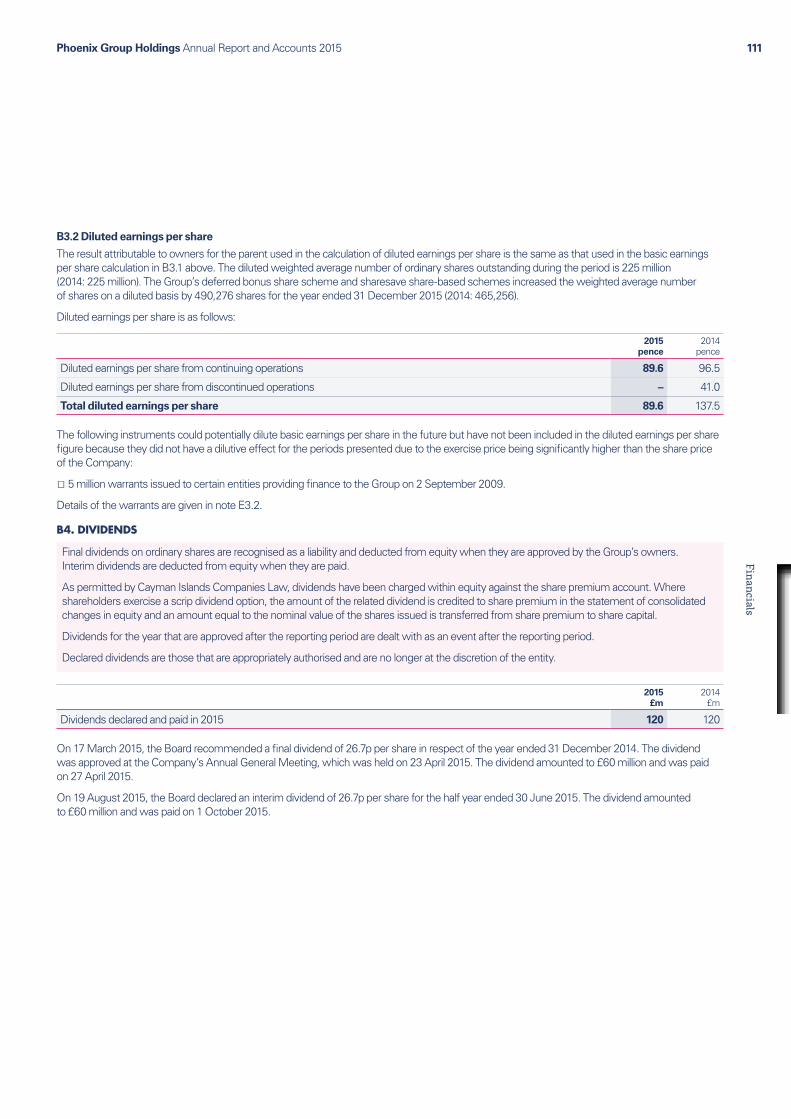
Phoenix Group Holdings Annual Report and Accounts 2015 111Financials
B3.2 Diluted earnings per share
The result attributable to owners for the parent used in the calculation of diluted earnings per share is the same as that used in the basic earnings per share calculation in B3.1 above. The diluted weighted average number of ordinary shares outstanding during the period is 225 million (2014: 225 million). The Group’s deferred bonus share scheme and sharesave share-based schemes increased the weighted average number of shares on a diluted basis by 490,276 shares for the year ended 31 December 2015 (2014: 465,256).
Diluted earnings per share is as follows:
2015 pence
2014 pence
Diluted earnings per share from continuing operations 89.6 96.5
Diluted earnings per share from discontinued operations – 41.0
Total diluted earnings per share 89.6 137.5
The following instruments could potentially dilute basic earnings per share in the future but have not been included in the diluted earnings per share figure because they did not have a dilutive effect for the periods presented due to the exercise price being significantly higher than the share price of the Company:
Ɛ 5 million warrants issued to certain entities providing finance to the Group on 2 September 2009.
Details of the warrants are given in note E3.2.
B4. DIVIDENDS
Final dividends on ordinary shares are recognised as a liability and deducted from equity when they are approved by the Group’s owners. Interim dividends are deducted from equity when they are paid.
As permitted by Cayman Islands Companies Law, dividends have been charged within equity against the share premium account. Where shareholders exercise a scrip dividend option, the amount of the related dividend is credited to share premium in the statement of consolidated changes in equity and an amount equal to the nominal value of the shares issued is transferred from share premium to share capital.
Dividends for the year that are approved after the reporting period are dealt with as an event after the reporting period.
Declared dividends are those that are appropriately authorised and are no longer at the discretion of the entity.
2015 £m
2014 £m
Dividends declared and paid in 2015 120 120
On 17 March 2015, the Board recommended a final dividend of 26.7p per share in respect of the year ended 31 December 2014. The dividend was approved at the Company’s Annual General Meeting, which was held on 23 April 2015. The dividend amounted to £60 million and was paid on 27 April 2015.
On 19 August 2015, the Board declared an interim dividend of 26.7p per share for the half year ended 30 June 2015. The dividend amounted to £60 million and was paid on 1 October 2015.

Phoenix Group Holdings Annual Report and Accounts 2015112
NOTES TO THE IFRS CONSOLIDATEDFINANCIAL STATEMENTSContinued
C. OTHER CONSOLIDATED INCOME STATEMENT NOTESC1. NET INVESTMENT INCOME
Net investment income comprises interest, dividends, rents receivable, net interest income/(expense) on the net defined benefit asset/(liability), fair value gains and losses on financial assets and investment property at fair value and impairment losses on loans and receivables.
Interest income is recognised in the consolidated income statement as it accrues using the effective interest method.
Dividend income is recognised in the consolidated income statement on the date the right to receive payment is established, which in the case of listed securities is the ex-dividend date.
Rental income from investment property is recognised in the consolidated income statement on a straight-line basis over the term of the lease. Lease incentives granted are recognised as an integral part of the total rental income.
Fair value gains and losses on financial assets designated at fair value through profit or loss are recognised in the consolidated income statement. Fair value gains and losses includes both realised and unrealised gains and losses.
2015 £m
2014 £m
Investment income
Interest income on loans and receivables at amortised cost 3 4
Interest income on financial assets designated at fair value through profit or loss on initial recognition 1,076 1,156
Dividend income 911 1,098
Rental income 90 95
Net interest income on Group defined benefit pension scheme asset/liability 17 4
2,097 2,357
Fair value (losses)/gains
Loans and receivables at amortised cost – 1
Financial assets at fair value through profit or loss
Designated upon initial recognition (1,178) 2,333
Held for trading – derivatives 5 1,143
Investment property 140 200
(1,033) 3,677
Net investment income 1,064 6,034
C2. ADMINISTRATIVE EXPENSES
Administrative expenses are recognised in the consolidated income statement as incurred.
2015 £m
2014 £m
Employee costs 81 86
Outsourcer expenses 97 106
Professional fees 33 29
Office costs 23 23
Investment management expenses and transaction costs 150 122
Direct costs of life companies 15 9
Direct costs of collective investment schemes 17 26
Pension administrative expenses 5 7
Other 9 21
430 429

Phoenix Group Holdings Annual Report and Accounts 2015 113Financials
Employee costs comprise:
2015 £m
2014 £m
Wages and salaries 73 77
Social security contributions 8 9
81 86
2015 Number
2014 Number
Average number of persons employed 750 757
C3. AUDITOR’S REMUNERATION During the year the Group obtained the following services from its auditor at costs as detailed in the table below.
2015 £m
2014 £m
Audit of the consolidated financial statements 0.5 0.5
Audit of the Company’s subsidiaries 2.3 2.3
Audit of MCEV supplementary information 0.4 0.4
3.2 3.2
Audit-related assurance services 0.9 0.8
Reporting accountant assurance services 0.1 0.2
Total fee for assurance services 4.2 4.2
Tax advisory services 0.1 –
Corporate finance services 0.1 0.6
Other non-audit services 0.3 0.3
Total fees for other services 0.5 0.9
Total auditor’s remuneration 4.7 5.1
No services were provided by the Company’s auditors to the Group’s pension schemes in either 2015 or 2014.
Audit-related assurance services includes fees payable for services where the reporting is required by law or regulation to be provided by the auditor, such as reporting on regulatory returns. It also includes fees payable in respect of reviews of interim financial information and services where the work is integrated with the audit itself.
Reporting accountant assurance services relate to assurance reporting on historical information included within investment circulars.
Corporate finance services fees were £0.1 million (2014: £0.6 million). Fees for 2014 primarily related to services performed in association with the divestment of Ignis, where management concluded that significant efficiencies would arise as a result of engaging the Group’s auditors to perform the work.
Other non-audit services of £0.3 million (2014: £0.3 million) primarily includes fees payable in respect of assurance services related to applications made to the regulator with regard to the Group’s implementation of Solvency II. In 2014, the fees principally related to a Solvency II preparedness review required in response to an industry-wide request from the Prudential Regulation Authority (‘PRA’).

Phoenix Group Holdings Annual Report and Accounts 2015114
NOTES TO THE IFRS CONSOLIDATEDFINANCIAL STATEMENTSContinued
C. OTHER CONSOLIDATED INCOME STATEMENT NOTES continued
C4. FINANCE COSTS
Interest payable is recognised in the consolidated income statement as it accrues and is calculated using the effective interest method.
This note analyses the interest costs on the Group’s borrowings which are described in note E5.
2015 £m
2014 £m
Interest expense
On financial liabilities at amortised cost 122 141
On financial liabilities at fair value through profit or loss 14 15
136 156
Attributable to:
– policyholders 37 68
– owners 99 88
136 156
C5. TAX (CREDIT)/CHARGE
Income tax comprises current and deferred tax. Income tax is recognised in the consolidated income statement except to the extent that it relates to items recognised in the statement of consolidated comprehensive income or the statement of consolidated changes in equity, in which case it is recognised in these statements.
Current tax is the expected tax payable on the taxable income for the year, using tax rates and laws enacted or substantively enacted at the date of the statement of consolidated financial position together with adjustments to tax payable in respect of previous years.
The tax charge is analysed between tax that is payable in respect of policyholders’ returns and tax that is payable on owners’ returns. This allocation is calculated based on an assessment of the effective rate of tax that is applicable to owners for the year.
C5.1 Current year tax (credit)/charge2015
£m2014
£m
Current tax:
UK corporation tax 11 120
Overseas tax 8 18
19 138
Adjustment in respect of prior years (99) (11)
Total current tax (credit)/charge (80) 127
Deferred tax:
Origination and reversal of temporary differences 7 28
Change in the rate of UK corporation tax (24) (2)
Movement in unrecognised deferred tax – (2)
Total deferred tax (credit)/charge (17) 24
Total tax (credit)/charge (97) 151
Attributable to:
– policyholders (33) 129
– owners (64) 22
Total tax (credit)/charge (97) 151
The Group, as a proxy for policyholders in the UK, is required to pay taxes on investment income and gains each year. Accordingly, the tax credit or expense attributable to UK life assurance policyholder earnings is included in income tax expense. The tax (credit)/charge attributable to policyholder earnings was £(33) million (2014: £129 million).
Phoenix Group Holdings Annual Report and Accounts 2015 115Financials
C5.2 Tax charged/(credited) to other comprehensive income
2015 £m
2014 £m
Current tax credit on share schemes (1) (2)
Deferred tax charge/(credit) on defined benefit schemes 5 (9)
Deferred tax on share schemes 1 –
5 (11)
C5.3 Reconciliation of tax (credit)/charge 2015
£m2014
£m
Profit before tax 152 465
Policyholder tax credit/(charge) 33 (129)
Profit before the tax attributable to owners 185 336
Tax at standard UK1 rate of 20.25% (2014: 21.5%) 37 72
Non-taxable income and gains (13) (6)
Disallowable expenses 6 7
Prior year tax credit for shareholders2 (41) (16)
Movement on acquired in-force amortisation at less than 20.25% (2014: 21.5%) 15 2
Profits taxed at rates other than 20.25% (2014: 21.5%) (36) (21)
Recognition of previously unrecognised deferred tax assets (6) (19)
Deferred tax rate change (24) (7)
Temporary differences not valued (1) 4
Other (1) 6
Owners’ tax (credit)/charge (64) 22
Policyholder tax (credit)/charge (33) 129
Total tax (credit)/charge for the period (97) 1511 The Phoenix Life operating segment operates predominantly in the UK. The reconciliation of the tax (credit)/charge has, therefore, been completed by reference to the standard rate of UK tax
rather than by reference to the Jersey income tax rate of 0% which is applicable to Phoenix Group Holdings.2 The prior year tax credit represents the impact of reaching agreement with HMRC in respect of the Group’s uncertain tax positions for the years 2007 to 2014. This includes the increased
utilisation of tax losses previously unrecognised, the effect of the reduction in corporate tax rates across the years and a release of tax provisions.
D. EQUITY D1. SHARE CAPITAL
The Group has issued ordinary shares which are classified as equity. Incremental external costs that are directly attributable to the issue of these shares are recognised in equity, net of tax.
2015 £
2014 £
Authorised:
410 million (2014: 410 million) ordinary shares of €0.0001 each 31,750 31,750
Issued and fully paid:
225.4 million (2014: 225.1 million) ordinary shares of €0.0001 each 18,444 18,439
The holders of ordinary shares are entitled to one vote per share on matters to be voted on by owners and to receive such dividends, if any, as may be declared by the Board of Directors in its discretion out of legally available profits. Movements in issued share capital during the year:
Phoenix Group Holdings Annual Report and Accounts 2015116
NOTES TO THE IFRS CONSOLIDATEDFINANCIAL STATEMENTSContinued
D. EQUITY continued
D1. SHARE CAPITAL continued
2015
Number £
Shares in issue at 1 January 225,090,284 18,439
Other ordinary shares issued in the period 329,162 5
Shares in issue at 31 December 225,419,446 18,444
During the year, the Company issued 329,162 shares at a premium of £2 million in order to satisfy its obligations to employees under the Group’s sharesave schemes (see note I2).
2014
Number £
Shares in issue at 1 January 224,818,301 18,418
Other ordinary shares issued in the period 271,983 21
Shares in issue at 31 December 225,090,284 18,439
During 2014, the Company issued 271,983 shares at a premium of £1 million in order to satisfy its obligations to employees under the Group’s sharesave schemes.
D2. SHARES HELD BY THE EMPLOYEE BENEFIT TRUST AND GROUP ENTITIES
Where the Phoenix Group Holdings Employee Benefit Trust (‘PGH EBT’) or other Group entity acquires shares in the Company or obtains rights to purchase its shares, the consideration paid (including any attributable transaction costs, net of tax) is shown as a deduction from owners’ equity. Gains and losses on sales of shares held by the PGH EBT and Group entities are charged or credited to the own shares account in equity.
The PGH EBT holds shares to satisfy awards granted to employees under the Group’s share-based payment schemes.
2015 £m
2014 £m
At 1 January 8 13
Shares acquired by the PGH EBT in year 6 8
Shares awarded to employees by the PGH EBT in year (9) (10)
Shares sold by other Group entities in year – (3)
At 31 December 5 8
During the year 1,398,290 (2014: 1,478,921) shares were awarded to employees by the PGH EBT and 735,068 (2014: 1,200,000) shares were purchased. The number of shares held by the PGH EBT at 31 December 2015 was 587,334 (2014: 1,250,556).
The Company provides the PGH EBT with an interest-free facility arrangement to enable it to purchase the shares. Details of this loan are included in note 9 to the parent company accounts.
In the prior period 540,612 shares held by other Group entities were sold. The number of shares held by other Group entities as at 31 December 2015 was nil (2014: nil).
Phoenix Group Holdings Annual Report and Accounts 2015 117Financials
D3. NON-CONTROLLING INTERESTS
Non-controlling interests are stated at the share of net assets attributed to the non-controlling interest holder at the time of acquisition, adjusted or the relevant share of subsequent changes in equity.
2015
Perpetual Reset
Capital Securities
£m
UK Commercial
Property Trust
Limited £m
Total £m
At 1 January 408 505 913
Profit for the year 2 46 48
Dividends paid – (23) (23)
Coupon paid, net of tax relief (15) – (15)
Exchange of Notes for subordinated notes (388) – (388)
Shares in subsidiaries subscribed for by non-controlling interests – 35 35
At 31 December 7 563 570
2014Perpetual
Reset Capital
Securities £m
UK Commercial
Property Trust Limited
£mTotal £m
At 1 January 408 370 778
Profit for the year 21 75 96
Dividends paid – (22) (22)
Coupon paid, net of tax relief (21) – (21)
Shares in subsidiaries subscribed for by non-controlling interests – 82 82
At 31 December 408 505 913
D3.1 Perpetual Reset Capital Securities
On 1 January 2010, Pearl Group Holdings (No. 1) Limited (‘PGH1’) had in issue £500 million of Perpetual Reset Capital Securities (‘the Notes’) which are admitted to the Official List of the UK Listing Authority and to trading on the LSE. Following amendments made to the Notes in 2010, the principal amount outstanding was £425 million.
On 23 January 2015, the Group exchanged 99% of the Notes for £428 million of new subordinated notes, issued by PGH Capital Limited, and £3 million of cash (see note E5 for further details). £32 million of the new notes are held by Group companies and are therefore eliminated in the preparation of the consolidated financial statements. The exchange resulted in a loss of £12 million which has been recognised in equity. The remaining Notes outstanding at 31 December 2015 had a principal amount outstanding of £6 million.
The Notes are unsecured obligations of PGH1 and are subordinate to the claims of senior creditors. Payments in respect of the Notes are conditional upon PGH1 being solvent at the time of payment and immediately following such payment.
The outstanding Notes have no fixed maturity date and coupon payments may be deferred at the option of PGH1; accordingly the Notes meet the definition of equity for financial reporting purposes and are disclosed as a non-controlling interest in the consolidated financial statements.
The remaining Notes may be redeemed at par at the option of PGH1 on the first reset date of 25 April 2016 or on any coupon payment date thereafter. Redemption is subject to the agreement of the PRA. In certain circumstances PGH1 has the right to substitute the Notes or to redeem the Notes before the first reset date.
Coupons are payable annually in arrears on 25 April, at the rate of 6.5864% per annum, until the first reset date. Thereafter coupons are payable semi-annually at 2.73% per annum over the then prevailing offered rate for six month sterling deposits.
If PGH1 opts to defer a coupon payment, then PGH1 has the option to either leave the coupon outstanding or satisfy the deferred coupon payment through the alternative coupon satisfaction mechanism (the ‘ACSM’), which involves the issue by PGH1 of ordinary shares in order to fund payment of the deferred coupon.

Phoenix Group Holdings Annual Report and Accounts 2015118
NOTES TO THE IFRS CONSOLIDATEDFINANCIAL STATEMENTSContinued
D. EQUITY continued
D3. NON-CONTROLLING INTERESTS continued
For so long as a deferred coupon payment has not been satisfied, PGH1 may not declare, pay or distribute a dividend on any of its securities in issue ranking junior to the Notes, including the ordinary shares of PGH1 or any parity securities or, except in particular circumstances, redeem, purchase or otherwise acquire any of its securities in issue ranking junior to the Notes, including its ordinary shares or any parity securities. These restrictions would also apply to the Company until the deferred coupon payment is satisfied.
On 23 January 2015, the coupon that was due on the Notes was settled with the noteholders that exchanged their Notes. On 25 April 2015, the 2015 coupon was settled in full with the remaining noteholders.
On 21 March 2016, PGH1 gave notice to the noteholders to redeem the remaining Notes on 25 April 2016.
D3.2 UK Commercial Property Trust Limited
UK Commercial Property Trust Limited (‘UKCPT’) is a property investment subsidiary which is domiciled in Guernsey and is admitted to the Official List of the UK Listing Authority and to trading on the LSE.
As at 31 December 2015 the Group held 50% (2014: 53%) of the issued share capital of UKCPT. The Group’s interest in UKCPT is held in the with-profit funds of the Group’s life companies. Therefore, the shareholder exposure to the results of UKCPT is limited to the impact of those results on the shareholder share of distributed profits of the relevant fund.
Summary financial information for the UKCPT is shown below:
2015 £m
2014 £m
Non-current assets 683 612
Current assets 17 14
Non-current liabilities (124) (111)
Current liabilities (13) (10)
563 505
Revenue 58 86
Profit before tax 46 75
Income tax – –
Profit for the year after tax 46 75
E. FINANCIAL ASSETS & LIABILITIESE1. FAIR VALUES
Financial assets
Purchases and sales of financial assets are recognised on the trade date, which is the date that the Group commits to purchase or sell the asset.
Loans and receivables are non-derivative financial assets with fixed or determinable payments that are not quoted in an active market. For the majority of the Group’s loans and receivables these investments are initially recognised at cost, being the fair value of the consideration paid for the acquisition of the investment. All transaction costs directly attributable to the acquisition are also included in the cost of the investment. Subsequent to initial recognition, these investments are carried at amortised cost, using the effective interest method. The Group holds a portfolio of loans that are designated at fair value through profit or loss.
Derivative financial instruments are classified as held for trading. They are recognised initially at fair value and subsequently are remeasured to fair value. The gain or loss on remeasurement to fair value is recognised in the consolidated income statement.
Equities, fixed and variable rate income securities, collective investment schemes and certain loans and receivables are designated at fair value through profit or loss and accordingly are stated in the statement of consolidated financial position at fair value. They are designated at fair value through profit or loss because this is reflective of the manner in which the financial assets are managed and reduces a measurement inconsistency that would otherwise arise with regard to the insurance liabilities that the assets are backing.
Impairment of financial assetsThe Group assesses at each period end whether a financial asset or group of financial assets held at amortised cost is impaired. The Group first assesses whether objective evidence of impairment exists. If it is determined that no objective evidence of impairment exists for an individually assessed financial asset, the asset is included in a group of financial assets with similar credit risk characteristics and that group of financial assets is collectively assessed for impairment. Assets that are individually assessed for impairment and for which an impairment loss is, or continues to be recognised, are not included in the collective assessment of impairment.

Phoenix Group Holdings Annual Report and Accounts 2015 119Financials
Fair value estimationThe fair value of financial instruments traded in active markets such as publicly traded securities and derivatives are based on quoted market prices at the period end. The quoted market price used for financial assets is the applicable bid price on the period end date. The fair value of investments that are not traded in an active market is determined using valuation techniques such as broker quotes, pricing models or discounted cash flow techniques. Where pricing models are used, inputs are based on market related data at the period end. Where discounted cash flow techniques are used, estimated future cash flows are based on contractual cash flows using current market conditions and market calibrated discount rates and interest rate assumptions for similar instruments.
For units in unit trusts and shares in open-ended investment companies, fair value is determined by reference to published bid-values. The fair value of receivables and floating rate and overnight deposits with credit institutions is their carrying value. The fair value of fixed interest-bearing deposits is estimated using discounted cash flow techniques.
Joint venturesInvestments in joint ventures that are held for investment purposes are accounted for under IAS 39 Financial Instruments: Recognition and Measurement as permitted by IAS 28 Investments in Associates and Joint Ventures. These are measured at fair value through profit or loss. There are no investments in joint ventures which are of a strategic nature.
Financial liabilities
On initial recognition, financial liabilities are recognised when due and measured at the fair value of the consideration received less directly attributable transaction costs (with the exception of liabilities at fair value through profit or loss for which all transaction costs are expensed).
Subsequent to initial recognition, financial liabilities (except for liabilities under investment contracts and other liabilities designated at fair value through profit or loss) are measured at amortised cost using the effective interest method.
Financial liabilities are designated upon initial recognition at fair value through profit or loss and where doing so results in more meaningful information because either:
Ɛ it eliminates or significantly reduces accounting mismatches that would otherwise arise from measuring assets or liabilities or recognising the gains and losses on them on different bases; or
Ɛ a group of financial assets, financial liabilities or both is managed and its performance is evaluated and managed on a fair value basis, in accordance with a documented risk management or investment strategy, and information about the investments is provided internally on that basis to the Group’s key management personnel.
Investment contracts without DPFContracts under which the transfer of insurance risk to the Group from the policyholder is not significant are classified as investment contracts and accounted for as financial liabilities.
Receipts and payments on investment contracts without DPF are accounted for using deposit accounting, under which the amounts collected and paid out are recognised in the statement of consolidated financial position as an adjustment to the liability to the policyholder.
The valuation of liabilities on unit-linked contracts is held at the fair value of the related assets and liabilities. The liability is the sum of the unit-linked liabilities plus an additional amount to cover the present value of the excess of future policy costs over future charges.
Movements in the fair value of investment contracts without DPF are included in the ‘change in investment contract liabilities’ in the consolidated income statement.
Investment contract policyholders are charged for policy administration services, investment management services, surrenders and other contract fees. These fees are recognised as revenue over the period in which the related services are performed. If the fees are for services provided in future periods, then they are deferred and recognised over those periods. ‘Front end’ fees are charged on some non-participating investment contracts. Where the non-participating investment contract is measured at fair value, such fees which relate to the provision of investment management services are deferred and recognised as the services are provided.
Deposits from reinsurersIt is the Group’s practice to obtain collateral to cover certain reinsurance transactions, usually in the form of cash or marketable securities. Where cash collateral is available to the Group for investment purposes, it is recognised as a ‘financial asset’ and the collateral repayable is recognised as ‘deposits received from reinsurers’ in the statement of consolidated financial position.
Net asset value attributable to unitholdersThe net asset value attributable to unitholders represents the non-controlling interest in collective investment schemes which are consolidated by the Group. This interest is classified at fair value through profit or loss and measured at fair value, which is equal to the bid value of the number of units of the collective investment scheme not owned by the Group.
Obligations for repayment of collateral receivedIt is the Group’s practice to obtain collateral in stock lending and derivative transactions, usually in the form of cash or marketable securities. Where cash collateral is available to the Group for investment purposes, it is recognised as a ‘financial asset’ and the collateral repayable is recognised as ‘obligations for repayment of collateral received’ in the statement of consolidated financial position. The ‘obligations for repayment of collateral received’ are measured at amortised cost, which in the case of cash is equivalent to the fair value of the consideration received.
Phoenix Group Holdings Annual Report and Accounts 2015120
NOTES TO THE IFRS CONSOLIDATEDFINANCIAL STATEMENTSContinued
E. FINANCIAL ASSETS & LIABILITIES continued
E1. FAIR VALUES continued
The table below sets out a comparison of the carrying amounts and fair values of financial instruments as at 31 December 2015:
2015Carrying value
Total £m
Amounts due for
settlement after
12 months £m
Fair value £m
Financial assets measured at carrying and fair values
Financial assets at fair value through profit or loss:
Held for trading – derivatives 1,498 1,335 1,498
Designated upon initial recognition:
Loans and receivables 268 245 268
Equities1 12,351 – 12,351
Investment in joint venture 149 – 149
Fixed and variable rate income securities 31,814 24,176 31,814
Collective investment schemes 1 3,826 – 3,826
Loans and receivables at amortised cost 309 24 309
50,215 50,215
Less amounts classified as held for sale (see note I1.2) (149) – (149)
Total financial assets 50,066 50,066
Carrying value
Total £m
Amounts due for
settlement after
12 months £m
Fair value £m
Financial liabilities measured at carrying and fair values
Financial liabilities at fair value through profit or loss:
Held for trading – derivatives 1,360 1,255 1,360
Designated upon initial recognition:
Borrowings 194 194 194
Net asset value attributable to unitholders 1 5,120 – 5,120
Investment contract liabilities 1 7,905 – 7,905
Financial liabilities measured at amortised cost:
Borrowings 1,804 1,772 1,907
Deposits received from reinsurers 378 347 378
Obligations for repayment of collateral received 2 725 – –
Total financial liabilities 17,486 16,864
1 These assets and liabilities have no expected settlement date.2 These liabilities have no expected settlement date. As the obligations relate to the repayment of collateral received in the form of cash, the liability is stated at the value of the consideration
received and therefore no fair value has been disclosed.

Phoenix Group Holdings Annual Report and Accounts 2015 121Financials
2014Carrying value
Total £m
Amounts due for
settlement after
12 months £m
Fair value £m
Financial assets measured at carrying and fair values
Financial assets at fair value through profit or loss:
Held for trading – derivatives 2,558 2,112 2,558
Designated upon initial recognition:
Equities 1 13,168 – 13,168
Investment in joint venture 1 133 – 133
Fixed and variable rate income securities 34,384 27,244 34,384
Collective investment schemes 1 3,583 – 3,583
Loans and receivables at amortised cost 196 36 196
Total financial assets 54,022 54,022
Carrying value
Total £m
Amounts due for
settlement after
12 months £m
Fair value £m
Financial liabilities measured at carrying and fair values
Financial liabilities at fair value through profit or loss:
Held for trading – derivatives 2,192 2,122 2,192
Designated upon initial recognition:
Borrowings 184 184 184
Net asset value attributable to unitholders 1 4,659 – 4,659
Investment contract liabilities 1 8,451 – 8,451
Financial liabilities measured at amortised cost:
Borrowings 1,578 1,425 1,698
Deposits received from reinsurers 408 375 408
Obligations for repayment of collateral received 2 954 – –
Total financial liabilities 18,426 17,5921 These assets and liabilities have no expected settlement date.2 These liabilities have no expected settlement date. As the obligations relate to the repayment of collateral received in the form of cash, the liability is stated at the value
of the consideration received and therefore no fair value has been disclosed.
Phoenix Group Holdings Annual Report and Accounts 2015122
NOTES TO THE IFRS CONSOLIDATEDFINANCIAL STATEMENTSContinued
E. FINANCIAL ASSETS & LIABILITIES continued
E2. FAIR VALUE HIERARCHYE2.1 Determination of fair value and fair value hierarchy of financial instruments
Level 1 financial instrumentsThe fair value of financial instruments traded in active markets (such as exchange traded securities and derivatives) is based on quoted market prices at the period end provided by recognised pricing services. Market depth and bid-ask spreads are used to corroborate whether an active market exists for an instrument. Greater depth and narrower bid-ask spread indicates higher liquidity in the instrument and are classed as Level 1 inputs. For collective investment schemes, fair value is by reference to published bid prices.
Level 2 financial instrumentsFinancial instruments traded in active markets with less depth or wider bid-ask spreads which do not meet the classification as Level 1 inputs, are classified as Level 2. The fair values of financial instruments not traded in active markets are determined using broker quotes or valuation techniques with observable market inputs. Financial instruments valued using broker quotes are classified at Level 2, only where there is a sufficient range of available quotes. The fair value of unquoted equities, over the counter derivatives, loans and deposits and collective investment schemes, where published bid prices are not available, are estimated using pricing models or discounted cash flow techniques. Where pricing models are used, inputs are based on market related data at the period end. Where discounted cash flows are used, estimated future cash flows are based on management’s best estimates and the discount rate used is a market related rate for a similar instrument.
Level 3 financial instrumentsThe Group’s financial instruments determined by valuation techniques using non-observable market inputs are based on a combination of independent third party evidence and internally developed models. In relation to investments in hedge funds and private equity investments, non-observable third party evidence in the form of net asset valuation statements are used as the basis for the valuation. Adjustments may be made to the net asset valuation where other evidence, for example recent sales of the underlying investments in the fund, indicates this is required. Securities that are valued using broker quotes which could not be corroborated across a sufficient range of quotes are considered as Level 3. For a small number of investment vehicles and debt securities, standard valuation models are used, as due to their nature and complexity they have no external market. Inputs into such models are based on observable market data where applicable. The fair value of loans and some borrowings with no external market is determined by internally developed discounted cash flow models using appropriate assumptions corroborated with external market data where possible.
For financial instruments that are recognised at fair value on a recurring basis, the Company determines whether transfers have occurred between levels in the hierarchy by re-assessing categorisation (based on the lowest level input that is significant to the fair value measurement as a whole) at the start of each reporting period.

Phoenix Group Holdings Annual Report and Accounts 2015 123Financials
E2.2 Fair value hierarchy of financial instruments
The tables below separately identify financial instruments carried at fair value from those measured on another basis but for which fair value is disclosed.
2015
Level 1 £m
Level 2 £m
Level 3 £m
Total fair value
£m
Financial assets measured at fair value
Derivatives 14 1,484 – 1,498
Financial assets designated at fair value through profit or loss upon initial recognition:
Loans and receivables – – 268 268
Equities 11,734 11 606 12,351
Investment in joint venture – – 149 149
Fixed and variable rate income securities 20,346 11,138 330 31,814
Collective investment schemes 3,098 646 82 3,826
35,178 11,795 1,435 48,408
Less amounts classified as held for sale (see note I1.2) – – (149) (149)
Total financial assets measured at fair value 35,192 13,279 1,286 49,757
Financial assets for which fair values are disclosed
Loans and receivables at amortised cost – 309 – 309
Total financial assets 35,192 13,588 1,286 50,066
Level 1 £m
Level 2 £m
Level 3 £m
Total fair value
£m
Financial liabilities measured at fair value
Derivatives 33 1,327 – 1,360
Financial liabilities designated at fair value through profit or loss upon initial recognition:
Borrowings – – 194 194
Net asset value attributable to unitholders 5,120 – – 5,120
Investment contract liabilities – 7,905 – 7,905
5,120 7,905 194 13,219
Total financial liabilities measured at fair value 5,153 9,232 194 14,579
Financial liabilities for which fair values are disclosed
Borrowings at amortised cost – 970 937 1,907
Deposits received from reinsurers – 378 – 378
Total financial liabilities for which fair values are disclosed – 1,348 937 2,285
Total financial liabilities 5,153 10,580 1,131 16,864

Phoenix Group Holdings Annual Report and Accounts 2015124
NOTES TO THE IFRS CONSOLIDATEDFINANCIAL STATEMENTSContinued
E. FINANCIAL ASSETS & LIABILITIES continued
E2. FAIR VALUE HIERARCHY continued
2014
Level 1 £m
Level 2 £m
Level 3 £m
Total fair value
£m
Financial assets measured at fair value
Derivatives 18 2,540 – 2,558
Financial assets designated at fair value through profit or loss upon initial recognition:
Equities 12,315 149 704 13,168
Investment in joint venture – – 133 133
Fixed and variable rate income securities 24,639 9,010 735 34,384
Collective investment schemes 2,579 923 81 3,583
39,533 10,082 1,653 51,268
Total financial assets measured at fair value 39,551 12,622 1,653 53,826
Financial assets for which fair values are disclosed
Loans and receivables at amortised cost – 36 186 222
Total financial assets 39,551 12,658 1,839 54,048
Level 1 £m
Level 2 £m
Level 3 £m
Total fair value
£m
Financial liabilities measured at fair value
Derivatives 40 2,151 1 2,192
Financial liabilities designated at fair value through profit or loss upon initial recognition:
Borrowings – – 184 184
Net asset value attributable to unitholders 4,659 – – 4,659
Investment contract liabilities – 8,451 – 8,451
4,659 8,451 184 13,294
Total financial liabilities measured at fair value 4,699 10,602 185 15,486
Financial liabilities for which fair values are disclosed
Borrowings at amortised cost – 553 1,145 1,698
Deposits received from reinsurers – 408 – 408
Total financial liabilities for which fair values are disclosed – 961 1,145 2,106
Total financial liabilities 4,699 11,563 1,330 17,592
E2.3 Level 3 financial instrument sensitivities
Level 3 investments in indirect property, equities (including private equity) and collective investment schemes (including hedge funds) are valued using net asset statements provided by independent third parties, and therefore no sensitivity analysis has been prepared.
Fixed and variable rate securities categorised as Level 3 investments, with the exception of a property investment structure and certain local authority loans, are valued using broker quotes. Although such valuations are sensitive to estimates, it is believed that changing one or more of the assumptions to reasonably possible alternative assumptions would not change the fair value significantly.
Level 3 investments in fixed and variable income securities include a property investment structure with a value of £36 million (2014: £59 million). This investment was restructured during the year and inputs to the valuation have changed.
Phoenix Group Holdings Annual Report and Accounts 2015 125Financials
The investment is valued by taking the fair value of the equity holdings in the structure, using market data less a discount spread to reflect reduced liquidity due to redemption restrictions. The fair value of the debt in the structure is valued using a simple calculation model taking a comparable overseas bond issue and applying a credit spread to reflect reduced liquidity.
The valuation of the debt investment is sensitive to a change in the credit spread whereby an increase of 100bps in the credit spread would decrease the value by £1 million and a spread reduction of 100bps would increase the value by £1 million. The valuation of the equity investment is sensitive to changes in the equity discount rate, whereby an increase of 5% in the discount spread would decrease the value by £2 million and a 5% reduction would increase the value by £1 million.
Also included within fixed and variable rate securities are investments in local authority loans. These investments are valued using a simple calculation model taking a comparable UK Treasury stock and applying a credit spread to reflect reduced liquidity. The credit spread is derived from a sample broker quote. The valuations are sensitive to movements in this spread, an increase of 25bps would decrease the value by £1 million (2014: £1 million) and a decrease of 25bps would increase the value by £1 million (2014: £1 million).
Included within loans and receivables are investments in equity release mortgages with a value of £268 million, acquired in January 2015. The loans are valued using a discounted cash flow model, the key inputs to which include demographic assumptions, economic assumptions (including house price index) and the use of a Black-Scholes model for valuation of the no-negative equity guarantee. The no-negative equity guarantee caps the loan repayment in the event of death or entry into long-term care to be no greater than the sales proceeds from the property. The significant sensitivities arise from movements in gilt curve, inflation rate and house prices.
An increase of 100bps in the gilt curve would decrease the value by £22 million and a decrease of 100bps would increase the value by £25 million. An increase of 1% in the inflation rate would increase the value by £2 million and a decrease of 1% would decrease the value by £3 million. An increase of 10% in house prices would increase the value by £1 million and a decrease of 10% would decrease the value by £1 million.
Borrowings measured at fair value and categorised as Level 3 financial liabilities comprise the property reversion loans, measured using an internally developed model. The valuation is sensitive to key assumptions of the discount rate and the house price inflation rate. An increase in the discount rate of 1% would decrease the value by £5 million and a decrease of 1% would increase the value by £5 million. An increase of 1% in the house price inflation rate would increase the value by £6 million and a decrease of 1% would decrease the value by £6 million. Details of the valuation of the underlying residential property reversions are included in note G9.
E2.4 Transfers of financial instruments between Level 1 and Level 2
2015From
Level 1 toLevel 2
£m
FromLevel 2 to
Level 1£m
Financial assets measured at fair value
Financial assets designated at fair value through profit or loss upon initial recognition:
Fixed and variable rate income securities 173 210
2014From
Level 1 toLevel 2
£m
FromLevel 2 to
Level 1£m
Financial assets measured at fair value
Financial assets designated at fair value through profit or loss upon initial recognition:
Fixed and variable rate income securities 167 372
Collective investment schemes 2 –
Consistent with the prior year, all the Group’s Level 1 and Level 2 assets have been valued using standard market pricing sources.
The application of the Group’s fair value hierarchy classification methodology at an individual security level, in particular observations with regard to measures of market depth and bid-ask spreads, have resulted in an overall net movement of financial assets from Level 2 to Level 1 in the current and comparative periods.
Phoenix Group Holdings Annual Report and Accounts 2015126
NOTES TO THE IFRS CONSOLIDATEDFINANCIAL STATEMENTSContinued
E. FINANCIAL ASSETS & LIABILITIES continued
E2. FAIR VALUE HIERARCHY continued
E2.5 Movement in Level 3 financial instruments measured at fair value
2015
At 1 January
2015£m
Total (losses)/gains in income
statement£m
Purchases£m
Sales£m
Transfers from
Level 1 and Level 2
£m
Transfers to
Level 1 and Level 2
£m
At 31 December
2015£m
Unrealised (losses)/gains on
assets held at end of
period £m
Financial assets
Financial assets designated at fair value through profit or loss upon initial recognition:
Loans and receivables – (15) 298 (15) – – 268 (12)
Equities 704 (26) 79 (152) 4 (3) 606 (9)
Investment in joint venture 133 16 – – – – 149 16
Fixed and variable rate income securities 735 (34) 378 (724) – (25) 330 (26)
Collective investment schemes 81 10 28 (37) – – 82 5
1,653 (49) 783 (928) 4 (28) 1,435 (26)
Less amounts classified as held for sale (see note I1.2) (133) (16) – – – – (149) –
Total financial assets 1,520 (65) 783 (928) 4 (28) 1,286 (26)
At 1 January
2015£m
Totallosses in income
statement£m
Purchases£m
Sales£m
Transfers from
Level 1 and Level 2
£m
Transfers to
Level 1 and Level 2
£m
At 31 December
2015£m
Unrealised losses on liabilities
held at end of period
£m
Financial liabilities
Derivatives 1 – – – – (1) – –
Financial liabilities designated at fair value through profit or loss upon initial recognition:
Borrowings 184 37 – (27) – – 194 37
Total financial liabilities 185 37 – (27) – (1) 194 37
Phoenix Group Holdings Annual Report and Accounts 2015 127Financials
2014
At 1 January
2014£m
Totalgains in income
statement£m
Purchases£m
Sales£m
Transfers from
Level 1 and Level 2
£m
Transfers to
Level 1 and Level 2
£m
At 31 December
2014£m
Unrealised gains on
assets held at end of period
£m
Financial assets
Financial assets designated at fair value through profit or loss upon initial recognition:
Equities 628 40 95 (59) – – 704 60
Investment in joint venture 125 8 – – – – 133 8
Fixed and variable rate income securities 935 57 427 (502) 8 (190) 735 19
Collective investment schemes 116 5 5 (45) – – 81 5
Total financial assets 1,804 110 527 (606) 8 (190) 1,653 92
At 1 January
2014£m
Total (gains)/losses in income
statement£m
Purchases£m
Sales£m
Transfers from
Level 1 and Level 2
£m
Transfers to
Level 1 and Level 2
£m
At 31 December
2014£m
Unrealised losses on
liabilities held at end of
period£m
Financial liabilities
Derivatives 3 (2) – – – – 1 1
Financial liabilities designated at fair value through profit or loss upon initial recognition:
Borrowings 186 22 – (24) – – 184 22
Total financial liabilities 189 20 – (24) – – 185 23
Updates to the Group’s observations with regard to measures of market depth, bid-ask spreads and the extent to which inputs to the valuation of fixed and variable rate income securities are market observable resulted in a net transfer of financial assets from Level 3 to Level 1 and 2 in both periods.
Gains and losses on Level 3 financial instruments are included in net investment income in the consolidated income statement. There were no gains or losses recognised in other comprehensive income in either the current or comparative periods.
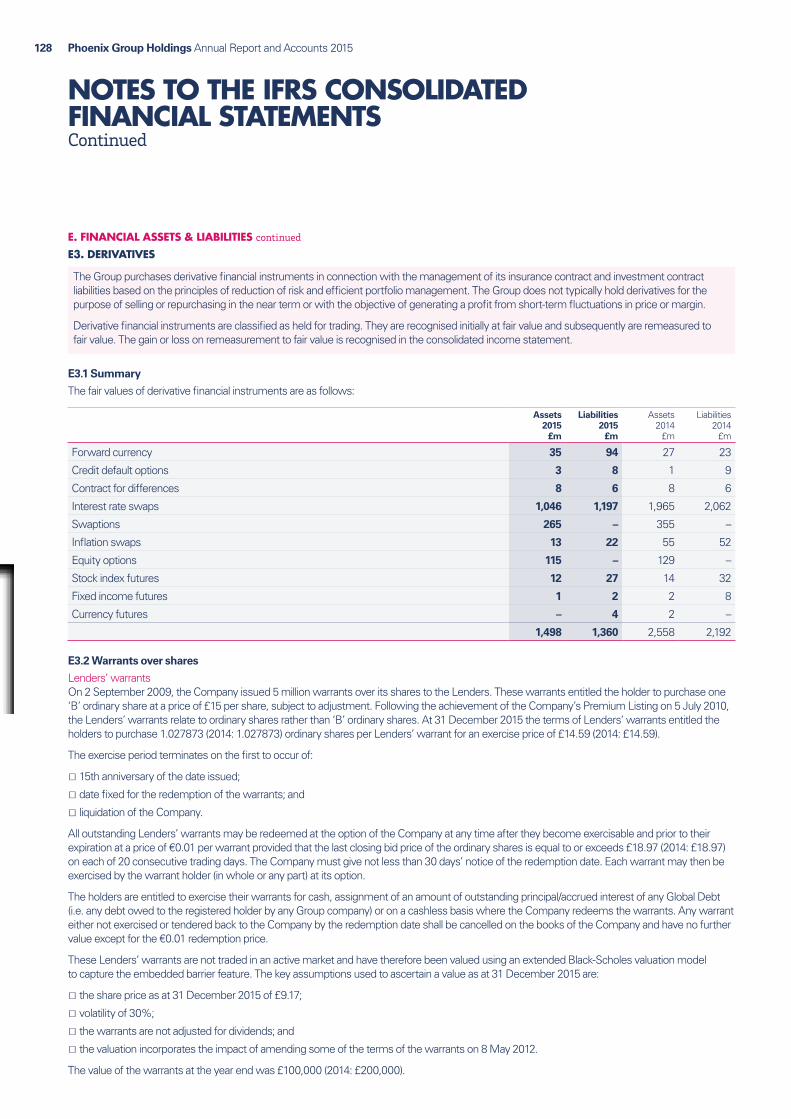
Phoenix Group Holdings Annual Report and Accounts 2015128
NOTES TO THE IFRS CONSOLIDATEDFINANCIAL STATEMENTSContinued
E. FINANCIAL ASSETS & LIABILITIES continued
E3. DERIVATIVES
The Group purchases derivative financial instruments in connection with the management of its insurance contract and investment contract liabilities based on the principles of reduction of risk and efficient portfolio management. The Group does not typically hold derivatives for the purpose of selling or repurchasing in the near term or with the objective of generating a profit from short-term fluctuations in price or margin.
Derivative financial instruments are classified as held for trading. They are recognised initially at fair value and subsequently are remeasured to fair value. The gain or loss on remeasurement to fair value is recognised in the consolidated income statement.
E3.1 Summary
The fair values of derivative financial instruments are as follows:
Assets 2015
£m
Liabilities 2015
£m
Assets 2014
£m
Liabilities 2014
£m
Forward currency 35 94 27 23
Credit default options 3 8 1 9
Contract for differences 8 6 8 6
Interest rate swaps 1,046 1,197 1,965 2,062
Swaptions 265 – 355 –
Inflation swaps 13 22 55 52
Equity options 115 – 129 –
Stock index futures 12 27 14 32
Fixed income futures 1 2 2 8
Currency futures – 4 2 –
1,498 1,360 2,558 2,192
E3.2 Warrants over shares
Lenders’ warrantsOn 2 September 2009, the Company issued 5 million warrants over its shares to the Lenders. These warrants entitled the holder to purchase one ‘B’ ordinary share at a price of £15 per share, subject to adjustment. Following the achievement of the Company’s Premium Listing on 5 July 2010, the Lenders’ warrants relate to ordinary shares rather than ‘B’ ordinary shares. At 31 December 2015 the terms of Lenders’ warrants entitled the holders to purchase 1.027873 (2014: 1.027873) ordinary shares per Lenders’ warrant for an exercise price of £14.59 (2014: £14.59).
The exercise period terminates on the first to occur of:
Ɛ 15th anniversary of the date issued;
Ɛ date fixed for the redemption of the warrants; and
Ɛ liquidation of the Company.
All outstanding Lenders’ warrants may be redeemed at the option of the Company at any time after they become exercisable and prior to their expiration at a price of €0.01 per warrant provided that the last closing bid price of the ordinary shares is equal to or exceeds £18.97 (2014: £18.97) on each of 20 consecutive trading days. The Company must give not less than 30 days’ notice of the redemption date. Each warrant may then be exercised by the warrant holder (in whole or any part) at its option.
The holders are entitled to exercise their warrants for cash, assignment of an amount of outstanding principal/accrued interest of any Global Debt (i.e. any debt owed to the registered holder by any Group company) or on a cashless basis where the Company redeems the warrants. Any warrant either not exercised or tendered back to the Company by the redemption date shall be cancelled on the books of the Company and have no further value except for the €0.01 redemption price.
These Lenders’ warrants are not traded in an active market and have therefore been valued using an extended Black-Scholes valuation model to capture the embedded barrier feature. The key assumptions used to ascertain a value as at 31 December 2015 are:
Ɛ the share price as at 31 December 2015 of £9.17;
Ɛ volatility of 30%;
Ɛ the warrants are not adjusted for dividends; and
Ɛ the valuation incorporates the impact of amending some of the terms of the warrants on 8 May 2012.
The value of the warrants at the year end was £100,000 (2014: £200,000).
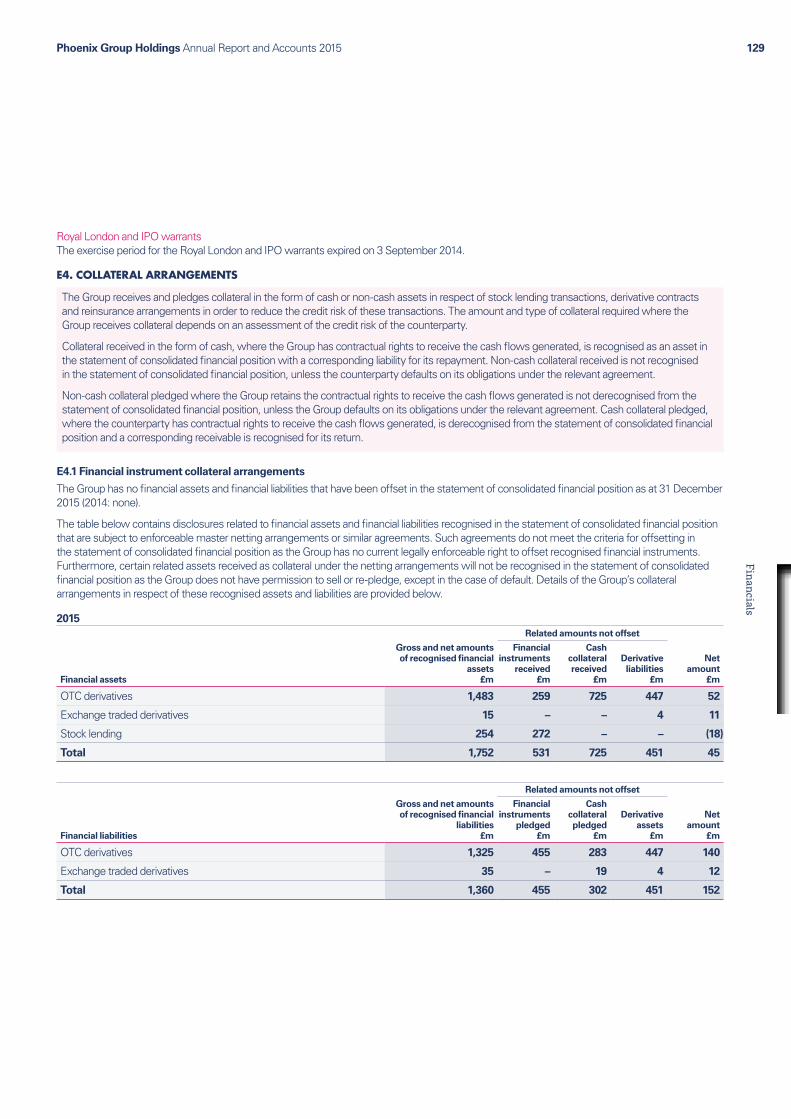
Phoenix Group Holdings Annual Report and Accounts 2015 129Financials
Royal London and IPO warrantsThe exercise period for the Royal London and IPO warrants expired on 3 September 2014.
E4. COLLATERAL ARRANGEMENTS
The Group receives and pledges collateral in the form of cash or non-cash assets in respect of stock lending transactions, derivative contracts and reinsurance arrangements in order to reduce the credit risk of these transactions. The amount and type of collateral required where the Group receives collateral depends on an assessment of the credit risk of the counterparty.
Collateral received in the form of cash, where the Group has contractual rights to receive the cash flows generated, is recognised as an asset in the statement of consolidated financial position with a corresponding liability for its repayment. Non-cash collateral received is not recognised in the statement of consolidated financial position, unless the counterparty defaults on its obligations under the relevant agreement.
Non-cash collateral pledged where the Group retains the contractual rights to receive the cash flows generated is not derecognised from the statement of consolidated financial position, unless the Group defaults on its obligations under the relevant agreement. Cash collateral pledged, where the counterparty has contractual rights to receive the cash flows generated, is derecognised from the statement of consolidated financial position and a corresponding receivable is recognised for its return.
E4.1 Financial instrument collateral arrangements
The Group has no financial assets and financial liabilities that have been offset in the statement of consolidated financial position as at 31 December 2015 (2014: none).
The table below contains disclosures related to financial assets and financial liabilities recognised in the statement of consolidated financial position that are subject to enforceable master netting arrangements or similar agreements. Such agreements do not meet the criteria for offsetting in the statement of consolidated financial position as the Group has no current legally enforceable right to offset recognised financial instruments. Furthermore, certain related assets received as collateral under the netting arrangements will not be recognised in the statement of consolidated financial position as the Group does not have permission to sell or re-pledge, except in the case of default. Details of the Group’s collateral arrangements in respect of these recognised assets and liabilities are provided below.
2015Related amounts not offset
Financial assets
Gross and net amounts of recognised financial
assets £m
Financial instruments
received £m
Cash collateral received
£m
Derivative liabilities
£m
Net amount
£m
OTC derivatives 1,483 259 725 447 52
Exchange traded derivatives 15 – – 4 11
Stock lending 254 272 – – (18)
Total 1,752 531 725 451 45
Related amounts not offset
Financial liabilities
Gross and net amounts of recognised financial
liabilities £m
Financial instruments
pledged £m
Cash collateral pledged
£m
Derivative assets
£m
Net amount
£m
OTC derivatives 1,325 455 283 447 140
Exchange traded derivatives 35 – 19 4 12
Total 1,360 455 302 451 152

Phoenix Group Holdings Annual Report and Accounts 2015130
NOTES TO THE IFRS CONSOLIDATEDFINANCIAL STATEMENTSContinued
The maximum exposure to credit risk in respect of OTC derivative assets is £1,483 million (2014: £2,540 million) of which credit risk of £1,408 million (2014: £2,353 million) is mitigated by use of collateral arrangements (which are settled net after taking account of any OTC derivative liabilities owed to the counterparty).
Credit risk on exchange traded derivative assets of £15 million (2014: £18 million) is mitigated through regular margining and the protection offered by the exchange.
Assets pledgedThe Group pledges collateral in respect of its OTC derivative liabilities. The value of assets pledged at 31 December 2015 in respect of OTC derivative liabilities of £1,325 million (2014: £2,152 million) amounted to £738 million (2014: £961 million).
E4.3 Stock lending collateral arrangements
Certain of the Group’s consolidated collective investment schemes lend financial assets held in their investment portfolios to other institutions.
The consolidated collective investment schemes conduct stock lending only with well-established, reputable institutions in accordance with established market conventions. The financial assets do not qualify for derecognition as the Group retains all the risks and rewards of the transferred assets except for the voting rights.
It is the Group’s practice to obtain collateral in stock lending transactions, usually in the form of cash or marketable financial instruments.
The fair value of financial assets accepted as such collateral but not recognised in the statement of financial position amounts to £272 million (2014: £152 million).
No collateral has been accepted in the form of cash as at 31 December 2015 (2014: £3 million).
E. FINANCIAL ASSETS & LIABILITIES continued
E4. COLLATERAL ARRANGEMENTS continued
2014Related amounts not offset
Financial assets
Gross and net amounts of recognised
financial assets £m
Financial instruments
received £m
Cash collateral received
£m
Derivative liabilities
£m
Net amount
£m
OTC derivatives 2,540 405 870 1,082 183
Exchange traded derivatives 18 – – 9 9
Stock lending 143 152 3 – (12)
Repurchase arrangements 84 – 84 – –
Total 2,785 557 957 1,091 180
Related amounts not offset
Financial liabilities
Gross and net amounts of recognised
financial liabilities£m
Financial instruments
pledged £m
Cash collateral pledged
£m
Derivative assets
£m
Net amount
£m
OTC derivatives 2,152 424 537 1,082 109
Exchange traded derivatives 40 – 29 9 2
Total 2,192 424 566 1,091 111
E4.2 Derivative collateral arrangements
Assets acceptedIt is the Group’s practice to obtain collateral to mitigate the counterparty risk related to over-the-counter (‘OTC’) derivatives usually in the form of cash or marketable financial instruments.
The fair value of financial assets accepted as collateral for OTC derivatives but not recognised in the statement of consolidated financial position amounts to £259 million (2014: £405 million).
The amounts recognised as financial assets and liabilities from cash collateral received at 31 December 2015 are set out below.
OTC derivatives
2015£m
2014£m
Financial assets 725 870
Financial liability (725) (870)

Phoenix Group Holdings Annual Report and Accounts 2015 131Financials
The maximum exposure to credit risk in respect of stock lending transactions is £254 million (2014: £143 million) of which credit risk of £254 million (2014: £143 million) is mitigated through the use of collateral arrangements.
E4.4 Repurchase agreements
In November 2014, the Group entered into agreements to sell securities in the form of UK Treasury Stocks to another party with an agreement to repurchase these stocks at an agreed date and price in the future. This arrangement was wound down during 2015 and no related balances are recognised in the statement of consolidated financial position at 31 December 2015.
The repurchase arrangement was in substance a short-term collateralised cash loan with the securities being used as collateral. These arrangements were completed only with well-established, reputable institutions in accordance with established market conventions.
Collateral provided did not qualify for derecognition as the Group retained the risk and rewards, although the counterparty had the right to sell or repledge the assets. The carrying value of the listed financial assets transferred that were not derecognised as at 31 December 2014 was £84 million of fixed and variable interest rate securities.
The maximum exposure to credit risk in respect of these repurchase transactions as at 31 December 2014 was £84 million and this was fully mitigated through the use of collateral arrangements.
E4.5 Other collateral arrangements
Collateral has also been pledged and charges granted in respect of certain of the Group’s borrowings. The details of these arrangements are set out in note E5.
E5. BORROWINGS
The Group classifies the majority of its interest bearing borrowings as financial liabilities carried at amortised cost and these are recognised initially at fair value less any attributable transaction costs. The difference between initial cost and the redemption value is amortised through the consolidated income statement over the period of the borrowing using the effective interest method.
Certain borrowings are designated upon initial recognition at fair value through profit or loss and measured at fair value where doing so provides more meaningful information due to the reasons stated in the financial liabilities accounting policy (see note E1). Transaction costs relating to borrowings designated upon initial recognition at fair value through profit or loss are expensed as incurred.
Borrowings are classified as either policyholder or shareholder borrowings. Policyholder borrowings are those attributable to with-profit operations and are held by the with-profit funds. Shareholder exposure to these borrowings is limited to their participation in these with-profit funds.
Carrying value Fair value
2015£m
2014£m
2015£m
2014£m
Limited recourse bonds 2022 7.59% (note a) 66 73 74 92
Property Reversions loan (note b) 194 184 194 184
£80 million facility agreement (note c) – 80 – 80
£150 million term facility (note d) 148 150 148 150
£100 million facility agreement (note e) 99 – 99 –
Total policyholder borrowings 507 487 515 506
£200 million 7.25% unsecured subordinated loan (note f) 158 149 212 212
£300 million senior unsecured bond (note g) 298 298 324 324
£450 million revolving credit facility (note h) 443 441 450 450
£450 million amortising term loan (note h) 199 387 200 390
£428 million subordinated loans (note i) 393 – 400 –
Total shareholder borrowings 1,491 1,275 1,586 1,376
Total borrowings 1,998 1,762 2,101 1,882
Amount due for settlement after 12 months 1,966 1,609

Phoenix Group Holdings Annual Report and Accounts 2015132
NOTES TO THE IFRS CONSOLIDATEDFINANCIAL STATEMENTSContinued
E. FINANCIAL ASSETS & LIABILITIES continued
E5. BORROWINGS continued
a. In 1998, Mutual Securitisation plc raised £260 million of capital through the securitisation of embedded value on a block of existing unit-linked and unitised with-profit life and pension policies. The bonds were split between two classes, which rank pari passu, and were listed on the Irish Stock Exchange The £140 million 7.39% class A1 limited recourse bonds matured in 2012 with no remaining outstanding principal. The £120 million 7.59% class A2 limited recourse bonds with an outstanding principal of £83 million (2014: £94 million) have an average remaining life of 3 years maturing in 2022. PLAL has provided collateral of £34 million (2014: £39 million) to provide security to the holders of the recourse bonds in issue. During 2015, repayments totalling £11 million were made (2014: £11 million).
b. The Property Reversions loan from Santander UK plc (‘Santander’) was brought into the consolidated financial statements at fair value. It relates to the sale of Extra-Income Plan policies that Santander finances to the value of the associated property reversions. As part of the arrangement Santander receive an amount calculated by reference to the movement in the Halifax House Price Index and the Group is required to indemnify Santander against profits or losses arising from mortality or surrender experience which differs from the basis used to calculate the reversion amount. Repayment will be on a policy-by-policy basis and is expected to occur over the next 10 to 20 years. During 2015, repayments totalling £27 million were made (2014: £24 million). Note G9 contains details of the assets that support this loan.
c. In 2008, UKCPT entered into an £80 million revolving loan facility agreement. This loan accrues interest at LIBOR plus a variable margin of 0.50% to 0.60% per annum. The lender holds a floating charge over certain assets of UKCPT and its subsidiaries. This facility was due for repayment on 19 June 2015 and was refinanced on 2 April 2015 (see note e).
d. On 19 May 2011, UKCPT entered into a £150 million investment term loan facility agreement. The £150 million investment term loan facility agreement accrued interest at LIBOR plus a variable margin of 1.60% to 2.00% per annum. The lender holds security over the assets of UK Commercial Property Estates Holdings Limited and UK Commercial Property Estates Limited, both of which are subsidiaries of UKCPT. On 8 April 2015, UKCPT amended the agreement, extending the repayment date to April 2020. The facility now accrues interest at LIBOR plus a margin of 1.50% per annum. The amendment includes the provision of a five year additional revolving credit facility of up to £50 million. As at 31 December 2015, the main facility was fully drawn down (2014: Fully drawn down) and the additional facility had not been drawn down.
e. On 2 April 2015, UK Commercial Property Finance Holdings Limited, a wholly-owned subsidiary of UKCPT, entered into a new £100 million 12-year fixed rate term loan facility agreement with Cornerstone Real Estate Advisers Europe LLP. This facility accrues interest at a rate of 3.03% per annum. The lender holds security over the assets of the UK Commercial Property Finance Holdings Limited and a further subsidiary of UKCPT. As at 31 December 2015, the facility was fully drawn down.
f. Scottish Mutual Assurance Limited issued £200 million 7.25% undated, unsecured subordinated loan notes on 23 July 2001 (‘PLL subordinated debt’). The earliest repayment date of the notes is 25 March 2021 and thereafter on each fifth anniversary so long as the notes are outstanding. With effect from 1 January 2009, as a part of a Part VII transfer, these loan notes were transferred into the shareholder fund of PLL. In the event of the winding-up of PLL, the right of payment under the notes is subordinated to the rights of the higher-ranking creditors (principally policyholders). As a result of the acquisition of the Phoenix Life businesses in 2009, these subordinated loan notes were acquired at their fair value and as such, the outstanding principal of these subordinated loan notes differs from the carrying value in the statement of consolidated financial position. The fair value adjustments, which were recognised on acquisition, will unwind over the remaining life of these subordinated loan notes.
With effect from 23 December 2014, minor modifications were made to the terms of the notes to enable them to qualify as Tier 2 capital for regulatory reporting purposes. Expenses incurred in effecting these modifications amounted to £10 million. Given the modifications were not substantial, the carrying amount of the liability was adjusted accordingly and the expenses are being amortised over the life of the notes.
g. On 7 July 2014, the Group’s financing subsidiary, PGH Capital Limited, issued a £300 million 7 year senior unsecured bond at an annual coupon rate of 5.75% (‘PGH Capital senior bond’). The senior bond is subject to guarantee by the Company.
h. On 23 July 2014, PGH Capital Limited entered into a £900 million 5 year unsecured bank facility (‘PGH Capital facility’). The facility comprises a £450 million revolving credit facility (‘RCF’) loan and a £450 million amortising term loan of which £200 million remained outstanding at 31 December 2015. Both loans are guaranteed by the Company and are repayable by July 2019 with an option to request an extension to the term of the RCF loan by two years to July 2021. Further terms of the facilities agreement include:
(i) term facility repayment instalments of £30 million are due semi-annually on 30 June and 31 December each year. Additional target repayments of £30 million may be paid semi-annually on 30 June and 31 December each year, non-payment of which would trigger restrictions on the Group regarding the declaration of dividends;
(ii) the term loan and RCF loan bear interest at LIBOR plus a margin which changes in accordance with a margin ratchet which operates by reference to the Group’s gearing ratio. As at 31 December 2015 the margin on the term loan was 2.625% and the margin on the RCF loan was 2.375%; and
(iii) amongst other fees, a utilisation fee of 0.25% p.a. is payable in respect of the RCF loan for so long as the amount outstanding under the RCF exceeds 50% of the total commitments of the RCF loan.
During 2015, a £190 million repayment was made in respect of targeted and mandatory repayments on the £450 million amortising term loan including prepayments of £70 million in respect of payments due in 2016 and £30 million in respect of payments due in 2017.
In March 2016, the Group agreed an amendment of the PGH Capital facility into a revolving credit facility (the ‘PGH Capital revolving credit facility’), details of which are included in note I9.

Phoenix Group Holdings Annual Report and Accounts 2015 133Financials
i. On 23 January 2015, PGH Capital Limited issued £428 million of subordinated notes (‘PGH Capital subordinated notes’) due 2025 at a coupon of 6.625%. Upon exchange £32 million of these notes were held and continued to be held as at 31 December 2015 by Group companies. Fees associated with these notes of £3 million have been deferred and amortised over the life of the notes in the condensed statement of consolidated financial position. The notes are subject to a subordinated guarantee by the Company.
E6. RISK MANAGEMENT – FINANCIAL RISKThis note forms one part of the risk management disclosures in the consolidated financial statements. The Group’s management of insurance risk is detailed in note F4.
E6.1 Financial risk and the asset liability management (‘ALM’) framework
The use of financial instruments naturally exposes the Group to the risks associated with them, mainly, market risk, credit risk and financial soundness risk.
Responsibility for agreeing the financial risk profile rests with the board of each life company, as advised by investment managers, internal committees and the actuarial function. In setting the risk profile, the board of each life company will receive advice from the appointed investment managers, the relevant with-profit actuary and the relevant actuarial function holder as to the potential implications of that risk profile with regard to the probability of both realistic insolvency and of failing to meet the regulatory minimum capital requirement. The actuarial function holder will also advise the extent to which the investment risk taken is consistent with the Group’s commitment to treat customers fairly.
Derivatives are used in many of the Group’s funds, within policy guidelines agreed by the Board of each life company and overseen by investment committees of the Boards of each life company supported by management oversight committees. Derivatives are primarily used for risk hedging purposes or for efficient portfolio management, including the activities of the Group’s Treasury function.
More detail on the Group’s exposure to financial risk is provided in note E6.2 below.
The Group is also exposed to insurance risk arising from its Phoenix Life segment. Life insurance risk in the Group arises through its exposure to longevity, persistency, mortality and to other variances between assumed and actual experience. These variances can be in factors such as persistency levels and management and administrative expenses. More detail on the Group’s exposure to insurance risk is provided in note F4.
The Group’s overall exposure to market and credit risk is monitored by appropriate committees, which agree policies for managing each type of risk on an ongoing basis, in line with the investment strategy developed to achieve investment returns in excess of amounts due in respect of insurance contracts. The effectiveness of the Group’s ALM relies on the matching of assets and liabilities arising from insurance and investment contracts, taking into account the types of benefits payable to policyholders under each type of contract. Separate portfolios of assets are maintained for with-profit business funds, (which includes all of the Group’s participating business), non-linked non-profit funds and unit-linked funds.
E6.2 Financial risk analysis
Transactions in financial instruments result in the Group assuming financial risks. These include credit risk, market risk and financial soundness risk. Each of these are described below, together with a summary of how the Group manages them.
E6.2.1 Credit risk
Credit risk is the risk that one party to a financial instrument will cause a financial loss for the other party by failing to discharge an obligation. These obligations can relate to both on and off balance sheet assets and liabilities.
There are two principal sources of credit risk for the Group:
Ɛ credit risk which results from direct investment activities, including investments in fixed and variable rate income securities, derivatives, collective investment schemes and the placing of cash deposits; and
Ɛ credit risk which results indirectly from activities undertaken in the normal course of business. Such activities include premium payments, outsourcing contracts, reinsurance, exposure from material suppliers and the lending of securities.
The amount disclosed in the statement of consolidated financial position in respect of all financial assets, together with rights secured under off balance sheet collateral arrangements, and excluding those that back unit-linked liabilities, represents the Group’s maximum exposure to credit risk.
The impact of non-government fixed and variable rate income securities and, inter alia, the change in market credit spreads during the year is fully reflected in the values shown in these financial statements. Credit spreads are the excess of corporate bond yields over gilt yields to reflect the higher level of risk. Similarly, the value of derivatives that the Group holds takes into account fully the changes in swap rates.
There is an exposure to spread changes affecting the prices of corporate bonds and derivatives. This exposure applies to with-profit funds, non-profit funds (where risks and rewards fall wholly to shareholders) and shareholders’ funds.
The Group holds £3,942 million (2014: £3,589 million) of corporate bonds which are used to back annuity liabilities in non-profit funds. These annuity liabilities include an aggregate credit default provision of £214 million (2014: £266 million) to fund against the risk of default.
A 100bps widening of credit spreads, with all other variables held constant and no change in assumed expected defaults, would result in a decrease in the profit after tax in respect of a full financial year, and in equity, of £55 million (2014: £97 million).
A 100bps narrowing of credit spreads, with all other variables held constant and no change in assumed expected defaults, would result in an increase in the profit after tax in respect of a full financial year, and in equity, of £62 million (2014: £102 million).
Credit risk is managed by the monitoring of aggregate Group exposures to individual counterparties and by appropriate credit risk diversification. The Group manages the level of credit risk it accepts through credit risk tolerances. In certain cases, protection against exposure to particular credit risk types may be achieved through the use of derivatives. The credit risk borne by the shareholder on with-profit policies is dependent on the extent to which the underlying insurance fund is relying on shareholder support.
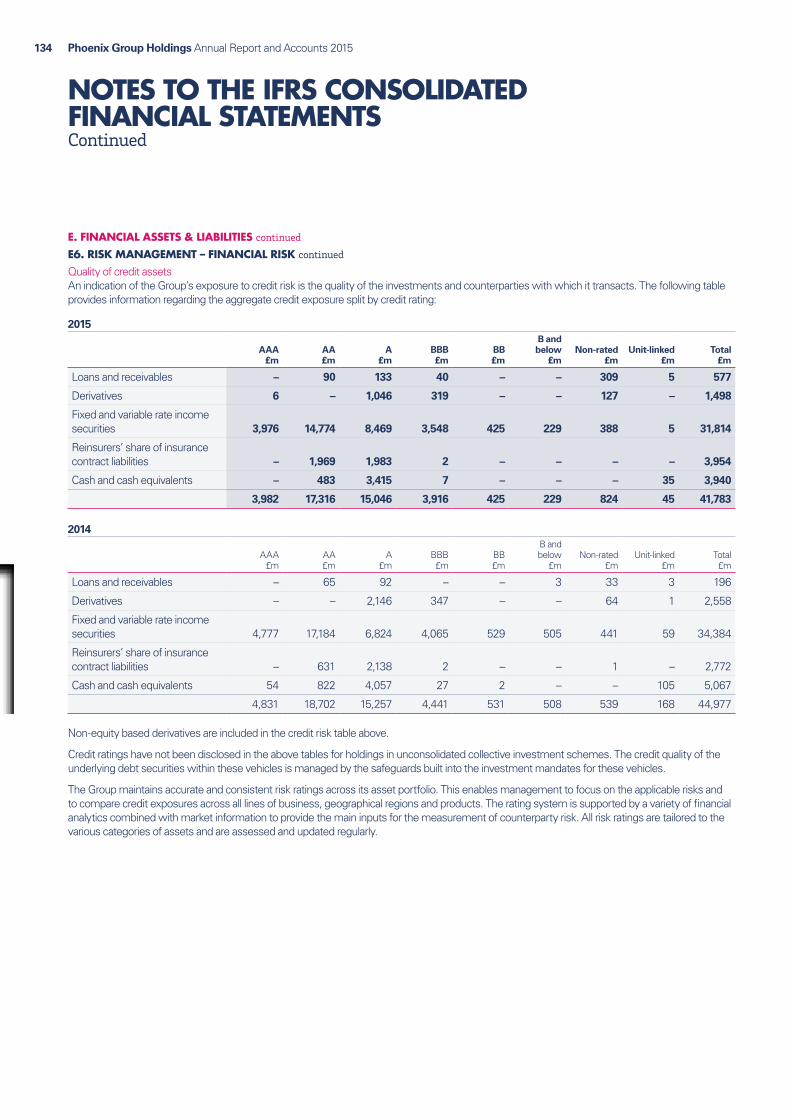
Phoenix Group Holdings Annual Report and Accounts 2015134
NOTES TO THE IFRS CONSOLIDATEDFINANCIAL STATEMENTSContinued
E. FINANCIAL ASSETS & LIABILITIES continued
E6. RISK MANAGEMENT – FINANCIAL RISK continued
Quality of credit assetsAn indication of the Group’s exposure to credit risk is the quality of the investments and counterparties with which it transacts. The following table provides information regarding the aggregate credit exposure split by credit rating:
2015
AAA £m
AA £m
A £m
BBB £m
BB £m
B and below
£mNon-rated
£mUnit-linked
£mTotal
£m
Loans and receivables – 90 133 40 – – 309 5 577
Derivatives 6 – 1,046 319 – – 127 – 1,498
Fixed and variable rate income securities 3,976 14,774 8,469 3,548 425 229 388 5 31,814
Reinsurers’ share of insurance contract liabilities – 1,969 1,983 2 – – – – 3,954
Cash and cash equivalents – 483 3,415 7 – – – 35 3,940
3,982 17,316 15,046 3,916 425 229 824 45 41,783
2014
AAA £m
AA £m
A £m
BBB £m
BB £m
B and below
£mNon-rated
£mUnit-linked
£mTotal£m
Loans and receivables – 65 92 – – 3 33 3 196
Derivatives – – 2,146 347 – – 64 1 2,558
Fixed and variable rate income securities 4,777 17,184 6,824 4,065 529 505 441 59 34,384
Reinsurers’ share of insurance contract liabilities – 631 2,138 2 – – 1 – 2,772
Cash and cash equivalents 54 822 4,057 27 2 – – 105 5,067
4,831 18,702 15,257 4,441 531 508 539 168 44,977
Non-equity based derivatives are included in the credit risk table above.
Credit ratings have not been disclosed in the above tables for holdings in unconsolidated collective investment schemes. The credit quality of the underlying debt securities within these vehicles is managed by the safeguards built into the investment mandates for these vehicles.
The Group maintains accurate and consistent risk ratings across its asset portfolio. This enables management to focus on the applicable risks and to compare credit exposures across all lines of business, geographical regions and products. The rating system is supported by a variety of financial analytics combined with market information to provide the main inputs for the measurement of counterparty risk. All risk ratings are tailored to the various categories of assets and are assessed and updated regularly.

Phoenix Group Holdings Annual Report and Accounts 2015 135Financials
A further indicator of the quality of the Group’s financial assets is the extent to which they are neither past due nor impaired. The following table gives information regarding the ageing of financial assets that are past due but not impaired and the carrying value of financial assets that have been impaired.
2015Neither
past due nor
impaired £m
Less than 30 days
£m30–90 days
£m
Greater than
90 days £m
Impaired £m
Unit-linked £m
Carrying value
£m
Loans and receivables 572 – – – – 5 577
Derivatives 1,498 – – – – – 1,498
Fixed and variable rate income securities 31,795 – – 2 12 5 31,814
Reinsurers’ share of insurance contract liabilities 3,954 – – – – – 3,954
Reinsurance receivables 29 – – – – – 29
Prepayments and accrued income 335 – – – – – 335
Other receivables 474 – – – – – 474
Cash and cash equivalents 3,905 – – – – 35 3,940
2014Neither past
due nor impaired
£m
Less than 30 days
£m30–90 days
£m
Greater than
90 days £m
Impaired£m
Unit-linked £m
Carrying value
£m
Loans and receivables 190 – – – 3 3 196
Derivatives 2,557 – – – – 1 2,558
Fixed and variable rate income securities 34,325 – – – – 59 34,384
Reinsurers’ share of insurance contract liabilities 2,772 – – – – – 2,772
Reinsurance receivables 67 – – – – – 67
Prepayments and accrued income 405 – – – – – 405
Other receivables 750 – – – – – 750
Cash and cash equivalents 4,962 – – – – 105 5,067
Please refer to pages 199 to 205 for additional life company asset disclosures which include the life companies’ exposure to peripheral Eurozone debt securities. Peripheral Eurozone is defined as Portugal, Spain, Italy, Ireland and Greece. The Group’s exposure to peripheral Eurozone debt continues to be relatively small compared to total assets.
Assets backing unit-linked business have not been analysed in these tables as the credit risk on such financial assets is borne by the policyholders. However, these assets have been included as a separate column in these tables to reconcile the information to the statement of consolidated financial position. Shareholder credit exposure on unit-linked assets is limited to the level of fee income to the extent it is dependent on the underlying assets.
Concentration of credit riskConcentration of credit risk might exist where the Group has significant exposure to an individual counterparty or a group of counterparties with similar economic characteristics that would cause their ability to meet contractual obligations to be similarly affected by changes in economic and other conditions. The Group has most of its counterparty risk within its life business and this is monitored by the counterparty limits contained within the investment guidelines and investment management agreements, overlaid by regulatory requirements and the monitoring of aggregate counterparty exposures across the Group against additional Group counterparty limits. Counterparty risk in respect of OTC derivative counterparties is monitored using a Value-at-Risk (VaR) exposure metric.
The Group is also exposed to concentration risk with outsource partners. This is due to the nature of the outsourced services market. The Group operates a policy to manage outsourcer service counterparty exposures and the impact from default is reviewed regularly by executive committees and measured though the ICA stress and scenario testing.

Phoenix Group Holdings Annual Report and Accounts 2015136
NOTES TO THE IFRS CONSOLIDATEDFINANCIAL STATEMENTSContinued
E. FINANCIAL ASSETS & LIABILITIES continued
E6. RISK MANAGEMENT – FINANCIAL RISK continued
CollateralThe credit risk of the Group is mitigated, in certain circumstances, by entering into collateral agreements. The amount and type of collateral required depends on an assessment of the credit risk of the counterparty. Guidelines are implemented regarding the acceptability of types of collateral and the valuation parameters. Collateral is mainly in respect of stock lending, certain reinsurance arrangements and to provide security against the maturity proceeds of derivative financial instruments. Management monitors the market value of the collateral received, requests additional collateral when needed, and performs an impairment valuation when impairment indicators exist and the asset is not fully secured (and is not carried at fair value). See note E4.1 for further information on collateral arrangements.
E6.2.2 Market risk
Market risk is the risk that the fair value or future cash flows of a financial instrument will fluctuate because of changes in market influences. Market risk comprises interest rate risk, currency risk and other price risk (comprising equity risk, property risk, inflation risk and alternative asset class risk).
The Group is mainly exposed to market risk as a result of:
Ɛ the mismatch between liability profiles and the related asset investment portfolios;
Ɛ the investment of surplus assets including shareholder reserves yet to be distributed, surplus assets within the with-profit funds and assets held to meet regulatory capital and solvency requirements; and
Ɛ the income flow of management charges from the invested assets of the business.
The Group manages the levels of market risk that it accepts through an approach to investment management that determines:
Ɛ the constituents of market risk for the Group;
Ɛ the basis used to fair value financial assets and liabilities;
Ɛ the asset allocation and portfolio limit structure;
Ɛ diversification from and within benchmarks by type of instrument and geographical area;
Ɛ the net exposure limits by each counterparty or group of counterparties, geographical and industry segments;
Ɛ control over hedging activities;
Ɛ reporting of market risk exposures and activities; and
Ɛ monitoring of compliance with market risk policy and review of market risk policy for pertinence to the changing environment.
All operations comply with regulatory requirements relating to the taking of market risk.
Interest rate riskInterest rate risk is the risk that the fair value of future cash flows of a financial instrument will fluctuate relative to the respective liability due to the impact of changes in market interest rates on the value of interest-bearing assets and on the value of future guarantees provided under certain contracts of insurance.
Interest rate risk is managed by matching assets and liabilities where practicable and by entering into derivative arrangements for hedging purposes where appropriate. This is particularly the case for the non-participating funds. For participating business, some element of investment mismatching is permitted where it is consistent with the principles of treating customers fairly. The with-profit funds of the Group provide capital to allow such mismatching to be effected. In practice, the life companies of the Group maintain an appropriate mix of fixed and variable rate instruments according to the underlying insurance or investment contracts and will review this at regular intervals to ensure that overall exposure is kept within the risk profile agreed for each particular fund. This also requires the maturity profile of these assets to be managed in line with the liabilities to policyholders.
The sensitivity analysis for interest rate risk indicates how changes in the fair value or future cash flows of a financial instrument arising from changes in market interest rates at the reporting date result in a change in profit after tax and in equity. It takes into account the effect of such changes in market interest rates on all assets and liabilities that contribute to the Group’s reported profit after tax and in equity (but excludes the impact on the Group’s pension schemes).
With-profit business and non-participating business within the with-profit funds are exposed to interest rate risk as guaranteed liabilities are valued relative to market interest rates and investments include fixed interest securities and derivatives. For with-profit business the profit or loss arising from mismatches between such assets and liabilities is largely offset by increased or reduced discretionary policyholder benefits dependent on the existence of policyholder guarantees. The contribution of these funds to the Group result is determined primarily by either the shareholders’ share of the declared annual bonus or by the shareholders’ interest in any change in value in the capital advanced to the Group’s with-profit funds.
In the non-participating funds, policy liabilities’ sensitivity to interest rates are matched primarily with fixed and variable rate income securities, with the result that sensitivity to changes in interest rates is very low.
As part of preparation for the new Solvency II regime, management has reviewed the matching position of assets and liabilities resulting in changes to the hedging position for certain asset portfolios. As a result an increase of 1% in interest rates, with all other variables held constant, would now result in a decrease in the profit after tax in respect of a full financial year, and in equity, of £89 million (2014: an increase of £24 million).
A decrease of 1% in interest rates, with all other variables held constant, would result in an increase in profit after tax in respect of a full financial year, and in equity, of £89 million (2014: a decrease of £52 million).

Phoenix Group Holdings Annual Report and Accounts 2015 137Financials
Equity, property and inflation riskThe Group has exposure to financial assets and liabilities whose values will fluctuate as a result of changes in market prices other than from interest rate and currency fluctuations. This is due to factors specific to individual instruments, their issuers or factors affecting all instruments traded in the market. Accordingly, the Group limits its exposure to any one counterparty in its investment portfolios and to any one foreign market.
The portfolio of marketable equity securities and property investments which is carried in the statement of consolidated financial position at fair value, has exposure to price risk. The Group’s objective in holding these assets is to earn higher long-term returns by investing in a diverse portfolio of equities and properties. Portfolio characteristics are analysed regularly and price risks are actively managed in line with investment mandates. The Group’s holdings are diversified across industries and concentrations in any one company or industry are limited.
Equity and property price risk is primarily borne in respect of assets held in with-profit or unit-linked funds. For unit-linked funds this risk is borne by policyholders and asset movements directly impact unit prices and hence policy values. For with-profit funds policyholders’ future bonuses will be impacted by the investment returns achieved and hence the price risk, whilst the Group also has exposure to the value of guarantees provided to with-profit policyholders. In addition some equity investments are held in respect of shareholders’ funds. The Group as a whole is exposed to price risk fluctuations impacting the income flow of management charges from the invested assets of all funds.
Equity and property price risk is managed through the agreement and monitoring of financial risk profiles that are appropriate for each of the Group’s life funds in respect of maintaining adequate regulatory capital and treating customers fairly. This is largely achieved through asset class diversification and within the Group’s ALM framework through the holding of derivatives or physical positions in relevant assets where appropriate.
The sensitivity analysis for equity and property price risk illustrates how a change in the fair value of equities and properties affects the Group result. It takes into account the effect of such changes in equity and property prices on all assets and liabilities that contribute to the Group’s reported profit after tax and in equity (but excludes the impact on the Group’s pension schemes).
A 10% decrease in equity prices, with all other variables held constant, would result in an increase in the profit after tax in respect of a full financial year, and in equity, of £48 million (2014: an increase of £36 million).
A 10% increase in equity prices, with all other variables held constant, would result in a decrease in the profit after tax in respect of a full financial year, and in equity, of £46 million (2014: a decrease of £36 million).
A 10% decrease in property prices, with all other variables held constant, would result in a decrease in the profit after tax in respect of a full financial year, and in equity, of £21 million (2014: a decrease of £27 million).
A 10% increase in property prices, with all other variables held constant, would result in an increase in the profit after tax in respect of a full financial year, and in equity, of £21 million (2014: an increase of £28 million).
The Group is exposed to inflation risk through certain contracts, such as annuities, which may provide for future benefits to be paid taking account of changes in the level of experienced and implied inflation, and also through the Group’s cost base. The Group seeks to manage inflation risk within the ALM framework through the holding of derivatives, such as inflation swaps, or physical positions in relevant assets, such as index linked gilts, where appropriate.
Currency riskThe Group’s principal transactions are carried out in sterling and therefore its exchange risk is limited principally to historic business that was written in the Republic of Ireland, where the assets are generally held in the same currency denomination as their liabilities, therefore, any foreign currency mismatch is largely mitigated. Consequently, the foreign currency risk relating to this business mainly arises when the assets and liabilities are translated into sterling.
The Group’s financial assets are primarily denominated in the same currencies as its insurance and investment liabilities. Thus, the main foreign exchange risk arises from recognised assets and liabilities denominated in currencies other than those in which insurance and investment liabilities are expected to be settled and, indirectly, from the earnings of UK companies arising abroad.
Certain Phoenix Life with-profit funds have an exposure to overseas assets which is not driven by liability considerations. The purpose of this exposure is to reduce overall risk whilst maximising returns by diversification. This exposure is limited and managed through investment mandates which are subject to the oversight of the investment committees of the Boards of each life company. Fluctuations in exchange rates from certain holdings in overseas assets are hedged against currency risks.
Sensitivity of profit after tax and equity to fluctuations in currency exchange rates is not considered significant at 31 December 2015, since unhedged exposure to foreign currency was relatively low (2014: not considered significant).

Phoenix Group Holdings Annual Report and Accounts 2015138
NOTES TO THE IFRS CONSOLIDATEDFINANCIAL STATEMENTSContinued
E. FINANCIAL ASSETS & LIABILITIES continued
E6. RISK MANAGEMENT – FINANCIAL RISK continued
E6.2.3 Financial soundness risk
Financial soundness risk is a broad risk category encompassing capital management risk, tax risk and liquidity and funding risk.
Capital management risk is defined as the failure of the Group, or one of its separately regulated subsidiaries, to maintain sufficient capital to provide appropriate security for policyholders and meet all regulatory capital requirements whilst not retaining unnecessary capital. The PLHL Group has exposure to capital management risk through the requirements of the new Solvency II capital regime, as implemented by the PRA, to calculate regulatory capital adequacy at a Group level. The Group’s UK life subsidiaries have exposure to capital management risk through the Solvency II regulatory capital requirements mandated by the PRA at the solo level. The Group’s approach to managing capital management risk is described in detail in note I4.
Tax risk is defined as the risk of financial or reputational loss arising from a lack of liquidity, funding or capital due to an unforeseen tax cost, or by the inappropriate reporting and disclosure of information in relation to taxation. Tax risk is managed by maintaining an appropriately-staffed tax team who have the qualifications and experience to make judgements on tax issues, augmented by advice from external specialists where required. The Group has a formal tax risk policy, which sets out its risk appetite in relation to specific aspects of tax risk, and which details the controls the Group has in place to manage those risks. These controls are subject to a regular review process. The Group’s subsidiaries have exposure to tax risk through the annual statutory and regulatory reporting and through the processing of policyholder tax requirements.
Liquidity and funding risk is defined as the failure of the Group to maintain adequate levels of financial resources to enable it to meet its obligations as they fall due. The Group has exposure to liquidity risk as a result of servicing its external debt and equity investors, and from the operating requirements of its subsidiaries. The Group’s subsidiaries have exposure to liquidity risk as a result of normal business activities, specifically the risk arising from an inability to meet short-term cash flow requirements.
The Board of Phoenix Group Holdings has defined a number of governance objectives and principles and the liquidity risk frameworks of each subsidiary are designed to ensure that:
Ɛ liquidity risk is managed in a manner consistent with the subsidiary company Boards’ strategic objectives, risk appetite and Principles and Practices of Financial Management (‘PPFM’);
Ɛ cash flows are appropriately managed and the reputation of the Group is safeguarded; and
Ɛ appropriate information on liquidity risk is available to those making decisions.
The Group’s policy is to maintain sufficient liquid assets of suitable credit quality at all times including, where appropriate, by having access to borrowings so as to be able to meet all foreseeable current liabilities as they fall due in a cost-effective manner. Forecasts are prepared regularly to predict required liquidity levels over both the short and medium term allowing management to respond appropriately to changes in circumstances.
The vast majority of the Group’s derivative contracts are traded OTC and have a two day collateral settlement period. The Group’s derivative contracts are monitored daily, via an end-of-day valuation process, to assess the need for additional funds to cover margin or collateral calls.
Some of the Group’s commercial property investments are held through collective investment schemes. The collective investment schemes have the power to restrict and/or suspend withdrawals, which would, in turn, affect liquidity. To date, the collective investment schemes have continued to process both investments and realisations in a normal manner and have not imposed any restrictions or delays.
Some of the Group’s cash and cash equivalents are held through collective investment schemes. The collective investment schemes have the power, in an extreme stress, to restrict and/or suspend withdrawals, which would, in turn, affect liquidity. To date, the collective investment schemes have continued to process both investments and realisations in a normal manner and have not imposed any restrictions or delays.
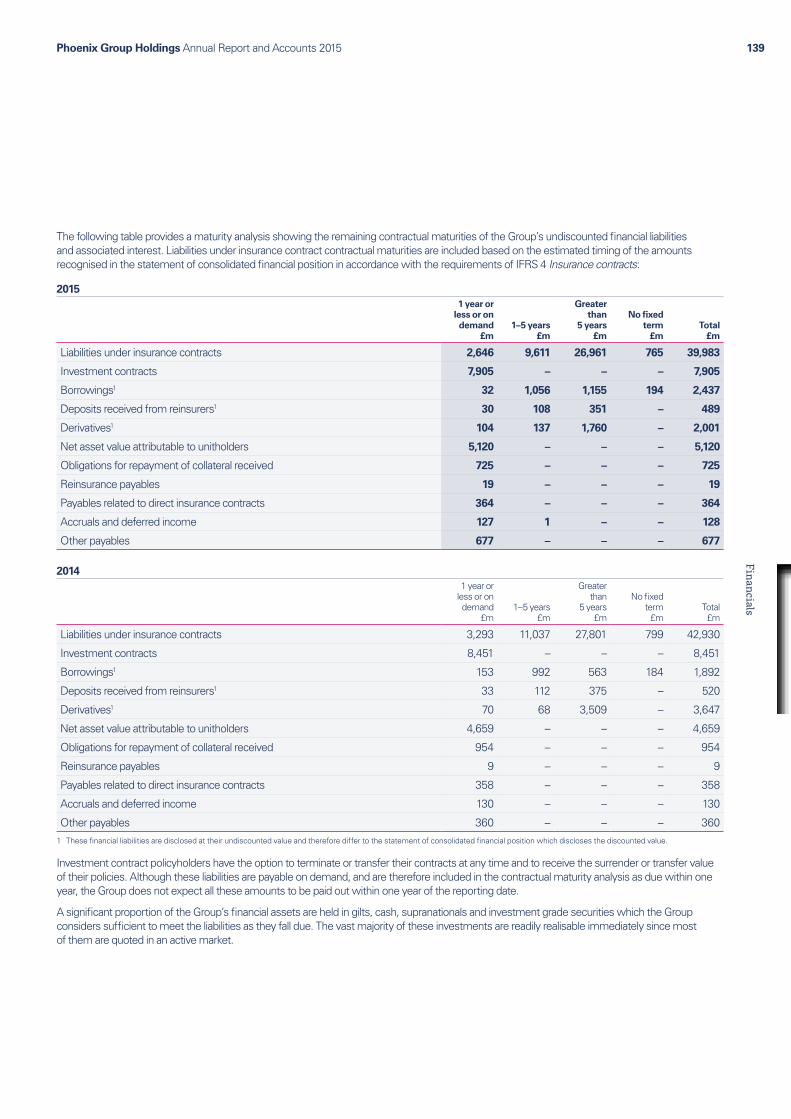
Phoenix Group Holdings Annual Report and Accounts 2015 139Financials
The following table provides a maturity analysis showing the remaining contractual maturities of the Group’s undiscounted financial liabilities and associated interest. Liabilities under insurance contract contractual maturities are included based on the estimated timing of the amounts recognised in the statement of consolidated financial position in accordance with the requirements of IFRS 4 Insurance contracts:
20151 year or
less or on demand
£m1–5 years
£m
Greater than
5 years £m
No fixed term
£mTotal
£m
Liabilities under insurance contracts 2,646 9,611 26,961 765 39,983
Investment contracts 7,905 – – – 7,905
Borrowings1 32 1,056 1,155 194 2,437
Deposits received from reinsurers1 30 108 351 – 489
Derivatives1 104 137 1,760 – 2,001
Net asset value attributable to unitholders 5,120 – – – 5,120
Obligations for repayment of collateral received 725 – – – 725
Reinsurance payables 19 – – – 19
Payables related to direct insurance contracts 364 – – – 364
Accruals and deferred income 127 1 – – 128
Other payables 677 – – – 677
20141 year or
less or on demand
£m1–5 years
£m
Greater than
5 years £m
No fixed term
£mTotal £m
Liabilities under insurance contracts 3,293 11,037 27,801 799 42,930
Investment contracts 8,451 – – – 8,451
Borrowings1 153 992 563 184 1,892
Deposits received from reinsurers1 33 112 375 – 520
Derivatives1 70 68 3,509 – 3,647
Net asset value attributable to unitholders 4,659 – – – 4,659
Obligations for repayment of collateral received 954 – – – 954
Reinsurance payables 9 – – – 9
Payables related to direct insurance contracts 358 – – – 358
Accruals and deferred income 130 – – – 130
Other payables 360 – – – 3601 These financial liabilities are disclosed at their undiscounted value and therefore differ to the statement of consolidated financial position which discloses the discounted value.
Investment contract policyholders have the option to terminate or transfer their contracts at any time and to receive the surrender or transfer value of their policies. Although these liabilities are payable on demand, and are therefore included in the contractual maturity analysis as due within one year, the Group does not expect all these amounts to be paid out within one year of the reporting date.
A significant proportion of the Group’s financial assets are held in gilts, cash, supranationals and investment grade securities which the Group considers sufficient to meet the liabilities as they fall due. The vast majority of these investments are readily realisable immediately since most of them are quoted in an active market.
Phoenix Group Holdings Annual Report and Accounts 2015140
NOTES TO THE IFRS CONSOLIDATEDFINANCIAL STATEMENTSContinued
E. FINANCIAL ASSETS & LIABILITIES continued
E6. RISK MANAGEMENT – FINANCIAL RISK continued
E6.3 Unit-linked contracts
For unit-linked contracts the Group matches all the liabilities with assets in the portfolio on which the unit prices are based. There is therefore no interest, price, currency or credit risk for the Group on these contracts.
In extreme circumstances, the Group could be exposed to liquidity risk in its unit-linked funds. This could occur where a high volume of surrenders coincides with a tightening of liquidity in a unit-linked fund to the point where assets of that fund have to be sold to meet those withdrawals. Where the fund affected consists of property, it can take several months to complete a sale and this would impede the proper operation of the fund. In these situations, the Group considers its risk to be low since there are steps that can be taken first within the funds themselves both to ensure the fair treatment of all investors in those funds and to protect the Group’s own risk exposure.
F. INSURANCE CONTRACTS, INVESTMENT CONTRACTS WITH DPF AND REINSURANCEF1. LIABILITIES UNDER INSURANCE CONTRACTS
Classification of contracts
Contracts under which the Group accepts significant insurance risk are classified as insurance contracts.
Contracts under which the transfer of insurance risk to the Group from the policyholder is not significant are classified as investment contracts, and accounted for as financial liabilities (see note E1).
Some insurance and investment contracts contain a DPF. This feature entitles the policyholder to additional discretionary benefits as a supplement to guaranteed benefits. Investment contracts with a DPF are recognised, measured and presented as insurance contracts.
Insurance contracts and investment contracts with DPF
Under current IFRS requirements the Group’s insurance contracts and investment contracts with DPF are measured using accounting policies consistent with those previously adopted under UK GAAP. Amounts recoverable from reinsurers are estimated in a manner consistent with the outstanding claims provision or settled claims associated with the reinsured policy.
Insurance liabilitiesInsurance contract liabilities for non-participating business, other than unit-linked insurance contracts, are calculated on the basis of current data and assumptions, using either a net premium or gross premium method. Where a gross premium method is used, the liability includes allowance for prudent lapses. Negative policy values are allowed for on individual policies:
Ɛ where there are no guaranteed surrender values; or
Ɛ in the periods where guaranteed surrender values do not apply even though guaranteed surrender values are applicable after a specified period of time.
For unit-linked insurance contract liabilities the provision is based on the fund value, together with an allowance for any excess of future expenses over charges, where appropriate.
For participating business, the liabilities under insurance contracts and investment contracts with DPF are calculated in accordance with the following methodology:
Ɛ liabilities to policyholders arising from the with-profit business are stated at the amount of the realistic value of the liabilities, adjusted to exclude the owners’ share of projected future bonuses;
Ɛ acquisition costs are not deferred; and
Ɛ reinsurance recoveries are measured on a basis that is consistent with the valuation of the liability to policyholders to which the reinsurance applies.
The with-profit bonus reserve for an individual contract is determined by either a retrospective calculation of ‘accumulated asset share’ approach or by way of a prospective ‘bonus reserve valuation’ method. The cost of future policy related liabilities is determined using a market consistent approach, mainly based on a stochastic model calibrated to market conditions at the end of the reporting period. Non-market related assumptions (for example, persistency, mortality and expenses) are based on experience adjusted to take into account of future trends.
The realistic liability for any contract is equal to the sum of the with-profit bonus reserve and the cost of future policy-related liabilities.
Where policyholders have valuable guarantees, options or promises in respect of the with-profit business, these costs are generally valued using a stochastic model.
In calculating the realistic liabilities, account is taken of the future management actions consistent with those set out in the Principles and Practices of Financial Management (‘PPFM’).
Present value of future profits on non-participating business in the with-profit fundsFor UK with-profit life funds, an amount may be recognised for the present value of future profits (‘PVFP’) on non-participating business written in a with-profit fund where the determination of the realistic value of liabilities in that with-profit fund takes account, directly or indirectly, of this value.
Where the value of future profits can be shown to be due to policyholders, this amount is recognised as a reduction in the liability rather than as an intangible asset. This is then apportioned between the amounts that have been taken into account in the measurement of liabilities and other amounts which are shown as an adjustment to the unallocated surplus.
Where it is not possible to apportion the future profits on this non-participating business to policyholders, the PVFP on this business is recognised as an intangible asset and changes in its value are recorded as a separate item in the consolidated income statement (see note G7).

Phoenix Group Holdings Annual Report and Accounts 2015 141Financials
The value of the PVFP is determined in a manner consistent with realistic measurement of liabilities. In particular, the methodology and assumptions involve adjustments to reflect risk and uncertainty, are based on current estimates of future experience and current market yields and allow for market consistent valuation of any guarantees or options within the contracts. The value is also adjusted to remove the value of capital backing the non-profit business if this is included in the realistic calculation of PVFP. The principal assumptions used to calculate the PVFP are the same as those used in calculating the insurance contract liabilities given in note F4.
Embedded derivativesEmbedded derivatives, including options to surrender insurance contracts, that meet the definition of insurance contracts or are closely related to the host insurance contract, are not separately measured. All other embedded derivatives are separated from the host contract and measured at fair value through profit or loss.
Liability adequacyAt each reporting date, liability adequacy tests are performed to assess whether the insurance contract and investment contract with DPF liabilities are adequate. Current best estimates of future cash flows are compared to the carrying value of the liabilities. Any deficiency is charged to the consolidated income statement.
The Group’s accounting policies for insurance contracts meet the minimum specified requirements for liability adequacy testing under IFRS 4 Insurance Contracts, as they allow for current estimates of all contractual cash flows and of related cash flows such as claims handling costs. Cash flows resulting from embedded options and guarantees are also allowed for, with any deficiency being recognised in the consolidated income statement.
Consolidated income statement recognition
Gross premiumsIn respect of insurance contracts and investment contracts with DPF, premiums are accounted for on a receivable basis and exclude any taxes or duties based on premiums. Funds at retirement under individual pension contracts converted to annuities with the Group are, for accounting purposes, included in both claims incurred and premiums within gross premiums written.
Gross benefits and claimsClaims on insurance contracts and investment contracts with DPF reflect the cost of all claims arising during the period, including policyholder bonuses allocated in anticipation of a bonus declaration. Claims payable on maturity are recognised when the claim becomes due for payment and claims payable on death are recognised on notification. Surrenders are accounted for at the earlier of the payment date or when the policy ceases to be included within insurance contract liabilities. Where claims are payable and the contract remains in-force, the claim instalment is accounted for when due for payment. Claims payable include the costs of settlement.
Reinsurance
The Group cedes insurance risk in the normal course of business. Reinsurance assets represent balances due from reinsurance providers. Reinsurers’ share of insurance contract liabilities is dependent on expected claims and benefits arising under the related reinsured policies.
Reinsurance assets are reviewed for impairment at each reporting date, or more frequently, when an indication of impairment arises during the reporting period. Impairment occurs when there is objective evidence, as a result of an event that occurred after initial recognition of the reinsurance asset, that the Group may not receive all outstanding amounts due under the terms of the contract and the event has a reliably measurable impact on the amounts that the Group will receive from the reinsurer. The impairment loss is recognised in the consolidated income statement. The reinsurers’ share of investment contract liabilities is measured on a basis that is consistent with the valuation of the liability to policyholders to which the reinsurance applies.
Reinsurance premiums payable in respect of certain reinsured individual and group pensions annuity contracts are payable by quarterly instalments and are accounted for on a payable basis. Due to the period of time over which reinsurance premiums are payable under these arrangements, the reinsurance premiums and related payables are discounted to present values using a pre-tax risk-free rate of return. The unwinding of the discount is included as a charge within the consolidated income statement.
Reinsurance claims are recognised when the related gross insurance claim is recognised according to the terms of the relevant contract.
Gains or losses on purchasing reinsurance are recognised in the consolidated income statement at the date of purchase and are not amortised. They are the difference between the premiums ceded to reinsurers and the related change in the reinsurers’ share of insurance contract liabilities.

Phoenix Group Holdings Annual Report and Accounts 2015142
NOTES TO THE IFRS CONSOLIDATEDFINANCIAL STATEMENTSContinued
F. INSURANCE CONTRACTS, INVESTMENT CONTRACTS WITH DPF AND REINSURANCE continued
F1. LIABILITIES UNDER INSURANCE CONTRACTS continued
The table below shows a summary of the liabilities under insurance contracts and the related reinsurers’ share included within assets in the statement of consolidated financial position.
Gross liabilities
2015 £m
Reinsurers’ share 2015
£m
Gross liabilities
2014 £m
Reinsurers’ share 2014
£m
Life assurance business:
Insurance contracts 31,150 5,474 33,582 4,484
Investment contracts with DPF 10,420 1 11,124 1
41,570 5,475 44,706 4,485
Less amounts classified as held for sale (note I1.2) (1,587) (1,521) (1,776) (1,713)
39,983 3,954 42,930 2,772
Amounts due for settlement after 12 months 37,337 3,909 39,636 2,705
Gross liabilities
2015 £m
Reinsurers’ share 2015
£m
Gross liabilities
2014 £m
Reinsurers’ share 2014
£m
At 1 January 42,930 2,772 42,729 2,851
Amounts classified as held for sale at 1 January 1,776 1,713 – –
44,706 4,485 42,729 2,851
Premiums 902 1,376 981 1,792
Claims (3,931) (326) (3,724) (341)
Other changes in liabilities 70 (47) 4,751 200
Foreign exchange adjustments (19) (13) (31) (17)
Disposal of SMI (note I1.3) (158) – – –
41,570 5,475 44,706 4,485
Less amounts classified as held for sale (note I1.2) at 31 December (1,587) (1,521) (1,776) (1,713)
At 31 December 39,983 3,954 42,930 2,772
F2. UNALLOCATED SURPLUSThe unallocated surplus comprises the excess of the assets over the policyholder liabilities of the with-profit business of the Group’s life operations. For the Group’s with-profit funds this represents amounts which have yet to be allocated to owners since the unallocated surplus attributable to policyholders has been included within liabilities under insurance contracts.
If the realistic value of liabilities to policyholders exceeds the value of the assets in the with-profit fund, the unallocated surplus is valued at £nil.
2015£m
2014£m
At 1 January 981 970
Transfer (to)/from income statement (84) 11
Disposal of SMI (see note I1.3) (20) –
At 31 December 877 981
Phoenix Group Holdings Annual Report and Accounts 2015 143Financials
F3. REINSURANCEThis section includes disclosures in relation to reinsurance. Further disclosures and accounting policies relating to reinsurance are included in note F1.
F3.1 Premiums ceded to reinsurers
Premiums ceded to reinsurers during the period were £1,376 million (2014: £1,792 million).
On 9 November 2015 the Group entered into an agreement with RGA International, effective from 1 November 2015, to reinsure substantively all of the Phoenix Life Assurance Limited (‘PLAL’) annuity liabilities previously ceded to Opal Reassurance Limited (‘Opal Re’), a subsidiary undertaking of the Company. The Group paid a reinsurance premium of £1,346 million to RGA International. Under the terms of the arrangement, RGA International holds assets in a collateral account over which the Group has a floating charge as disclosed in note F3.2.
On 31 July 2014, the Group entered into a business transfer agreement with Guardian Assurance Limited (‘Guardian’) (see note I1.2). The transfer has been initially effected under a reinsurance agreement effective from 1 January 2014.
In accordance with the business transfer agreement, it is intended that the reinsurance agreement will be replaced by a transfer of the business using a scheme under Part VII of the Financial Services and Markets Act 2000 by the end of 2016 subject to the necessary regulatory and Court approvals.
The Group paid a reinsurance premium of £1,736 million to Guardian. Under the terms of the agreement, in order to mitigate the risk of counterparty default, Guardian holds assets in a collateral account over which the Group has a fixed charge as disclosed in note F3.2.
F3.2 Collateral arrangements
It is the Group’s practice to obtain collateral to mitigate the counterparty risk related to reinsurance transactions usually in the form of cash or marketable financial instruments.
Where the Group receives collateral in the form of marketable financial instruments which it is not permitted to sell or re-pledge except in the case of default, it is not recognised in the statement of consolidated financial position. The fair value of financial assets accepted as collateral for reinsurance transactions but not recognised in the statement of consolidated financial position amounts to £4,909 million (2014: £3,829 million). The increase is largely driven by the reinsurance agreement entered into with RGA International during the period over certain portfolios of the Group’s annuity liabilities (see note F3.1).
Where the Group receives collateral on reinsurance transactions in the form of cash it is recognised in the statement of consolidated financial position along with a corresponding liability to repay the amount of collateral received, disclosed as ‘Deposits received from reinsurers’. The amounts recognised as financial assets and liabilities from cash collateral received at 31 December 2015 are set out below.
Reinsurance transactions
2015£m
2014£m
Financial assets 376 405
Financial liabilities 376 405
F4. RISK MANAGEMENT – INSURANCE RISKThis note forms one part of the risk management disclosures in the consolidated financial statements. Financial risk is included in note E6.
Insurance risk refers to the risk that the frequency or severity of insured events may be worse than expected and includes expense risk. The Phoenix Life segment contracts include the following sources of insurance risk:
Mortality higher than expected number of death claims on assurance products and occurrence of one or more large claims;
Longevity faster than expected improvements in life expectancy on immediate and deferred annuity products;
Morbidity higher than expected number of serious illness claims or more sickness claims which last longer on income protection policies;
Expenses policies cost more to administer than expected;
Lapses the numbers of policies terminating early is different to that expected in a way which increases expected claims costs or expenses or reduces future profits; and
Options unanticipated changes in policyholder option exercise rates giving rise to increased claims costs.
Phoenix Group Holdings Annual Report and Accounts 2015144
NOTES TO THE IFRS CONSOLIDATEDFINANCIAL STATEMENTSContinued
F. INSURANCE CONTRACTS, INVESTMENT CONTRACTS WITH DPF AND REINSURANCE continued
F4. RISK MANAGEMENT – INSURANCE RISK continued
Objectives and policies for mitigating insurance risk
The Group uses several methods to assess and monitor insurance risk exposures both for individual types of risks insured and overall risks. These methods include internal risk measurement models, experience analyses, external data comparisons, sensitivity analyses, scenario analyses and stress testing.
The profitability of the run-off of the closed long-term insurance businesses within the Group depends, to a significant extent, on the values of claims paid in the future relative to the assets accumulated to the date of claim. Typically, over the lifetime of a contract, premiums and investment returns exceed claim costs in the early years and it is necessary to set aside these amounts to meet future obligations. The amount of such future obligations is assessed on actuarial principles by reference to assumptions about the development of financial and insurance risks.
It is therefore necessary for the Directors of each life company to make decisions, based on actuarial advice, which ensure an appropriate accumulation of assets relative to liabilities. These decisions include investment policy, bonus policy and, where discretion exists, the level of payments on early termination.
SensitivitiesInsurance liabilities are sensitive to changes in risk variables, such as prevailing market interest rates, currency rates and equity prices, since these variations alter the value of the financial assets held to meet obligations arising from insurance contracts and changes in investment conditions also have an impact on the value of insurance liabilities themselves. Additionally, insurance liabilities are sensitive to the assumptions which have been applied in their calculation, such as mortality and lapse rates. Sometimes allowance must also be made for the effect on future assumptions of management or policyholder actions in certain economic scenarios. This could lead to changes in assumed asset mix or future bonus rates. The most significant non- economic sensitivities arise from mortality, longevity and lapse risk.
A decrease of 5% in assurance mortality, with all other variables held constant, would result in an increase in the profit after tax in respect of a full year, and an increase in equity of £12 million (2014: £14 million).
An increase of 5% in assurance mortality, with all other variables held constant, would result in a decrease in the profit after tax in respect of a full year, and a decrease in equity of £12 million (2014: £14 million).
A decrease of 5% in annuitant longevity, with all other variables held constant, would result in an increase in the profit after tax in respect of a full year, and an increase in equity of £99 million (2014: £135 million).
An increase of 5% in annuitant longevity, with all other variables held constant, would result in a decrease in the profit after tax in respect of a full year, and a decrease in equity of £99 million (2014: £135 million).
A decrease of 25% in lapse rates, with all other variables held constant, would result in a decrease in the profit after tax in respect of a full year, and a decrease in equity of £76 million (2014: £53 million).
An increase of 25% in lapse rates, with all other variables held constant, would result in an increase in the profit after tax in respect of a full year, and an increase in equity of £76 million (2014: £46 million).
F4.1 Assumptions
Valuation of participating insurance and investment contracts
For participating business, which is with-profit business (insurance and investment contracts), the insurance contract liability is calculated on a realistic basis, adjusted to exclude the shareholders’ share of future bonuses and the associated tax liability. This is a market consistent valuation, which involves placing a value on liabilities similar to the market value of assets with similar cash flow patterns.
Valuation of non-participating insurance contractsThe non-participating insurance contract liabilities are determined using either a net premium or gross premium valuation method.
Process used to determine assumptionsFor participating business in realistic basis companies the assumptions about future demographic trends are intended to be ‘best estimates’. They are determined after considering the companies’ recent experience and/or relevant industry data. Economic assumptions are market consistent.
For other business, demographic assumptions are derived by adding a prudent margin to best estimate assumptions. Economic assumptions are prudent estimates of the returns expected to be achieved on the assets backing the liabilities.
Phoenix Group Holdings Annual Report and Accounts 2015 145Financials
During the year a number of changes were made to assumptions to reflect changes in expected experience or to harmonise the approach across the enlarged Group. The impact of material changes during the year was as follows:
(Decrease)/increase in insurance
liabilities 2015 £m
Decrease in insurance
liabilities 2014 £m
Change in longevity assumptions (3) (14)Change in persistency assumptions 1 (13)Change in mortality assumptions 3 –Change in expenses assumptions 5 –
Valuation interest rateFor realistic basis companies the liabilities are determined stochastically using an appropriate number of risk neutral scenarios produced by an economic scenario generator calibrated to market conditions and gilt yields as at the valuation date.
For funds not subject to realistic reporting, the method used to determine valuation interest rates generally follows the regulations set out in the Prudential Sourcebook for Insurers.
Assets are firstly hypothecated to classes of business being valued. The valuation interest rates for each block of business are based on the expected returns of the hypothecated assets. The yield is then adjusted to make allowance for credit risk, liquidity risk, reinvestment risk and investment management expenses.
Valuation interest rates (after tax for life policies) are typically in the following ranges:
2015%
2014%
Life policies 1.70 – 2.18 2.06 – 2.72Pension policies 1.26 – 3.01 2.45 – 3.31
Expense inflationExpenses are assumed to increase at the rate of increase in the Retail Price Index (‘RPI’) plus fixed margins in accordance with the various management service agreements (‘MSAs’) the Group has in place with outsource partners. For with-profit business the rate of RPI inflation is determined within each stochastic scenario. For other business it is based on the Bank of England inflation spot curve. For MSAs with contractual increases set by reference to national average earnings inflation, this is approximated as RPI inflation plus 1%. In instances in which inflation risk is not mitigated, a further margin for adverse deviations may then be added to the rate of expense inflation.
Mortality and longevity ratesMortality rates are based on published tables, adjusted appropriately to take account of changes in the underlying population mortality since the table was published, company experience and forecast changes in future mortality. Where appropriate, a margin is added to assurance mortality rates to allow for adverse future deviations. Annuitant mortality rates are adjusted to make allowance for future improvements in pensioner longevity.
Lapse and surrender rates (persistency)The assumed rates for surrender and voluntary premium discontinuance depend on the length of time a policy has been in force and the relevant company. Surrender or voluntary premium discontinuances are only assumed for realistic basis companies. Withdrawal rates used in the valuation of with-profit policies are based on observed experience and adjusted when it is considered that future policyholder behaviour will be influenced by different considerations than in the past. In particular, it is assumed that withdrawal rates for unitised with-profit contracts will be higher on policy anniversaries on which Market Value Adjustments do not apply.
Discretionary participating bonus rateFor realistic basis companies, the regular bonus rates assumed in each scenario are determined in accordance with each company’s PPFM. Final bonuses are assumed at a level such that maturity payments will equal asset shares subject to smoothing rules set out in the PPFM.
Policyholder options and guaranteesSome of the Group’s products give potentially valuable guarantees, or give options to change policy benefits which can be exercised at the policyholders’ discretion. These products are described below.
Most with-profit contracts give a guaranteed minimum payment on a specified date or range of dates or on death if before that date or dates. For pensions contracts, the specified date is the policyholder’s chosen retirement date or a range of dates around that date. For endowment contracts, it is the maturity date of the contract. For with-profit bonds it is often a specified anniversary of commencement, in some cases with further dates thereafter. Annual bonuses when added to with-profit contracts usually increase the guaranteed amount.
There are guaranteed surrender values on a small number of older contracts.

Phoenix Group Holdings Annual Report and Accounts 2015146
NOTES TO THE IFRS CONSOLIDATEDFINANCIAL STATEMENTSContinued
F. INSURANCE CONTRACTS, INVESTMENT CONTRACTS WITH DPF AND REINSURANCE continued
F4. RISK MANAGEMENT – INSURANCE RISK continued
Some pensions contracts include guaranteed annuity options (see deferred annuities in note F4.2 for details). The total amount provided in the with-profit and non-profit funds in respect of the future costs of guaranteed annuity options are £1,710 million (2014: £1,809 million) and £5 million (2014: £6 million) respectively.
In common with other life companies in the UK which have written pension transfer and opt-out business, the Group has set up provisions for the review and possible redress relating to personal pension policies. These provisions, which have been calculated from data derived from detailed file reviews of specific cases and using a certainty equivalent approach, which give a result very similar to a market consistent valuation, are included in liabilities arising under insurance contracts. The total amount provided in the with-profit funds and non-profit funds in respect of the review and possible redress relating to pension policies, including associated costs, are £254 million (2014: £284 million) and £14 million (2014: £15 million) respectively.
With-profit deferred annuities participate in profits only up to the date of retirement. At retirement, a guaranteed cash option allows the policyholder to commute the annuity benefit into cash on guaranteed terms.
F4.2 Managing product risk
The following sections give an assessment of the risks associated with the Group’s main life assurance products, as shown below, and the ways in which the Group manages those risks.
2015Gross Reinsurance
Insurance contracts
£m
Investment contracts with DPF
£m
Insurance contracts
£m
Investment contracts with DPF
£m
With-profit funds:
Pensions:
Deferred annuities – with guarantees 8,534 142 726 –
Deferred annuities – without guarantees 1,586 – – –
Immediate annuities 865 – 404 –
Unitised with-profit 1,017 8,574 38 –
Total pensions 12,002 8,716 1,168 –
Life:
Immediate annuities 59 – 4 –
Unitised with-profit 555 640 20 –
Life with-profit 4,377 – 9 1
Total life 4,991 640 33 1
Other 1,967 – 182 –
Non-profit funds:
Deferred annuities – with guarantees 14 – – –
Deferred annuities – without guarantees 489 – 2 –
Immediate annuities 7,933 – 2,383 –
Protection 508 – 99 –
Unit-linked 1,353 1,059 46 –
Other 306 5 40 –
29,563 10,420 3,953 1

Phoenix Group Holdings Annual Report and Accounts 2015 147Financials
2014Gross Reinsurance
Insurance contracts
£m
Investment contracts with DPF
£m
Insurance contracts
£m
Investment contracts with DPF
£m
With-profit funds:
Pensions:
Deferred annuities – with guarantees 9,298 157 595 –
Deferred annuities – without guarantees 1,717 – – –
Immediate annuities 1,158 – 589 –
Unitised with-profit 1,089 9,106 39 –
Total pensions 13,262 9,263 1,223 –
Life:
Immediate annuities 63 – 5 –
Unitised with-profit 594 688 22 –
Life with-profit 4,704 – 10 1
Total life 5,361 688 37 1
Other 2,022 – 181 –
Non-profit funds:
Deferred annuities – with guarantees 15 – – –
Deferred annuities – without guarantees 647 – – –
Immediate annuities 8,107 – 1,117 –
Protection 497 – 114 –
Unit-linked 1,650 1,167 54 –
Other 246 5 45 –
31,807 11,123 2,771 1
The tables above exclude insurance contract liabilities and related reinsurer’s share of insurance contract liabilities classified as held for sale at 31 December 2015 and 31 December 2014.
With-profit fund (unitised and traditional)The Group operates a number of with-profit funds in the UK in which the with-profit policyholders benefit from a discretionary annual bonus (guaranteed once added in most cases) and a discretionary final bonus. Non-participating business is also written in some of the with-profit funds and some of the funds may include immediate annuities and deferred annuities with Guaranteed Annuity Rates (‘GAR’).
The investment strategy of each fund differs, but is broadly to invest in a mixture of fixed interest investments and equities and/or property and other asset classes in such proportions as is appropriate to the investment risk exposure of the fund and its capital resources.
The Group has significant discretion regarding investment policy, bonus policy and early termination values. The process for exercising discretion in the management of the with-profit funds is set out in the PPFM for each with-profit fund and is overseen by With-Profit committees. Advice is also taken from the with-profit actuary of each with-profit fund. Compliance with the PPFM is reviewed annually and reported to the PRA, FCA and policyholders.
The bonuses are designed to distribute to policyholders a fair share of the return on the assets in the with-profit funds together with other elements of the experience of the fund. The shareholders of the Group are entitled to receive one-ninth of the cost of bonuses declared for some funds and £nil for others.
Unitised and traditional with-profit policies are exposed to equivalent risks, the main difference being that unitised with-profit policies purchase notional units in a with-profit fund whereas traditional with-profit policies do not. Benefit payments for unitised policies are then dependent on unit prices at the time of a claim, although charges may be applied. A unitised with-profit fund price is typically guaranteed not to fall and increases in line with any discretionary bonus payments over the course of one year.
Phoenix Group Holdings Annual Report and Accounts 2015148
NOTES TO THE IFRS CONSOLIDATEDFINANCIAL STATEMENTSContinued
F. INSURANCE CONTRACTS, INVESTMENT CONTRACTS WITH DPF AND REINSURANCE continued
F4. RISK MANAGEMENT – INSURANCE RISK continued
Deferred annuitiesDeferred annuity policies are written to provide either a cash benefit at retirement, which the policyholder can use to buy an annuity on the terms then applicable, or an annuity payable from retirement. The policies contain an element of guarantee expressed in the form that the contract is written in, i.e. to provide cash or an annuity. Deferred annuity policies written to provide a cash benefit may also contain an option to convert the cash benefit to an annuity benefit on guaranteed terms; these are known as GAR policies. Deferred annuity policies written to provide an annuity benefit may also contain an option to convert the annuity benefit into cash benefits on guaranteed terms; these are known as Guaranteed Cash Option (‘GCO’) policies.
During the last decade, interest rates and inflation have fallen and life expectancy has increased more rapidly than originally anticipated. The guaranteed terms on GAR policies are more favourable than the annuity rates currently available in the market available for cash benefits. The guaranteed terms on GCO policies are currently not valuable. Deferred annuity policies which are written to provide annuity benefits are managed in a similar manner to immediate annuities and are exposed to the same risks.
The option provisions on GAR policies are particularly sensitive to downward movements in interest rates, increasing life expectancy and the proportion of customers exercising their option. Adverse movements in these factors could lead to a requirement to increase reserves which could adversely impact profit and potentially require additional capital. In order to address the interest rate risk (but not the risk of increasing life expectancy or changing customer behaviour with regard to exercise of the option), insurance subsidiaries within the Group have purchased derivatives that provide protection against an increase in liabilities and have thus reduced the sensitivity of profit to movements in interest rates.
The Group seeks to manage this risk in accordance with both the terms of the issued policies and the interests of customers, and has obtained external advice supporting the manner in which it operates the long-term funds in this respect.
Immediate annuitiesThis type of annuity is purchased with a single premium at the outset, and is paid to the policyholder for the remainder of their lifetime. Payments may also continue for the benefit of a surviving spouse or partner after the annuitant’s death. Annuities may be level, or escalate at a fixed rate, or may escalate in line with a price index and may be payable for a minimum period irrespective of whether the policyholder remains alive.
The main risks associated with this product are longevity and investment risks. Longevity risk arises where the annuities are paid for the lifetime of the policyholder, and is managed through the initial pricing of the annuity and through reinsurance (appropriately collateralised) or transfer of existing liabilities. Annuities may also be a partial ‘natural hedge’ against losses incurred in protection business in the event of increased mortality (and vice versa) although the extent to which this occurs will depend on the similarity of the demographic profile of each book of business.
The pricing assumption for mortality risk is based on both historic internal information and externally-generated information on mortality experience, including allowances for future mortality improvements. Pricing will also include a contingency margin for adverse deviations in assumptions.
Market and credit risk is influenced by the extent to which the cash flows under the contracts have been matched by suitable assets which is managed under the ALM framework. Asset/liability modelling is used to monitor this position on a regular basis.
ProtectionThese contracts are typically secured by the payment of a regular premium payable for a period of years providing benefits payable on certain events occurring within the period. The benefits may be a single lump sum or a series of payments and may be payable on death, serious illness or sickness.
The main risk associated with this product is the claims experience and this risk is managed through the initial pricing of the policy (based on actuarial principles), the use of reinsurance and a clear process for administering claims.
Market and credit risk is influenced by the extent to which the cash flows under the contracts have been matched by suitable assets which is managed under the ALM framework. Asset/liability modelling is used to monitor this position on a regular basis.
G. OTHER STATEMENT OF CONSOLIDATED FINANCIAL POSITION NOTESG1. PROVISIONS
A provision is recognised when the Group has a present legal or constructive obligation, as a result of a past event, which is likely to result in an outflow of resources and where a reliable estimate of the amount of the obligation can be made. If the effect is material, the provision is determined by discounting the expected future cash flows at a pre-tax rate that reflects current market assessments of the time value of money and, where appropriate, the risks specific to the liability.
A provision is recognised for onerous contracts when the expected benefits to be derived from the contracts are less than the related unavoidable costs. The unavoidable costs reflect the net cost of exiting the contract, which is the lower of the cost of fulfilling it and any compensation or penalties arising from failure to fulfil it.
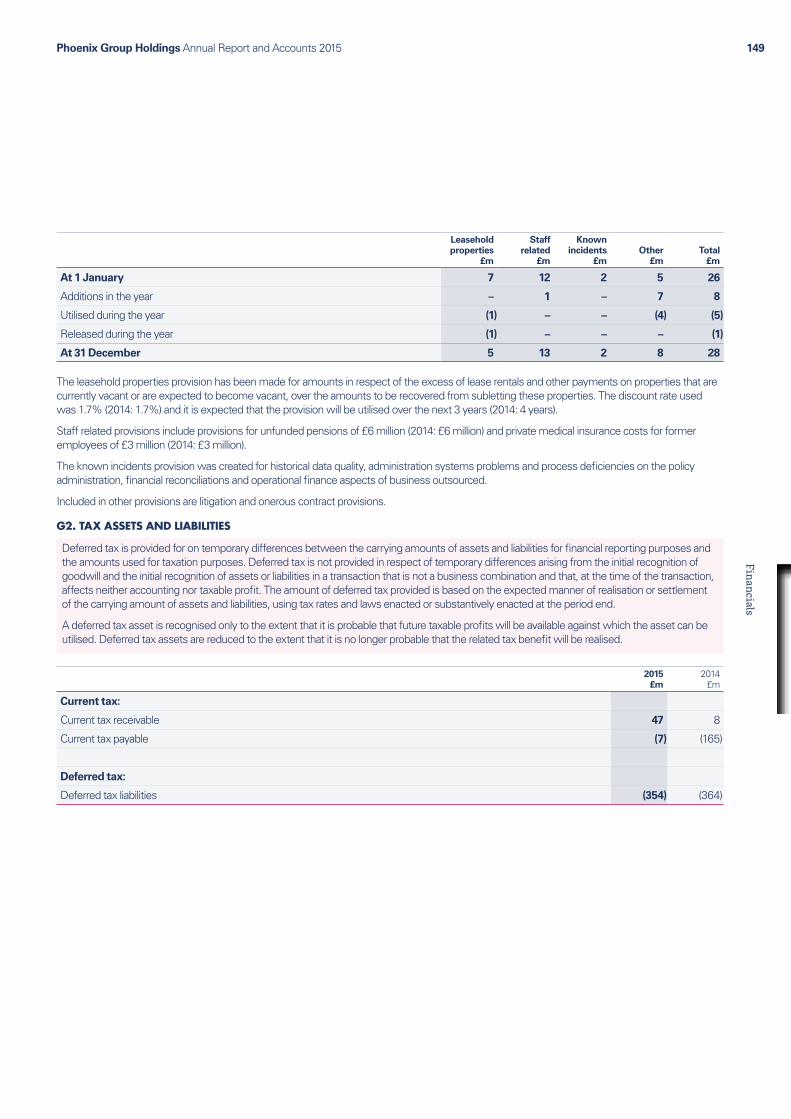
Phoenix Group Holdings Annual Report and Accounts 2015 149Financials
Leasehold properties
£m
Staff related
£m
Known incidents
£mOther
£mTotal
£m
At 1 January 7 12 2 5 26
Additions in the year – 1 – 7 8
Utilised during the year (1) – – (4) (5)
Released during the year (1) – – – (1)
At 31 December 5 13 2 8 28
The leasehold properties provision has been made for amounts in respect of the excess of lease rentals and other payments on properties that are currently vacant or are expected to become vacant, over the amounts to be recovered from subletting these properties. The discount rate used was 1.7% (2014: 1.7%) and it is expected that the provision will be utilised over the next 3 years (2014: 4 years).
Staff related provisions include provisions for unfunded pensions of £6 million (2014: £6 million) and private medical insurance costs for former employees of £3 million (2014: £3 million).
The known incidents provision was created for historical data quality, administration systems problems and process deficiencies on the policy administration, financial reconciliations and operational finance aspects of business outsourced.
Included in other provisions are litigation and onerous contract provisions.
G2. TAX ASSETS AND LIABILITIES
Deferred tax is provided for on temporary differences between the carrying amounts of assets and liabilities for financial reporting purposes and the amounts used for taxation purposes. Deferred tax is not provided in respect of temporary differences arising from the initial recognition of goodwill and the initial recognition of assets or liabilities in a transaction that is not a business combination and that, at the time of the transaction, affects neither accounting nor taxable profit. The amount of deferred tax provided is based on the expected manner of realisation or settlement of the carrying amount of assets and liabilities, using tax rates and laws enacted or substantively enacted at the period end.
A deferred tax asset is recognised only to the extent that it is probable that future taxable profits will be available against which the asset can be utilised. Deferred tax assets are reduced to the extent that it is no longer probable that the related tax benefit will be realised.
2015 £m
2014 £m
Current tax:
Current tax receivable 47 8
Current tax payable (7) (165)
Deferred tax:
Deferred tax liabilities (354) (364)
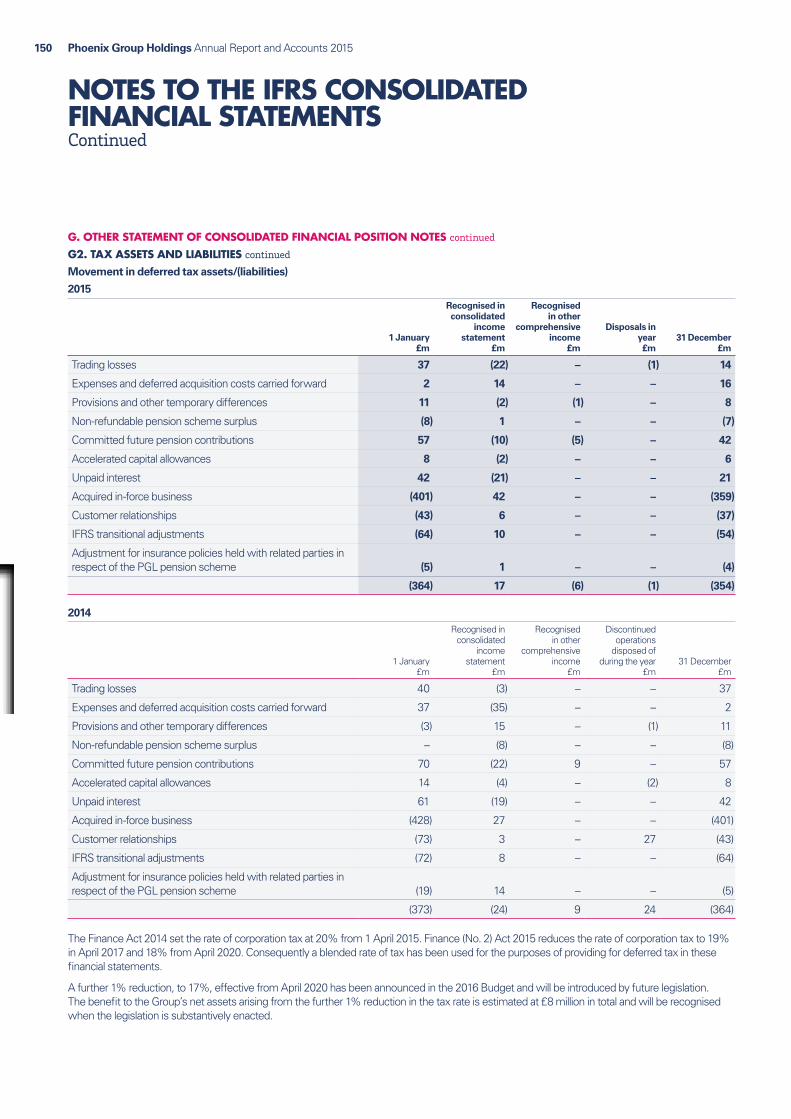
Phoenix Group Holdings Annual Report and Accounts 2015150
NOTES TO THE IFRS CONSOLIDATEDFINANCIAL STATEMENTSContinued
G. OTHER STATEMENT OF CONSOLIDATED FINANCIAL POSITION NOTES continued
G2. TAX ASSETS AND LIABILITIES continued
Movement in deferred tax assets/(liabilities)
2015
1 January £m
Recognised in consolidated
income statement
£m
Recognised in other
comprehensive income
£m
Disposals in year£m
31 December £m
Trading losses 37 (22) – (1) 14
Expenses and deferred acquisition costs carried forward 2 14 – – 16
Provisions and other temporary differences 11 (2) (1) – 8
Non-refundable pension scheme surplus (8) 1 – – (7)
Committed future pension contributions 57 (10) (5) – 42
Accelerated capital allowances 8 (2) – – 6
Unpaid interest 42 (21) – – 21
Acquired in-force business (401) 42 – – (359)
Customer relationships (43) 6 – – (37)
IFRS transitional adjustments (64) 10 – – (54)
Adjustment for insurance policies held with related parties in respect of the PGL pension scheme (5) 1 – – (4)
(364) 17 (6) (1) (354)
2014
1 January £m
Recognised in consolidated
income statement
£m
Recognised in other
comprehensive income
£m
Discontinued operations
disposed of during the year
£m31 December
£m
Trading losses 40 (3) – – 37
Expenses and deferred acquisition costs carried forward 37 (35) – – 2
Provisions and other temporary differences (3) 15 – (1) 11
Non-refundable pension scheme surplus – (8) – – (8)
Committed future pension contributions 70 (22) 9 – 57
Accelerated capital allowances 14 (4) – (2) 8
Unpaid interest 61 (19) – – 42
Acquired in-force business (428) 27 – – (401)
Customer relationships (73) 3 – 27 (43)
IFRS transitional adjustments (72) 8 – – (64)
Adjustment for insurance policies held with related parties in respect of the PGL pension scheme (19) 14 – – (5)
(373) (24) 9 24 (364)
The Finance Act 2014 set the rate of corporation tax at 20% from 1 April 2015. Finance (No. 2) Act 2015 reduces the rate of corporation tax to 19% in April 2017 and 18% from April 2020. Consequently a blended rate of tax has been used for the purposes of providing for deferred tax in these financial statements.
A further 1% reduction, to 17%, effective from April 2020 has been announced in the 2016 Budget and will be introduced by future legislation. The benefit to the Group’s net assets arising from the further 1% reduction in the tax rate is estimated at £8 million in total and will be recognised when the legislation is substantively enacted.

Phoenix Group Holdings Annual Report and Accounts 2015 151Financials
Deferred income tax assets are recognised for tax losses carried forward only to the extent that realisation of the related tax benefit is probable.
2015 £m
2014 £m
Deferred tax assets have not been recognised in respect of:
Tax losses carried forward 16 39
Provisions and other temporary differences 4 6
Deferred tax assets not recognised on capital losses1 89 1161 These can only be recognised against future capital gains and have no expiry date.
G3. PAYABLES RELATED TO DIRECT INSURANCE CONTRACTS
Payables related to direct insurance contracts are recognised when due and are measured on initial recognition at the fair value of the consideration payable. Subsequent to initial recognition, these payables are measured at amortised cost using the effective interest rate method.
2015 £m
2014 £m
Payables related to direct insurance contracts 364 358
Amount due for settlement after 12 months – –
G4. ACCRUALS AND DEFERRED INCOMEThis note analyses the Group’s accruals and deferred income at the end of the year.
2015 £m
2014 £m
Accruals and deferred income 128 130
Amount due for settlement after 12 months 1 –
G5. OTHER PAYABLES
Other payables are recognised when due and are measured on initial recognition at the fair value of the consideration payable. Subsequent to initial recognition, these payables are measured at amortised cost using the effective interest rate method.
2015 £m
2014 £m
Investment broker balances 581 242
Other payables 96 118
677 360
Amount due for settlement after 12 months – –
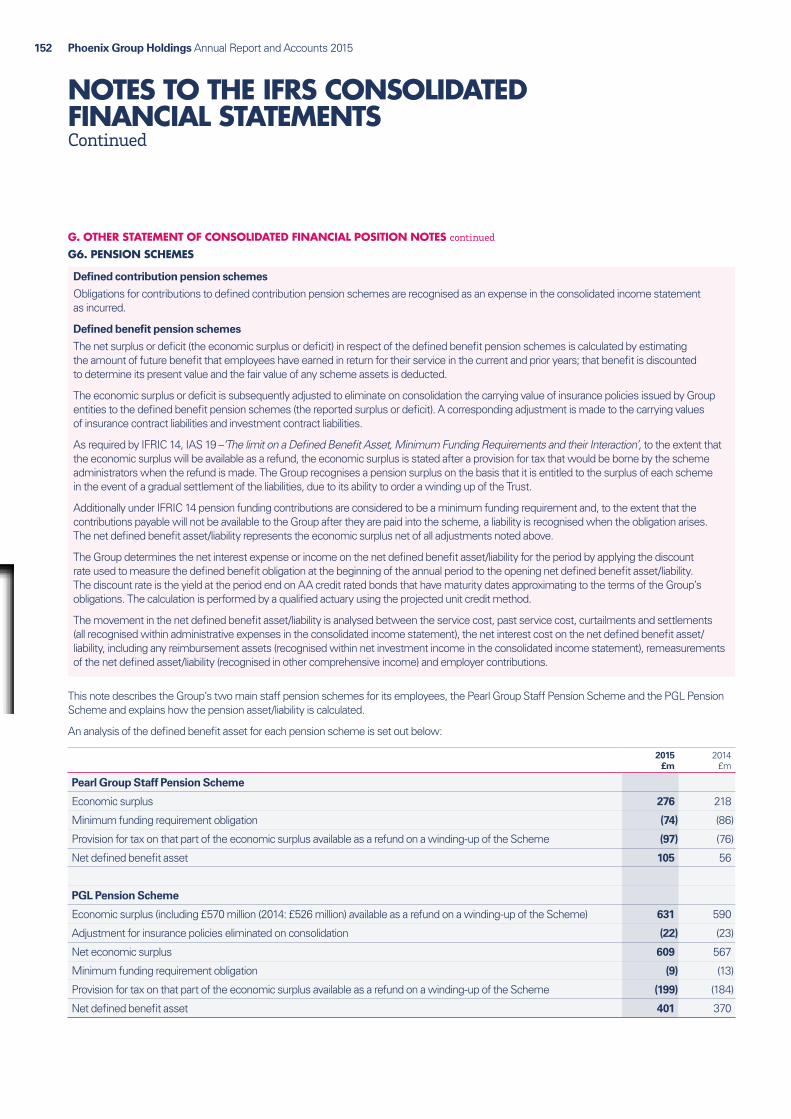
Phoenix Group Holdings Annual Report and Accounts 2015152
NOTES TO THE IFRS CONSOLIDATEDFINANCIAL STATEMENTSContinued
G. OTHER STATEMENT OF CONSOLIDATED FINANCIAL POSITION NOTES continued
G6. PENSION SCHEMES
Defined contribution pension schemes
Obligations for contributions to defined contribution pension schemes are recognised as an expense in the consolidated income statement as incurred.
Defined benefit pension schemes
The net surplus or deficit (the economic surplus or deficit) in respect of the defined benefit pension schemes is calculated by estimating the amount of future benefit that employees have earned in return for their service in the current and prior years; that benefit is discounted to determine its present value and the fair value of any scheme assets is deducted.
The economic surplus or deficit is subsequently adjusted to eliminate on consolidation the carrying value of insurance policies issued by Group entities to the defined benefit pension schemes (the reported surplus or deficit). A corresponding adjustment is made to the carrying values of insurance contract liabilities and investment contract liabilities.
As required by IFRIC 14, IAS 19 –‘The limit on a Defined Benefit Asset, Minimum Funding Requirements and their Interaction’, to the extent that the economic surplus will be available as a refund, the economic surplus is stated after a provision for tax that would be borne by the scheme administrators when the refund is made. The Group recognises a pension surplus on the basis that it is entitled to the surplus of each scheme in the event of a gradual settlement of the liabilities, due to its ability to order a winding up of the Trust.
Additionally under IFRIC 14 pension funding contributions are considered to be a minimum funding requirement and, to the extent that the contributions payable will not be available to the Group after they are paid into the scheme, a liability is recognised when the obligation arises. The net defined benefit asset/liability represents the economic surplus net of all adjustments noted above.
The Group determines the net interest expense or income on the net defined benefit asset/liability for the period by applying the discount rate used to measure the defined benefit obligation at the beginning of the annual period to the opening net defined benefit asset/liability. The discount rate is the yield at the period end on AA credit rated bonds that have maturity dates approximating to the terms of the Group’s obligations. The calculation is performed by a qualified actuary using the projected unit credit method.
The movement in the net defined benefit asset/liability is analysed between the service cost, past service cost, curtailments and settlements (all recognised within administrative expenses in the consolidated income statement), the net interest cost on the net defined benefit asset/liability, including any reimbursement assets (recognised within net investment income in the consolidated income statement), remeasurements of the net defined asset/liability (recognised in other comprehensive income) and employer contributions.
This note describes the Group’s two main staff pension schemes for its employees, the Pearl Group Staff Pension Scheme and the PGL Pension Scheme and explains how the pension asset/liability is calculated.
An analysis of the defined benefit asset for each pension scheme is set out below:
2015 £m
2014 £m
Pearl Group Staff Pension Scheme
Economic surplus 276 218
Minimum funding requirement obligation (74) (86)
Provision for tax on that part of the economic surplus available as a refund on a winding-up of the Scheme (97) (76)
Net defined benefit asset 105 56
PGL Pension Scheme
Economic surplus (including £570 million (2014: £526 million) available as a refund on a winding-up of the Scheme) 631 590
Adjustment for insurance policies eliminated on consolidation (22) (23)
Net economic surplus 609 567
Minimum funding requirement obligation (9) (13)
Provision for tax on that part of the economic surplus available as a refund on a winding-up of the Scheme (199) (184)
Net defined benefit asset 401 370

Phoenix Group Holdings Annual Report and Accounts 2015 153Financials
The Group’s defined benefit schemes typically expose the Group to a number of risks, the most significant of which are:
Asset volatility – the value of the schemes’ assets will vary as market conditions change and as such is subject to considerable volatility. The volatility in the schemes’ assets can be caused by both volatility within the markets or variations in the return achieved by the schemes’ investment managers relative to market performance. In particular there is the risk that the variation in asset values will not be in line with the variation in pension liability values, and as such differences in the nature and duration of the assets and liabilities can cause difference in the way that the assets and liabilities vary.
Inflation risk – a significant proportion of the schemes’ benefit obligations are linked to inflation, and higher inflation will lead to higher liabilities (although in most cases, caps on the level of inflationary increases are in place to protect against extreme inflation). Assets in both schemes are invested so as to hedge a significant proportion of the inflation risks, further details of which are included in this note.
Life expectancy – the majority of the schemes’ obligations are to provide benefits for the life of the member, so increases in life expectancy will result in an increase in the liabilities.
Information on each of these schemes is set out below.
G6.1 Pearl Group Staff Pension Scheme
Scheme detailsThe Pearl Group Staff Pension Scheme (‘the Pearl Scheme’) comprises a final salary section, a money purchase section and a hybrid section (a mix of final salary and money purchase). The final salary and hybrid sections of the Pearl Scheme are closed to new members, and since 1 July 2011 are also closed to future accrual by active members.
Defined contribution schemeContributions in the year amounted to £1 million (2014: £1 million).
Defined benefit schemeThe defined benefit scheme is funded by payment of contributions to a separately administered trust fund. The Pearl Scheme is established under, and governed by, the trust deeds and rules. A Group company, Pearl Group Holdings No.2 Limited (‘PGH2’), is the principal employer of the Pearl Scheme. The principal employer meets the administration expenses of the Pearl Scheme. The Pearl Scheme is administered by a trustee company, P.A.T. (Pensions) Limited, which is separate from the company. The trustee company is comprised of two representatives from the Group, three member nominated representatives and one independent trustee in accordance with the trustee company’s articles of association. The trustee is required by law to act in the interest of all relevant beneficiaries and is responsible for the investment policy with regard to the assets.
To the extent that an economic surplus will be available as a refund, the economic surplus is stated after a provision for tax that would be borne by the scheme administrators when the refund is made. Additionally pension funding contributions are considered to be a minimum funding requirement and, to the extent that the contributions payable will not be available to the Group after they are paid into the scheme, a liability is recognised when the obligation arises.
The valuation has been based on an assessment of the liabilities of the Pearl Scheme as at 31 December 2015, undertaken by independent qualified actuaries. The present values of the defined benefit obligation
and the related interest costs have been measured using the projected unit credit method.
FundingA triennial funding valuation of the Pearl Scheme as at 30 June 2012 was completed in May 2013. This showed a deficit as at 30 June 2012 of £480 million, on the agreed technical provisions basis.
On 27 November 2012 the principal employer and the Trustee of the Pearl Scheme entered into a revised pensions funding agreement (the ‘Pensions Agreement’), which forms the basis of the 30 June 2012 triennial valuation. The principal terms of the Pensions Agreement are:
Ɛ annual cash payments into the scheme of £70 million in 2013 and 2014 payable on 30 September, followed by payments of £40 million each year from 2015 to 2021. The Pensions Agreement includes a sharing mechanism, related to the level of dividends paid out of PGH2, that in certain circumstances allows for an acceleration of the contributions to be paid to the Pearl Scheme;
Ɛ increased and further contributions may become payable if the scheme is not anticipated to meet the two agreed funding targets:
(i) to reach full funding on the technical provisions basis by 30 June 2022; and
(ii) to reach full funding on a gilts flat basis by 30 June 2031;
Ɛ the Trustee continues to benefit from a first charge over shares in Phoenix Life Assurance Limited, National Provident Life Limited, Pearl Group Services Limited and PGS2 Limited. Following the repayment of the £425 million loan facility and £75 million of secured C loan notes on 23 July 2014 (see note E5) the value of the security claim granted under the share charges is capped at the lower of £600 million and 100% of the Pearl Scheme deficit (calculated on a basis linked to UK government securities) revalued every three years thereafter, increasing from 60% of the Pearl Scheme deficit; and
Ɛ covenant tests relating to the embedded value of certain companies with the Group.
The triennial funding valuation of the scheme as at 30 June 2015 commenced during the year and is expected to be completed by September 2016.
It should be noted that the terms of the £900 million facility agreement (see note E5) restrict the Group’s ability, with certain exceptions, to transfer assets into the secured companies over which the Trustee holds a charge over shares.
An additional liability of £74 million (2014: £86 million) has been recognised, reflecting a charge on any refund of the resultant IAS 19 surplus that arises after adjustment for discounted future contributions of £213 million (2014: £245 million) in accordance with the minimum funding requirement. A deferred tax asset of £38 million (2014: £49 million) has also been recognised to reflect tax relief at a rate of 18% (2014: 20%) that is expected to be available on the contributions, once paid into the scheme.
Contributions totalling £40 million were paid into the scheme in 2015 (2014: £68 million) and contributions totalling £40 million are currently expected to be paid into the scheme in 2016.
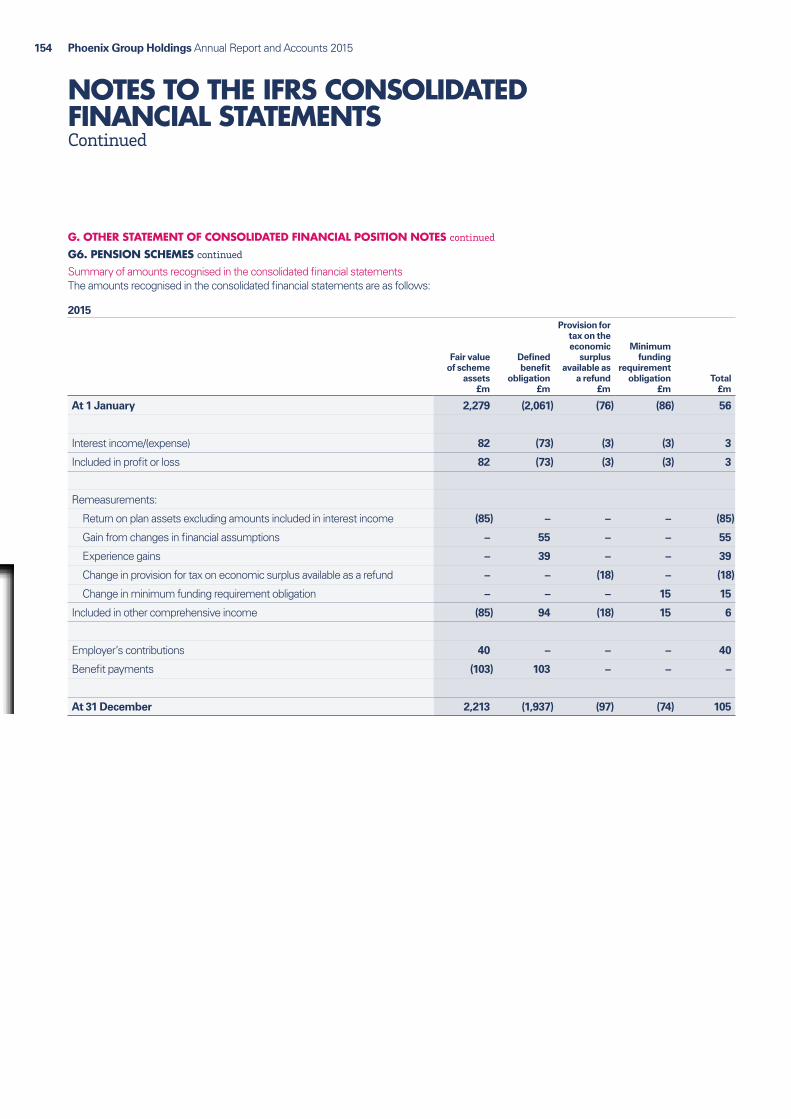
Phoenix Group Holdings Annual Report and Accounts 2015154
NOTES TO THE IFRS CONSOLIDATEDFINANCIAL STATEMENTSContinued
G. OTHER STATEMENT OF CONSOLIDATED FINANCIAL POSITION NOTES continued
G6. PENSION SCHEMES continued
Summary of amounts recognised in the consolidated financial statementsThe amounts recognised in the consolidated financial statements are as follows:
2015
Fair value of scheme
assets £m
Defined benefit
obligation £m
Provision for tax on the economic
surplus available as
a refund£m
Minimum funding
requirement obligation
£mTotal
£m
At 1 January 2,279 (2,061) (76) (86) 56
Interest income/(expense) 82 (73) (3) (3) 3
Included in profit or loss 82 (73) (3) (3) 3
Remeasurements:
Return on plan assets excluding amounts included in interest income (85) – – – (85)
Gain from changes in financial assumptions – 55 – – 55
Experience gains – 39 – – 39
Change in provision for tax on economic surplus available as a refund – – (18) – (18)
Change in minimum funding requirement obligation – – – 15 15
Included in other comprehensive income (85) 94 (18) 15 6
Employer’s contributions 40 – – – 40
Benefit payments (103) 103 – – –
At 31 December 2,213 (1,937) (97) (74) 105
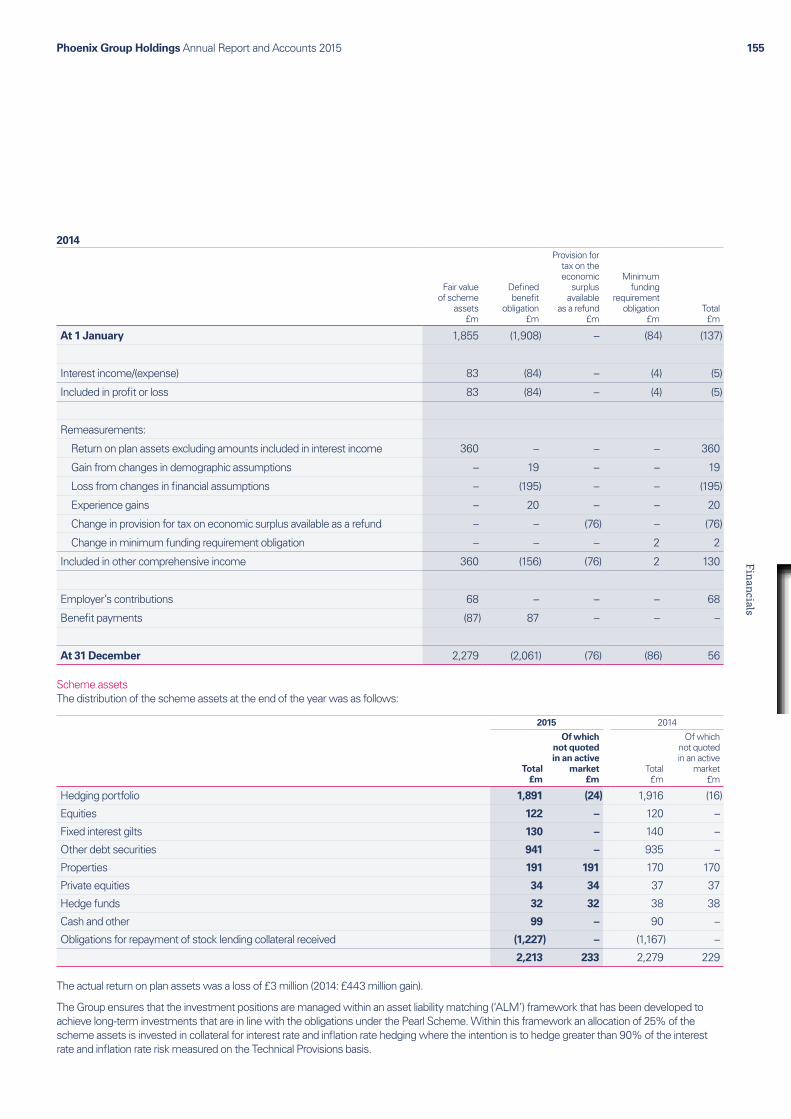
Phoenix Group Holdings Annual Report and Accounts 2015 155Financials
2014
Fair value of scheme
assets £m
Defined benefit
obligation£m
Provision for tax on the economic
surplus available
as a refund £m
Minimum funding
requirement obligation
£mTotal £m
At 1 January 1,855 (1,908) – (84) (137)
Interest income/(expense) 83 (84) – (4) (5)
Included in profit or loss 83 (84) – (4) (5)
Remeasurements:
Return on plan assets excluding amounts included in interest income 360 – – – 360
Gain from changes in demographic assumptions – 19 – – 19
Loss from changes in financial assumptions – (195) – – (195)
Experience gains – 20 – – 20
Change in provision for tax on economic surplus available as a refund – – (76) – (76)
Change in minimum funding requirement obligation – – – 2 2
Included in other comprehensive income 360 (156) (76) 2 130
Employer’s contributions 68 – – – 68
Benefit payments (87) 87 – – –
At 31 December 2,279 (2,061) (76) (86) 56
Scheme assetsThe distribution of the scheme assets at the end of the year was as follows:
2015 2014
Total £m
Of which not quoted in an active
market £m
Total £m
Of which not quoted in an active
market £m
Hedging portfolio 1,891 (24) 1,916 (16)
Equities 122 – 120 –
Fixed interest gilts 130 – 140 –
Other debt securities 941 – 935 –
Properties 191 191 170 170
Private equities 34 34 37 37
Hedge funds 32 32 38 38
Cash and other 99 – 90 –
Obligations for repayment of stock lending collateral received (1,227) – (1,167) –
2,213 233 2,279 229
The actual return on plan assets was a loss of £3 million (2014: £443 million gain).
The Group ensures that the investment positions are managed within an asset liability matching (‘ALM’) framework that has been developed to achieve long-term investments that are in line with the obligations under the Pearl Scheme. Within this framework an allocation of 25% of the scheme assets is invested in collateral for interest rate and inflation rate hedging where the intention is to hedge greater than 90% of the interest rate and inflation rate risk measured on the Technical Provisions basis.

Phoenix Group Holdings Annual Report and Accounts 2015156
NOTES TO THE IFRS CONSOLIDATEDFINANCIAL STATEMENTSContinued
G. OTHER STATEMENT OF CONSOLIDATED FINANCIAL POSITION NOTES continued
G6. PENSION SCHEMES continued
The Pearl Scheme uses swaps, UK Government bonds and UK Government stock lending to hedge the interest rate and inflation exposure arising from the liabilities which are disclosed in the table above as ‘Hedging Portfolio’ assets. Under the Scheme’s stock lending programme, the Scheme lends a Government bond to an approved counterparty and receives a similar value in the form of cash in return which is typically reinvested into other Government bonds. The Scheme retains economic exposure to the Government bond, hence the bonds continue to be recognised as scheme assets with a corresponding liability to repay the cash received as disclosed in the table above.
Defined benefit obligationThe calculation of the defined benefit obligation can be allocated to the scheme’s members as follows:
Ɛ deferred scheme members: 40% (2014: 40%)
Ɛ retirees: 60% (2014: 60%)
The weighted average duration of the defined benefit obligation at 31 December 2015 is 17 years (2014: 17 years).
Principal assumptionsThe principal financial assumptions of the Pearl Scheme are set out in the table below:
2015 %
2014 %
Rate of increase for pensions in payment (5% per annum or RPI if lower) 2.95 2.90
Rate of increase for deferred pensions (‘CPI’) 2.05 2.00
Discount rate 3.85 3.65
Inflation – RPI 3.05 3.00
Inflation – CPI 2.05 2.00
The discount rate and inflation rate assumptions have been determined by considering the shape of the appropriate yield curves and the duration of the Pearl Scheme’s liabilities. This method determines an equivalent single rate for each of the discount and inflation rates, which is derived from the profile of projected benefit payments.
It has been assumed that post-retirement mortality is in line with a scheme-specific table which was derived from the actual mortality experience in recent years, performed as part of the actuarial funding valuation as at 30 June 2012, based on the SAPS standard tables for males and for females based on year of use. Future longevity improvements are in line with current Group best estimate longevity improvements, which are based on CMI 2014 Core Projections and a long-term rate of improvement of 2% p.a. up to and including age 75 then decreasing linearly to 0% p.a. at age 110. Under these assumptions, the average life expectancy from retirement for a member currently aged 40 retiring at age 60 is 30.8 years and 33.0 years for male and female members respectively.
A quantitative sensitivity analysis for significant actuarial assumptions as at 31 December 2015 is shown below:
2015Assumptions Base Discount rate RPI Life expectancy
Sensitivity level25bps
increase25bps
decrease25bps
increase25bps
decrease1 year
increase1 year
decrease
Impact on the defined benefit obligation (£m) 1,937 (71) 75 54 (52) 54 (54)
2014Assumptions Base Discount rate RPI Life expectancy
Sensitivity level25bps
increase25bps
decrease25bps
increase25bps
decrease1 year
increase1 year
decrease
Impact on the defined benefit obligation (£m) 2,061 (79) 84 53 (50) 55 (53)
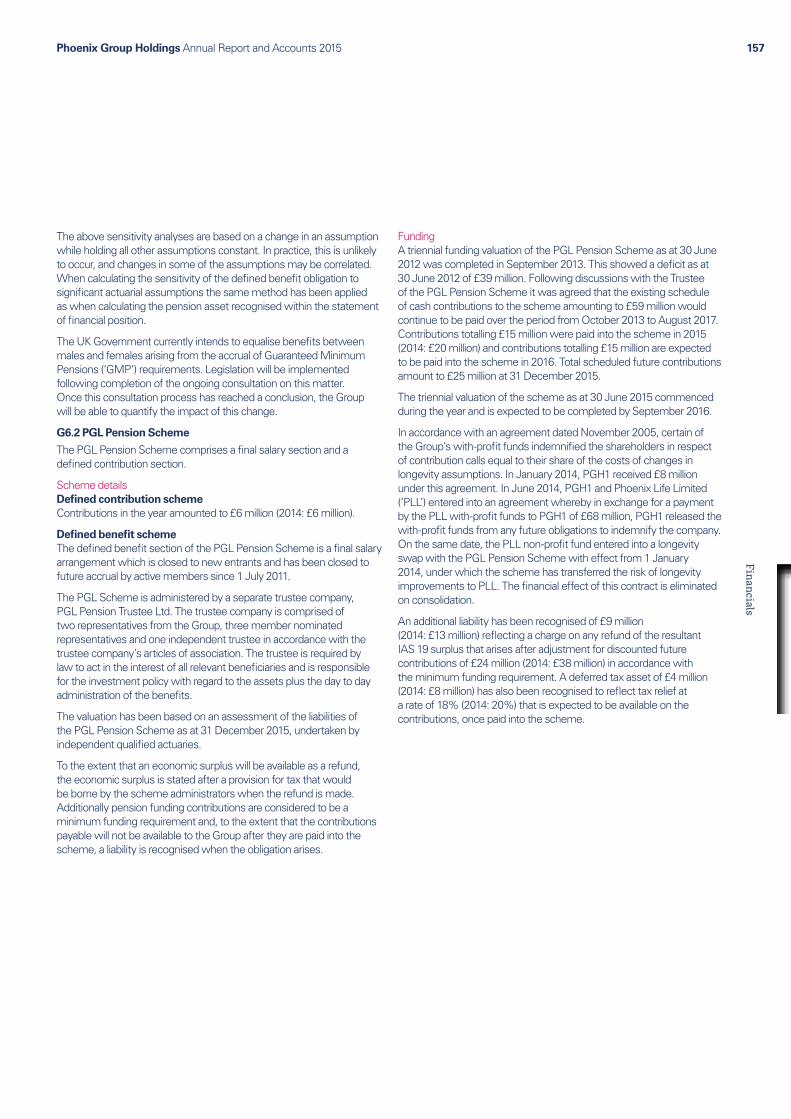
Phoenix Group Holdings Annual Report and Accounts 2015 157Financials
The above sensitivity analyses are based on a change in an assumption while holding all other assumptions constant. In practice, this is unlikely to occur, and changes in some of the assumptions may be correlated. When calculating the sensitivity of the defined benefit obligation to significant actuarial assumptions the same method has been applied as when calculating the pension asset recognised within the statement of financial position.
The UK Government currently intends to equalise benefits between males and females arising from the accrual of Guaranteed Minimum Pensions (‘GMP’) requirements. Legislation will be implemented following completion of the ongoing consultation on this matter. Once this consultation process has reached a conclusion, the Group will be able to quantify the impact of this change.
G6.2 PGL Pension Scheme
The PGL Pension Scheme comprises a final salary section and a defined contribution section.
Scheme detailsDefined contribution schemeContributions in the year amounted to £6 million (2014: £6 million).
Defined benefit schemeThe defined benefit section of the PGL Pension Scheme is a final salary arrangement which is closed to new entrants and has been closed to future accrual by active members since 1 July 2011.
The PGL Scheme is administered by a separate trustee company, PGL Pension Trustee Ltd. The trustee company is comprised of two representatives from the Group, three member nominated representatives and one independent trustee in accordance with the trustee company’s articles of association. The trustee is required by law to act in the interest of all relevant beneficiaries and is responsible for the investment policy with regard to the assets plus the day to day administration of the benefits.
The valuation has been based on an assessment of the liabilities of the PGL Pension Scheme as at 31 December 2015, undertaken by independent qualified actuaries.
To the extent that an economic surplus will be available as a refund, the economic surplus is stated after a provision for tax that would be borne by the scheme administrators when the refund is made. Additionally pension funding contributions are considered to be a minimum funding requirement and, to the extent that the contributions payable will not be available to the Group after they are paid into the scheme, a liability is recognised when the obligation arises.
FundingA triennial funding valuation of the PGL Pension Scheme as at 30 June 2012 was completed in September 2013. This showed a deficit as at 30 June 2012 of £39 million. Following discussions with the Trustee of the PGL Pension Scheme it was agreed that the existing schedule of cash contributions to the scheme amounting to £59 million would continue to be paid over the period from October 2013 to August 2017. Contributions totalling £15 million were paid into the scheme in 2015 (2014: £20 million) and contributions totalling £15 million are expected to be paid into the scheme in 2016. Total scheduled future contributions amount to £25 million at 31 December 2015.
The triennial valuation of the scheme as at 30 June 2015 commenced during the year and is expected to be completed by September 2016.
In accordance with an agreement dated November 2005, certain of the Group’s with-profit funds indemnified the shareholders in respect of contribution calls equal to their share of the costs of changes in longevity assumptions. In January 2014, PGH1 received £8 million under this agreement. In June 2014, PGH1 and Phoenix Life Limited (‘PLL’) entered into an agreement whereby in exchange for a payment by the PLL with-profit funds to PGH1 of £68 million, PGH1 released the with-profit funds from any future obligations to indemnify the company. On the same date, the PLL non-profit fund entered into a longevity swap with the PGL Pension Scheme with effect from 1 January 2014, under which the scheme has transferred the risk of longevity improvements to PLL. The financial effect of this contract is eliminated on consolidation.
An additional liability has been recognised of £9 million (2014: £13 million) reflecting a charge on any refund of the resultant IAS 19 surplus that arises after adjustment for discounted future contributions of £24 million (2014: £38 million) in accordance with the minimum funding requirement. A deferred tax asset of £4 million (2014: £8 million) has also been recognised to reflect tax relief at a rate of 18% (2014: 20%) that is expected to be available on the contributions, once paid into the scheme.
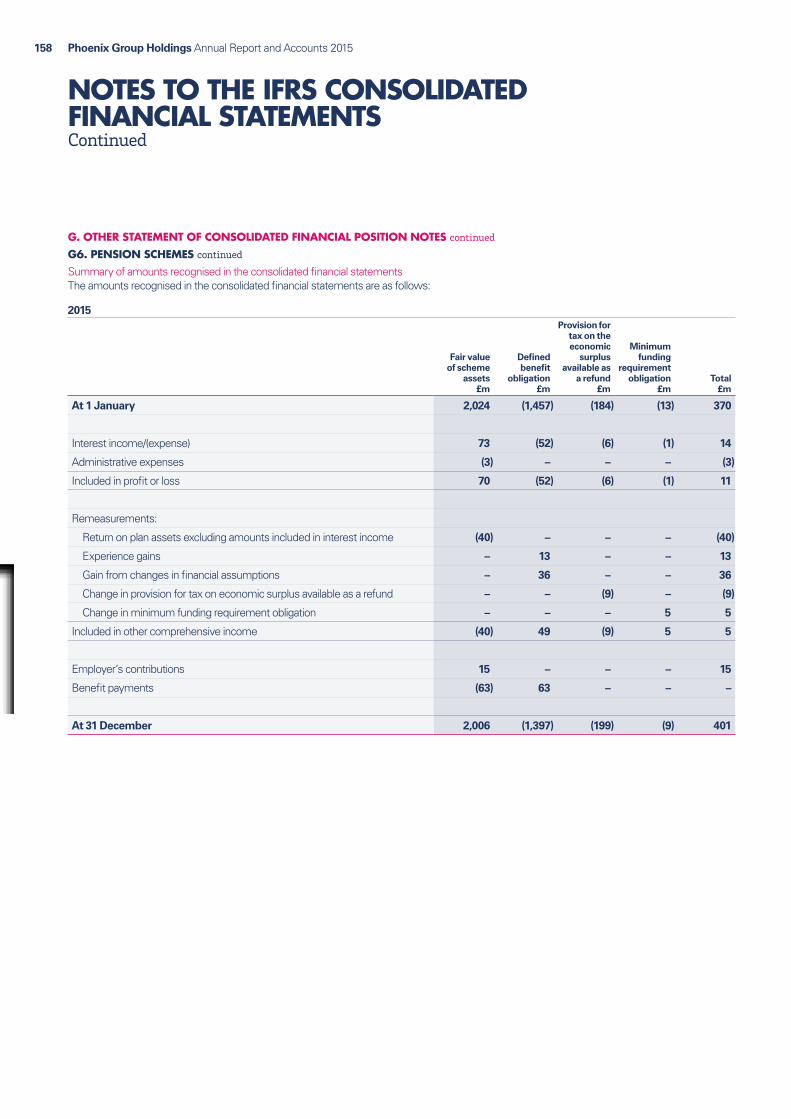
Phoenix Group Holdings Annual Report and Accounts 2015158
NOTES TO THE IFRS CONSOLIDATEDFINANCIAL STATEMENTSContinued
G. OTHER STATEMENT OF CONSOLIDATED FINANCIAL POSITION NOTES continued
G6. PENSION SCHEMES continued
Summary of amounts recognised in the consolidated financial statementsThe amounts recognised in the consolidated financial statements are as follows:
2015
Fair value of scheme
assets £m
Defined benefit
obligation £m
Provision for tax on the economic
surplus available as
a refund £m
Minimum funding
requirement obligation
£mTotal
£m
At 1 January 2,024 (1,457) (184) (13) 370
Interest income/(expense) 73 (52) (6) (1) 14
Administrative expenses (3) – – – (3)
Included in profit or loss 70 (52) (6) (1) 11
Remeasurements:
Return on plan assets excluding amounts included in interest income (40) – – – (40)
Experience gains – 13 – – 13
Gain from changes in financial assumptions – 36 – – 36
Change in provision for tax on economic surplus available as a refund – – (9) – (9)
Change in minimum funding requirement obligation – – – 5 5
Included in other comprehensive income (40) 49 (9) 5 5
Employer’s contributions 15 – – – 15
Benefit payments (63) 63 – – –
At 31 December 2,006 (1,397) (199) (9) 401

Phoenix Group Holdings Annual Report and Accounts 2015 159Financials
2014
Fair value of scheme
assets £m
Defined benefit
obligation £m
Provision for tax on the economic
surplus available
as a refund £m
Minimum funding
requirement obligation
£mTotal £m
At 1 January 1,639 (1,366) (96) (17) 160
Interest income/(expense) 75 (60) (4) (2) 9
Administrative expenses (3) – – – (3)
Included in profit or loss 72 (60) (4) (2) 6
Remeasurements:
Return on plan assets excluding amounts included in interest income 277 – – – 277
Gain from change in demographic assumptions – 54 – – 54
Loss from change in financial assumptions – (143) – – (143)
Change in provision for tax on economic surplus available as a refund – – (84) – (84)
Change in minimum funding requirement obligation – – – 6 6
Included in other comprehensive income 277 (89) (84) 6 110
Plan assets previously eliminated on consolidation 74 – – – 74
Employer’s contributions 20 – – – 20
Benefit payments (58) 58 – – –
At 31 December 2,024 (1,457) (184) (13) 370

Phoenix Group Holdings Annual Report and Accounts 2015160
NOTES TO THE IFRS CONSOLIDATEDFINANCIAL STATEMENTSContinued
G. OTHER STATEMENT OF CONSOLIDATED FINANCIAL POSITION NOTES continued
G6. PENSION SCHEMES continued
Scheme assetsThe distribution of the scheme assets at the end of the year was as follows:
2015 2014
Total £m
Of which not quoted in an active
market £m
Total £m
Of which not quoted in an active
market £m
Fixed interest gilts 930 – 1,570 –Index-linked bonds 984 – 373 –Swaps 3 3 (24) (24)Properties 98 98 88 88Hedge funds 83 83 80 80Cash and other 21 – 354 –Obligations for repayment of stock lending collateral received (113) – (417) –
2,006 184 2,024 144
The actual return on plan assets was £33 million (2014: £353 million).
The economic value of the PGL Pension Scheme assets as at 31 December 2015, amounted to £2,028 million (2014: £2,047 million). For financial reporting purposes, the carrying value of the insurance policies effected by the PGL Pension Scheme with the Group have been eliminated on consolidation, resulting in reported assets of the PGL Pension Scheme as at 31 December 2015 of £2,006 million (2014: £2,024 million).
The Group ensures that the investment positions are managed within an asset liability matching (ALM) framework that has been developed to achieve long-term investments that are in line with the obligations under the pension scheme. Within this framework an allocation of 85% of the scheme assets is invested in a combination of supranational debt and a liability hedging portfolio. The Liability Driven Investment (‘LDI’) portfolio is passively managed against a liability benchmark in order to hedge the duration and inflation risks.
The PGL Scheme uses swaps, UK Government bonds and UK Government stock lending to hedge the interest rate and inflation exposure arising from the liabilities. Under the Scheme’s stock lending programme, the Scheme lends a Government bond to an approved counterparty and receives a similar value of cash in return which it typically reinvested into other Government bonds. The Scheme retains economic exposure to the Government bonds, hence the value of the gilts continues to be recognised as a scheme asset with a corresponding liability to repay the cash received as disclosed in the table above.
Defined benefit obligationThe calculation of the defined benefit obligation can be allocated to the scheme’s members as follows:
Ɛ deferred scheme members: 39% (2014: 39%); and
Ɛ retirees: 61% (2014: 61%).
The weighted average duration of the defined benefit obligation at 31 December 2015 is 17 years (2014: 17 years).

Phoenix Group Holdings Annual Report and Accounts 2015 161Financials
Principal assumptionsThe principal financial assumptions of the PGL Pension Scheme are set out in the table below:
2015 %
2014 %
Rate of increase for pensions in payment (7.5% per annum or RPI if lower) 3.10 3.00Rate of increase for deferred pensions (‘CPI’) 2.05 2.00Discount rate 3.85 3.65Inflation – RPI 3.05 3.00Inflation – CPI 2.05 2.00
The discount rate and inflation assumptions have been determined by considering the shape of the appropriate yield curves and the duration of the PGL Scheme liabilities. This method determines an equivalent single rate for each of the discount and inflation rates, which is derived from the profile of projected benefit payments.
It has been assumed that post-retirement mortality is in line with 86%/94% of S1PA base tables with future longevity improvements in line with CMI 2014 Core Projections and a long-term rate of improvement of 2% p.a. up to and including age 75 then decreasing linearly to 0% at age 110. Under these assumptions, the average life expectancy from retirement for a member currently aged 40 retiring at age 62 is 28.4 years and 30.4 years for male and female members respectively.
A quantitative sensitivity analysis for significant actuarial assumptions as at 31 December 2015 is shown below:
2015Assumptions Base Discount rate RPI Life expectancy
Sensitivity level25bps
increase25bps
decrease25bps
increase25bps
decrease1 year
increase1 year
decrease
Impact on the defined benefit obligation (£m) 1,397 (54) 57 37 (39) 46 (46)
2014Assumptions Base Discount rate RPI Life expectancy
Sensitivity level25bps
increase25bps
decrease25bps
increase25bps
decrease1 year
increase1 year
decrease
Impact on the defined benefit obligation (£m) 1,457 (60) 63 40 (38) 46 (44)
The above sensitivity analyses are based on a change in an assumption while holding all other assumptions constant. In practice, this is unlikely to occur, and changes in some of the assumptions may be correlated. When calculating the sensitivity of the defined benefit obligation to significant actuarial assumptions the same method has been applied as when calculating the pension liability recognised within the statement of financial position.
The UK Government currently intends to equalise benefits between males and females arising from the accrual of Guaranteed Minimum Pension (‘GMP’) requirements. Legislation will be implemented following completion of the ongoing consultation on this matter. Once this consultation process has reached a conclusion, the Group will be able to quantify the impact of this change.
Phoenix Group Holdings Annual Report and Accounts 2015162
NOTES TO THE IFRS CONSOLIDATEDFINANCIAL STATEMENTSContinued
G. OTHER STATEMENT OF CONSOLIDATED FINANCIAL POSITION NOTES continued
G7. INTANGIBLE ASSETS
Goodwill
Business combinations are accounted for by applying the purchase method. Goodwill represents the difference between the cost of the acquisition and the fair value of the net identifiable assets acquired.
Goodwill is measured on initial recognition at cost. Following initial recognition, goodwill is stated at cost less any accumulated impairment losses. It is tested for impairment annually or when there is evidence of possible impairment. Goodwill is not amortised. For impairment testing, goodwill is allocated to the Phoenix Life cash-generating unit. Goodwill is impaired when the recoverable amount is less than the carrying value.
Acquired in-force business
Insurance and investment contracts with and without DPF acquired in business combinations and portfolio transfers are measured at fair value at the time of acquisition. The difference between the fair value of the contractual rights acquired and obligations assumed and the liability measured in accordance with the Group’s accounting policies for such contracts is recognised as acquired in-force business.
Acquired in-force business is amortised over the estimated life of the contracts on a basis which recognises the emergence of the economic benefits.
An impairment review is performed whenever there is an indication of impairment. When the recoverable amount is less than the carrying value, an impairment loss is recognised in the consolidated income statement. Acquired in-force business is also considered in the liability adequacy test for each reporting period.
The acquired in-force business is allocated to the Phoenix Life segment.
Customer relationships
Intangible assets include vesting pension premiums and investment management contracts. These are measured on initial recognition at cost. The cost of intangible assets acquired in a business combination is their fair value as at the date of acquisition. Following initial recognition, intangible assets are carried at cost less any accumulated amortisation and any accumulated impairment losses. Internally generated intangible assets are not capitalised and expenditure is reflected in the consolidated income statement in the year in which the expenditure is incurred.
Intangible assets with finite lives are amortised on a straight-line basis over their useful economic lives and assessed for impairment whenever there is an indication that the recoverable amount of the intangible asset is less than its carrying value.
Intangible assets with indefinite useful lives are tested for impairment annually either individually or at the cash-generating unit level. Such intangibles are not amortised.
Present value of future profits on non-participating business in the with-profit fund
The value of the present value of future profits is determined on a realistic basis and is allocated in full to the Phoenix Life segment.
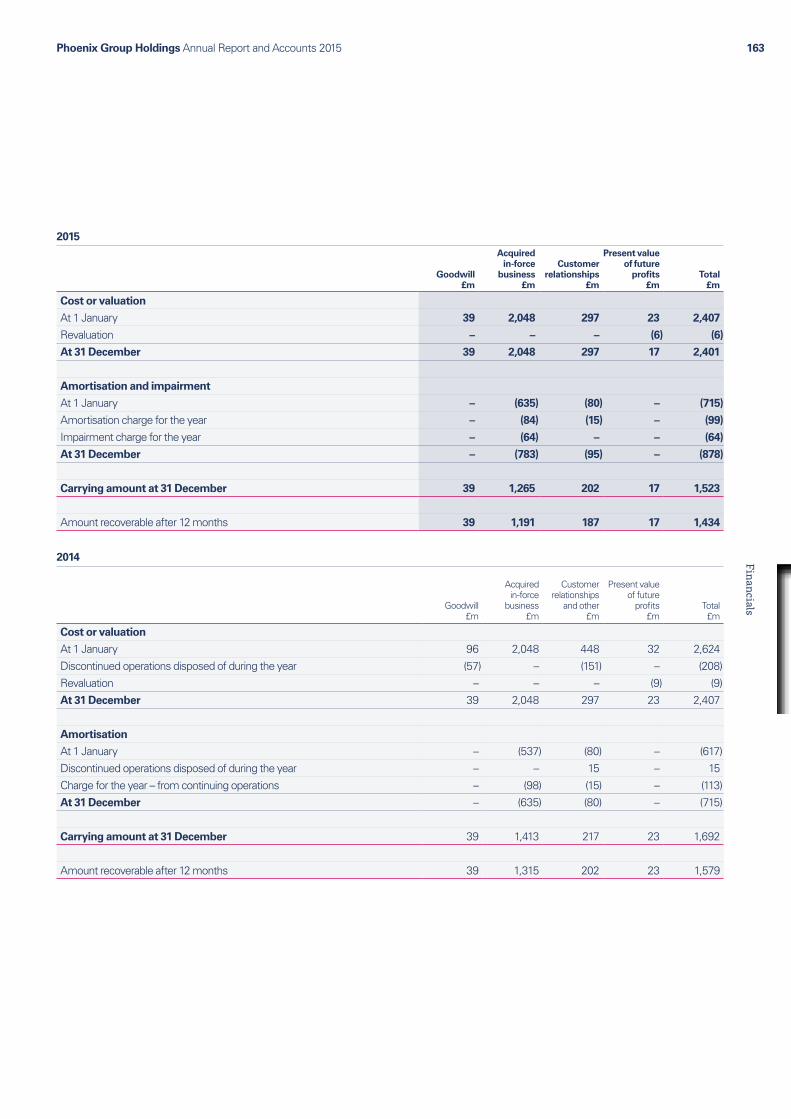
Phoenix Group Holdings Annual Report and Accounts 2015 163Financials
2015
Goodwill £m
Acquired in-force
business £m
Customer
relationships £m
Present value of future
profits £m
Total £m
Cost or valuation
At 1 January 39 2,048 297 23 2,407
Revaluation – – – (6) (6)
At 31 December 39 2,048 297 17 2,401
Amortisation and impairment
At 1 January – (635) (80) – (715)
Amortisation charge for the year – (84) (15) – (99)
Impairment charge for the year – (64) – – (64)
At 31 December – (783) (95) – (878)
Carrying amount at 31 December 39 1,265 202 17 1,523
Amount recoverable after 12 months 39 1,191 187 17 1,434
2014
Goodwill £m
Acquired in-force
business £m
Customer
relationships and other
£m
Present value of future
profits £m
Total £m
Cost or valuation
At 1 January 96 2,048 448 32 2,624Discontinued operations disposed of during the year (57) – (151) – (208)Revaluation – – – (9) (9)At 31 December 39 2,048 297 23 2,407
Amortisation
At 1 January – (537) (80) – (617)Discontinued operations disposed of during the year – – 15 – 15Charge for the year – from continuing operations – (98) (15) – (113)At 31 December – (635) (80) – (715)
Carrying amount at 31 December 39 1,413 217 23 1,692
Amount recoverable after 12 months 39 1,315 202 23 1,579

Phoenix Group Holdings Annual Report and Accounts 2015164
NOTES TO THE IFRS CONSOLIDATEDFINANCIAL STATEMENTSContinued
G. OTHER STATEMENT OF CONSOLIDATED FINANCIAL POSITION NOTES continued
G7. INTANGIBLE ASSETS continued
G7.1 Goodwill
The carrying value of goodwill has been tested for impairment at the period end. No impairment has resulted as the value in use of this intangible continues to exceed its carrying value. Value in use has been determined as the present value of certain future cash flows associated with the management services business of the Phoenix Life segment. The cash flows used in this calculation are consistent with those adopted by management in the Group’s operating plan and, for the period 2020 and beyond, reflect the anticipated run-off of the Phoenix Life insurance business. The underlying assumptions of these projections include management’s best estimates with regards to longevity, persistency, mortality and morbidity.
Future cash flows have been valued using a discount rate of 9.0% (2014: 8.1%) for the management services business of the Phoenix Life segment.
Impairment tests have been performed using assumptions which management consider reasonable. Given the magnitude of the excess of the value in use over carrying value, management does not believe that a reasonably foreseeable change in key assumptions would cause the carrying value to exceed value in use.
Goodwill disposed of during the prior year relates to the disposal of the discontinued operations of Ignis on 1 July 2014 (see note I1.1).
The carrying amount of goodwill allocated to the Phoenix Life segment is £39 million (2014: £39 million).
G7.2 Acquired in-force business
Acquired in-force business represents the difference between the fair value of the contractual rights acquired and obligations assumed under insurance contracts with and without DPF and the liability measured in accordance with the Group’s accounting policies for such contracts. This intangible is being amortised in accordance with the run-off of the book of business within the Phoenix Life segment.
The acquired in-force business is allocated to the Phoenix Life segment.
During the year, an impairment charge of £64 million has been recognised in respect of acquired in-force business originally allocated to contracts issued by PLAL and reinsured to the Group’s Bermudan reinsurance captive, Opal Re. As detailed in note F3.1, the Opal Re reassurance was recaptured during the year and replaced with a new agreement with an external reinsurer, RGA International. Accordingly, the value of the acquired in-force business associated with these contracts has been fully impaired.
G7.3 Customer relationships and other
The customer relationships intangible at 31 December 2015 relates to vesting pension premiums which captures the new business arising from policies in-force at the acquisition date, specifically top-ups made to existing policies and annuities vested from matured pension policies. The total value of this customer relationship intangible at acquisition was £297 million and has been allocated to the Phoenix Life segment. This intangible is being amortised over a 20 year period.
The new UK legislation on pension freedoms that came into force in April 2015 is expected to impact the level of future annuity business written by the Group. This is considered to be an indicator of impairment for the Group’s vesting pension premiums intangible and as a result an impairment test was carried out during the year.
No impairment has resulted as the value in use of the intangible is considered to exceed its carrying value. The value in use was determined as the present value of certain future cash flows associated with annuities vesting from matured pension policies. The cash flows used in this calculation are consistent with those adopted by management in the Group’s operating plan for the next five years, and for the period 2020 and beyond, and reflect the anticipated run-off of the Phoenix Life insurance business. The cash flows are based on long-term future profit margins and risk-free projections of with-profits maturity payments that are largely consistent with the Group’s MCEV basis. The cash flows also include an allowance for future profits earned by the service companies on the administration of vesting policies. The cash flows reflect management’s best estimate of future take-up rates on guaranteed annuity rate business and non-guaranteed annuity rate business. Future cash flows have been valued using a discount rate of 11.2%.
The impairment test was carried out using assumptions which management consider reasonable. However, given the limited experience available to date since the implementation of the pension freedoms, there remains considerable uncertainty as to the long-term impact on policyholder behaviour of the changes to the annuities rules. Were actual experience with regard to the take-up rates and profit margins for annuity business to differ significantly from management’s current best estimate assumptions, there is a potential for the carrying value of the intangible to exceed the value in use.
The customer relationships intangible disposed of during 2014 related to the investment management contracts (‘IMCs’) held within Ignis, the disposal of which was completed on 1 July 2014 (see note I1.1). Other intangibles of £3 million relating to capitalised software costs held within Ignis were also disposed of during 2014.
The amortisation charge for customer relationships and other is presented separately in the consolidated income statement.
G7.4 Present value of future profits on non-participating business in the with-profit fund
The principal assumptions used to calculate the present value of future profits are the same as those used in calculating the insurance contract liabilities given in note F4.1. Revaluation of the present value of future profits is charged or credited to the consolidated income statement as appropriate.

Phoenix Group Holdings Annual Report and Accounts 2015 165Financials
G8. PROPERTY, PLANT AND EQUIPMENT
Owner-occupied property is stated at its revalued amount, being its fair value at the date of the revaluation less any subsequent accumulated depreciation and impairment. Owner-occupied property is depreciated over its estimated useful life, which is taken as 50 years. Land is not depreciated. Gains and losses on owner-occupied property are recognised in the statement of consolidated comprehensive income.
2015 £m
2014 £m
Owner-occupied property 19 15
Jones Lang Lasalle, an accredited independent valuer, completed a valuation of owner-occupied property at 31 December 2015 on an open market basis in accordance with the Royal Institution of Chartered Surveyors’ requirements, which is deemed to equate to fair value. The fair value measurement for the property of £19 million has been categorised as a Level 3 fair value based on the non-observable inputs to the valuation technique used.
The following table shows a reconciliation from the opening to the closing fair value for the Level 3 owner-occupied property at valuation:
2015 £m
At 1 January 15
Depreciation recognised in profit or loss –
Remeasurement recognised in other comprehensive income 4
At 31 December 19
Unrealised gains for the year 4
The fair value of the owner-occupied property at valuation was derived using the investment method supported by comparable evidence. The significant non-observable inputs used in the valuation are the expected rental value per square foot and the capitalisation rate.
The fair value of the owner-occupied property valuation would increase (decrease) if the expected rental value per square foot were to be higher (lower) and the capitalisation rate were to be lower (higher).
G9. INVESTMENT PROPERTY
Investment property is stated at fair value. Fair value is the price that would be received to sell a property in an orderly transaction between market participants at the measurement date. Gains and losses arising from the change in fair value are recognised in the consolidated income statement.
Leases, where a significant portion of the risks and rewards of ownership are retained by the lessor, are classified as operating leases. Where investment property is leased out by the Group, rental income from these operating leases is recognised as income in the consolidated income statement on a straight-line basis over the period of the lease.
2015 £m
2014 £m
At 1 January 1,858 1,603Additions 152 107Improvements 19 7Disposals (227) (59)Gains on adjustments to fair value (recognised in profit and loss) 140 200At 31 December 1,942 1,858Unrealised gains on properties held at end of period 120 194
The property portfolio consists of a mix of commercial sectors, held by the life companies, £420 million (2014: £407 million), and by the UK Commercial Property Trust, £1,312 million (2014: £1,265 million). The portfolio is spread geographically throughout the UK. Investment properties also include £210 million (2014: £186 million) of property reversions arising from sales of the NPI Extra Income Plan (see note E5 for further details).
Commercial investment property is measured at fair value by independent property valuers having appropriate recognised professional qualifications and recent experiences in the location and category of the property being valued. The valuations are carried out in accordance with the Royal Institute of Chartered Surveyors (‘RICS’) guidelines with expected income and capitalisation rate as the key non observable inputs.
The residential property reversions, an interest in customer’s properties which the Group will realise upon their death, are valued using a DCF model based on the Group’s proportion of the current open market value, and discounted for the expected lifetime of the policyholder. The open market value is measured by independent local property surveyors having appropriate recognised professional qualifications with reference to the condition of the property and local market conditions. The individual properties are valued triennially and indexed using regional house price indices to the 31 December 2015. The discount rate is a risk-free rate appropriate for the duration of the asset, adjusted for liquidity and mortality risk. Assumptions are also made in the valuation for future movements in property prices. The residential property reversions have been substantially refinanced under the arrangements with Santander as described in note E5.
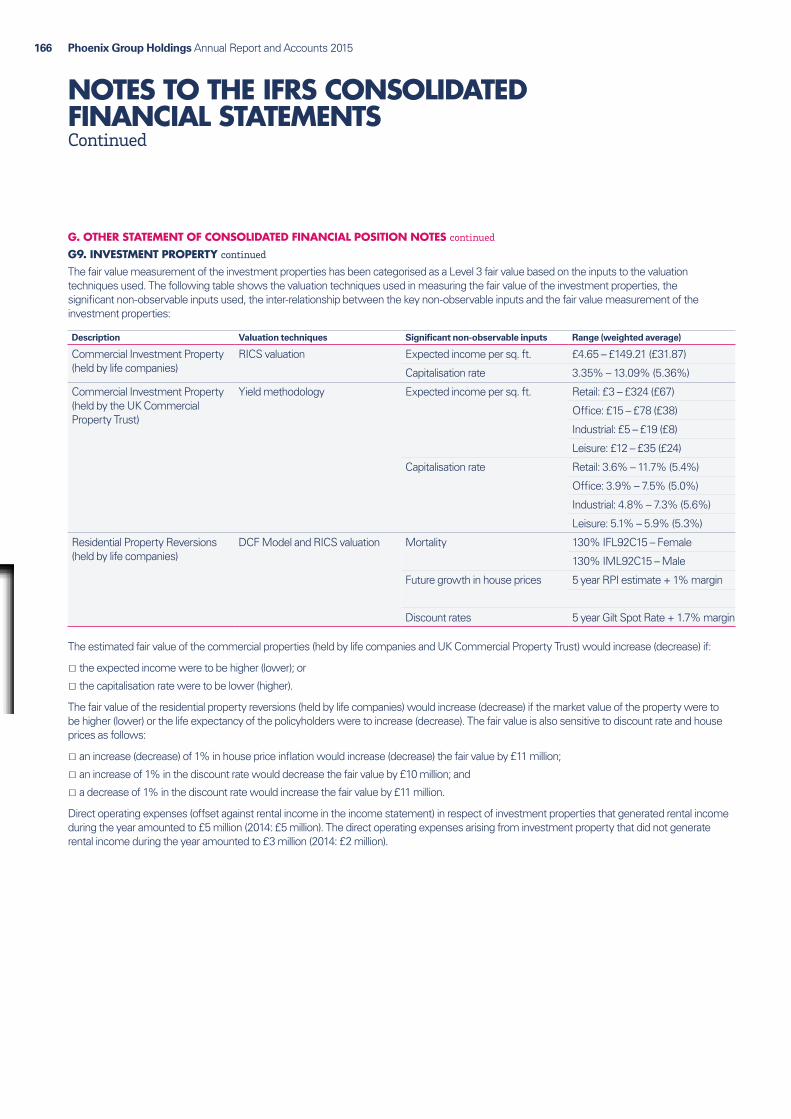
Phoenix Group Holdings Annual Report and Accounts 2015166
NOTES TO THE IFRS CONSOLIDATEDFINANCIAL STATEMENTSContinued
G. OTHER STATEMENT OF CONSOLIDATED FINANCIAL POSITION NOTES continued
G9. INVESTMENT PROPERTY continued
The fair value measurement of the investment properties has been categorised as a Level 3 fair value based on the inputs to the valuation techniques used. The following table shows the valuation techniques used in measuring the fair value of the investment properties, the significant non-observable inputs used, the inter-relationship between the key non-observable inputs and the fair value measurement of the investment properties:
Description Valuation techniques Significant non-observable inputs Range (weighted average)
Commercial Investment Property (held by life companies)
RICS valuation Expected income per sq. ft. £4.65 – £149.21 (£31.87)
Capitalisation rate 3.35% – 13.09% (5.36%)
Commercial Investment Property (held by the UK Commercial Property Trust)
Yield methodology Expected income per sq. ft. Retail: £3 – £324 (£67)
Office: £15 – £78 (£38)
Industrial: £5 – £19 (£8)
Leisure: £12 – £35 (£24)
Capitalisation rate Retail: 3.6% – 11.7% (5.4%)
Office: 3.9% – 7.5% (5.0%)
Industrial: 4.8% – 7.3% (5.6%)
Leisure: 5.1% – 5.9% (5.3%)
Residential Property Reversions (held by life companies)
DCF Model and RICS valuation Mortality 130% IFL92C15 – Female
130% IML92C15 – Male
Future growth in house prices 5 year RPI estimate + 1% margin
Discount rates 5 year Gilt Spot Rate + 1.7% margin
The estimated fair value of the commercial properties (held by life companies and UK Commercial Property Trust) would increase (decrease) if:
Ɛ the expected income were to be higher (lower); or
Ɛ the capitalisation rate were to be lower (higher).
The fair value of the residential property reversions (held by life companies) would increase (decrease) if the market value of the property were to be higher (lower) or the life expectancy of the policyholders were to increase (decrease). The fair value is also sensitive to discount rate and house prices as follows:
Ɛ an increase (decrease) of 1% in house price inflation would increase (decrease) the fair value by £11 million;
Ɛ an increase of 1% in the discount rate would decrease the fair value by £10 million; and
Ɛ a decrease of 1% in the discount rate would increase the fair value by £11 million.
Direct operating expenses (offset against rental income in the income statement) in respect of investment properties that generated rental income during the year amounted to £5 million (2014: £5 million). The direct operating expenses arising from investment property that did not generate rental income during the year amounted to £3 million (2014: £2 million).
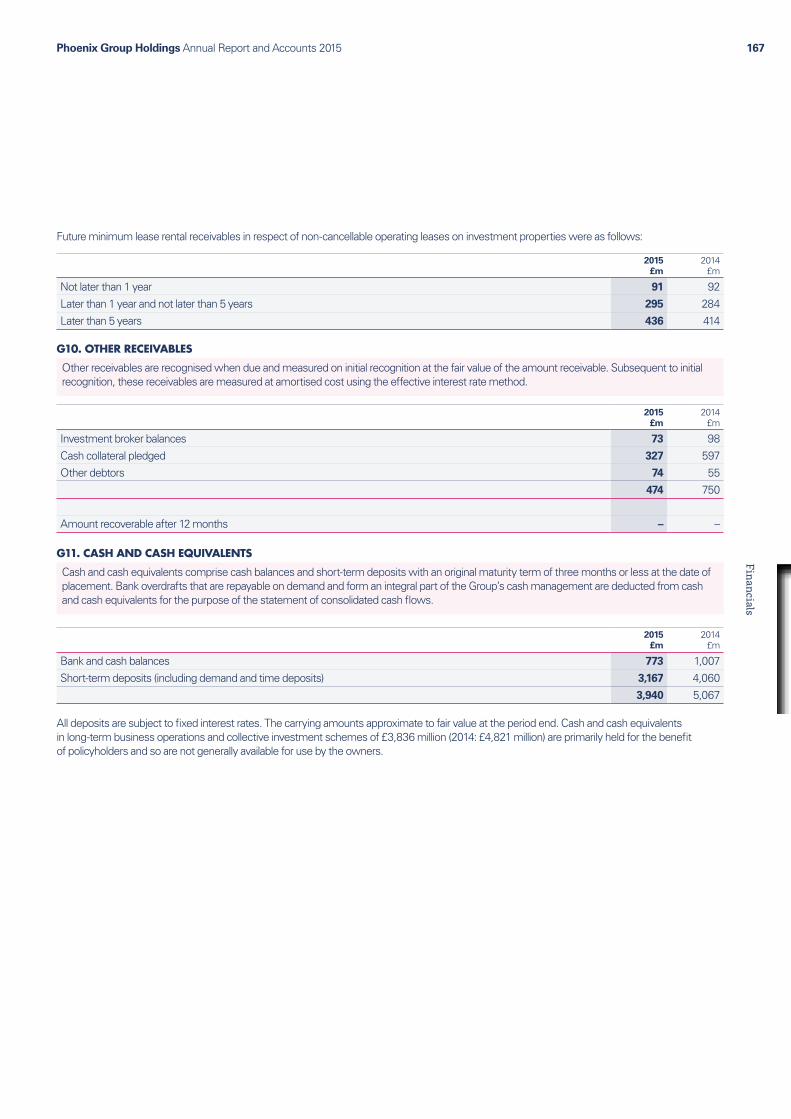
Phoenix Group Holdings Annual Report and Accounts 2015 167Financials
Future minimum lease rental receivables in respect of non-cancellable operating leases on investment properties were as follows:
2015 £m
2014 £m
Not later than 1 year 91 92Later than 1 year and not later than 5 years 295 284Later than 5 years 436 414
G10. OTHER RECEIVABLES
Other receivables are recognised when due and measured on initial recognition at the fair value of the amount receivable. Subsequent to initial recognition, these receivables are measured at amortised cost using the effective interest rate method.
2015 £m
2014 £m
Investment broker balances 73 98Cash collateral pledged 327 597Other debtors 74 55
474 750
Amount recoverable after 12 months – –
G11. CASH AND CASH EQUIVALENTS
Cash and cash equivalents comprise cash balances and short-term deposits with an original maturity term of three months or less at the date of placement. Bank overdrafts that are repayable on demand and form an integral part of the Group’s cash management are deducted from cash and cash equivalents for the purpose of the statement of consolidated cash flows.
2015 £m
2014 £m
Bank and cash balances 773 1,007Short-term deposits (including demand and time deposits) 3,167 4,060
3,940 5,067
All deposits are subject to fixed interest rates. The carrying amounts approximate to fair value at the period end. Cash and cash equivalents in long-term business operations and collective investment schemes of £3,836 million (2014: £4,821 million) are primarily held for the benefit of policyholders and so are not generally available for use by the owners.
Phoenix Group Holdings Annual Report and Accounts 2015168
NOTES TO THE IFRS CONSOLIDATEDFINANCIAL STATEMENTSContinued
H. INTERESTS IN SUBSIDIARIES AND JOINT VENTURESH1. SUBSIDIARIES
Subsidiary undertakings are consolidated from the date that effective control is obtained by the Group (see basis of consolidation in note A1) and are excluded from consolidation from the date they cease to be subsidiary undertakings. For subsidiary undertakings disposed of during the year, any difference between the net proceeds, plus the fair value of any retained interest, and the carrying amount of the subsidiary undertaking including non-controlling interests, is recognised in the consolidated income statement.
The Group uses the purchase method to account for the acquisition of subsidiary undertakings. The cost of an acquisition is measured at the fair value of the consideration. Any excess of the cost of acquisition over the fair value of the net assets acquired is recognised as goodwill. Any excess of the fair value of the net assets acquired over the cost of acquisition is recognised in the consolidated income statement. Directly attributable acquisition costs are included within administrative expenses, except for acquisitions undertaken prior to 2010 when they are included within the cost of the acquisition. Costs directly related to the issuing of debt or equity securities are included within the initial carrying amount of debt or equity securities where these are not carried at fair value. Intra-group balances and income and expenses arising from intra-group transactions are eliminated in preparing the consolidated financial statements.
The Group has invested in a number of collective investment schemes such as Open-ended Investments Companies (‘OEICs’), unit trusts, Société d’Investissement à Capital Variable (‘SICAVs’) and private equity funds. These invest mainly in equities, bonds, property and cash and cash equivalents. The Group’s percentage ownership in these collective investment schemes can fluctuate according to the level of Group and third party participation in structures.
For such collective investment schemes, the following circumstances may indicate, in substance that the Group has power over the investee:
Ɛ where the investee is managed by fund managers outside the Group, the Group has existing substantive rights (such as power of veto and liquidation rights) that give it the ability to direct the current activities of the investee. In assessing the Group’s ability to direct an investee the Group considers its ability relative to other investors; and
Ɛ where the investee is managed by the Group’s fund manager, and the Group holds a significant investment in the investee. It is generally presumed that the Group has rights to variable returns and has the ability to use its power to affect its returns where the Group’s holding is greater than 50%. For holdings between 25% and 50% the Group performs an assessment of power and associated control on a case by case basis. This assessment includes establishing the nature of the decision making rights that the fund manager has over the investee and whether these rights give it the power to control the investee.
Where Group companies are deemed to control such collective investment schemes they are consolidated in the Group financial statements, with the interests of external third parties recognised as a liability, see the accounting policy for ‘Net asset value attributable to unitholders’ in note E1.
Certain of the collective investment schemes have non-coterminous period ends and are consolidated on the basis of additional financial statements prepared to the period end.
H1.1 Significant restrictions
The ability of subsidiary undertakings to transfer funds to the Group in the form of cash dividends or to repay loans and advances is subject to local laws, regulations and solvency requirements.
Each UK Life company and the Group must retain sufficient capital at all times to meet the regulatory capital requirements mandated by or otherwise agreed with the PRA. Further information on the capital requirements applicable to Group entities are set out in the Capital Management note (I4). Under UK company law, dividends can only be paid if a UK company has distributable reserves sufficient to cover the dividend.
In addition, contractual requirements may place restrictions on the transfer of funds as follows:
Ɛ the Pearl Pension Scheme funding agreement includes certain covenants which restrict the transfer of funds within the Group. Details are provided in note G6;
Ɛ as disclosed in note D3.1, deferral of the coupon payable on the Notes may restrict the payment of dividends by certain Group companies; and
Ɛ in the first half of 2014 there was a restriction on the ability of certain subsidiary undertakings to distribute funds to Phoenix Group Holdings as a result of restrictions imposed by the Group’s two credit agreements, namely the Pearl Facility and the Impala Facility. These facilities were replaced with a single debt facility in July 2014 thereby removing these restrictions. Details of restrictions on the payment of dividends imposed by this facility are provided in note E5.
H2. STRUCTURED ENTITIESA structured entity is an entity that has been designed so that voting or similar rights are not the dominant factor in deciding who controls the entity, such as when any voting rights relate to administrative tasks only, and the relevant activities are directed by means of contractual arrangements. A structured entity often has some or all of the following features or attributes: (a) restricted activities; (b) a narrow and well-defined objective, such as to provide investment opportunities for investors by passing on risks and rewards associated with the assets of the structured entity to investors; (c) insufficient equity to permit the structured entity to finance its activities without subordinated financial support; and (d) financing in the form of multiple contractually linked instruments to investors that create concentrations of credit or other risks (tranches).
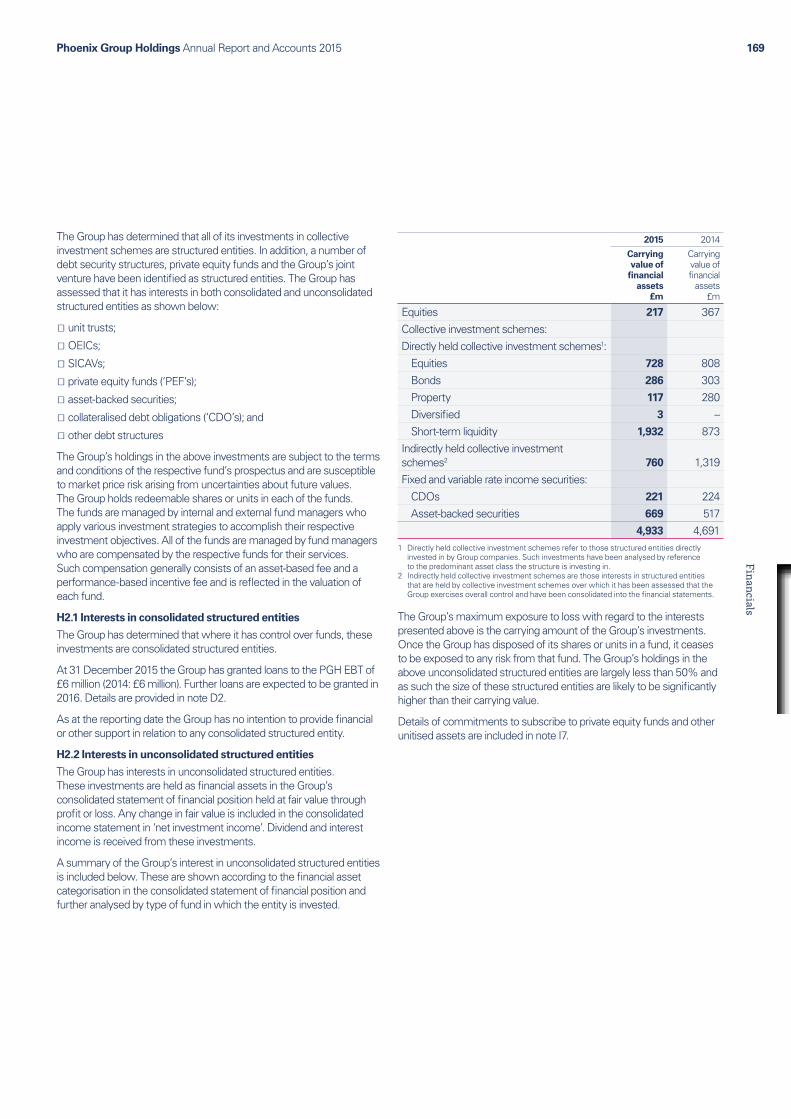
Phoenix Group Holdings Annual Report and Accounts 2015 169Financials
The Group has determined that all of its investments in collective investment schemes are structured entities. In addition, a number of debt security structures, private equity funds and the Group’s joint venture have been identified as structured entities. The Group has assessed that it has interests in both consolidated and unconsolidated structured entities as shown below:
Ɛ unit trusts;
Ɛ OEICs;
Ɛ SICAVs;
Ɛ private equity funds (‘PEF’s);
Ɛ asset-backed securities;
Ɛ collateralised debt obligations (‘CDO’s); and
Ɛ other debt structures
The Group’s holdings in the above investments are subject to the terms and conditions of the respective fund’s prospectus and are susceptible to market price risk arising from uncertainties about future values. The Group holds redeemable shares or units in each of the funds. The funds are managed by internal and external fund managers who apply various investment strategies to accomplish their respective investment objectives. All of the funds are managed by fund managers who are compensated by the respective funds for their services. Such compensation generally consists of an asset-based fee and a performance-based incentive fee and is reflected in the valuation of each fund.
H2.1 Interests in consolidated structured entities
The Group has determined that where it has control over funds, these investments are consolidated structured entities.
At 31 December 2015 the Group has granted loans to the PGH EBT of £6 million (2014: £6 million). Further loans are expected to be granted in 2016. Details are provided in note D2.
As at the reporting date the Group has no intention to provide financial or other support in relation to any consolidated structured entity.
H2.2 Interests in unconsolidated structured entities
The Group has interests in unconsolidated structured entities. These investments are held as financial assets in the Group’s consolidated statement of financial position held at fair value through profit or loss. Any change in fair value is included in the consolidated income statement in ‘net investment income’. Dividend and interest income is received from these investments.
A summary of the Group’s interest in unconsolidated structured entities is included below. These are shown according to the financial asset categorisation in the consolidated statement of financial position and further analysed by type of fund in which the entity is invested.
2015 2014
Carrying value of
financial assets
£m
Carrying value of financial
assets £m
Equities 217 367Collective investment schemes:Directly held collective investment schemes1: Equities 728 808 Bonds 286 303 Property 117 280 Diversified 3 – Short-term liquidity 1,932 873Indirectly held collective investment schemes2 760 1,319Fixed and variable rate income securities: CDOs 221 224 Asset-backed securities 669 517
4,933 4,6911 Directly held collective investment schemes refer to those structured entities directly
invested in by Group companies. Such investments have been analysed by reference to the predominant asset class the structure is investing in.
2 Indirectly held collective investment schemes are those interests in structured entities that are held by collective investment schemes over which it has been assessed that the Group exercises overall control and have been consolidated into the financial statements.
The Group’s maximum exposure to loss with regard to the interests presented above is the carrying amount of the Group’s investments. Once the Group has disposed of its shares or units in a fund, it ceases to be exposed to any risk from that fund. The Group’s holdings in the above unconsolidated structured entities are largely less than 50% and as such the size of these structured entities are likely to be significantly higher than their carrying value.
Details of commitments to subscribe to private equity funds and other unitised assets are included in note I7.
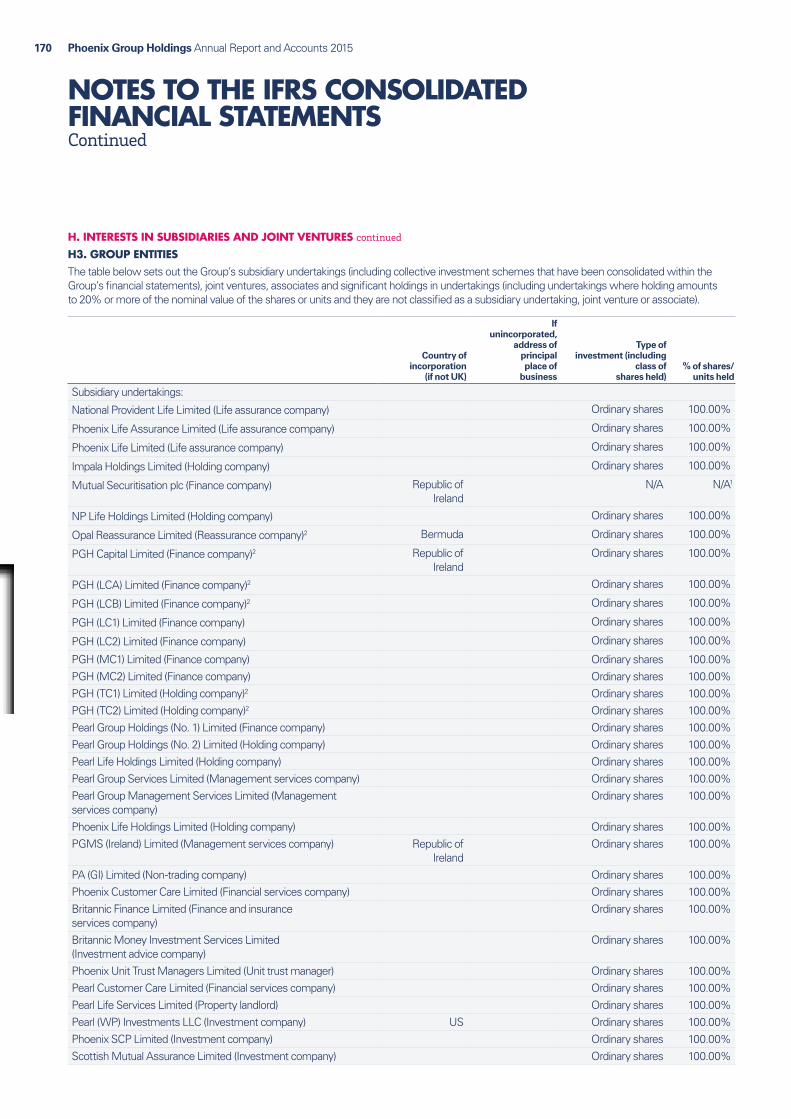
Phoenix Group Holdings Annual Report and Accounts 2015170
NOTES TO THE IFRS CONSOLIDATEDFINANCIAL STATEMENTSContinued
H. INTERESTS IN SUBSIDIARIES AND JOINT VENTURES continued
H3. GROUP ENTITIESThe table below sets out the Group’s subsidiary undertakings (including collective investment schemes that have been consolidated within the Group’s financial statements), joint ventures, associates and significant holdings in undertakings (including undertakings where holding amounts to 20% or more of the nominal value of the shares or units and they are not classified as a subsidiary undertaking, joint venture or associate).
Country of incorporation
(if not UK)
If unincorporated,
address of principal place of
business
Type of investment (including
class of shares held)
% of shares/ units held
Subsidiary undertakings:
National Provident Life Limited (Life assurance company) Ordinary shares 100.00%
Phoenix Life Assurance Limited (Life assurance company) Ordinary shares 100.00%
Phoenix Life Limited (Life assurance company) Ordinary shares 100.00%
Impala Holdings Limited (Holding company) Ordinary shares 100.00%
Mutual Securitisation plc (Finance company) Republic of Ireland
N/A N/A1
NP Life Holdings Limited (Holding company) Ordinary shares 100.00%
Opal Reassurance Limited (Reassurance company)2 Bermuda Ordinary shares 100.00%
PGH Capital Limited (Finance company)2 Republic of Ireland
Ordinary shares 100.00%
PGH (LCA) Limited (Finance company)2 Ordinary shares 100.00%
PGH (LCB) Limited (Finance company)2 Ordinary shares 100.00%
PGH (LC1) Limited (Finance company) Ordinary shares 100.00%
PGH (LC2) Limited (Finance company) Ordinary shares 100.00%
PGH (MC1) Limited (Finance company) Ordinary shares 100.00%PGH (MC2) Limited (Finance company) Ordinary shares 100.00%PGH (TC1) Limited (Holding company)2 Ordinary shares 100.00%PGH (TC2) Limited (Holding company)2 Ordinary shares 100.00%Pearl Group Holdings (No. 1) Limited (Finance company) Ordinary shares 100.00%Pearl Group Holdings (No. 2) Limited (Holding company) Ordinary shares 100.00%Pearl Life Holdings Limited (Holding company) Ordinary shares 100.00%Pearl Group Services Limited (Management services company) Ordinary shares 100.00%Pearl Group Management Services Limited (Management services company)
Ordinary shares 100.00%
Phoenix Life Holdings Limited (Holding company) Ordinary shares 100.00%PGMS (Ireland) Limited (Management services company) Republic of
IrelandOrdinary shares 100.00%
PA (GI) Limited (Non-trading company) Ordinary shares 100.00%Phoenix Customer Care Limited (Financial services company) Ordinary shares 100.00%Britannic Finance Limited (Finance and insurance services company)
Ordinary shares 100.00%
Britannic Money Investment Services Limited (Investment advice company)
Ordinary shares 100.00%
Phoenix Unit Trust Managers Limited (Unit trust manager) Ordinary shares 100.00%Pearl Customer Care Limited (Financial services company) Ordinary shares 100.00%Pearl Life Services Limited (Property landlord) Ordinary shares 100.00%Pearl (WP) Investments LLC (Investment company) US Ordinary shares 100.00%Phoenix SCP Limited (Investment company) Ordinary shares 100.00%Scottish Mutual Assurance Limited (Investment company) Ordinary shares 100.00%

Phoenix Group Holdings Annual Report and Accounts 2015 171Financials
Country of incorporation
(if not UK)
If unincorporated,
address of principal place of
business
Type of investment (including
class of shares held)
% of shares/ units held
Impala Loan Company 1 Limited (Investment company) Ordinary shares 100.00%SMA (Jersey) Limited (Investment company) Jersey Ordinary shares 100.00%ILC1 (Jersey) Limited (Investment company) Jersey Ordinary shares 100.00%PGH1 (Jersey) Limited (Investment company) Jersey Ordinary shares 100.00%IH (Jersey) Limited (Investment company) Jersey Ordinary shares 100.00%Pearl Assurance Group Holdings Limited (Investment company) Ordinary shares 100.00%PGMS (Ireland) Holdings (Holding company) Republic of
IrelandOrdinary shares 100.00%
PGMS (Glasgow) Limited (Investment company) Ordinary shares 100.00%Phoenix SCP Pensions Trustees Limited (Trustee company) Ordinary shares 100.00%Phoenix SCP Trustees Limited (Trustee company) Ordinary shares 100.00%PGS2 Limited (Investment company) Ordinary shares 100.00%Century Group Limited (Investment company) Ordinary shares 100.00%Pearl RLH Limited (Investment holding company) Ordinary shares 100.00%SPL (Holdings) Limited (Investment holding company) Ordinary shares 100.00%Alcobendas Entrust Limited (Investment company) Ordinary shares 100.00%Scottish Mutual Pension Funds Investment Limited (Trustee company)
Ordinary shares 100.00%
Britannic Group Services Limited (Dormant company) Ordinary shares 100.00%Phoenix Pensions Trustee Services Limited (Dormant company) Ordinary shares 100.00%Pearl (Covent Garden) Limited (Dormant company) Ordinary shares 100.00%NPI (Westgate) Limited (Dormant company) Ordinary shares 100.00%NPI (Printworks) Limited (Dormant company) Ordinary shares 100.00%Pearl (Barwell 2) Limited (Dormant company) Ordinary shares 100.00%Pearl (Chiswick House) Limited (Dormant company) Ordinary shares 100.00%Pearl (Printworks) Limited (Dormant company) Ordinary shares 100.00%Pearl (Stockley Park) Limited (Dormant company) Ordinary shares 100.00%London Life Trustees Limited (Dormant company) Ordinary shares 100.00%Pearl Trustees Limited (Dormant company) Ordinary shares 100.00%Pearl Group Secretariat Services Limited (Dormant company) Ordinary shares 100.00%Phoenix Life Pension Trust Limited (Dormant company) Ordinary shares 100.00%Century Trustee Services Limited (Dormant company) Ordinary shares 100.00%Pearl AL Limited (Dormant company) Ordinary shares 100.00%Phoenix Pensions Limited (Dormant company) Ordinary shares 100.00%Bradford Insurance Company Limited (Dormant company) Ordinary shares 100.00%Clearfol Investment Limited (Dormant company) Ordinary shares 100.00%Pearl PLP Limited (Dormant company) Ordinary shares 100.00%SL Liverpool PLC (Dormant company) Ordinary shares 100.00%SPL (Holdings 1) Limited (Non-trading company) Ordinary shares 100.00%Zilmer Limited (Dormant company) Ordinary shares 100.00%Alba Life Trustees Limited (Non-trading company) Ordinary shares 100.00%Scottish Mutual Customer Care Limited (Dormant company) Ordinary shares 100.00%BA (FURBS) Limited (Dormant company) Ordinary shares 100.00%PG Dormant No. 1 Limited (Dormant company) Ordinary shares 100.00%Phoenix Annuities Limited (Dormant company) Ordinary shares 100.00%

Phoenix Group Holdings Annual Report and Accounts 2015172
NOTES TO THE IFRS CONSOLIDATEDFINANCIAL STATEMENTSContinued
H. INTERESTS IN SUBSIDIARIES AND JOINT VENTURES continued
H3. GROUP ENTITIES continued
Country of incorporation
(if not UK)
If unincorporated,
address of principal place of
business
Type of investment
(including class of
shares held)% of shares/
units held
Phoenix Pension Scheme (Trustees) Limited Ordinary shares 100.00%Evergreen Trustee Limited (Dormant company) Ordinary shares 100.00%Corunna Limited (Dormant company) Ordinary shares 100.00%Pearl ULA Limited (Dormant company) Ordinary shares 100.00%Scottish Mutual Nominees Limited (Dormant company) Ordinary shares 100.00%National Provident Institution (Dormant company) Unlimited without
sharesN/A
Phoenix & London Assurance Limited (Dormant company) Ordinary shares 100.00%Cityfournic (Dormant company) Ordinary shares 100.00%Phoenix Life Insurance Services Limited Ordinary shares 100.00%Scottish Mutual International Holdings (Holding company) Republic of
IrelandOrdinary shares 100.00%
London Life Limited (Non-trading company) Ordinary shares 100.00%Pearl RLG Limited (Dormant company) Ordinary shares 100.00%The London Life Association Limited (Dormant company) Limited by guarantee N/APearl BULA Limited (Dormant company) Ordinary shares 100.00%The Scottish Mutual Assurance Society (Dormant company) Limited by guarantee N/AThe Phoenix Life SCP Institution (Dormant company) Limited by guarantee N/AAlba LAS Pensions Management Limited (Dormant company) Ordinary shares 100.00%Axial Fundamental Strategies (US Investments) LLC (Non-trading company)
US Ordinary shares 100.00%
Bellevale Properties Limited (Holding company) Gibraltar Ordinary shares 100.00%Pearl Breakfast Unit Trust (Jersey Property Unit Trust) Jersey Units 100.00%Pearl (Martineau Phase 2) Limited (Dormant company) Ordinary shares 100.00%Pearl MG Birmingham Limited (Dormant company) Ordinary shares 100.00%The Pearl Martineau Galleries Limited Partnership (Dormant) Limited Partnership 100.00%Pearl (Martineau Phase 1) Limited (Dormant company) Ordinary shares 100.00%Pearl MP Birmingham Limited (Dormant company) Ordinary shares 100.00%The Pearl Martineau Limited Partnership (Dormant company) Limited Partnership 100.00%Pearl (Moor House 1) Limited (Dormant company) Ordinary shares 100.00%Pearl (Moor House 2) Limited (Dormant company) Ordinary shares 100.00%Pearl (Moor House) Limited (Dormant company) Ordinary shares 100.00%UK Commercial Property Trust Limited (Property investment company)
Guernsey Ordinary shares 50.02%
UK Commercial Property Estates Holdings Limited (Property investment company)
Guernsey Ordinary shares 50.02%
UK Commercial Property Holdings Limited (Property investment company)
Guernsey Ordinary shares 50.02%
UK Commercial Property Estates Limited (Property investment company)
Guernsey Ordinary shares 50.02%
UK Commercial Property Nominee Limited (Property investment company)
Guernsey Ordinary shares 50.02%
UK Commercial Property GP Limited Guernsey Ordinary shares 50.02%UKCPT Limited Partnership Guernsey Limited Partnership 50.02%
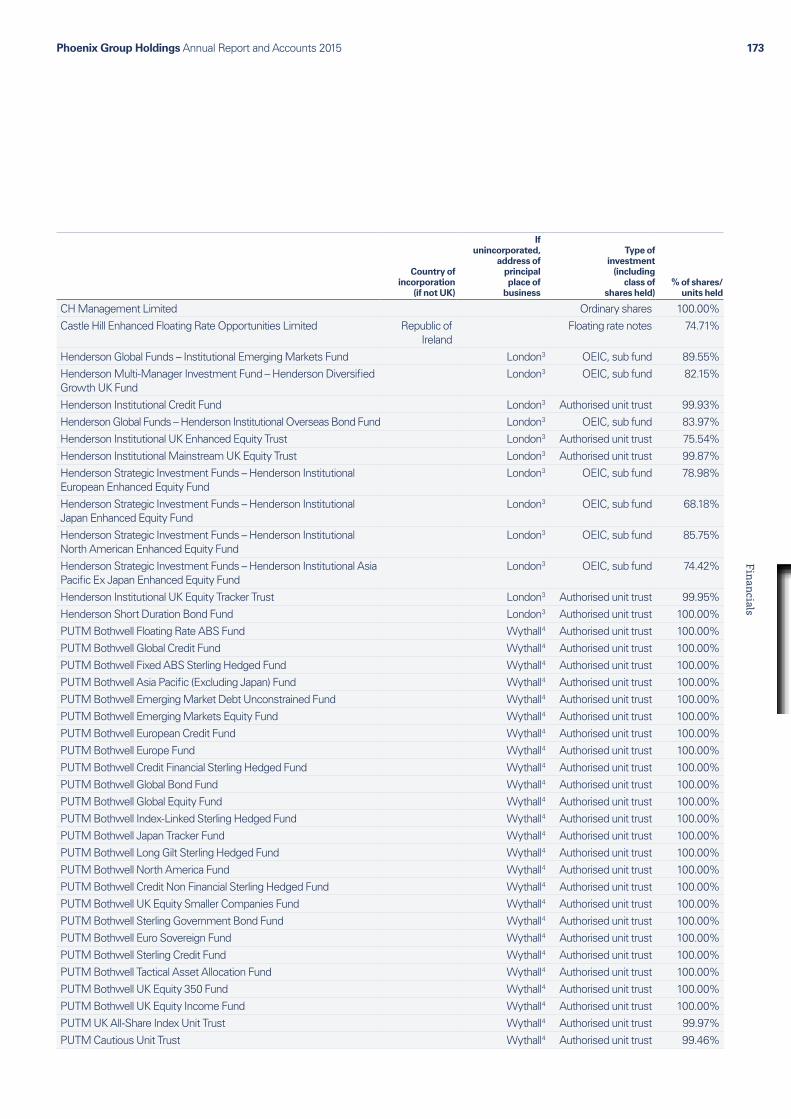
Phoenix Group Holdings Annual Report and Accounts 2015 173Financials
Country of incorporation
(if not UK)
If unincorporated,
address of principal place of
business
Type of investment
(including class of
shares held)% of shares/
units held
CH Management Limited Ordinary shares 100.00%Castle Hill Enhanced Floating Rate Opportunities Limited Republic of
IrelandFloating rate notes 74.71%
Henderson Global Funds – Institutional Emerging Markets Fund London 3 OEIC, sub fund 89.55%Henderson Multi-Manager Investment Fund – Henderson Diversified Growth UK Fund
London 3 OEIC, sub fund 82.15%
Henderson Institutional Credit Fund London 3 Authorised unit trust 99.93%Henderson Global Funds – Henderson Institutional Overseas Bond Fund London 3 OEIC, sub fund 83.97%Henderson Institutional UK Enhanced Equity Trust London 3 Authorised unit trust 75.54%Henderson Institutional Mainstream UK Equity Trust London 3 Authorised unit trust 99.87%Henderson Strategic Investment Funds – Henderson Institutional European Enhanced Equity Fund
London 3 OEIC, sub fund 78.98%
Henderson Strategic Investment Funds – Henderson Institutional Japan Enhanced Equity Fund
London 3 OEIC, sub fund 68.18%
Henderson Strategic Investment Funds – Henderson Institutional North American Enhanced Equity Fund
London 3 OEIC, sub fund 85.75%
Henderson Strategic Investment Funds – Henderson Institutional Asia Pacific Ex Japan Enhanced Equity Fund
London 3 OEIC, sub fund 74.42%
Henderson Institutional UK Equity Tracker Trust London 3 Authorised unit trust 99.95%Henderson Short Duration Bond Fund London 3 Authorised unit trust 100.00%PUTM Bothwell Floating Rate ABS Fund Wythall 4 Authorised unit trust 100.00%PUTM Bothwell Global Credit Fund Wythall 4 Authorised unit trust 100.00%PUTM Bothwell Fixed ABS Sterling Hedged Fund Wythall 4 Authorised unit trust 100.00%PUTM Bothwell Asia Pacific (Excluding Japan) Fund Wythall 4 Authorised unit trust 100.00%PUTM Bothwell Emerging Market Debt Unconstrained Fund Wythall 4 Authorised unit trust 100.00%PUTM Bothwell Emerging Markets Equity Fund Wythall 4 Authorised unit trust 100.00%PUTM Bothwell European Credit Fund Wythall 4 Authorised unit trust 100.00%PUTM Bothwell Europe Fund Wythall 4 Authorised unit trust 100.00%PUTM Bothwell Credit Financial Sterling Hedged Fund Wythall 4 Authorised unit trust 100.00%PUTM Bothwell Global Bond Fund Wythall 4 Authorised unit trust 100.00%PUTM Bothwell Global Equity Fund Wythall 4 Authorised unit trust 100.00%PUTM Bothwell Index-Linked Sterling Hedged Fund Wythall 4 Authorised unit trust 100.00%PUTM Bothwell Japan Tracker Fund Wythall 4 Authorised unit trust 100.00%PUTM Bothwell Long Gilt Sterling Hedged Fund Wythall 4 Authorised unit trust 100.00%PUTM Bothwell North America Fund Wythall 4 Authorised unit trust 100.00%PUTM Bothwell Credit Non Financial Sterling Hedged Fund Wythall 4 Authorised unit trust 100.00%PUTM Bothwell UK Equity Smaller Companies Fund Wythall 4 Authorised unit trust 100.00%PUTM Bothwell Sterling Government Bond Fund Wythall 4 Authorised unit trust 100.00%PUTM Bothwell Euro Sovereign Fund Wythall 4 Authorised unit trust 100.00%PUTM Bothwell Sterling Credit Fund Wythall 4 Authorised unit trust 100.00%PUTM Bothwell Tactical Asset Allocation Fund Wythall 4 Authorised unit trust 100.00%PUTM Bothwell UK Equity 350 Fund Wythall 4 Authorised unit trust 100.00%PUTM Bothwell UK Equity Income Fund Wythall 4 Authorised unit trust 100.00%PUTM UK All-Share Index Unit Trust Wythall 4 Authorised unit trust 99.97%PUTM Cautious Unit Trust Wythall 4 Authorised unit trust 99.46%
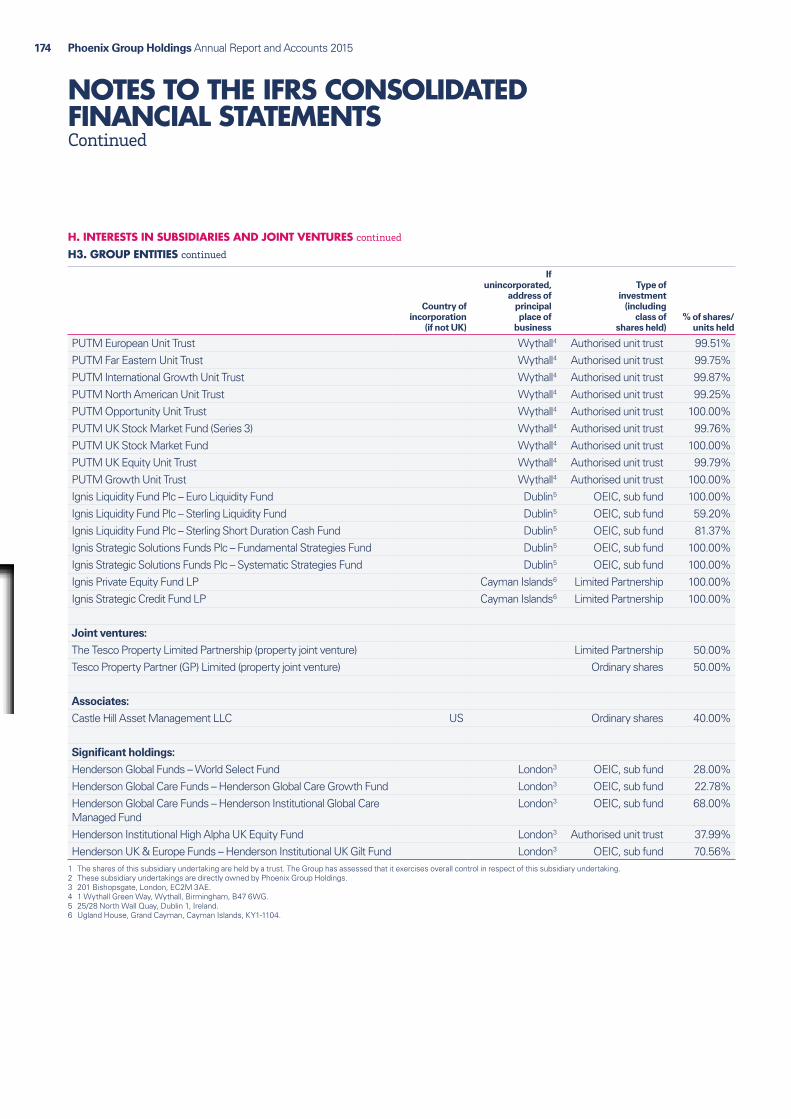
Phoenix Group Holdings Annual Report and Accounts 2015174
NOTES TO THE IFRS CONSOLIDATEDFINANCIAL STATEMENTSContinued
H. INTERESTS IN SUBSIDIARIES AND JOINT VENTURES continued
H3. GROUP ENTITIES continued
Country of incorporation
(if not UK)
If unincorporated,
address of principal place of
business
Type of investment
(including class of
shares held)% of shares/
units held
PUTM European Unit Trust Wythall 4 Authorised unit trust 99.51%PUTM Far Eastern Unit Trust Wythall 4 Authorised unit trust 99.75%PUTM International Growth Unit Trust Wythall 4 Authorised unit trust 99.87%PUTM North American Unit Trust Wythall 4 Authorised unit trust 99.25%PUTM Opportunity Unit Trust Wythall 4 Authorised unit trust 100.00%PUTM UK Stock Market Fund (Series 3) Wythall 4 Authorised unit trust 99.76%PUTM UK Stock Market Fund Wythall 4 Authorised unit trust 100.00%PUTM UK Equity Unit Trust Wythall 4 Authorised unit trust 99.79%PUTM Growth Unit Trust Wythall 4 Authorised unit trust 100.00%Ignis Liquidity Fund Plc – Euro Liquidity Fund Dublin 5 OEIC, sub fund 100.00%Ignis Liquidity Fund Plc – Sterling Liquidity Fund Dublin 5 OEIC, sub fund 59.20%Ignis Liquidity Fund Plc – Sterling Short Duration Cash Fund Dublin 5 OEIC, sub fund 81.37%Ignis Strategic Solutions Funds Plc – Fundamental Strategies Fund Dublin 5 OEIC, sub fund 100.00%Ignis Strategic Solutions Funds Plc – Systematic Strategies Fund Dublin 5 OEIC, sub fund 100.00%Ignis Private Equity Fund LP Cayman Islands 6 Limited Partnership 100.00%Ignis Strategic Credit Fund LP Cayman Islands 6 Limited Partnership 100.00%
Joint ventures:
The Tesco Property Limited Partnership (property joint venture) Limited Partnership 50.00%Tesco Property Partner (GP) Limited (property joint venture) Ordinary shares 50.00%
Associates:
Castle Hill Asset Management LLC US Ordinary shares 40.00%
Significant holdings:
Henderson Global Funds – World Select Fund London 3 OEIC, sub fund 28.00%Henderson Global Care Funds – Henderson Global Care Growth Fund London 3 OEIC, sub fund 22.78%Henderson Global Care Funds – Henderson Institutional Global Care Managed Fund
London 3 OEIC, sub fund 68.00%
Henderson Institutional High Alpha UK Equity Fund London 3 Authorised unit trust 37.99%Henderson UK & Europe Funds – Henderson Institutional UK Gilt Fund London 3 OEIC, sub fund 70.56%
1 The shares of this subsidiary undertaking are held by a trust. The Group has assessed that it exercises overall control in respect of this subsidiary undertaking.2 These subsidiary undertakings are directly owned by Phoenix Group Holdings.3 201 Bishopsgate, London, EC2M 3AE.4 1 Wythall Green Way, Wythall, Birmingham, B47 6WG.5 25/28 North Wall Quay, Dublin 1, Ireland.6 Ugland House, Grand Cayman, Cayman Islands, KY1-1104.
Phoenix Group Holdings Annual Report and Accounts 2015 175Financials
The following subsidiary undertakings were fully disposed of during the period and were deconsolidated from the date of disposal:
Ɛ Scottish Mutual International Limited (life assurance company) (for further details see note I1.3);
Ɛ Castle Hill Credit Opportunities Holdings Limited (for further details see note I1.4);
Ɛ Castle Hill Fixed Income Opportunities Sarl;
Ɛ PUTM Bothwell Emerging Market Debt Absolute Return Fund;
Ɛ Ignis Funds SICAV – Ignis Absolute Return Emerging Market Debt Fund;
Ɛ Ignis Funds SICAV – Global Emerging Markets Equity Fund; and
Ɛ Ignis Global Growth Fund.
The following subsidiary undertakings were reclassified as significant holdings due to the loss of effective control by the Group during the period:
Ɛ Henderson Global Care Funds – Henderson Institutional Global Care Managed Fund.
I. OTHER NOTESI1. DISCONTINUED OPERATIONS, ASSETS AND LIABILITIES HELD FOR SALE AND DISPOSALS
A discontinued operation is a component of the Group’s business, the operations and cash flows of which can be clearly distinguished from the rest of the Group and which:
Ɛ represents a separate major line of business; and
Ɛ is part of a coordinated plan to dispose of a separate line of business.
Classification as a discontinued operation occurs at the earlier of disposal or when the operation meets the criteria to be classified as held for sale. When an operation is classified as a discontinued operation, the comparative consolidated income statement and statement of comprehensive income is re-presented as if the operation had been discontinued from the start of the comparative year.
Non-current assets or disposal groups are classified separately as held for sale in the statement of financial position when their carrying amount will be recovered through a sale transaction rather than through continuing use. This condition is met only when the sale is highly probable, the asset or disposal group is available for immediate sale in its present condition, and management is committed to the sale, which should be expected to qualify for recognition as a completed sale within one year from the date of classification. Liabilities directly associated with the assets classified as held for sale and expected to be included as part of the sale transaction are correspondingly also classified separately. The net assets and liabilities of a disposal group classified as held for sale are measured at the lower of their carrying amount and fair value less costs to sell.
I1.1 Discontinued operations
On 25 March 2014, the Group and Standard Life Investments (Holdings) Limited (‘Standard Life Investments’) signed a disposal agreement under which Standard Life Investments agreed to acquire the entire issued share capital of Ignis in return for gross cash consideration of £390 million. The divestment was completed on 1 July 2014 and the results for the business have been included in the Ignis operating segment up to this date. A post completion payment of £6 million, calculated in accordance with the sale and purchase agreement, was paid to Standard Life Investments on 24 September 2014.
As part of the divestment, the Group agreed to a purchase price adjustment for a period of 10 years from the date of the divestment in the event that assets held by the life companies are withdrawn from management by Ignis Asset Management, other than for specific reasons such as poor investment performance or for material breaches of investment management contracts. In 2015 a liability of £2 million was recognised as due to Standard Life Investments in respect of assets no longer managed by Ignis Asset Management following the recapture of annuity liabilities from Opal Re, a subsidiary undertaking of the Company, and the subsequent reinsurance to RGA International. The expense has been recognised in the consolidated income statement in administrative expenses.
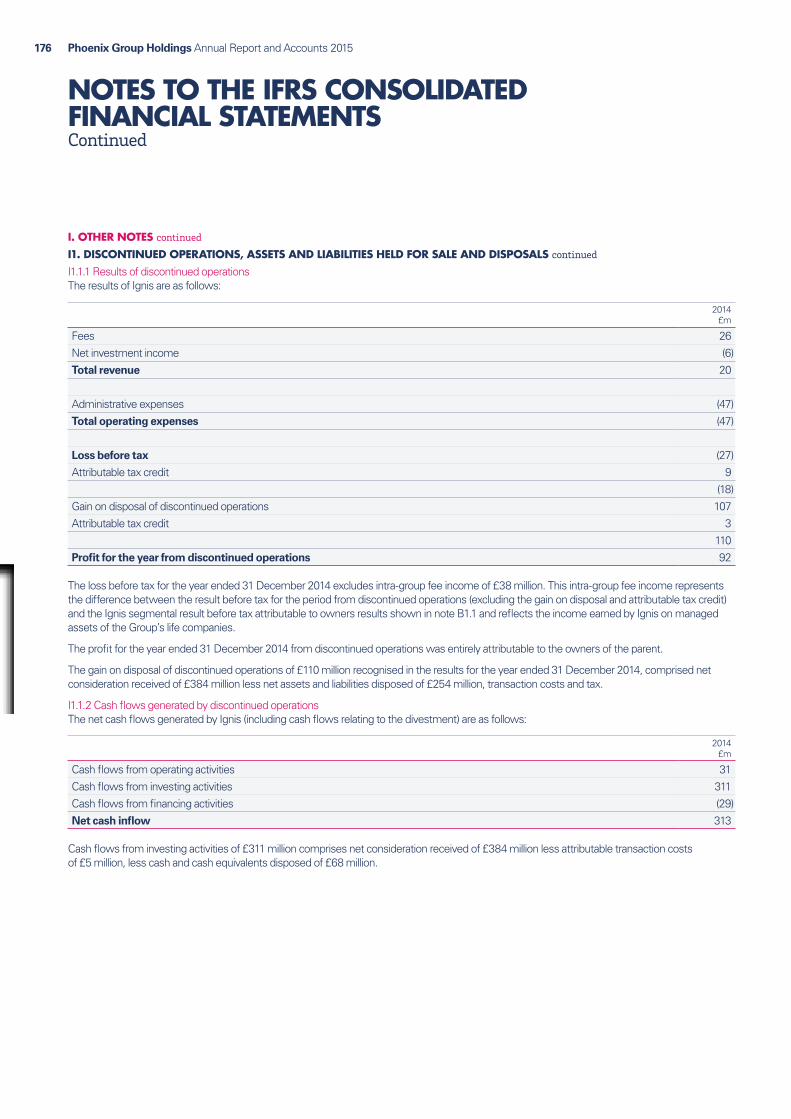
Phoenix Group Holdings Annual Report and Accounts 2015176
NOTES TO THE IFRS CONSOLIDATEDFINANCIAL STATEMENTSContinued
I. OTHER NOTES continued
I1. DISCONTINUED OPERATIONS, ASSETS AND LIABILITIES HELD FOR SALE AND DISPOSALS continued
I1.1.1 Results of discontinued operationsThe results of Ignis are as follows:
2014 £m
Fees 26Net investment income (6)Total revenue 20
Administrative expenses (47)Total operating expenses (47)
Loss before tax (27)Attributable tax credit 9
(18)Gain on disposal of discontinued operations 107Attributable tax credit 3
110Profit for the year from discontinued operations 92
The loss before tax for the year ended 31 December 2014 excludes intra-group fee income of £38 million. This intra-group fee income represents the difference between the result before tax for the period from discontinued operations (excluding the gain on disposal and attributable tax credit) and the Ignis segmental result before tax attributable to owners results shown in note B1.1 and reflects the income earned by Ignis on managed assets of the Group’s life companies.
The profit for the year ended 31 December 2014 from discontinued operations was entirely attributable to the owners of the parent.
The gain on disposal of discontinued operations of £110 million recognised in the results for the year ended 31 December 2014, comprised net consideration received of £384 million less net assets and liabilities disposed of £254 million, transaction costs and tax.
I1.1.2 Cash flows generated by discontinued operationsThe net cash flows generated by Ignis (including cash flows relating to the divestment) are as follows:
2014 £m
Cash flows from operating activities 31Cash flows from investing activities 311Cash flows from financing activities (29)Net cash inflow 313
Cash flows from investing activities of £311 million comprises net consideration received of £384 million less attributable transaction costs of £5 million, less cash and cash equivalents disposed of £68 million.
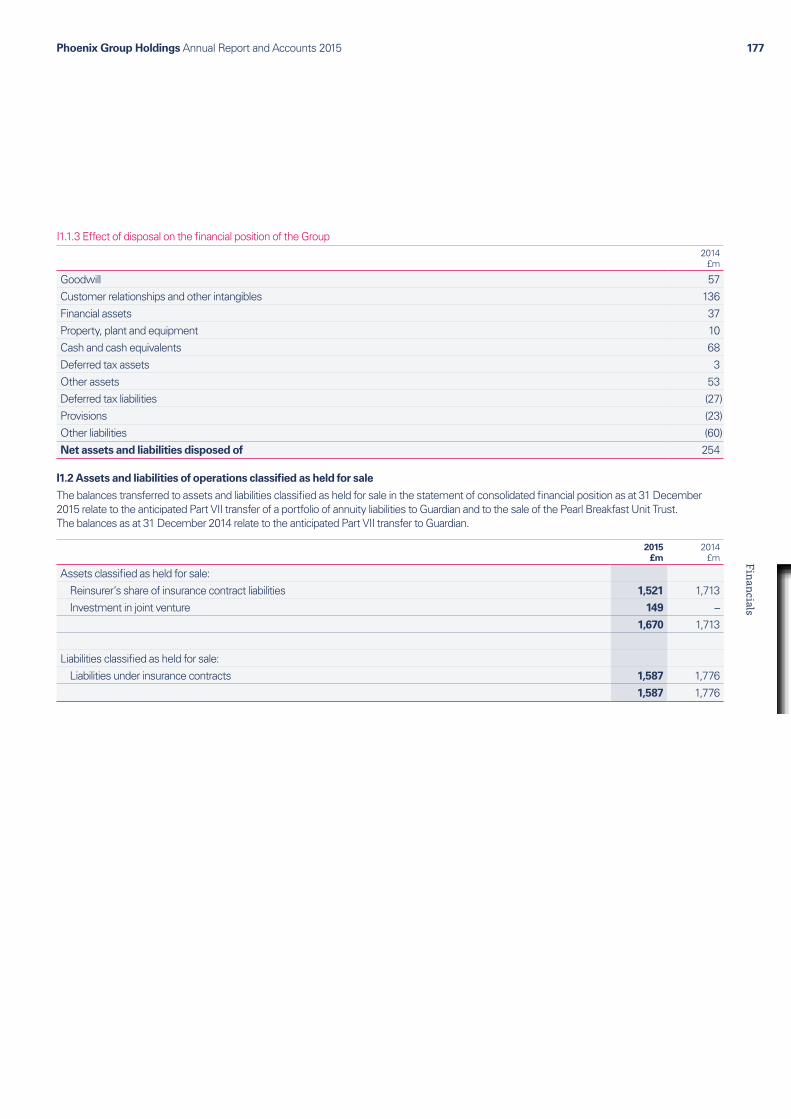
Phoenix Group Holdings Annual Report and Accounts 2015 177Financials
I1.1.3 Effect of disposal on the financial position of the Group2014
£m
Goodwill 57Customer relationships and other intangibles 136Financial assets 37Property, plant and equipment 10Cash and cash equivalents 68Deferred tax assets 3Other assets 53Deferred tax liabilities (27)Provisions (23)Other liabilities (60)Net assets and liabilities disposed of 254
I1.2 Assets and liabilities of operations classified as held for sale
The balances transferred to assets and liabilities classified as held for sale in the statement of consolidated financial position as at 31 December 2015 relate to the anticipated Part VII transfer of a portfolio of annuity liabilities to Guardian and to the sale of the Pearl Breakfast Unit Trust. The balances as at 31 December 2014 relate to the anticipated Part VII transfer to Guardian.
2015 £m
2014 £m
Assets classified as held for sale: Reinsurer’s share of insurance contract liabilities 1,521 1,713 Investment in joint venture 149 –
1,670 1,713
Liabilities classified as held for sale: Liabilities under insurance contracts 1,587 1,776
1,587 1,776

Phoenix Group Holdings Annual Report and Accounts 2015178
NOTES TO THE IFRS CONSOLIDATEDFINANCIAL STATEMENTSContinued
I. OTHER NOTES continued
I1. DISCONTINUED OPERATIONS, ASSETS AND LIABILITIES HELD FOR SALE AND DISPOSALS continued
I1.2.1 Annuity liabilities transferOn 31 July 2014, the Group entered into a reinsurance agreement, effective from 1 January 2014, to reinsure certain portfolios of the Group’s annuity liabilities to Guardian in exchange for the transfer of financial assets of £1.7 billion. The annuity in-payment liabilities are currently held in the Group’s with-profit funds. It is highly probable that the reinsurance agreement will be replaced by a formal scheme under Part VII of the Financial Services and Market Act 2000 to transfer the annuity liabilities to Guardian or a member of its group. Management’s expectations are that the necessary approvals will be in place by the end of 2016. The parties remain committed to fulfilling their contractual obligations in relation to the Part VII. Accordingly the assets and liabilities to be transferred have been classified as held for sale.
Liabilities classified as held for sale include the annuity liabilities reinsured to Guardian and directly attributable expense reserves where they will be extinguished at the time of transfer. Assets classified as held for sale include the associated reinsurers’ share of insurance contract liabilities.
Under the terms of this reinsurance agreement Guardian holds assets in a collateral account over which the Group has a fixed charge as disclosed in note F3.2.
I1.2.2 Sale of Pearl Breakfast Unit TrustAt 31 December 2015 the Group invested in an investment property joint venture which was held by the Pearl Breakfast Unit Trust. In 2015 the Group committed to selling the Pearl Breakfast Unit Trust (and consequently its investment in the joint venture) and on 25 February 2016 the units in the Pearl Breakfast Unit Trust were sold to Tesco Property Holdings (No.2) Limited and Tesco Property Holdings Limited. As part of the sale agreement Tesco plc also purchased the Group’s investment in Tesco Property Partner (GP) Limited.
The Group’s investment in the joint venture has therefore been classified as held for sale as at 31 December 2015.
I1.3 Scottish Mutual International (‘SMI’)
On 2 December 2015, the Group completed the sale of its entire interest in SMI for gross cash consideration of £14 million following a pre-completion return of capital by SMI. The carrying value of the net assets transferred was £1 million which excludes £11 million of recoverables under an intercompany reinsurance agreement that is eliminated on consolidation.
2015 £m
Cash consideration received (net of transaction costs) 12
Less: carrying value of net assets sold Financial assets (181)
Cash and cash equivalents (12)
Other receivables (1)
Liabilities under insurance contracts 169
Unallocated surplus 20
Other liabilities 4
(1)
Intercompany liabilities under insurance contracts assumed on disposal (11)
Loss on sale (net of tax) –
I1.4 Castle Hill Credit Opportunities Holding Limited (‘CHCOHL’)
During the second half of 2015, the Group completed the disposal of its entire investment in the Sterling (Class A) loan notes of CHCOHL. No gain or loss arose on the disposal of the investment as the net assets of the structure were carried at fair value in the consolidated financial statements.
I1.5 BAGI
The Group completed the sale of its entire interest in BAGI to National Indemnity Company on 18 March 2014 for cash consideration of £21 million. The carrying value of the net assets transferred was £17 million, resulting in a pre-tax gain of £4 million.

Phoenix Group Holdings Annual Report and Accounts 2015 179Financials
I2. SHARE-BASED PAYMENT
Equity-settled share-based payments to employees and others providing services are measured at the fair value of the equity instruments at the grant date. The fair value excludes the effect of non-market-based vesting conditions. Further details regarding the determination of the fair value of equity-settled share-based transactions are set below.
The fair value determined at the grant date of the equity-settled share-based payments is expensed on a straight-line basis over the vesting period, based on the Group’s estimate of equity instruments that will eventually vest. At each period end, the Group revises its estimate of the number of equity instruments expected to vest as a result of the effect of non-market-based vesting conditions. The impact of the revision of the original estimates, if any, is recognised in the consolidated income statement such that the cumulative expense reflects the revised estimate with a corresponding adjustment to equity.
I2.1 Share-based payment expense
The expense recognised for employee services receivable during the year is as follows:
2015 £m
2014 £m
Expense arising from equity-settled share-based payment transactions 4 7
I2.2 Share-based payment schemes in issue
Long-term incentive plan (‘LTIP’)In 2009, the Group implemented a long-term incentive plan to retain and motivate its senior management group. The awards under this plan are in the form of nil-cost options to acquire an allocated number of ordinary shares. Assuming no good leavers or other events which would trigger early vesting rights, these awards will be subject to performance conditions tied to the Company’s financial performance in respect of growth in MCEV, cumulative cash generation over a three year period and total shareholder return (‘TSR’). For all LTIP awards made from 2015 onwards, a holding period applies so that any LTIP awards for which the performance vesting requirements are satisfied will not be released for a further two years from the third anniversary of the original award date. Dividends will accrue for LTIP awards until the end of the holding period. There are no cash settlement alternatives.
The 2015 LTIP awards were granted on 28 September 2015. The 2012 LTIP awards vested during the year. The 2013 award will vest on 15 November 2016, the 2014 award will vest on 26 March 2017 and the 2015 award will vest on 28 September 2018.
The fair value of these awards is estimated at the share price at the grant date, taking into account the terms and conditions upon which the instruments were granted.
Sharesave schemeThe sharesave scheme allows participating employees to save up to £250 each month over a period of either three or five years. This amount was increased to £500 each month with respect to the 2014 and 2015 sharesave schemes.
Under the sharesave arrangement, participants remaining in the Group’s employment at the end of the three or five year saving period are entitled to use their savings to purchase shares at an exercise price at a discount to the share price on the date of grant. Employees leaving the Group for certain reasons are able to use their savings to purchase shares if they leave less than six months before the end of their three or five year periods.
The fair value of the awards has been determined using a Black-Scholes valuation model. Key assumptions within this valuation model include expected share price volatility and expected dividend yield.
The 2010, 2011 and 2012 sharesave awards were increased during 2013 as a result of the equity raising on 21 February 2013. The exercise price of these awards were also amended as a result of the equity raising. The 2015 sharesave awards were granted on 21 April 2015.
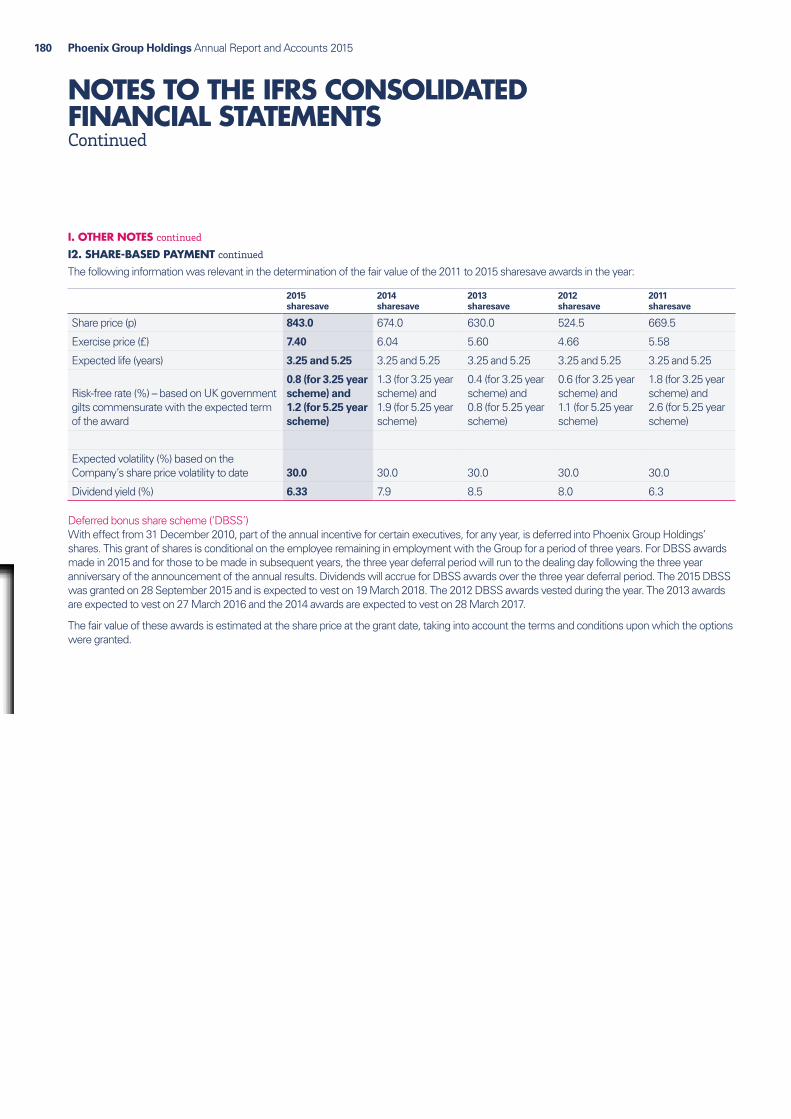
Phoenix Group Holdings Annual Report and Accounts 2015180
NOTES TO THE IFRS CONSOLIDATEDFINANCIAL STATEMENTSContinued
I. OTHER NOTES continued
I2. SHARE-BASED PAYMENT continued
The following information was relevant in the determination of the fair value of the 2011 to 2015 sharesave awards in the year:
2015 sharesave
2014 sharesave
2013 sharesave
2012 sharesave
2011 sharesave
Share price (p) 843.0 674.0 630.0 524.5 669.5
Exercise price (£) 7.40 6.04 5.60 4.66 5.58
Expected life (years) 3.25 and 5.25 3.25 and 5.25 3.25 and 5.25 3.25 and 5.25 3.25 and 5.25
Risk-free rate (%) – based on UK government gilts commensurate with the expected term of the award
0.8 (for 3.25 year scheme) and 1.2 (for 5.25 year scheme)
1.3 (for 3.25 year scheme) and 1.9 (for 5.25 year scheme)
0.4 (for 3.25 year scheme) and 0.8 (for 5.25 year scheme)
0.6 (for 3.25 year scheme) and 1.1 (for 5.25 year scheme)
1.8 (for 3.25 year scheme) and 2.6 (for 5.25 year scheme)
Expected volatility (%) based on the Company’s share price volatility to date 30.0 30.0 30.0 30.0 30.0
Dividend yield (%) 6.33 7.9 8.5 8.0 6.3
Deferred bonus share scheme (‘DBSS’)With effect from 31 December 2010, part of the annual incentive for certain executives, for any year, is deferred into Phoenix Group Holdings’ shares. This grant of shares is conditional on the employee remaining in employment with the Group for a period of three years. For DBSS awards made in 2015 and for those to be made in subsequent years, the three year deferral period will run to the dealing day following the three year anniversary of the announcement of the annual results. Dividends will accrue for DBSS awards over the three year deferral period. The 2015 DBSS was granted on 28 September 2015 and is expected to vest on 19 March 2018. The 2012 DBSS awards vested during the year. The 2013 awards are expected to vest on 27 March 2016 and the 2014 awards are expected to vest on 28 March 2017.
The fair value of these awards is estimated at the share price at the grant date, taking into account the terms and conditions upon which the options were granted.
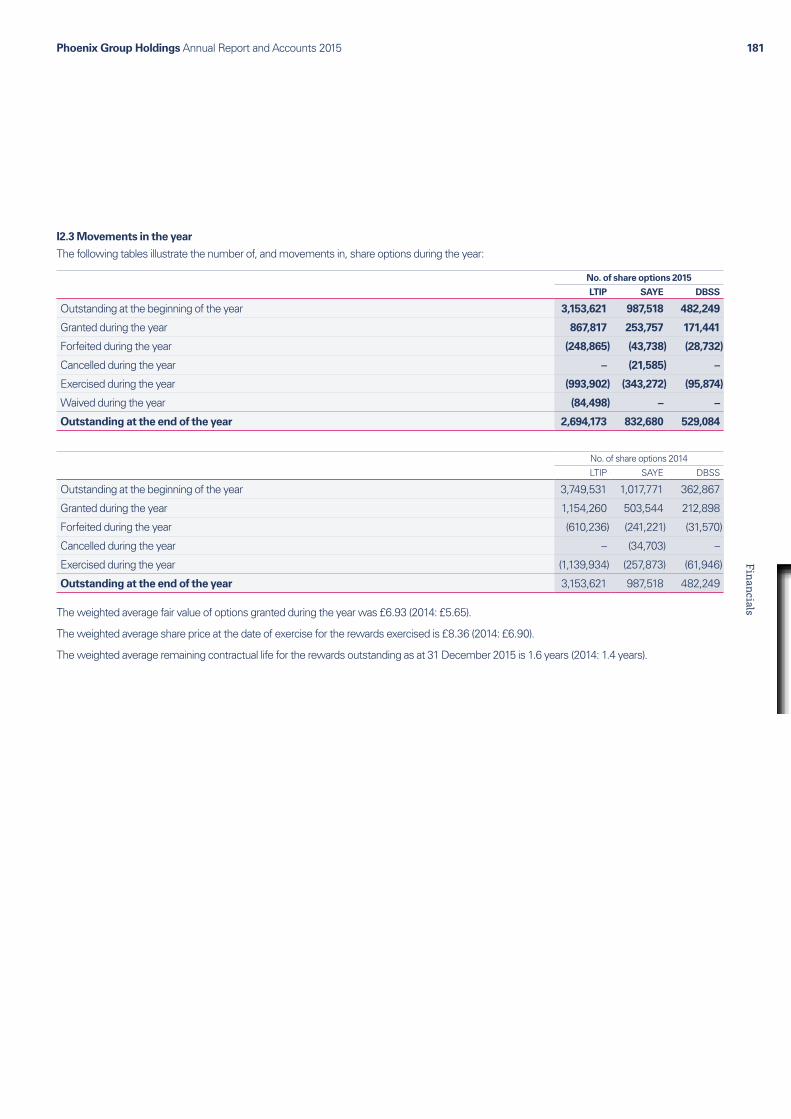
Phoenix Group Holdings Annual Report and Accounts 2015 181Financials
I2.3 Movements in the year
The following tables illustrate the number of, and movements in, share options during the year:
No. of share options 2015
LTIP SAYE DBSS
Outstanding at the beginning of the year 3,153,621 987,518 482,249
Granted during the year 867,817 253,757 171,441
Forfeited during the year (248,865) (43,738) (28,732)
Cancelled during the year – (21,585) –
Exercised during the year (993,902) (343,272) (95,874)
Waived during the year (84,498) – –
Outstanding at the end of the year 2,694,173 832,680 529,084
No. of share options 2014
LTIP SAYE DBSS
Outstanding at the beginning of the year 3,749,531 1,017,771 362,867
Granted during the year 1,154,260 503,544 212,898
Forfeited during the year (610,236) (241,221) (31,570)
Cancelled during the year – (34,703) –
Exercised during the year (1,139,934) (257,873) (61,946)
Outstanding at the end of the year 3,153,621 987,518 482,249
The weighted average fair value of options granted during the year was £6.93 (2014: £5.65).
The weighted average share price at the date of exercise for the rewards exercised is £8.36 (2014: £6.90).
The weighted average remaining contractual life for the rewards outstanding as at 31 December 2015 is 1.6 years (2014: 1.4 years).
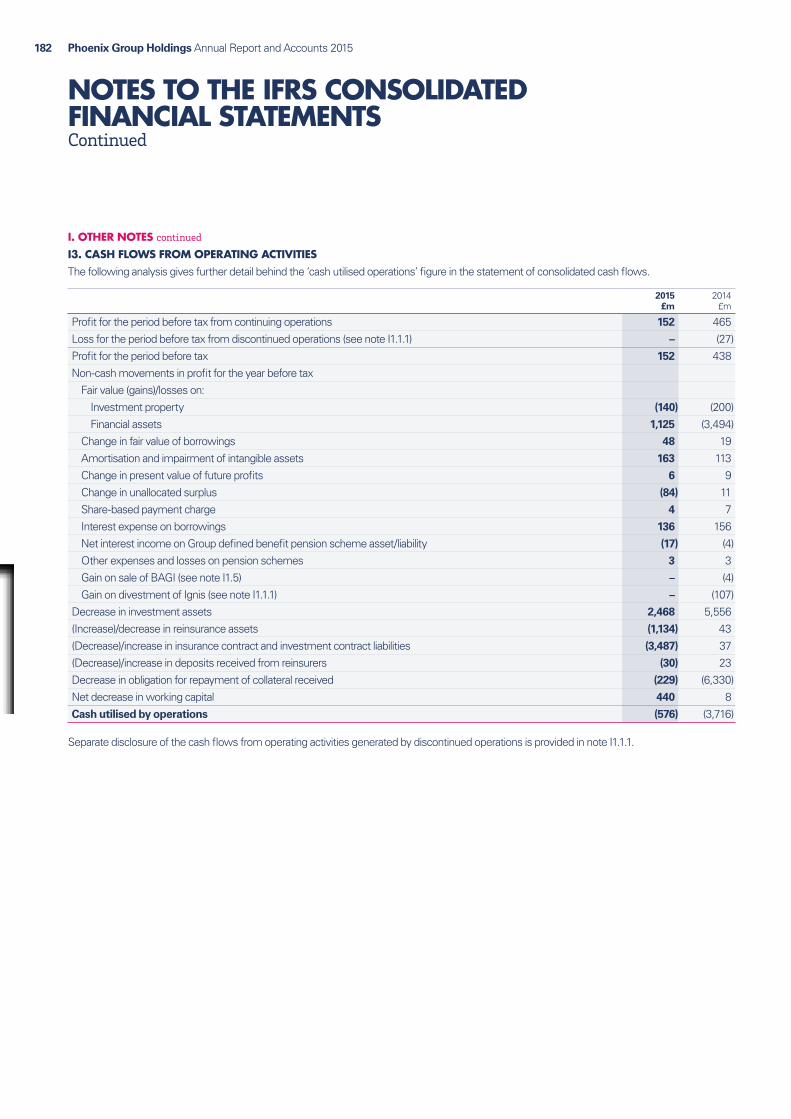
Phoenix Group Holdings Annual Report and Accounts 2015182
NOTES TO THE IFRS CONSOLIDATEDFINANCIAL STATEMENTSContinued
I. OTHER NOTES continued
I3. CASH FLOWS FROM OPERATING ACTIVITIESThe following analysis gives further detail behind the ‘cash utilised operations’ figure in the statement of consolidated cash flows.
2015 £m
2014 £m
Profit for the period before tax from continuing operations 152 465Loss for the period before tax from discontinued operations (see note I1.1.1) – (27)Profit for the period before tax 152 438Non-cash movements in profit for the year before tax Fair value (gains)/losses on: Investment property (140) (200) Financial assets 1,125 (3,494) Change in fair value of borrowings 48 19 Amortisation and impairment of intangible assets 163 113 Change in present value of future profits 6 9 Change in unallocated surplus (84) 11 Share-based payment charge 4 7 Interest expense on borrowings 136 156 Net interest income on Group defined benefit pension scheme asset/liability (17) (4) Other expenses and losses on pension schemes 3 3 Gain on sale of BAGI (see note I1.5) – (4) Gain on divestment of Ignis (see note I1.1.1) – (107)Decrease in investment assets 2,468 5,556(Increase)/decrease in reinsurance assets (1,134) 43(Decrease)/increase in insurance contract and investment contract liabilities (3,487) 37(Decrease)/increase in deposits received from reinsurers (30) 23Decrease in obligation for repayment of collateral received (229) (6,330)Net decrease in working capital 440 8Cash utilised by operations (576) (3,716)
Separate disclosure of the cash flows from operating activities generated by discontinued operations is provided in note I1.1.1.
Phoenix Group Holdings Annual Report and Accounts 2015 183Financials
I4. CAPITAL MANAGEMENT
This note sets out the Group’s approach to managing capital, provides an analysis of available capital resources and explains the different regulatory capital requirements of the Group and its life companies.
Risk and capital management objectives
The risk management objectives and policies of the Group are based on the requirement to protect the Group’s regulatory capital position, thereby safeguarding policyholders’ guaranteed benefits whilst also ensuring the Group can meet its various cash flow requirements. Subject to this, the Group seeks to use available capital to achieve increased returns, balancing risk and reward, to generate additional value for policyholders and shareholders.
In pursuing these objectives, the Group deploys financial and other assets and incurs insurance contract liabilities and financial and other liabilities. Financial and other assets principally comprise investments in equity securities, fixed and variable rate income securities, collective investment schemes, property, derivatives, reinsurance, trade and other receivables, and banking deposits. Financial liabilities principally comprise investment contracts, borrowings for financing purposes, derivative liabilities and net asset value attributable to unit holders.
The risk management disclosures in the consolidated financial statements set out the major risks that the Group businesses are exposed to and describe the Group’s approach to managing these. The section on financial risk is included in note E6, the section on insurance risk is included in note F4 and the sections on risk and capital management objectives and other risks are included below. The Group’s risk management framework is described in the risk management commentary on pages 34 to 39 of the Annual Report and Accounts.
Other risks
Customer riskCustomer risk is the risk of reductions in earnings and/or value, through inappropriate or poor customer treatment (including poor advice).
Operational riskOperational risk is the risk of reductions in earnings and/or value, through financial or reputational loss, from inadequate or failed internal processes and systems, or from people related or external events.
Capital management framework
The Group’s Capital Management Framework is designed to achieve the following objectives:
Ɛ provide appropriate security for policyholders and meet all regulatory capital requirements whilst not retaining unnecessary excess capital;
Ɛ ensure sufficient liquidity to meet obligations to policyholders and other creditors;
Ɛ optimise the level of debt in the Group statement of consolidated financial position to maintain an investment grade credit rating; and
Ɛ to meet the dividend expectations of shareholders as set by the Group’s dividend policy.
The framework comprises a suite of capital management policies that govern the allocation of capital throughout the Group to achieve the framework objectives under a range of stress conditions. The policy suite is defined with reference to policyholder security, creditor obligations, owner dividend policy and regulatory capital requirements.
The capital policy of each life company is set and monitored by each life company Board. These policies ensure there is sufficient capital within each life company to meet regulatory capital requirements under a range of stress conditions. The capital policy of each life company varies according to the risk profile and financial strength of the company.
Regulatory capital adequacy at a Group level is calculated at the ultimate EEA insurance parent undertaking which is PLHL. This continues to be the case after 1 January 2016 under the Solvency II regime.

Phoenix Group Holdings Annual Report and Accounts 2015184
NOTES TO THE IFRS CONSOLIDATEDFINANCIAL STATEMENTSContinued
I. OTHER NOTES continued
I4. CAPITAL MANAGEMENT continued
Group capital
Capital resourcesThe primary sources of capital used by the Group prior to 1 January 2016 comprised equity shareholder funds as measured on an MCEV basis, the Perpetual Reset Capital Securities and shareholder borrowings. This is analysed as follows:
Notes2015
£m2014
£m
Total IFRS equity attributable to owners of the parent1 2,434 2,365
Adjustments between IFRS equity attributable to owners of the parent and MCEV net worth2 (1,863) (1,899)
MCEV value of in-force business2 1,942 2,181
Group MCEV 2,513 2,647
Gross shareholder debt:
Perpetual Reset Capital Securities D3.1 6 408
Shareholder borrowings E5 1,491 1,275
Difference between IFRS and MCEV carrying values of shareholder borrowings 95 78
Gross MCEV 4,105 4,4081 As shown in the consolidated statement of financial position.2 As detailed in the reconciliation of Group IFRS equity to MCEV net worth in the MCEV financial statements.
From 1 January 2016, the primary sources of capital used by the Group comprise the Group Basic Own Funds calculated on a Solvency II basis (see Solvency II regulatory capital measures below).
LeverageIn managing capital the Group seeks to optimise the level of debt on its balance sheet. The Group’s closed book business model allows it to operate with higher leverage than life companies that are still writing new business, as it does not need to fund upfront capital requirements and new business acquisition expenses.
Further detail on the Group’s financial leverage calculation (unaudited) is provided in the business review on page 33.
Regulatory capital measures (applicable until 31 December 2015)
Under the regulatory rules applicable until 31 December 2015, each UK life company and PLHL was required to retain sufficient capital at all times to meet the regulatory capital requirements mandated by the PRA. In addition to EU-directive-based ‘Pillar 1’ individual and group capital requirements, the PRA also stipulated a ‘Pillar 2’ of risk-based capital requirements that were implemented in the UK. The actual capital requirement for each UK life company and PLHL is based on whichever of the Pillar 1 or Pillar 2 requirement turns out to be more onerous for the company and for PLHL. Each UK life company generally holds an amount of capital that is greater than the minimum required amount to allow for adverse events in the future that may use capital and might otherwise cause the company to fail the minimum level of regulatory capital test.
UK Life companiesCapital resources of the UK life companies comprise capital arising within their long-term fund, i.e. within the with-profit funds and non-participating funds; and capital arising outside their long-term fund. There are certain restrictions that operate over the capital in these funds which are summarised as follows:
With-profit funds – any available surplus held in each fund can only be used to meet the requirements of the fund itself or be distributed to policyholders and owners. In 90:10 with-profit funds, policyholders are entitled to at least 90% of the distributed profits while owners receive the balance. In 100:0 with-profit funds, policyholders are entitled to 100% of the distributed profits.
Non-participating funds – any available surplus held in these funds is attributable to owners. Capital within the non-participating funds may be made available to meet capital requirements elsewhere in the Group subject to meeting regulatory and legal requirements, and after consideration of the internal capital requirements of the relevant fund and company.
Pillar 1 capital requirementsThe regulatory capital requirement under Pillar 1 for the Group’s UK life companies applicable until 31 December 2015 was the total amount held in respect of investment, expense and insurance risks (the ‘long-term insurance capital requirement’ (‘LTICR’)) and an additional amount in respect of with-profit funds which may result in an additional capital requirement referred to as the ‘with-profit insurance capital component’ (‘WPICC’).

Phoenix Group Holdings Annual Report and Accounts 2015 185Financials
Pillar 2 capital requirementsThe Pillar 2 capital requirements applicable until 31 December 2015 were based on a self-assessment methodology, called the ‘Individual Capital Assessment’ (‘ICA’). This methodology determined the capital requirement to ensure that the life company’s realistic liabilities could be met in one year’s time with a 99.5% confidence level, or in other words to be able to withstand a one in 200 year event. The PRA reviewed each life company’s ICA and could impose additional capital requirements if necessary in the form of ‘Individual Capital Guidance’ (‘ICG’).
PLHL Group
Prior to 1 January 2016, PLHL maintained two separate measures of its regulatory capital resources and related capital requirements. These were the Insurance Groups’ Directive (‘IGD’) and PLHL ICA, which correspond to the Pillar 1 and Pillar 2 requirement respectively.
IGDPRA regulated insurance groups (including their holding companies) are required to assess capital adequacy on a group wide basis to enable the PRA to assess both the level of insurance and financial risk within the group and the capital resources available to cover that risk. The assessment is known as the IGD, and was in force until 31 December 2015.
The Group’s IGD assessment was made at the ultimate insurance parent undertaking within the EEA, which is PLHL. The assessment aggregated the capital resources of the UK life companies and insurance holding companies headquartered within the EEA and made adjustments to remove internal holdings and apply regulatory rules pertaining to the calculation. The result is compared with the aggregate regulatory Pillar 1 capital requirements (see below) to determine the overall surplus for the IGD measure of regulatory capital.
As at 31 December 2015, the unaudited estimated PLHL Group Capital Resources were £5.9 billion (2014: £5.6 billion) and the unaudited estimated PLHL Group IGD Surplus was £1.5 billion (2014: £1.2 billion).
Further detail of the PLHL IGD position (unaudited) is provided in the business review on page 31.
PLHL ICA Prior to 1 January 2016, the Group undertook a further group solvency calculation, the ‘PLHL ICA’, at the same level at which the IGD calculation was performed. This involves an assessment, on an economic basis, of the capital resources and requirements arising from the obligations and risks which exist outside of the life companies.
For this measure the capital resources included the surplus over capital policy in the life companies and the net assets of the holding companies, less the pension scheme obligations on an economic basis. The capital requirements relate to the risks arising outside of the life companies including those in relation to the Group’s staff pension schemes, offset by Group diversification benefits. Applicable until 31 December 2015 and as agreed with the PRA, the Group aimed to ensure that PLHL maintains an ICA surplus of at least £150 million. As at 31 December 2015, the unaudited estimated PLHL Group ICA position was £0.6 billion (2014: £0.7 billion).
Further detail of the PLHL ICA position is provided in the business review (unaudited) on page 31.
Solvency II regulatory capital measures (applicable from 1 January 2016)
The Solvency II Directive became effective from 1 January 2016. Under this regime, each UK life company and the PLHL Group are required to retain sufficient capital (termed ‘own funds’) at all times to meet the Solvency Capital Requirements (‘SCR’) as determined by Phoenix’s PRA approved Internal Model.
Basic Own Funds represents the excess of assets over liabilities from the Solvency II balance sheet adjusted to add back any relevant subordinated liabilities that meet the criteria to be treated as capital items.
The Basic Own Funds can be classified into three tiers based on permanency and loss absorbency (tier 1 being the highest quality and tier 3 the lowest). Limits are imposed on the amount of each tier that can be held to cover the SCR. Eligible Own Funds at a Life company level are obtained after having applied these prescribed tiering limits to the Basic Own Funds.
Phoenix has obtained PRA approval to calculate the SCR of its UK life companies using an Internal Model. This model has been calibrated to ensure that the life company’s liabilities could be met in one year’s time with a 99.5% confidence level, or in other words to be able to withstand a one in 200 year event.
Surplus funds in with-profit funds of the life companies (‘ring fenced funds’) are restricted and can only be included in Eligible Own Funds up to the value of the SCR they are used to support.
The Group’s Solvency II assessment is made at the ultimate parent undertaking within the EEA, which is PLHL. Solvency at the PGH Group level is regulated by the PRA through a series of ‘other methods’ as agreed in a PRA approved waiver exempting the PGH Group from application of the full group requirements of the Solvency II Directive.
Group Own Funds are assessed for their eligibility to cover the Group SCR with reference to both the quality of capital and its availability and transferability and restrictions are applied accordingly.
Each UK Life company and the PLHL Group generally hold an amount of Eligible Own Funds that is greater than the SCR to allow for adverse events in the future that may use capital and might otherwise cause the company to fail the minimum level of regulatory capital test (termed the Minimum Capital Requirement).
The unaudited estimated PLHL Solvency II surplus position at 1 January 2016 is set out below:
Year ended 31 December
2 015 £bn
Own funds1 5.8
Solvency capital requirement2 (4.5)
Estimated Solvency II surplus (unaudited) 1.3
1 Own funds includes the net assets of the life and holding companies calculated under Solvency II rules, pension scheme surpluses calculated on an IAS19 basis not exceeding the holding companies’ contribution to the Group SCR and qualifying subordinated liabilities.
2 Solvency capital requirements relate to the risks and obligations, to which the Group is exposed, calculated using an internal model, offset by Group diversification benefits.
Further details of the PLHL Solvency II excess (unaudited) is provided in the Financial performance section on page 32.

Phoenix Group Holdings Annual Report and Accounts 2015186
NOTES TO THE IFRS CONSOLIDATEDFINANCIAL STATEMENTSContinued
I. OTHER NOTES continued
I5. RELATED PARTY TRANSACTIONSIn the ordinary course of business, the Group and its subsidiaries carry out transactions with related parties as defined by IAS 24 Related party disclosures.
I5.1 Transactions with pension schemes
During the year, the Group entered into the following transactions with its pension schemes:
Transactions 2015
£m
Balances outstanding
2015 £m
Transactions 2014
£m
Balances outstanding
2014 £m
Pearl Group Staff Pension Scheme
Payment of administrative expenses (2) – (4) –
PGL Pension Scheme
Investment management fees – – 1 –
The Pearl Scheme has invested in collective investment schemes that are controlled by the Group. At 31 December 2015, the Pearl Scheme held 44,354,178 units in the Castle Hill Enhanced Floating Rate Opportunities Limited Fund. The value of these investments at 31 December 2015 was £74 million. At 31 December 2014, Castle Hill Enhanced Floating Rate Opportunities Limited Fund was not a related party, and therefore no comparatives have been reported.
Information on other transactions with the pension schemes is included in note G6.
I5.2 Transactions with key management personnel
The total compensation of key management personnel, being those having authority and responsibility for planning, directing and controlling the activities of the Group, including the Executive and Non-Executive Directors, are as follows:
2015£m
2014£m
Salary and other short-term benefits 4 4
Equity compensation plans 2 2
Details of the shareholdings and emoluments of individual Directors are provided in the Remuneration report on pages 57 to 80.
I6. OPERATING LEASES
Leases, where a significant portion of the risks and rewards of ownership are retained by the lessor, are classified as operating leases. Where the Group is the lessee, payments made under operating leases, net of any incentives received from the lessor are charged to the consolidated income statement on a straight-line basis over the period of the lease.
Operating lease rentals charged within administrative expenses amounted to £8 million (2014: £10 million).
The Group has commitments under non-cancellable operating leases as set out below:
2015£m
2014£m
Not later than 1 year 7 10
Later than 1 year and not later than 5 years 22 33
Later than 5 years – 7
The principal operating lease commitments for 2015 concern office space located at St Vincent Street, Glasgow and Juxon House, London (2014: St Vincent Street, Glasgow and Juxon House, London).
Disclosures of future minimum lease rental receivables in respect of non-cancellable operating leases on investment properties are included in note G9.

Phoenix Group Holdings Annual Report and Accounts 2015 187Financials
I7. COMMITMENTSThis note analyses the Group’s other commitments.
2015£m
2014£m
To subscribe to private equity funds and other unlisted assets 443 334
To purchase, construct or develop investment property 6 28
For repairs, maintenance or enhancements of investment property 5 2
I8. CONTINGENT LIABILITIES
Where the Group has a present legal or constructive obligation, but it is not probable that there will be an outflow of resources to settle the obligation or the amount cannot be reliably estimated, this is disclosed as a contingent liability.
In the normal course of business the Group is exposed to certain legal issues, which involve litigation and arbitration. At the period end, the Group has a number of contingent liabilities in this regard, none of which are considered by the Directors to be material.
I9. EVENTS AFTER THE REPORTING PERIOD
The financial statements are adjusted to reflect significant events that have a material effect on the financial results and that have occurred between the period end and the date when the financial statements are authorised for issue, provided they give evidence of conditions that existed at the period end. Events that are indicative of conditions that arise after the period end that do not result in an adjustment to the financial statements are disclosed.
In March 2016, the Group agreed an amendment of its £900 million 5 year unsecured bank facility into a £650 million unsecured revolving credit facility, maturing in June 2020. There are no mandatory or target amortisation payments associated with the facility but prepayments are permissible.
On 22 March 2016, the Board recommended a final dividend of 26.7p per share (2014: 26.7p per share) for the year ended 31 December 2015. Payment of the final dividend is subject to shareholder approval at the AGM. The cost of this dividend has not been recognised as a liability in the financial statements for 2015 and will be charged to the statement of changes in equity in 2016.
H StauntonC BannisterJ McConvilleA BarbourI CormackT Cross BrownI HudsonD WoodsK Sorenson
ST HELIER, JERSEY 22 MARCH 2016

188 Phoenix Group Holdings Annual Report and Accounts 2015
PARENT COMPANY ACCOUNTS
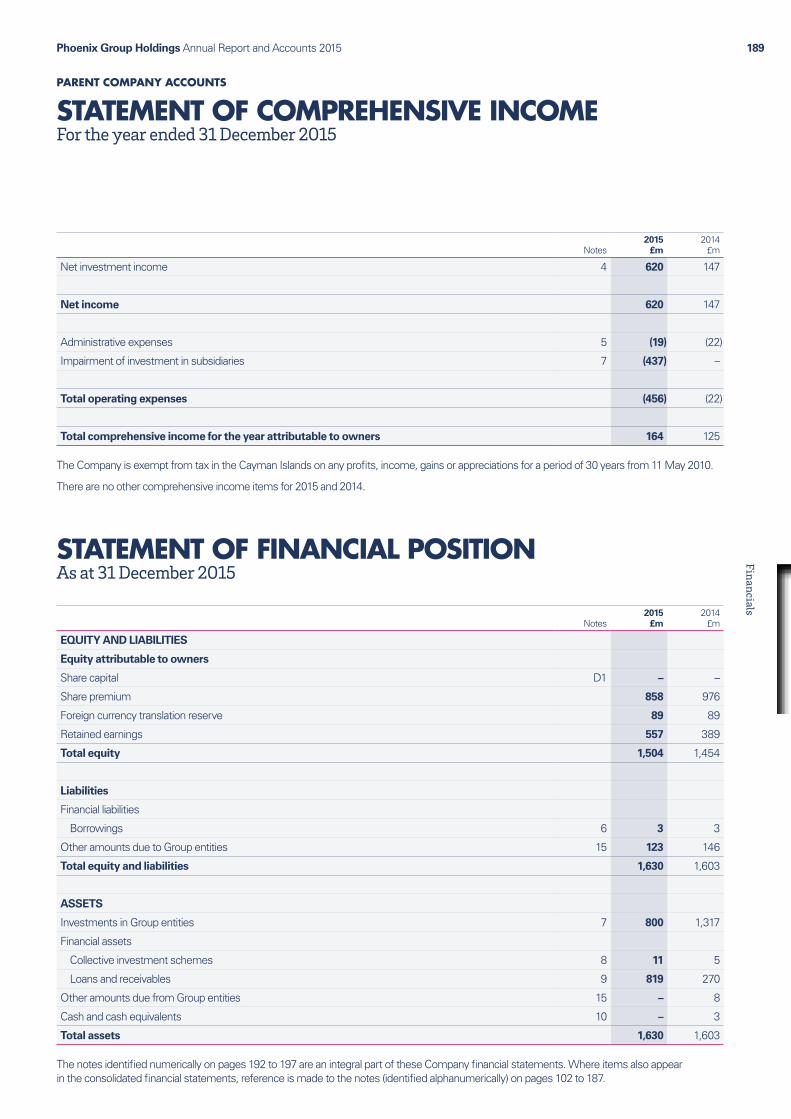
Phoenix Group Holdings Annual Report and Accounts 2015 189Financials
PARENT COMPANY ACCOUNTS
STATEMENT OF COMPREHENSIVE INCOMEFor the year ended 31 December 2015
Notes2015
£m2014
£m
Net investment income 4 620 147
Net income 620 147
Administrative expenses 5 (19) (22)
Impairment of investment in subsidiaries 7 (437) –
Total operating expenses (456) (22)
Total comprehensive income for the year attributable to owners 164 125
The Company is exempt from tax in the Cayman Islands on any profits, income, gains or appreciations for a period of 30 years from 11 May 2010.
There are no other comprehensive income items for 2015 and 2014.
STATEMENT OF FINANCIAL POSITIONAs at 31 December 2015
Notes2015
£m2014
£m
EQUITY AND LIABILITIES
Equity attributable to owners
Share capital D1 – –
Share premium 858 976
Foreign currency translation reserve 89 89
Retained earnings 557 389
Total equity 1,504 1,454
Liabilities
Financial liabilities
Borrowings 6 3 3
Other amounts due to Group entities 15 123 146
Total equity and liabilities 1,630 1,603
ASSETS
Investments in Group entities 7 800 1,317
Financial assets
Collective investment schemes 8 11 5
Loans and receivables 9 819 270
Other amounts due from Group entities 15 – 8
Cash and cash equivalents 10 – 3
Total assets 1,630 1,603
The notes identified numerically on pages 192 to 197 are an integral part of these Company financial statements. Where items also appear in the consolidated financial statements, reference is made to the notes (identified alphanumerically) on pages 102 to 187.

Phoenix Group Holdings Annual Report and Accounts 2015190
PARENT COMPANY ACCOUNTS
STATEMENT OF CASH FLOWSFor the year ended 31 December 2015
Notes2015
£m2014
£m
Cash flows from operating activities
Cash (utilised)/generated by operations 11 (28) 15
Net cash flows from operating activities (28) 15
Cash flows from investing activities
Dividends received from Group entities 40 85
Loan advance to Group entities (6) (6)
Repayment of loan from a Group entity – 1
Interest received from Group entities 19 18
Return of share capital from Opal Re 90 –
Net cash flows from investing activities 143 98
Cash flows from financing activities
Proceeds from issuing ordinary shares 2 1
Ordinary share dividends paid (120) (120)
Net cash flows from financing activities (118) (119)
Net decrease in cash and cash equivalents (3) (6)
Cash and cash equivalents at the beginning of the year 3 9
Cash and cash equivalents at the end of the year 10 – 3
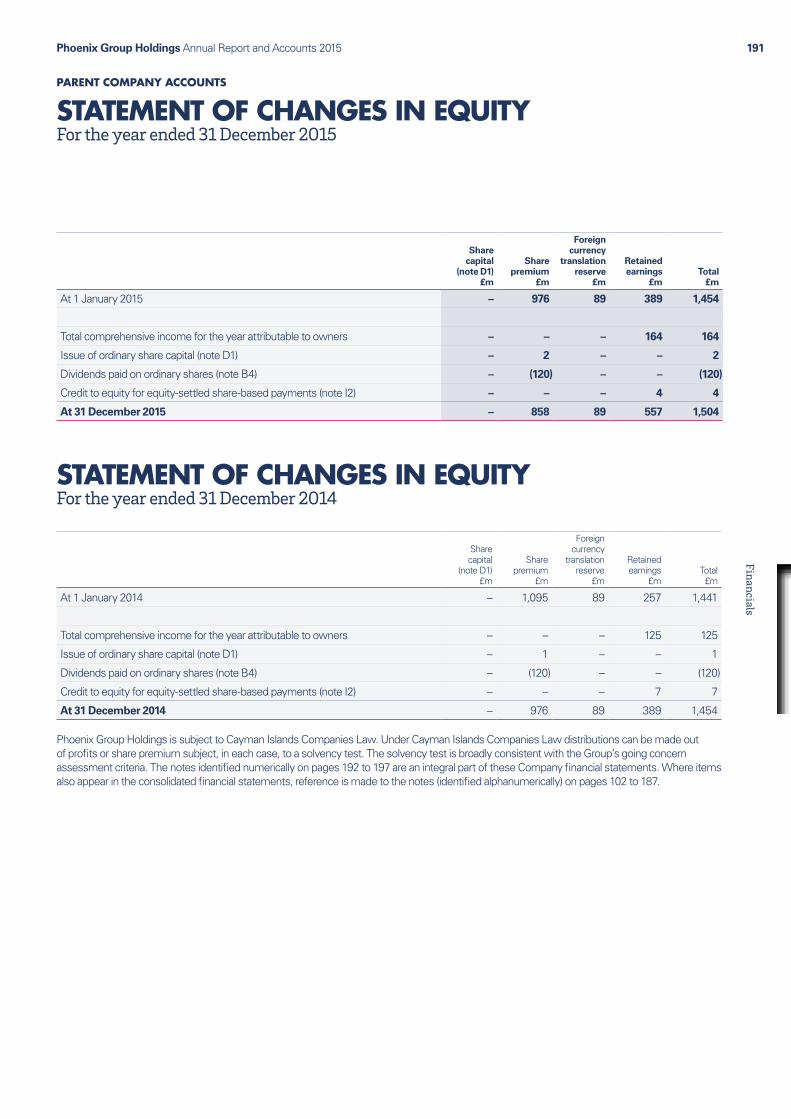
Phoenix Group Holdings Annual Report and Accounts 2015 191Financials
PARENT COMPANY ACCOUNTS
STATEMENT OF CHANGES IN EQUITYFor the year ended 31 December 2015
Share capital
(note D1) £m
Share premium
£m
Foreign currency
translation reserve
£m
Retained earnings
£mTotal
£m
At 1 January 2015 – 976 89 389 1,454
Total comprehensive income for the year attributable to owners – – – 164 164
Issue of ordinary share capital (note D1) – 2 – – 2
Dividends paid on ordinary shares (note B4) – (120) – – (120)
Credit to equity for equity-settled share-based payments (note I2) – – – 4 4
At 31 December 2015 – 858 89 557 1,504
STATEMENT OF CHANGES IN EQUITYFor the year ended 31 December 2014
Share capital
(note D1) £m
Share premium
£m
Foreign currency
translation reserve
£m
Retained earnings
£mTotal £m
At 1 January 2014 – 1,095 89 257 1,441
Total comprehensive income for the year attributable to owners – – – 125 125
Issue of ordinary share capital (note D1) – 1 – – 1
Dividends paid on ordinary shares (note B4) – (120) – – (120)
Credit to equity for equity-settled share-based payments (note I2) – – – 7 7
At 31 December 2014 – 976 89 389 1,454
Phoenix Group Holdings is subject to Cayman Islands Companies Law. Under Cayman Islands Companies Law distributions can be made out of profits or share premium subject, in each case, to a solvency test. The solvency test is broadly consistent with the Group’s going concern assessment criteria. The notes identified numerically on pages 192 to 197 are an integral part of these Company financial statements. Where items also appear in the consolidated financial statements, reference is made to the notes (identified alphanumerically) on pages 102 to 187.

Phoenix Group Holdings Annual Report and Accounts 2015192
PARENT COMPANY ACCOUNTS
NOTES TO THE PARENT COMPANY FINANCIAL STATEMENTS
1. ACCOUNTING POLICIES(A) BASIS OF PREPARATIONThe financial statements have been prepared on an historical cost basis except for those financial assets and financial liabilities that have been measured at fair value.
Statement of Compliance
The financial statements have been prepared in accordance with International Financial Reporting Standards (‘IFRSs’) as issued by the International Accounting Standards Board (‘IASB’).
The financial statements are presented in sterling (£) rounded to the nearest million unless otherwise stated.
Assets and liabilities are offset and the net amount reported in the statement of financial position only when there is a legally enforceable right to offset the recognised amounts and there is an intention to settle on a net basis, or to realise the assets and settle the liabilities simultaneously.
Income and expenses are not offset in the statement of comprehensive income unless required or permitted by an IFRS or interpretation, as specifically disclosed in the accounting policies of the Company.
(B) ACCOUNTING POLICIESThe accounting policies in the separate financial statements are the same as those presented in the notes to the consolidated financial statements on pages 102 to 187, except for the policy noted below. Where an accounting policy can be directly attributed to a specific note to the consolidated financial statements, the policy is presented within that note. Each note within the Company financial statements makes reference to the note to the consolidated financial statements containing the applicable accounting policy. The accounting policy in relation to foreign currency transactions is included within note A2.1.
Investments in Group entities
Investments in Group entities are carried in the statement of financial position at cost less impairment.
The Company assesses at each reporting date whether an investment is impaired. The Company first assesses whether objective evidence of impairment exists. Evidence of impairment needs to be significant or prolonged to determine that objective evidence of impairment exists. If objective evidence of impairment exists, the Company calculates the amount of impairment as the difference between the recoverable amount of the Group entity and its carrying value and recognises the amount as an expense in the income statement.
The recoverable amount is determined based on the cash flow projections of the underlying entities.
The assessment of whether an investment in a Group entity is impaired is considered to be a critical accounting judgement for the Company.
2. FINANCIAL INFORMATIONIn preparing the financial statements the Company has adopted the standards, interpretations and amendments effective 1 January 2015 which have been issued by the IASB as detailed in note A4 of the consolidated financial statements, none of which have had a significant impact on the Company’s financial statements. Details of standards, interpretations and amendments to be adopted in future periods are also detailed in note A5.
3. SEGMENTAL ANALYSIS The Company has one reportable segment, comprising its investment in and loans to/from its subsidiaries. Its revenue principally comprises the dividend and interest income derived from these investments and loans. Information relating to this segment is included in the Company’s primary financial statements on pages 189 to 191. The accounting policy for segmental analysis is included in note B1.
Predominantly, all revenues from external customers is sourced in the UK.
Predominantly, all assets are located in the UK.

Phoenix Group Holdings Annual Report and Accounts 2015 193Financials
4. NET INVESTMENT INCOME The accounting policy for net investment income is included in note C1.
2015£m
2014£m
Investment income
Dividend income from other Group entities 487 94
Interest income from other Group entities 58 48
545 142
Reversal of impairment losses on loans and receivables 75 –
Fair value gains on financial instruments – 5
Net investment income 620 147
5. ADMINISTRATIVE EXPENSESThe accounting policy for administrative expenses is included in note C2.
2015£m
2014£m
Employee costs1 1 1
Professional fees 1 7
Office costs – 1
Write down of loans due from other Group entities 8 10
Other 9 3
Administrative expenses 19 221 In addition to the Non-Executive Directors, one employee was employed by Phoenix Group Holdings during the period (2014: one). Other Group employees are employed by other
Group entities.
6. BORROWINGS The accounting policy for borrowings is included in note E5.
Carrying value Fair value
2015 £m
2014£m
2015 £m
2014£m
Loans due to Impala Holdings Limited 3 3 3 3
Amount due for settlement after 12 months – 3
All borrowings are due to Group entities and are measured at amortised cost using the effective interest method.
On 16 July 2010, the Company was granted a loan from Impala Holdings Limited of £3 million. The loan accrues interest at six month LIBOR plus a margin of 3.25% (2014: 3.25%) which is capitalised semi-annually on 7 April and 7 October. The loan has a maturity date of 31 December 2016. Interest of £0.1 million (2014: £0.1 million) was accrued during the year. The balance outstanding at 31 December 2015 was £3 million (2014: £3 million).
All borrowings are categorised as Level 3 financial instruments. The fair value of borrowings with no external market is determined by internally developed discounted cash flow models using a risk adjusted discount rate corroborated with external market data where possible.

Phoenix Group Holdings Annual Report and Accounts 2015194
PARENT COMPANY ACCOUNTS
NOTES TO THE PARENT COMPANY FINANCIAL STATEMENTSContinued
7. INVESTMENTS IN GROUP ENTITIES
2015£m
2014£m
Cost
At 1 January 1,317 1,308
Additions 10 9
Return of share capital (90) –
At 31 December 1,237 1,317
Impairment
At 1 January – –
Charge for the year (437) –
At 31 December (437) –
Carrying amount at 31 December 800 1,317
On 27 April 2015, the Company received a £10 million dividend (2014: £9 million) from Opal Reassurance Limited (‘Opal Re’) in the form of preference shares. During the year, the Company received £90 million as a result of a return of share capital from Opal Re.
Following a restructure of the Company’s holdings in PGH (LCA) Limited, PGH (LCB) Limited, PGH (TC1) Limited and PGH (TC2) Limited, the Company received dividends of £205 million and £232 million from PGH (TC1) Limited and PGH (TC2) Limited respectively, settled by the novation of intragroup loan receivables to the Company. The Company impaired its investments in PGH (TC1) Limited and PGH (TC2) Limited to the extent of dividends received.
For a list of principal Group entities, refer to note H3 of the consolidated financial statements. The entities directly held by Phoenix Group Holdings are separately identified.
8. COLLECTIVE INVESTMENT SCHEMESThe accounting policy for collective investment schemes is included in note E1.
Carrying value Fair value
2015 £m
2014£m
2015 £m
2014£m
Investment in collective investment schemes 11 5 11 5
Amount due for settlement after 12 months – –
All investments are categorised as Level 1 financial instruments. Details of the factors considered in determination of the fair value are included in note E2 to the consolidated financial statements.

Phoenix Group Holdings Annual Report and Accounts 2015 195Financials
9. LOANS AND RECEIVABLES
Carrying value Fair value
2015 £m
2014£m
2015 £m
2014£m
Loans due from PGH (LCA) Limited and PGH (LCB) Limited 626 164 791 257
Loans due from PGH (MC1) Limited and PGH (MC2) Limited 113 99 262 194
Loans due from Employee Benefit Trust 5 7 5 7
Notes due from Phoenix Life Holdings Limited 75 – 74 –
819 270 1,132 458
Amounts due after 12 months 814 270
The accounting policy for loans and receivables is included in note E1.
All loans and receivables balances are due from Group entities and are measured at amortised cost using the effective interest method. The fair value of these loans and receivables are also disclosed.
On 22 March 2010, the Company subscribed for £325 million of Eurobonds which were issued equally by PGH (LCA) Limited and PGH (LCB) Limited. On 23 March 2010, the Eurobonds were listed on the Channel Islands Stock Exchange. Interest accrues on these Eurobonds at a rate of LIBOR plus a margin of 2.5% and the final maturity date to 30 June 2025. The Eurobonds were initially recognised at fair value and are accreted to par over the period to 2025. At 31 December 2015, £175 million was due (2014: £160 million).
On 12 December 2011, the Company, PGH (LCA) Limited and PGH (LCB) Limited, became party to a joint £77 million loan agreement to formalise an inter-company balance which had arisen in 2009 relating to fees payable to a syndicate of external banks. The loan accrues interest at a rate of LIBOR plus a margin of 1.25% and matures on 30 June 2016. Interest of £0.1 million was capitalised during the year (2014: £0.1 million) and £nil was repaid (2014: £nil). At 31 December 2015, £5 million was due (2014: £4 million).
In June 2015, the Company was assigned loans of £436 million issued equally by PGH (LCA) Limited and PGH (LCB) Limited. These loans accrue interest at a rate of LIBOR plus a margin of 2.9% and mature on 5 June 2020. Interest of £10 million was capitalised during the year. At 31 December 2015, £446 million was due.
On 22 March 2010, the Company subscribed for £250 million of Eurobonds which were issued equally by PGH (MC1) Limited and PGH (MC2) Limited. On 23 March 2010, the Eurobonds were listed on the Channel Islands Stock Exchange. Interest accrues on these Eurobonds at a rate of LIBOR plus a margin of 2.5% and the final maturity date to 30 June 2025. The Eurobonds were initially recognised at fair value and are accreted to par over the period to 2025. At 31 December 2015, £113 million was due (2014: £99 million).
On 16 July 2010, the Company entered into an interest free facility arrangement with Phoenix Group Holdings’ Employee Benefit Trust (‘EBT’). In 2015, an additional £6 million was drawn down against this facility (2014: £6 million). The loan is recoverable until the point the awards held by the EBT vest to the participants, at which point the loan is reviewed for impairment. Any impairments are determined by comparing the carrying value to the estimated recoverable amount of the loan. Following the vesting of awards in 2015, £8 million of the loan (2014: £10 million) has been written off. At 31 December 2015, £5 million was due (2014: £7 million).
On 22 April 2010, Pearl Group Holdings (No.1) Limited issued a balancing instrument under which notes with a principal of £75 million were issued to Phoenix Group Holdings. During January 2015 the notes were transferred from PGH1 to Phoenix Life Holdings Limited (‘PLHL’). The notes have no fixed maturity date and are included in the Company’s financial statements at a value of £75 million (2014: £nil). Phoenix Group Holdings paid no consideration for the notes and has waived its right to receive a coupon on the notes. In November 2015, PLHL agreed, subject to obtaining approvals, to repay the notes in full in 2016.
No other loans are considered to be past due or impaired.
For the purposes of the additional fair value disclosures for assets recognised at amortised cost, all loans and receivables are categorised as Level 3 financial instruments. The fair value of loans and receivables with no external market is determined by internally developed discounted cash flow models using a risk adjusted discount rate corroborated with external market data where possible.
Details of the factors considered in determination of fair value are included in note E2 to the consolidated financial statements.

Phoenix Group Holdings Annual Report and Accounts 2015196
PARENT COMPANY ACCOUNTS
NOTES TO THE PARENT COMPANY FINANCIAL STATEMENTSContinued
10. CASH AND CASH EQUIVALENTSThe accounting policy for cash and cash equivalents is included in note G11.
2015£m
2014£m
Short-term deposits (including demand and time deposits) – 3
11. CASH FLOWS FROM OPERATING ACTIVITIES
2015£m
2014£m
Profit for the year before tax 164 125
Adjustments to reconcile profit for the year to cash flows from operating activities:
Interest income from other Group entities (58) (48)
Reversal of impairment losses on loans and receivables (75) –
Fair value gains on financial instruments – (5)
Dividends received (487) (94)
Write down of loans to Group entities 8 10
Impairment of investment in subsidiaries 437 –
Share-based payment charge 4 7
Net (increase)/decrease in investment assets (29) 26
Net decrease/(increase) in working capital 8 (6)
Cash (utilised)/generated by operations (28) 15
12. CAPITAL AND RISK MANAGEMENTThe Company’s capital comprises share capital and all reserves. At 31 December 2015, total capital was £1,504 million (2014: £1,454 million). The movement in capital in the year comprises the total comprehensive income for the year attributable to owners of £164 million (2014: £125 million), proceeds from the issue of ordinary share capital of £2 million (2014: £1 million) and a credit to equity for equity-settled share-based payments of £4 million (2014: £7 million), partly offset by payment of dividends of £120 million (2014: £120 million).
There are no externally imposed capital requirements on the Company. The Company’s capital is monitored by the Directors and managed on an on-going basis via a monthly close process to ensure that it remains positive at all times.
Details of the Group risk management policies are outlined in notes E6 and F4 to the consolidated financial statements.
The primary operation of the Company is to manage its investment in subsidiaries. The Company’s other assets and liabilities mainly consist of receivables due from and borrowings owed to other Group entities.
The principal risks and uncertainties facing the Company are:
Ɛ interest rate risk, since the movement in interest rates will impact the value of interest receivable and payable by the Company;
Ɛ liquidity risk, exposure to liquidity risk as a result of normal business activities, specifically the risk arising from an inability to meet short-term cash flow requirements; and
Ɛ credit risk, arising from the default of the counterparty to a particular financial asset and is significantly reduced as assets are primarily inter-company receivables from other Group entities.
The Company’s exposure to all these risks is monitored by the Directors, who agree policies for managing each of these risks on an ongoing basis.
13. SHARE-BASED PAYMENTSFor detailed information on the long-term incentive plans, sharesave schemes and deferred bonus share schemes refer to note I2 in the consolidated financial statements.
14. DIRECTORS’ REMUNERATIONDetails of the remuneration of the Directors’ of Phoenix Group Holdings is included in the Directors’ remuneration report on pages 57 to 80 of the Annual Report and Accounts.
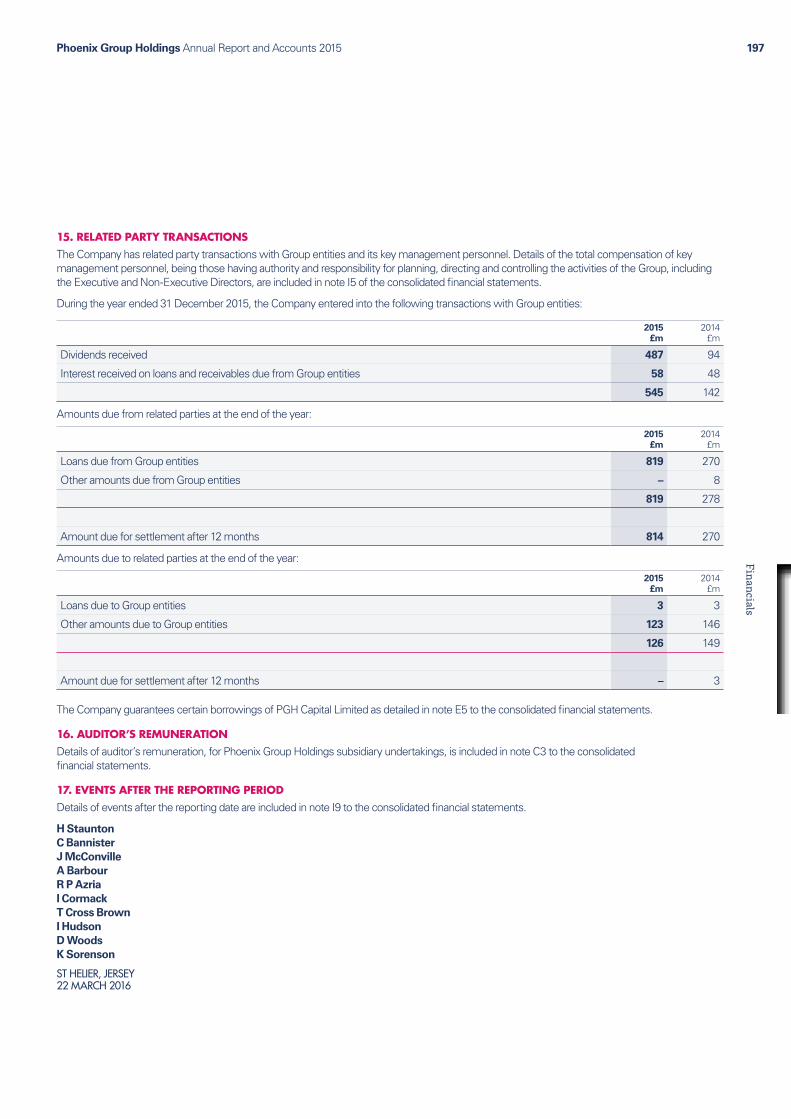
Phoenix Group Holdings Annual Report and Accounts 2015 197Financials
15. RELATED PARTY TRANSACTIONSThe Company has related party transactions with Group entities and its key management personnel. Details of the total compensation of key management personnel, being those having authority and responsibility for planning, directing and controlling the activities of the Group, including the Executive and Non-Executive Directors, are included in note I5 of the consolidated financial statements.
During the year ended 31 December 2015, the Company entered into the following transactions with Group entities:
2015£m
2014£m
Dividends received 487 94
Interest received on loans and receivables due from Group entities 58 48
545 142
Amounts due from related parties at the end of the year:
2015£m
2014£m
Loans due from Group entities 819 270
Other amounts due from Group entities – 8
819 278
Amount due for settlement after 12 months 814 270
Amounts due to related parties at the end of the year:
2015£m
2014£m
Loans due to Group entities 3 3
Other amounts due to Group entities 123 146
126 149
Amount due for settlement after 12 months – 3
The Company guarantees certain borrowings of PGH Capital Limited as detailed in note E5 to the consolidated financial statements.
16. AUDITOR’S REMUNERATIONDetails of auditor’s remuneration, for Phoenix Group Holdings subsidiary undertakings, is included in note C3 to the consolidated financial statements.
17. EVENTS AFTER THE REPORTING PERIODDetails of events after the reporting date are included in note I9 to the consolidated financial statements.
H Staunton C Bannister J McConville A Barbour R P Azria I Cormack T Cross Brown I Hudson D Woods K Sorenson
ST HELIER, JERSEY 22 MARCH 2016

198 Phoenix Group Holdings Annual Report and Accounts 2015
ASSET DISCLOSURES
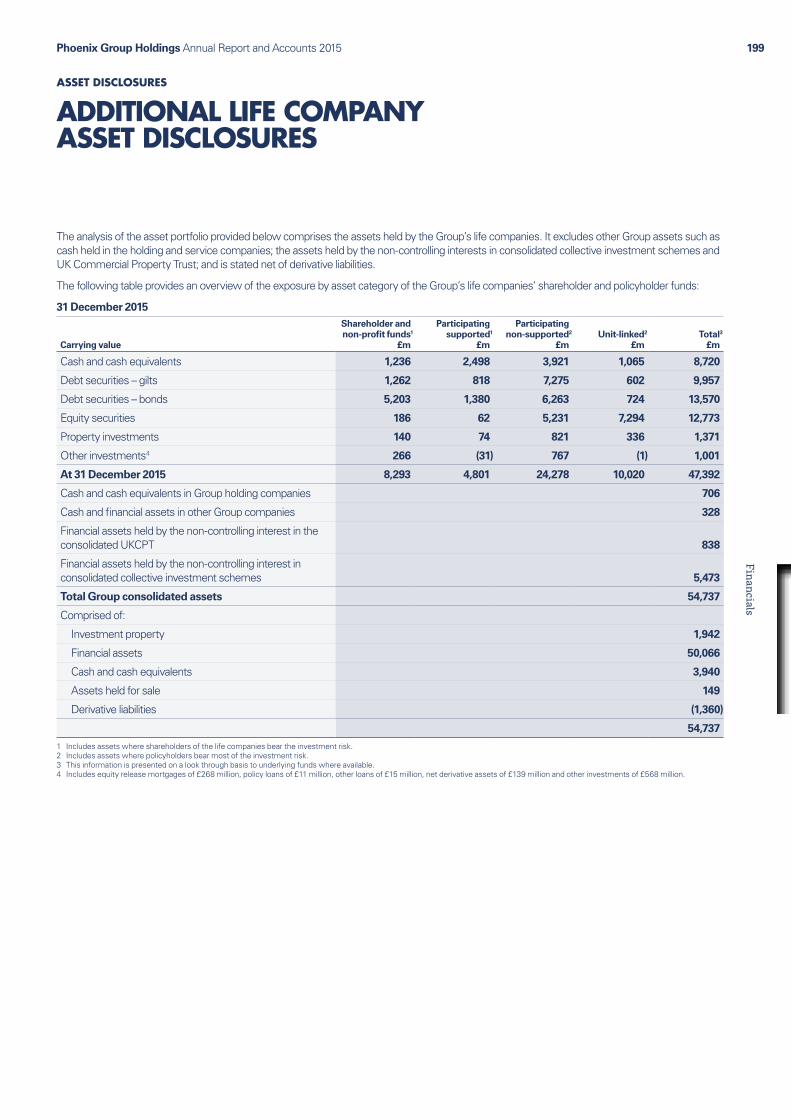
Phoenix Group Holdings Annual Report and Accounts 2015 199Financials
ADDITIONAL LIFE COMPANY ASSET DISCLOSURES
The analysis of the asset portfolio provided below comprises the assets held by the Group’s life companies. It excludes other Group assets such as cash held in the holding and service companies; the assets held by the non-controlling interests in consolidated collective investment schemes and UK Commercial Property Trust; and is stated net of derivative liabilities.
The following table provides an overview of the exposure by asset category of the Group’s life companies’ shareholder and policyholder funds:
31 December 2015
Carrying value
Shareholder andnon-profit funds1
£m
Participating supported1
£m
Participating non-supported2
£mUnit-linked2
£mTotal3
£m
Cash and cash equivalents 1,236 2,498 3,921 1,065 8,720
Debt securities – gilts 1,262 818 7,275 602 9,957
Debt securities – bonds 5,203 1,380 6,263 724 13,570
Equity securities 186 62 5,231 7,294 12,773
Property investments 140 74 821 336 1,371
Other investments4 266 (31) 767 (1) 1,001
At 31 December 2015 8,293 4,801 24,278 10,020 47,392
Cash and cash equivalents in Group holding companies 706
Cash and financial assets in other Group companies 328
Financial assets held by the non-controlling interest in the consolidated UKCPT 838
Financial assets held by the non-controlling interest in consolidated collective investment schemes 5,473
Total Group consolidated assets 54,737
Comprised of:
Investment property 1,942
Financial assets 50,066
Cash and cash equivalents 3,940
Assets held for sale 149
Derivative liabilities (1,360)
54,737
1 Includes assets where shareholders of the life companies bear the investment risk.2 Includes assets where policyholders bear most of the investment risk.3 This information is presented on a look through basis to underlying funds where available.4 Includes equity release mortgages of £268 million, policy loans of £11 million, other loans of £15 million, net derivative assets of £139 million and other investments of £568 million.
ASSET DISCLOSURES
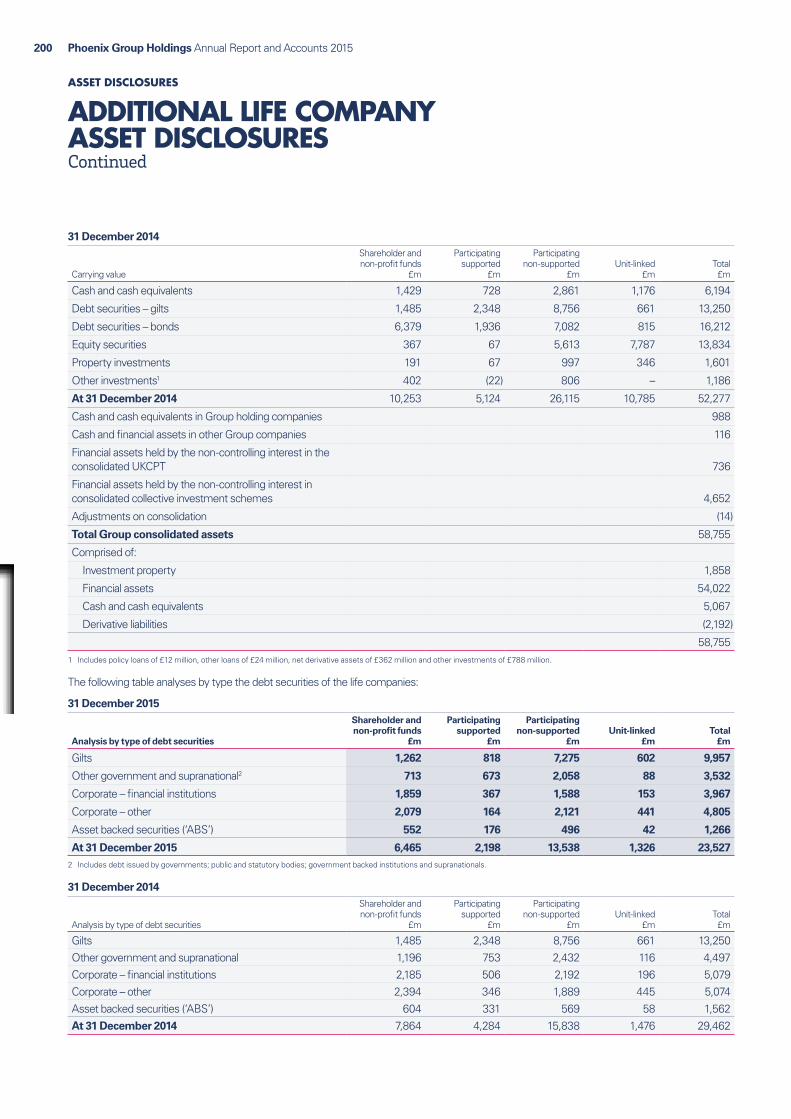
Phoenix Group Holdings Annual Report and Accounts 2015200
ASSET DISCLOSURES
ADDITIONAL LIFE COMPANY ASSET DISCLOSURESContinued
31 December 2014
Carrying value
Shareholder and non-profit funds
£m
Participating supported
£m
Participating non-supported
£mUnit-linked
£mTotal £m
Cash and cash equivalents 1,429 728 2,861 1,176 6,194
Debt securities – gilts 1,485 2,348 8,756 661 13,250
Debt securities – bonds 6,379 1,936 7,082 815 16,212
Equity securities 367 67 5,613 7,787 13,834
Property investments 191 67 997 346 1,601
Other investments1 402 (22) 806 – 1,186
At 31 December 2014 10,253 5,124 26,115 10,785 52,277
Cash and cash equivalents in Group holding companies 988
Cash and financial assets in other Group companies 116
Financial assets held by the non-controlling interest in the consolidated UKCPT 736
Financial assets held by the non-controlling interest in consolidated collective investment schemes 4,652
Adjustments on consolidation (14)
Total Group consolidated assets 58,755
Comprised of:
Investment property 1,858
Financial assets 54,022
Cash and cash equivalents 5,067
Derivative liabilities (2,192)
58,7551 Includes policy loans of £12 million, other loans of £24 million, net derivative assets of £362 million and other investments of £788 million.
The following table analyses by type the debt securities of the life companies:
31 December 2015
Analysis by type of debt securities
Shareholder and non-profit funds
£m
Participating supported
£m
Participating non-supported
£mUnit-linked
£mTotal
£m
Gilts 1,262 818 7,275 602 9,957
Other government and supranational2 713 673 2,058 88 3,532
Corporate – financial institutions 1,859 367 1,588 153 3,967
Corporate – other 2,079 164 2,121 441 4,805
Asset backed securities (‘ABS’) 552 176 496 42 1,266
At 31 December 2015 6,465 2,198 13,538 1,326 23,5272 Includes debt issued by governments; public and statutory bodies; government backed institutions and supranationals.
31 December 2014
Analysis by type of debt securities
Shareholder and non-profit funds
£m
Participating supported
£m
Participating non-supported
£mUnit-linked
£mTotal £m
Gilts 1,485 2,348 8,756 661 13,250Other government and supranational 1,196 753 2,432 116 4,497Corporate – financial institutions 2,185 506 2,192 196 5,079Corporate – other 2,394 346 1,889 445 5,074Asset backed securities (‘ABS’) 604 331 569 58 1,562At 31 December 2014 7,864 4,284 15,838 1,476 29,462

Phoenix Group Holdings Annual Report and Accounts 2015 201Financials
The life companies’ debt portfolio was £23.5 billion at 31 December 2015. Shareholders had direct exposure to £8.7 billion of these assets (including supported participating funds), of which 99% of rated securities were investment grade. The shareholders’ credit risk exposure to the non-supported participating funds is primarily limited to the shareholders’ share of future bonuses. Shareholders’ credit risk exposure to the unit-linked funds is limited to the level of asset management fee, which is dependent on the underlying assets.
Sovereign and supranational debt represented 40% of the debt portfolio in respect of shareholder exposure, or £3.5 billion, at 31 December 2015. The vast majority of the life companies’ exposure to sovereign and supranational debt holdings is to UK gilts.
The following table sets out a breakdown of the life companies’ sovereign and supranational debt security holdings by country:
31 December 2015
Analysis of sovereign and supranational debt security holdings by country
Shareholder and non-profit funds
£m
Participating supported
£m
Participating non-supported
£mUnit-linked
£mTotal
£m
UK 1,400 905 7,560 609 10,474
Supranationals 310 195 553 17 1,075
USA 1 12 15 24 52
Germany 211 232 593 14 1,050
France 31 50 64 4 149
Netherlands – – 1 1 2
Italy – – – 5 5
Spain – – – 3 3
Other – non-Eurozone 22 87 511 13 633
Other – Eurozone – 10 36 – 46
At 31 December 2015 1,975 1,491 9,333 690 13,489
31 December 2014
Analysis of sovereign and supranational debt security holdings by country
Shareholder and non-profit funds
£m
Participating supported
£m
Participating non-supported
£mUnit-linked
£mTotal £m
UK 1,605 2,424 9,200 670 13,899
Supranationals 571 327 661 24 1,583
USA 3 7 119 26 155
Germany 425 263 787 22 1,497
France 49 50 59 5 163
Netherlands – – 4 2 6
Italy – – – 4 4
Spain – 5 – 3 8
Other – non-Eurozone 18 10 282 14 324
Other – Eurozone 10 15 76 7 108
At 31 December 2014 2,681 3,101 11,188 777 17,747
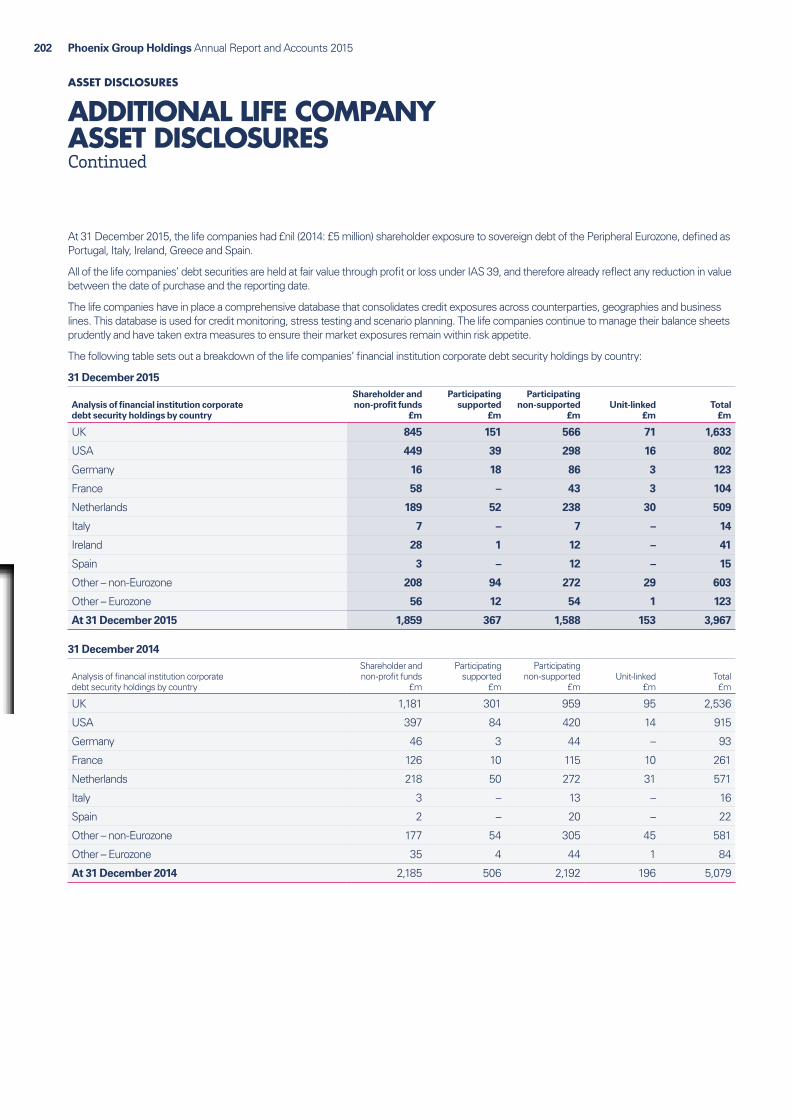
Phoenix Group Holdings Annual Report and Accounts 2015202
ASSET DISCLOSURES
ADDITIONAL LIFE COMPANY ASSET DISCLOSURESContinued
At 31 December 2015, the life companies had £nil (2014: £5 million) shareholder exposure to sovereign debt of the Peripheral Eurozone, defined as Portugal, Italy, Ireland, Greece and Spain.
All of the life companies’ debt securities are held at fair value through profit or loss under IAS 39, and therefore already reflect any reduction in value between the date of purchase and the reporting date.
The life companies have in place a comprehensive database that consolidates credit exposures across counterparties, geographies and business lines. This database is used for credit monitoring, stress testing and scenario planning. The life companies continue to manage their balance sheets prudently and have taken extra measures to ensure their market exposures remain within risk appetite.
The following table sets out a breakdown of the life companies’ financial institution corporate debt security holdings by country:
31 December 2015
Analysis of financial institution corporate debt security holdings by country
Shareholder and non-profit funds
£m
Participating supported
£m
Participating non-supported
£mUnit-linked
£mTotal
£m
UK 845 151 566 71 1,633
USA 449 39 298 16 802
Germany 16 18 86 3 123
France 58 – 43 3 104
Netherlands 189 52 238 30 509
Italy 7 – 7 – 14
Ireland 28 1 12 – 41
Spain 3 – 12 – 15
Other – non-Eurozone 208 94 272 29 603
Other – Eurozone 56 12 54 1 123
At 31 December 2015 1,859 367 1,588 153 3,967
31 December 2014
Analysis of financial institution corporate debt security holdings by country
Shareholder and non-profit funds
£m
Participating supported
£m
Participating non-supported
£mUnit-linked
£mTotal £m
UK 1,181 301 959 95 2,536
USA 397 84 420 14 915
Germany 46 3 44 – 93
France 126 10 115 10 261
Netherlands 218 50 272 31 571
Italy 3 – 13 – 16
Spain 2 – 20 – 22
Other – non-Eurozone 177 54 305 45 581
Other – Eurozone 35 4 44 1 84
At 31 December 2014 2,185 506 2,192 196 5,079

Phoenix Group Holdings Annual Report and Accounts 2015 203Financials
The life companies had £39 million (2014: £5 million) shareholder exposure to financial institution corporate debt of the Peripheral Eurozone at 31 December 2015. The £2,226 million (2014: £2,691 million) total shareholder exposure comprised £1,742 million (2014: £1,644 million) senior debt, £4 million (2014: £215 million) Tier 1 debt and £480 million (2014: £832 million) Tier 2 debt.
The £2,226 million shareholder exposure to financial institution corporate debt comprised £1,281 million (2014: £1,556 million) bank debt and £945 million (2014: £1,135 million) non-bank debt.
For each of the life companies’ significant financial institution counterparties, industry and other data has been used to assess the exposure of the individual counterparties. As part of the Group’s risk appetite framework and analysis of shareholder exposure to a potential worsening of the economic situation, this assessment has been used to identify counterparties considered to be most at risk from defaults. The financial impact on these counterparties, and the contagion impact on the rest of the shareholder portfolio, is assessed under various scenarios and assumptions. This analysis is regularly reviewed to reflect the latest economic outlook, economic data and changes to asset portfolios. The results are used to inform the Group’s views on whether any management actions are required.
The following table sets out a breakdown of the life companies’ corporate – other debt security holdings by country:
31 December 2015
Analysis of corporate – other debt security holdings by country
Shareholder and non-profit funds
£m
Participating supported
£m
Participating non-supported
£mUnit-linked
£mTotal
£m
UK 1,073 76 1,607 363 3,119
USA 288 33 115 15 451
Germany 142 24 93 15 274
France 173 15 113 20 321
Netherlands 39 – 19 3 61
Italy 56 2 27 3 88
Ireland 1 – 2 2 5
Spain 45 – 24 2 71
Other – non-Eurozone 190 13 77 11 291
Other – Eurozone 72 1 44 7 124
At 31 December 2015 2,079 164 2,121 441 4,805
31 December 2014
Analysis of corporate – other debt security holdings by country
Shareholder and non-profit funds
£m
Participating supported
£m
Participating non-supported
£mUnit-linked
£mTotal £m
UK 1,122 166 1,022 350 2,660
USA 436 71 233 16 756
Germany 191 51 151 21 414
France 227 32 197 23 479
Netherlands 51 2 35 5 93
Portugal – – 1 – 1
Italy 42 2 62 2 108
Greece 3 – – – 3
Spain 30 – 28 2 60
Other – non-Eurozone 188 21 96 14 319
Other – Eurozone 104 1 64 12 181
At 31 December 2014 2,394 346 1,889 445 5,074

Phoenix Group Holdings Annual Report and Accounts 2015204
ASSET DISCLOSURES
ADDITIONAL LIFE COMPANY ASSET DISCLOSURESContinued
The following table sets out a breakdown of the life companies’ ABS holdings by country:
31 December 2015
Analysis of ABS holdings by country
Shareholder and non-profit funds
£m
Participating supported
£m
Participating non-supported
£mUnit-linked
£mTotal
£m
UK 499 172 399 41 1,111
USA 3 – 4 – 7
Germany – – 28 – 28
France – 1 – – 1
Netherlands 10 – 20 1 31
Italy – – 12 – 12
Spain – – 1 – 1
Other – non-Eurozone 40 – 10 – 50
Other – Eurozone – 3 22 – 25
At 31 December 2015 552 176 496 42 1,266
31 December 2014
Analysis of ABS holdings by country
Shareholder and non-profit funds
£m
Participating supported
£m
Participating non-supported
£mUnit-linked
£mTotal £m
UK 516 323 487 56 1,382
USA 43 – 5 – 48
Germany – 2 23 – 25
France – 2 – – 2
Netherlands 19 – 28 2 49
Italy – – 5 – 5
Ireland – – 8 – 8
Spain – – 2 – 2
Other – non-Eurozone 26 4 11 – 41
At 31 December 2014 604 331 569 58 1,562

Phoenix Group Holdings Annual Report and Accounts 2015 205Financials
The following table sets out the credit rating analysis of the debt portfolio:
31 December 2015
Credit rating analysis of debt portfolio
Shareholder and non-profit funds
£m
Participating supported
£m
Participating non-supported
£mUnit-linked
£mTotal
£m
AAA 746 625 1,740 72 3,183
AA 2,336 1,272 8,443 487 12,538
A 1,618 189 902 84 2,793
BBB 1,635 92 1,751 179 3,657
BB 100 11 205 21 337
B and below 1 – 327 – 328
Non-rated 29 9 170 483 691
At 31 December 2015 6,465 2,198 13,538 1,326 23,527
97% of rated securities were investment grade at 31 December 2015 (2014: 97%). The percentage of rated securities that were investment grade in relation to the shareholder and policyholders’ funds were 99% and 96% respectively (2014: 95% and 98% respectively).
31 December 2014
Credit rating analysis of debt portfolio
Shareholder and non-profit funds
£m
Participating supported
£m
Participating non-supported
£mUnit-linked
£mTotal £m
AAA 1,168 699 1,769 62 3,698
AA 2,257 2,981 10,130 775 16,143
A 1,549 438 1,392 137 3,516
BBB 2,154 140 2,043 207 4,544
BB 284 3 129 17 433
B and below 284 – 191 2 477
Non-rated 168 23 184 276 651
At 31 December 2014 7,864 4,284 15,838 1,476 29,462

206 Phoenix Group Holdings Annual Report and Accounts 2015206
MCEV SUPPLEMENTARY INFORMATION
Phoenix Group Holdings Annual Report and Accounts 2015 207Financials
MCEV SUPPLEMENTARY INFORMATION
STATEMENT OF DIRECTORS’ RESPONSIBILITIES IN RESPECT OF THE MARKET CONSISTENT EMBEDDED VALUE
When compliance with the CFO Forum MCEV principles published in June 2008 and amended in October 2009 is stated, those principles require the Directors to prepare supplementary information in accordance with the MCEV principles and to disclose and provide reasons for any non‑compliance with the principles.
The MCEV methodology adopted by the Group is in accordance with these MCEV principles, with the exception of:
Ɛ risk‑free rates have been defined as the annually compounded UK Government bond nominal spot curve plus ten basis points rather than as the swap rate curve;
Ɛ the value of the asset management (prior to divestment on 1 July 2014) and the management service companies has been included on an IFRS basis; and
Ɛ no allowance for the costs of residual non‑hedgeable risk has been made.
Further detail on these exceptions is included in note 1, Basis of preparation.
Specifically, the Directors have:
Ɛ determined assumptions on a realistic basis, having regard to past, current and expected future experience and to relevant external data, and then applied them consistently;
Ɛ made estimates that are reasonable and consistent; and
Ɛ provided additional disclosures when compliance with the specific requirements of the MCEV principles is insufficient to enable users to understand the impact of particular transactions, other events and conditions and the Group’s financial position and financial performance.
CLIVE BANNISTER JAMES MCCONVILLEGROUP CHIEF EXECUTIVE OFFICER GROUP FINANCE DIRECTOR
ST HELIER, JERSEY 22 MARCH 2016

Phoenix Group Holdings Annual Report and Accounts 2015208
INDEPENDENT AUDITOR’S REPORT TO THE DIRECTORS OF PHOENIX GROUP HOLDINGS ON THE CONSOLIDATED GROUP MCEV
MCEV SUPPLEMENTARY INFORMATION
We have audited the Consolidated Phoenix Group MCEV (‘Phoenix Group MCEV’) supplementary information for the year ended 31 December 2015 which comprises the Summarised consolidated income statement – Group MCEV basis, MCEV earnings per ordinary share, Statement of consolidated comprehensive income – Group MCEV basis, Reconciliation of movement in equity – Group MCEV basis, Group MCEV analysis of earnings, Reconciliation of Group IFRS equity to MCEV net worth and related notes 1 to 7. The Phoenix Group MCEV supplementary information has been prepared by the Directors of Phoenix Group Holdings (‘the Group’) in accordance with the basis of preparation set out on pages 213 to 215.
DIRECTORS’ RESPONSIBILITIES FOR THE PHOENIX GROUP MCEV SUPPLEMENTARY INFORMATIONThe Directors are responsible for the preparation of the Phoenix Group MCEV supplementary information in accordance with the basis of preparation set out on pages 213 to 215 and for such internal control as the Directors determine is necessary to enable the preparation of supplementary information that is free from material misstatement, whether due to fraud or error.
AUDITOR’S RESPONSIBILITYOur responsibility is to express an opinion on the Phoenix Group MCEV supplementary information based on our audit. We conducted our audit in accordance with International Standards on Auditing. Those standards require us to comply with ethical requirements and plan and perform the audit to obtain reasonable assurance about whether the Phoenix Group MCEV supplementary information is free from material misstatement.
An audit involves performing procedures to obtain audit evidence about the amounts and disclosures in the Phoenix Group MCEV supplementary information. The procedures selected depend on the auditor’s judgement, including the assessment of the risks of material misstatement of the Phoenix Group MCEV supplementary information, whether due to fraud or error. In making those risk assessments, we consider internal control relevant to the Group’s preparation of the Phoenix Group MCEV supplementary information in order to design audit procedures that are appropriate in the circumstances, but not for the purpose of expressing an opinion on the effectiveness of the Group’s internal control. An audit also includes evaluating the appropriateness of accounting policies used and the reasonableness of significant accounting estimates made by the Directors, as well as evaluating the overall presentation of the Phoenix Group MCEV supplementary information.
We believe that the audit evidence we have obtained is sufficient and appropriate to provide a basis for our audit opinion.
OPINIONIn our opinion the Phoenix Group MCEV supplementary information, for the year ended 31 December 2015, has been prepared, in all material respects, in accordance with the basis of preparation set out on pages 213 to 215.
BASIS OF ACCOUNTING AND RESTRICTION ON USEWithout modifying our opinion, we draw attention to pages 213 to 215 of the Phoenix Group MCEV supplementary information, which describe the basis of preparation. The Phoenix Group MCEV supplementary information is prepared by Phoenix Group Holdings in accordance with the basis of preparation set out on pages 213 to 215. As a result, the Phoenix Group MCEV supplementary information may not be suitable for another purpose. This report, including the opinion, has been prepared for and only for the Group’s Directors as a body in accordance with our letter of engagement dated 10 March 2016 and for no other purpose. We do not, in giving this opinion, accept or assume responsibility for any other purpose or to any other person to whom this report is shown or into whose hands it may come save where expressly agreed by our prior consent in writing.
OTHER MATTERWe have reported separately on the IFRS consolidated financial statements of Phoenix Group Holdings for the year ended 31 December 2015.
The information contained in the Phoenix Group MCEV supplementary information should be read in conjunction with the consolidated financial statements prepared on an IFRS basis.
ERNST & YOUNG LLP
LONDON 22 MARCH 2016
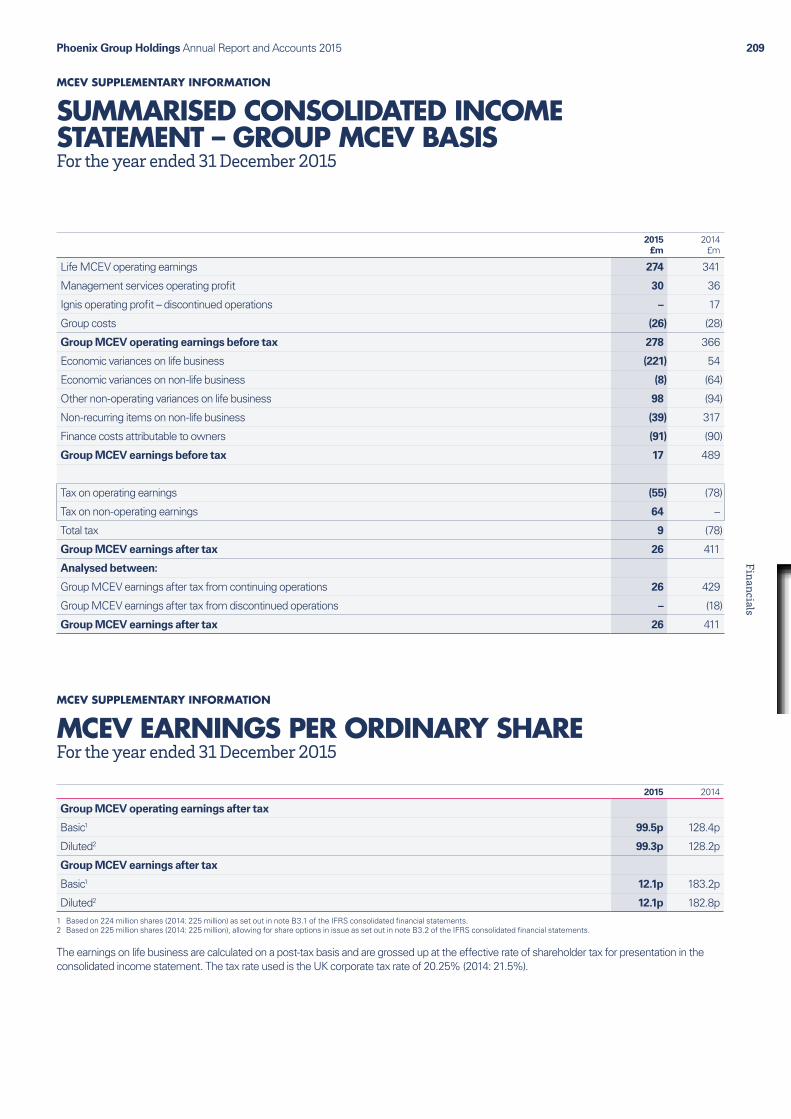
Phoenix Group Holdings Annual Report and Accounts 2015 209Financials
MCEV SUPPLEMENTARY INFORMATION
SUMMARISED CONSOLIDATED INCOME STATEMENT – GROUP MCEV BASISFor the year ended 31 December 2015
2015£m
2014£m
Life MCEV operating earnings 274 341
Management services operating profit 30 36
Ignis operating profit – discontinued operations – 17
Group costs (26) (28)
Group MCEV operating earnings before tax 278 366
Economic variances on life business (221) 54
Economic variances on non‑life business (8) (64)
Other non‑operating variances on life business 98 (94)
Non‑recurring items on non‑life business (39) 317
Finance costs attributable to owners (91) (90)
Group MCEV earnings before tax 17 489
Tax on operating earnings (55) (78)
Tax on non‑operating earnings 64 –
Total tax 9 (78)
Group MCEV earnings after tax 26 411
Analysed between:
Group MCEV earnings after tax from continuing operations 26 429
Group MCEV earnings after tax from discontinued operations – (18)
Group MCEV earnings after tax 26 411
MCEV SUPPLEMENTARY INFORMATION
MCEV EARNINGS PER ORDINARY SHAREFor the year ended 31 December 2015
2015 2014
Group MCEV operating earnings after tax
Basic1 99.5p 128.4p
Diluted2 99.3p 128.2p
Group MCEV earnings after tax
Basic1 12.1p 183.2p
Diluted2 12.1p 182.8p1 Based on 224 million shares (2014: 225 million) as set out in note B3.1 of the IFRS consolidated financial statements.2 Based on 225 million shares (2014: 225 million), allowing for share options in issue as set out in note B3.2 of the IFRS consolidated financial statements.
The earnings on life business are calculated on a post‑tax basis and are grossed up at the effective rate of shareholder tax for presentation in the consolidated income statement. The tax rate used is the UK corporate tax rate of 20.25% (2014: 21.5%).

Phoenix Group Holdings Annual Report and Accounts 2015210
STATEMENT OF CONSOLIDATED COMPREHENSIVE INCOME – GROUP MCEV BASISFor the year ended 31 December 2015
MCEV SUPPLEMENTARY INFORMATION
2015 £m
2014 £m
Group MCEV earnings after tax 26 411
Other comprehensive income:
Remeasurements and pension scheme contributions on defined benefit pension schemes (net of tax) (44) (27)
Fair value gains on owner‑occupied property 4 –
Total comprehensive income for the year (14) 384
MCEV SUPPLEMENTARY INFORMATION
RECONCILIATION OF MOVEMENT IN EQUITY – GROUP MCEV BASISFor the year ended 31 December 2015
2015£m
2014£m
Opening Group MCEV equity 2,647 2,378
Total comprehensive income for the year (14) 384
Issue of ordinary share capital, net of associated commissions and expenses 2 1
Dividends paid on ordinary shares (120) (120)
Dividends paid on shares held by the employee trust and Group entities – 1
Shares sold by Group entities – 4
Movement in equity for equity‑settled share‑based payments 4 7
Shares acquired by the employee benefit trust (6) (8)
Total capital and dividend flows – external (120) (115)
Closing Group MCEV equity 2,513 2,647

Phoenix Group Holdings Annual Report and Accounts 2015 211Financials
MCEV SUPPLEMENTARY INFORMATION
GROUP MCEV ANALYSIS OF EARNINGSFor the year ended 31 December 2015
Non-covered business
Covered business
MCEV £m
Management services
IFRS £m
Other Groupcompanies1
IFRS £m
Group MCEV
£m
Group MCEV at 1 January 2015 2,856 142 (351) 2,647
Operating MCEV earnings (after tax) 220 24 (21) 223
Non‑operating MCEV earnings (after tax) (98) 3 (102) (197)
Total MCEV earnings 122 27 (123) 26
Other comprehensive income/(expense) – 4 (44) (40)
Transfers from covered to non‑covered business2 (138) – 138 –
Capital and dividend flows – internal (166) (8) 174 –
Capital and dividend flows – external – – (120) (120)
Closing value at 31 December 2015 2,674 165 (326) 2,513
1 Comprises the Group holding and other companies that do not form part of the Phoenix Life division.2 Following the de‑authorisation of Opal Reassurance Limited in December 2015, its remaining net assets have been transferred from covered business to non‑covered business.
For the year ended 31 December 2014Non‑covered business
Covered business
MCEV £m
Management services
IFRS £m
AssetManagement3
IFRS £m
Other Group companies1
IFRS £m
Group MCEV
£m
Group MCEV at 1 January 2014 3,059 134 108 (923) 2,378
Operating MCEV earnings (after tax) 268 28 14 (22) 288
Non‑operating MCEV earnings (after tax) (32) (8) (2) 165 123
Total MCEV earnings 236 20 12 143 411
Other comprehensive income – – – (27) (27)
Divested businesses4 (18) – (91) 109 –
Capital and dividend flows – internal (421) (12) (29) 462 –
Capital and dividend flows – external – – – (115) (115)
Closing value at 31 December 2014 2,856 142 – (351) 2,6473 Relates to the Ignis division disposed of on 1 July 2014, classified as discontinued operations. The Asset Management MCEV earnings after tax of £12 million includes intra‑group income of
£30 million.4 Comprises capital flows relating to the disposal of Ignis and BA(GI) Limited.
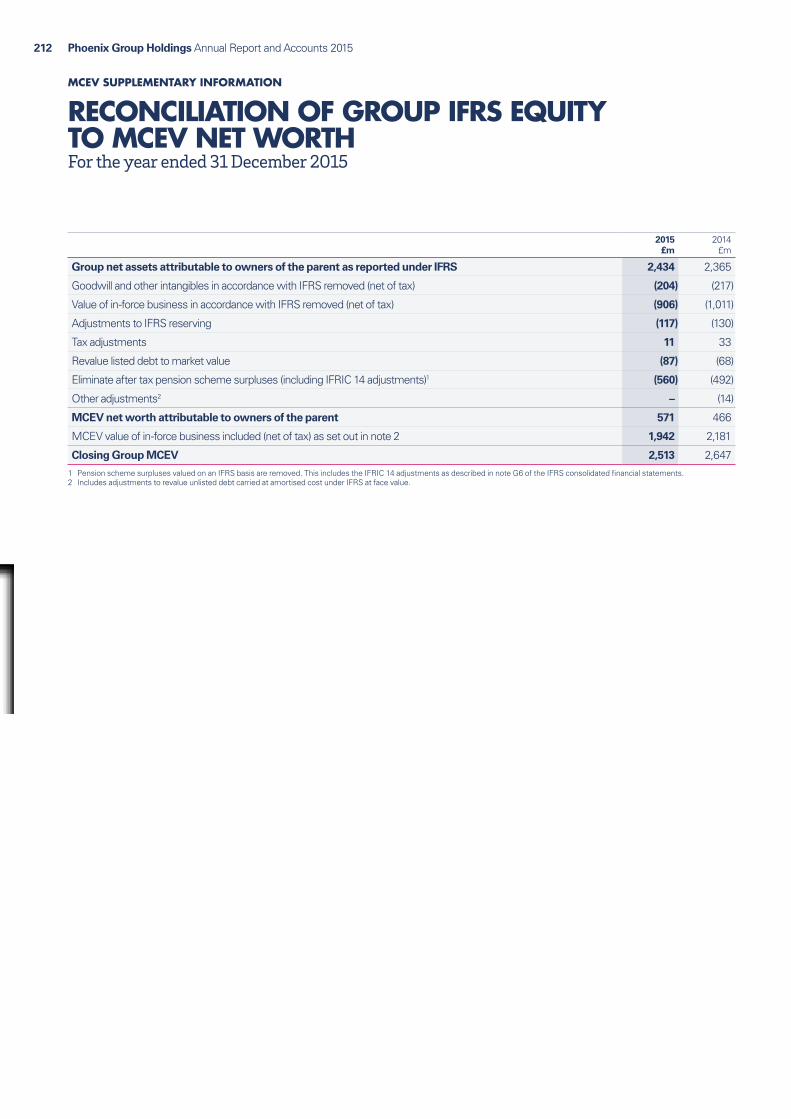
Phoenix Group Holdings Annual Report and Accounts 2015212
2015 £m
2014 £m
Group net assets attributable to owners of the parent as reported under IFRS 2,434 2,365
Goodwill and other intangibles in accordance with IFRS removed (net of tax) (204) (217)
Value of in‑force business in accordance with IFRS removed (net of tax) (906) (1,011)
Adjustments to IFRS reserving (117) (130)
Tax adjustments 11 33
Revalue listed debt to market value (87) (68)
Eliminate after tax pension scheme surpluses (including IFRIC 14 adjustments)1 (560) (492)
Other adjustments2 – (14)
MCEV net worth attributable to owners of the parent 571 466
MCEV value of in‑force business included (net of tax) as set out in note 2 1,942 2,181
Closing Group MCEV 2,513 2,6471 Pension scheme surpluses valued on an IFRS basis are removed. This includes the IFRIC 14 adjustments as described in note G6 of the IFRS consolidated financial statements.2 Includes adjustments to revalue unlisted debt carried at amortised cost under IFRS at face value.
RECONCILIATION OF GROUP IFRS EQUITY TO MCEV NET WORTHFor the year ended 31 December 2015
MCEV SUPPLEMENTARY INFORMATION

Phoenix Group Holdings Annual Report and Accounts 2015 213Financials
NOTES TO THE MCEV FINANCIAL STATEMENTSMCEV SUPPLEMENTARY INFORMATION
1. BASIS OF PREPARATIONOVERVIEWThe supplementary information on pages 209 to 220 has been prepared on a MCEV basis except for the items described further below.
The MCEV methodology adopted by the Group is in accordance with the MCEV principles and guidance published by the CFO Forum in June 2008 and amended in October 2009, except that:
Ɛ risk‑free rates have been defined as the annually compounded UK Government bond nominal spot curve plus 10bps rather than as the swap rate curve;
Ɛ no allowance for the cost of residual non‑hedgeable risk (‘CNHR’) has been made because, in the opinion of the Directors, the Group operates a robust outsourcer model in terms of operational risk, does not write new business, is focused entirely on the back book, and has succeeded in closing out significant legacy risks. The theoretical value of CNHR is disclosed separately in note 1(b); and
Ɛ the asset management (prior to its divestment on 1 July 2014) and management service companies’ values are calculated and presented on a basis consistent with IFRS. Under CFO Forum principles and guidance, productivity gains should not be recognised until achieved. This treatment is inconsistent with the cost profile of a closed fund where continual cost reductions are expected to maintain unit costs as the business runs off. In the opinion of the Directors, if the MCEV principles and guidance were to be applied to the asset management and the management service companies, it would not provide a fair reflection of the Group’s financial position. These companies are therefore reported alongside the Group’s other holding companies at their IFRS net asset value.
In January 2015, the Group announced the successful exchange of 99% of the Group’s Perpetual Reset Capital Securities (‘Tier 1 notes’) for £428 million of new listed subordinated notes issued by PGH Capital Limited and maturing in 2025. The terms of the new notes meet the requirement of Tier 2 capital under Solvency II and have a coupon of 6.625%. Upon exchange, new notes with a face value of £32 million were held by Group companies and continue to be held as at 31 December 2015.
The Finance (No.2) Act 2015 was enacted in November 2015 and set out reductions in rates of corporation tax from 20% to 19% in April 2017 and from 19% to 18% in April 2020. The impact of these changes has been reflected in the Group’s MCEV at 31 December 2015.
A further 1% reduction, to 17%, effective from April 2020 has been announced in the 2016 Budget and will be introduced by future legislation. The impact of this change has not been reflected in the Group’s MCEV at 31 December 2015.
On 9 November 2015 the Group entered into an agreement with RGA International, effective from 1 November 2015, to reinsure substantively all of the PLAL annuity liabilities previously ceded to Opal Re, a subsidiary undertaking of the Company. The Group paid a reinsurance premium of £1,346 million to RGA International. A favourable impact of £13 million has arisen as a result of entering the reassurance arrangement, consisting of an £18 million gain recognised in ‘Other non‑operating variances on life business’ and attributable transaction expenses of £5 million recognised in ‘Non‑recurring items on non‑life business’.
On 2 December 2015, the Group completed the sale of its entire interest in Scottish Mutual International Limited (‘SMI’) for cash consideration of £14 million following a pre‑completion return of capital by SMI. The results of SMI have been included in the MCEV supplementary information up to the date of the disposal, and a loss on disposal of £4 million has been recorded in ‘Other non‑operating variances on life business’.
COVERED BUSINESSThe MCEV calculations cover all long‑term insurance business written by the Group, but exclude Ignis (prior to its divestment on 1 July 2014) and the management service companies.
Opal Re was included within covered business prior to its de‑authorisation as an insurance company in December 2015, and was valued on a basis consistent with the annuity business within the UK life companies. Following the de‑authorisation, the residual net assets of Opal Re are included within non‑covered business and valued in accordance with IFRS.
MCEV METHODOLOGYThe embedded value of covered business is based on a market‑consistent methodology. Under this methodology, assets and liabilities are valued in line with market prices and consistently with each other.
The key components of MCEV are net worth plus the value of in‑force covered business.
a) Net worth
For the Group’s life companies, net worth is defined as the market value of shareholder funds plus the shareholders’ interest in surplus assets held in long‑term business funds less the market value of any outstanding debt of the life companies.
Loans from the life companies to holding companies have been consolidated out such that they do not appear as an asset in the life company or as a liability in the holding company. This presentation has no impact on the overall MCEV but does affect the allocation of net assets between covered and non‑covered business.
b) Value of in-force business (‘VIF’)
The market consistent VIF represents the present value of profits attributable to shareholders arising from the in‑force business, less an allowance for the time value of financial options and guarantees embedded within life insurance contracts and frictional costs of required capital.
The approach adopted to calculate VIF combines deterministic and stochastic techniques (each of which is discussed in more detail below):
Ɛ deterministic techniques have been used to value cash flows whose values vary in a linear fashion with market movements. These cash flows are valued using discount rates that reflect the risk inherent in each cash flow. In practice, it is not necessary to discount each cash flow at a different discount rate, as the same result is achieved by projecting and discounting all cash flows at risk‑free rates. This is known as the ‘certainty equivalent approach’; and

Phoenix Group Holdings Annual Report and Accounts 2015214
NOTES TO THE MCEV FINANCIAL STATEMENTSContinued
MCEV SUPPLEMENTARY INFORMATION
1. BASIS OF PREPARATION continued
MCEV METHODOLOGY continued
Ɛ stochastic techniques have been used to value cash flows that have an asymmetric effect on cash flows to shareholders. Here, the calculation involves the use of stochastic models developed for the purposes of realistic balance sheet reporting.
The VIF consists of the following components:
Present value of future profits (‘PVFP’)The PVFP represents the present value of profits attributable to shareholders arising from the in‑force business. The PVFP is calculated by projecting and discounting using risk‑free rates, with an allowance for liquidity premiums where appropriate.
The projection is based on actively reviewed best estimate non‑economic assumptions. Best estimate assumptions make appropriate allowance for expected future experience where there is sufficient evidence to justify; for example, in allowing for future mortality improvements on annuity business.
Time value of financial options and guarantees (‘TVFOGs’)The Group’s embedded value includes an explicit allowance for the TVFOGs embedded within insurance contracts, including investment performance guarantees on participating business and guaranteed vesting annuity rates. The cost of these options and guarantees to shareholders is calculated using market‑consistent stochastic models calibrated to the market prices of financial instruments as at the period end.
The TVFOGs allow for the impact of management actions, consistent with those permitted by the Principles and Practices of Financial Management. The modelling of management actions vary for each of the funds but typically include management of bonus rates and policy enhancements, charges to asset shares to cover increases to the cost of guarantees and alterations to investment strategy.
Frictional cost of capital (‘COC’)COC is defined as the difference between the market value of shareholder‑owned assets backing required capital and the present value of future releases of those assets allowing for future investment returns on that capital, investment expenses and taxes.
Required capital is defined as the minimum regulatory capital requirement, which is the greater of Solvency I Pillar 1 and Pillar 2 capital requirements, plus the capital required under the Group’s capital management policy. This equates to 146% of the Solvency I Pillar 1 minimum regulatory capital requirement or 123% of the Solvency I Pillar 2 minimum regulatory capital requirement (2014: 142% Pillar 1, 124% Pillar 2).
Solvency II introduces a new capital regime for insurers with effect from 1 January 2016. No allowance has been made within the Group’s MCEV information for the impact of this, in accordance with the additional guidance issued by the CFO Forum in October 2015.
Costs of residual non‑hedgeable risks (‘CNHR’)The CNHR should allow for risks that can have an asymmetric impact on shareholder value to the extent these risks have not already been reflected in the PVFP or TVFOGs. The majority of such risks within the Group are operational and tax risks.
No allowance for the CNHR has been made, as in the opinion of the Directors, the CNHR calculated in accordance with CFO Forum principles and guidance does not anticipate further risk management actions, and therefore does not provide a fair reflection of the Group’s ongoing risk.
However, the CNHR calculated in accordance with the CFO Forum principles and guidance, and therefore without anticipating further risk management actions, has been disclosed below.
For with‑profits business the CNHR would increase the TVFOGs by £23 million (2014: £14 million).
For other business the cost would be £106 million (2014: £105 million). This equates to an equivalent average cost of capital charge of 0.76% (2014: 0.95%). The level of capital assumed in this calculation is determined based on a 99.5% confidence level over a 1 year time horizon, consistent with the ICA methodology. Allowance is made for diversification benefits between non‑hedgeable risks, but not between hedgeable and non‑hedgeable risks.
c) Valuation of debt
Listed debt issued by the Group is valued at the market value quoted at the reporting date which is consistent with MCEV principles.
The National Provident Life Limited recourse bonds are backed by surpluses that are expected to emerge on blocks of its unit‑linked and unitised with‑profits business. This securitisation has been valued on a cash flow basis, allowing for payments expected to be due based on the projected level of securitised surpluses emerging. The full VIF of the securitised unit‑linked and unitised with‑profits business is expected to be payable to bondholders; therefore, no additional value accrues to the embedded value.
Unlisted bank debt owed by the holding companies is included at face value.
d) Taxation
Full allowance has been made for the value of tax that would become payable on the transfer of surplus assets out of non‑profit funds. This allowance reflects the projected pace of releases of surplus from non‑profit funds that is not required to support with‑profit funds.
Allowance has also been made for the tax relief arising from interest payments made on the debt of the holding companies. The value of the tax relief is determined by offsetting the tax payable on profits emerging from covered business against the tax relief afforded by interest payments on the debt. Interest payments are projected assuming that current levels of debt are reduced and then refinanced to maintain a long‑term level of debt that the Directors consider to be supported by the projected embedded value of the Group’s businesses.
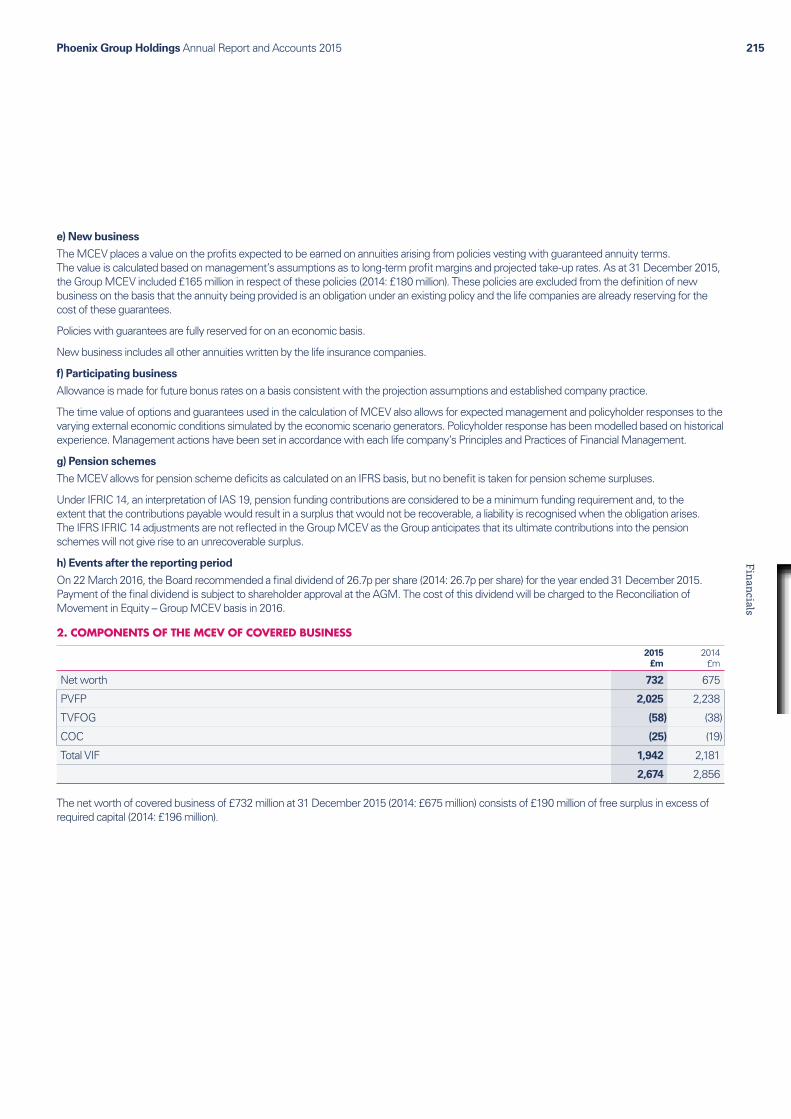
Phoenix Group Holdings Annual Report and Accounts 2015 215Financials
e) New business
The MCEV places a value on the profits expected to be earned on annuities arising from policies vesting with guaranteed annuity terms. The value is calculated based on management’s assumptions as to long‑term profit margins and projected take‑up rates. As at 31 December 2015, the Group MCEV included £165 million in respect of these policies (2014: £180 million). These policies are excluded from the definition of new business on the basis that the annuity being provided is an obligation under an existing policy and the life companies are already reserving for the cost of these guarantees.
Policies with guarantees are fully reserved for on an economic basis.
New business includes all other annuities written by the life insurance companies.
f) Participating business
Allowance is made for future bonus rates on a basis consistent with the projection assumptions and established company practice.
The time value of options and guarantees used in the calculation of MCEV also allows for expected management and policyholder responses to the varying external economic conditions simulated by the economic scenario generators. Policyholder response has been modelled based on historical experience. Management actions have been set in accordance with each life company’s Principles and Practices of Financial Management.
g) Pension schemes
The MCEV allows for pension scheme deficits as calculated on an IFRS basis, but no benefit is taken for pension scheme surpluses.
Under IFRIC 14, an interpretation of IAS 19, pension funding contributions are considered to be a minimum funding requirement and, to the extent that the contributions payable would result in a surplus that would not be recoverable, a liability is recognised when the obligation arises. The IFRS IFRIC 14 adjustments are not reflected in the Group MCEV as the Group anticipates that its ultimate contributions into the pension schemes will not give rise to an unrecoverable surplus.
h) Events after the reporting period
On 22 March 2016, the Board recommended a final dividend of 26.7p per share (2014: 26.7p per share) for the year ended 31 December 2015. Payment of the final dividend is subject to shareholder approval at the AGM. The cost of this dividend will be charged to the Reconciliation of Movement in Equity – Group MCEV basis in 2016.
2. COMPONENTS OF THE MCEV OF COVERED BUSINESS
2015 £m
2014 £m
Net worth 732 675
PVFP 2,025 2,238
TVFOG (58) (38)
COC (25) (19)
Total VIF 1,942 2,181
2,674 2,856
The net worth of covered business of £732 million at 31 December 2015 (2014: £675 million) consists of £190 million of free surplus in excess of required capital (2014: £196 million).
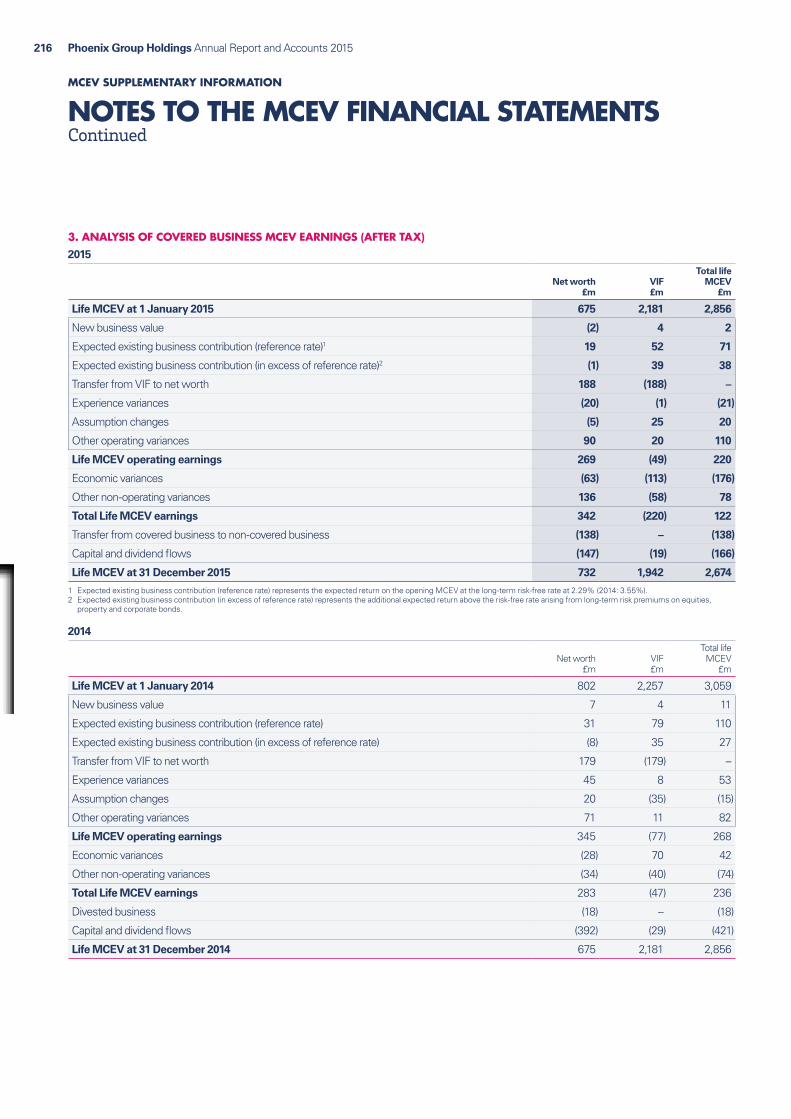
Phoenix Group Holdings Annual Report and Accounts 2015216
NOTES TO THE MCEV FINANCIAL STATEMENTSContinued
MCEV SUPPLEMENTARY INFORMATION
3. ANALYSIS OF COVERED BUSINESS MCEV EARNINGS (AFTER TAX)2015
Net worth £m
VIF £m
Total life MCEV
£m
Life MCEV at 1 January 2015 675 2,181 2,856
New business value (2) 4 2
Expected existing business contribution (reference rate)1 19 52 71
Expected existing business contribution (in excess of reference rate)2 (1) 39 38
Transfer from VIF to net worth 188 (188) –
Experience variances (20) (1) (21)
Assumption changes (5) 25 20
Other operating variances 90 20 110
Life MCEV operating earnings 269 (49) 220
Economic variances (63) (113) (176)
Other non‑operating variances 136 (58) 78
Total Life MCEV earnings 342 (220) 122
Transfer from covered business to non‑covered business (138) – (138)
Capital and dividend flows (147) (19) (166)
Life MCEV at 31 December 2015 732 1,942 2,674
1 Expected existing business contribution (reference rate) represents the expected return on the opening MCEV at the long‑term risk‑free rate at 2.29% (2014: 3.55%).2 Expected existing business contribution (in excess of reference rate) represents the additional expected return above the risk‑free rate arising from long‑term risk premiums on equities,
property and corporate bonds.
2014
Net worth £m
VIF £m
Total life MCEV
£m
Life MCEV at 1 January 2014 802 2,257 3,059
New business value 7 4 11
Expected existing business contribution (reference rate) 31 79 110
Expected existing business contribution (in excess of reference rate) (8) 35 27
Transfer from VIF to net worth 179 (179) –
Experience variances 45 8 53
Assumption changes 20 (35) (15)
Other operating variances 71 11 82
Life MCEV operating earnings 345 (77) 268
Economic variances (28) 70 42
Other non‑operating variances (34) (40) (74)
Total Life MCEV earnings 283 (47) 236
Divested business (18) – (18)
Capital and dividend flows (392) (29) (421)
Life MCEV at 31 December 2014 675 2,181 2,856
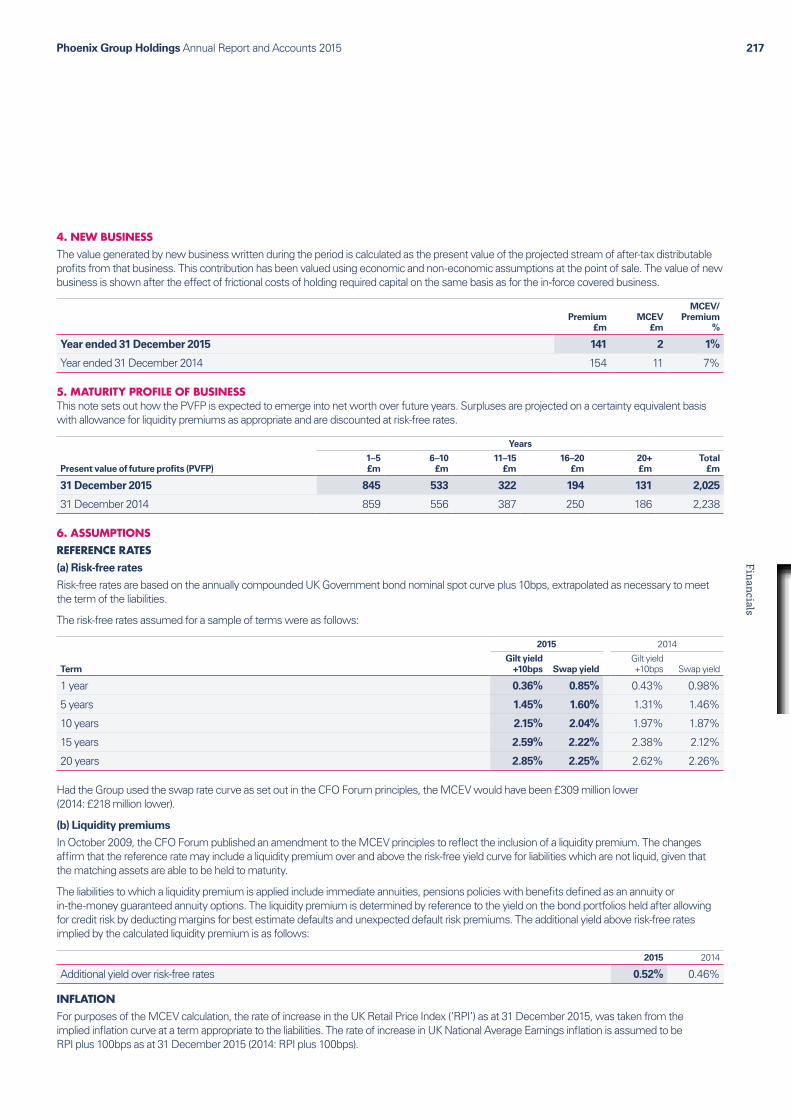
Phoenix Group Holdings Annual Report and Accounts 2015 217Financials
4. NEW BUSINESSThe value generated by new business written during the period is calculated as the present value of the projected stream of after‑tax distributable profits from that business. This contribution has been valued using economic and non‑economic assumptions at the point of sale. The value of new business is shown after the effect of frictional costs of holding required capital on the same basis as for the in‑force covered business.
Premium £m
MCEV £m
MCEV/ Premium
%
Year ended 31 December 2015 141 2 1%
Year ended 31 December 2014 154 11 7%
5. MATURITY PROFILE OF BUSINESSThis note sets out how the PVFP is expected to emerge into net worth over future years. Surpluses are projected on a certainty equivalent basis with allowance for liquidity premiums as appropriate and are discounted at risk‑free rates.
Present value of future profits (PVFP)
Years
1–5 £m
6–10 £m
11–15 £m
16–20 £m
20+ £m
Total £m
31 December 2015 845 533 322 194 131 2,025
31 December 2014 859 556 387 250 186 2,238
6. ASSUMPTIONSREFERENCE RATES(a) Risk-free rates
Risk‑free rates are based on the annually compounded UK Government bond nominal spot curve plus 10bps, extrapolated as necessary to meet the term of the liabilities.
The risk‑free rates assumed for a sample of terms were as follows:
Term
2015 2014
Gilt yield +10bps Swap yield
Gilt yield +10bps Swap yield
1 year 0.36% 0.85% 0.43% 0.98%
5 years 1.45% 1.60% 1.31% 1.46%
10 years 2.15% 2.04% 1.97% 1.87%
15 years 2.59% 2.22% 2.38% 2.12%
20 years 2.85% 2.25% 2.62% 2.26%
Had the Group used the swap rate curve as set out in the CFO Forum principles, the MCEV would have been £309 million lower (2014: £218 million lower).
(b) Liquidity premiums
In October 2009, the CFO Forum published an amendment to the MCEV principles to reflect the inclusion of a liquidity premium. The changes affirm that the reference rate may include a liquidity premium over and above the risk‑free yield curve for liabilities which are not liquid, given that the matching assets are able to be held to maturity.
The liabilities to which a liquidity premium is applied include immediate annuities, pensions policies with benefits defined as an annuity or in‑the‑money guaranteed annuity options. The liquidity premium is determined by reference to the yield on the bond portfolios held after allowing for credit risk by deducting margins for best estimate defaults and unexpected default risk premiums. The additional yield above risk‑free rates implied by the calculated liquidity premium is as follows:
2015 2014
Additional yield over risk‑free rates 0.52% 0.46%
INFLATIONFor purposes of the MCEV calculation, the rate of increase in the UK Retail Price Index (‘RPI’) as at 31 December 2015, was taken from the implied inflation curve at a term appropriate to the liabilities. The rate of increase in UK National Average Earnings inflation is assumed to be RPI plus 100bps as at 31 December 2015 (2014: RPI plus 100bps).

Phoenix Group Holdings Annual Report and Accounts 2015218
NOTES TO THE MCEV FINANCIAL STATEMENTSContinued
MCEV SUPPLEMENTARY INFORMATION
6. ASSUMPTIONS continued
STOCHASTIC ECONOMIC ASSUMPTIONSThe time value of options and guarantees is calculated using an economic scenario generator. The model is calibrated to market conditions as at 31 December 2015. The scenario generator and calibration are consistent with that used for realistic balance sheet reporting.
A LIBOR Market Model with displaced diffusion and stochastic volatility is used to generate risk‑free rates over a complete yield curve, calibrated to the UK nominal spot curve plus 10bps, consistent with the deterministic projections. Interest rate volatility is calibrated to swaption implied volatilities, as per the sample below.
Interest rate volatility
Option term (years)
5 10 15 20 25 30
2015 Swap term (years)
5 35.3% 32.6% 31.2% 30.6% 30.4% 30.2%
10 30.9% 29.8% 29.3% 29.3% 29.2% 28.7%
20 28.1% 28.6% 29.0% 28.8% 28.0% 27.1%
30 28.3% 29.0% 28.9% 28.0% 26.6% 25.7%
Interest rate volatility
Option term (years)
5 10 15 20 25 30
2014 Swap term (years)
5 37.4% 32.1% 29.1% 27.4% 26.5% 25.7%
10 29.9% 27.0% 25.4% 24.6% 24.1% 23.2%
20 24.6% 23.8% 23.4% 22.9% 22.0% 21.0%
30 23.6% 23.3% 22.7% 21.9% 20.8% 19.8%
Real interest rates have been modelled using the two‑factor Hull‑White model, calibrated to index‑linked gilts.
Equity volatility is calibrated to replicate the prices on a range of FTSE equity options with a range of terms and strikes. The equity volatility model used allows volatility to vary with both term and strike of the options.
Equity implied volatility (ATM)
Term (years)
5 10 15 20 25 30
2015 21.0% 22.1% 22.7% 23.1% 23.3% 23.5%
2014 20.8% 22.2% 23.0% 23.4% 23.7% 23.9%
Best estimate levels of volatility are assumed for directly held property. The model implied volatility for 31 December 2015 is 15% (2014: 15%).
The modelling of corporate bonds allows for credit transitions and defaults, calibrated to historic data, derived from current markets.

Phoenix Group Holdings Annual Report and Accounts 2015 219Financials
OPERATING EARNINGSThe Group uses normalised investment returns in calculating the expected existing business contribution. The Group considers that an average return over the remaining term of its in‑force business is more appropriate than using a short‑term rate and is more consistent with the Group’s expectation of longer‑term rates of return. Therefore, the Group calculates the expected contribution on existing business using a 15‑year gilt rate at the beginning of the reporting period plus 10bps and long‑term expectations of excess investment returns.
The table below sets outs the asset risk premiums used:
2015 2014
Equities 3.0% 3.0%
Property 2.0% 2.0%
Gilts 0.0% 0.0%
The return assumed on corporate bond portfolios is the redemption yield for the portfolio less an allowance for credit risk.
EXPENSESEach life company’s projected per policy expenses are based on agreements with the Group’s management service companies, adjusted to allow for additional costs incurred directly by the life companies, including, for example, regulatory fees and one‑time expenses.
The life companies’ projected investment expenses are based on the fees agreed with the Group’s fund managers, allowing for current and projected future asset mixes.
VALUATION OF DEBT AND NON-CONTROLLING INTERESTSThe Group’s statement of consolidated financial position as at 31 December 2015 includes Perpetual Reset Capital Securities with principal outstanding of £6 million (2014: £394 million), Phoenix Life Limited subordinated debt with a face value of £200 million (2014: £200 million), the PGH Capital Limited senior bond with a face value of £300 million (2014: £300 million) and the PGH Capital Limited subordinated notes issued during the year, with principal outstanding of £396 million (net of internal holdings). These listed securities have been included within the MCEV at their market value quoted at the reporting date.
The table below summarises the face and market values of these debt obligations after adjustment for internal holdings in the Perpetual Reset Capital Securities and the PGH Capital subordinated notes:
2015 2014
Face value £m
Market value
£mFace value
£m
Market value
£m
Listed debt and non-controlling interests
Perpetual Reset Capital Securities 6 6 394 387
Phoenix Life Limited subordinated debt 200 212 200 212
PGH Capital Limited senior bond 300 324 300 324
PGH Capital Limited subordinated notes 396 400 – –
Unlisted debt has been included at face value:
2015 Face value
£m
2014 Face value
£m
Unlisted debt
PGH Capital Limited facility 650 840
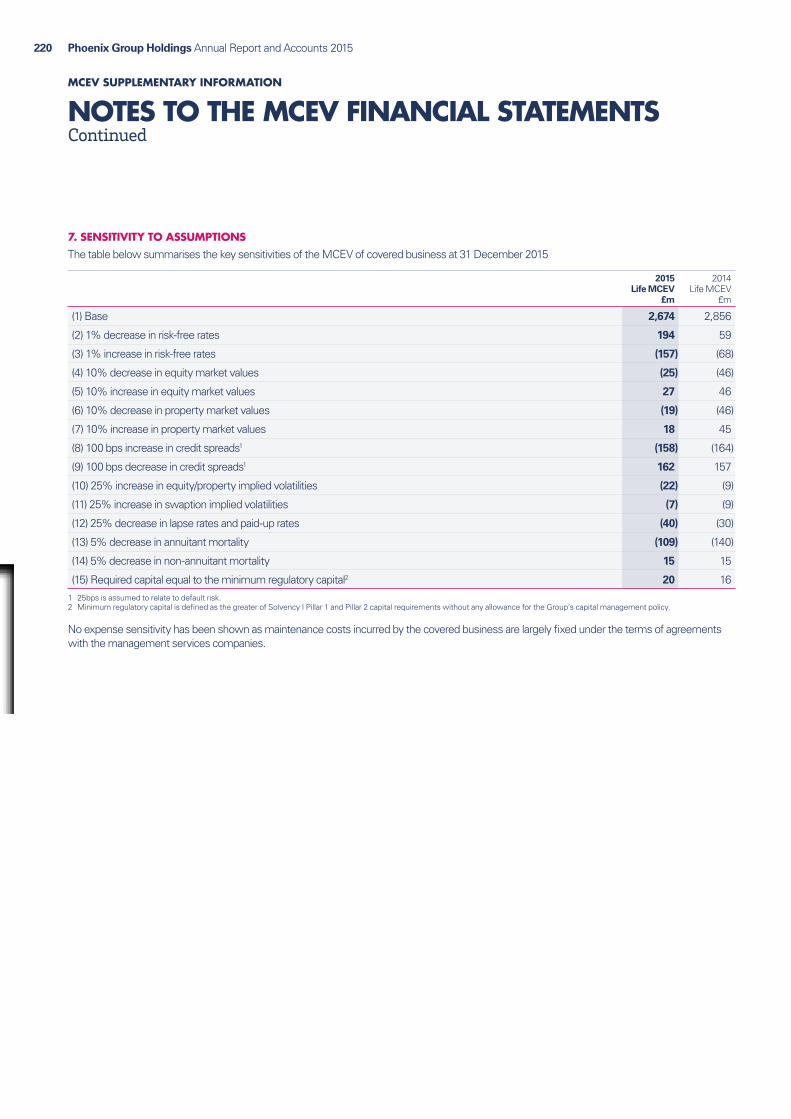
Phoenix Group Holdings Annual Report and Accounts 2015220
NOTES TO THE MCEV FINANCIAL STATEMENTSContinued
MCEV SUPPLEMENTARY INFORMATION
7. SENSITIVITY TO ASSUMPTIONSThe table below summarises the key sensitivities of the MCEV of covered business at 31 December 2015
2015 Life MCEV
£m
2014 Life MCEV
£m
(1) Base 2,674 2,856
(2) 1% decrease in risk‑free rates 194 59
(3) 1% increase in risk‑free rates (157) (68)
(4) 10% decrease in equity market values (25) (46)
(5) 10% increase in equity market values 27 46
(6) 10% decrease in property market values (19) (46)
(7) 10% increase in property market values 18 45
(8) 100 bps increase in credit spreads1 (158) (164)
(9) 100 bps decrease in credit spreads1 162 157
(10) 25% increase in equity/property implied volatilities (22) (9)
(11) 25% increase in swaption implied volatilities (7) (9)
(12) 25% decrease in lapse rates and paid‑up rates (40) (30)
(13) 5% decrease in annuitant mortality (109) (140)
(14) 5% decrease in non‑annuitant mortality 15 15
(15) Required capital equal to the minimum regulatory capital2 20 161 25bps is assumed to relate to default risk.2 Minimum regulatory capital is defined as the greater of Solvency I Pillar 1 and Pillar 2 capital requirements without any allowance for the Group’s capital management policy.
No expense sensitivity has been shown as maintenance costs incurred by the covered business are largely fixed under the terms of agreements with the management services companies.

221Phoenix Group Holdings Annual Report and Accounts 2015
AD
DITIO
NA
L IN
FOR
MA
TION
IN THIS SECTION
Shareholder information 222
Glossary 225

Phoenix Group Holdings Annual Report and Accounts 2015222
SHAREHOLDER INFORMATION
ANNUAL GENERAL MEETINGOur Annual General Meeting (‘AGM’) will be held on 11 May 2016 at 12:30pm.
The voting results for our 2016 AGM, including proxy votes and votes withheld, will be available on the Group’s website shortly after the meeting.
SHARE PRICE PERFORMANCE
PHOENIX GROUP HOLDINGS SHARE PRICE PERFORMANCEPrice (rebased to PHNX) pence
Dec2015
Apr2015
Mar2015
Feb2015
Jul2015
Jun2015
May2015
Oct2015
Nov2015
Sep2015
Aug2015
Jan2015
Phoenix GroupFTSE 250 (ex Inv Trusts) FTSE 350 Life Assurance
1,000
950
900
850
800
750
700
SHAREHOLDER PROFILE AS AT 31 DECEMBER 2015
Range of shareholdingsNo. of
shareholders %No. of
shares %
1–1,000 625 38.5 301,280 0.1
1,001–5,000 482 29.6 1,088,957 0.5
5,001–10,000 105 6.5 753,488 0.4
10,001–250,000 299 18.4 20,086,625 8.9
250,001–500,000 44 2.7 16,084,163 7.1
500,001 and above 70 4.3 187,104,933 83
Total 1625 100 225,419,446 100

Phoenix Group Holdings Annual Report and Accounts 2015 223A
dditional information
SHAREHOLDER SERVICESMANAGING YOUR SHAREHOLDINGOur registrar, Computershare, maintains the Company’s register of members. Shareholders may request a hard copy of this Annual Report from our registrar and if you have any further queries in respect of your shareholding, please contact directly using the contact details set out below.
REGISTRAR DETAILSComputershare Investor Services (Cayman) Limited Queensway House Hilgrove Street St Helier Jersey, JE1 1ES
Shareholder helpline number +44 (0) 870 707 4040 Fax number +44 (0) 870 873 5851 Shareholder helpline email address [email protected]
DIVIDEND MANDATESShareholders may find it convenient to have their dividends paid directly to their bank or building society account. If you wish to take advantage of this facility please call Computershare and request a ‘Dividend Mandate’ form.
SCRIP DIVIDEND ALTERNATIVEThe Company does not currently offer a scrip dividend alternative.
WARNING TO SHAREHOLDERSOver recent years, many companies have become aware that their shareholders have received unsolicited phone calls or correspondence concerning investment matters. These are typically from overseas-based ‘brokers’ who target UK shareholders, offering to sell them what often turn out to be worthless or high-risk shares in US or UK investments. These operations are commonly known as ‘boiler rooms’.
Shareholders are advised to be very wary of any unsolicited advice, offers to buy shares at a discount or offers of free reports about the Company.
If you receive any unsolicited investment advice:
Ɛ make sure you get the correct name of the person and organisation;
Ɛ check that they are properly authorised by the Financial Conduct Authority (‘FCA’) before getting involved by visiting www.fca.org.uk/firms/systems-reporting/register;
Ɛ report the matter to the FCA by calling the FCA Consumer Helpline on 0800 111 6768; and
Ɛ if the calls persist, hang up.
If you deal with an unauthorised firm, you will not be eligible to receive payment under the Financial Services Compensation Scheme (‘FSCS’). The FCA can also be contacted by completing an online form available at www.fca.org.uk/consumers/scams/investment-scams/share-fraud-and-boiler-room-scams/reporting-form.
Details of any share dealing facilities that the Company endorses will be included in Company mailings.
More detailed information on this or similar activity can be found on the FCA website available at www.fca.org.uk/consumers.

Phoenix Group Holdings Annual Report and Accounts 2015224
SHAREHOLDER INFORMATIONContinued
SHARE PRICEYou can access the current share price of Phoenix Group Holdings on the Group’s website together with electronic copies of the Group’s financial reports and presentations at www.thephoenixgroup.com/investor-relations.aspx.
ORDINARY SHARES – 2015 FINAL DIVIDEND
Ex-dividend date 7 April 2016
Record date 8 April 2016
Payment date for the recommended final dividend 13 May 2016
GROUP FINANCIAL CALENDAR FOR 2016
Annual General Meeting 11 May 2016
Announcement of unaudited six months’ Interim Results 25 August 2016
FORWARD-LOOKING STATEMENTSThe 2015 Annual Report and Accounts contains, and the Group may make other statements (verbal or otherwise) containing, forward-looking statements and other financial and/or statistical data about the Group’s current plans, goals and expectations relating to future financial conditions, performance, results, strategy and/or objectives.
Statements containing the words: ‘believes’, ‘intends’, ‘will’, ‘may’, ‘should’, ‘expects’, ‘plans’, ‘aims’, ‘seeks’, ‘targets’, ‘continues’ and ‘anticipates’ or other words of similar meaning are forward-looking. Such forward-looking statements and other financial and/or statistical data involve risk and uncertainty because they relate to future events and circumstances that are beyond the Group’s control. For example, certain insurance risk disclosures are dependent on the Group’s choices about assumptions and models, which by their nature are estimates. As such, actual future gains and losses could differ materially from those that we have estimated. Other factors which could cause actual results to differ materially from those estimated by forward-looking statements include but are not limited to:
Ɛ domestic and global economic and business conditions;
Ɛ asset prices;
Ɛ market-related risks such as fluctuations in interest rates and exchange rates, the potential for a sustained low-interest rate environment, and the performance of financial markets generally;
Ɛ the policies and actions of governmental and/or regulatory authorities, including, for example, new government initiatives related to the financial crisis and the effect of the European Union’s ‘Solvency II’ requirements on the Group’s capital maintenance requirements;
Ɛ market developments and government actions regarding the referendum on UK membership of the European Union;
Ɛ the impact of inflation and deflation;
Ɛ market competition;
Ɛ changes in assumptions in pricing and reserving for insurance business (particularly with regard to mortality and morbidity trends, gender pricing and lapse rates);
Ɛ the timing, impact and other uncertainties of future acquisitions or combinations within relevant industries;
Ɛ risks associated with arrangements with third parties;
Ɛ inability of reinsurers to meet obligations or unavailability of reinsurance coverage; and
Ɛ the impact of changes in capital, solvency or accounting standards, and tax and other legislation and regulations in the jurisdictions in which members of the Group operate.
As a result, the Group’s actual future financial condition, performance and results may differ materially from the plans, goals and expectations set out in the forward-looking statements within the 2015 Annual Report and Accounts.
The Group undertakes no obligation to update any of the forward-looking statements contained within the 2015 Annual Report and Accounts or any other forward-looking statements it may make or publish.
The 2015 Annual Report and Accounts has been prepared for the members of the Company and no one else. The Company, its Directors or agents do not accept or assume responsibility to any other person in connection with this document and any such responsibility or liability is expressly disclaimed.
Nothing in the 2015 Annual Report and Accounts is or should be construed as a profit forecast or estimate.
Phoenix Group Holdings Annual Report and Accounts 2015 225A
dditional information
GLOSSARY
ABS Asset Backed Securities – A collateralised security whose value and income payments are derived from a specified pool of underlying assets
ACSM Alternative Coupon Satisfaction Mechanism – The mechanism under the Tier 1 Notes, under which, if Pearl Group Holdings (No. 1) Limited opts to defer a coupon payment, the deferred coupon payment may only be satisfied through the proceeds of the issue of certain forms of securities, which may be made at any time
ALM Asset Liability Management – Management of mismatches between assets and liabilities within risk appetite
ANNUITY POLICY A policy that pays out regular benefit amounts, either immediately and for the remainder of a policyholder’s lifetime (immediate annuity), or deferred to commence at some future date (deferred annuity)
ASSET MANAGEMENT The management of assets using a structured approach to guide the act of acquiring and disposing of assets, with the objective of meeting defined investment goals and maximising value for investors, including policyholders
BLACK-SCHOLES A mathematical model used to calculate the value of an option
CFO FORUM A high-level discussion group formed of the Chief Financial Officers of major European insurance companies. Its aim is to influence the development of financial reporting and related regulatory developments for insurance companies on behalf of its members
CLOSED LIFE FUND A fund that no longer accepts new business. The fund continues to be managed for the existing policyholders
COC Frictional Cost of Capital – The difference between the market value of shareholder-owned assets backing required capital and the present value of future releases of those assets allowing for future investment returns on that capital, investment expenses and taxes
CNHR Cost of residual non-hedgeable risk – The expected cost of non-hedgeable risks that can have an asymmetric impact on shareholder value to the extent these risks have not already been reflected in the present value of future profits or time value of financial options and guarantees within the MCEV
DPF Discretionary Participation Feature – A contractual right under an insurance contract to receive, as a supplement to guaranteed benefits, additional benefits whose amount or timing is contractually at the discretion of the issuer
EBT Employee Benefit Trust – A trust set up to enable its Trustee to purchase and hold shares to satisfy employee share-based incentive plan awards. The Company’s EBT is the Phoenix Group Holdings Employee Benefit Trust
ECONOMIC ASSUMPTIONS Assumptions related to future interest rates, inflation, market value movements and tax
EEA European Economic Area – Established on 1 January 1994 and is an agreement between Norway, Iceland, Liechtenstein and the European Union. It allows these countries to participate in the EU’s single market without joining the EU
EMBEDDED VALUE The value to equity shareholders of the net assets and expected future profits of a life company
EXPERIENCE VARIANCES Current period differences between the actual experience incurred and the assumptions used in the calculation of MCEV or IFRS insurance liabilities
FINANCIAL LEVERAGE Gross shareholder debt (financial leverage basis) as a percentage of the gross MCEV
FINANCIAL REPORTING COUNCIL
The UK’s independent regulator responsible for promoting high-quality corporate governance and reporting to foster investment
FREE SURPLUS The amount of capital held in life companies in excess of that needed to support their minimum regulatory capital requirement, plus the capital required under the Group’s capital management policy
FCA Financial Conduct Authority – The body responsible for supervising the conduct of all financial services firms and for the prudential regulation of those financial services firms not supervised by the Prudential Regulation Authority (‘PRA’), such as asset managers and independent financial advisers
FOS Financial Ombudsman Service – An ombudsman established in 2000, and given statutory powers in 2001 by the Financial Services and Markets Act 2000, to help settle disputes between consumers and UK-based businesses providing financial services
GAR Guaranteed Annuity Rate – A rate available to certain pension policyholders to acquire an annuity at a contractually guaranteed conversion rate
GEARING Gross shareholder debt (gearing basis) as a percentage of the gross MCEV
GROSS MCEV Gross MCEV is the sum of the Group MCEV and the value of the shareholder and hybrid debt as included in the MCEV
Phoenix Group Holdings Annual Report and Accounts 2015226
GLOSSARYContinued
GROSS SHAREHOLDER DEBT (FINANCIAL LEVERAGE BASIS)
Gross shareholder debt (financial leverage basis) is defined as the sum of the notional face value of shareholder debt and 100% of the face value of the Tier 1 notes
GROSS SHAREHOLDER DEBT (GEARING BASIS)
Gross shareholder debt (gearing basis) is defined as the sum of the IFRS carrying value of shareholder debt (as disclosed in the Borrowings note in the IFRS financial statements) and 50% of the IFRS carrying value of the Tier 1 Notes given the hybrid nature of that instrument
HMRC Her Majesty’s Revenue and Customs
HOLDING COMPANIES Refers to Phoenix Group Holdings, PGH Capital Limited, Phoenix Life Holdings Limited, Pearl Group Holdings (No. 2) Limited, Impala Holdings Limited, Pearl Group Holdings (No. 1) Limited, PGH (TC1) Limited, PGH (TC2) Limited, PGH (MC1) Limited, PGH (MC2) Limited, PGH (LCA) Limited, PGH (LCB) Limited, PGH (LC1) Limited, PGH (LC2) Limited and Pearl Life Holdings Limited
ICA Individual Capital Assessment – A life company’s Pillar 2 assessment of its capital requirements to ensure that assets exceed liabilities 99.5% of the time over a 1 year period or (in other words) to be able to withstand a 1 in 200 year event
IFRS International Financial Reporting Standards – Accounting standards, interpretations and the framework adopted by the International Accounting Standards Board
IGD Insurance Groups Directive – The European Directive setting out the current capital adequacy regime for insurance groups as implemented by the PRA
IMC Investment Management Contract – A contract between an investor and an investment manager
INCREMENTAL EMBEDDED VALUE
Enhancement of MCEV through management actions
IN-FORCE Long-term business written before the period end and which has not terminated before the period end
INHERITED ESTATE The assets of the long-term with-profit funds less the realistic reserves for non-profit policies written into the non-profit fund, less asset shares aggregated across the with-profit policies and any additional amounts expected at the valuation date to be paid to in-force policyholders in the future in respect of smoothing costs and guarantees
LIBOR London Interbank Offer Rate – The average interbank interest rate at which a selection of banks on the London money market are prepared to lend to one another
LSE London Stock Exchange
LTIP Long-Term Incentive Plan – The part of an executive’s remuneration designed to incentivise long-term value for shareholders through an award of shares with vesting contingent on employment and the satisfaction of stretching performance conditions linked to Group strategy
MCEV Market Consistent Embedded Value – A measure of the consolidated value of shareholders’ interests calculated using the Group’s MCEV methodology as described in the Basis of preparation section of the MCEV supplementary information
MSA Management Services Agreement – Contracts that exist between Phoenix Life and management services companies or between management services companies and their outsource partners
NET SHAREHOLDER DEBT Shareholder debt (including the Tier 1 Notes) less holding company cash and cash equivalents
NON-ECONOMIC ASSUMPTIONS
Assumptions related to future levels of mortality, morbidity, persistency and expenses
NON-PROFIT FUND A fund which is not a with-profit fund, where risks and rewards of the fund fall wholly to shareholders
OPEN ENDED INVESTMENT COMPANIES
A type of company or a fund in the UK that is structured to invest in other companies with the ability to adjust its investment criteria and fund size
OPERATING COMPANIES Refers to the trading companies within Phoenix Life (which includes Opal Reassurance Limited)
ORIGO An electronic pensions transfer system
PART VII TRANSFER The transfer of insurance policies under Part VII of FSMA 2000. The insurers involved can be in the same corporate group or in different groups. Transfers require the consent of the High Court, which will consider the views of the PRA and FCA and of an Independent Expert
PARTICIPATING BUSINESS See with-profit fund
PERIPHERAL EUROZONE Refers to Portugal, Ireland, Italy, Greece and Spain

Phoenix Group Holdings Annual Report and Accounts 2015 227A
dditional information
PIK Payment-in-kind – Interest on a bond is paid other than in cash, most commonly by increasing the principal
PILLAR 1 EU-directive-based capital requirements as implemented by the PRA for insurance companies. The Pillar 1 surplus is the excess of available capital resources over the regulatory capital resource requirements
PILLAR 2 The PRA’s Pillar 2 risk-based capital requirements for insurance companies that have been implemented in the UK. The Pillar 2 surplus is the excess of available capital resources over capital calculated on an economic basis required to ensure entities can meet their liabilities. It is based on a self-assessment methodology called the ICA (‘Individual Capital Assessment’)
PLHL ICA PLHL ICA is an assessment, on an economic basis, of the capital resources and requirements arising from the obligations and risks which exist outside the Group’s life companies
PPFM Principles and Practices of Financial Management – A publicly available document which explains how a company’s with-profit business is run. As part of demonstrating that customers are treated fairly, the Board certifies that the PPFM has been complied with
PRA Prudential Regulation Authority – The body responsible for the prudential regulation and supervision of banks, building societies, credit unions, insurers and major investment firms. The PRA and FCA use a Memorandum of Understanding to co-ordinate and carry out their respective responsibilities
PROTECTION POLICY A policy which provides benefits payable on certain events. The benefits may be a single lump sum or a series of payments and may be payable on death, serious illness or sickness
PVFP Present Value of Future Profits – The present value of profits attributable to shareholders arising from the relevant in-force business
SOLVENCY II A new regime for the prudential regulation of European insurance companies that came into force on 1 January 2016
TIER 1 NOTES £500 million Perpetual Reset Capital Securities issued by Pearl Group Holdings (No. 1) Limited. In January 2015, the Group announced the exchange of 99% of the Group’s Tier 1 notes for £428 million of new subordinated notes
TSR Total Shareholder Return – The total return, over a fixed period, to an investor in terms of share price growth and dividends (assuming that dividends paid are re-invested, on the ex-dividend date, in acquiring further shares)
UK CORPORATE GOVERNANCE CODE
Standards of good corporate governance practice in the UK relating to issues such as board composition and development, remuneration, accountability, audit and relations with shareholders
UKCPT UK Commercial Property Trust Limited – A property subsidiary of the Group which is domiciled in Guernsey and listed on the London Stock Exchange
UK GAAP Generally Accepted Accounting Principles adopted within the UK
UNIT-LINKED POLICY A policy where the benefits are determined by the investment performance of the underlying assets in the unit-linked fund
VIF The Value of In-Force business in the MCEV – The Present Value of Future Profits (‘PVFP’) plus the Time Value of Financial Options and Guarantees (‘TVFOG’) less the Frictional Cost of Required Capital (‘COC’)
WITH-PROFIT FUND A fund where policyholders are entitled to a share of the profits of the fund. Normally, policyholders receive their share of the profits through bonuses. Also known as a participating fund as policyholders have a participating interest in the with-profit funds and any declared bonuses. Generally, policyholder and shareholder participation in the with-profit funds in the UK is split 90:10
WPICC With-Profit Insurance Capital Component – The WPICC is the amount by which the regulatory surplus exceeds the realistic surplus for with-profit funds

Our highly focused area of specialisation allows us to recruit the very best and most experienced individuals in the field, particularly in niche areas such as with-profit funds.
F O C U S

PAPER INFORMATION Printed by Park Communications on FSC® certified paper. Park is an EMAS certified company and its Environmental Management System is certified to ISO 14001. 100% of the inks used are vegetable oil based, 95% of press chemicals are recycled for further use and, on average 99% of any waste associated with this production will be recycled. This document is printed on Edixion Offset, a paper containing 100% Environmental Chlorine Free (ECF) virgin fibre sourced from well managed, responsible, FSC® certified forests.
Design and production Radley Yeldar
Online resources
REDUCING OUR ENVIRONMENTAL IMPACTIn line with our Corporate Responsibility programme, and as part of our desire to reduce our environmental impact, you can view key information on our website.
INVESTOR RELATIONSOur Investor Relations section includes information such as our most recent news and announcements, results presentations, annual and interim reports, share-price performance, AGM and EGM information, UK Regulatory Returns and contact information.
NEWS AND UPDATESTo stay up-to-date with Phoenix Group news and other changes to our site’s content, you can sign up for email alerts, which will notify you when content is added.
Go onlinewww.thephoenixgroup.com
Go onlinewww.thephoenixgroup.com/investor‑relations
To sign up visitwww.thephoenixgroup.com/site‑services/email‑alerts.aspx

T R U S T
Millions of customers trust Phoenix to manage their funds effectively and communicate clearly and honestly with them. To honour this trust, we have created a wide‑ranging programme to solicit and respond to policyholders’ views.
Phoenix Group Holdings
Registered addressPhoenix Group Holdings PO Box 309 Ugland House Grand Cayman KY1-1104 Cayman IslandsCayman Islands Registrar of Companies Number 202172
Principal place of businessPhoenix Group Holdings 1st Floor 32 Commercial Street St Helier JE2 3RU Jersey
PHO
ENIX
GRO
UP H
OLD
ING
S ANN
UAL REPORT AN
D ACC
OU
NTS 2015
Related Documents


