Half Year Results 27 August 2010

Welcome message from author
This document is posted to help you gain knowledge. Please leave a comment to let me know what you think about it! Share it to your friends and learn new things together.
Transcript
Half Year Results
27 August 2010
2
• Introduction - Ron Sandler, Chairman
• Business review - Jonathan Moss, Group Chief Executive
• Financial results - Jonathan Yates, Group Finance Director
• Summary - Jonathan Moss
• Q&A
Agenda

IntroductionRon Sandler
Business review Jonathan Moss

5
Life companies
UK Holding Companies
Corporate costsPension scheme contributionsDebt service and amortisation
Phoenix Group Holdings
Dividends
• IGD surplus £1.3bn• £326m cash to UK Holding
Companies
£335m cash inflows
A simple business model
Ignis Asset Management
• £68.6bn AuM• £22m operating profit• £9m cash to Holding
Companies
Management Services
• Services 6.5m policyholders• £7m operating profit
Note: All amounts reflect HY 10 results

6
Objective - to be the consolidator of choice
• Maximise business performance &
value
• Maintain a robust & scaleable
platform
• Efficient capital usage & cash
release
• Optimise asset management
• Satisfied policyholders
• Lead consolidation of closed life
sector
• Simplify and optimise capital
structure
• Strong capital policies to ensure
safe release of capital
• Targets to increase EV and
accelerate cash inflows through
management actions
• Grow Ignis AuM
• Good customer service and
prompt payment of benefits
• Explore complementary M&A
opportunities
Key strategic goals Group priorities
Transparent reporting of performance against targets
7
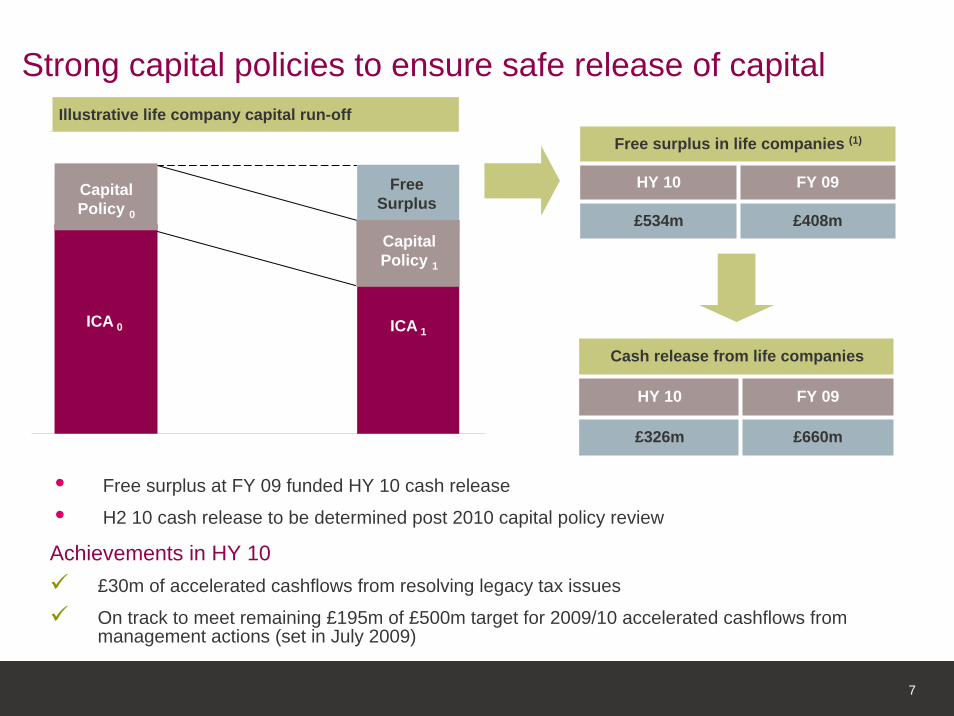
Strong capital policies to ensure safe release of capital
£155m
ICA 0
Capital Policy 0
ICA 1
Capital Policy 1
Free Surplus
Illustrative life company capital run-off
Free surplus in life companies (1)
HY 10 FY 09
£534m £408m
Cash release from life companies
£660m£326m
FY 09HY 10
Achievements in HY 10£30m of accelerated cashflows from resolving legacy tax issues
On track to meet remaining £195m of £500m target for 2009/10 accelerated cashflows from management actions (set in July 2009)
• Free surplus at FY 09 funded HY 10 cash release
• H2 10 cash release to be determined post 2010 capital policy review
8
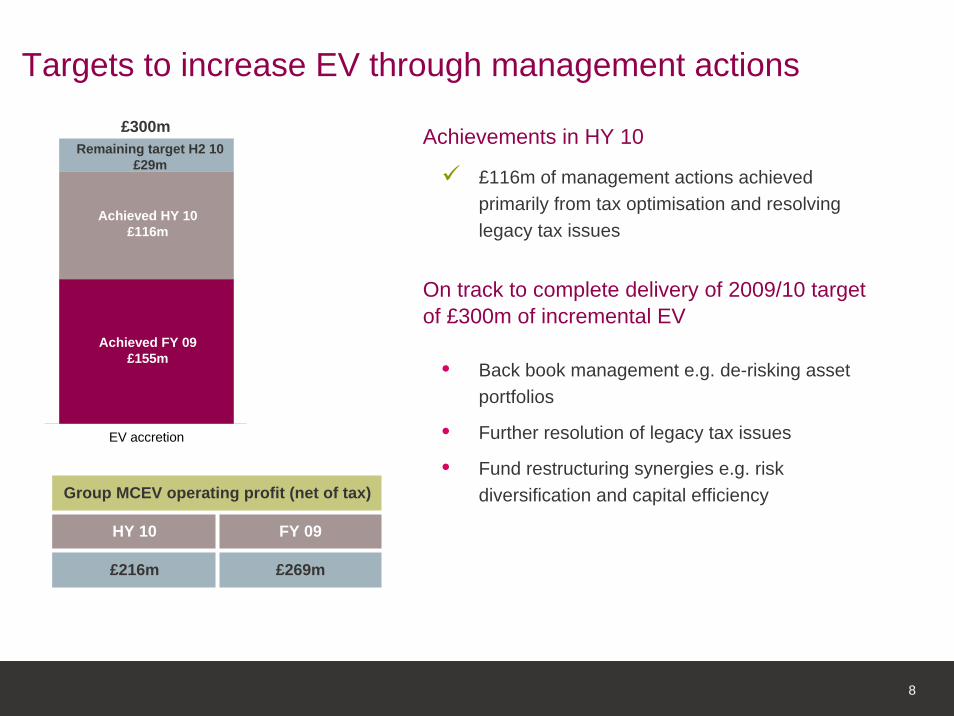
Achievements in HY 10
£116m of management actions achieved primarily from tax optimisation and resolving legacy tax issues
On track to complete delivery of 2009/10 target of £300m of incremental EV
• Back book management e.g. de-risking asset portfolios
• Further resolution of legacy tax issues
• Fund restructuring synergies e.g. risk diversification and capital efficiency
Targets to increase EV through management actions
Group MCEV operating profit (net of tax)
HY 10 FY 09
£216m £269m
Achieved FY 09£155m
Achieved HY 10£116m
Remaining target H2 10£29m
£300m
EV accretion
9
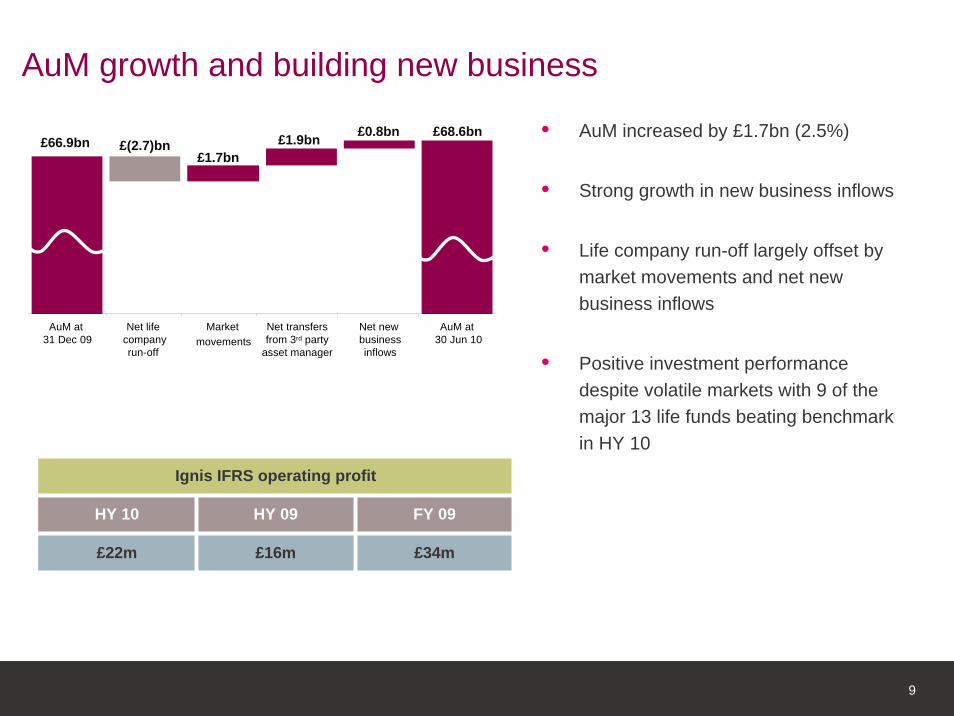
AuM growth and building new business
• AuM increased by £1.7bn (2.5%)
• Strong growth in new business inflows
• Life company run-off largely offset by market movements and net new business inflows
• Positive investment performance despite volatile markets with 9 of the major 13 life funds beating benchmark in HY 10
AuM at 31 Dec 09
Net lifecompanyrun-off
Marketmovements
Net transfersfrom 3rd party
asset manager
Net newbusinessinflows
AuM at 30 Jun 10
£66.9bn £(2.7)bn£1.7bn
£1.9bn £0.8bn £68.6bn
Ignis IFRS operating profit
HY 10 HY 09
£16m
FY 09
£22m £34m

10
Notes:
Cash flows are undiscounted
Only £75m of management actions included for 2011. No management actions assumed beyond 2011
(1) Includes VIF of Ignis and management services companies
£1.6bn
Emergence of surplus
£1.1bn
Release of capital
£1.0bn
Management actions£0.3bn
Other (1)
£0.3bn
£2.7bn
2010 - 2014 (targeted) 2015 - 2019 (targeted)
• Projected cash inflows highly predictable
• 5 year target of £2.7bn cash inflows
– £335m achieved in HY 10
– £400 to £500m target for BAU cash inflows (£305m in HY 10)
– £225m management actions accelerating cash inflow in 2010 (£30m in HY 10)
– On track to meet 2009/10 cash acceleration targets (set in July 2009)
• Performance to be tracked against targets
• Link provided between IFRS profit, capital and cash flow
Transparent reporting of performance against targets
Holding companies cash inflows

11
Achieved in HY 10 Ongoing
Fund mergers
Relocation
Solvency II
PhoenixLife
Ignis
Corporate
Outsourcers
Capability
Fund rationalisation
Build 3rd party business
Capital structure
Listing
• PALAL and PLL restructuringNational Provident Life restructure
Relocated majority of accounting, tax and strategy/planning functions to Wythall
Completed pre-application process for internal model approval by FSA
Initial phase of outsourcer rationalisation nearing completion
• Migrate further policies onto new integrated platform
Strengthened management team • Embed new MI focusing the investment teams on out-performance
£7bn of assets transferred to collectives
£0.8bn of net new 3rd party business
• All remaining departments (largely actuarial) to move to Wythall by Q1 2011
Reduced dilutive instruments to < 20%Restructured Tier 1 bonds
• Submit QIS 5 results by end Oct for solo entities and end Nov for groups
• Transfer further £10bn in H2 10
Premium Listing on LSE on 5 July 2010
• Continue the build out of institutional and European distribution platforms
• Discussions with lenders
• Expected inclusion in FTSE 250 index
Update on specific group milestones

Financial resultsJonathan Yates

13
£m unless otherwise stated HY 10 FY 09
Holding companies cash inflows 335 716
Market Consistent Embedded Value (“MCEV”) 1,962 1,827
IGD capital surplus 1.3bn 1.2bn
Group IFRS operating profit 176 457
Ignis IFRS operating profit 22 34
Assets under Management 68.6bn 66.9bn
MCEV per share (1) £11.90 £11.08
Dividend per share in respect of period £0.21 £0.15 (2)
Note: For comparative purposes, FY 09 information includes the Pearl businesses from 1 January 2009(1) Based on post Premium Listing shares in issue of 164,862,855(2) FY 09 dividend paid in respect of 4 month period post Liberty acquisition (€0.17 converted to £ at 15 April 2010)
HY financial highlights

14
• On track to deliver recurring cash inflows from operating subsidiaries at top end of £400m to £500m annual target
• Total cash receipts of £335m include £30m of cash accelerated through management actions
• £49m of debt interest and £22m debt prepayment made in HY 10
• Non recurring cash outflows include IT, business transformation costs and listing costs
£m HY 10 FY 09
Opening cash 202 86
Cash inflows from management services - 35
Cash receipts
Uses of cash
Total uses of cash 195 600
Closing cash 342 202
660
21
716
60
102
-
162
438
Cash inflows from life companies 326
Cash inflows from Ignis 9
Total Recurring cash outflows 136
Total Non Recurring cash outflows 59
Total cash receipts 335
Recurring cash outflows
Operating expenses and pension contributions 18
Debt service and Tier 1 coupon 98
External dividend 20
Strong holding companies cash inflows
15
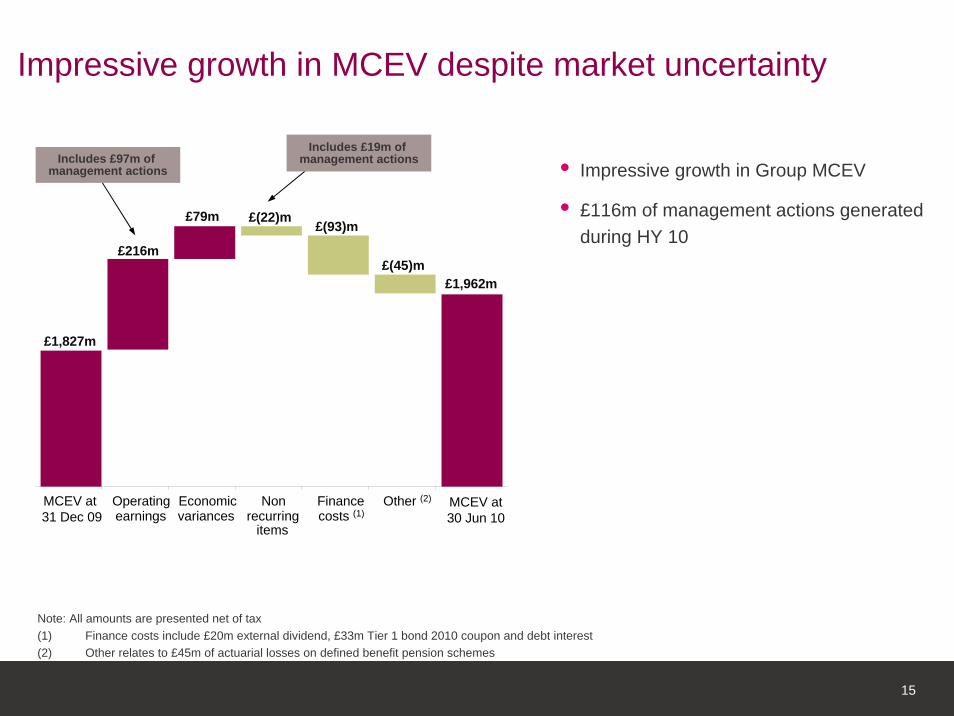
• Impressive growth in Group MCEV
• £116m of management actions generated during HY 10
Impressive growth in MCEV despite market uncertainty
Note: All amounts are presented net of tax(1) Finance costs include £20m external dividend, £33m Tier 1 bond 2010 coupon and debt interest(2) Other relates to £45m of actuarial losses on defined benefit pension schemes
£1,827m
£216m
£79m £(22)m£(93)m
£(45)m£1,962m
MCEV at 31 Dec 09
Operatingearnings
Economicvariances
Nonrecurring
items
Financecosts (1)
Other (2) MCEV at30 Jun 10
Includes £97m of management actions
Includes £19m of management actions

16
£1.2bn£1.3bn
£(0.1)bn£0.2bn • IGD surplus represents coverage of 135%
• 25% of Impala sub-group (currently not included due to holding company structure) would contribute an additional £0.2bn to the IGD surplus
Robust IGD surplus
IGD Surplus at 31 Dec 09
Capital generation
Dividend payments and debt financing
costs
IGD Surplusat 30 Jun 10

17
£bn
1.3
1.3
1.3
1.3
75 bps increase in yields 1.3 135%
1.2
1.1
75 bps decrease in yields 133%
Margin
IGD surplus at 30 Jun 10 135%
20% fall in equity markets 144%
15% fall in property values 136%
Credit spread widening (1) 134%
Combined stress (25% equity fall, 20% property fall, yields up 75bps and credit spreads widening (1)) 145%
IGD relatively insensitive
(1) 10 year term: AAA - 48bps, AA - 77bps, A - 108bps, BBB - 162bps
18
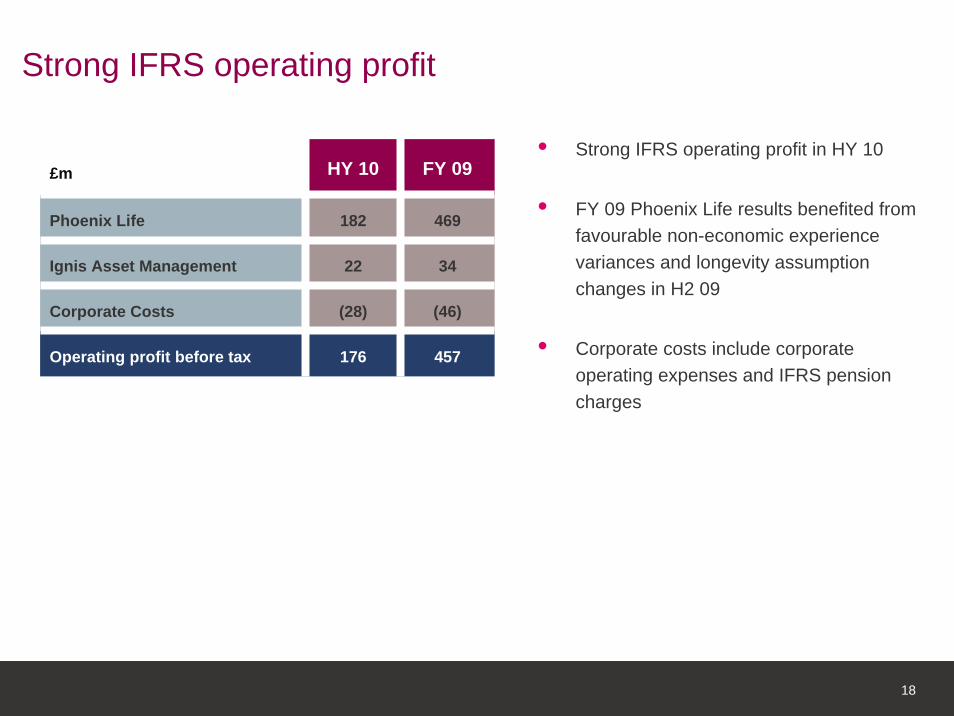
£m HY 10 FY 09
Phoenix Life 182
22
(28)
176
34
Corporate Costs (46)
Operating profit before tax
469
457
Ignis Asset Management
• Strong IFRS operating profit in HY 10
• FY 09 Phoenix Life results benefited from favourable non-economic experience variances and longevity assumption changes in H2 09
• Corporate costs include corporate operating expenses and IFRS pension charges
Strong IFRS operating profit

19
• Favourable long term business investment return variances of £128m driven by short equity positions, improvements in property, reduced credit spreads and strong hedge fund returns
• £28m of owners’ fund variances due to positive returns on interest rate swaps, private equity and hedge funds
• Non-recurring items partly offset by the reversal of 2009 charge in respect of the PALAL guaranteed annuity option compromise scheme
Non-recurring items
Amortisation of acquired in-force business and other intangibles
Variance on owners’ funds
Investment return variances and economic assumption changes on long term business
Operating profit before adjusting items
£m
28
128
(19)
(73)
176
HY 10
Profit for the period attributable to owners (1)
Tax attributable to owners
Profit before tax attributable to owners
Finance costs attributable to owners (60)
180
207
27
Reconciling operating profit to profit after tax
(1) Includes £28m attributable to non-controlling interests
20
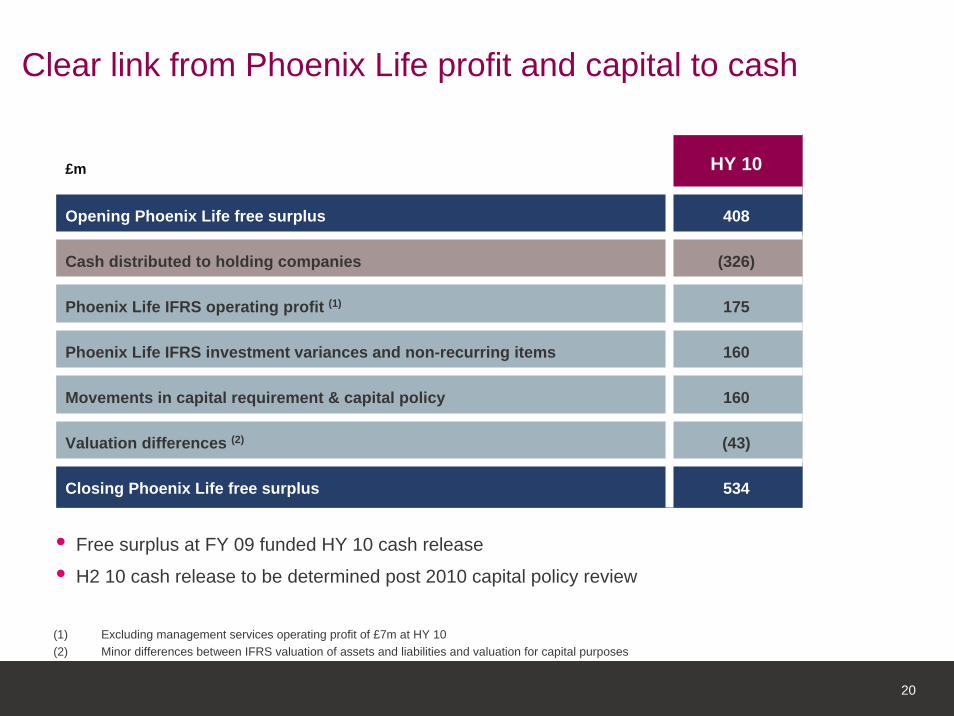
£m HY 10
Opening Phoenix Life free surplus 408
Cash distributed to holding companies (326)
175
160
160
Valuation differences (2) (43)
Closing Phoenix Life free surplus 534
Movements in capital requirement & capital policy
Phoenix Life IFRS operating profit (1)
Phoenix Life IFRS investment variances and non-recurring items
Clear link from Phoenix Life profit and capital to cash
(1) Excluding management services operating profit of £7m at HY 10(2) Minor differences between IFRS valuation of assets and liabilities and valuation for capital purposes
• Free surplus at FY 09 funded HY 10 cash release
• H2 10 cash release to be determined post 2010 capital policy review

21
Note: “n/m” represents not meaningful(1) Based on FSA return Form 13(2) Annualised(3) Split of non-profit operating profit and assets is illustrative
Phoenix Life - IFRS operating profit drivers
£m unless otherwise stated HY 10 FY 09
Fund type How profits are generated IFRS op profit
Average assets (1) Net Margin (2) IFRS op
profitAverage assets (1) Net Margin
With profit (internal capital support)
Return on with profit funds which are supported with capital from shareholder funds
- 12.4bn n/m 20 14.5bn n/m
Unit linked (3) Margin earned on unit linked business 45 12.0bn 75bps 79 12.5bn 63bps
Annuities (3) Spread earned on annuities 38 10.6bn 72bps 186 10.0bn 185bps (4)
Protection and other non-profit (3)
Investment return and release of margins 44 1.5bn n/m 66 1.5bn n/m
Shareholder funds Return earned on shareholder fund assets 21 1.7bn 247bps 55 1.7bn 318bps (5)
30.0bn 18bps 49
n/a 14
469
27 29.6bn
Management services
Return generated from administering policies 7 n/a
Total Phoenix Life IFRS operating profit 182
With profitOur share of bonuses paid to policyholders of with profit business
17bps
(4) FY 09 margin benefited from favourable non-economic experience variances and longevity assumption changes
(5) FY 09 margin benefited from higher returns on cash balances

22
(1) Margin calculation annualised and based on average AuM over period
Ignis - IFRS operating profit driversHY 10 FY 09
£m unless otherwise statedIFRS
resultsClosing
AuM Margin (1) IFRS results
Closing AuM Margin (1)
Retail 8 2.0bn 74bps 14 2.0bn 74bps
Institutional and international 7 4.6bn 31bps 15 4.8bn 31bps
Life funds 48 62.0bn 15bps 81 60.1bn 14bps
Other income 1 1
Total revenue/AuM 64 68.6bn 111 66.9bn
Staff costs (27) (49)
Total Ignis IFRS operating profit 22 34
(28)
31%
(15)
Operating profit margin 34%
Other operating expenses

SummaryJonathan Moss

24
• Establish group within London market and FTSE 250 index • Simplification and restructuring of banking arrangements• Increase capital efficiency and cashflow acceleration• Increase value through management actions in Phoenix Life and driving
performance in Ignis• Pursue value adding M&A in due course
• Simple link from profit and capital to cash • Strong performance in uncertain markets • Clear strategy and focus on delivery• Significant progress towards our strategic goals
Well positioned for the future
Clear group agenda for shareholder value

Q&A
The specialist closed life consolidator
Appendices
I Cash flow sensitivity analysis
II MCEV sensitivity analysis
III Shareholder fund asset mix at 30 June 2010
IV Analysis of shareholder fund debt securities
V Ignis new business flows
VI Current capitalisation
VII Summary of bank facilities
27
£bn
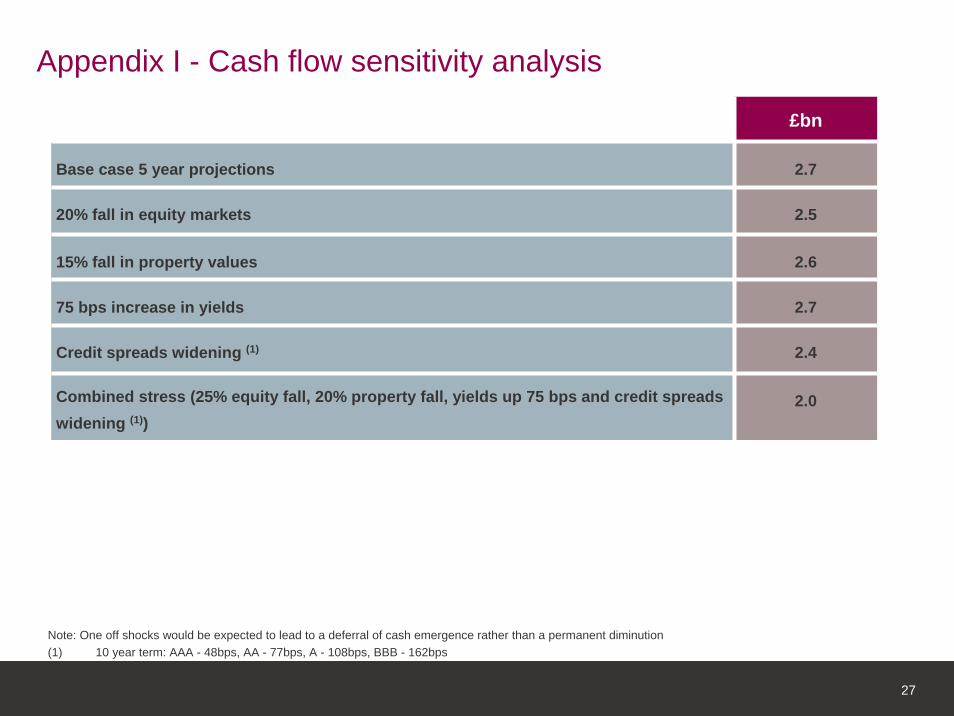
Base case 5 year projections 2.7
20% fall in equity markets 2.5
15% fall in property values 2.6
75 bps increase in yields 2.7
Credit spreads widening (1) 2.4
Combined stress (25% equity fall, 20% property fall, yields up 75 bps and credit spreads widening (1))
2.0
Appendix I - Cash flow sensitivity analysis
Note: One off shocks would be expected to lead to a deferral of cash emergence rather than a permanent diminution(1) 10 year term: AAA - 48bps, AA - 77bps, A - 108bps, BBB - 162bps

28
£m
Base case covered business MCEV at 30 Jun 10 4,465
1% decrease in risk free rates 188
1% increase in risk free rates (230)
10% decrease in equity/property market values (148)
100 bps increase in credit spreads (311)
25% increase in equity/property implied volatilities (31)
25% increase in swaption implied volatilities (33)
10% decrease in lapse rates and paid up rates (19)
5% decrease in non-annuitant mortality 21
Required capital equal to minimum regulatory capital 67
5% decrease in annuitant mortality (171)
Swap curve as reference rate, retaining appropriate liquidity premiums (312)
Appendix II - MCEV sensitivity analysis
29
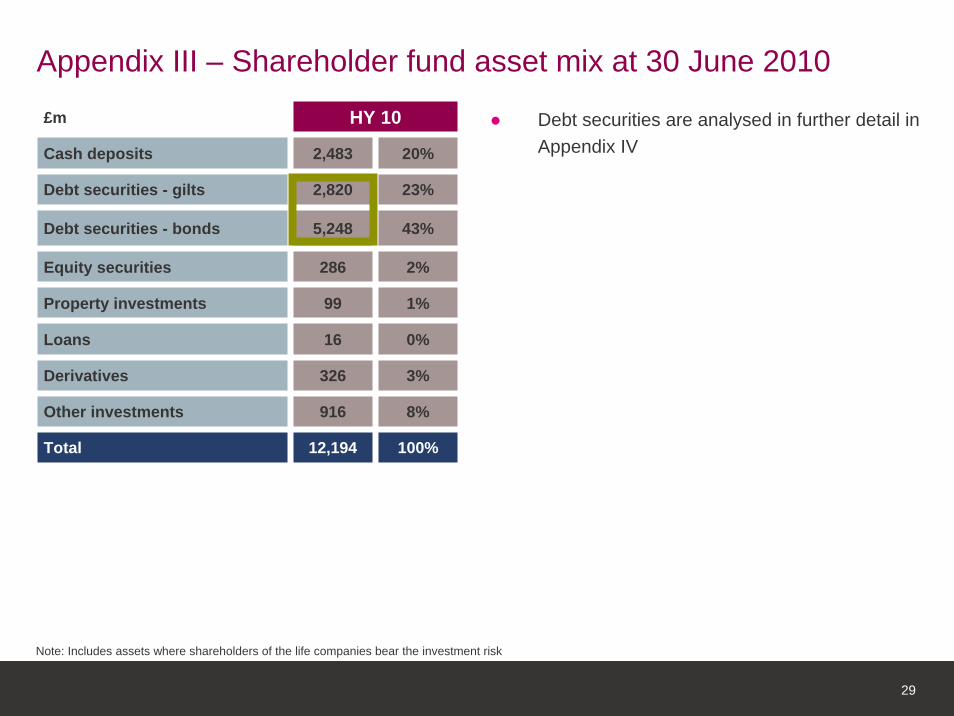
£m HY 10
Loans 16 0%
Derivatives 326 3%
Cash deposits 2,483 20%
Debt securities - gilts 2,820 23%
Debt securities - bonds 5,248 43%
Equity securities 286 2%
Property investments 99 1%
Other investments 916 8%
Total 12,194 100%
Appendix III – Shareholder fund asset mix at 30 June 2010
● Debt securities are analysed in further detail in Appendix IV
Note: Includes assets where shareholders of the life companies bear the investment risk
30
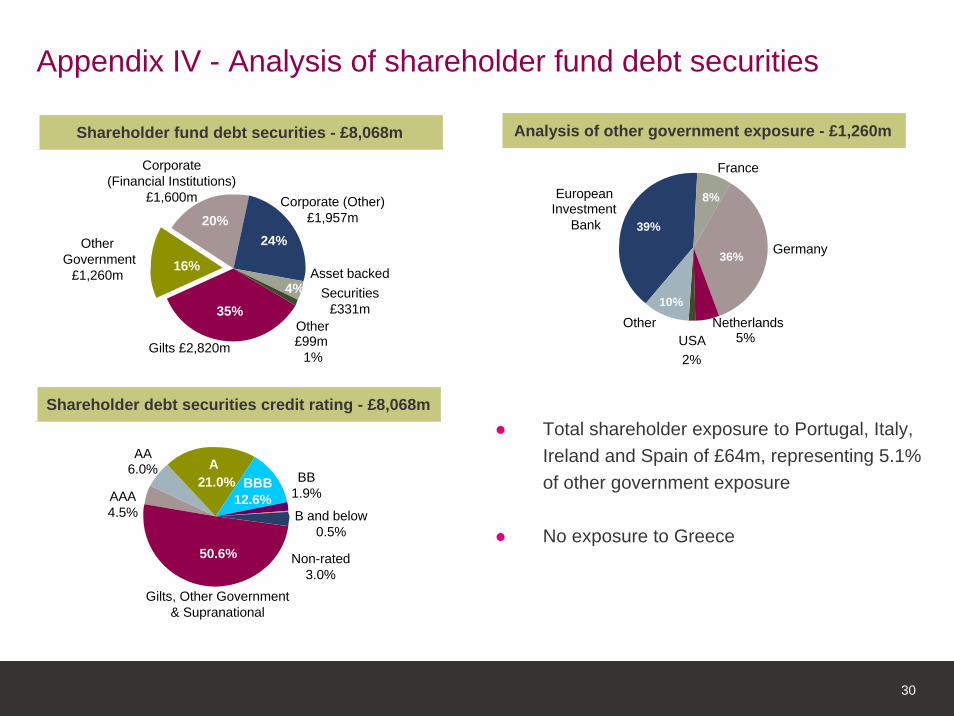
Appendix IV - Analysis of shareholder fund debt securities
Gilts £2,820m
35%
Other Government
£1,260m 16%
Corporate (Financial Institutions)
£1,600m
20%Corporate (Other)
£1,957m
24%
Asset backed Securities
£331m4%
Other£99m
1%
Shareholder fund debt securities - £8,068m
European Investment
Bank 39%
France
8%
Germany36%
Netherlands5%USA
2%
Other10%
Analysis of other government exposure - £1,260m
● Total shareholder exposure to Portugal, Italy, Ireland and Spain of £64m, representing 5.1% of other government exposure
● No exposure to Greece
AAA4.5%
AA6.0%
Gilts, Other Government& Supranational
A21.0% BBB
12.6%
Non-rated3.0%
BB 1.9%
Shareholder debt securities credit rating - £8,068m
B and below 0.5%
50.6%

31
23619413Liquidity funds (net)
(2)
19
(18)
56
(59)
466
67
137
243
HY 09
406
236
24
(35)
181
856
93
89
438
H2 09
121International
88Institutional
221Institutional
503Retail
Gross flows
775
413
153
1,327
190
HY 10
Retail
£m
International
Total
Net flows
Liquidity funds
Total
Appendix V - Ignis new business flows

32
(1) Outstanding contingent rights are only exercisable in the event of a takeover(2) Excludes shares authorised for issue under employee incentive plans
Appendix VI - Current capitalisation
Sept 09 Jan 10 Jul 10
Warrants 58.8m 25.5m 25.5m
Total dilutive instruments (2) 94.8m 61.5m 29.1m
Total ordinary shares in issue 126.2m 132.3m 164.9m
Contingent rights over shares (1) 36.0m 36.0m
Warrant exchanges Premium listing on LSE
3.6m
Dilutive instruments as % of total share capital
Acquisition of Pearl Businesses
75.1% 46.5% 17.7%

33
£m Margin (1) Maturity Repayment
Bank facility 425.0 (2) L+125bps cash 2016 £25m p.a. 2011-2015Balance in 2016
Lender loan notes 75.0 L+100bps cash or PIK 2024 Non-amortising
Total Pearl bank debt 500.0
Facility A 1,253.0 L+100bps cash+ 100bps cash or PIK (3) 2014 £125m p.a. from 2011
Balance in 2014
Facility B 492.5 L+125bps cash+ 75bps cash or PIK (4) 2015 Non-amortising
Facility C 492.5 L+175bps cash+ 25bps cash or PIK (5) 2016 Non-amortising
Total Impala bank debt 2,238.0
Note: “L” represents LIBOR, “bps” represents basis points, “PIK” represents payment in kind whereby the borrower has the option to add, prior to the third anniversary of the closing date for the Impala Bank Debt facilities and for the full maturity of the Lender Loan Notes, any unpaid interest amount to the principal amount outstanding of the relevant tranche
(1) In addition to interest rate margin figures shown, mandatory costs (if any) will be payable to compensate the lenders for the costs of compliance with the requirements of the Bank of England, the FSA and/or the European Central Bank
(2) Senior in right of payment to the Lender Loan Notes(3) From and after the fourth anniversary of the closing date of the acquisition of the Pearl businesses by Pearl Group, Facility A will bear interest of L+250bps(4) From and after the fourth anniversary of the closing date of the acquisition of the Pearl businesses by Pearl Group, Facility B will bear interest of L+325bps(5) From and after the fourth anniversary of the closing date of the acquisition of the Pearl businesses by Pearl Group, Facility C will bear interest of L+375bps
Appendix VII - Summary of bank facilities

34
Disclaimer
This presentation in relation to Phoenix Group Holdings and its subsidiaries (the “Group”) contains forward looking statements concerning future events. Those forward looking statements are based on the current information and assumptions of the Group’s management concerning known and unknown risks and uncertainties. Forward looking statements do not relate to definite facts and are subject to risks and uncertainty. The actual results and financial condition of the Group may differ considerably as a result of risks and uncertainties relating to events and circumstances beyond the Group’s control. This includes, amongst other things, domestic and global economic and business conditions, market related risks such as fluctuations in interest rates and exchange rates, and the performance of financial markets generally; the policies and actions of regulatory authorities, the impact of competition, inflation, and deflation; experience in particular with regard to mortality and morbidity trends, and lapse rates; the timing, impact and other uncertainties of future acquisitions or combinations within relevant industries; and the impact of changes in capital, solvency or accounting standards, and tax and other legislation and regulations in the jurisdictions in which members of the Group operate. The Group cautions that expectations are only valid on the specified dates and accepts no responsibility for the revision or updating of any information contained in this presentation.
Any references to IGD Group, IGD sensitivities, or IGD relate to the relevant calculation for Phoenix Life Holdings Limited, the ultimate EEA Insurance parent undertaking as at 30 June 2010.
For comparative purposes, FY 09 information includes the Pearl businesses from 1 January 2009, although the acquisition date for accounting purposes was 28 August 2009.
Related Documents