Nutritional status and dietary intakes of children aged 6 months to 12 years: findings of the Nutrition Survey of Malaysian Children (SEANUTS Malaysia) Bee Koon Poh 1 *, Boon Koon Ng 1 , Mohd Din Siti Haslinda 2 , Safii Nik Shanita 3 , Jyh Eiin Wong 1 , Siti Balkis Budin 4 , Abd Talib Ruzita 1 , Lai Oon Ng 5 , Ilse Khouw 6 and A. Karim Norimah 1 1 Nutritional Sciences Programme, Faculty of Health Sciences, School of Healthcare Sciences, Universiti Kebangsaan Malaysia, 50300 Kuala Lumpur, Malaysia 2 Department of Statistics, Putrajaya, Malaysia 3 Dietetics Programme, Faculty of Health Sciences, School of Healthcare Sciences, Universiti Kebangsaan Malaysia, Kuala Lumpur, Malaysia 4 Biomedical Sciences Programme, Faculty of Health Sciences, School of Diagnostics and Applied Health, Universiti Kebangsaan Malaysia, Kuala Lumpur, Malaysia 5 Health Psychology Programme, Faculty of Health Sciences, Universiti Kebangsaan Malaysia, Kuala Lumpur, Malaysia 6 FrieslandCampina, Amersfoort, The Netherlands (Submitted 18 September 2012 – Final revision received 13 February 2013 – Accepted 14 March 2013) Abstract The dual burden of malnutrition reportedly coexists in Malaysia; however, existing data are scarce and do not adequately represent the nutritional status of Malaysian children. The Nutrition Survey of Malaysian Children was carried out with the aim of assessing the nutritional status in a sample of nationally representative population of children aged 6 months to 12 years. A total of 3542 children were recruited using a stratified random sampling method. Anthropometric measurements included weight, height, mid-upper arm circumference, and waist and hip circumferences. Blood biochemical assessment involved analyses of Hb, serum ferritin, and vitamins A and D. Dietary intake was assessed using semi-quantitative FFQ, and nutrient intakes were compared with the Malaysian Recommended Nutrient Intakes (RNI). The prevalence of overweight (9·8 %) and obesity (11·8 %) was higher than that of thinness (5·4 %) and stunting (8·4 %). Only a small proportion of children had low levels of Hb (6·6 %), serum ferritin (4·4 %) and vitamin A (4·4 %), but almost half the children (47·5 %) had vitamin D insufficiency. Dietary intake of the children was not compatible with the recommendations, where more than one-third did not achieve the Malaysian RNI for energy, Ca and vitamin D. The present study revealed that overnutrition was more prevalent than undernutrition. The presence of high prevalence of vitamin D insufficiency and the inadequate intake of Ca and vitamin D are of concern. Hence, strategies for improving the nutritional status of Malaysian children need to consider both sides of malnutrition and also put emphasis on approaches for the prevention of overweight and obesity as well as vitamin D insufficiency. Key words: Children’s nutritional status: Blood biochemistry: Dietary intakes: Double burden of malnutrition Global transitions in economic development and sociodemo- graphy have resulted in dietary and lifestyle changes (1) , which in turn have implications for nutritional and health status of children around the world (2,3) . In many developing countries, including in Malaysia, it is known that the dual burden of malnutrition coexists (4–6) , sometimes within the same family (7) . The World Health Statistics has reported that the percentage of underweight children aged , 5 years declined globally from 25% in 1990 to 18% in 2005 (8) , while the prevalence of overweight in the same age group averaged at 6·7 % (9) . Globally, one-third of pre-schoolers suffered from vitamin A deficiency in 1995–2005, with 45·5 % of the prevalence being observed in Southeast Asia (10) . The problem of anaemia among Southeast Asian pre-school children was severe at 65·5 % (11) . More recently, vitamin D has also been recognised as a global problem (12) , with a large proportion of children reported among children worldwide, including in sun-rich countries (13–16) . Data from the National Health and Morbidity Survey (NHMS) III has revealed that the prevalences of stunting, underweight and overweight among children aged , 5 years are 17·2, 12·9 and 6·4 %, respectively, in Malaysia (17) . Another follow-up survey has reported that the prevalence of * Corresponding author: Dr B. K. Poh, fax þ60 3 2694 7621, email [email protected] Abbreviations: NHMS, National Health and Morbidity Survey; RNI, Recommended Nutrient Intakes; SEANUTS, South East Asian Nutrition Survey. British Journal of Nutrition (2013), 110, S21–S35 doi:10.1017/S0007114513002092 q The Authors 2013 British Journal of Nutrition

Welcome message from author
This document is posted to help you gain knowledge. Please leave a comment to let me know what you think about it! Share it to your friends and learn new things together.
Transcript

Nutritional status and dietary intakes of children aged 6 months to 12 years:findings of the Nutrition Survey of Malaysian Children (SEANUTS Malaysia)
Bee Koon Poh1*, Boon Koon Ng1, Mohd Din Siti Haslinda2, Safii Nik Shanita3, Jyh Eiin Wong1,Siti Balkis Budin4, Abd Talib Ruzita1, Lai Oon Ng5, Ilse Khouw6 and A. Karim Norimah1
1Nutritional Sciences Programme, Faculty of Health Sciences, School of Healthcare Sciences, Universiti Kebangsaan
Malaysia, 50300 Kuala Lumpur, Malaysia2Department of Statistics, Putrajaya, Malaysia3Dietetics Programme, Faculty of Health Sciences, School of Healthcare Sciences, Universiti Kebangsaan Malaysia,
Kuala Lumpur, Malaysia4Biomedical Sciences Programme, Faculty of Health Sciences, School of Diagnostics and Applied Health, Universiti
Kebangsaan Malaysia, Kuala Lumpur, Malaysia5Health Psychology Programme, Faculty of Health Sciences, Universiti Kebangsaan Malaysia, Kuala Lumpur, Malaysia6FrieslandCampina, Amersfoort, The Netherlands
(Submitted 18 September 2012 – Final revision received 13 February 2013 – Accepted 14 March 2013)
Abstract
The dual burden of malnutrition reportedly coexists in Malaysia; however, existing data are scarce and do not adequately represent the
nutritional status of Malaysian children. The Nutrition Survey of Malaysian Children was carried out with the aim of assessing the nutritional
status in a sample of nationally representative population of children aged 6 months to 12 years. A total of 3542 children were recruited
using a stratified random sampling method. Anthropometric measurements included weight, height, mid-upper arm circumference, and
waist and hip circumferences. Blood biochemical assessment involved analyses of Hb, serum ferritin, and vitamins A and D. Dietary
intake was assessed using semi-quantitative FFQ, and nutrient intakes were compared with the Malaysian Recommended Nutrient Intakes
(RNI). The prevalence of overweight (9·8 %) and obesity (11·8 %) was higher than that of thinness (5·4 %) and stunting (8·4 %). Only a small
proportion of children had low levels of Hb (6·6 %), serum ferritin (4·4 %) and vitamin A (4·4 %), but almost half the children (47·5 %)
had vitamin D insufficiency. Dietary intake of the children was not compatible with the recommendations, where more than one-third
did not achieve the Malaysian RNI for energy, Ca and vitamin D. The present study revealed that overnutrition was more prevalent
than undernutrition. The presence of high prevalence of vitamin D insufficiency and the inadequate intake of Ca and vitamin D are of
concern. Hence, strategies for improving the nutritional status of Malaysian children need to consider both sides of malnutrition and
also put emphasis on approaches for the prevention of overweight and obesity as well as vitamin D insufficiency.
Key words: Children’s nutritional status: Blood biochemistry: Dietary intakes: Double burden of malnutrition
Global transitions in economic development and sociodemo-
graphy have resulted in dietary and lifestyle changes(1),
which in turn have implications for nutritional and health
status of children around the world(2,3). In many developing
countries, including in Malaysia, it is known that the dual
burden of malnutrition coexists(4–6), sometimes within the
same family(7).
The World Health Statistics has reported that the percentage
of underweight children aged ,5 years declined globally
from 25 % in 1990 to 18 % in 2005(8), while the prevalence
of overweight in the same age group averaged at 6·7 %(9).
Globally, one-third of pre-schoolers suffered from vitamin A
deficiency in 1995–2005, with 45·5 % of the prevalence
being observed in Southeast Asia(10). The problem of anaemia
among Southeast Asian pre-school children was severe at
65·5 %(11). More recently, vitamin D has also been recognised
as a global problem(12), with a large proportion of children
reported among children worldwide, including in sun-rich
countries(13–16).
Data from the National Health and Morbidity Survey
(NHMS) III has revealed that the prevalences of stunting,
underweight and overweight among children aged ,5 years
are 17·2, 12·9 and 6·4 %, respectively, in Malaysia(17). Another
follow-up survey has reported that the prevalence of
*Corresponding author: Dr B. K. Poh, fax þ60 3 2694 7621, email [email protected]
Abbreviations: NHMS, National Health and Morbidity Survey; RNI, Recommended Nutrient Intakes; SEANUTS, South East Asian Nutrition Survey.
British Journal of Nutrition (2013), 110, S21–S35 doi:10.1017/S0007114513002092q The Authors 2013
British
Journal
ofNutrition

underweight among school-aged children in Malaysia
decreased slightly from 9·7 % in 2002 to 9·5 % in 2008, while
that of overweight/obesity increased from 20·7 to 26·4 %
during the same period(18). Anaemia has been observed in
32 % of the pre-schoolers(19), while vitamin A deficiency has
been reported in 3·5 % of the children aged ,5 years in a
rural area of the country (Ministry of Health/UNICEF (2000)
Nutritional status of children under five years, unpublished
results). Among school-aged children in the capital city,
Kuala Lumpur, 35·3 % had low serum 25-hydroxyvitamin D
concentrations indicative of vitamin D deficiency(16).
Nutrition is an important influencing factor with regard to
the continuous growth and development that occur through-
out the childhood period. Although anthropometry is widely
accepted as the most useful tool for assessing the nutritional
status of children(20), dietary assessment is also commonly
used in epidemiological studies to monitor the nutritional
status of children. The contribution of the various macronutri-
ents and micronutrients to the diet is the major focus of studies
on dietary intakes in children(21). Evaluating dietary intake
among children not only helps one to identify possible risk
factors for diet-linked diseases but also allows researchers to
examine whether food intake is influenced by non-modifiable
factors such as sex, ethnicity and age(22). In addition, using
blood biochemical analyses to determine nutritional status
can be extremely beneficial as they help one to assess and
interpret lifestyle and dietary intakes. Deviations in blood
chemistry are detectable before the symptoms of malnutrition
manifest(23). It is, therefore, useful in the prevention of
diseases or early detection of malnutrition.
With this background, it is obvious that while nationwide
anthropometric data are widely available as indicators of nutri-
tional status in Malaysia, data on other nutrition and health
indicators are scarce, especially for infants and young children
aged #12 years. Existing data do not adequately represent the
nutritional status of Malaysian children, and reports are avail-
able only for specific sections of the population. Thus, the
Nutrition Survey of Malaysian Children was carried out with
the main aim of assessing the nutritional status in a sample
of nationally representative population of Malaysian children
aged 6 months to 12 years.
The present survey was part of the South East Asian
Nutrition Survey (SEANUTS), a multi-centre study that was
simultaneously carried out among 16 744 children aged
0·5–12 years in four countries, namely Indonesia, Malaysia,
Thailand and Vietnam. Comprehensive assessment of nutri-
tional status was undertaken, which included anthropometry,
body composition, dietary intake, physical activity and blood
biochemistry, as well as assessment of bone health and cognitive
function(24). The present study describes only the key results
for anthropometry, body composition, blood biochemistry and
dietary intake from the Nutrition Survey of Malaysian Children.
Methodology
Study design and sampling
The present cross-sectional study was conducted from May
2010 till October 2011 throughout Malaysia. A stratified
random sampling of children aged 0·5–12·9 years from a
random sample selection of schools, kindergartens and nur-
series in Malaysia, stratified for geographical location and
age, was carried out. The present study was carried out on a
region-based sample. Data collection was done in all six
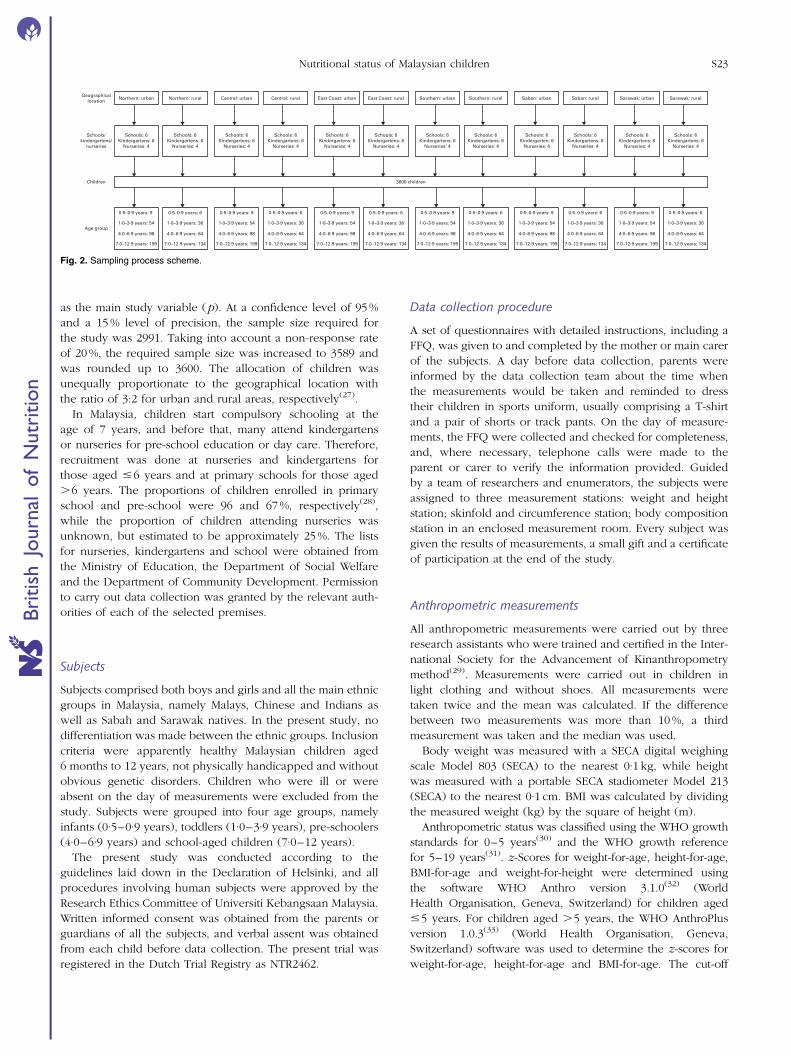
regions, namely Northern, Central, Southern and East Coast
in Peninsular Malaysia and Sabah and Sarawak (map shown
in Fig. 1). The sampling process is shown in Fig. 2.
The sample size was calculated using a formula for the esti-
mation of a population proportion with a specified relative
precision(25) as follows:
n ¼ Z212a=2
ð1 2 pÞ
p:1 2
where n is the required sample size, Z1-a/2 is the value of
the standard normal distribution at the desired CI, p is the
estimated prevalence of the variable of interest and 1 is the
relative precision required.
The prevalence of childhood overweight in Malaysia,
which is 5·4 % as reported by the NHMS III(26), was chosen
Northern
East
Central
SouthernSarawak
Sabah
Fig. 1. Map of Malaysia showing the six regions.
B. K. Poh et al.S22
British
Journal
ofNutrition
as the main study variable ( p). At a confidence level of 95 %
and a 15 % level of precision, the sample size required for
the study was 2991. Taking into account a non-response rate
of 20 %, the required sample size was increased to 3589 and
was rounded up to 3600. The allocation of children was
unequally proportionate to the geographical location with
the ratio of 3:2 for urban and rural areas, respectively(27).
In Malaysia, children start compulsory schooling at the
age of 7 years, and before that, many attend kindergartens
or nurseries for pre-school education or day care. Therefore,
recruitment was done at nurseries and kindergartens for
those aged #6 years and at primary schools for those aged
.6 years. The proportions of children enrolled in primary
school and pre-school were 96 and 67 %, respectively(28),
while the proportion of children attending nurseries was
unknown, but estimated to be approximately 25 %. The lists
for nurseries, kindergartens and school were obtained from
the Ministry of Education, the Department of Social Welfare
and the Department of Community Development. Permission
to carry out data collection was granted by the relevant auth-
orities of each of the selected premises.
Subjects
Subjects comprised both boys and girls and all the main ethnic
groups in Malaysia, namely Malays, Chinese and Indians as
well as Sabah and Sarawak natives. In the present study, no
differentiation was made between the ethnic groups. Inclusion
criteria were apparently healthy Malaysian children aged
6 months to 12 years, not physically handicapped and without
obvious genetic disorders. Children who were ill or were
absent on the day of measurements were excluded from the
study. Subjects were grouped into four age groups, namely
infants (0·5–0·9 years), toddlers (1·0–3·9 years), pre-schoolers
(4·0–6·9 years) and school-aged children (7·0–12 years).
The present study was conducted according to the
guidelines laid down in the Declaration of Helsinki, and all
procedures involving human subjects were approved by the
Research Ethics Committee of Universiti Kebangsaan Malaysia.
Written informed consent was obtained from the parents or
guardians of all the subjects, and verbal assent was obtained
from each child before data collection. The present trial was
registered in the Dutch Trial Registry as NTR2462.
Data collection procedure
A set of questionnaires with detailed instructions, including a
FFQ, was given to and completed by the mother or main carer
of the subjects. A day before data collection, parents were
informed by the data collection team about the time when
the measurements would be taken and reminded to dress
their children in sports uniform, usually comprising a T-shirt
and a pair of shorts or track pants. On the day of measure-
ments, the FFQ were collected and checked for completeness,
and, where necessary, telephone calls were made to the
parent or carer to verify the information provided. Guided
by a team of researchers and enumerators, the subjects were
assigned to three measurement stations: weight and height
station; skinfold and circumference station; body composition
station in an enclosed measurement room. Every subject was
given the results of measurements, a small gift and a certificate
of participation at the end of the study.
Anthropometric measurements
All anthropometric measurements were carried out by three
research assistants who were trained and certified in the Inter-
national Society for the Advancement of Kinanthropometry
method(29). Measurements were carried out in children in
light clothing and without shoes. All measurements were
taken twice and the mean was calculated. If the difference
between two measurements was more than 10 %, a third
measurement was taken and the median was used.
Body weight was measured with a SECA digital weighing
scale Model 803 (SECA) to the nearest 0·1 kg, while height
was measured with a portable SECA stadiometer Model 213
(SECA) to the nearest 0·1 cm. BMI was calculated by dividing
the measured weight (kg) by the square of height (m).
Anthropometric status was classified using the WHO growth
standards for 0–5 years(30) and the WHO growth reference
for 5–19 years(31). z-Scores for weight-for-age, height-for-age,
BMI-for-age and weight-for-height were determined using
the software WHO Anthro version 3.1.0(32) (World
Health Organisation, Geneva, Switzerland) for children aged
#5 years. For children aged .5 years, the WHO AnthroPlus
version 1.0.3(33) (World Health Organisation, Geneva,
Switzerland) software was used to determine the z-scores for
weight-for-age, height-for-age and BMI-for-age. The cut-off
Geographicallocation
Schools/kindergartens/
nurseries
Schools: 6Kindergartens: 6
Nurseries: 4
Schools: 6Kindergartens: 6
Nurseries: 4
Schools: 6Kindergartens: 6
Nurseries: 4
Schools: 6Kindergartens: 6
Nurseries: 4
Schools: 6Kindergartens: 6
Nurseries: 4
Schools: 6Kindergartens: 6
Nurseries: 4
Schools: 6Kindergartens: 6
Nurseries: 4
Schools: 6Kindergartens: 6
Nurseries: 4
Schools: 6Kindergarten: 6
Nurseries: 4
Schools: 6Kindergartens: 6
Nurseries: 4
Schools: 6Kindergartens: 6
Nurseries: 4
Schools: 6Kindergartens: 6
Nurseries: 4
Children
Age group
0·5–0·9 years: 9
1·0–3·9 years: 54
4·0–6·9 years: 98
7·0–12·9 years: 199
0·5–0·9 years: 6
1·0–3·9 years: 36
4·0–6·9 years: 64
7·0–12·9 years: 134
0·5–0·9 years: 9
1·0–3·9 years: 54
4·0–6·9 years: 98
7·0–12·9 years: 199
0·5–0·9 years: 9
1·0–3·9 years: 54
4·0–6·9 years: 98
7·0–12·9 years: 199
0·5–0·9 years: 9
1·0–3·9 years: 54
4·0–6·9 years: 98
7·0–12·9 years: 199
0·5–0·9 years: 9
1·0–3·9 years: 54
4·0–6·9 years: 98
7·0–12·9 years: 199
0·5–0·9 years: 9
1·0–3·9 years: 54
4·0–6·9 years: 98
7·0–12·9 years: 199
3600 children
0·5–0·9 years: 6
1·0–3·9 years: 36
4·0–6·9 years: 64
7·0–12·9 years: 134
0·5–0·9 years: 6
1·0–3·9 years: 36
4·0–6·9 years: 64
7·0–12·9 years: 134
0·5–0·9 years: 6
1·0–3·9 years: 36
4·0–6·9 years: 64
7·0–12·9 years: 134
0·5–0·9 years: 6
1·0–3·9 years: 36
4·0–6·9 years: 64
7·0–12·9 years: 134
0·5–0·9 years: 6
1·0–3·9 years: 36
4·0–6·9 years: 64
7·0–12·9 years: 134
Northern: urban Northern: rural Central: urban Central: rural East Coast: urban East Coast: rural Southern: urban Southern: rural Saban: urban Saban: rural Sarawak: urban Sarawak: rural
Fig. 2. Sampling process scheme.
Nutritional status of Malaysian children S23
British
Journal
ofNutrition

values for wasting, stunting and thinness were 22 SD. On the
other hand, the cut-off values for overweight and obesity
among children aged ,5 years were 2 SD, whereas they were
1 SD and 2 SD, respectively, among children aged.5 years as rec-
ommended by the WHO(30,31).
Mid-upper arm circumference and waist and hip circumfer-
ences were measured with a Lufkin tape (Model W606PM;
Apex Tool Group) to the nearest 0·1 cm. In addition, head
circumference was measured among children aged #3
years. Tricipital and subscapular skinfolds were measured in
all the subjects with a Harpenden skinfold calliper (British
Indicators Limited) to the nearest 0·1 mm.
Blood biochemical assessments
Blood sampling was carried out within a week of the anthro-
pometric measurements. Approximately 6 ml of venous blood
were drawn from the subjects aged $2 years by trained
phlebotomists. The collected blood samples were kept in a
standard storage box with an ice pack and transported
immediately to an accredited laboratory for analysis. Blood
samples were analysed for Hb and serum ferritin as well as
vitamins A and D.
Hb concentration was measured by a spectrophotometric
technique using Sysmex XE5000 (Sysmex), while serum
ferritin concentration was measured by a two-site sandwich
immunoassay using a direct chemiluminescence method using
ADVIA Centaur (Siemens). Vitamin D concentration through
the measurement of 25-hydroxyvitamin D was measured by a
direct competitive chemiluminescence method using the
Diaspora Liaison vitamin D platform (Diasorin). Vitamin A con-
centration through the measurement of serum retinol was
determined by HPLC using Agilent 1100 HPLC (Agilent).
The values obtained through the blood tests were then
compared with the internationally acceptable cut-off values
to determine deficiencies. Hb concentration was used to
determine anaemia, whereas serum ferritin concentration
as the single best predictor of Fe deficiency(34) was used to
determine Fe deficiency. Anaemia was defined as Hb concen-
trations ,110 g/l for children aged ,5 years, ,115 g/l for
children aged 5–11·9 years and ,120 g/l for children aged
$12 years(35). Fe deficiency was defined as serum ferritin con-
centrations ,12mg/l for children aged ,5 years and ,15mg/l
for children aged $5 years(36). Serum retinol concentration
,0·70mmol/l was used as an indication for vitamin A
deficiency(10), whereas circulating 25-hydroxyvitamin D con-
centration ,50 nmol/l was used as an indication for vitamin D
insufficiency(37).
Assessment of dietary intake
Dietary intake was assessed using semi-quantitative FFQ, with
parents or carers as the proxy for children. According to three
different age groups, three different sets of FFQ were devel-
oped and validated for the children: FFQ1 for children aged
6–23 months(38,39); FFQ2 for those aged 2–6 years(40); FFQ3
for those aged 7–12 years (41,42). In brief, the validation
study results attested to a good acceptance of the FFQ.
The mean intakes of the macronutrients were comparable
between the FFQ and 3-days dietary record (3DR) methods,
although those assessed by the FFQ method tended to be
higher. Correlations between the two methods were moderate
and ranged from r 0·310 and P,0·001 for fat to r 0·497 and
P,0·001 for energy. As indicated by Cronbach’s a coefficients
ranging between 0·61 (protein) and 0·70 (energy, carbo-
hydrate and fat), the FFQ exhibited a good reliability when
administered a week apart.
FFQ1, FFQ2 and FFQ3 consisted of seventy-six, ninety-five
and ninety-four food items, respectively. These food items
were grouped into thirteen food groups, namely cereals and
cereal products, meat and meat products, fish and seafood,
eggs, legumes and legume products, milk and dairy products,
vegetables, fruit, confectionery, beverages, spreads, season-
ings and flavouring, and soups. The frequency of intake and
amount of habitual food consumption of the children were
collated. The eight frequency categories were ‘never’, ‘1–3
times a month’, ‘once a week’, ‘2–4 times a week’, ‘5–6
times a week’, ‘once a day’, ‘2–3 times a day’ and ‘4 times
or more a day’. Each food item in the FFQ was assigned a por-
tion size using common household units, such as plate, bowl
and tablespoon. To facilitate accurate reporting, written
instructions on how to fill in the FFQ were provided and
photographs of food portion sizes were given in a separate
booklet.
Nutrient values for each food item were obtained from the
Nutrient Composition of Malaysian Foods(43), Composition of
Foods Commonly Eaten in Singapore(44) and food product
labels. The nutrient value of breast milk, an item listed in
Table 1. Number of children who participated in the study by age group
0·5–0·9 years 1·0–3·9 years 4·0–6·9 years 7·0–12 years Total
Sample(n)
Estimatedpopulation
(n)Sample
(n)
Estimatedpopulation
(n)Sample
(n)
Estimatedpopulation
(n)Sample
(n)
Estimatedpopulation
(n)Sample
(n)
Estimatedpopulation
(n)
UrbanBoys 20 70 680 150 544 783 324 583 937 558 1 192 061 1052 2 391 461Girls 23 65 913 144 511 612 268 535 735 615 1 170 900 1050 2 284 160All 43 136 593 294 1 056 395 592 1 119 672 1173 2 362 961 2102 4 675 621
RuralBoys 9 6962 128 173 349 185 119 157 388 312 718 710 612 186Girls 16 8838 116 175 463 190 138 333 408 287 731 730 610 365All 25 15 800 244 348 812 375 257 490 796 600 449 1440 1 222 551
B. K. Poh et al.S24
British
Journal
ofNutrition
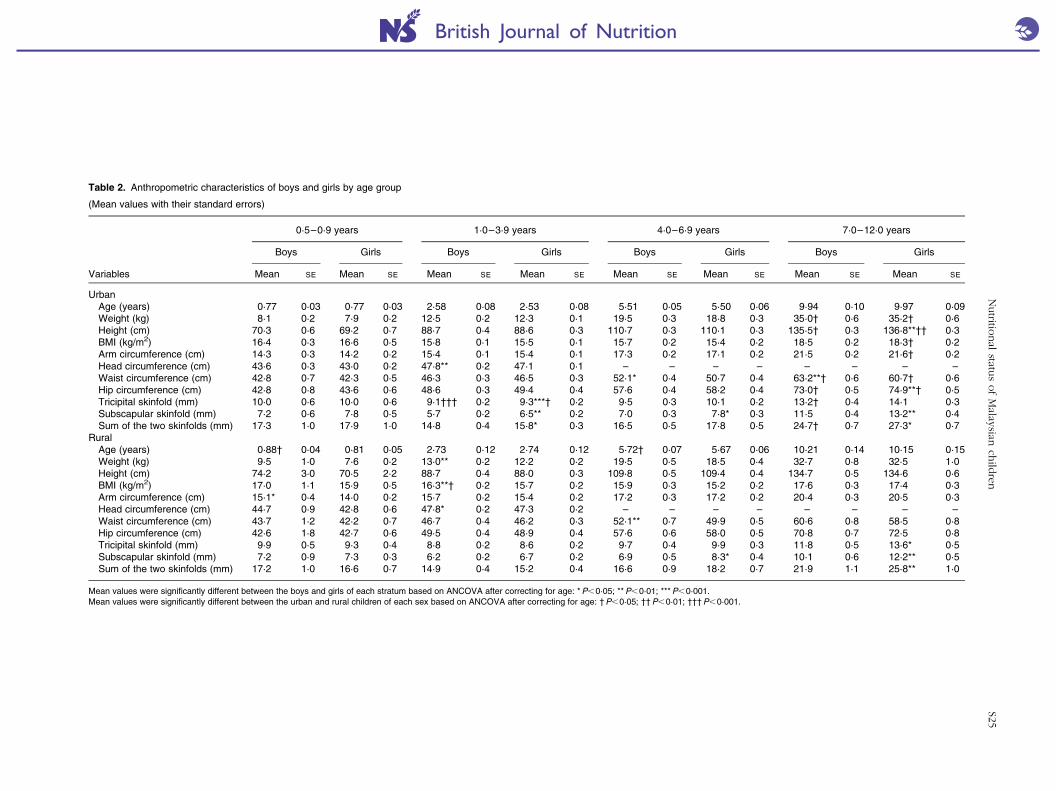
Table 2. Anthropometric characteristics of boys and girls by age group
(Mean values with their standard errors)
0·5–0·9 years 1·0–3·9 years 4·0–6·9 years 7·0–12·0 years
Boys Girls Boys Girls Boys Girls Boys Girls
Variables Mean SE Mean SE Mean SE Mean SE Mean SE Mean SE Mean SE Mean SE
UrbanAge (years) 0·77 0·03 0·77 0·03 2·58 0·08 2·53 0·08 5·51 0·05 5·50 0·06 9·94 0·10 9·97 0·09Weight (kg) 8·1 0·2 7·9 0·2 12·5 0·2 12·3 0·1 19·5 0·3 18·8 0·3 35·0† 0·6 35·2† 0·6Height (cm) 70·3 0·6 69·2 0·7 88·7 0·4 88·6 0·3 110·7 0·3 110·1 0·3 135·5† 0·3 136·8**†† 0·3BMI (kg/m2) 16·4 0·3 16·6 0·5 15·8 0·1 15·5 0·1 15·7 0·2 15·4 0·2 18·5 0·2 18·3† 0·2Arm circumference (cm) 14·3 0·3 14·2 0·2 15·4 0·1 15·4 0·1 17·3 0·2 17·1 0·2 21·5 0·2 21·6† 0·2Head circumference (cm) 43·6 0·3 43·0 0·2 47·8** 0·2 47·1 0·1 – – – – – – – –Waist circumference (cm) 42·8 0·7 42·3 0·5 46·3 0·3 46·5 0·3 52·1* 0·4 50·7 0·4 63·2**† 0·6 60·7† 0·6Hip circumference (cm) 42·8 0·8 43·6 0·6 48·6 0·3 49·4 0·4 57·6 0·4 58·2 0·4 73·0† 0·5 74·9**† 0·5Tricipital skinfold (mm) 10·0 0·6 10·0 0·6 9·1††† 0·2 9·3***† 0·2 9·5 0·3 10·1 0·2 13·2† 0·4 14·1 0·3Subscapular skinfold (mm) 7·2 0·6 7·8 0·5 5·7 0·2 6·5** 0·2 7·0 0·3 7·8* 0·3 11·5 0·4 13·2** 0·4Sum of the two skinfolds (mm) 17·3 1·0 17·9 1·0 14·8 0·4 15·8* 0·3 16·5 0·5 17·8 0·5 24·7† 0·7 27·3* 0·7
RuralAge (years) 0·88† 0·04 0·81 0·05 2·73 0·12 2·74 0·12 5·72† 0·07 5·67 0·06 10·21 0·14 10·15 0·15Weight (kg) 9·5 1·0 7·6 0·2 13·0** 0·2 12·2 0·2 19·5 0·5 18·5 0·4 32·7 0·8 32·5 1·0Height (cm) 74·2 3·0 70·5 2·2 88·7 0·4 88·0 0·3 109·8 0·5 109·4 0·4 134·7 0·5 134·6 0·6BMI (kg/m2) 17·0 1·1 15·9 0·5 16·3**† 0·2 15·7 0·2 15·9 0·3 15·2 0·2 17·6 0·3 17·4 0·3Arm circumference (cm) 15·1* 0·4 14·0 0·2 15·7 0·2 15·4 0·2 17·2 0·3 17·2 0·2 20·4 0·3 20·5 0·3Head circumference (cm) 44·7 0·9 42·8 0·6 47·8* 0·2 47·3 0·2 – – – – – – – –Waist circumference (cm) 43·7 1·2 42·2 0·7 46·7 0·4 46·2 0·3 52·1** 0·7 49·9 0·5 60·6 0·8 58·5 0·8Hip circumference (cm) 42·6 1·8 42·7 0·6 49·5 0·4 48·9 0·4 57·6 0·6 58·0 0·5 70·8 0·7 72·5 0·8Tricipital skinfold (mm) 9·9 0·5 9·3 0·4 8·8 0·2 8·6 0·2 9·7 0·4 9·9 0·3 11·8 0·5 13·6* 0·5Subscapular skinfold (mm) 7·2 0·9 7·3 0·3 6·2 0·2 6·7 0·2 6·9 0·5 8·3* 0·4 10·1 0·6 12·2** 0·5Sum of the two skinfolds (mm) 17·2 1·0 16·6 0·7 14·9 0·4 15·2 0·4 16·6 0·9 18·2 0·7 21·9 1·1 25·8** 1·0
Mean values were significantly different between the boys and girls of each stratum based on ANCOVA after correcting for age: *P,0·05; **P,0·01; ***P,0·001.Mean values were significantly different between the urban and rural children of each sex based on ANCOVA after correcting for age: †P,0·05; ††P,0·01; †††P,0·001.
Nutritio
nal
status
of
Malay
sianch
ildre
nS2
5
British Journal of Nutrition

FFQ1, was estimated at 11·3 ml/min(45) and its nutrient content
was obtained from the Association of Southeast Asian Nations
(ASEAN) Food Composition Tables(46). Total energy and nutri-
ent intakes were calculated by employing an Excel-based plat-
form(47). The total energy and nutrient intake values were
compared with the Recommended Nutrient Intakes (RNI) for
Malaysia(48).
Statistical analyses
Data were entered, cleaned and checked before data analysis.
Double data entry was done for 10 % of the data. Descriptive
statistics are presented as means with their standard errors
or percentage of prevalence. The children were stratified
into four age groups, namely 0·5–0·9 years, 1·0–3·9 years,
4·0–6·9 years and 7·0–12·9 years. The adjusted means and
standard errors were reported after adjusting for complex
sampling and covariates including age and sex. Generalised
linear models were used to calculate the adjusted means and
standard errors of means of anthropometric and body compo-
sition measurements, blood parameters and nutrient intakes.
Mean value differences were assessed using the Wald F logis-
tics regression for comparing prevalence or proportion with
adjustment for complex sampling and covariates of age and
sex. Statistical analyses were conducted using SPSS-IBM
(version 16.0) (IBM Corporation, New York, United States
of America) with a complex sampling module. A two-sided
P value of ,0·05 was considered statistically significant.
Results
Table 1 reports the number of children in whom measurements
were carried out and the estimated weighted population rep-
resented from the survey. A total of 3542 children participated
in the study, representing an estimated population totalling
5 898 172 children aged 6 months to 12 years.
The anthropometric characteristics are presented by age
groups in Table 2. Among children aged ,1 year, mean age
and all the anthropometric characteristics showed no signifi-
cant difference between the sexes and strata, except that
rural boys were slightly older than the urban boys, and rural
boys had a greater mid-upper arm circumference than the
rural girls. Among children aged 1–3 years, boys in rural
areas had significantly greater weight and BMI and all boys
had a significantly greater head circumference than their
female counterparts. On the other hand, urban girls had sig-
nificantly greater skinfolds than their male counterparts.
Urban children also had significantly greater tricipital skinfolds
than their rural counterparts. Among children aged 4–6 years,
similar anthropometric characteristics were observed between
the sexes and strata, except for boys having a greater waist cir-
cumference but a lower subscapular skinfold than the girls.
Among children aged 7–12 years, all the anthropometric
characteristics were generally higher in urban children than
in their rural counterparts, although significant differences
were not observed for some variables. In this age group,
girls had significantly greater skinfolds than the boys in both
the urban and rural areas, while urban boys had a greater
waist circumference than the girls.
The prevalence of overnutrition and undernutrition is
reported in Tables 3 and 4. The prevalence of thinness was
similar throughout the various age groups, except in the age
group 1–3 years, in which a lower prevalence was observed
(Table 3). The prevalence of obesity, on the other hand,
Table 3. Percentage of thin‡, overweight and obese boys and girls in urban and rural areas by age group
0·5–0·9 years 1·0–3·9 years 4·0–6·9 years 7·0–12 years All
Boys Girls All Boys Girls All Boys Girls All Boys Girls All Boys Girls All
UrbanThin 11·4 4·8 8·2 2·9 1·7 2·4 7·2* 2·5 5·0 7·6 5·2 6·4 6·5* 3·8 5·2Overweight 2·4 5·0 3·6 4·1 2·7 3·4 5·8 7·4 6·6 13·3 15·6 14·4 9·0 10·5 9·7Obese – 11·3 5·4a,b 1·2* 0·1 0·7a 12·8* 5·8 9·4b 23·5*† 16·7 20·1b 15·1**†† 10·2 12·7
RuralThin 14·2 – 6·2 2·1 0·3 1·2 4·0 5·7 4·9 7·6 11·1 9·3 5·4 6·6† 6·0Overweight 26·4 – 11·6 7·9 2·7 5·3 11·6 7·8 9·5 11·2 14·2 12·6 10·5 9·2 9·9Obese – – – 1·2 0·4 0·8a 8·8 6·5 7·6b 15·4 10·4 13·0b 9·9 6·5 8·2
a,b Mean values with unlike superscript letters were significantly different between the age groups based on complex sample logistic regression adjusted for age: P,0·05.Mean values were significantly different between the sexes by stratum based on complex sample logistic regression adjusted for age: *P,0·05; **P,0·01.Mean values were significantly different between the strata by sex based on complex sample logistic regression adjusted for age: †P,0·05; ††P,0·01.‡ Thinness was calculated based on BMI-for-age z-scores ,22 SD.
Table 4. Percentage of stunted children in urban and rural areas byage group
0·5–0·9years
1·0–3·9years
4·0 26·9years
7·0–12years All
UrbanBoys 24·0 17·6 9·9* 5·7 10·0*Girls 23·9†† 10·5 4·5 4·8 6·6All 23·9 14·2 7·3 5·2 8·3
RuralBoys 7·3 19·1** 10·8 3·8 9·5Girls 2·6 5·4 5·3 11·1**†† 8·0All 4·6a 12·2b 7·8c 7·3b,c 8·8
a,b,c Mean values with unlike superscript letters were significantly different betweenthe age groups based on complex sample logistic regression adjusted for age(P,0·05).
Mean values were significantly different between the sexes by stratum based oncomplex sample logistic regression adjusted for age: *P,0·05; **P,0·01.
Mean values were significantly different between the strata by sex based oncomplex sample logistic regression adjusted for age: ††P,0·01.
B. K. Poh et al.S26
British
Journal
ofNutrition

was higher in the older age groups. Comparison between the
sexes showed that a significantly higher prevalence of thin-
ness and obesity was present in urban boys than in their
female counterparts. Comparison between the strata showed
that a significantly higher prevalence of obesity was present
in urban boys than in their rural counterparts. Table 4
shows that the prevalence of stunting was generally lower in
the higher age groups. A higher prevalence of stunting was
observed in boys than in the girls, with the difference being
significant in the urban population. In the 7–12-year age
group, a higher prevalence of stunting was observed in rural
girls than in their urban counterparts.
Figs. 3–5 show that the distributions of weight-for-age and
height-for-age z-scores of Malaysian children were shifted to
the left compared with those of the reference population(30,31).
For the BMI-for-age z-scores, the distribution of Malaysian
children appeared to shift only a little to the left, but there
were also a small proportion of children for whom the distri-
bution shifted to the right of the reference population.
The levels of the blood parameters of the children by sex,
area and age group are detailed in Table 5. Generally, the
older age group and urban children exhibited higher values
for most of the blood parameters than the younger age
group and rural area children, except for vitamin D. After
correcting for age, significant differences were observed for
certain blood parameters between the sexes from the same
area (ferritin and vitamin D) and between the areas for the
same sex (vitamin D) between the two age groups.
Table 6 presents the prevalence of anaemia, Fe deficiency,
vitamin A deficiency and vitamin D insufficiency by sex, area
and agegroup.Overall, 6·6, 4·4 and4·4 %of the childrenhaddef-
icit values for Hb, ferritin and vitamin A. In contrast, there was a
high prevalence of vitamin D deficiency with 47·5 % having
25-hydroxyvitamin D concentrations ,50 nmol/l, whereby the
prevalence among the girls (54·1 %) was significantly higher
than that among the boys (41·1 %). The prevalence of anaemia
and vitamin A deficiency was higher in rural areas than in the
urban areas, whereas the prevalence of Fe deficiency and
vitamin D deficiency was lower in the rural areas. A higher
prevalence of anaemia and vitamin A deficiency was observed
among younger children, whereas older children were found
to have a poorer ferritin and vitamin D status when compared
with their younger counterparts.
The mean energy and macronutrient intakes of Malaysian
children by age group and residence strata are presented in
Table 7. As expected, the energy and macronutrient intakes
were higher in the older age groups. The mean energy and
macronutrient intakes were generally higher for boys than
for the girls in the same age group except for the 0·5–0·9-
year and 1–3-year age groups, where they were similar
between the sexes. Overall, there was no significant difference
in mean energy and macronutrient intakes between rural and
20(a)
(b)
15
10
Per
cen
tag
e (%
)
5
0–7 –6 –5 –4 –3 –2
Weight-for-age z-score
–1 0 1 2 3 4 5 6 7
20
15
10
Per
cen
tag
e (%
)
5
0–7 –6 –5 –4 –3 –2
Weight-for-age z-score
–1 0 1 2 3 4 5 6 7
Fig. 3. z-Score distribution for weight-for-age of Malaysian children compared with
the WHO reference ( ) by (a) sex (boys ( ) and girls ( )) and (b) strata
(urban ( ) and rural ( )).
20(a)
(b)
15
10
Per
cen
tag
e (%
)
5
0–7 –6 –5 –4 –3 –2
Height-for-age z-score
–1 0 1 2 3 4 5 6 7
20
15
10
Per
cen
tag
e (%
)
5
0–7 –6 –5 –4 –3 –2
Height-for-age z-score
–1 0 1 2 3 4 5 6 7
Fig. 4. z-Score distribution for height-for-age of Malaysian children compared
with the WHO reference ( ) by (a) sex (boys ( ) and girls ( )) and (b)
strata (urban ( ) and rural ( )).
Nutritional status of Malaysian children S27
British
Journal
ofNutrition

urban children across the age groups. However, significant
differences in mean energy and certain macronutrient intakes
were found when comparing rural and urban children of the
same sex in the 1–3-year age group.
Table 8 reports the micronutrient intakes according to age
group and residence strata. As expected, micronutrient intakes
were higher in the older age groups. There was no obvious
difference in intakes between the sexes except for Ca, Fe
and vitamin C intakes in certain age groups. Ca intake of
girls aged 0·5–0·9 years and Fe intake of girls aged 1–3
years were higher than those of their male counterparts. On
the other hand, vitamin C intake of rural girls aged 1–3
years and urban girls aged 7–12 years was significantly
higher than that of their counterparts from the same area.
No differences in micronutrient intakes between the urban
and rural areas were observed, except in the youngest and
oldest age groups. In the age group 7–12 years, Ca, Fe and
vitamin C, A and D intakes of the urban girls were higher
than those of the rural girls. Besides, Ca, Fe and vitamin D
intakes of rural boys aged 0·5–0·9 years were significantly
higher than those of their urban counterparts.
In general, the percentage of children not achieving the
Malaysian RNI(48) for nutrients across the age groups was
lower than 20 %, except for energy, Ca and vitamin D
(Table 9). Approximately 30 % of the children did not achieve
the energy recommendations, while nearly 50 % did not
achieve the Ca and vitamin D recommendations. In urban
areas, significantly more boys aged 7–12 years did not achieve
the Malaysian RNI for energy and vitamin C compared
with their female counterparts. On the other hand, in rural
areas, the percentage of girls aged 4–6 years who did not
achieve the Malaysian RNI for vitamins C and A was more
than double that of the boys. On comparing the urban and
rural areas, it was observed that there were a higher percen-
tage of girls aged 7–12 years in rural areas who did not
achieve the Malaysian RNI for Fe and vitamins A and D com-
pared with their urban counterparts. On the other hand, the
percentage of urban children aged 1–3 years not achieving
the vitamin A recommendations was more than four times
that of the rural counterparts.
Discussion
The findings of SEANUTS Malaysia will be deliberated and
compared with those of other national studies as well as
those of other neighbouring countries.
Anthropometric status of Malaysian children
Among infants aged ,1 year, the anthropometric parameters
did not differ much between the sexes as well as between
the urban and rural locations. Sex and urban/rural differences
became more apparent for those aged $1 year, especially in
the oldest age group (7–12 years). Among the primary school-
aged children, urban children evidently had a better nutritional
status than their rural counterparts. An analysis of data from
thirty-six developing countries has concluded that lower
urban malnutrition is due to more favourable socio-economic
conditions, which in turn lead to better caring practices for
children(49).
Overall, the prevalence of overweight (9·8 %) and obesity
(11·8 %) was higher than that of thinness (5·4 %) and stunting
(8·4 %). z-Score distribution curves for weight-for-age and
height-for-age shows that Malaysian children are skewed to
the left of the WHO reference, both for boys and girls as
well as urban and rural. However, for BMI-for-age z-score dis-
tribution, the curve was dissimilar in that although to a certain
extent it was skewed to the left, above 2 SD, there were also a
certain percentage of children for whom the distribution was
above the WHO reference, producing a wider spread for the
BMI-for-age distribution. The rightward spread above the
reference population indicates that there are a subgroup of
children who are unusually big and implies that there are a
proportion of children in the population who are of a better
nutritional status and probably also a higher socio-economic
status than the rest.
Contrary to the present findings, the NHMS 2011 has
reported that the prevalence of thinness (12·2 %) was higher
than that of obesity (6·1 %) among children aged ,18
years(50). Similarly, previous NHMS 2006 report has also
stated that the prevalence of underweight (13·2 %) was
higher than that of overweight (5·4 %)(26). It must, however,
be noted that both the NHMS 2006 and NHMS 2011 reports
had used the 2000 United States Centers for Disease Control
and Prevention (CDC) growth charts(51), while the present
20(a)
(b)
15
10
Per
cen
tag
e (%
)
5
0–7 –6 –5 –4 –3 –2
BMI-for-age z-score
–1 0 1 2 3 4 5 6 7
20
15
10
Per
cen
tag
e (%
)
5
0–7 –6 –5 –4 –3 –2
BMI-for-age z-score
–1 0 1 2 3 4 5 6 7
Fig. 5. z-Score distribution for BMI-for-age of Malaysian children compared
with the WHO reference ( ) by (a) sex (boys ( ) and girls ( )) and
(b) strata (urban ( ) and rural ( )).
B. K. Poh et al.S28
British
Journal
ofNutrition

study analysed nutritional status based on the WHO
growth references(30,31). The application of the WHO 2006
growth standards may have produced a lower prevalence of
underweight and a higher prevalence of stunting and
overweight compared with that of the 2000 CDC growth
charts(52). A reanalysis of the NHMS 2006 data for children
aged ,5 years indicated 14·9 % thinness and 6·4 % overweight
based on the WHO 2006 BMI-for-age standards and 17·2 %
stunting based on the WHO 2006 height-for-age standards(17).
It would appear that the results of the NHMS 2006 indicated
a higher prevalence of undernutrition than that of overnutri-
tion, whereas our data from SEANUTS Malaysia conducted
in the years 2010–11 imply that the opposite is true. The
reason for this difference is not clear as both studies aimed
to be representative of the Malaysian population. However,
we speculate that it could be due to the different
sampling protocol, whereby the NHMS 2006 sampling was
household based, while our survey was sampled at the
school, kindergarten and nursery levels. Another possible
Table 5. Blood parameters of boys and girls by area of residence
(Mean values with their standard errors)
Urban Rural
Boys Girls Boys Girls
Variables Mean SE Mean SE Mean SE Mean SE
4·0–6·9 yearsHb (g/l) 125·9 1·7 126·0 2·2 125·5 1·8 121·6 1·7Ferritin (mg/l) 42·5 2·7 52·3* 3·5 42·8 4·1 41·7 4·8Vitamin A (mmol/l) 1·00 0·04 0·95 0·03 0·99 0·04 1·00 0·04Vitamin D (nmol/l) 65·1 3·0 59·1 2·7 75·5**† 3·2 62·7 3·6
7·0–12 yearsHb (g/l) 133·1 0·8 132·0 0·7 131·9 1·3 132·6 1·0Ferritin (mg/l) 48·4 2·9 49·8 3·6 59·8 5·4 47·7 3·8Vitamin A (mmol/l) 1·04 0·02 1·08 0·03 1·04 0·04 1·06 0·03Vitamin D (nmol/l) 54·3*** 1·6 43·2 1·4 56·6*** 1·9 46·4 1·5
Mean values were significantly different between the boys and girls of each stratum based on ANCOVA after correcting for age:*P,0·05; **P,0·01; ***P,0·001.
Mean values were significantly different between the urban and rural children of each sex based on ANCOVA after correcting forage: †P,0·05.
Table 6. Prevalence of anaemia, iron deficiency, vitamin A deficiency and vitamin D insufficiency byage group and area of residence
4·0–6·9 years 7·0–12 years All
Urban Rural Urban Rural Urban Rural All
Anaemia§Boys 12·9 7·4 3·7 8·0* 6·5 7·8 6·8Girls 9·7 33·2*† 3·5 1·9 5·5 10·5 6·4All 11·3 17·6 3·6 5·1 6·0 9·0 6·6
Fe deficiencykBoys 1·5 1·6 5·3 1·2 4·1 1·3 3·5Girls 2·4 1·0 7·6* 3·2 5·9 2·5 5·3All 2·0 1·3 6·4 2·2 5·0 1·9 4·4
Vitamin A deficiency{Boys 3·1 14·1 4·5* 5·6 4·1 8·5 5·1Girls 9·9 4·9 1·1 3·4 3·5 3·7 3·6All 6·6 10·9 2·8 4·5 3·8 6·4 4·4
Vitamin D insufficiency§§Boys 35·5 10·8 48·2 38·9 44·3† 29·5 41·1Girls 33·7†† 27·2 66·7* 52·9* 56·2* 45·4* 54·1‡‡All 34·6 17·9 57·3 45·6 50·2 36·9 47·5
Mean values were significantly different between the sexes by stratum based on complex sample logistic regressionadjusted for age: *P,0·05.
Mean values were significantly different between the strata by sex based on complex sample logistic regression adjustedfor age: †P,0·05; ††P,0·01.
Mean values were significantly different between the sexes based on complex sample logistic regression adjusted forage: ‡‡P,0·01.
§ Cut-off values of Hb concentration based on WHO/UNICEF/UNU (2001)(33): children aged ,5 years, ,11 g/l; childrenaged 5–11 years, ,11·5 g/l; children aged 12–13 years, ,12 g/l.
kCut-off values of serum ferritin concentration based on WHO/UNICEF/UNU (2001)(33): children aged ,5 years,,12mg/l; children aged $5 years, ,15mg/l.
{Deficiency is defined as serum retinol concentration ,0·7mmol/l based on WHO (2009)(10).§§ Insufficiency is defined as 25-hydroxyvitamin D concentration ,50 nmol/l based on Misra et al.(37).
Nutritional status of Malaysian children S29
British
Journal
ofNutrition

reason could be the different geographical areas covered and
the larger number of participants in the NHMS 2006. Also, the
different time periods during which the two surveys were con-
ducted could possibly explain the lower prevalence of under-
nutrition and higher prevalence of overnutrition in the present
survey. Khor et al.(17) found a similar pattern, where the
prevalence of underweight and stunting was lower and that
of overweight was higher when comparing the NHMS 2006
data for children aged ,5 years with the results of the year
2000 Ministry of Health, Malaysia (MOH)/UNICEF survey in
the same age group. Among primary school children, two sur-
veys conducted by Universiti Kebangsaan Malaysia (UKM) in
the years 2001 and 2008 had also found that the prevalence
of overweight and obesity had increased from 20·7 to
26·4 %, whereas that of thinness decreased, although not by
much, from 9·7 to 9·5 % over the 7-year period(53).
Micronutrient deficiencies in Malaysian children
Fe deficiency and anaemia were identified as the most import-
ant factors leading to micronutrient malnutrition in Malaysia
based on persistence and prevalence(54). The findings of the
present study demonstrate that the overall prevalence of Fe
deficiency and anaemia is 4·4 and 6·6 %, respectively, which
according to the WHO(34) is at a low level of public health
significance for anaemia. The Fe status of the children is, there-
fore, encouraging, and it is in concordance with a recent study
carried out among urban school children in Kuala Lumpur,
which has found that the prevalence of both Fe deficiency
and anaemia is 2·2 %(16). However, a higher prevalence
ranging from 48·5 to 62·0 % has been reported by other local
studies mostly in rural areas(55–57). Detailed analysis of our
own data indicated a higher prevalence of anaemia in Sabah
(13·2 %) than in Peninsular Malaysia (5·8 %) and Sarawak
(4·0 %). The difference in study locations and study age
groups may have contributed to the variance in results.
Moderate-to-high levels of Fe deficiency and anaemia have
long been one of the predominant findings of nutrition sur-
veys among children in Southeast Asia. When compared
with data from other countries, the present results show that
the prevalence of Fe deficiency and anaemia among Malaysian
children is relatively low. A study conducted in northeast
Thailand, which involved 567 school children, has reported
31·0 % of the children to be anaemic(58), while in Vietnam
the prevalence of Fe deficiency and anaemia among pre-
school children is 9·8 and 55·6 %, respectively(59).
The lower prevalence of anaemia among the children may
be due to national programmes implemented by the Ministry
of Health, such as the Programme on the Rehabilitation of
Malnourished Children that targets families with income
below the poverty line that had underweight children aged
,5 years(60). Under this programme, food baskets containing
essential food items, as well as Fe and multivitamin sup-
plements, are distributed to eligible recipients on a monthly
basis. The Family Health Clinics also routinely disseminate
nutrition education on food preparation techniques for a
balanced diet, which includes the promotion of Fe-rich
foods(61).Table
7.
Macro
nutr
ient
inta
kes
by
age
gro
up
and
are
aof
resid
ence
(Mean
valu
es
with
their
sta
ndard
err
ors
)
0·5
–0·9
years
1·0
–3·9
years
4·0
–6·9
years
7·0
–12
years
Boys
Girls
All
Boys
Girls
All
Boys
Girls
All
Boys
Girls
All
Mean
SE
Mean
SE
Mean
SE
Mean
SE
Mean
SE
Mean
SE
Mean
SE
Mean
SE
Mean
SE
Mean
SE
Mean
SE
Mean
SE
Urb
an
Energ
y(k
J)
3039
164
3209
270
3121
156
4529
137
4476
130
4503
94
6231*
105
5890
106
6068
75
8465**
*90
8047†
84
8258
62
Energ
y(k
cal)
725
38
766
64
745
37
1085
31
1078
29
1082
21
1492
24
1412
25
1454
18
2029
19
1926†
18
1978
13
Carb
ohydra
tes
(g)
96·0
3·9
102·2
9·3
99·0
4·9
144·8
4·3
147·1
4·2
145·9
3·0
203·7
*3·2
192·5
3·5
198·3
2·4
289·4
**2·8
275·8
3·1
282·7
2·1
Pro
tein
(g)
20·2
2·0
21·6
2·2
20·9
1·5
39·6
1·3
38·6
1·0
39·1
0·8
56·7
*1·1
53·6
1·1
55·2
0·8
74·9
**1·0
70·8
0·8
72·9
0·6
Fat
(g)
28·9
2·6
30·1
2·9
29·5
2·0
38·5
1·3
37·3
1·1
37·9
0·8
50·1
1·0
47·5
1·0
48·9
0·7
63·5
**0·9
60·0
0·7
61·7
0·6
Rura
l
Energ
y(k
J)
3846
509
2902
222
3318
324
5087†
182
5055††
137
5071
113
6455
150
6223
138
6330
102
8521**
*136
7814
109
8182
91
Energ
y(k
cal)
934
126
698
51
801
77
1201
36
1191
31
1196
24
1523
36
1474
34
1497
25
2017
26
1854
25
1939
19
Carb
ohydra
tes
(g)
114·0
16·8
97·3
4·3
104·6
8·4
161·2
†4·6
158·9
4·6
160·0
3·3
205·9
5·3
200·4
4·8
203·0
3·5
289·7
***
4·8
262·2
3·7
276·6
3·2
Pro
tein
(g)
33·8
*†5·9
19·7
1·2
25·8
3·6
44·7
††
1·4
43·8
††
1·3
44·3
1·0
57·3
1·6
55·1
1·5
56·1
1·1
72·5
1·2
68·8
1·5
70·7
0·9
Fat
(g)
38·1
*4·4
25·6
4·6
31·0
4·1
42·0
1·5
42·3
††
1·2
42·1
1·0
52·3
1·4
50·1
1·4
51·1
1·0
63·1
*1·2
58·9
1·1
61·1
0·8
Mean
valu
es
were
sig
nifi
cantly
diffe
rent
betw
een
the
boys
and
girls
of
each
str
atu
mbased
on
AN
CO
VA
aft
er
corr
ecting
for
age:
*P,
0·0
5;
**P,
0·0
1;
***P,
0·0
01.
Mean
valu
es
were
sig
nifi
cantly
diffe
rent
betw
een
the
urb
an
and
rura
lchild
ren
of
each
sex
based
on
AN
CO
VA
aft
er
corr
ecting
for
age:
†P,
0·0
5;
††P,
0·0
1.
B. K. Poh et al.S30
British
Journal
ofNutrition

The prevalence of vitamin A deficiency in the present study
was lower than that reported by other Malaysian studies. In
the present study, 4·4 % of the children were found to have
vitamin A deficiency and the prevalence of vitamin A
deficiency in rural areas (6·4 %) was higher than that in
urban areas (3·8 %). Earlier studies conducted in Malaysia
have reported a range of prevalence rates from 3·9 % in a
sample of children aged ,5 years(62) to 27·4 % among abori-
ginal school children aged 7–12 years(63). Based on
WHO(64) definition, vitamin A deficiency among our popu-
lation of children is considered a mild public health problem,
that is, between 2 and 9 % having retinol concentration
,0·70mmol/l.
In other parts of the world, vitamin A deficiency remains a
public health problem. A high prevalence of vitamin A
deficiency has been reported among Vietnamese primary
school girls, whereby 35·7 % of rural children and 21·4 % of
urban children exhibited marginal retinol stores (0·35–
0·7mmol/l)(65). A study conducted among pre-school children
in the southern coastal area of central Jawa in Indonesia has
reported that 52 % of the children had a very low serum retinol
concentration (0·35–0·7mmol/l)(66). The lower prevalence in
Malaysia than in the surrounding countries may be due to
the relatively better socio-economic and nutritional status of
Malaysian children.
Despite Malaysia being a tropical country located right next
to the equator and exposed to sunshine all year round, find-
ings from the present study reveal that a large proportion of
children (47·5 %) have vitamin D insufficiency. Similarly, a
recent local study conducted among urban school children
has documented 37·1 % of the children to have an insufficient
vitamin D status(16). As mentioned by Chailurkit et al.(67), a
low vitamin D level is not an uncommon problem even in
countries that receive abundant sunshine. Numerous studies
have shown a poor vitamin D status among children in tropi-
cal countries, including Qatar (68·8 %)(13), India (10·8 %)(68)
and Saudi Arabia (58·8 %)(69).
Inadequate dietary intake of vitamin D and low sunlight
exposure are likely to be the main contributing factors for
the poor vitamin D status in the study population. Most
foods are poor sources of vitamin D, with the exception of
egg yolk and certain types of fish and seafood. In Malaysia,
not many foods are fortified with vitamin D and these are con-
fined to certain brands of margarines and beverages only.
Hence, it is not likely that children in Malaysia can obtain suf-
ficient vitamin D from dietary sources alone(16). Malaysian
children also tend to spend more time engaged in indoor
sedentary activities, such as doing homework, reading, play-
ing computer games and watching television(70). They avoid
being outdoors during the day due to the hot and humid
weather, thus leading to an impact on outdoor activities and
sunlight exposure.
A difference in vitamin D status between urban and rural
children was clearly demonstrated in the present study.
Environmental factors such as air pollution may play a
contributory role, where tropospheric ozone, an efficient
absorber of UV, is a common air pollutant found in urban
cities that may indirectly reduce the availability of sunlight toTable
8.
Mic
ronutr
ient
inta
kes
by
age
gro
up
and
are
aof
resid
ence
(Mean
valu
es
with
their
sta
ndard
err
ors
)
0·5
–0·9
years
1·0
–3·9
years
4·0
–6·9
years
7·0
–12
years
Boys
Girls
All
Boys
Girls
All
Boys
Girls
All
Boys
Girls
All
Mean
SE
Mean
SE
Mean
SE
Mean
SE
Mean
SE
Mean
SE
Mean
SE
Mean
SE
Mean
SE
Mean
SE
Mean
SE
Mean
SE
Urb
an
Ca
(mg)
532
32
578**
*†45
554·2
27·1
706
29
682
27
694·5
19·8
673
17
673
19
672·8
12·5
777
14
775††
15
776·2
10·2
Fe
(mg)
7·7
0·9
9·2
1·2
8·4
0·7
11·8
0·5
11·8
0·4
11·8
0·3
14·5
0·3
13·8
0·3
14·1
0·2
18·0
0·3
17·5
†0·2
17·8
0·2
Vitam
inC
(mg)
91
985
888·0
6·1
87
491
489·0
2·6
87
388
387·1
1·9
100
3109**
††
2104·5
1·8
Vitam
inA
(mg)
947·1
103·4
765·2
64·0
859·4
63·0
862·3
36·9
825·3
36·5
844·4
25·9
906·5
24·6
881·3
25·2
894·4
17·6
1105·2
†19·9
1102·5
††
17·8
1103·9
13·4
Vitam
inD
(mg)
5·4
0·6
6·5
0·7
5·9
0·5
6·4
0·3
6·2
0·3
6·3
0·2
5·4
0·2
5·5
0·2
5·5
0·1
5·7
††
0·2
5·3
††
0·2
5·5
0·1
Rura
l
Ca
(mg)
755†††
117
568
32
648·6
63·0
694
31
734
35
714·2
23·6
707
22
672
25
688·2
17·2
741
19
696
19
719·4
13·5
Fe
(mg)
11·9
†1·7
9·4
1·3
10·5
1·1
13·1
0·5
13·0
0·5
13·0
0·3
15·4
0·4
14·4
0·5
14·8
0·3
17·5
*0·4
16·4
0·4
17·0
0·3
Vitam
inC
(mg)
91
982
986·3
7·0
88
4100**
*4
94·1
3·0
88
386
486·9
2·5
102
496
399·3
2·5
Vitam
inA
(mg)
801·8
95·8
714·2
99·7
752·7
76·9
887·4
37·8
879·0
43·3
883·1
29·0
941·2
29·6
883·9
34·1
910·3
23·2
1028·1
26·8
993·0
26·3
1011·3
18·8
Vitam
inD
(mg)
8·4
†1·0
6·4
0·6
7·3
0·6
6·6
0·4
6·9
0·4
6·7
0·3
6·0
0·3
5·4
0·3
5·7
0·2
4·8
0·2
4·5
0·2
4·6
0·1
Mean
valu
es
were
sig
nifi
cantly
diffe
rent
betw
een
the
boys
and
girls
of
each
str
atu
mbased
on
AN
CO
VA
aft
er
corr
ecting
for
age:
*P,
0·0
5;
**P,
0·0
1;
***P,
0·0
01.
Mean
valu
es
were
sig
nifi
cantly
diffe
rent
betw
een
the
urb
an
and
rura
lchild
ren
of
each
sex
based
on
AN
CO
VA
aft
er
corr
ecting
for
age:
†P,
0·0
5;
††P,
0·0
1;
†††P,
0·0
01.
Nutritional status of Malaysian children S31
British
Journal
ofNutrition

urban populations(71). Besides, cultural factors such as cloth-
ing practices may also limit the capacity of the skin to syn-
thesise vitamin D. This is more evident in girls than in boys,
especially among Muslim girls whose headscarves and long
dresses generally allow for greater body coverage and may
explain in part the finding that more girls exhibited a poorer
vitamin D status than boys.
Dietary intake of Malaysian children
The energy and macronutrient intakes of boys were higher
than those of girls in the present study, whereas micronutrient
intakes were quite similar between both the sexes, with the
exception of Ca intake in youngest age groups and Fe and
vitamin C intakes in the other age groups. The sex differences
in energy and macronutrient intakes could be explained by
the food choices and preferences of boys and girls, where
boys preferred high-energy-dense foods compared with the
girls. A study among 4205 children aged 9–12 years has
reported that less desirable foods such as pre-sugared cereals,
cakes, confectionery, burgers and sausages were eaten more
by boys than by girls(72). Besides that, Cooke & Wardle(73)
also concluded that boys like fatty and sugary foods, meat,
processed meat products and eggs more than girls do.
The dietary intake levels of rural children among the infant
and pre-schooler groups appeared to be better than those of
their urban counterparts. However, in the oldest age group,
the micronutrient intakes of rural girls such as Fe, vitamins A
and D intakes, were significantly lower than those of the
urban girls. Inadequate consumption of nutrient-dense foods
among the rural girls may be one of the contributing factors
for this phenomenon. This finding is in agreement with that
of a study on 667 Korean children aged 7–12 years that
reported that dietary intakes of calories, Fe and niacin in the
rural areas were lower than those in the urban areas(74).
Overall, the dietary intake of the children was not compatible
with that recommended by the Malaysian RNI, especially for Ca
and vitamin D. Vitamin D and Ca intakes of about 50 % of the
children were below the recommendations. The percentage of
children who did not achieve the Malaysian RNI for Ca was
higher among the school-aged children than among infants
and toddlers. This percentage of inadequate intake was found
to be higher than the 17–35 % found in previous studies(75,76).
Milk as one of the food sources rich in Ca and vitamin D is the
dominant food for infants and toddlers. The low Ca and vitamin
D intakes across the age group may be related to a reduction in
milk consumption(77).
The percentage of rural girls in the oldest age group who
did not achieve the Malaysian RNI for Fe was significantly
higher than that of the boys. The lower intake of Fe in 7–12-
year-old girls was found to match with the higher prevalence
of Fe deficiency in this age group found in the present study.
Moreover, the onset of menarche usually occurring between
10 and 12 years may partially explain the higher prevalence
of Fe deficiency in the older girls(78). However, differences in
food choices could be one of the contributing factors. In the
present study, girls may have consumed foods with a lower
bioavailability of Fe when compared with the boys and
hence may have an increased risk of anaemia. Besides, food
choices of older girls may also have been affected by factors
such as body image and diet control, which are unfavourable
for their nutrient and energy intakes(79).
Strengths and limitations
SEANUTS Malaysia has several strengths. Topmost among the
strengths is the fact that this survey is comprehensive and
measured a broad range of nutrition-related parameters.
Apart from those reported in the present paper (anthropome-
try, blood biochemistry and dietary parameters), physical
activity, bone health, blood pressure, cognitive development,
child health, child food habits, including breast-feeding and
complementary feeding in younger children, as well as fatty
acid profile and many other blood biochemical parameters(24)
Table 9. Percentage of subjects not achieving Malaysian Recommended Nutrient Intake recommendations of macronutrients and micronutrients byage group and area of residence
0·5–0·9 years 1·0–3·9 years 4·0–6·9 years 7·0–12 years All
Boys Girls All Boys Girls All Boys Girls All Boys Girls All Boys Girls All
UrbanEnergy 33·4 41·6 37·4 33·8†† 29·6 31·8 35·3 38·1 36·7 39·7* 31·7 35·7 37·1 33·0 35·1Protein – 16·1 7·8 1·6 3·4 2·4 0·4 1·4 0·9 0·6 1·2 0·9 2·1 2·9† 2·5Ca 19·3 14·5 17·0 25·2 29·7 27·4 43·4† 43·5 43·5 63·4 66·6 65·0 48·5 51·4 49·9Fe 62·9† 64·7 63·8 11·1† 5·6 8·4 1·0 1·8 1·4 12·8 10·1 11·5 11·0 8·7 9·9Vitamin C – – – 7·3 3·6 5·5 4·0 4·1 4·0 13·4* 8·9 11·2 9·3* 6·4 7·9Vitamin A – 5·0 2·4 7·7 10·1†† 8·9 9·1 8·4 8·8 4·3 3·1 3·7 6·1 6·0 6·0Vitamin D 45·4 28·3 37·1 35·6 38·9 37·2 51·6 51·2 51·4 52·0 52·6 52·3 48·0 48·5 48·3
RuralEnergy 8·4 40·2 26·2 21·3 11·0 16·1 29·6 26·9 28·1 40·8 36·8 38·9 32·7 27·2 30·0Protein – – – 0·4 0·8 0·6 0·4 0·9 0·6 1·2 1·7 1·4 0·8 1·4 1·1Ca 5·0 7·9 6·6 24·0 19·1 21·5 33·3 44·9 39·5 66·2 74·8 70·3 47·2 51·1 49·1Fe 19·0 34·3 27·6 2·5 2·2 2·4 2·1 4·4 3·3 13·2 18·0† 15·5 8·1 10·6 9·3Vitamin C – – – 1·7 1·3 1·5 1·8 5·6* 3·8 12·1 13·6 12·8 7·0 8·1 7·5Vitamin A 5·0 – 2·2 4·3 2·1 3·2 3·9 11·0*† 7·7 10·2†† 9·6††† 9·9 7·2 7·6 7·4Vitamin D 11·7 17·8 15·1 32·7 29·3 31·0 42·5 52·5 47·9 59·9 66·7†† 63·2 48·3 52·0 50·1
Mean values were significantly different between the sexes by stratum based on complex sample logistic regression adjusted for age: *P,0·05.Mean values were significantly different between the strata by sex based on complex sample logistic regression adjusted for age: †P,0·05; ††P,0·01; †††P,0·001.
B. K. Poh et al.S32
British
Journal
ofNutrition

were assessed in a nationally representative sample. The methods
used in the present study were developed and pre-tested
rigorously and validated to ensure a sound methodology and to
enable comparison across the four countries.
This is the first study carried out in Malaysia, and among the
few in the literature(17,26,50), to cover a wide paediatric age
range from 6 months to 12 years old. The present study pro-
vides a valuable database and adds to the scanty literature
on the nutritional status of Malaysian infants and children.
A limitation of this survey is the small number of infants
recruited. This may be due to the fact that the parents of
young children are more anxious and concerned about the
welfare of their infants and are less likely to provide consent
for participation. Consequently, the sample for young children,
especially infants, was slightly smaller in proportion than the
population. Additionally, it was also very difficult to obtain
parental consent for blood collection from children aged
,4 years. Hence, we had only sixteen children aged 2–3·9
years who gave blood, and we had to omit them from the data
analysis. Another limitation is the overestimation of portion
sizes in dietary assessment, as the FFQ was proxy-reported by
the mothers or main carers. Some mothers had difficulty in esti-
mating the portion sizes of the foods consumed by their chil-
dren(80,81). Hence, dependence on third parties (carers or
mothers) to report the intakes of the children may have led to
a biased estimation of portion sizes(82).
In conclusion, SEANUTS Malaysia has provided an enor-
mous amount of important data regarding the nutritional
status of children aged 12 years. On the whole, the findings
of the present study reveal that both sides of malnutrition
exist among the children of Malaysia. However, overnutrition
is more prevalent than undernutrition. While micronutrient
deficiencies, such as anaemia and vitamin A deficiency,
appear to be lower than those reported previously, vitamin
D insufficiency is highly prevalent in both the sexes and
both urban and rural areas and affects nearly half of the child-
hood population of Malaysia. Dietary intakes of Ca, vitamin D
and energy are also of concern, where nearly half of the popu-
lation did not achieve the Malaysian RNI for Ca and vitamin D
and more than 30 % did not achieve the energy recommen-
dations. The results of this survey provide the much-needed
information for the planning and implementation of the
National Plan of Action for Nutrition in Malaysia. Strategies
for improving the nutritional status of Malaysian children
cannot remain focused only on undernutrition; they also
need to put emphasis on approaches for the prevention of
overweight and obesity as well as vitamin D insufficiency.
Acknowledgements
The study was funded by Royal FrieslandCampina Innovation
(UKM-Dutch Lady Project Code: NN-072-2009). The authors
thank all the subjects and their parents for their participation
and cooperation during the course of the present study.
They are grateful to the school principals, teachers and admin-
istrators for their support and assistance. The researchers, data
collection team, enumerators and all those involved in this
project are acknowledged and much appreciated for their
effort and dedication. They are also grateful to Nguyen Thu
Ha and Ang Yeow Nyin for their assistance in data analysis
and, last but not the least, also to Paul Deurenberg for his
invaluable advice throughout the project.
The authors’ contributions were as follows: B. K. P., M. D. S.
H., S. N. S., J. E. W., A. K. N., S. B. B., A. T. R. and L. O. N.
conceived and designed the study; B. K. P., B. K. N., M. D. S.
H., S. N. S. and I. K. analysed and interpreted the data, as well
as drafted and revised the manuscript. All authors
critically reviewed and approved the final version of the manu-
script for publication. The authors declare no known conflicts of
interest. Any opinions, findings, conclusions or recommen-
dations expressed in this publication are those of the authors
and do not necessarily reflect the views of FrieslandCampina.
This paper was published as part of a supplement to the
British Journal of Nutrition, the publication of which was
supported by an unrestricted educational grant from Royal
FrieslandCampina. The papers included in this supplement
were invited by the Guest Editor and have undergone the
standard journal formal review process. They may be cited.
The Guest Editor appointed to this supplement is Dr Panam
Parikh. The Guest Editor declares no conflict of interest.
References
1. Popkin BM (2001) Nutrition in transition: the changingglobal nutrition challenge. Asia Pac J Clin Nutr 10, S13–S18.
2. Popkin BM (2011) Contemporary nutritional transition:determinants of diet and its impact on body composition.Proc Nutr Soc 70, 82–91.
3. Popkin BM, Adair LS & Ng SW (2012) Global nutrition tran-sition and the pandemic of obesity in developing countries.Nutr Rev 70, 3–21.
4. Caballero B (2002) Global patterns of child health: the roleof nutrition. Ann Nutr Metab 46, Suppl. 1, 3–7.
5. Uauy R, Kain J, Mericq V, et al. (2008) Nutrition, childgrowth, and chronic disease prevention. Ann Med 40,11–20.
6. Khambalia AZ, Lim SS, Gill T, et al. (2012) Prevalence andsociodemographic factors of malnutrition among childrenin Malaysia. Food Nutr Bull 33, 31–42.
7. Khor GL & Zalilah MS (2003) Dual forms of malnutritionin the same households in Malaysia – a case study amongMalay rural households. Asia Pac J Clin Nutr 12, 427–438.
8. World Health Organization (2010) World Health Statistics2010. Geneva: WHO. http://www.who.int/whosis/whostat/2010/en/index.html.
9. World Health Organization (2012) World Health Statistics 2012.Geneva: WHO. http://www.who.int/gho/publications/world_health_statistics/2012/en/index.html.
10. World Health Organization (2009) Global Prevalence ofVitamin A Deficiency in Populations at Risk 1995–2005.WHO Global Database on Vitamin A Deficiency. Geneva:WHO.
11. World Health Organization (2008) Worldwide Prevalence ofAnaemia 1993–2005: WHO Global Database on Anaemia.Geneva: WHO.
12. Holick MF & Chen TC (2008) Vitamin D deficiency: a world-wide problem with health consequences. Am J Clin Nutr 87,Suppl., 1080S–1086S.
13. Bener A, Al-Ali M & Hoffmann GF (2009) High prevalence ofvitamin D deficiency in young children in a highly sunny
Nutritional status of Malaysian children S33
British
Journal
ofNutrition

humid country: a global health problem. Minerva Pediatr
61, 15–22.14. Gessner BD, Plotnik J & Muth PT (2003) 25-Hydroxyvitamin
D levels among healthy children in Alaska. J Pediatr 143,
434–437.15. Gilbert-Diamond D, Baylin A, Mora-Plazas M, et al. (2010)
Vitamin D deficiency and anthropometric indicators of adi-
posity in school-age children: a prospective study. Am J
Clin Nutr 92, 1446–1451.16. Khor GL, Chee WSS, Shariff ZM, et al. (2011) High preva-
lence of vitamin D insufficiency and its association with
BMI-for-age among primary school children in Kuala
Lumpur, Malaysia. BMC Public Health 11, 95.17. Khor GL, Noor Safiza MN, Jamalludin AB, et al. (2009) Nutri-
tional status of children below five years in Malaysia: anthro-
pometric analyses from the Third National Health and
Morbidity Survey III (NHMS, 2006). Mal J Nutr 15, 121–136.18. Ismail MN, Ruzita AN, Norimah AK, et al. (2009) Prevalence
and trends of overweight and obesity in two cross-sectional
studies of Malaysia children, 2002–2008. In MASO 2009
Scientific Conference on Obesity: Obesity and Our Environ-
ment, 12–13 August 2009, Kuala Lumpur.19. UNICEF (2010) Nutrition Country Profile for Malaysia. http://
www.childinfo.org/country_profiles.php?input¼90
(accessed May 2012).20. Hasan I, Zulkifle M & Ansari AH (2011) An assessment
of nutritional status of the children of government Urdu
higher primary schools of Azad Nagar and its surrounding
areas of Bangalore. Arch Appl Sci Res 3, 167–176.21. Albertson AM & Tobelmann RC (1993) Ten-year trend of
energy intakes of American children ages 2 ^ 10 years.
Ann N Y Acad Sci 699, 250–252.22. Brady LM, Lindquist CH, Herd SL, et al. (2000) Comparison
of children’s dietary intake patterns with US dietary guide-
lines. Br J Nutr 84, 361–367.23. World Health Organization (1966) The Assessment of the
Nutritional Status of the Community. Monograph Series no.
53. Geneva: WHO.24. Schaafsma A, Deurenberg P, Calame W, et al. (2013) Design of
theSouthEastAsianNutritionSurvey: a four countrymulti-stage
cluster design study. Br J Nutr 110, S2–S10.25. World Health Organization (1986) Sample Size Determi-
nation: A User’s Manual. Geneva: WHO.26. Institute for Public Health (2008) Nutritional Status. Report
of the Third National Health and Morbidity Survey 2006
(NHMS III). Kuala Lumpur: IPH, Ministry of Health.27. Department of Statistics Malaysia (2010) Population, House-
hold and Living Quarters, Malaysia 2010. Putrajaya:
Department of Statistics.28. Ministry of Education Malaysia (2010) Malaysia Educational
Statistics 2010. Putrajaya: Ministry of Education.29. Marfell-Jones M, Olds T, Stewart A, et al. (2006)
International Standards for Anthropometric Assessment.
Potchefstroom: International Society for the Advancement
of Kinanthropometry (ISAK).30. World Health Organization (2006) WHO Child Growth
Standards. Geneva: WHO. http://www.who.int/childgrowth
(accessed October 2010).31. World Health Organization (2007) Growth Chart for Children
5–19 years. Geneva: WHO. http://www.who.int/growthref/
en/ (accessed October 2010).32. World Health Organization (2010) WHO Anthro for Personal
Computers Manual: Software for Assessing Growth and
Development of the World’s Children. Geneva: WHO.
33. World Health Organization (2009) WHO AnthroPlus forPersonal Computers Manual: Software for Assessing Growthof the World’s Children and Adolescents. Geneva: WHO.
34. World Health Organization (2001) Iron Deficiency Anaemia:Assessment, Prevention, and Control. Geneva: WHO.
35. World Health Organization (2011) Haemoglobin Concen-trations for the Diagnosis of Anaemia and Assessmentof Severity. Vitamin and Mineral Nutrition InformationSystem. Geneva: WHO. http://www.who.int/vmnis/indicators/haemoglobin.pdf (accessed July 2011).
36. World Health Organization (2011) Serum Ferritin Concen-trations for the Assessment of Iron Status and Iron Deficiencyin Populations. Vitamin and Mineral Nutrition InformationSystem. Geneva: WHO. http://www.who.int/vmnis/indicators/serum_ferritin.pdf (accessed July 2011).
37. Misra M, Pacaud D, Petryk A, et al. (2008) Vitamin Ddeficiency in children and its management: review of currentknowledge and recommendations. Pediatrics 122, 398–417.
38. Ooi SY, Ng BK, Ong WW, et al. (2010) Development of foodfrequency questionnaire among infants in Malaysia. InAbstract and Poster Presented at 25th Scientific Conferenceof the Nutrition Society of Malaysia, 25–26 March2010, p. 132. Kuala Lumpur, Malaysia: Nutrition Society ofMalaysia.
39. Irma HA, Poh BK, Norimah AK (2011) Validation of proxy-reported food frequency questionnaires (FFQ) in assessingdietary intake among children aged 6 months to 23months. In Abstract and Poster Presentation at 26th Scienti-fic Conference of the Nutrition Society of Malaysia, 24–25March 2011, pp. 98–99. Kuala Lumpur, Malaysia: NutritionSociety of Malaysia.
40. Ho PS, Poh BK, Norimah AK, et al. (2011) Validation ofproxy-reported food frequency questionnaire to assess diet-ary intake among children aged 2 to 6 years old. In Abstractand Poster Presentation at 26th Scientific Conference ofthe Nutrition Society of Malaysia, 24–25 March 2011, p. 98.Kuala Lumpur, Malaysia: Nutrition Society of Malaysia.
41. Fatihah F, Ng BK, Ong WW, et al. (2011) Development offood frequency questionnaire for Malaysian children aged7–9 years. In Abstract and Poster Presented at 25th ScientificConference of the Nutrition Society of Malaysia, 25–26March 2010, p. 117. Kuala Lumpur, Malaysia:Nutrition Society of Malaysia (Won the First Prize in thePoster Competition).
42. Hazwanie H, Poh BK, Norimah AK (2011) Validation of foodfrequency questionnaire for dietary intake assessmentamong children aged 7–12 years old. In Abstract andPoster Presentation at 26th Scientific Conference ofthe Nutrition Society of Malaysia, 24–25 March 2011,pp. 97–98. Kuala Lumpur, Malaysia: Nutrition Society ofMalaysia.
43. Tee ES, Ismail MN, Nasir MA, et al. (1997) Nutrient Compo-sition of Malaysian Foods, 4th ed. Kuala Lumpur: Institutefor Medical Research.
44. Department of Nutrition (2000) The Composition of FoodsCommonly Eaten in Singapore 2000. Singapore: Ministryof Health.
45. Taki M, Mizuno K, Murase M, et al. (2010) Maturationalchanges in the feeding behaviour of infants – a comparisonbetween breast-feeding and bottle-feeding. Acta Paediatr99, 61–67.
46. Puwastien P, ASEAN Network of Food Data System (2000)ASEAN Food Composition Tables. Bangkok, Thailand: Insti-tute of Nutrition, Mahidol University.
47. Chong YM, Poh BK, Ng BK, et al. (2011) Developmentof Nutrient Calculator for Children’s Food Frequency
B. K. Poh et al.S34
British
Journal
ofNutrition
Questionnaire. In Abstract and Poster Presentation at 26thScientific Conference of the Nutrition Society of Malaysia,24–25 March 2011, pp. 91–92. Kuala Lumpur, Malaysia:Nutrition Society of Malaysia.
48. National Coordinating Committee on Food and Nutrition(2005) Recommended Nutrient Intakes of Malaysia. AReport of the Technical Working Group on NutritionalGuidelines. Putrajaya: Ministry of Health Malaysia.
49. Smith LC, Ruel MT & Ndiaye A (2005) Why is child malnu-trition lower in urban than in rural areas? Evidence from 36developing countries. World Dev 33, 1285–1305.
50. Institute for Public Health (2011) Non Communicable Dis-eases. Report of the National Health and Morbidity Survey2011 (Volume II). Kuala Lumpur: IPH, Ministry of Health.
51. Kuczmarski RJ, Ogden CL, Guo SS, et al. (2000) CDC growthcharts for the United States: methods and development.National Center for Health Statistics. Vital Health Stat 11,1–190.
52. Mei Z, Ogden CL, Flegal KM, et al. (2008) Comparison of theprevalence of shortness, underweight, and overweightamong US children aged 0 to 59 months by using the CDC2000 and the WHO 2006 growth charts. J Pediatr 153,622–628.
53. Ruzita AT, Nurunnajiha N, Wong JE, et al. (2009) NutritionalStatus and Dietary Habits of Primary School Children inPeninsular Malaysia: Comparison of the 2001/02 Surveywith the 2007/08 Survey. Report for UKM-Nestle ResearchProject. Kuala Lumpur: Universiti Kebangsaan Malaysia.
54. Khor GL (2002) Micronutrient deficiency and its alleviation:the case of Malaysia. Asia Pac J Clin Nutr 11, S377–S381.
55. Ngui R, Lim YAL, Liam CK, et al. (2012) Association betweenanaemia, iron deficiency anaemia, neglected parasitic infec-tions and socioeconomic factors in rural children of WestMalaysia. PLoS Negl Trop Dis 6, e1550.
56. Nor Aini U, Al-Mekhlafi HM, Azlin M, et al. (2007) Serumiron status in Orang Asli children living in endemic areasof soil-transmitted helminths. Asia Pac J Clin Nutr 16,724–730.
57. Al-Mekhlafi MH, Surin J, Atiya AS, et al. (2008) Anaemia andiron deficiency anaemia among aboriginal school childrenin rural Peninsular Malaysia: an update on a continuingproblem. Trans R Soc Trop Med Hyg 102, 1046–1052.
58. Thurlow RA, Winichagoon P, Green T, et al. (2005) Only asmall proportion of anemia in northeast Thai school childrenis associated with iron deficiency. Am J Clin Nutr 82,380–387.
59. Nhien NV, Khan NC, Ninh NX, et al. (2008) Micronutrientdeficiencies and anemia among preschool children in ruralVietnam. Asia Pac J Clin Nutr 17, 48–55.
60. Rokiah D (2009) Children nutrition policies and programmesin the Ministry of Health Malaysia. Mal J Nutr 15, S2.
61. Khor GL (2005) Micronutrient status and intervention pro-grams in Malaysia. Food Nutr Bull 26, Suppl. 2, S281–S285.
62. Ministry of Health (2000) Hemoglobin and Serum RetinolLevel Amongst Children Under 5 Years of Age. Report of aMOH-UNICEF Study. Kuala Lumpur: Division of FamilyHealth Development.
63. Al-Mekhlafi HM, Surin J, Sallam AA, et al. (2010) Giardiasisand poor vitamin A status among aboriginal school childrenin rural Malaysia. Am J Trop Med Hyg 83, 523–527.
64. World Health Organization (1996) Indicators for AssessingVitamin A Deficiency and Their Application in Monitoringand Evaluation Intervention Programmes. Geneva: WHO.
http://www.who.int/nutrition/publications/micronutrients/vitamin_a_deficiency/WHONUT96.10.pdf.
65. Mai TT, Hung NK, Kawakami M, et al. (2003) Micronutrientstatus of primary school girls in rural and urban areas ofSouth Vietnam. Asia Pac J Clin Nutr 12, 178–185.
66. Hadi H, Stoltzfus RJ, Dibley MJ, et al. (2000) Vitamin Asupplementation selectively improves the linear growth ofIndonesian preschool children: results from a randomizedcontrolled trial. Am J Clin Nutr 71, 507–513.
67. Chailurkit L, Aekplakorn W & Ongphiphadhanakul B (2011)Regional variation and determinants of vitamin D status insunshine-abundant Thailand. BMC Public Health 11, 853.
68. Marwaha RK, Tandon N, Reddy DRHK, et al. (2005) VitaminD and bone mineral density status of healthy schoolchildrenin northern India. Am J Clin Nutr 82, 477–482.
69. Mansour MMHK & Alhadidi KM (2012) Vitamin D deficiencyin children living in Jeddah, Saudi Arabia. Indian J Endocri-nol Metab 16, 263–269.
70. Ismail MN, Norimah AK, Ruzita AT, et al. (2003) NutritionalStatus and Dietary Habits of Primary School Children inPeninsular Malaysia. Final Report for UKM-Nestle ResearchProject. Kuala Lumpur: Universiti Kebangsaan Malaysia.
71. Holick MF (1995) Environmental factors that influence thecutaneous production of vitamin D. Am J Clin Nutr 61,638S–645S.
72. Hackett AF, Gibbon M, Sratton G, et al. (2002) Dietary intakeof 9–10-year-old and 11–12-year-old children in Liverpool.Public Health Nutr 5, 449–455.
73. Cooke LJ & Wardle J (2005) Age and gender differences inchildren’s food preferences. Br J Nutr 93, 741–746.
74. Kim SH, Kim JY & Keen CL (2005) Comparison of dietarypatterns and nutrient intakes of elementary schoolchildrenliving in remote rural and urban areas in Korea: their poten-tial impact on school performance. Nutr Res 25, 349–363.
75. Muhammad Faiz AA & Naleena Devi M (2012) Nutritionalstatus and eating practices among children aged 4–6 yearsold in selected urban and rural kindergarten in Selangor,Malaysia. Asian J Clin Nutr 4, 116–131.
76. Elias SM, Hashim Z, Marjan ZM, et al. (2007) Relationshipbetween blood lead concentration and nutritional statusamong Malay Primary School Children in Kuala Lumpur,Malaysia. Asia Pac J Public Health 19, 29–37.
77. Du XQ, Greenfield H, Fraser DR, et al. (2002) Milk consump-tion and bone mineral content in Chinese adolescent girls.Bone 30, 521–528.
78. Thane CW, Batesa CJ & Prentice A (2002) Menarche andnutritional status in pubescent British girls. Nutr Res 22,423–432.
79. Nowak M (1998) The weight-conscious adolescent: bodyimage, food intake, and weight-related behaviour. J AdolescHealth 23, 389–398.
80. Reinaerts E, de Nooijer J & de Vries NK (2007) Parentalversus child reporting of fruit and vegetable consumption.Int J Behav Nutr Phys Act 4, 33.
81. Klohe DM, Clarke KK, George GC, et al. (2005) Relativevalidity and reliability of a food frequency questionnairefor a triethnic population of 1-year-old to 3-year-old childrenfrom low income families. J Am Diet Assoc 105, 727–734.
82. Sherwood NE (2008) Diet assessment in children and adoles-cents. In Handbook of Childhood and Adolescent Obesity,pp. 73–89 [E Jejalian and RG Steele, editors]. Minneapolis:Health Partners Foundation.
Nutritional status of Malaysian children S35
British
Journal
ofNutrition
Related Documents


