5862 Volume 12 No. 2 April 2012 NUTRITIONAL AND HEALTH STATUS OF PRIMARY SCHOOLCHILDREN IN RURAL UGANDA Acham H 1* Kikafunda JK 2 , Tylleskar T 3 and MK Malde 4 Hedwig Acham *Corresponding author E-mail: [email protected] 1 Department of Science, Technical & Vocational Education, Makerere University, Box 7062, Kampala, Uganda. 2 Department of Food Science and Technology, Makerere University, Box 7062, Kampala, Uganda. 3 Centre for International Health, University of Bergen, N-5021, Bergen-Norway. 4 National Institute of Nutrition and Seafood Research (NIFES), Nordnes N-5817, Bergen, Norway.

Welcome message from author
This document is posted to help you gain knowledge. Please leave a comment to let me know what you think about it! Share it to your friends and learn new things together.
Transcript
5862
Volume 12 No. 2 April 2012
NUTRITIONAL AND HEALTH STATUS OF PRIMARY SCHOOLCHILDREN IN RURAL UGANDA
Acham H1* Kikafunda JK2, Tylleskar T3 and MK Malde4
Hedwig Acham
*Corresponding author E-mail: [email protected] 1Department of Science, Technical & Vocational Education, Makerere University, Box 7062, Kampala, Uganda. 2Department of Food Science and Technology, Makerere University, Box 7062, Kampala, Uganda. 3Centre for International Health, University of Bergen, N-5021, Bergen-Norway. 4National Institute of Nutrition and Seafood Research (NIFES), Nordnes N-5817, Bergen, Norway.
5863
Volume 12 No. 2 April 2012
ABSTRACT Poor nutrition and health can affect children’s education. The nutritional status of school children (9-15 years) was assessed in Kumi district, Eastern Uganda in 2006-2007. Selection of schools was done using modified cluster sampling involving 34 schools (n= 645). Assessments for nutritional status were done anthropometrically (height and weight), biochemically (iron, n=145; iodine, n=87; and vitamin A, n=145) and assessment for health status was done following the formal ether concentration technique for examination for intestinal helminths (n=189) and a quick malaria (n=119) test for malaria parasites. Prevalence rates for stunting, underweight and thinness were 8.7% (95CI 6.7-11.1); 13.0% (95CI 10.6-15.8); and 10.1% (95CI 7.9-12.6), respectively of which males and the older age group of children were more affected. Prevalence rates for iodine deficiency, anaemia, iron deficiency and vitamin A deficiency (VAD) were 3.4% (95CI 0.9-9.1); 24.1% (95CI 17.7-31.6); 82.1% (95CI 75.2-87.7); and 30.3% (95CI 23.3-38.2), respectively. Anaemia (measured as haemoglobin status), iron deficiency (measured as serum Ferritin) and VAD (measured as serum retinol) were higher among females (26.3%, 95CI 17.5-36.7; 83.8%, 95CI 74.4-90.7; 33.8%, 95CI 24.0-44.6) compared to males (21.5%, 95CI 12.8-32.8; 80%, 95CI 69.0-88.4; 26.2%, 95CI 16.6-37.8). Geohelminth (S.mansoni & N.americanus) and malaria parasitemia were 4.8% and 46.2%, respectively. Prevalence rates for stunting, iodine deficiency and geohelminth infections were low. The high prevalence rates of wasting/thinness, underweight, iron and vitamin A deficiencies show these as significant public health problems among school children in Kumi district. There is a need to focus attention on nutritional and health conditions of school children to improve their conditions. Much can be done to prevent malaria infection by promoting the use of Insecticide Treated Nets and chemoprophylaxis. The biennial dosage with albendazole for deworming, and universal use of iodized salt in Uganda are success stories that should continue; iron deficiency anaemia can be controlled through nutrition education, provision of nutritious school meals coupled with control of malaria and deworming. Since many children attend school, such services if delivered through school systems would assist those school children who most need them. Key words: Nutrition, Health, School children, Uganda
5864
Volume 12 No. 2 April 2012
INTRODUCTION Of the world’s undernourished children, 80% live in 20 countries, among which is Uganda [1]. It is estimated that malnutrition directly and indirectly contributes up to 60% of child mortality, making malnutrition one of the most significant contributors to childhood mortality in the country [2]. The latest Uganda Demographic and Health report indicates that nearly 38% of Ugandan children below 5 years are stunted, 6% are wasted and 16% are underweight [3], which puts Uganda among the few countries with the highest malnutrition rates [4]. Micronutrient deficiencies including iron, iodine, vitamin A and of recent zinc, are a major component of this malnutrition and most efforts to alleviate micronutrient deficiency in Uganda have mostly focused on the first three as key micronutrients [5]. The health of school children in Uganda, however, is not well documented. Malaria remains one of the most common causes of absenteeism from school while such health related factors account for more than 50% of school drop-outs [6]. In Uganda today, access to primary education has increased to over 7.3 million with the girl-child being the greatest beneficiary. Completion rates have also increased from 49.1% in 2002 to 62% (2004) but with more boys than girls [7]. However, limited information on nutrition and health is available on this age group despite the reported massive enrolments. It is, therefore, important that data on nutritional and health status of this age group are documented, in order to create awareness to education and health planners, who can use this information to plan for these children so as to enable them get a better future as they engage in their learning. Thus, this paper reports on nutritional and health status of primary school children in Kumi district (Eastern Uganda) in 2006-2007. SUBJECTS, MATERIALS AND METHODS The study was carried out in Kumi District, a rural district in Eastern Uganda, about 350km North-East of Kampala and halfway between Mbale and Soroti. The district covers approximately 1,800 sq km, of which a fifth is covered by water bodies, swamps and wetlands. The total population according to the 2005 housing and population census was about 267,000 persons of which 52% were female, and 48% were male [8] while over half of the population (56%) were children below 18 years. The fertility rate remains very high (7.4) and thus the 2007 projection for the district was 330,000 persons. By end of 2005, the primary school enrolment for the district was 93%, of which 51% were girls and 49% boys [7]. Agriculture remains the main economic activity with 93% of the households engaged in farming, mainly subsistence farming [8]. Over 70% of agricultural labour force is
5865
Volume 12 No. 2 April 2012
provided by women and yet only 30% of them have access to and control over means of production [8]. It remains one of the poorest districts with a Human Development Index of 0.423 compared to the highest recorded for Kampala (0.615), the capital city of Uganda. The district has also a human poverty index of 36.9 [9]. Selection The selection of schools was done using a modification of 30x30 cluster sampling design using Probability Proportional to Size (PPS) as described in WFP/CDC [10]. There were no accurate estimates of children in the target class (grade 4) available at the beginning of the year 2006 that could be used in the sampling procedure. Therefore, enrolment figures for the previous year had to be used to derive the clusters and a sampling interval. Fourth grade was purposively selected, being a pivotal bench mark in students learning [11]. Modification was, therefore, done by selecting only grade 1 public mixed-gender day schools (54 in total), which had enrolment figures greater than 700. From this list, the PPS cluster sampling procedure above was then applied to obtain 34 schools, using the total enrolment figure of 46,474 children for the target class in the 54 schools for the year 2005, and a derived class interval of 1,366. In each school, grade 4 class was purposively selected and in this class, numbers were handed out to all present pupils, in their order of sitting. Using a hand held computer, random numbers were generated and children whose numbers were selected were enrolled to participate in the study. Out of a total sample of 34 x 30 = 1020 children, 10 children were above 15 years, while 365 children and parents either declined participation or opted to drop out of the study. A total of 645 children had complete information on all variables (demographic and socio-economic variables, academic achievement and anthropometry).
5866
Volume 12 No. 2 April 2012
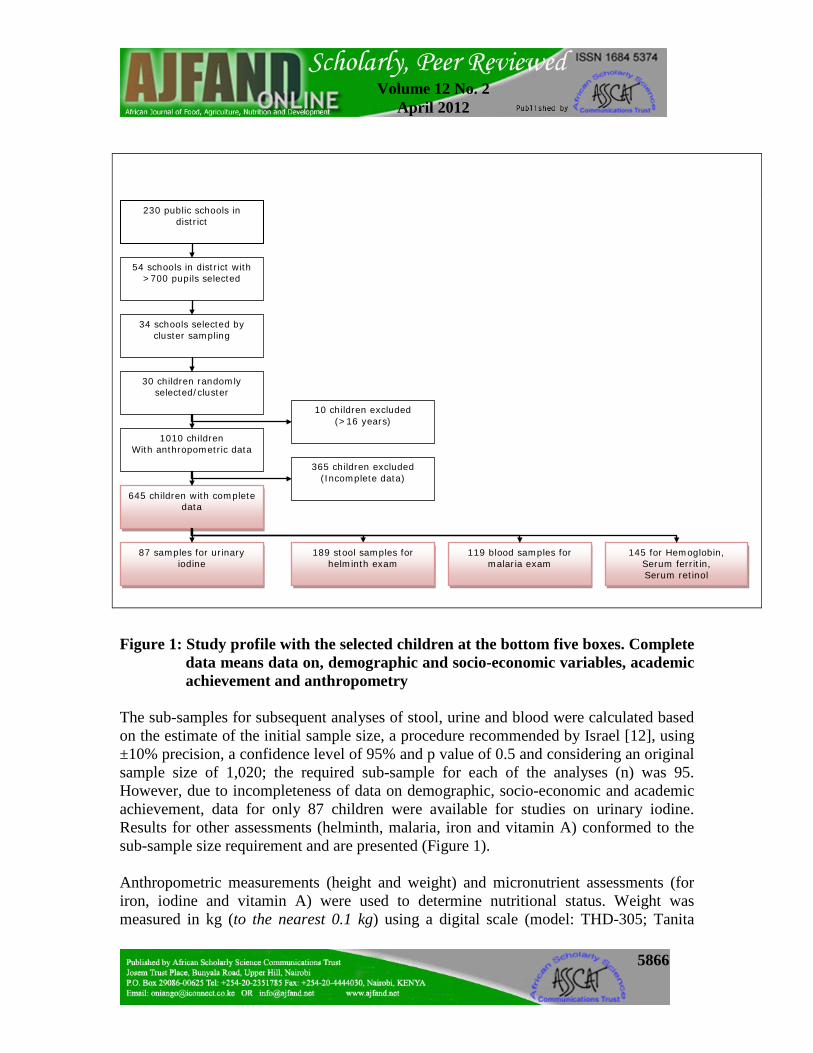
Figure 1: Study profile with the selected children at the bottom five boxes. Complete
data means data on, demographic and socio-economic variables, academic achievement and anthropometry
The sub-samples for subsequent analyses of stool, urine and blood were calculated based on the estimate of the initial sample size, a procedure recommended by Israel [12], using ±10% precision, a confidence level of 95% and p value of 0.5 and considering an original sample size of 1,020; the required sub-sample for each of the analyses (n) was 95. However, due to incompleteness of data on demographic, socio-economic and academic achievement, data for only 87 children were available for studies on urinary iodine. Results for other assessments (helminth, malaria, iron and vitamin A) conformed to the sub-sample size requirement and are presented (Figure 1). Anthropometric measurements (height and weight) and micronutrient assessments (for iron, iodine and vitamin A) were used to determine nutritional status. Weight was measured in kg (to the nearest 0.1 kg) using a digital scale (model: THD-305; Tanita
54 schools in district with >700 pupils selected
34 schools selected by cluster sampling
189 stool samples for helminth exam
645 children with complete data
87 samples for urinary iodine
30 children randomly selected/cluster
10 children excluded (>16 years)
119 blood samples for malaria exam
145 for Hemoglobin, Serum ferritin, Serum retinol
1010 children With anthropometric data
365 children excluded (Incomplete data)
230 public schools in district
5867
Volume 12 No. 2 April 2012
Corporation, Tokyo, Japan). Children were measured wearing uniform as standard clothing. The average weight of school uniform (a school shirt and a short for boys 0.24 ± 0.04 kg (n=30) and a dress for girls 0.16 ± 0.05 kg (n=30), measured for 30 different schools was subtracted from the body weight of all children in the study. All weight measurement of children was done before lunch. Height was measured in cm (to the nearest 0.1 cm) by use of a height board (model: RI Woonsocket, Short Productions, Rhode Island USA). Anthropometric measurements were used to derive nutritional indices (weight-for-age z-score, height-for-age z-score and BMI-for-age z-score), which were used to characterize and categorize the children, following the assessment criteria of CDC/NCHS [13]. Iodine assessment was done in the field following Rendl et al. [14]. A semi-quantitative rapid test kit (3.01299.0001 UROJOD-Test-Merk, Germany) was used and estimation for iodine was done within 2 hours of urine collection. Levels of iodide concentration < 100 µg/l were regarded as iodine deficient as defined by WHO/UNICEF/ICCIDD [15]. A sample of 5 ml of blood was obtained from each child by venipuncture. The blood was collected in Vacutainer® tubes, after samples for tests of haemoglobin, malaria parasites and for preparation of dried serum and dried blood spots had been removed. Haemoglobin (Hb) was assessed in the field using a portable HemoCue machine (model: 201, Ängelholm, Sweden). Anaemia was defined as Hb <12.0 mg/l following WHO/UNICEF/UNU [16] and INACG [17] classification. A sample of 20 µL of whole blood was transferred directly onto blood collection cards (Whatman 903, Schleicher & Schuell bioscience; Ref. 10 539 859; GmbH, Germany) using micro capillary tubes, for preparation of dried blood spots (DBS). The DBS cards were immediately kept in a specially designed dark box and allowed to dry for 3 hours, and later put in Ziploc bags with a desiccant (minipax sorbent; 1-800-445-9890, Multisorb technologies Inc), kept in the designed dark box and transferred into an ice box, transported to the laboratory at Makerere University where they were kept in the freezer (4-6o C), until transportation for retinol analysis. Because of the rural field conditions, it was not possible to centrifuge the blood; instead blood was left to stand in darkness in the tubes overnight, which allowed for separation. After separation had been achieved, 20µL of serum was drawn using a capillary tube, spotted onto filter paper cards and left to dry for 3 hours. The DSS cards were put in Ziploc bags with a desiccant, kept at low temperatures (4-6o C) until transportation for serum ferritin analysis. Both assays of Dried Serum Spots and Dried Blood Spots were performed at Vitas AS Analytical Laboratory, Oslo, Norway. Serum ferritin was analyzed based on ELISA principles of assays as described by Addison et al. [18] and Miles [19], and modified according to specifications on the kit. The assay was done using AssayMax Ferritin ELISA kit (EF2003-1, MO-USA). Control
5868
Volume 12 No. 2 April 2012
serum spots were prepared in the laboratory, with some slight modifications made in volumes of stock and buffer used in standard preparation. Results were generated on a microplate reader (Multiskan Ascent, 15018820, version 1.3.2, Thermolab systems, Helsinki- Finland) at a wavelength of 450 nm. Adjustments were made for recovery and dilution by multiplying the serum concentrations obtained from the multiscan reader by the dilution factor of 10. Being an acute protein whose concentration can rise during inflammation, the customary threshold (<12-15 µg/L) was not used especially considering the fact that many of the children had malaria infection. The cut-off for serum ferritin was raised to 30µg/L following WHO/UNICEF/UNU [16]. Retinol assay was done by isocratic modification of Bieri’s High Performance Liquid Chromatography [20]. The modification was done by using a combination of high performance liquid chromatography and mass spectrometry (LC-MS assay principal). Whole blood retinol values were validated using the HPLC procedure following Bieri’s high performance liquid chromatography method, to adjust for recovery, storage effects and volume of serum used in preparation of DBS. A median factor of 1.07 was obtained for 11 serum samples, which was multiplied to all the whole blood retinol values to convert them to serum retinol equivalents. No adjustments were made for inflammation, as suggested by Filteau & Tomkins [21]. Therefore, serum retinol levels from laboratory assays were used after validating for recovery, storage effects and volumes, without correcting for inflammation. A serum retinol value < 0.70 µmol/L, set by WHO was used as cut off point to define Vitamin A deficiency [22]. Malaria infection was assessed using the malaria quick test for qualitative screening of Plasmodium falciparum in whole blood (341-025, Cypress diagnostics- Belgium). Those who tested positive for malaria antigen were given a 3-day dose of malaria treatment (Coartem 20/120). Geohelminth infection was assessed from a faeces sample following the formal ether concentration technique [23]. Presence of helminths, type, and infection rate (egg/gm) were recorded for each sample. Data analysis Data was entered using the statistical package for social sciences (SPSS version 15.0, 2006 SPSS Inc; Chicago, USA). Nutritional indices (HAZ; WAZ and BMI-for-age) were derived using Epiinfo Version 3.3.2 (Centers for Disease Control and Prevention, Atlanta Ga., USA), and categorized following the assessment criteria of CDC/NCHS [13]. Univariate analysis was done to get summary statistics (frequencies, means and standard deviations) of variables investigated. Bivariate associations were assessed using cross tabulations and t-tests.
5869
Volume 12 No. 2 April 2012
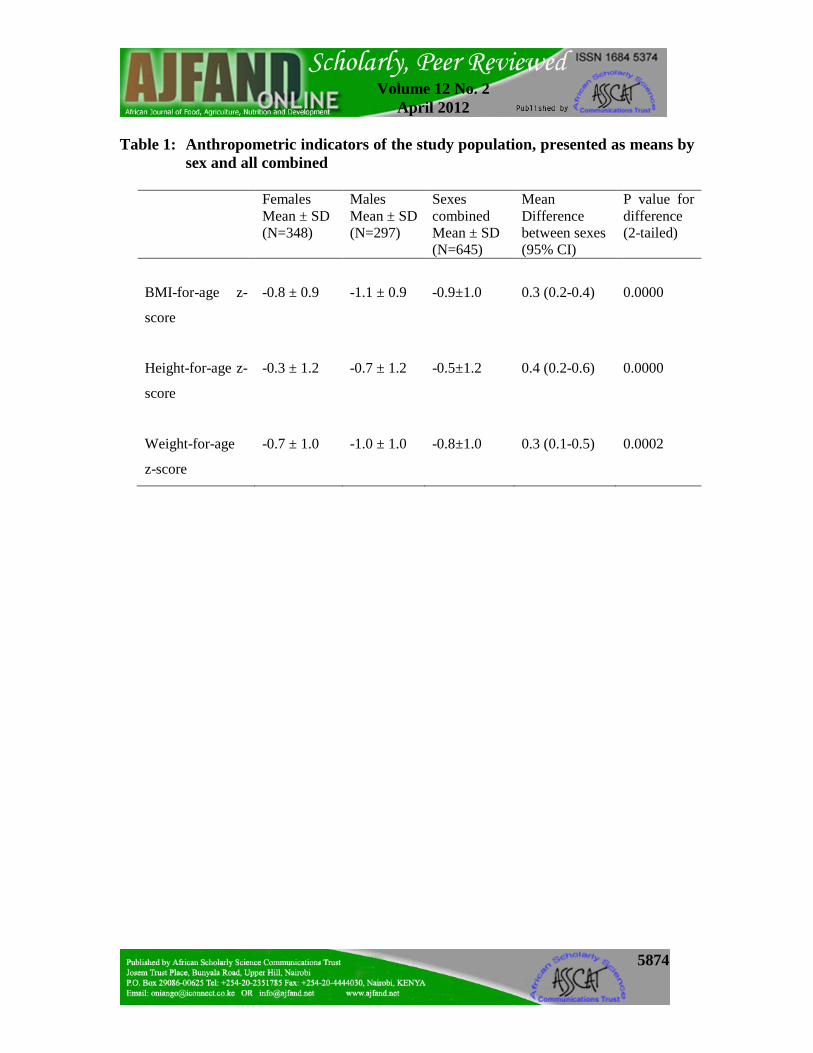
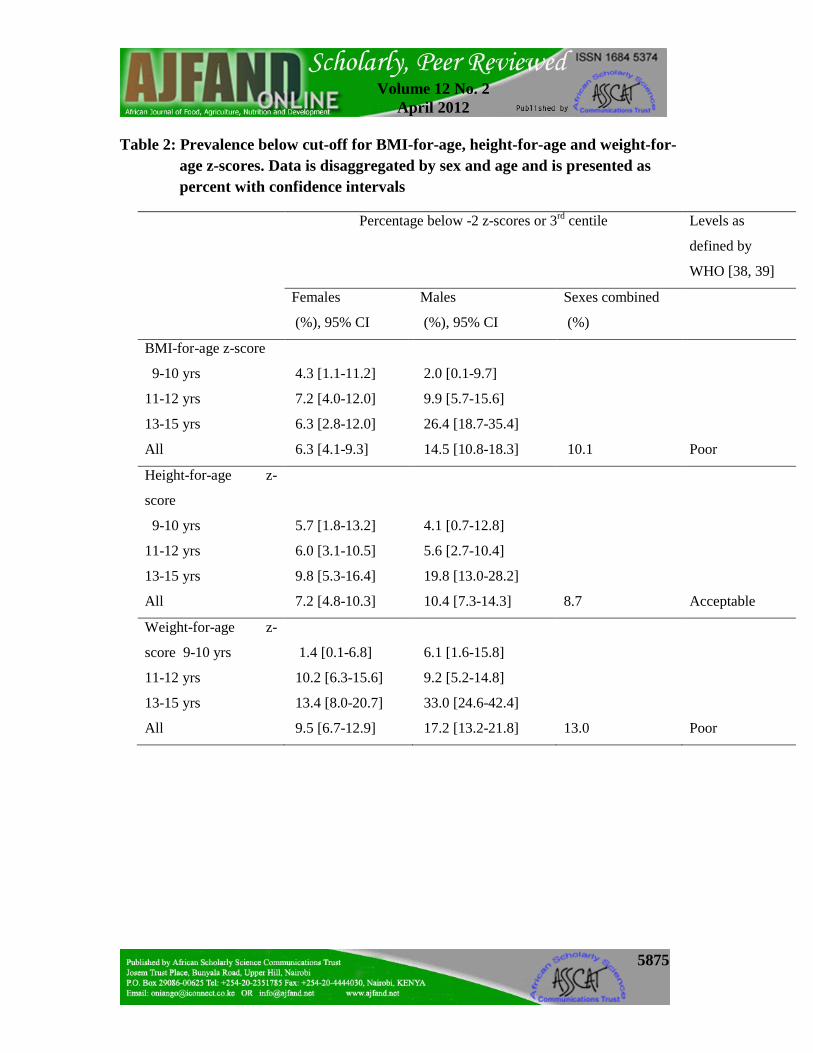
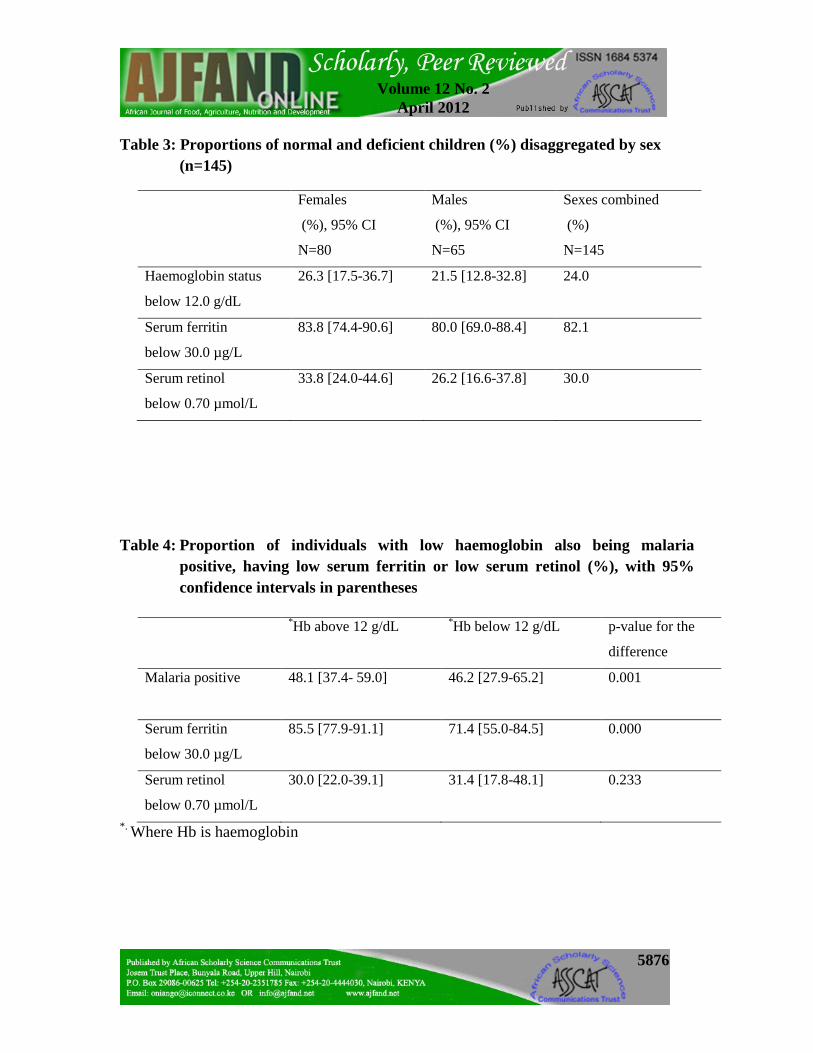
Ethical considerations Clearance to conduct the study in schools was obtained from the National Council for Science and Technology after the proposal was vetted and approved by Makerere University Ethical Committee based in Makerere University Medical School. Permission was also sought from the Ministry of Education and Sports (MOES) and the District Education Office (DEO), who then gave instructions to all head teachers in schools where the study was to be conducted. Written informed consent was further obtained from the parents and guardians and /or caretakers of all the children in class 4 and assent also from the children themselves. RESULTS Anthropometric measures Of the children assessed, 54% were female while 46% were male, of average age 12.2 years (12.1 ± 1.5 and 12.3 ± 1.6 for females and males, respectively). The means for BMI-for-age, height-for-age and weight-for-age z-scores for the study group were -0.9 ± 1.0; -0.5 ± 1.2 and -0.8 ± 1.0, respectively (Table 1). The means significantly differed between females and males (p<0.001), with females having slightly higher means in all anthropometric measures compared to the males (Table 1). The prevalence for the respective anthropometric measures indicated that 10.1%, 8.7% and 13.0% of the children, respectively were thin (wasted), stunted and underweight (Table 2). In all cases, the prevalence rates were significantly higher among males compared to the females (p<0.001, Table 1). Following the classification of World Health Organization (Table 2), levels of wasting and underweight in this study could be classified as poor compared to stunting. Micronutrient status Over all, 145 children were examined for micronutrient status (iron and vitamin A). The mean concentrations of haemoglobin, serum ferritin and serum retinol were 12.4 ± 1.0 g/dL; 22.8 ± 9.7 µg/L and 0.9 ± 0.3 µmol/L, respectively. The means for the different sexes were 12.3 ± 0.9 g/dL; 22.7 ± 9.5 µg/L; 0.9 ± 0.3 µmol/L and 12.7 ± 1.1 g/dL, 23.0 ± 10.0 µg/L, 0.9 ± 0.3 µmol/L of haemoglobin, serum ferritin and serum retinol for girls and boys, respectively. The prevalence of anaemia in the study group was 24.1%, low serum ferritin 82.1% and low serum retinol 30.3% (Table 3). There was no apparent difference in anaemia and iron deficiency between the two sexes as seen by the confidence intervals (26.3%, 95% CI 17.5-36.7 and 21.5%, 95% CI 12.8-32.8 for females and males, respectively). More than half (71.4%) of all the anaemia cases was associated with iron deficiency, and close to half (46.2%) was associated with malaria, with about one third (31.4%) being associated with vitamin A deficiency (Table 4). A test of difference between the two groups indicated that there was a significant difference for malaria and serum ferritin (p<0.05), but not for serum retinol (Table 4). Although the numbers affected by vitamin A deficiency were higher for the females (33.8%) compared
5870
Volume 12 No. 2 April 2012
to the males (26.2%), the confidence intervals indicated that there was no apparent difference between the two groups (Table 3). A low prevalence of iodine deficiency (2.6%) was found, indicating adequate iodine intake in the population. Health status Of the 189 children examined for intestinal parasites, only 4.8% children were found infected with intestinal parasites. By sex, 5.8% girls were infected compared to just 3.5% of the boys. There was no statistical difference shown in the rates of infection in the two groups. The parasites identified among the geohelminths were Giardia lamblia, Schistosoma mansoni and hookworm (Necator americanus). Of the 119 children tested for malaria parasitemia, close to half 46.2% were infected with malaria parasites. By sex, 43.9% girls were infected compared to 49.1% of the boys. DISCUSSION Anthropometry This study demonstrates that malnutrition exists even at school-age in Uganda. Stunting levels in this study group were generally better than those reported for children below 5 years in Uganda; however, the prevalence of stunting observed indicates that there is a spill-over of nutritional problems from childhood to school age. Compared to national and regional estimates, prevalence of wasting and underweight was higher (>10% prevalence), indicating a problem as well. Other studies have also reported similar rates among school children [24, 25, 26]. The findings on stunting were, however, lower than expected, agreeing with national data on stunting levels in Uganda, that are reportedly highest in northern and south western Uganda, while this study was conducted in eastern Uganda. Unlike stunting which arises from long-term under-nutrition, wasting and underweight often considered as composite measures of both acute and chronic under-nutrition, indicate that these are public health problems. The finding on wasting agrees with the findings of Uganda Demographic Health Surveys [3] that wasting levels in Uganda are high, and the levels are on the rise in all regions of the country. High disease burdens, resulting from malaria infection and other infections, as well as inadequate dietary intake are reportedly the cause. In the region where the study was conducted, there were no organized feeding programmes in schools, and yet these are often known to alleviate hunger and act as safety-nets for children in poverty [27]. Underweight was above levels reported for children under-five in Uganda, which justifies the need for school nutrition programmes. Anaemia, iron deficiency and malaria The findings on iron status also showed a serious problem in the school-age (greater than 20%). The results are comparable to other findings where high rates of anaemia and iron
5871
Volume 12 No. 2 April 2012
deficiency among school children have been reported [28], though the prevalence of anaemia in this age group looks better than that for children below 5 years in Uganda. Although there was no significant correlation between haemoglobin and serum ferritin status (p>0.05), most of the anaemia was associated with iron deficiency (Table 4). In Uganda, it is estimated that the prevalence of iron deficiency is 2 to 2.5 times the prevalence of anaemia [29], of which the findings of iron deficiency agree with. A prevalence level of 82.1% shows that iron deficiency in this population is prevalent with or without transferrin receptor values. One common practice, however, in assessing whether or not anaemia is due to iron deficiency involves monitoring the response in haemoglobin or haematocrit levels after 1 or 2 months of oral supplementation with iron. An increase of 10 g/l in haemoglobin or 3% in haematocrit is indicative of iron deficiency [30]. In this study, it could not be confirmed whether the anaemia level was due to iron deficiency since such tests of response were not conducted. Due to its wide spread nature in Uganda, region specific causes are varied, but the common factors that drive the high prevalence of anaemia are the high disease burdens especially malaria, inadequate dietary sources and intake of iron, which in turn is also associated with wealth ranking [31]. Although data on wealth were collected in this study, this paper does not report data on socio-economic variables, which will be published separately. However, malaria infection still continues to affect children in school age, and in this study it was found that close to half of them were infected with malaria parasites. Although malaria is a serious problem to the pre-school child, it still reflects a significant burden of disease for the school age child. Globally, malaria accounts for 10-20% of all causes of mortality among school children [32]; however, data estimates of mortality among school children for Uganda are not available. Nonetheless, malaria remains a major cause of school absenteeism of up to 13-50% [6]. Vitamin A, Iodine and helminth infections The findings on vitamin A deficiency did not show a good picture of the status of school children in the district as prevalence levels were way above those reported for children under five years and even for women of child bearing age in Uganda (20% and 19%, respectively). Nationally, vitamin A supplementation in Uganda is limited to children under five, pregnant and lactating mothers [3]. This may explain why levels among school children surpassed these two groups; this calls for a need to re-focus attention on school children in the country as well, which can be done by promoting vitamin A fortification in foods, and providing to these children in form of a nutritious school meal. In all the schools that were involved in this study, there was lack of such organized feeding programmes. Iodine deficiency disorders have greatly reduced over the years, a positive situation attributed to the government policy on salt iodization [33]. In this study, a small proportion of children suffering from iodine deficiency were identified; this could be due to poor storage, which may sometimes lead to seepage of iodine from the salt. While the
5872
Volume 12 No. 2 April 2012
findings suggest that Uganda is well on its way to eradication of iodine deficiency disorders, it will be important to continue monitoring iodized salt intake to ensure that use of iodized salt remains high and that iodine is available as a regular part of women’s and children’s daily diets. Levels of helminth infections have also drastically reduced over the years due to the massive deworming programme of all school going children [34]. In this study, it was not established whether the children infected did receive albendazole in the last 3 months as other children in the study. All the above poor conditions of nutrition and health have implications for school children’s development including physical, cognitive and academic achievement, which have been reported by several authors [35]. Limitations of the study There is an inherent problem in assessing children in the years of puberty without collecting data on maturation (age at menarche in girls and testicular volume in boys). The average age of onset of puberty may be different between the reference population, as in this case an American population collected by the NCHS, and the study population. Generally, there are large between-population differences in timing and patterns of maturation and there is a strong association between the state of maturation and overweight in both females and males [28, 36]. The age of maturation is higher in poorly nourished populations and lower in well fed populations. It is, therefore, likely that a large proportion of the wasting, stunting, and underweight that is recorded in this study may be attributed to a later onset of puberty in this Ugandan population. It is, therefore, inherently difficult to conclude on the current levels of these indices in this age group based on these data. An additional challenge is that it will not be possible to use these findings for future reference as the age of onset of puberty is likely to change over time, also in Uganda, due to nutrition transition. A recommendation for future studies is to assess children anthropometrically either before or after puberty but not in the middle. Further to this, it also has to be admitted that the design could have been improved by assessing the same variables in the whole study group. For future studies, this is recommended. CONCLUSION Malnutrition in all its forms remains largely a “hidden problem” among school children since the majority of children affected are moderately malnourished or have micronutrient deficiencies that are not routinely assessed. Although there were low stunting rates, wasting, underweight and micronutrient deficiencies particularly of iron and vitamin A could be defined as public health problems among these children. Much of the burden of poor nutrition and health derives from poverty. While poverty has declined across Uganda from 56% in 1992 to 31% in 2006, improvements in the prevalence of poverty are largely attributable to economic growth in the country rather than income distribution and welfare improvement of the people. In Kumi district, agriculture defines
5873
Volume 12 No. 2 April 2012
the socio-economic way of life of the communities and specifically, about 97% of the households in this current study. The type of agriculture practiced is rain fed, and does not yield much produce, which leaves the farmers impoverished. A holistic approach is needed to help improve the levels of poverty in the district. For the case of this study, the good news is that something can be done about the situation of poor nutrition and health among school children. There is great potential for interventions to improve the conditions of the school children in the country. Much can be done to prevent malaria infection by promoting the use of Insecticide Treated Nets and chemoprophylaxis, as proven [32, 37]. The biennial dosage with albendazole for deworming, and universal use of iodized salt in Uganda are success stories that should continue. Iron deficiency anaemia can be controlled through nutrition education, provision of nutritious school meals coupled with control of malaria and deworming. Since many children attend school, such services if delivered through school systems would assist those school children who really need them most. AUTHORS’ CONTRIBUTIONS All the authors participated in concept preparation, design and implementation of the study, statistical analysis, interpretation and writing of the manuscript. In addition, Hedwig Acham and Marian K Malde interpreted results of biochemical analyses. All authors read and approved the final manuscript. ACKNOWLEDGEMENTS We acknowledge support from NUFU and Carnegie cooperation of New York who funded the study. We are also indebted to all parents of the children, and the children who participated in this study.
5874
Volume 12 No. 2 April 2012
Table 1: Anthropometric indicators of the study population, presented as means by sex and all combined
Females
Mean ± SD (N=348)
Males Mean ± SD (N=297)
Sexes combined Mean ± SD (N=645)
Mean Difference between sexes (95% CI)
P value for difference (2-tailed)
BMI-for-age z-
score
Height-for-age z-
score
Weight-for-age
z-score
-0.8 ± 0.9
-0.3 ± 1.2
-0.7 ± 1.0
-1.1 ± 0.9
-0.7 ± 1.2
-1.0 ± 1.0
-0.9±1.0
-0.5±1.2
-0.8±1.0
0.3 (0.2-0.4)
0.4 (0.2-0.6)
0.3 (0.1-0.5)
0.0000
0.0000
0.0002
5875
Volume 12 No. 2 April 2012
Table 2: Prevalence below cut-off for BMI-for-age, height-for-age and weight-for-age z-scores. Data is disaggregated by sex and age and is presented as percent with confidence intervals
Percentage below -2 z-scores or 3rd centile Levels as
defined by
WHO [38, 39]
Females
(%), 95% CI
Males
(%), 95% CI
Sexes combined
(%)
BMI-for-age z-score
9-10 yrs
11-12 yrs
13-15 yrs
All
4.3 [1.1-11.2]
7.2 [4.0-12.0]
6.3 [2.8-12.0]
6.3 [4.1-9.3]
2.0 [0.1-9.7]
9.9 [5.7-15.6]
26.4 [18.7-35.4]
14.5 [10.8-18.3]
10.1
Poor
Height-for-age z-
score
9-10 yrs
11-12 yrs
13-15 yrs
All
5.7 [1.8-13.2]
6.0 [3.1-10.5]
9.8 [5.3-16.4]
7.2 [4.8-10.3]
4.1 [0.7-12.8]
5.6 [2.7-10.4]
19.8 [13.0-28.2]
10.4 [7.3-14.3]
8.7
Acceptable
Weight-for-age z-
score 9-10 yrs
11-12 yrs
13-15 yrs
All
1.4 [0.1-6.8]
10.2 [6.3-15.6]
13.4 [8.0-20.7]
9.5 [6.7-12.9]
6.1 [1.6-15.8]
9.2 [5.2-14.8]
33.0 [24.6-42.4]
17.2 [13.2-21.8]
13.0
Poor
5876
Volume 12 No. 2 April 2012
Table 3: Proportions of normal and deficient children (%) disaggregated by sex (n=145)
Females
(%), 95% CI
N=80
Males
(%), 95% CI
N=65
Sexes combined
(%)
N=145
Haemoglobin status
below 12.0 g/dL
26.3 [17.5-36.7]
21.5 [12.8-32.8] 24.0
Serum ferritin
below 30.0 µg/L
83.8 [74.4-90.6] 80.0 [69.0-88.4] 82.1
Serum retinol
below 0.70 µmol/L
33.8 [24.0-44.6] 26.2 [16.6-37.8] 30.0
Table 4: Proportion of individuals with low haemoglobin also being malaria
positive, having low serum ferritin or low serum retinol (%), with 95% confidence intervals in parentheses
*Hb above 12 g/dL *Hb below 12 g/dL p-value for the
difference
Malaria positive
48.1 [37.4- 59.0] 46.2 [27.9-65.2] 0.001
Serum ferritin
below 30.0 µg/L
85.5 [77.9-91.1] 71.4 [55.0-84.5] 0.000
Serum retinol
below 0.70 µmol/L
30.0 [22.0-39.1] 31.4 [17.8-48.1] 0.233
*. Where Hb is haemoglobin
5877
Volume 12 No. 2 April 2012
REFERENCES
1. Bryce J, Coitinho D, Darnton-Hill I, Pelletier D and P Pinstrup-Andersen Maternal and Child Undernutrition 4. Maternal and child under nutrition: effective action at national level. Lancet 2008; 371: 510–26.
2. FANTA-2. The Analysis of the Nutrition Situation in Uganda. Food and Nutrition Technical Assistance II Project (FANTA-2), Washington, DC: AED, 2010.
3. UDHS. Uganda Demographic Health Surveys report. Uganda Bureau of statistics 2006, Kampala, Uganda. Macro International Inc., Calverton, Maryland, USA.
4. United Nations System Standing Committee on Nutrition. Progress in Nutrition. Sixth Report on the World Nutrition Situation 2010; Washington, DC.
5. Bachou H The nutrition situation in Uganda. Nutrition, 2002; 18: 356-358.
6. School Health Policy for Uganda A healthy mind in a healthy body for better performance (2005). Available at: http://www.usaid.or.ug/SO8annexes/FinalSchoolHealthPolicyforUganda.doc Accessed May 2005.
7. Ministry of Education and Sports Uganda Education Statistics Abstracts 2005. Ministry of Education and Sports. The Republic of Uganda. Available at http://www.education.go.ug/statistics_abstracts.htm Accessed November 2007.
8. Kumi District Local Government District Orphans and other Vulnerable Children (OVC) strategic plan, 2007-2012. December, 2007. Available at http://www.mglsd.go.ug/ovc/index.php Accessed February 2011.
9. UNDP/Uganda. Millennium Development Goals: Uganda’s Progress Report 2007. Geneva: UNDP. http://www.undp.or.ug/mdgs/25 Accessed January 2009.
10. WFP/CDC. A manual: Measuring and interpreting malnutrition and mortality. Nutrition service, WFP, Rome. July, 2005.
11. Piaget J Piagets theory. In: Mussen P (ed). Hand book of child psychology; History, theory and methods. Vol. 1 pp 103-128. John Wiley & sons Inc,New York.
12. Israel GD Determining sample size. Institute of Food and Agricultural Sciences, University of Florida. PEOD6. Available at: http://edis.ifas.ufl.edu Accessed January 2006.
13. CDC/NCHS. United States growth Charts 2000: Available at http://www.cdc.gov/growthcharts Accessed May 2007.
5878
Volume 12 No. 2 April 2012
14. Rendl J, Bier D, Groh T and C Reiners Rapid Urinary Iodide test. Journal of clinical endocrinology and metabolism. 1998; 83 (3): 1007-1012.
15. WHO/UNICEF/ICCIDD. Assessment of Iodine deficiency Disorders and monitoring their elimination. A guide for programme managers, World Health Organization, 2001. 2nd Ed. WHO/NHD/01.1.
16. WHO/UNICEF/UNU. Iron deficiency anaemia: Assessment, Prevention and Control. A guide for programme managers. World Health Organization, 2001. Geneva. WHO/NHD/01.3.
17. International Nutritional Anaemia Consultative Group (INACG) Adjusting Haemoglobin values in Programme surveys, 2002. Available at: http://inacg.ilsi.org/file/HemoglobinValues2004.pdf Accessed October 2007.
18. Addison G, Hales C and M Beamich An immunoradiometric assay for ferritin in the serum of normal subjects and patients with iron deficiency and iron overload. Journal of Clinical Pathology, 1972; 25: 326-329.
19. Miles L, In Dekker M and GE Abraham Eds. Hand book of radioimmunoassay. New York: Marcel Dekker Inc. 1977.
20. Bieri JG, Tolliver TJ and GL Catignani Simultaneous determination of alpha tocopherol and retinol in plasma or red cells by high pressure liquid chromatography. American Journal of Clinical Nutrition, 1979; 32: 2143.
21. Filteau SM and AM Tomkins Micronutrients and tropical infections. Trans. R. Soc. Trop. Med. Hyg. 1994; 88: 1 – 3.
22. World Health Organization. Indicators of Vitamin A Deficiency and their application in monitoring and evaluating intervention programmes. WHO/NUT/96.10. World Health Organization 1996, Geneva, Switzerland.
23. World Health Organization. Guidelines on Standard operating procedures for microbiology. Parasitological examination of faeces, 2006. Available at http://www.searo.who.int/en/Section10/Section17/Section53/Section482_1803.htm Accessed July 2006.
24. Chritiaensen L and H Alderman Child malnutrition in Ethiopia: Can maternal knowledge augment the role of income? Economic Development and cultural change; 2004; 52 (2): 287-312.
25. Glewwe P, Koch S and BL Nguyen Child nutrition, economic growth, and the provision of health care services in Vietnam in the 1990s. Policy Research Working Paper Series, 2002. The World Bank.
5879
Volume 12 No. 2 April 2012
26. Karlberg J Secular trends in pubertal development. Horm Res 2002; 57 (2): 19-30.
27. Vermeersch C and M Kremer School meals, educational achievement, and school competition: evidence from a randomized evaluation, in World Bank policy Research Working paper No. 3523. 2004, The World Bank: Washington DC.
28. Wang Y Is obesity associated with early sexual maturation? A comparison of the association in American boys versus girls. Pediatrics 2002; 110: 903-910.
29. ORC Macro. Uganda Demographic and Health Survey 2006: Supplemental Test Report. Calverton, MD: ORC Macro.
30. WHO/CDC. Assessing the iron status of populations. Report of a joint World Health Organization/ Centres for Disease Control and Prevention Technical Consultation on the assessment of iron status at the population level. Geneva, Switzerland. 2005.
31. Agho KE, Dibley MJ, D’Este C and R Gibberd Factors Associated with Haemoglobin Concentration among Timor-Leste Children Aged 6-59 Months. Journal of Health, Population and Nutrition, 2008; 26 (2): 200-209.
32. Jukes MCH, Pinder M, Grigorenko EL, Smith HB, Walraven G, Bariau EM, Sterberg RJ, Drake LJ, Milligan P, Cheung YB, Greenwood BM and DAP Bundy Long term impact of malaria chemoprophylaxis on cognitive abilities and educational attainment: Follow-up of a controlled trial. PLoS Clinical Trials, 2006; 1 (4): p. e19.
33. Olico-Okui G Assessment of the success of Uganda’s Universal Salt Iodization in the control of iodine deficiency disorders after 10 years. Kampala, Makerere University School of Public Health, 2005. Reference No. 5601.
34. Kabatereine NB, Tukahebwa E, Kazibwe F, Namwangye H, Zaramba S, Brooker S, Stothard JR, Kamenka C, Whawell S, Webster JP and A Fenwick Progress towards countrywide control of schistosomiasis and soil-transmitted helminthiasis in Uganda. Transactions of the Royal Society of Tropical Medicine and Hygiene, 2006; 100: 208–215.
35. Jukes MCH, Sharma C, Miguel E and G Bobonis In: Jukes MCH, Drake LJ & Bundy DAP. School health, Nutrition and Education for all: Levelling the playing field. CABI publishing, 2008.145pp.
36. Partnership for Child Development Anaemia in schoolchildren in eight countries in Africa and Asia. Public Health Nutrition, 2001; 4 (3): 749-756.
5880
Volume 12 No. 2 April 2012
37. Fernando D, De Silva D, Carter R, Mendis KN and R Wickremasinghe A randomized double blind, placebo-controlled, clinical trial of the impact of malaria prevention on the educational attainment of schoolchildren. American Journal of Tropical Medicine and Hygiene, 2006; 74(3): 386-398.
38. World Health Organization. Physical status: The use and interpretation of anthropometric data. WHO 1995: Geneva.
39. World Health Organization. Global database on child growth and malnutrition: Forecast of trends. WHO/NHD/00.3 WHO 2000: Geneva.
Related Documents