Welcome message from author
This document is posted to help you gain knowledge. Please leave a comment to let me know what you think about it! Share it to your friends and learn new things together.
Transcript

Journal of Orthodontic Science ■ Vol. 2 | Issue 1 | Jan-Mar 20131
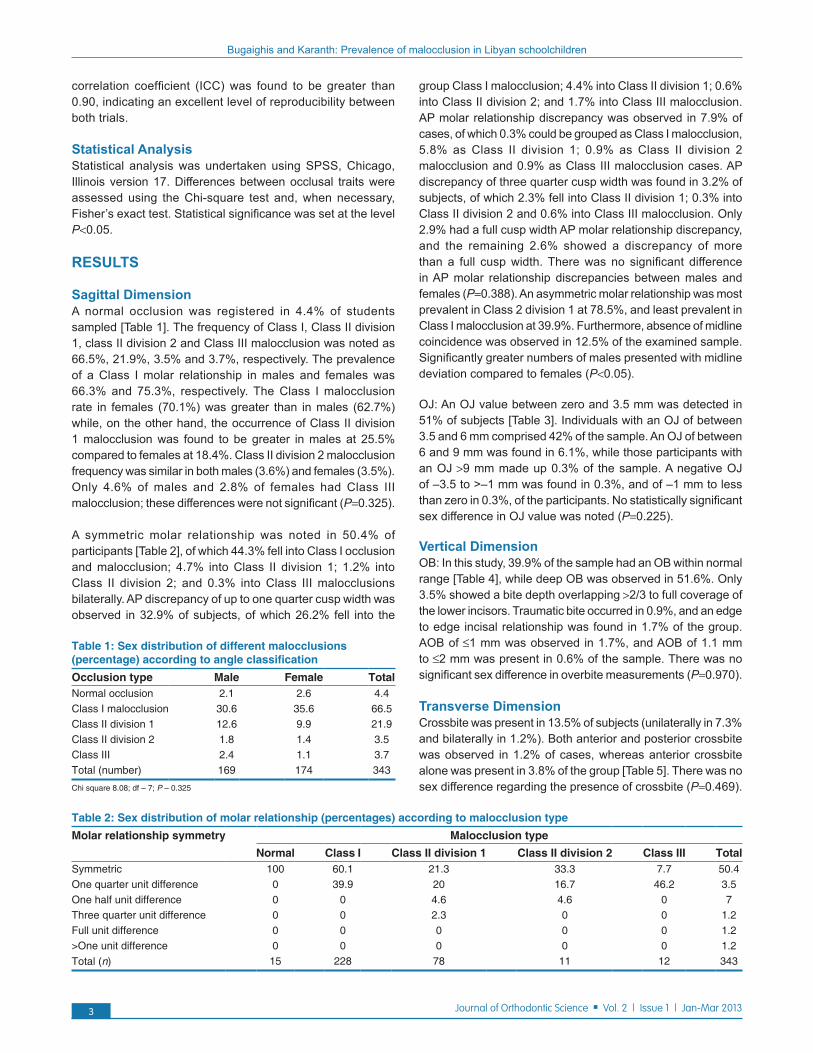
ABSTRACTObjective: This study aimed to explore the prevalence of malocclusion and its distribution among 12-17 year old Urban Libyan schoolchildren.Materials and Methods: A total of 900 subjects were examined, of which 343 fulfilled the inclusion criteria; 169 males and 174 females. Molar relationship, overjet (OJ), overbite (OB), midline deviation, crossbite, and crowding/spacing were recorded. Sexual dimorphism was explored using descriptive statistics and the Chi-square tests.Results: The prevalence of malocclusion was 95.6%. Class I, Class II division 1, Class II division 2 and Class III malocclusions comprised 66.5%, 21.9%, 3.5%, and 3.7% respectively of the total sample. The OJ percentage of 51% (zero-3.5 mm), 48.4% (>3.5 mm), 0.6% (≤−3.5 mm to >zero) was recorded, with no significant sex differences (P=0.225). A normal overbite, increased and open bites were observed in 39.9%, 55.1%, and 2.3% of the group respectively with no sexual dimorphism (P=0.970). Crossbite was present in 13.1% of the group, with no significant sex difference (P=0.469). Crowding in the maxillary and mandibular arches were observed in13.9%, and 12.2% respectively. Spacing occurred in 9.4% and 7.9% of the examined maxillary and mandibular arches respectively, with no significant sex difference regarding the presence of spacing/crowding in the maxillary arch (P>0.05). Males, however, had significantly more spacing and less crowding in the mandibular arch (P<0.05).Conclusions: The prevalence of malocclusion in Libyan schoolchildren is among the highest reported in the literature. Crowding is among the least reported manifestations of malocclusion.
Key words: Libyan, malocclusion, prevalence, schoolchildren
The prevalence of malocclusion in urban Libyan schoolchildren
Iman Bugaighis and Divakar Karanth1
INTRODUCTION
The prevalence of malocclusion varies between different populations, ethnicities and age groups.[1] Variations within the same population have also been noticed, especially in respect of both crowding and the sagittal dental arch relationship.[2] However, the application of different registration methods by different researchers might influence the outcome of such assessments, even where the same groups have been examined.
Several assessment approaches have been advocated in the literature to classify malocclusion. Angle’s classification of malocclusion, introduced in 1899,[3] was based on molar relationship and offered a clear description of normal occlusion as well as subdividing the major types of malocclusions. The classification is limited to anteroposterior direction and ignored
transversal and vertical dimensions, but remains the most widely used by orthodontists because of its simplicity and practicality.[4]
Quantitative systems employed for evaluating occlusal traits are imperative for oral health planners responsible for publicly funded orthodontic services. Furthermore, dental students must be taught the basic information relating specifically to their community instead of that derived from research conducted on other, different ethnicities and populations. This allows greater focus on teaching solutions to problems of particular concern to the students’ community and allows construction of a curriculum related to their society.
Two previous studies reported the prevalence of malocclusion in Libyan schoolchildren.[5,6] Ommar[5] examined 2015 Libyan
Address for correspondence: Dr. Iman Bugaighis, Department of Orthodontic, Dental Faculty, Benghazi University, Benghazi-Libya. E-mail: [email protected]
Department of Orthodontic, Dental Faculty, Benghazi University, Benghazi-Libya, 1Smile N Braces, The Multispecialty Dental Clinic, Porvorim, Bardez, Goa, India
Original Article
Access this article online
Quick Response Code:Website: www.jorthodsci.org
DOI:
10.4103/2278-0203.110325

Bugaighis and Karanth: Prevalence of malocclusion in Libyan schoolchildren
Journal of Orthodontic Science ■ Vol. 2 | Issue 1 | Jan-Mar 2013 2
schoolchildren aged 7-16 years in two cities, one to the south and the other to the east of Benghazi. Gardiner[6] conducted a survey by clinically examining 479 students from Benghazi city. However, the subjects’ age range and the type of dentition examined were not reported. Both studies lacked a sample size calculation, method error analyses, details of measuring tools, and neither reported clear cut discrimination between the different types of malocclusions. Furthermore, the evaluations were undertaken on site without using study models. Thus, there is a need for further research with refined methodology to explore a wider variety of occlusal traits. In this context, the aim of this study was to determine the prevalence of malocclusions and occlusal traits in an urban Libyan schoolchildren living in Benghazi city. A second aim was to investigate sexual dimorphism of occlusal traits.
MATERIALS AND METHODS
Ethical approval was granted from the Ministry of Health in Benghazi, Libya, and parents of students were informed. Benghazi is the second largest city in Libya with 1,000,000 inhabitants, comprising 19% of the whole Libyan population. Intermediate schools were selected from a list obtained from the Ministry of Education Directorate in Benghazi and were based in five geographic regions; central, Eastern, Western, Northern and Southern. Four schools were selected randomly from each geographic area. The total number of students attending these schools was 43,881 (22,248 females and 21,633 males), with the number of participants chosen from each region varying according to the total number of students to ensure fair representation of the targeted population. A list of children in each classroom was obtained; every fifth child was examined to assure randomization. The students who fulfilled the inclusion criteria were requested to participate in the study after informing their parents and obtaining the consents. Nine hundred students (453 males and 447 females) aged 12-17 years were examined at the school premises by one examiner (I.B). The participants were of Libyan descent for at least two generations with no craniofacial abnormalities and none had undergone previous orthodontic treatment. All permanent dentitions were fully erupted up to the second molar, with no caries or restorations that might interfere with accurate assessment. A total of 343 students (169 males with a mean age of 14.1 years, SD=1.1 and 174 females with a mean age of 14.4 years, SD=1.1) fulfilled the reported requirements.
Upper and lower arch Alginate impressions (ALGINKID, Italy) and wax bite registrations were recorded and then cast on the same morning with dental stone. All models were checked and numbered. All measurements were extracted using an electronic digital caliper with an accuracy of 0.01 mm (0-150 mm Digital (Vernier) Caliper/Lin 48772) Venire by one operator (D.K). An Excel spreadsheet file was prepared including all the recorded occlusal criteria for all participants.
Sagittal DimensionThe intermolar relationship was recorded as Class I, Class II or Class III as defined by Angle.[3] Any asymmetric differences
were assessed; a half unit lower molar mesial deviation from Class I was considered as Class III, and as Class II if the lower molar was shifted distally.
Overjet (OJ): The horizontal distance from the most labial point of the incisal edge of the maxillary incisors to the most labial surface of the corresponding mandibular incisor parallel to the occlusal plane to the nearest 0.5 mm. A negative OJ value was reported if the upper incisors were posterior to the lower incisors. OJ measurements were grouped as follows: >–3.5; ≤–3.5 to <–1; ≤–1 to 0.0; ≤0.0 to <3.5; ≤3.5 to ≤6; <6 to ≤9; and >9 (all values in mm).
Vertical DimensionOverbite (OB): The incisal vertical overlap in mm when the posterior teeth were in occlusion. The OB was considered as anterior open bite (AOB) if there was no vertical overlap between the incisors and was recorded as follows: ≤1; 1.1 to ≤2; 2.1 to ≤4; and >4 (all values in mm). The measurement was recorded as zero if the upper and lower incisal edges met edge to edge. OB measurement was organized in 1/3 lower incisor height intervals as follows: Edge to edge to ≤1/3 overlap; >1/3 to ≤2/3 overlap; >2/3 to ≤3/3 overlap without gingival or palatal trauma; and full overlap with gingival or palatal trauma.
Transverse DimensionA posterior crossbite was recorded when the buccal cusps of the maxillary posterior teeth (premolars and/or molars) unilaterally or bilaterally occluded lingual to the buccal cusps of their mandibular opposing teeth, including a cusp to cusp interarch relationship. If any of the maxillary molars or premolars occluded buccally to the mandibular opposing teeth, the relationship was considered a scissors bite. Any discrepancy between the maxillary and mandibular midline was also assessed. Diastema was recorded if a space of ≤2 mm was present between the upper central incisors.
Alignment DiscrepanciesThe degree of crowding/spacing was categorized as follows: No crowding or spacing; mild crowding (≤2 mm); moderate crowding (2.1-5 mm); severe crowding (≥5.1 mm); mild spacing (<2 mm); moderate spacing (2.1-5 mm); and severe spacing (5.1-9 mm).
Normal occlusion was considered to occur if the molar and canine interarch relationships were Class I, and the incisal relationship was also Class I (according to the British standard classification), with an OJ of ≤3 mm, OB ≤3 mm and well-aligned dental arches with ≤0.5 mm crowding/spacing (according to Andrews’ six keys of normal occlusion).
Assessment of Method ErrorThirty randomly selected dental casts were re-examined after a two-week interval to assess the reproducibility of intra-operator occlusal trait measurement. The intraclass
Journal of Orthodontic Science ■ Vol. 2 | Issue 1 | Jan-Mar 20133
Bugaighis and Karanth: Prevalence of malocclusion in Libyan schoolchildren
correlation coefficient (ICC) was found to be greater than 0.90, indicating an excellent level of reproducibility between both trials.
Statistical AnalysisStatistical analysis was undertaken using SPSS, Chicago, Illinois version 17. Differences between occlusal traits were assessed using the Chi-square test and, when necessary, Fisher’s exact test. Statistical significance was set at the level P<0.05.
RESULTS
Sagittal DimensionA normal occlusion was registered in 4.4% of students sampled [Table 1]. The frequency of Class I, Class II division 1, class II division 2 and Class III malocclusion was noted as 66.5%, 21.9%, 3.5% and 3.7%, respectively. The prevalence of a Class I molar relationship in males and females was 66.3% and 75.3%, respectively. The Class I malocclusion rate in females (70.1%) was greater than in males (62.7%) while, on the other hand, the occurrence of Class II division 1 malocclusion was found to be greater in males at 25.5% compared to females at 18.4%. Class II division 2 malocclusion frequency was similar in both males (3.6%) and females (3.5%). Only 4.6% of males and 2.8% of females had Class III malocclusion; these differences were not significant (P=0.325).
A symmetric molar relationship was noted in 50.4% of participants [Table 2], of which 44.3% fell into Class I occlusion and malocclusion; 4.7% into Class II division 1; 1.2% into Class II division 2; and 0.3% into Class III malocclusions bilaterally. AP discrepancy of up to one quarter cusp width was observed in 32.9% of subjects, of which 26.2% fell into the
group Class I malocclusion; 4.4% into Class II division 1; 0.6% into Class II division 2; and 1.7% into Class III malocclusion. AP molar relationship discrepancy was observed in 7.9% of cases, of which 0.3% could be grouped as Class I malocclusion, 5.8% as Class II division 1; 0.9% as Class II division 2 malocclusion and 0.9% as Class III malocclusion cases. AP discrepancy of three quarter cusp width was found in 3.2% of subjects, of which 2.3% fell into Class II division 1; 0.3% into Class II division 2 and 0.6% into Class III malocclusion. Only 2.9% had a full cusp width AP molar relationship discrepancy, and the remaining 2.6% showed a discrepancy of more than a full cusp width. There was no significant difference in AP molar relationship discrepancies between males and females (P=0.388). An asymmetric molar relationship was most prevalent in Class 2 division 1 at 78.5%, and least prevalent in Class I malocclusion at 39.9%. Furthermore, absence of midline coincidence was observed in 12.5% of the examined sample. Significantly greater numbers of males presented with midline deviation compared to females (P<0.05).
OJ: An OJ value between zero and 3.5 mm was detected in 51% of subjects [Table 3]. Individuals with an OJ of between 3.5 and 6 mm comprised 42% of the sample. An OJ of between 6 and 9 mm was found in 6.1%, while those participants with an OJ >9 mm made up 0.3% of the sample. A negative OJ of –3.5 to >–1 mm was found in 0.3%, and of –1 mm to less than zero in 0.3%, of the participants. No statistically significant sex difference in OJ value was noted (P=0.225).
Vertical DimensionOB: In this study, 39.9% of the sample had an OB within normal range [Table 4], while deep OB was observed in 51.6%. Only 3.5% showed a bite depth overlapping >2/3 to full coverage of the lower incisors. Traumatic bite occurred in 0.9%, and an edge to edge incisal relationship was found in 1.7% of the group. AOB of ≤1 mm was observed in 1.7%, and AOB of 1.1 mm to ≤2 mm was present in 0.6% of the sample. There was no significant sex difference in overbite measurements (P=0.970).
Transverse DimensionCrossbite was present in 13.5% of subjects (unilaterally in 7.3% and bilaterally in 1.2%). Both anterior and posterior crossbite was observed in 1.2% of cases, whereas anterior crossbite alone was present in 3.8% of the group [Table 5]. There was no sex difference regarding the presence of crossbite (P=0.469).
Table 1: Sex distribution of different malocclusions (percentage) according to angle classificationOcclusion type Male Female TotalNormal occlusion 2.1 2.6 4.4Class I malocclusion 30.6 35.6 66.5Class II division 1 12.6 9.9 21.9Class II division 2 1.8 1.4 3.5Class III 2.4 1.1 3.7Total (number) 169 174 343
Chi square 8.08; df – 7; P – 0.325
Table 2: Sex distribution of molar relationship (percentages) according to malocclusion typeMolar relationship symmetry Malocclusion type
Normal Class I Class II division 1 Class II division 2 Class III TotalSymmetric 100 60.1 21.3 33.3 7.7 50.4One quarter unit difference 0 39.9 20 16.7 46.2 3.5One half unit difference 0 0 4.6 4.6 0 7Three quarter unit difference 0 0 2.3 0 0 1.2Full unit difference 0 0 0 0 0 1.2>One unit difference 0 0 0 0 0 1.2Total (n) 15 228 78 11 12 343

Bugaighis and Karanth: Prevalence of malocclusion in Libyan schoolchildren
Journal of Orthodontic Science ■ Vol. 2 | Issue 1 | Jan-Mar 2013 4
Unilateral, posterior bilateral, anterior and anteroposterior crossbite were more prevalent in Class I malocclusion (10.6%), while only 2.1% of subjects with Class II division 1 and 0.6% of subjects with Class II division 2 had a unilateral posterior crossbite. A single student with Class III malocclusion presented with anterior crossbite (0.3%). Only one subject in the group with Class I malocclusion (0.3%) had a unilateral scissors bite. There was no significant sex difference in the occurrence of crossbite (P=0.513).
Three males and two females with Class I malocclusion presented with diastema. This comprised 1.5% of the sample and 2.2% of the Class I malocclusion group.
Alignment DiscrepanciesMild crowding (≤2 mm) was observed in 9.3% and 8.7% of the maxillary and mandibular arches, respectively; moderate crowding (2.1 ≤ 5 mm) in 2.6% and 2.9%; severe crowding (≥5.1 mm) in 2% and 0.6%; and spacing in 9.4% and 8.9% of the maxillary and mandibular arches, in this order [Table 6]. There was no significant sex difference in crowding/spacing in their maxillary arches (P>0.05). Males, however, had greater spacing and less crowding in their mandibular arches (P<0.05).
DISCUSSION
This study examined 12-17-year-old urban schoolchildren living in Benghazi city to provide information about the prevalence of malocclusion in Libya. For the moment, we regard these results as preliminary, because the literature shows that there is wide discrepancy in the reported prevalence of malocclusion within and between most populations, ranging from 93.5%[7] to 38.9%.[8] Reasons for this include the origin of the studied groups, the assessment criteria used and the age of the study subjects. There is also a potential consequence of the overlapping differentiation criteria between normal and Class I malocclusions, leading to the inclusion of some cases with normal occlusion in Class I malocclusion, and vice versa.[9] To attempt to circumvent some of these problems in our research, study models were employed for assessment, rather than relying upon clinical examination. This provided extended time to reassess the occlusion. In addition, a relatively young age group was selected to minimize the influence of tooth wear on the study outcome.
Angle’s classification was used to assess interocclusal relationship because of its simplicity, reliability, and also to minimize examiner bias.[7] Normal occlusion was observed in only 4.7% of the participants. This is comparable to the prevalence reported by Gardner[6] (3%), while normal occlusion was not reported in Ommar’s[5] group. Normal occlusion in the present study was found to be similar to that in American Latinos[7] at 6.5%, but much lower than in White Americans[10] (35%), Egyptians[11] (34.33%) and Iranians[12] (21.1%). Sexual dimorphism in the frequency of occlusal relationship was not observed in current study (P=0.431). Similar findings were
Table 3: Sex distribution (percentage) of overjet in the study group (Chi square=6.94, df=5, P=0.225)
Male Female TotalOverjet>9 mm 0 0.6 0.3<6 to ≤9 4 8.3 6.1<3.5 to ≤6 40.8 43.2 42≤0 to ≤3.5 55.2 46.7 51≤−1 to<0 0 0.6 0.3≤−3.5 to <–1 0 0.6 0.3
Reverse overjet overall 0 1.2 0.6
Table 4: Sex distribution (percentage) of overbite in the study group (Chi square=1.33, df=6, P=0.970)
Male Female TotalOverbite
Edge to edge 2.3 1.2 1.7≤1/3 mm coverage 40.2 39.6 39.9>1/3 to ≤2/3 coverage 50.6 52.7 51.6>2/3 to ≤full coverage without gingival or palatal trauma
4 3 3.5
>2/3 to≤ full coverage without gingival or palatal trauma
0.6 1.2 0.9
Anterior open bite≤–1 mm 1.7 1.8 1.7≥–1.1 to ≤2 mm 0.3 0.3 0.6
Table 5: Sex distribution (percentage) of crossbite in the study group (Chi square=4.26, df=5, P=0.513)Crossbite Male Female TotalAnterior 4.1 3.4 3.8Posterior unilateral (right) 6.3 3 4.7Posterior unilateral (left) 3.6 1.7 2.6Bilateral posterior 1.2 1.1 1.2Anterior and posterior 0.6 1.7 1.2
Table 6: Sex distribution (percentages) of maxillary and mandibular arch crowding/spacing
Male Female TotalMaxillary arch*
No crowding or spacing 76.9 76.4 76.7Spacing 7.1 3.4 5.3
CrowdingMild ≤2 mm 5.3 13.2 9.3Moderate (2.1-5 mm) 2.4 2.9 2.6Severe ≥5 mm 1.2 2.9 2
Mandibular arch**No crowding or spacing 84 75.9 79.9Spacing 10.7 5.1 7.9
CrowdingMild ≤2 mm 4.1 13.2 8.7Moderate (2.1-5 mm) 1.2 4.6 2.9Severe ≥5 mm 0 1.1 0.6Total (n) 169 174 343
*Chi square – 17.63; df – 6; P – 0.007; ** Chi square – 18.03; df – 6; P – 0.006

Journal of Orthodontic Science ■ Vol. 2 | Issue 1 | Jan-Mar 20135
Bugaighis and Karanth: Prevalence of malocclusion in Libyan schoolchildren
observed in Iranians,[12] although El-Mangoury and Mostafa[11] reported significant sex differences in the frequency of Egyptians’ occlusal status.
This study showed that the frequency of Class I malocclusion was slightly higher in Libyans examined by Gardner[6] (74%) than the present group (66.5%). Both figures are greater than those observed in Americans (55%);[10] Egyptians (33.3%)[11] and Iranians[12] (41.8%). However, the present total number of Class I occlusion and malocclusion appears less than that noticed in Libyan subjects aged 7-16 years examined by Ommar[5] (94%). Differences in both the age range of subjects and the identification of the various categories of occlusion and malocclusion might contribute to the reported discrepancies. Class I malocclusion in the present study was found to have comparable frequency to that in White American subjects[3] (69%) and American Latinos[7] (62.9%). There is no significant difference in the frequency of Class I malocclusion between Libyan males (30.6%) and females (35.6%). A similar lack of sex difference was also reported in Iranian[12] and Danish[13] children. Class I malocclusion was, however, found to be significantly more prevalent in British,[14] Egyptian[11] and Eskimo[15] females, compared to their male counterparts.
Class II malocclusion is noted to be more prevalent in white populations of northern European descent,[13] and less prevalent in isolated societies such as Eskimos[15] and American Indians.[16] The occurrence of Class II malocclusion in the present study (25.4%; 21.9% Class II division 1 and 3.5% Class II division 2) was greater than in Gardner’s[6] group (18%; 16% Class II division 1 and 2% Class II division 2) and both groups had greater prevalence of Class II cases than Ommar’s[5] sample (Class II 2.9%; 2% Class II division 1 and 0.9% Class II division 2). This broad discrepancy might be due to the wide age range of Ommar’s[5] sample and may have occurred as a result of the overlap in differentiation criteria between both studies. Class II malocclusion frequency in the present study was greater than in American subjects[10] (15%), and comparable to that of Egyptians[11] (21%), Iranians[12] (27.6), and Europeans.[13,17,18] Severe class II malocclusion was not commonly observed in the current research.
We observed class III malocclusion in similar numbers (3.7%) to those of Gardner[6] (5%), but slightly in excess of those noted by Ommar[5] (1.2%). Class III malocclusion is more common in people of Asian descent, ranging between 3% and 14% in Japanese[19] and Chinese subjects.[20,21] Class III malocclusion rate in the present study (3.7%) was less than that observed in Egyptians[11] (10.6%) and Iranians[12] (7.8%), and similar to the frequency reported for Danish[13] (4.3%) and British[17] subjects (2.9%), but higher than in White Americans[10] (1%).
Class III malocclusion showed the highest frequency of asymmetric molar relationship in this study, followed by Class II division 1. Non-coincident upper and lower midlines were observed in 9.3% of the subjects examined. The midline
shift might have occurred as a result of dental or skeletal deviation, including maxillary or mandibular teeth displacement, skeletal midline displacement, or a combination of the above; sub-grouping of the midline shift was not undertaken in this research, however. The reported figure in this study is smaller than the number of cases with midline non-coincidence in Iranian subjects[12] at 23.7%. Diastema was seen less often in Libyan subjects (1.5%) compared to Americans[10] (6%).
In the current study, just over half of the sample (51%) had an OJ within normal range (0-3.5 mm). Over two-thirds of the Iranian sample (67.7%) had an OJ within normal range.[12] An OJ of more than 3.5 mm, suggesting Angle’s Class II malocclusion, was observed in 48.7% of subjects, of which 42% comprised moderate Class II with an OJ of ≥3.5-6 mm. An OJ of >6 mm was observed in 6.4% of the sample, indicating a severe form of Class II malocclusion. The incidence of the severe form of Class II malocclusion found in White Americans was comparable to that found in this research at 8.3%,[10] but greater than that observed in Iranians[12] (3.6%). A reverse OJ was observed in <1% of Libyans, which is similar to the figure reported for White Americans,[14] but less than that in Iranian subjects[12] (4.2%). The above results revealed that classification of malocclusion based on OJ as a reflection of Angle’s classification reflects similar trends to Angle’s classification based on molar relationship, but does not replicate it. Thus, comparison of prevalence of malocclusion between different studies can only be meaningful where similar classifications have been implemented.
Deep OB was observed in 56% of the subjects, of which 0.9% was traumatic bite. This demonstrates that deep bite is more prevalent in Libyans, compared to Iranians[12] (34.5%). The prevalence of AOB in Libyans at 2.3% was comparable to that in Iranians[12] (1.7%) and Jordanians[22] (2.9%). AOB was found to be <5% in White Americans,[10] double this number in Black Americans[23] and around 7% in a Turkish population.[24]
The frequency of posterior crossbite has been reported in 4.6%-16% of children.[1,23,25] This range is in concordance with the rate of occurrence of posterior crossbite in the present study (7.6%). While the prevalence of anterior and posterior crossbite was 3.8% and 1.2% respectively, the prevalence of anterior crossbite, posterior crossbite and anterior and posterior crossbite in Iranians[12] was greater than in Libyans at 8.4%, 12.4% and 2% correspondingly. Demir et al.[24] noticed the occurrence of anterior and posterior crossbite in 5.6% and 8.9%, respectively of the examined Turkish subjects, which are comparable with the present findings.
The majority of the examined subjects in this research presented with no space discrepancies of the maxillary and mandibular arches (76.7% and 79.9%, respectively). Maxillary and mandibular crowding in Libyan subjects (13.6% and 12.2%, respectively) was found to be less prevalent than in Iranians[12] (75.2% and 73.4%, respectively), and severe

Bugaighis and Karanth: Prevalence of malocclusion in Libyan schoolchildren
Journal of Orthodontic Science ■ Vol. 2 | Issue 1 | Jan-Mar 2013 6
crowding was less frequent (2% and 0.6%, respectively) than in Iranian[12] subjects (16.7% and 10.8%, respectively). Furthermore, spacing was less frequent in Libyan subjects (9.4 and 7.9%, respectively) than in Iranians (18.9% and 20.7%, respectively).
The higher prevalence of malocclusion in Libyan subjects reported here reveals a need for skilled and qualified specialists and educators in orthodontics who are aware of their community requirements, and a need to improve the quality of education and services at dental schools, in public service and in private practice. Nationwide research projects with sound methodologies are therefore required to allow further exploration of specific community requirements. Furthermore, it will be interesting to study the correlation between the high prevalence of malocclusion in Libyan subjects and oral health status in the community.
CONCLUSIONS
The prevalence of malocclusion in the Benghazi population of Libya is among the highest reported in the literature. However, the trend of malocclusion is similar to the frequencies observed in other populations. More studies are recommended to obtain a clearer picture about occlusal traits in Libyan populations across the whole of the country.
REFERENCES
1. Thilander B, Pena L, Infante C, Parada SS, de Mayorga C. Prevalence of malocclusion and orthodontic treatment need in children and adolescents in Bogota, Colombia. An epidemiological study related to different stages of dental development. Eur J Orthod 2001;23:153‑67.
2. Kerosuo H, Laine T, Nyyssonen V, Honkala E. Occlusal characteristics in groups of Tanzanian and Finnish urban schoolchildren. Angle Orthod 1991;61:49‑56.
3. Angle EH. Malocclusion of the teeth. 7th ed. Philadelphia: SS White Manufacturing Company; 1907.
4. Graber TM, Vanarsdall RL. Orthodontics: Current principles and techniques. St. Louis: CV Mosby Company; 1994.
5. Ommar SM. Occlusal status and permanent teeth eruption in Libyan children. J Indian Soc Pedod Prev Dent 1994;1:1‑6.
6. Gardiner JH. An orthodontic survey of Libyan schoolchildren. Br J Orthod 1982;9:59‑61.
7. Silva RG, Kang DS. Prevalence of malocclusion among Latino adolescents. Am J Orthod Dentofacial Orthop 2001;119:313‑5.
8. Myllarniemi S. Maloccluson in Finish urban children: An epidemiological study of different stages of dental development. Suom Hammaslaak Toim 1970;66:219‑64.
9. Moorrees CF, Gron AM. Principles of orthodontic diagnosis. Angle Orthod 1966;36:258‑62.
10. Proffit WR, Fields HW Jr, Moray LJ. Prevalence of malocclusion and orthodontic treatment need in the United States: Estimates from the NHANES III survey. Int J Adult Orthodon Orthognath Surg 1998;13:97‑106.
11. El‑Mangoury NH, Mostafa YA. Epidemiologic panorama of dental occlusion. Angle Orthod 1990;60:207‑14.
12. Borzabadi‑Farahani A, Borzabadi‑Farahani A, Eslamipour F. Malocclusion and occlusal traits in an urban Iranian population. An epidemiological study of 11‑ to 14‑year‑old children. Eur J Orthod 2009;31:477‑84.
13. Helm S. Malocclusion in Danish children with adolescent dentition: An epidemiologic study. Am J Orthod 1968;54:352‑66.
14. Goose DH, Thompson DG, Winter FC. Malocclusion in school children of the West Midlands. Br Dent J 1957;102:174‑8.
15. Wood BF. Malocclusion in the modern Alaskan Eskimo. Am J Orthod 1971;60:344‑54.
16. Grewe JM, Cervenka J, Shapiro BL, Witkop CJ. Prevalence of malocclusion in Chippewa Indian children. J Dent Res 1968;47:302‑5.
17. Sclare AR. Orthodontics and the school child: A survey of 680 children. Br Dent J 1945;79:278‑80.
18. Thilander B, Myrberg N. The prevalence of malocclusion in Swedish schoolchildren. Scand J Dent Res 1973;81:12‑20.
19. Ishii H, Morita S, Takeuchi Y, Nakamura S. Treatment effect of combined maxillary protraction and chin cap appliance in severe Skeletal III cases. Am J Orthod Dentofacial Orthop 1987;92:304‑12.
20. Allwright WC, Burndred WH. A survey of handicapping dentofacial anomalies among Chinese in Hong Kong. Int Dent J 1964;14:505‑19.
21. Lew KK, Foong WC, Loh E. Malocclusion prevalence in an ethnic Chinese population. Aust Dent J 1993;38:442‑9.
22. Abu Alhaija ES, Al‑Khateeb SN, Al‑Nimri KS. Prevalence of malocclusion in 13‑15 year‑old North Jordanian school children. Community Dent Health 2005;22:266‑71.
23. Brunelle J, Bhat M, Lipton JA. Prevalence and distribution of selected occlusal characteristics in the U.S. population. 1988‑91. J Dent Res 1996;75:706‑13.
24. Demir A, Uysal T, Basciftci FA, Guray E. The association of occlusal factors with masticatory muscle tenderness in 10 to 19 year old Turkish subjects. Angle Orthod 2005;75:40‑6.
25. Thilander B, Wahlund S, Lennartsson B. The effect of early interceptive treatment in children with posterior cross‑bite. Eur J Orthod 1984;6:25‑34.
How to cite this article: Bugaighis I, Karanth D. The prevalence of malocclusion in urban Libyan schoolchildren. J Orthodont Sci 2013;2:1-6.
Source of Support: Nil, Conflict of Interest: None declared.
Announcement
Android AppA free application to browse and search the journal’s content is now available for Android based mobiles and devices. The application provides “Table of Contents” of the latest issues, which are stored on the device for future offline browsing. Internet connection is required to access the back issues and search facility. The application is compatible with all the versions of Android. The application can be downloaded from https://market.android.com/details?id=comm.app.medknow. For suggestions and comments do write back to us.
Related Documents