ARTICLE Received 15 Apr 2016 | Accepted 16 Nov 2016 | Published 21 Dec 2016 Nutrient enrichment modifies temperature-biodiversity relationships in large-scale field experiments Jianjun Wang 1,2, *, Feiyan Pan 3, *, Janne Soininen 2 , Jani Heino 4 & Ji Shen 1 Climate effects and human impacts, that is, nutrient enrichment, simultaneously drive spatial biodiversity patterns. However, there is little consensus about their independent effects on biodiversity. Here we manipulate nutrient enrichment in aquatic microcosms in subtropical and subarctic regions (China and Norway, respectively) to show clear segregation of bacterial species along temperature gradients, and decreasing alpha and gamma diversity toward higher nutrients. The temperature dependence of species richness is greatest at extreme nutrient levels, whereas the nutrient dependence of species richness is strongest at intermediate temperatures. For species turnover rates, temperature effects are strongest at intermediate and two extreme ends of nutrient gradients in subtropical and subarctic regions, respectively. Species turnover rates caused by nutrients do not increase toward higher temperatures. These findings illustrate direct effects of temperature and nutrients on biodiversity, and indirect effects via primary productivity, thus providing insights into how nutrient enrichment could alter biodiversity under future climate scenarios. DOI: 10.1038/ncomms13960 OPEN 1 State Key Laboratory of Lake Science and Environment, Nanjing Institute of Geography and Limnology, Chinese Academic of Sciences, Nanjing 210008, China. 2 Department of Geosciences and Geography, University of Helsinki, Helsinki FIN-00014, Finland. 3 Jiangsu Key Laboratory for Molecular and Medical Biotechnology, Nanjing Normal University, Nanjing 210023, China. 4 Finnish Environment Institute, Natural Environment Centre, Biodiversity, Oulu FI-90014, Finland. *These authors contributed equally to this work. Correspondence and requests for materials should be addressed to J.W. (email: [email protected]). NATURE COMMUNICATIONS | 7:13960 | DOI: 10.1038/ncomms13960 | www.nature.com/naturecommunications 1

Nutrient enrichment modifies temperature-biodiversity relationships in large-scale field experiments
Apr 12, 2017
Welcome message from author
This document is posted to help you gain knowledge. Please leave a comment to let me know what you think about it! Share it to your friends and learn new things together.
Transcript
ARTICLEReceived 15 Apr 2016 | Accepted 16 Nov 2016 | Published 21 Dec 2016
Nutrient enrichment modifiestemperature-biodiversity relationshipsin large-scale field experimentsJianjun Wang1,2,*, Feiyan Pan3,*, Janne Soininen2, Jani Heino4 & Ji Shen1
Climate effects and human impacts, that is, nutrient enrichment, simultaneously drive spatial
biodiversity patterns. However, there is little consensus about their independent effects on
biodiversity. Here we manipulate nutrient enrichment in aquatic microcosms in subtropical
and subarctic regions (China and Norway, respectively) to show clear segregation of bacterial
species along temperature gradients, and decreasing alpha and gamma diversity toward
higher nutrients. The temperature dependence of species richness is greatest at extreme
nutrient levels, whereas the nutrient dependence of species richness is strongest at
intermediate temperatures. For species turnover rates, temperature effects are strongest at
intermediate and two extreme ends of nutrient gradients in subtropical and subarctic regions,
respectively. Species turnover rates caused by nutrients do not increase toward higher
temperatures. These findings illustrate direct effects of temperature and nutrients on
biodiversity, and indirect effects via primary productivity, thus providing insights into how
nutrient enrichment could alter biodiversity under future climate scenarios.
DOI: 10.1038/ncomms13960 OPEN
1 State Key Laboratory of Lake Science and Environment, Nanjing Institute of Geography and Limnology, Chinese Academic of Sciences, Nanjing 210008,China. 2 Department of Geosciences and Geography, University of Helsinki, Helsinki FIN-00014, Finland. 3 Jiangsu Key Laboratory for Molecular and MedicalBiotechnology, Nanjing Normal University, Nanjing 210023, China. 4 Finnish Environment Institute, Natural Environment Centre, Biodiversity, Oulu FI-90014,Finland. * These authors contributed equally to this work. Correspondence and requests for materials should be addressed to J.W.(email: [email protected]).
NATURE COMMUNICATIONS | 7:13960 | DOI: 10.1038/ncomms13960 | www.nature.com/naturecommunications 1
Spatial patterns of biodiversity are a core topic in ecology;however, the mechanisms driving these patterns remainunclear. Climatic factors, especially temperature, are
regarded as the main drivers underlying diversity gradients overbroad spatial scales. For instance, the positive relationshipsbetween temperature and species richness prevail along gradientsin elevation and latitude, which are explained by numeroushypotheses, including the metabolic theory of ecology (MTE)1–3
and productivity-diversity hypothesis2. In the last 100 years, theEarth has warmed by B0.78 !C, and global mean temperaturesare projected to increase by 4.3±0.7 !C by the year 2100 (ref. 4).The changing temperatures may affect species richness becausetemperature covaries with primary productivity, limits thedistribution ranges of species and drives speciation rates1,5. Theincreased temperatures may favour higher species richness, butalso result in the extinction of endemic species in colder regions,such as at high elevations and latitudes6–8.
In addition, human impacts, such as nutrient enrichment, havebeen identified as one of the main drivers of biodiversity loss inrecent decades9. For instance, mountainous regions are becomingincreasingly impacted by settlements and transport networks10,and are facing more intensive forestry practices, agricultureactivities, eutrophication and habitat loss. Higher temperaturesand nutrient enrichment would increase the ecosystem primaryproductivity11, which could further affect species richness12.Thus, the interactions between climate change and humanimpacts on biodiversity make it difficult to predict the spatialpatterns of biodiversity13. The typical covariance between climaticfactors and human impacts14,15, such as that along elevationalgradients16, further complicates the evaluation of theirindependent roles in determining biodiversity patterns17. Theindependent effects of climate change and human impact onbiodiversity patterns have rarely been addressed18,19.
A promising approach to exploring climatic effects is theuse of macroecological experiments (that is, large-scale fieldexperiments) on mountainsides. This approach integrateselevational gradients with experimental manipulations of nutrientenrichment to explore the independent effects of climate andhuman impacts on biodiversity20,21. For instance, De Sassi et al.22
used a natural temperature gradient along elevations, combinedwith experimental nitrogen fertilization, to investigate the effectsof elevated temperature and increased anthropogenic nitrogendeposition on the structure and phenology of a grasslandherbivore assemblage. Such field experiments along naturalclimatic gradients can be used to disentangle climatic effectsfrom any effects of local environmental conditions over relativelylarge spatial scales.
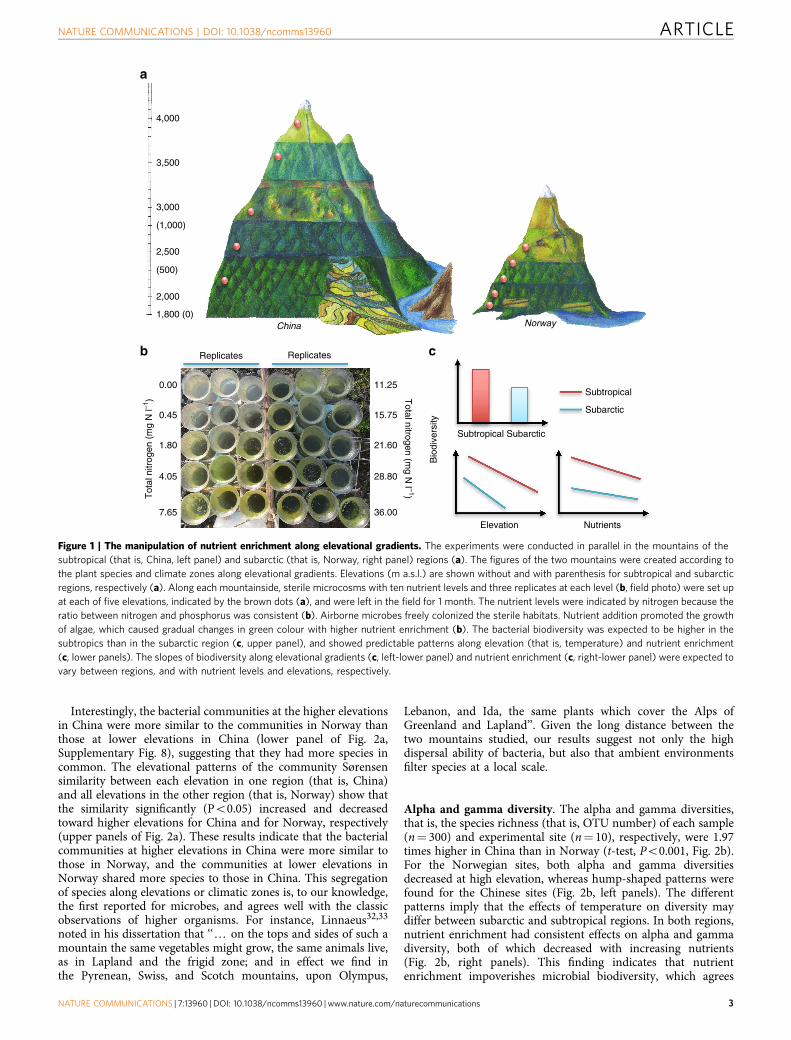
Here we conducted comparative field experiments ontwo mountainsides—in Norway and China—to examine theindependent effects of temperature and nutrient enrichment onaquatic bacterial richness and community composition (Fig. 1a).Along nutrient and elevation (that is, temperature) gradients,we established sterile aquatic microcosms composed of lakesediments and artificial lake water, then let airborne bacteriafreely colonize the sediments and water of microcosms (Fig. 1a,b).The microcosms were left in the field for 1 month before thesediments were collected, and sediment bacteria were examinedusing high-throughput sequencing of 16S rRNA genes. We chosebacteria as model organisms for two reasons. First, bacteria aresmall, abundant, diverse, essential to virtually all biogeochemicalcycles, and important components of ecosystems’ response toglobal change23,24. Second, bacteria can passively disperse overlong distances and adapt quickly to changing environments dueto rapid generation times and dormant-resistant stages25.Bacterial communities allow us to examine patterns of diversitywith a high degree of experimental control and replication in
natural field conditions that are subject to real species pool effects,experiments that cannot be conducted under laboratoryconditions or with larger organisms within feasible timeperiods26,27. Moreover, our recent field survey on the studymountains indicated that nutrients were one of the main driversof aquatic bacterial diversity28.
We considered three components of bacterial biodiversity:alpha, beta and gamma diversity29. Alpha diversity referred to thelocal bacterial species richness in each microcosm. Beta diversityreferred to the community differentiation among microcosms.Gamma diversity referred to the species richness of each elevation(that is, temperature) or nutrient level. We quantified betadiversity with the turnover rate of the distance-decay relationship(DDR)30,31, considering the variations in communitycomposition from one microcosm to another along temperatureor nutrient gradients. We addressed the following five questions:(1) How does the temperature effect on species richness varyalong a gradient in nutrient enrichment? (2) How does thenutrient-richness relationship (NRR) vary with elevation, asrepresentative of different temperature zones? (3) How does theslope of the temperature DDR, which is the community turnoverrate along the temperature gradient, vary with the gradient innutrients? (4) How does the species turnover rate along thenutrient enrichment gradient (that is, nutrient DDR) vary withtemperature? (5) How do nutrient enrichment and temperaturejointly influence bacterial communities? Our results show clearsegregation of bacterial species along temperature gradients, anddecreasing alpha and gamma diversity toward higher nutrients.The temperature dependence of species richness is weakest at theintermediate nutrient levels, whereas the nutrient dependence ofspecies richness is strongest at intermediate temperatures. Thus,our empirical evidence illustrates how temperature and nutrientsdirectly affect biodiversity, and also their indirect influence viaprimary productivity.
ResultsPrimary productivity and pH. In our experiments, linear andquadratic models were significantly (Po0.05, F-test) fitted formost of the relationships of temperature-primary productivity,as represented by Chlorophyll a (Chl a) (Supplementary Fig. 1),which shows that primary productivity was highly correlated withtemperature. Nutrient enrichment increased primary productivitymore strongly at lower elevations and in the subtropical region(Supplementary Fig. 2). This finding shows that nutrient effectson primary productivity were weaker at the colder temperatures,and indicates that in a warming climate, the ecosystemproductivity could be promoted more strongly than in currentclimate. Higher temperatures also resulted in higher water pH,especially at high nutrient concentrations (Supplementary Fig. 3).Nutrient concentrations correlated positively with water pH,particularly at low elevations (Supplementary Fig. 4). Chl a andpH were positively correlated at almost all nutrient levels andelevations (Supplementary Fig. 5).
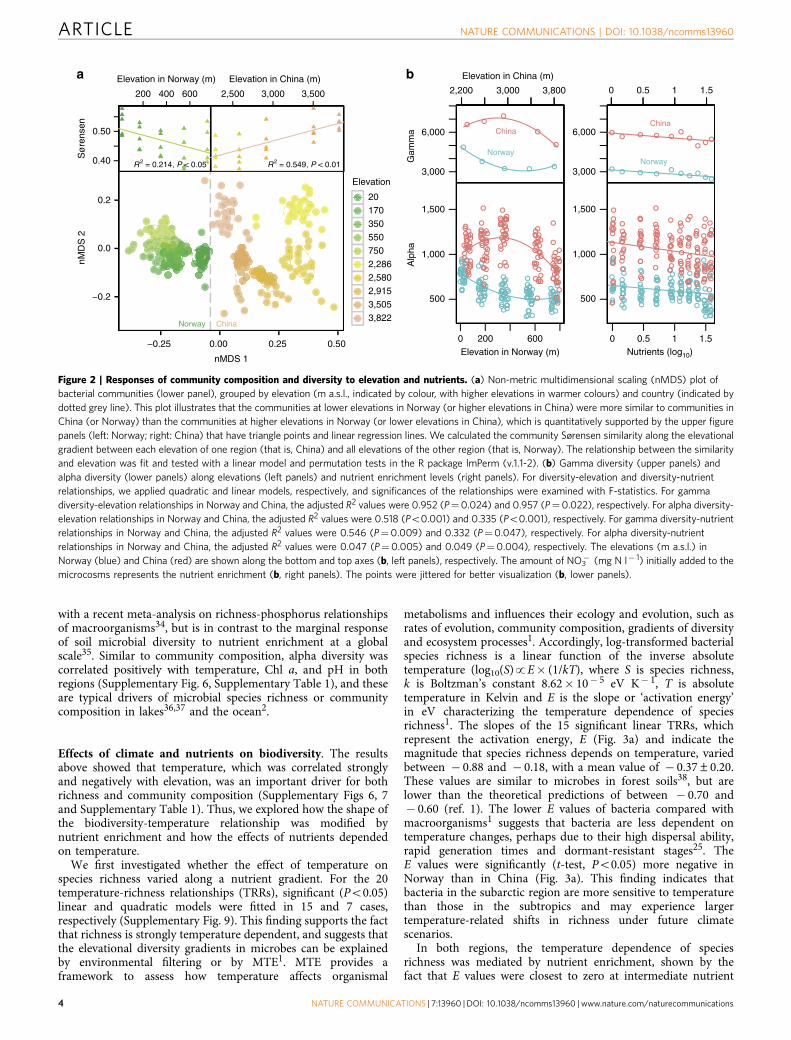
Community composition. Bacterial communities were groupedmainly by study region (r2¼ 0.332, Po0.01) and elevation(r2¼ 0.251, Po0.01) based on a permutational multivariateanalysis of variance (PERMANOVA) (Fig. 2a). Communitieswere also structured by local environments. In both regions,community variations were primarily related to elevation,temperature, pH, Chl a and nutrients according to multiplestatistical methods (that is, multiple regression analyses(Supplementary Table 1), Mantel tests, Pearson correlations(Supplementary Fig. 6) and canonical correspondenceanalysis (Supplementary Fig. 7)).
ARTICLE NATURE COMMUNICATIONS | DOI: 10.1038/ncomms13960
2 NATURE COMMUNICATIONS | 7:13960 | DOI: 10.1038/ncomms13960 | www.nature.com/naturecommunications
Interestingly, the bacterial communities at the higher elevationsin China were more similar to the communities in Norway thanthose at lower elevations in China (lower panel of Fig. 2a,Supplementary Fig. 8), suggesting that they had more species incommon. The elevational patterns of the community Sørensensimilarity between each elevation in one region (that is, China)and all elevations in the other region (that is, Norway) show thatthe similarity significantly (Po0.05) increased and decreasedtoward higher elevations for China and for Norway, respectively(upper panels of Fig. 2a). These results indicate that the bacterialcommunities at higher elevations in China were more similar tothose in Norway, and the communities at lower elevations inNorway shared more species to those in China. This segregationof species along elevations or climatic zones is, to our knowledge,the first reported for microbes, and agrees well with the classicobservations of higher organisms. For instance, Linnaeus32,33
noted in his dissertation that ‘‘y on the tops and sides of such amountain the same vegetables might grow, the same animals live,as in Lapland and the frigid zone; and in effect we find inthe Pyrenean, Swiss, and Scotch mountains, upon Olympus,
Lebanon, and Ida, the same plants which cover the Alps ofGreenland and Lapland’’. Given the long distance between thetwo mountains studied, our results suggest not only the highdispersal ability of bacteria, but also that ambient environmentsfilter species at a local scale.
Alpha and gamma diversity. The alpha and gamma diversities,that is, the species richness (that is, OTU number) of each sample(n¼ 300) and experimental site (n¼ 10), respectively, were 1.97times higher in China than in Norway (t-test, Po0.001, Fig. 2b).For the Norwegian sites, both alpha and gamma diversitiesdecreased at high elevation, whereas hump-shaped patterns werefound for the Chinese sites (Fig. 2b, left panels). The differentpatterns imply that the effects of temperature on diversity maydiffer between subarctic and subtropical regions. In both regions,nutrient enrichment had consistent effects on alpha and gammadiversity, both of which decreased with increasing nutrients(Fig. 2b, right panels). This finding indicates that nutrientenrichment impoverishes microbial biodiversity, which agrees
11.25
15.75
21.60
28.80
36.00
0.00
0.45
1.80
4.05
7.65
Total nitrogen (m
g N l –1)T
otal
nitr
ogen
(m
g N
l–1)
Subtropical Subarctic
Replicates
4,000
a
b c
3,500
3,000
2,500
2,000
(1,000)
(500)
1,800 (0)
Replicates
China Norway
Bio
dive
rsity
Elevation Nutrients
Subtropical
Subarctic
Figure 1 | The manipulation of nutrient enrichment along elevational gradients. The experiments were conducted in parallel in the mountains of thesubtropical (that is, China, left panel) and subarctic (that is, Norway, right panel) regions (a). The figures of the two mountains were created according tothe plant species and climate zones along elevational gradients. Elevations (m a.s.l.) are shown without and with parenthesis for subtropical and subarcticregions, respectively (a). Along each mountainside, sterile microcosms with ten nutrient levels and three replicates at each level (b, field photo) were set upat each of five elevations, indicated by the brown dots (a), and were left in the field for 1 month. The nutrient levels were indicated by nitrogen because theratio between nitrogen and phosphorus was consistent (b). Airborne microbes freely colonized the sterile habitats. Nutrient addition promoted the growthof algae, which caused gradual changes in green colour with higher nutrient enrichment (b). The bacterial biodiversity was expected to be higher in thesubtropics than in the subarctic region (c, upper panel), and showed predictable patterns along elevation (that is, temperature) and nutrient enrichment(c, lower panels). The slopes of biodiversity along elevational gradients (c, left-lower panel) and nutrient enrichment (c, right-lower panel) were expected tovary between regions, and with nutrient levels and elevations, respectively.
NATURE COMMUNICATIONS | DOI: 10.1038/ncomms13960 ARTICLE
NATURE COMMUNICATIONS | 7:13960 | DOI: 10.1038/ncomms13960 | www.nature.com/naturecommunications 3
with a recent meta-analysis on richness-phosphorus relationshipsof macroorganisms34, but is in contrast to the marginal responseof soil microbial diversity to nutrient enrichment at a globalscale35. Similar to community composition, alpha diversity wascorrelated positively with temperature, Chl a, and pH in bothregions (Supplementary Fig. 6, Supplementary Table 1), and theseare typical drivers of microbial species richness or communitycomposition in lakes36,37 and the ocean2.
Effects of climate and nutrients on biodiversity. The resultsabove showed that temperature, which was correlated stronglyand negatively with elevation, was an important driver for bothrichness and community composition (Supplementary Figs 6, 7and Supplementary Table 1). Thus, we explored how the shape ofthe biodiversity-temperature relationship was modified bynutrient enrichment and how the effects of nutrients dependedon temperature.
We first investigated whether the effect of temperature onspecies richness varied along a nutrient gradient. For the 20temperature-richness relationships (TRRs), significant (Po0.05)linear and quadratic models were fitted in 15 and 7 cases,respectively (Supplementary Fig. 9). This finding supports the factthat richness is strongly temperature dependent, and suggests thatthe elevational diversity gradients in microbes can be explainedby environmental filtering or by MTE1. MTE provides aframework to assess how temperature affects organismal
metabolisms and influences their ecology and evolution, such asrates of evolution, community composition, gradients of diversityand ecosystem processes1. Accordingly, log-transformed bacterialspecies richness is a linear function of the inverse absolutetemperature (log10(S)pE" (1/kT), where S is species richness,k is Boltzman’s constant 8.62" 10# 5 eV K# 1, T is absolutetemperature in Kelvin and E is the slope or ‘activation energy’in eV characterizing the temperature dependence of speciesrichness1. The slopes of the 15 significant linear TRRs, whichrepresent the activation energy, E (Fig. 3a) and indicate themagnitude that species richness depends on temperature, variedbetween # 0.88 and # 0.18, with a mean value of # 0.37±0.20.These values are similar to microbes in forest soils38, but arelower than the theoretical predictions of between # 0.70 and# 0.60 (ref. 1). The lower E values of bacteria compared withmacroorganisms1 suggests that bacteria are less dependent ontemperature changes, perhaps due to their high dispersal ability,rapid generation times and dormant-resistant stages25. TheE values were significantly (t-test, Po0.05) more negative inNorway than in China (Fig. 3a). This finding indicates thatbacteria in the subarctic region are more sensitive to temperaturethan those in the subtropics and may experience largertemperature-related shifts in richness under future climatescenarios.
In both regions, the temperature dependence of speciesrichness was mediated by nutrient enrichment, shown by thefact that E values were closest to zero at intermediate nutrient
Norway China
−0.2
0.0
0.2
−0.25 0.00 0.25 0.50
nMDS 1
nMD
S 2
Elevation
201703505507502,2862,5802,9153,5053,822
200 400 600
0.40
0.50
ba
R2 = 0.214, P < 0.05
Elevation in Norway (m)S
øre
nsen
2,500 3,000 3,500
R2 = 0.549, P < 0.01
Elevation in China (m)
3,000
6,000
Gam
ma China
Norway
2,200 3,000 3,800
500
1,000
1,500
0 200 600Elevation in Norway (m)
Alp
ha
3,000
6,000China
Norway
0 0.5 1 1.5
500
1,000
1,500
0 0.5 1 1.5
Elevation in China (m)
Nutrients (log10)
Figure 2 | Responses of community composition and diversity to elevation and nutrients. (a) Non-metric multidimensional scaling (nMDS) plot ofbacterial communities (lower panel), grouped by elevation (m a.s.l., indicated by colour, with higher elevations in warmer colours) and country (indicated bydotted grey line). This plot illustrates that the communities at lower elevations in Norway (or higher elevations in China) were more similar to communities inChina (or Norway) than the communities at higher elevations in Norway (or lower elevations in China), which is quantitatively supported by the upper figurepanels (left: Norway; right: China) that have triangle points and linear regression lines. We calculated the community Sørensen similarity along the elevationalgradient between each elevation of one region (that is, China) and all elevations of the other region (that is, Norway). The relationship between the similarityand elevation was fit and tested with a linear model and permutation tests in the R package lmPerm (v.1.1-2). (b) Gamma diversity (upper panels) andalpha diversity (lower panels) along elevations (left panels) and nutrient enrichment levels (right panels). For diversity-elevation and diversity-nutrientrelationships, we applied quadratic and linear models, respectively, and significances of the relationships were examined with F-statistics. For gammadiversity-elevation relationships in Norway and China, the adjusted R2 values were 0.952 (P¼0.024) and 0.957 (P¼0.022), respectively. For alpha diversity-elevation relationships in Norway and China, the adjusted R2 values were 0.518 (Po0.001) and 0.335 (Po0.001), respectively. For gamma diversity-nutrientrelationships in Norway and China, the adjusted R2 values were 0.546 (P¼0.009) and 0.332 (P¼0.047), respectively. For alpha diversity-nutrientrelationships in Norway and China, the adjusted R2 values were 0.047 (P¼0.005) and 0.049 (P¼0.004), respectively. The elevations (m a.s.l.) inNorway (blue) and China (red) are shown along the bottom and top axes (b, left panels), respectively. The amount of NO3
# (mg N l# 1) initially added to themicrocosms represents the nutrient enrichment (b, right panels). The points were jittered for better visualization (b, lower panels).
ARTICLE NATURE COMMUNICATIONS | DOI: 10.1038/ncomms13960
4 NATURE COMMUNICATIONS | 7:13960 | DOI: 10.1038/ncomms13960 | www.nature.com/naturecommunications
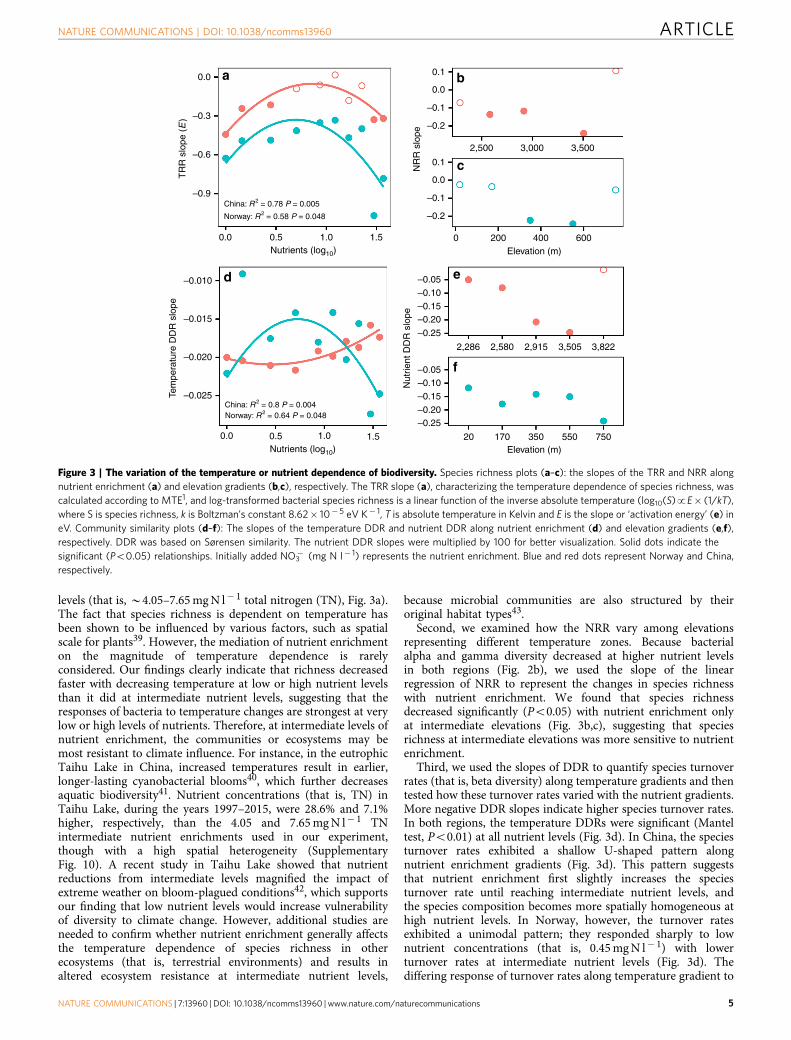
levels (that is, B4.05–7.65 mg N l# 1 total nitrogen (TN), Fig. 3a).The fact that species richness is dependent on temperature hasbeen shown to be influenced by various factors, such as spatialscale for plants39. However, the mediation of nutrient enrichmenton the magnitude of temperature dependence is rarelyconsidered. Our findings clearly indicate that richness decreasedfaster with decreasing temperature at low or high nutrient levelsthan it did at intermediate nutrient levels, suggesting that theresponses of bacteria to temperature changes are strongest at verylow or high levels of nutrients. Therefore, at intermediate levels ofnutrient enrichment, the communities or ecosystems may bemost resistant to climate influence. For instance, in the eutrophicTaihu Lake in China, increased temperatures result in earlier,longer-lasting cyanobacterial blooms40, which further decreasesaquatic biodiversity41. Nutrient concentrations (that is, TN) inTaihu Lake, during the years 1997–2015, were 28.6% and 7.1%higher, respectively, than the 4.05 and 7.65 mg N l# 1 TNintermediate nutrient enrichments used in our experiment,though with a high spatial heterogeneity (SupplementaryFig. 10). A recent study in Taihu Lake showed that nutrientreductions from intermediate levels magnified the impact ofextreme weather on bloom-plagued conditions42, which supportsour finding that low nutrient levels would increase vulnerabilityof diversity to climate change. However, additional studies areneeded to confirm whether nutrient enrichment generally affectsthe temperature dependence of species richness in otherecosystems (that is, terrestrial environments) and results inaltered ecosystem resistance at intermediate nutrient levels,
because microbial communities are also structured by theiroriginal habitat types43.
Second, we examined how the NRR vary among elevationsrepresenting different temperature zones. Because bacterialalpha and gamma diversity decreased at higher nutrient levelsin both regions (Fig. 2b), we used the slope of the linearregression of NRR to represent the changes in species richnesswith nutrient enrichment. We found that species richnessdecreased significantly (Po0.05) with nutrient enrichment onlyat intermediate elevations (Fig. 3b,c), suggesting that speciesrichness at intermediate elevations was more sensitive to nutrientenrichment.
Third, we used the slopes of DDR to quantify species turnoverrates (that is, beta diversity) along temperature gradients and thentested how these turnover rates varied with the nutrient gradients.More negative DDR slopes indicate higher species turnover rates.In both regions, the temperature DDRs were significant (Manteltest, Po0.01) at all nutrient levels (Fig. 3d). In China, the speciesturnover rates exhibited a shallow U-shaped pattern alongnutrient enrichment gradients (Fig. 3d). This pattern suggeststhat nutrient enrichment first slightly increases the speciesturnover rate until reaching intermediate nutrient levels, andthe species composition becomes more spatially homogeneous athigh nutrient levels. In Norway, however, the turnover ratesexhibited a unimodal pattern; they responded sharply to lownutrient concentrations (that is, 0.45 mg N l# 1) with lowerturnover rates at intermediate nutrient levels (Fig. 3d). Thediffering response of turnover rates along temperature gradient to
3,000
0.0 a
d e
f
b
c
0.0
0.1
–0.1
–0.2
2,500 3,500
0.0
0.1
–0.1
–0.2
–0.3
–0.6
–0.9
–0.05
–0.15
–0.25
–0.10
–0.20–0.015
–0.025
–0.010
–0.020–0.05
–0.15
–0.25
–0.10
–0.20
0.0
China: R2 = 0.78 P = 0.005
Norway: R2 = 0.58 P = 0.048
China: R2 = 0.8 P = 0.004Norway: R2 = 0.64 P = 0.048
Nutrients (log10)0.5 1.0 1.5
0.0Nutrients (log10)0.5 1.0 1.5
0 200
20 170 350 550 750
2,286
Nut
rient
DD
R s
lope
NR
R s
lope
TR
R s
lope
(E
)Te
mpe
ratu
re D
DR
slo
pe
2,580 2,915 3,505 3,822
400Elevation (m)
Elevation (m)
600
Figure 3 | The variation of the temperature or nutrient dependence of biodiversity. Species richness plots (a–c): the slopes of the TRR and NRR alongnutrient enrichment (a) and elevation gradients (b,c), respectively. The TRR slope (a), characterizing the temperature dependence of species richness, wascalculated according to MTE1, and log-transformed bacterial species richness is a linear function of the inverse absolute temperature (log10(S)pE" (1/kT),where S is species richness, k is Boltzman’s constant 8.62" 10# 5 eV K# 1, T is absolute temperature in Kelvin and E is the slope or ‘activation energy’ (e) ineV. Community similarity plots (d–f): The slopes of the temperature DDR and nutrient DDR along nutrient enrichment (d) and elevation gradients (e,f),respectively. DDR was based on Sørensen similarity. The nutrient DDR slopes were multiplied by 100 for better visualization. Solid dots indicate thesignificant (Po0.05) relationships. Initially added NO3
# (mg N l# 1) represents the nutrient enrichment. Blue and red dots represent Norway and China,respectively.
NATURE COMMUNICATIONS | DOI: 10.1038/ncomms13960 ARTICLE
NATURE COMMUNICATIONS | 7:13960 | DOI: 10.1038/ncomms13960 | www.nature.com/naturecommunications 5
nutrient enrichment for the two regions highlights the potentiallydifferent community assembly mechanisms constrained bynutrient and temperature gradients. Dissimilar mechanisms ofcommunity assembly (for example, species-sorting and dispersallimitation) have also been observed for temperate and tropicalforests44, and may also contribute to the strikingly differentbiodiversity gradients of these two biogeographic regions(Fig. 2b). The two patterns in turnover rate are alsoinconsistent with the findings of the communities in otherhabitats, such as the generally increasing turnover rate withincreasing primary productivity observed for freshwaterplankton45. The explanations for the inconsistency may be thepotential differences in productivity gradients among studiesbecause the nutrient gradient we considered here was extremelylong. Another reason could be the different organisms studied(that is, bacteria, phyto- and zooplankton, representingcontrasting trophic groups).
Fourth, we examined how species turnover rates on thenutrient gradient, quantified with nutrient DDR slopes, variedwith the temperature gradient. In both regions, the nutrientDDRs of each elevation were typically significant (Mantel test,Po0.05) (Fig. 3e,f). The significant DDR slopes decreasedsignificantly (Po0.05) toward high elevations (that is, decreasingtemperature) in China, but did not decrease significantly(P¼ 0.159) in Norway. This pattern indicates that the speciesturnover rate resulting from nutrient enrichment did not increaseat higher temperatures. Our results therefore differ from thefindings for other organisms, such as vascular plants46, whichshow that species turnover rates decrease toward high latitudes.This difference may have occurred because we consideredtemperature and nutrient enrichment as the sole primarydrivers for bacterial communities, which is unlikely under
natural conditions shaped by a higher number of covariantenvironmental drivers.
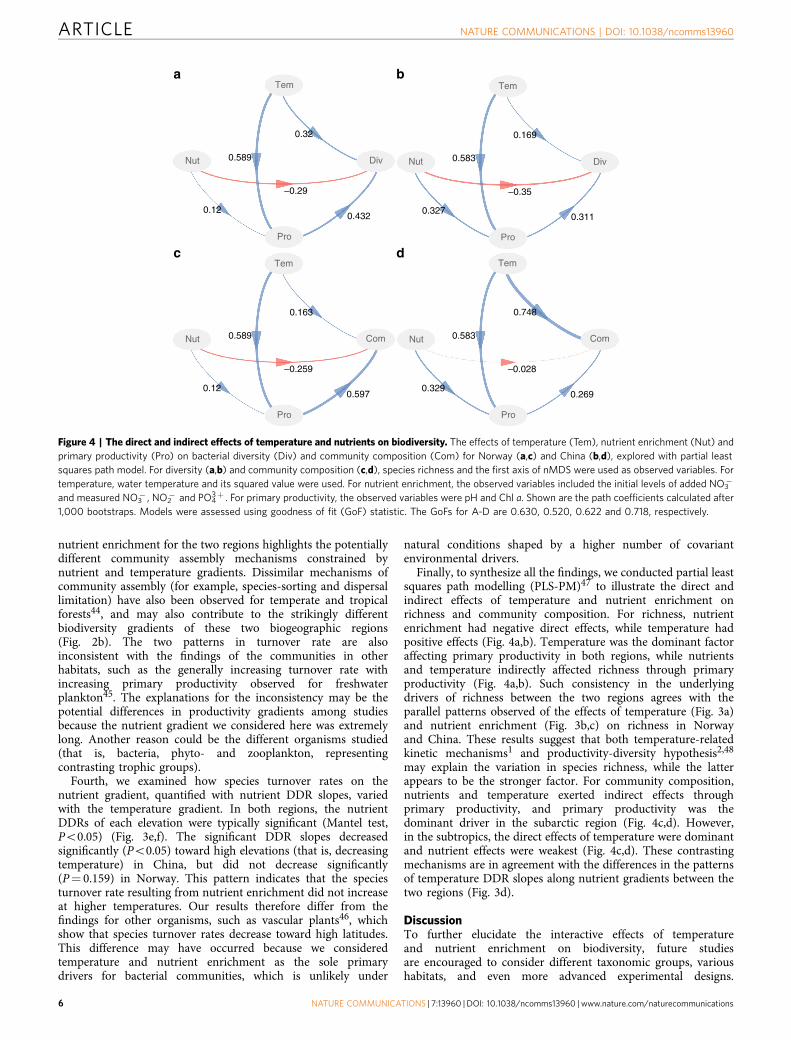
Finally, to synthesize all the findings, we conducted partial leastsquares path modelling (PLS-PM)47 to illustrate the direct andindirect effects of temperature and nutrient enrichment onrichness and community composition. For richness, nutrientenrichment had negative direct effects, while temperature hadpositive effects (Fig. 4a,b). Temperature was the dominant factoraffecting primary productivity in both regions, while nutrientsand temperature indirectly affected richness through primaryproductivity (Fig. 4a,b). Such consistency in the underlyingdrivers of richness between the two regions agrees with theparallel patterns observed of the effects of temperature (Fig. 3a)and nutrient enrichment (Fig. 3b,c) on richness in Norwayand China. These results suggest that both temperature-relatedkinetic mechanisms1 and productivity-diversity hypothesis2,48
may explain the variation in species richness, while the latterappears to be the stronger factor. For community composition,nutrients and temperature exerted indirect effects throughprimary productivity, and primary productivity was thedominant driver in the subarctic region (Fig. 4c,d). However,in the subtropics, the direct effects of temperature were dominantand nutrient effects were weakest (Fig. 4c,d). These contrastingmechanisms are in agreement with the differences in the patternsof temperature DDR slopes along nutrient gradients between thetwo regions (Fig. 3d).
DiscussionTo further elucidate the interactive effects of temperatureand nutrient enrichment on biodiversity, future studiesare encouraged to consider different taxonomic groups, varioushabitats, and even more advanced experimental designs.
Tema b
dcTem
0.163
–0.259
0.589
0.12
Nut
Pro
0.32
–0.29
0.589
0.12
Pro
0.432
Div DivNutNut 0.583
0.327
–0.35
Pro
0.169
Tem
Tem
0.311
0.748
ComCom
0.5970.329
Pro
0.269
–0.028
0.583Nut
Figure 4 | The direct and indirect effects of temperature and nutrients on biodiversity. The effects of temperature (Tem), nutrient enrichment (Nut) andprimary productivity (Pro) on bacterial diversity (Div) and community composition (Com) for Norway (a,c) and China (b,d), explored with partial leastsquares path model. For diversity (a,b) and community composition (c,d), species richness and the first axis of nMDS were used as observed variables. Fortemperature, water temperature and its squared value were used. For nutrient enrichment, the observed variables included the initial levels of added NO3
#
and measured NO3# , NO2
# and PO43þ . For primary productivity, the observed variables were pH and Chl a. Shown are the path coefficients calculated after
1,000 bootstraps. Models were assessed using goodness of fit (GoF) statistic. The GoFs for A-D are 0.630, 0.520, 0.622 and 0.718, respectively.
ARTICLE NATURE COMMUNICATIONS | DOI: 10.1038/ncomms13960
6 NATURE COMMUNICATIONS | 7:13960 | DOI: 10.1038/ncomms13960 | www.nature.com/naturecommunications
For instance, relevant comparison of communities of micro- andmacroorganisms49, or multiple habitats43, such as the overlyingwater and sediments in our microcosms, will go a long waytoward supporting broader conclusions regarding the effects oftemperature and nutrients on biota. Although microbialexperiments are not appropriate for all ecological questions,microbial manipulation experiments, for example, Vannetteand Fukami50, offer a complementary approach to fieldand laboratory studies of macroorganisms27. Furthermore,multiple analytical approaches of biological analysis, such asmetagenomics or Geochip51, would be helpful for understandingthe effects of temperature and nutrients on the functionaldiversity and various activities of communities35,52 and,consequently, their impacts on the ecosystem functioning andservices, which often depend on biodiversity11,53. The duration ofour experiments was one month, which is similar to that ofprevious microbial manipulation field studies investigatingthe underlying processes of community assembly26. Futureexperiments with a high-resolution time series and longerduration (for example, the 30-year and 150-year fertilizationexperiments on plant54 and microbial biodiversity55, respectively)and more global distribution (for example, Nutrient Network56)would provide more evidence for the dynamic patterns of theeffects of global change on global-scale biodiversity.
Collectively, we answered five specific questions regarding theeffects of temperature and nutrient enrichment on bacterialbiodiversity. By conducting experiments along climatic gradients,we have presented the first empirical evidence of the patterns andpathways of the effects of temperature and nutrient enrichmenton biodiversity in subtropical and subarctic regions. For over twocenturies, ecologists have documented the relationships betweenbiodiversity and temperature1–3,32, productivity2,12,45,48,57 oranthropogenic impacts19,35,56,58,59. The independent and inter-active effects of these factors are central to understanding theunderlying mechanisms responsible for the generation andmaintenance of biodiversity, and furthermore, to forecasting theeffects of global changes on biodiversity19. We believe ourfindings have important implications regarding these pivotaleffects on biodiversity.
First, our results highlight the fact that macroecologicalexperiments along environmental gradients (for example,mountain elevation gradients) are an important tool in ecologicalresearch because they allow for the disentangling the effects ofindividual environmental drivers on biodiversity, the independenteffects of which are not be easily separated due to their covariancein nature. The current findings using microbes as modelorganisms offer strong examples of the importance of the studyof global changes using integrating experiments and naturalenvironmental gradients, and illustrate an emerging approachwhich can be distributed globally to advance our predictiveunderstanding of ecological trends and responses. Second,temperature and nutrients play pivotal roles in maintainingelevational biodiversity patterns such that the temperaturedependence of species richness is strongest at very low and highnutrient enrichment, while the effect of nutrients on speciesrichness is strongest at intermediate temperatures. We foundclear segregation of bacterial species along temperature gradients(or climatic zones), and decreasing alpha and gamma diversitytoward higher nutrient levels. We documented the direct effectsof temperature and nutrient enrichment on biodiversity, and alsoshowed that both factors indirectly affected communities throughprimary productivity. Thus, we fill the knowledge gaps in howwell we understand the direct and indirect effects of climatechange and human impacts on the spatial patterns of biodiversity,and provide thoughtful insights into how nutrient enrichmentmay alter biodiversity under future climate scenarios.
MethodsExperimental design. The parallel field experiments were conducted in a subarcticregion, Balggesvarri Mountain in Norway (0–1,270 m a.s.l.), and in a subtropicalregion, Laojun Mountain in China (2,280–3,820 m a.s.l.)28, in July andSeptember–October 2013, respectively (Fig. 1a). The climate in the BalggesvarriMountain region is subarctic, with a growing season of B3 months. The annualtemperatures ranged from # 2.9–0.7 !C, with July temperatures ranging from 8 to16 !C. The tree line is located at B550 m a.s.l. The climate in the Laojun Mountainregion is subtropical. The annual temperatures ranged from 4.2–12.9 !C, with Julytemperatures varying from 17–25 !C. The tree line is located at B4,200 m a.s.l.
Along the side of each mountain, we selected unshaded locations at fivedifferent elevations. At each elevation, we set up 30 1.5 l bottles, which included tennutrient levels and three replicates of each level (Fig. 1b). The elevations were3,822, 3,505, 2,915, 2,580 and 2,286 m a.s.l. for China, and 750, 550, 350, 170 and20 m a.s.l. for Norway (Fig. 1b). The bottles of different nutrient levels andreplicates were arranged non-randomly at each elevation (Fig. 1b). The bottom ofeach bottle (B10% of the total bottle height) was buried in the local soil. We filledeach bottle with 1.2 l sterilized freshwater and 15 g sterilized sediments. Thesterilized sediments were prepared before the field experiments and were collectedfrom the centre of Taihu Lake in October 2012, freeze dried, and stored at # 20 !C.The sediments were autoclaved eight times at 121 !C for 30 min, dried at 110 !C for24 h, homogenized, and then aseptically canned with 15 g sediments per bottle forthe field experiments. The dried sediments were verified to be sterile by negativeDNA amplification using bacterial primers after DNA extraction following thesteps in the section ‘Bacterial community analyses’. No amplification results wereobserved. The artificial freshwater was prepared with sterilized MilliQ water andautoclaved at 121oC for 30 min, and the following salts were added: CaCl27.55 g l# 1, MgSO4 % 7H2O 6.78 g l# 1 and NHCO3 3.53 g l# 1. To facilitate the initialcolonization of heterogenetic microbes, 0.91 g l# 1 glucose was added. KNO3 wasadded at rates of 0.00, 0.45, 1.80, 4.05, 7.65, 11.25, 15.75, 21.60, 28.80 and36.00 mg N l# 1 to generate ten nutrient levels including the control of0.00 mg N l# 1. To compensate for the nitrate additions, KH2PO4 was added so thatthe N/P ratio of the overlying water was 14.93, which was similar to the annualaverage ratio in Taihu Lake during 2007 (14.49). The nutrient concentrations forthe experiments were selected according to the nutrient levels of the eutrophic LakeTaihu in China, and the highest nitrate concentration was based on the maximumTN of Taihu in 2007 (20.79 mg N l# 1).
The bottles were left in the field for 28 and 31 days, respectively, to allowairborne organisms (for example, bacteria) to colonize the water and sediments ofmicrocosms. The field setups were completed in 3 days. To keep the speciesdispersal events as natural as possible, we did not cover the experimental set-ups incase of rainfall. We checked the experimental set-ups twice during eachexperimental period, and added sterilized MilliQ water to obtain a final volume ofapproximately 1.2 l. Filling to a volume of 1.2 l with artificial freshwater into the1.5 l bottles ensured that the water would not overflow due to rain or splash out inthe heavy rains during the experimental periods.
To avoid the effects of daily temperature variation, we measured the watertemperature and pH within 2 h before noon at all elevations in the day before thefinal sample collection. At the end of the experimental period, we asepticallysampled the water and sediments of each bottle. The samples were frozen at# 20 !C after sampling until chemical and molecular analyses.
It should be noted that we analysed the sediment bacteria, but not the watercolumn bacteria. We did not use any specific natural aquatic bacterial communitiesfrom ponds or lakes in the current experiments, but established new communitiesvia post-dispersal effects. More details on the experimental design are provided inthe Supplementary Methods.
Physicochemical and biological analyses. Water ammonium (NH4þ ), nitrate
(NO3# ), nitrite (NO2
# ) and dissolved inorganic phosphorus (PO43# ) were mea-
sured with a flow injection analyser (Skalar SA1000, Breda, Netherlands). SedimentChl a was extracted with 90% acetone49. Sediment genomic DNA was extractedusing the phenol chloroform method, and bacterial 16S rRNA genes were amplifiedin triplicate using universal bacterial primers28. Real-time qPCR quantification ofbacterial 16S rRNA genes was performed on an iCycler iQ5 thermocycler (Bio-Rad,Hercules, CA) as described previously60. PCR products were sequenced with MiSeq(Illumina, San Diego, CA). The sequences were processed in QIIME (v1.8)28,61.OTUs were defined at 97% sequence similarity. The bacterial sequences wererarefied to 18,000 per sample. More details are provided in the SupplementaryMethods.
Statistical analyses. Non-metric multidimensional scaling (nMDS) was based onthe community Sørensen similarity, which is a popular beta diversity metric used inecological studies for DDRs31,62 and was applied in a general framework for thedistance-decay of similarity in ecological communities63. To test the hypothesisthat region and elevation structure the bacterial communities, PERMANOVA wasused64. To identify important environmental factors related to communities,we performed Mantel tests (permutations¼ 9,999) on the community Sørensensimilarity, Pearson correlations using the first axis of nMDS, and a canonicalcorrespondence analysis on species abundance data.
NATURE COMMUNICATIONS | DOI: 10.1038/ncomms13960 ARTICLE
NATURE COMMUNICATIONS | 7:13960 | DOI: 10.1038/ncomms13960 | www.nature.com/naturecommunications 7
We used linear and quadratic models to explore the relationships between alphaand gamma diversity with elevation and nutrient. The more appropriate model wasselected based on a lower value of Akaike’s information criterion65, and F-statisticwas used to test the significance of regression. We used Pearson correlations toexplore the relationships between species richness and environmental variables.We also applied stepwise multiple regression analyses with forward selection ofvariables to identify the most important environmental factors explainingcommunity composition (that is, sample scores on the first axis of nMDS) andspecies richness.
Water temperature was highly correlated with elevation, and was among thestrongest factors related to species richness and community composition(Supplementary Fig. 6); therefore, we used water temperature to explore therelationships between temperature and species richness or composition. For eachregion, we fit linear and quadratic models for the TRR of each nutrient level andfound the quadratic model to be better in 7 out of 20 cases. However, significantlinear models also fit well in 15 out of 20 cases (Supplementary Fig. 9). Thus, weexamined the TRR with the MTE, where the lognormal richness is a linear functionof temperature, expressed as 1/kT, in which k is Boltzmann’s constant and T isabsolute temperature in K. The slope of TRR was defined as the activation energy(E), indicating the temperature dependence of species richness. Furthermore, theslopes of the temperature DDR, based on Sørensen similarity, were used to explorethe turnover rates of species composition across temperature gradients. Finally, theslopes of TRR and temperature DDR were related to nutrient enrichment and therelationships were explored with linear and quadratic models. The better modelwas selected based on lower value of Akaike’s information criterion. For NRR, theslope of the linear regression was used to represent changes in species richness withnutrient enrichment (log10). The slopes of nutrient DDR were used to investigatethe turnover rates of species composition across nutrient gradients. Thesignificance of DDR slopes was tested with Mantel test (permutations¼ 9,999).
We explored the relationships between temperature, nutrient enrichment, andbacterial communities using PLS-PM in the R package plspm (V0.4.7)47. Thismethod is known as the partial least squares approach to structural equationmodelling and allows for the estimation of complex cause-effect relationshipmodels with latent variables47, which was especially suitable for our experimentaldata with strong environmental gradients. Five latent variables were used:temperature (the measured water temperature and its squared value), nutrientenrichment (the initially added nutrients and measured nutrients), primaryproductivity (Chl a and pH), diversity (species richness), and composition (the firstaxis of nMDS). We used pH as a proxy for primary productivity because of itspositive correlations with Chl a (Supplementary Fig. 5). Observed variables wereselected based on collinearity and prediction power for diversity and composition.Most of the loadings for observed variables on latent variables were40.7(Supplementary Fig. 11). We ran PLS-PM using 1,000 bootstraps to validate theestimates of path coefficients and the coefficients of determination47. Pathcoefficients represent the direction and strength of the linear relationships betweenvariables, or the direct effects. Indirect effects are the multiplied path coefficientsbetween a predictor and a response variable, adding the product of all possiblepaths excluding the direct effect. Models with different structures were evaluatedusing the goodness of fit statistic47.
Data availability. The amplicon sequences were deposited in MG-RAST underaccession number 17710. Other relevant data in this study are available from theauthors.
References1. Brown, J. H., Gillooly, J. F., Allen, A. P., Savage, V. M. & West, G. B. Toward a
metabolic theory of ecology. Ecology 85, 1771–1789 (2004).2. Fuhrman, J. A. et al. A latitudinal diversity gradient in planktonic marine
bacteria. Proc. Natl Acad. Sci. USA 105, 7774–7778 (2008).3. Stegen, J. C., Ferriere, R. & Enquist, B. J. Evolving ecological networks and the
emergence of biodiversity patterns across temperature gradients. Proc. R. Soc. BBiol. Sci. 279, 1051–1060 (2012).
4. Stocker, T. et al. Climate Change 2013: The Physical Science Basis(Cambridge University Press, 2014).
5. Colwell, R. K., Brehm, G., Cardelus, C. L., Gilman, A. C. & Longino, J. T. Globalwarming, elevational range shifts, and lowland biotic attrition in the wettropics. Science 322, 258–261 (2008).
6. Thomas, C. D. et al. Extinction risk from climate change. Nature 427, 145–148(2004).
7. Pacifici, M. et al. Assessing species vulnerability to climate change.Nat. Clim.Change 5, 215–224 (2015).
8. Bellard, C., Bertelsmeier, C., Leadley, P., Thuiller, W. & Courchamp, F. Impactsof climate change on the future of biodiversity. Ecol. Lett. 15, 365–377 (2012).
9. Newbold, T. et al. Global effects of land use on local terrestrial biodiversity.Nature 520, 45–50 (2015).
10. Price, M. F. Global Change in Mountain Regions (Sapiens Publishing, 2006).11. Isbell, F. et al. Nutrient enrichment, biodiversity loss, and consequent declines
in ecosystem productivity. Proc. Natl Acad. Sci. USA 110, 11911–11916 (2013).
12. Adler, P. B. et al. Productivity is a poor predictor of plant species richness.Science 333, 1750–1753 (2011).
13. Sax, D. F. & Gaines, S. D. Species diversity: from global decreases to localincreases. Trends. Ecol. Evol. 18, 561–566 (2003).
14. Noges, T. Relationships between morphometry, geographic location and waterquality parameters of European lakes. Hydrobiologia 633, 33–43 (2009).
15. Jeppesen, E. et al. Climate change effects on runoff, catchment phosphorusloading and lake ecological state, and potential adaptations. J. Environ. Qual.38, 1930–1941 (2009).
16. Nogues-Bravo, D., Araujo, M. B., Romdal, T. & Rahbek, C. Scale effects andhuman impact on the elevational species richness gradients. Nature 453,216–219 (2008).
17. Korner, C. The use of ’altitude’ in ecological research. Trends Ecol. Evol. 22,569–574 (2007).
18. Porter, E. M. et al. Interactive effects of anthropogenic nitrogen enrichment andclimate change on terrestrial and aquatic biodiversity. Biogeochemistry 114,93–120 (2012).
19. Mantyka-pringle, C. S., Martin, T. G. & Rhodes, J. R. Interactions betweenclimate and habitat loss effects on biodiversity: a systematic review andmeta-analysis. Global Change Biol. 18, 1239–1252 (2012).
20. Sundqvist, M. K., Sanders, N. J. & Wardle, D. A. Community and ecosystemresponses to elevational gradients: processes, mechanisms, and insights forglobal change. Annu. Rev. Ecol. Evol. Syst. 44, 261–280 (2013).
21. Dunne, J. A., Saleska, S. R., Fischer, M. L. & Harte, J. Integrating experimentaland gradient methods in ecological climate change research. Ecology 85,904–916 (2004).
22. de Sassi, C., Lewis, O. T. & Tylianakis, J. M. Plant-mediated and nonadditiveeffects of two global change drivers on an insect herbivore community. Ecology93, 1892–1901 (2012).
23. Prosser, J. I. et al. The role of ecological theory in microbial ecology. Nat. Rev.Microbiol. 5, 384–392 (2007).
24. Xue, K. et al. Tundra soil carbon is vulnerable to rapid microbial decompositionunder climate warming. Nat. Clim. Change 6, 595–600 (2016).
25. Lennon, J. T. & Jones, S. E. Microbial seed banks: the ecological andevolutionary implications of dormancy. Nat. Rev. Microbiol. 9, 119–130 (2011).
26. Bell, T. Experimental tests of the bacterial distance-decay relationship. ISME J.4, 1357–1365 (2010).
27. Jessup, C. M. et al. Big questions, small worlds: microbial model systems inecology. Trends Ecol. Evol. 19, 189–197 (2004).
28. Wang, J. et al. Regional and global elevational patterns of microbial speciesrichness and evenness. Ecography. doi: 10.1111/ecog.02216 (2017).
29. Whittaker, R. H. Vegetation of the Siskiyou Mountains, Oregon and California.Ecol. Monogr. 30, 279–338 (1960).
30. Harte, J., McCarthy, S., Taylor, K., Kinzig, A. & Fischer, M. L. Estimatingspecies-area relationships from plot to landscape scale using species spatial-turnover data. Oikos 86, 45–54 (1999).
31. Soininen, J., McDonald, R. & Hillebrand, H. The distance decay of similarity inecological communities. Ecography 30, 3–12 (2007).
32. Linnaeus, C. On the increase of the habitable earth. Amoenitates academicae 2,17–27 (1781).
33. Lomolino, M. V., Sax, D. F. & Brown, J. H. Foundations of Biogeography: ClassicPapers with Commentaries (University of Chicago Press, 2004).
34. Azevedo, L. B. et al. Species richness–phosphorus relationships for lakes andstreams worldwide. Glob. Ecol. Biogeogr. 22, 1304–1314 (2013).
35. Leff, J. W. et al. Consistent responses of soil microbial communities to elevatednutrient inputs in grasslands across the globe. Proc. Natl Acad. Sci. USA 112,10967–10972 (2015).
36. Lindstrom, E. S., Kamst-Van Agterveld, M. P. & Zwart, G. Distribution oftypical freshwater bacterial groups is associated with pH, temperature, and lakewater retention time. Appl. Environ. Microbiol. 71, 8201–8206 (2005).
37. Logue, J. B. et al. Freshwater bacterioplankton richness in oligotrophic lakesdepends on nutrient availability rather than on species-area relationships. ISMEJ. 6, 1127–1136 (2012).
38. Zhou, J. et al. Temperature mediates continental-scale diversity of microbes inforest soils. Nat. Commun. 7, 12083 (2016).
39. Wang, Z., Brown, J. H., Tang, Z. & Fang, J. Temperature dependence, spatialscale, and tree species diversity in eastern Asia and North America. Proc. NatlAcad. Sci. USA 106, 13388–13392 (2009).
40. Zhang, M., Duan, H., Shi, X., Yu, Y. & Kong, F. Contributions of meteorologyto the phenology of cyanobacterial blooms: implications for future climatechange. Water. Res. 46, 442–452 (2012).
41. Qin, B. et al. Lake eutrophication and its ecosystem response. Chin. Sci. Bull.58, 961–970 (2013).
42. Yang, Z. et al. Nutrient reduction magnifies the impact of extreme weather oncyanobacterial bloom formation in large shallow Lake Taihu (China). Water.Res. 103, 302–310 (2016).
43. Wang, J. et al. Phylogenetic beta diversity in bacterial assemblages acrossecosystems: deterministic versus stochastic processes. ISME J. 7, 1310–1321 (2013).
ARTICLE NATURE COMMUNICATIONS | DOI: 10.1038/ncomms13960
8 NATURE COMMUNICATIONS | 7:13960 | DOI: 10.1038/ncomms13960 | www.nature.com/naturecommunications
44. Myers, J. A. et al. Beta-diversity in temperate and tropical forests reflectsdissimilar mechanisms of community assembly. Ecol. Lett. 16, 151–157 (2013).
45. Chase, J. M. & Leibold, M. A. Spatial scale dictates the productivity-biodiversityrelationship. Nature 416, 427–430 (2002).
46. Qian, H. & Ricklefs, R. E. A latitudinal gradient in large-scale beta diversity forvascular plants in North America. Ecol. Lett. 10, 737–744 (2007).
47. Sanchez, G. PLS Path Modeling with R (Trowchez Editions, 2013).48. Vallina, S. M. et al. Global relationship between phytoplankton diversity and
productivity in the ocean. Nat. Commun. 5, 4299 (2014).49. Wang, J. et al. Contrasting patterns in elevational diversity between
microorganisms and macroorganisms. J. Biogeogr. 38, 595–603 (2011).50. Vannette, R. L. & Fukami, T. Historical contingency in species interactions:
towards niche-based predictions. Ecol. Lett. 17, 115–124 (2014).51. Zhou, J. et al. High-throughput metagenomic technologies for complex
microbial community analysis: open and closed formats. MBio. 6,e02288–02214 (2015).
52. Martiny, J. B. H., Jones, S. E., Lennon, J. T. & Martiny, A. C. Microbiomes inlight of traits: a phylogenetic perspective. Science 350, aac9323 (2015).
53. Tilman, D., Reich, P. B. & Isbell, F. Biodiversity impacts ecosystem productivityas much as resources, disturbance, or herbivory. Proc. Natl Acad. Sci. USA 109,10394–10397 (2012).
54. Isbell, F., Tilman, D., Polasky, S., Binder, S. & Hawthorne, P. Low biodiversitystate persists two decades after cessation of nutrient enrichment. Ecol. Lett. 16,454–460 (2013).
55. Liang, Y. et al. Over 150 years of long-term fertilization alters spatial scaling ofmicrobial biodiversity. Mbio. 6, e00240–00215 (2015).
56. Borer, E. T. et al. Finding generality in ecology: a model for globally distributedexperiments. Method. Ecol. Evol. 5, 65–73 (2014).
57. Grace, J. B. et al. Integrative modelling reveals mechanisms linking productivityand plant species richness. Nature 529, 390–393 (2016).
58. Hautier, Y. et al. Eutrophication weakens stabilizing effects of diversity innatural grasslands. Nature 508, 521–525 (2014).
59. Piggott, J. J., Salis, R. K., Lear, G., Townsend, C. R. & Matthaei, C. D. Climatewarming and agricultural stressors interact to determine stream periphytoncommunity composition. Global Change Biol. 21, 206–222 (2015).
60. Shen, J., Zhang, L., Guo, J., Ray, J. L. & He, J. Impact of long-term fertilizationpractices on the abundance and composition of soil bacterial communities inNortheast China. Appl. Soil. Ecol. 46, 119–124 (2010).
61. Caporaso, J. G. et al. QIIME allows analysis of high-throughput communitysequencing data. Nat. Meth. 7, 335–336 (2010).
62. Powell, J. R. et al. Deterministic processes vary during community assembly forecologically dissimilar taxa. Nat. Commun. 6, 8444 (2015).
63. Morlon, H. et al. A general framework for the distance-decay of similarity inecological communities. Ecol. Lett. 11, 904–917 (2008).
64. Anderson, M. J. A new method for non parametric multivariate analysis ofvariance. Austral Ecol. 26, 32–46 (2001).
65. Yamaoka, K., Nakagawa, T. & Uno, T. Application of Akaike’s informationcriterion (AIC) in the evaluation of linear pharmacokinetic equations.J. Pharmacokinet. Biopharm. 6, 165–175 (1978).
AcknowledgementsWe are grateful to C.Y. Zhang, L.Z. Dai, X.Y. Cheng, K. Yang, J.D. Xu, Y.C. Wu,J.Z. Zhou, L.Y. Wu, C.Q. Wen, P. Zhang, Y.L. Zhang, X.M. Tang and B.Q. Qin for fieldsampling, lab analyses or data providing; to Z.J. Wang and Z.S. An for fund notice; and toS. Langenheder and J. Stegen for comments on the manuscript. We appreciate CNERN,Taihu Laboratory for Lake Ecosystem Research for providing data of Taihu Lake. J.W.was supported by NSFC grants (41273088, 41571058), The Program of Global Changeand Mitigation (2016YFA0600502), Key Research Program of Frontier Sciences, CAS(QYZDJ-SSW-DQC030), The National Geographic Air and Water Conservation Fund(GEFC12-14), CAS oversea visiting scholarship (2011-115) and NSFC grant (40903031).J.So and J.W. were supported by Emil Aaltonen Foundation. J.Sh was supported by 973Program (2012CB956100) and the international partnership program for creativeresearch teams (KZZD-EW-TZ-08).
Author contributionsJ.W. led in conceiving the ideas, with the contributions from J.So and F.P. J.W.and F.P. performed the field experiments, sample collection and the analyses ofenvironmental variables. F.P. carried out the DNA preparation and sequence analyses.J.W. and J.So performed the data analyses. J.W. led the writing, with the contributionsfrom the other authors. All co-authors contributed intellectual inputs and commented onthe final version of the manuscript.
Additional informationSupplementary Information accompanies this paper at http://www.nature.com/naturecommunications
Competing financial interests: The authors declare no competing financialinterests.
Reprints and permission information is available online at http://npg.nature.com/reprintsandpermissions/
How to cite this article: Wang, J. et al. Nutrient enrichment modifies temperature-biodiversity relationships in large-scale field experiments. Nat. Commun. 7, 13960doi: 10.1038/ncomms13960 (2016).
Publisher’s note: Springer Nature remains neutral with regard to jurisdictional claims inpublished maps and institutional affiliations.
This work is licensed under a Creative Commons Attribution 4.0International License. The images or other third party material in this
article are included in the article’s Creative Commons license, unless indicated otherwisein the credit line; if the material is not included under the Creative Commons license,users will need to obtain permission from the license holder to reproduce the material.To view a copy of this license, visit http://creativecommons.org/licenses/by/4.0/
r The Author(s) 2016
NATURE COMMUNICATIONS | DOI: 10.1038/ncomms13960 ARTICLE
NATURE COMMUNICATIONS | 7:13960 | DOI: 10.1038/ncomms13960 | www.nature.com/naturecommunications 9

Supplementary Methods 1
Experimental design 2
We analysed the sediment bacteria, but not the water column bacteria, for the 3
following five reasons. Firstly, the natural aquatic systems are mostly composed of 4
sediment and water; thus, the sediment is an essential part of aquatic microcosms. By 5
adding both sediment and artificial lake water, we experimentally assembled whole, 6
natural aquatic environments. Secondly, sediment acts as a minimal medium with all the 7
necessary nutrients and mineral elements for the growth of microorganisms that are not 8
contained in the artificial lake water. Thirdly, we expected that the sediment bacteria 9
would be less influenced by disturbance effects because the sediment bacteria were in 10
more stable physical conditions than the water column bacteria. The sediment was below 11
the ground surface, and thus the sediment bacteria were less exposed to ambient 12
environmental variations, such as UV radiation, than the bacteria in the water column. 13
Sediment bacteria may also face less grazing pressure from higher organisms than water 14
column bacteria, which are prone to grazing. Fourthly, we expected that the sediment 15
bacteria were less structured by stochastic processes because they were environmentally 16
selected, first by water column and then by sediment. Our previous study showed that 17
deterministic processes are more important in structuring the bacterial communities in 18
sediments than of the overlying water within aquatic environments 1. Finally, compared 19
to water column bacteria, especially those with low nutrient supply and thus with low 20
biomass, sediment bacteria were much easier to collect after siphoning out the overlying 21
water, preserve in sterile tubes in the field conditions, and examine with molecular 22
methods. We faced practical issues with sampling the bacteria in the overlying water 23
because of the very large nutrient gradients. For example, the bacterial biomass in the 24
overlying water at the lowest nutrient treatment (e.g., controls) was too low for the DNA 25
analyses with the small volume of overlying water left over after the chemical analyses. 26
Furthermore, we considered a large number of samples from each mountain, and the 27
logistical issues thus prevented us from efficiently sampling the water-column bacteria. 28
Due to the remote field conditions, we could not manually the filter water samples in situ 29
for bacteria within a reasonable time period, and it was not possible to carry the water 30
back to the laboratory. Even if the water had been transferred to the laboratory, the 31
experimental delay (e.g., in days) would likely to happen for additional water-filtering 32
manipulations. 33
In the one-month-incubation experiments, the sediment bacterial species were 34
selected by two environmental filters, the overlying water and sediments. The simplified 35
experimental ecosystems were highly suitable for the examination of the relative 36
importance of temperature and nutrient factors on bacterial communities. Because 37
bacterial species are mainly dispersed through the air, the colonized communities allowed 38
us to capture the most natural local or regional species pools possible. Due to the multiple 39
dispersal sources of bacterial species at local, regional, and global scales 2, 3, we could not 40
identify the exact origins of sediment bacteria in the microcosms. This challenge was 41
especially prevalent after the bacteria in the sediment were further filtered by the local 42
environments of the overlying water and sediment in the microcosms. Thus, we did not 43
examine bacterial communities of the samples from other local habitats, such as air dust, 44
soil, streams, and lakes, to track the sources of sediment bacteria in the microcosms. 45

We did not use any specific natural aquatic bacterial communities from ponds or 46
lakes in the current experiments, but established new communities via post-dispersal 47
effects. By using sterile microcosms, we simplified the underlying processes for the 48
observed bacterial communities by partly eliminating the legacies of historical events that 49
affect the communities in natural ponds or lakes. This is because, together with 50
contemporary environmental filtering, historical contingencies are one of the main forces 51
affecting present-day microbial communities 4. Compared to the microcosms, natural 52
aquatic environments such as ponds or lakes are influenced by numerous covariant 53
variables that are difficult to control for but that are important for organisms 5, 6, 7. (1) The 54
origin of natural aquatic environments affects the evolution and dispersal history of 55
species in their biological communities. For instance, the selected lakes might have 56
different origin and formation histories that affect their morphology and hydrological 57
conditions. (2) Catchment area, surrounding vegetation, and local physical-chemical 58
conditions also vary spatially and affect the aquatic biota. (3) The initial communities 59
based on natural communities of ponds or lakes can differ spatially thus resulting in very 60
heterogeneous initial communities, and the biological interactions with other organisms 61
are probably more complex in nature than in our experimental microcosms. (4) To have 62
consistent initial communities by inoculating microcosms with natural communities of 63
ponds or lakes (i.e., the sediment bacteria in Taihu Lake) is less feasible for such broad-64
scale experiments due to the difficulties in preserving and transporting these natural 65
aquatic communities for large distances and long periods of time. (5) Most importantly, 66
using natural communities from ponds or lakes as the initial community does not 67
eliminate the dispersal effects from the air, and thus the potential for strong priority 68
effects 8 that would likely occur. This is because the air is one of the main dispersal 69
routes for bacterial species in nearly all surface aquatic environments 9, 10, 11. 70
71
Physicochemical analyses 72
The concentrations of ammonium (NH4+), nitrate (NO3
-), nitrite (NO2-), and dissolved 73
inorganic phosphorus (PO43-) in the overlying water were measured with a flow injection 74
analyser (Skalar SA1000, Breda, Netherlands). The sediment total organic carbon (TOC) 75
was determined using a solid TOC analyser (SSM-5000A, Shimadzu, Japan). The 76
sterilized sediments before the field experiments were measured for the above variables 77
in three replicates. 78
We did not measure all the potentially important variables for the bacterial 79
communities in the sediment, such as oxygen concentration or UV radiation. This is 80
largely because we have no evidence about the potential importance of these variables on 81
sediment microbial communities. Further, we do not expect these potential effects to be 82
stronger than nutrient and temperature effects considered in our study. This is because the 83
bottles were buried in the local soil to approximately 10% of the total bottle height, and 84
the sediment in each bottle was below the ground surface. Therefore, it is unlikely that 85
UV radiation would have had strong effects on these communities that would mask the 86
temperature or nutrient effects on the bacteria. In addition, we added 15 g sterilized 87
sediment to the bottom of each bottle, which created a sediment layer of approximately 5 88
mm. Based on our previous studies on the oxygen concentrations at the sediment-water 89
interface in eutrophic lakes, e.g., Wang et al. 12, 13, the 5-mm sediment layer would be less 90
likely to be anoxic during the experimental period, especially with the shallow overlying 91

water column (approximately 18 cm) and low total organic carbon (0.587 ± 0.390%). 92
93
Bacterial community analyses 94
Genomic DNA was extracted from freeze-dried sediments using the phenol 95
chloroform method 14. Real-time qPCR quantification of bacterial 16S rRNA genes in 96
sediments was performed on an iCycler iQ5 thermocycler (Bio-Rad, Hercules, USA) as 97
described previously 15. Bacterial 16S rRNA genes were sequenced using MiSeq 98
(Illumina, San Diego, USA) as described previously 16. We amplified 16S rRNA genes in 99
triplicate using the universal bacterial primers 515F, 5’-GTGCCAGCMGCCGCGGTAA-100
3’ and 806R, 5’-GGACTACHVGGGTWTCTAAT-3’, targeting the V4 region. Positive 101
PCR products were confirmed with agarose gel electrophoresis. PCR products from 102
triplicate reactions were combined and quantified with PicoGreen. PCR products from 103
samples sequenced in the same MiSeq run were pooled at equal molality. The pooled 104
mixture was purified with a QIAquick Gel Extraction Kit (QIAGEN Sciences, 105
Germantown, USA) and re-quantified with PicoGreen. Sample libraries were prepared 106
according to the MiSeqTM Reagent Kit Preparation Guide (Illumina, San Diego, USA). 107
We processed the sequences primarily using the QIIME pipeline (v1.8) 17 following 108
recent references e.g., 16, 18. Briefly, overlapped paired-end sequences from MiSeq were 109
assembled using FLASH 19 and poorly overlapped and poor quality sequences were 110
filtered out before de-multiplexing based on barcodes. Then, the sequences were 111
clustered into OTUs at 97% pairwise identity with the seed-based uclust algorithm 20. 112
After chimeras were removed via Uchime, and representative sequences from each OTU 113
were aligned to the Greengenes imputed core reference alignment V.201308 21 using 114
PyNAST 22. The taxonomic identity of each representative sequence was determined 115
using the RDP Classifier 23 and chloroplasts were removed. 116
We removed singletons before the subsequent analyses, which is a common 117
procedure in microbial studies, and has been highly recommended in popular microbial 118
analysis pipelines even before the generation of OTU tables (Supplementary Fig. 12). We 119
found that the removal of singletons and rare species (e.g., those occurring in less than 6 120
samples) did not notably affect the patterns in species richness in our data 121
(Supplementary Fig. 12). To keep the reported results as simple as possible, we used the 122
community OTU table without singletons for all analyses. For Archaea, we obtained 102 123
sequences from 42 out of 300 total samples. These archaeal sequences can be classified 124
into 13 OTUs related to the families Nitrososphaeraceae, Nitrosocaldaceae, 125
Methanocellaceae, Methanobacteriaceae, Methanomicrobiaceae, Methanosaetaceae, 126
Sulfolobaceae, and DHVEG-1. Due to the insufficient sequence number for Archaea, we 127
excluded all archaeal sequences from the data. 128
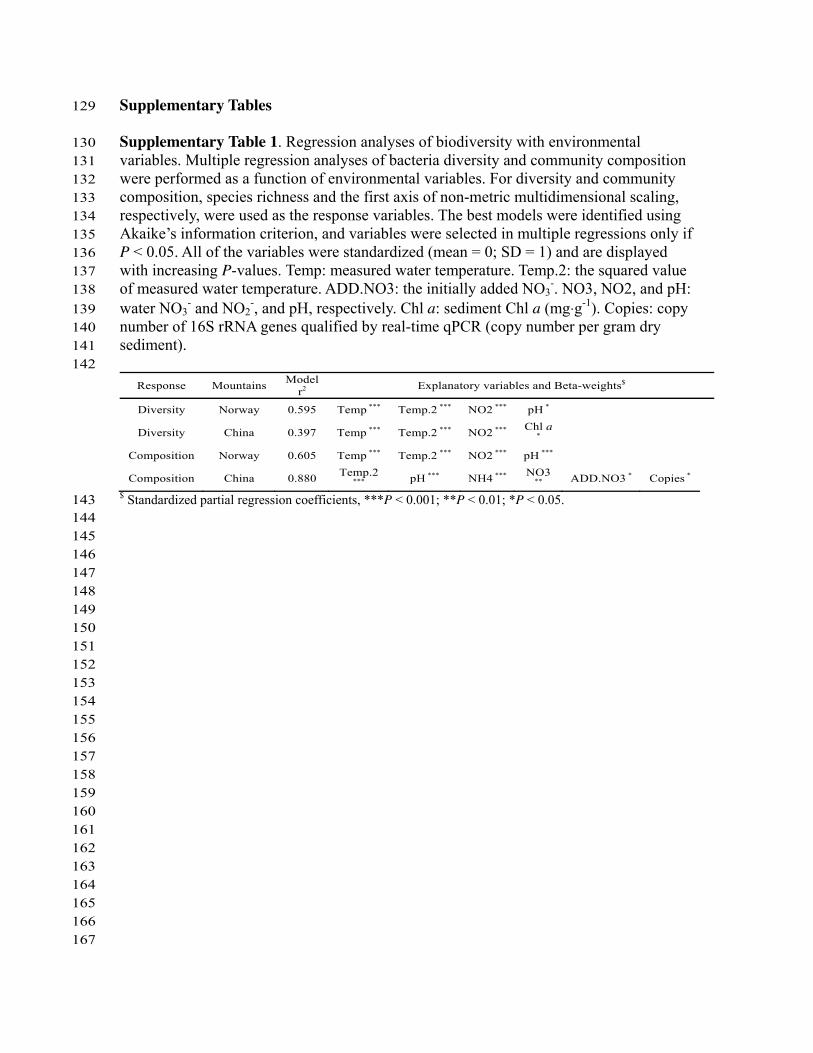
Supplementary Tables 129
Supplementary Table 1. Regression analyses of biodiversity with environmental 130 variables. Multiple regression analyses of bacteria diversity and community composition 131 were performed as a function of environmental variables. For diversity and community 132 composition, species richness and the first axis of non-metric multidimensional scaling, 133 respectively, were used as the response variables. The best models were identified using 134 Akaike’s information criterion, and variables were selected in multiple regressions only if 135 P < 0.05. All of the variables were standardized (mean = 0; SD = 1) and are displayed 136 with increasing P-values. Temp: measured water temperature. Temp.2: the squared value 137 of measured water temperature. ADD.NO3: the initially added NO3
-. NO3, NO2, and pH: 138 water NO3
- and NO2-, and pH, respectively. Chl a: sediment Chl a (mg⋅g-1). Copies: copy 139
number of 16S rRNA genes qualified by real-time qPCR (copy number per gram dry 140 sediment). 141 142
Response Mountains Model r2 Explanatory variables and Beta-weights$
Diversity Norway 0.595 Temp *** Temp.2 *** NO2 *** pH *
Diversity China 0.397 Temp *** Temp.2 *** NO2 *** Chl a *
Composition Norway 0.605 Temp *** Temp.2 *** NO2 *** pH *** Composition China 0.880 Temp.2
*** pH *** NH4 *** NO3** ADD.NO3 * Copies *
$ Standardized partial regression coefficients, ***P < 0.001; **P < 0.01; *P < 0.05. 143 144 145 146 147 148 149 150 151 152 153 154 155 156 157 158 159 160 161 162 163 164 165 166 167
168 Supplementary Figures169
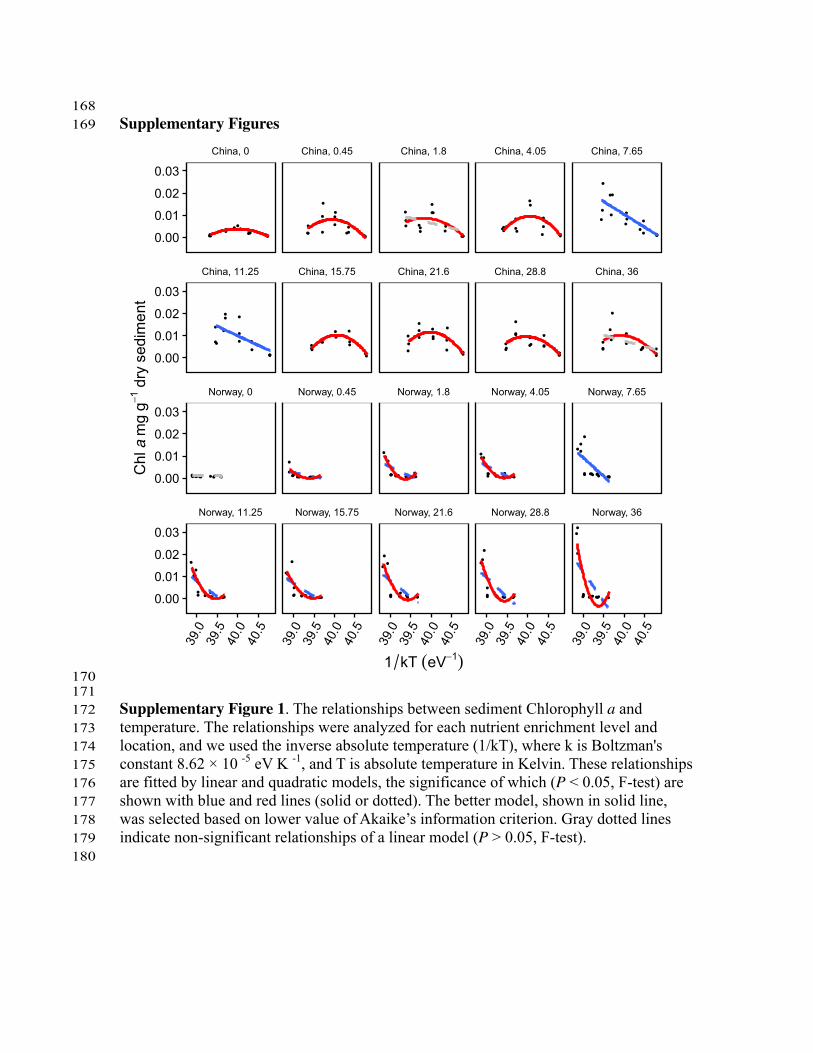
170 171 Supplementary Figure 1. The relationships between sediment Chlorophyll a and 172 temperature. The relationships were analyzed for each nutrient enrichment level and 173 location, and we used the inverse absolute temperature (1/kT), where k is Boltzman's 174 constant 8.62 × 10 -5 eV K -1, and T is absolute temperature in Kelvin. These relationships 175 are fitted by linear and quadratic models, the significance of which (P < 0.05, F-test) are 176 shown with blue and red lines (solid or dotted). The better model, shown in solid line, 177 was selected based on lower value of Akaike’s information criterion. Gray dotted lines 178 indicate non-significant relationships of a linear model (P > 0.05, F-test). 179 180
●●●●●●● ●●●●●●●● ●●●●●
●●●
●
●
●
●
●●● ●●●
●●●
●●●
●●●
●
●●
●●●●
●●
●
●●
●
●●●●●
●●●●●
●
●●●
●
●
●
●●
●
●●●
●●●
●●
●
●
●●
●
●
●●●●
●
●●●●●●●●
●●● ●●●●●
●●●●
●
●●
●●
● ●●●●●●●
●●
●●
●
●●●
●●●●●●
●●●
●
●●
●●●
●●●●●●●●● ●●● ●●●●●●
●●●●●● ●●● ●●●
●●●
●●●●●● ●●● ●●●
●●●
●●● ●●● ●●● ●●●
●●●
●
●
● ●●● ●●● ●●●
●●
●
●●
●
●●● ●●● ●●●
●
●●
●●● ●●●●●● ●●●
●●●
●●● ●●● ●●● ●●●
●●●
●●● ●●● ●●● ●●●
●
●●
●●● ●●● ●●● ●●●
China, 0 China, 0.45 China, 1.8 China, 4.05 China, 7.65
China, 11.25 China, 15.75 China, 21.6 China, 28.8 China, 36
Norway, 0 Norway, 0.45 Norway, 1.8 Norway, 4.05 Norway, 7.65
Norway, 11.25 Norway, 15.75 Norway, 21.6 Norway, 28.8 Norway, 36
0.00
0.01
0.02
0.03
0.00
0.01
0.02
0.03
0.00
0.01
0.02
0.03
0.00
0.01
0.02
0.03
39.0
39.5
40.0
40.5
39.0
39.5
40.0
40.5
39.0
39.5
40.0
40.5
39.0
39.5
40.0
40.5
39.0
39.5
40.0
40.5
1 kT (eV−1)
Chl
a m
g g−1
dry
sed
imen
t
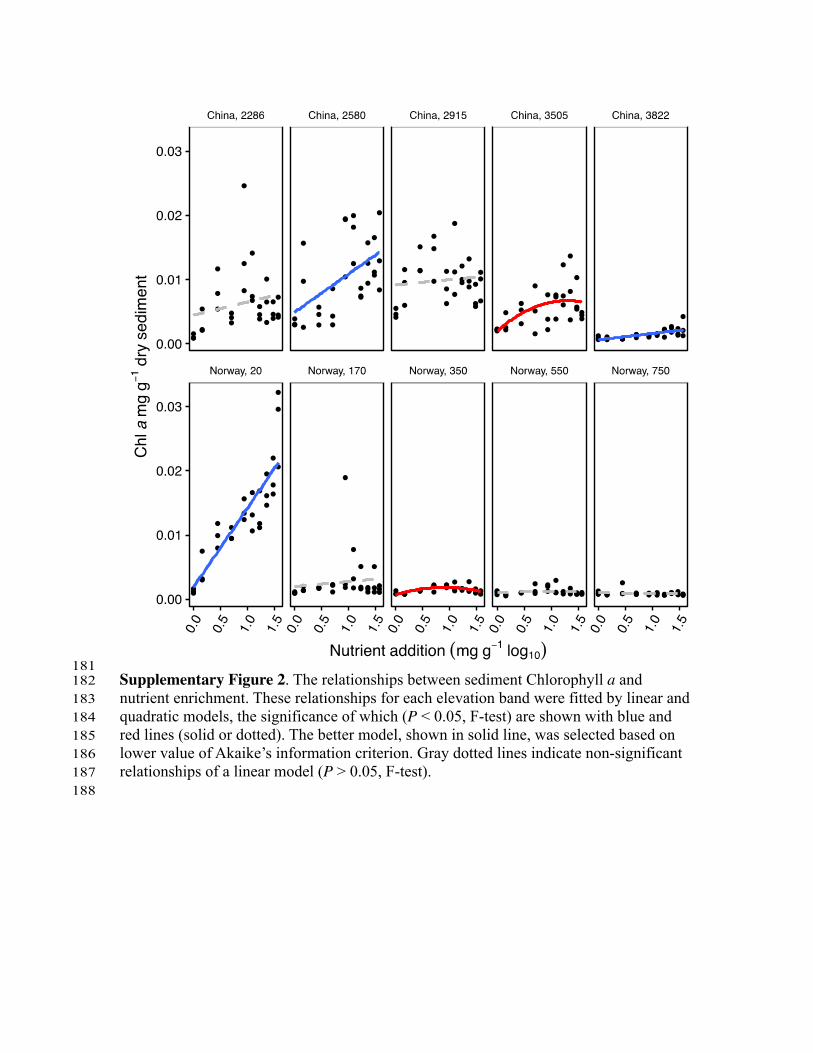
181 Supplementary Figure 2. The relationships between sediment Chlorophyll a and 182 nutrient enrichment. These relationships for each elevation band were fitted by linear and 183 quadratic models, the significance of which (P < 0.05, F-test) are shown with blue and 184 red lines (solid or dotted). The better model, shown in solid line, was selected based on 185 lower value of Akaike’s information criterion. Gray dotted lines indicate non-significant 186 relationships of a linear model (P > 0.05, F-test). 187 188
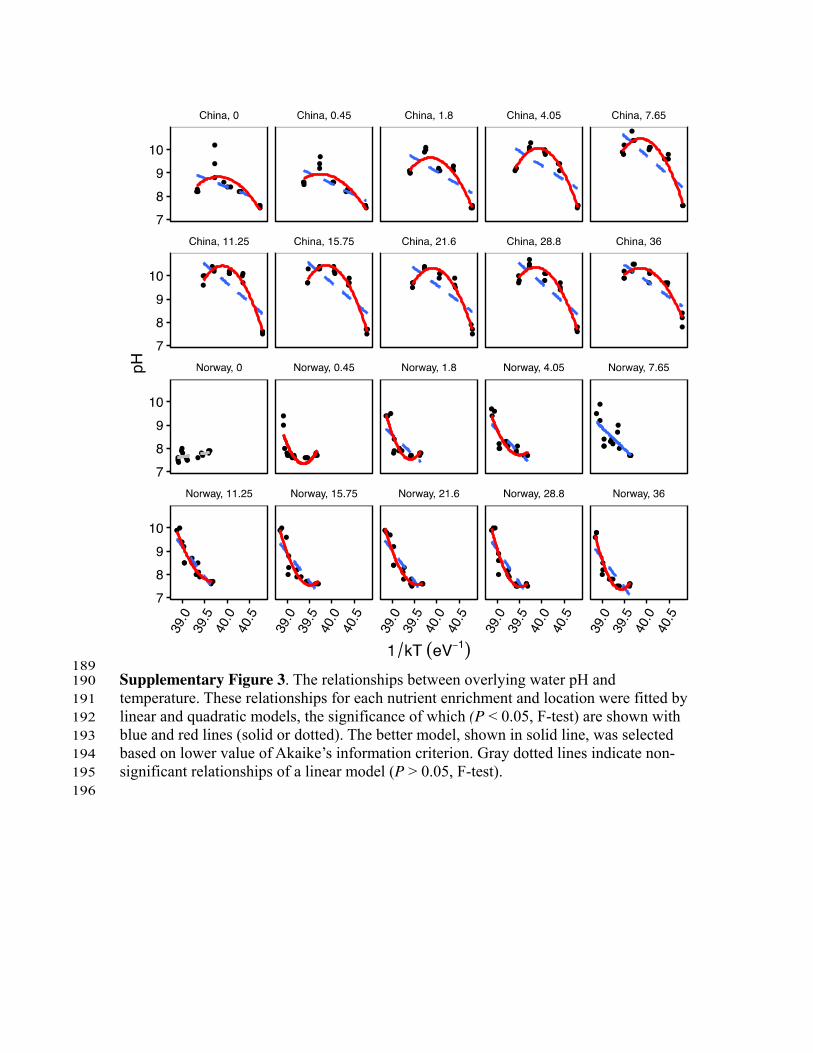
189 Supplementary Figure 3. The relationships between overlying water pH and 190 temperature. These relationships for each nutrient enrichment and location were fitted by 191 linear and quadratic models, the significance of which (P < 0.05, F-test) are shown with 192 blue and red lines (solid or dotted). The better model, shown in solid line, was selected 193 based on lower value of Akaike’s information criterion. Gray dotted lines indicate non-194 significant relationships of a linear model (P > 0.05, F-test). 195 196
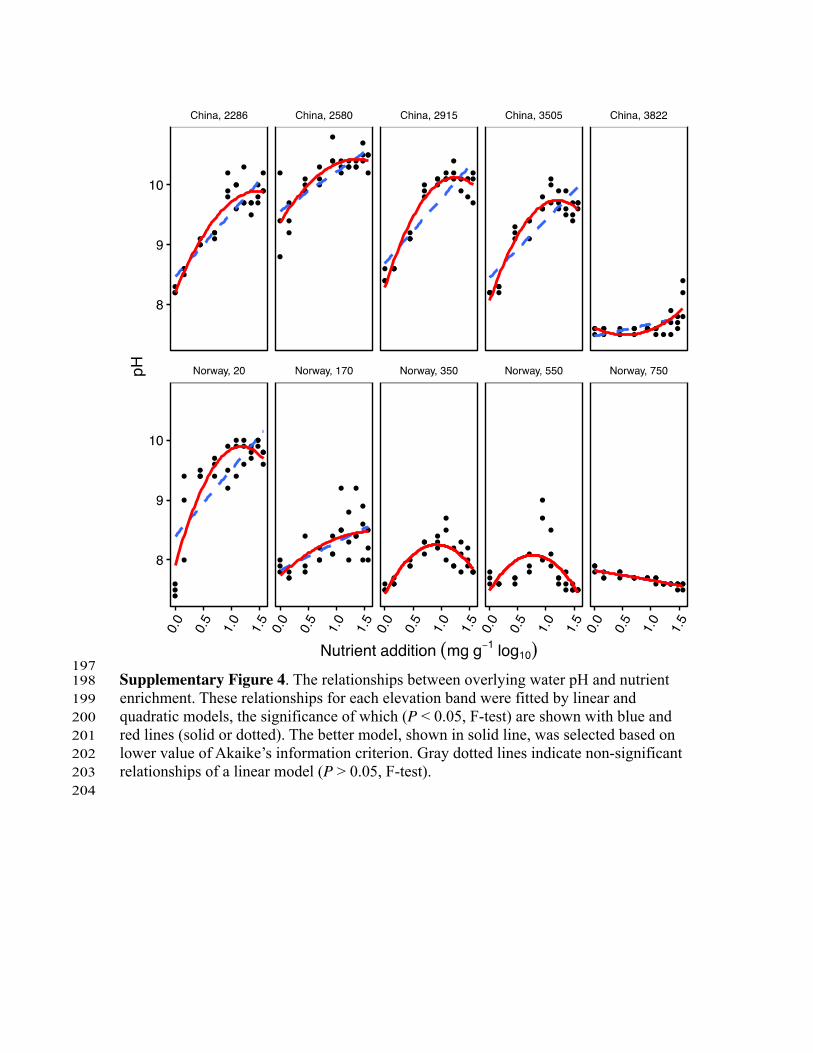
197 Supplementary Figure 4. The relationships between overlying water pH and nutrient 198 enrichment. These relationships for each elevation band were fitted by linear and 199 quadratic models, the significance of which (P < 0.05, F-test) are shown with blue and 200 red lines (solid or dotted). The better model, shown in solid line, was selected based on 201 lower value of Akaike’s information criterion. Gray dotted lines indicate non-significant 202 relationships of a linear model (P > 0.05, F-test). 203 204
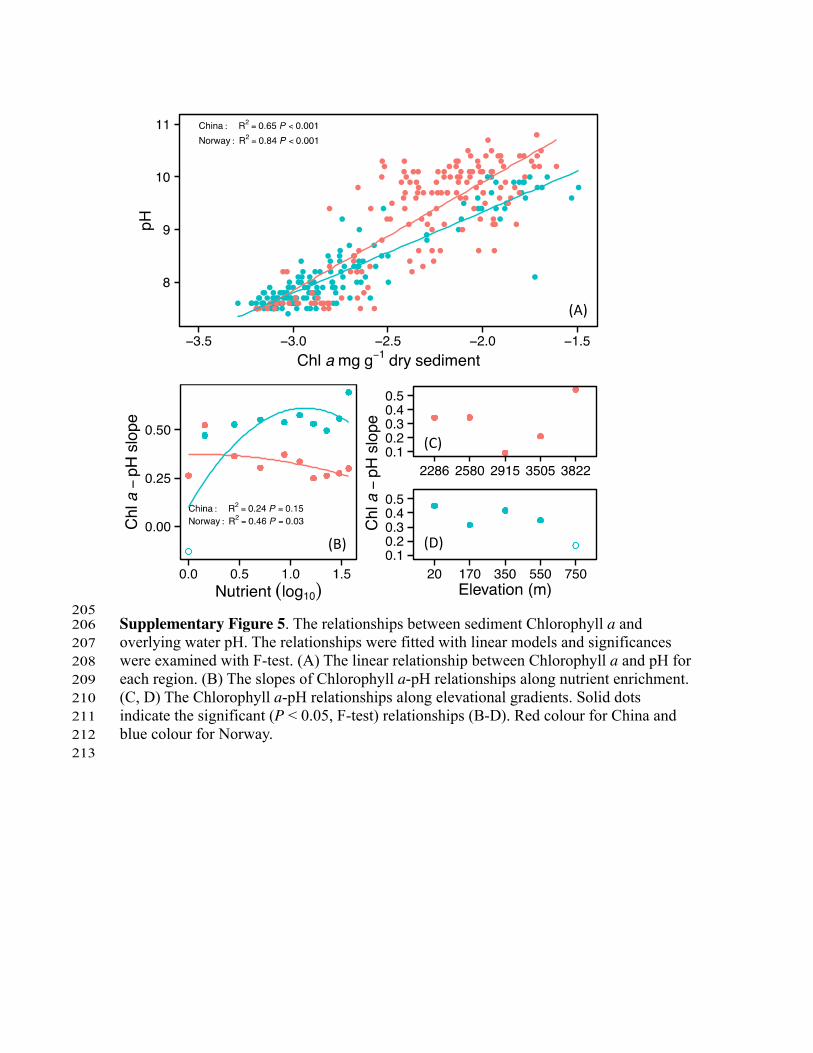
205 Supplementary Figure 5. The relationships between sediment Chlorophyll a and 206 overlying water pH. The relationships were fitted with linear models and significances 207 were examined with F-test. (A) The linear relationship between Chlorophyll a and pH for 208 each region. (B) The slopes of Chlorophyll a-pH relationships along nutrient enrichment. 209 (C, D) The Chlorophyll a-pH relationships along elevational gradients. Solid dots 210 indicate the significant (P < 0.05, F-test) relationships (B-D). Red colour for China and 211 blue colour for Norway. 212 213
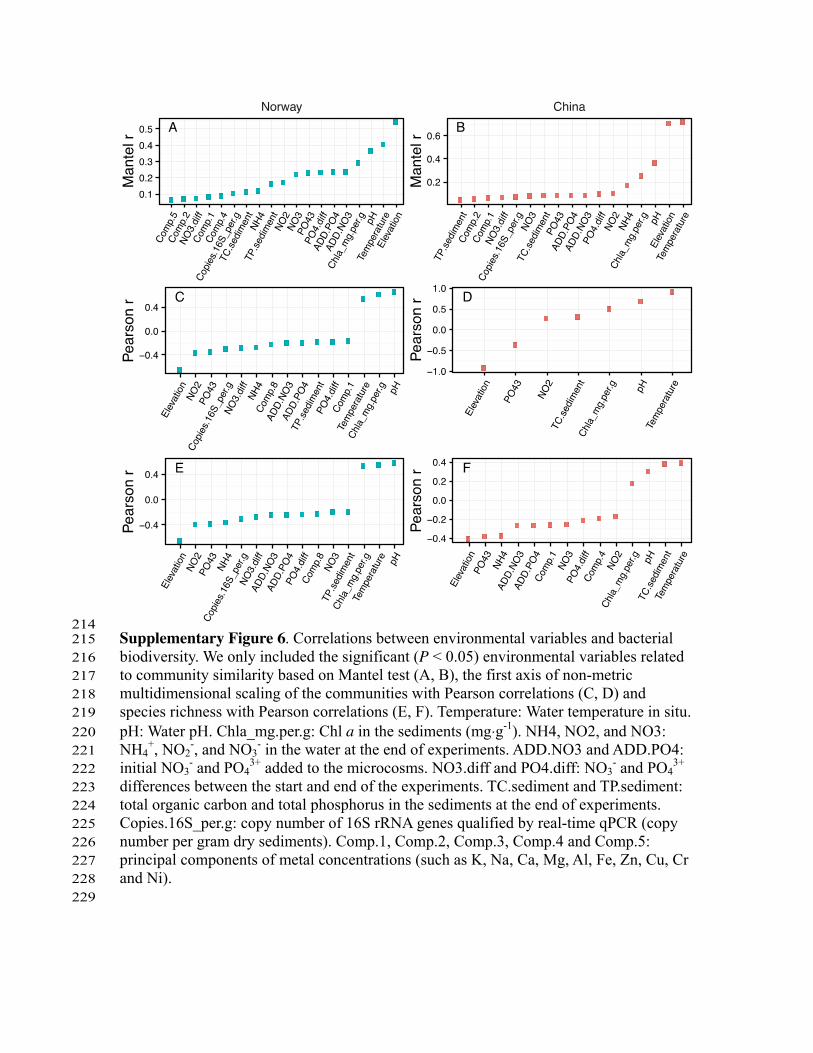
214 Supplementary Figure 6. Correlations between environmental variables and bacterial 215 biodiversity. We only included the significant (P < 0.05) environmental variables related 216 to community similarity based on Mantel test (A, B), the first axis of non-metric 217 multidimensional scaling of the communities with Pearson correlations (C, D) and 218 species richness with Pearson correlations (E, F). Temperature: Water temperature in situ. 219 pH: Water pH. Chla_mg.per.g: Chl a in the sediments (mg⋅g-1). NH4, NO2, and NO3: 220 NH4
+, NO2-, and NO3
- in the water at the end of experiments. ADD.NO3 and ADD.PO4: 221 initial NO3
- and PO43+ added to the microcosms. NO3.diff and PO4.diff: NO3
- and PO43+ 222
differences between the start and end of the experiments. TC.sediment and TP.sediment: 223 total organic carbon and total phosphorus in the sediments at the end of experiments. 224 Copies.16S_per.g: copy number of 16S rRNA genes qualified by real-time qPCR (copy 225 number per gram dry sediments). Comp.1, Comp.2, Comp.3, Comp.4 and Comp.5: 226 principal components of metal concentrations (such as K, Na, Ca, Mg, Al, Fe, Zn, Cu, Cr 227 and Ni). 228 229
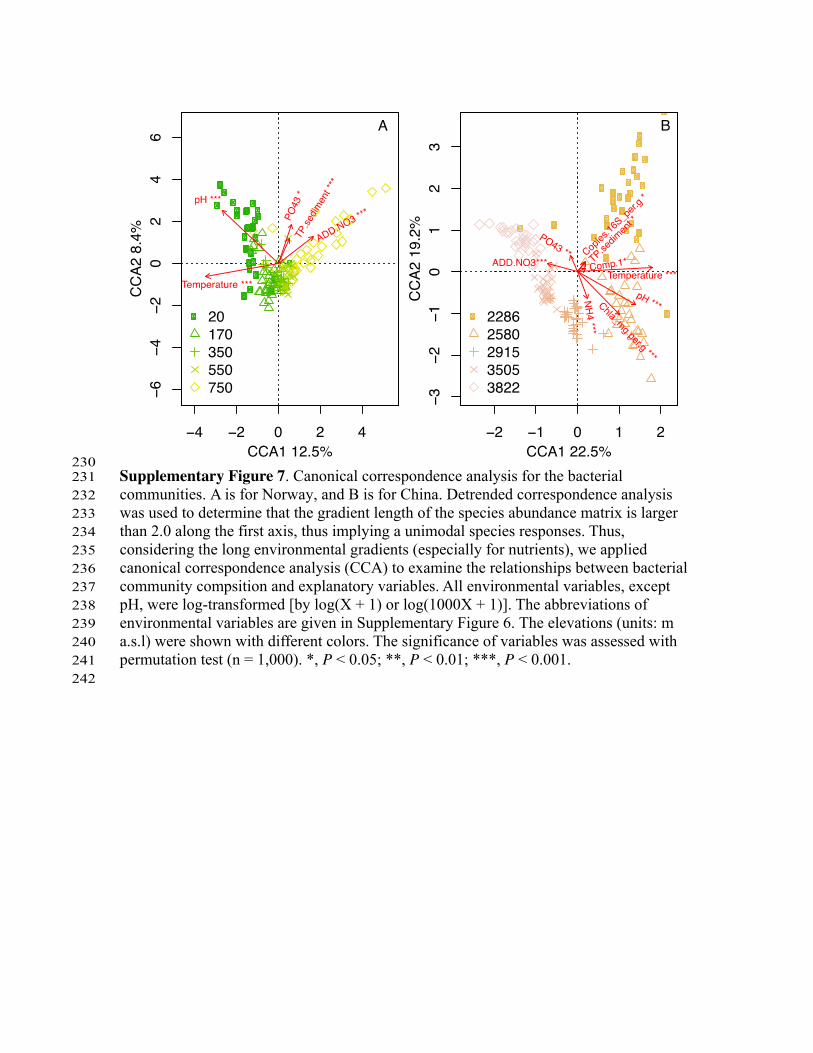
230 Supplementary Figure 7. Canonical correspondence analysis for the bacterial 231 communities. A is for Norway, and B is for China. Detrended correspondence analysis 232 was used to determine that the gradient length of the species abundance matrix is larger 233 than 2.0 along the first axis, thus implying a unimodal species responses. Thus, 234 considering the long environmental gradients (especially for nutrients), we applied 235 canonical correspondence analysis (CCA) to examine the relationships between bacterial 236 community compsition and explanatory variables. All environmental variables, except 237 pH, were log-transformed [by log(X + 1) or log(1000X + 1)]. The abbreviations of 238 environmental variables are given in Supplementary Figure 6. The elevations (units: m 239 a.s.l) were shown with different colors. The significance of variables was assessed with 240 permutation test (n = 1,000). *, P < 0.05; **, P < 0.01; ***, P < 0.001. 241 242
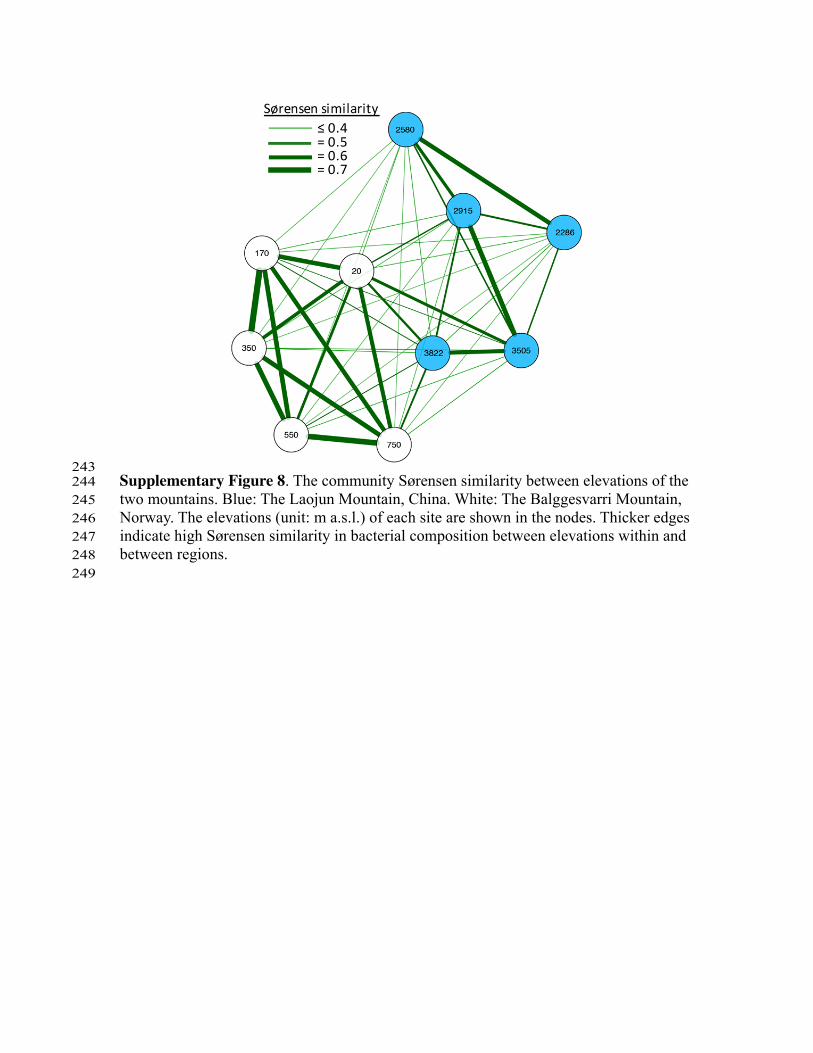
243 Supplementary Figure 8. The community Sørensen similarity between elevations of the 244 two mountains. Blue: The Laojun Mountain, China. White: The Balggesvarri Mountain, 245 Norway. The elevations (unit: m a.s.l.) of each site are shown in the nodes. Thicker edges 246 indicate high Sørensen similarity in bacterial composition between elevations within and 247 between regions. 248 249
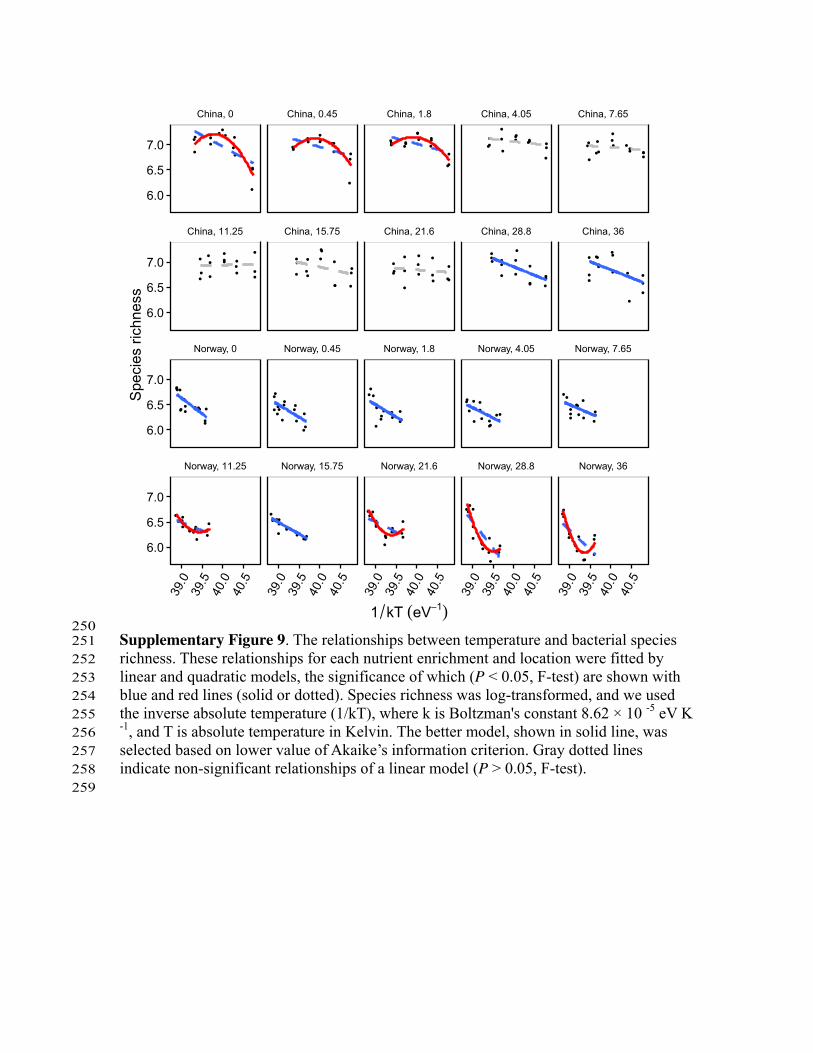
250 Supplementary Figure 9. The relationships between temperature and bacterial species 251 richness. These relationships for each nutrient enrichment and location were fitted by 252 linear and quadratic models, the significance of which (P < 0.05, F-test) are shown with 253 blue and red lines (solid or dotted). Species richness was log-transformed, and we used 254 the inverse absolute temperature (1/kT), where k is Boltzman's constant 8.62 × 10 -5 eV K 255 -1, and T is absolute temperature in Kelvin. The better model, shown in solid line, was 256 selected based on lower value of Akaike’s information criterion. Gray dotted lines 257 indicate non-significant relationships of a linear model (P > 0.05, F-test). 258 259
●
●●
●●
●
● ●●
●●●●
●
●
●
●●
●●●
●●●●●●
●●●
●●●
●●●
●●●●●●
●●●
●●●
●●●●●●
●
●●
●●●
●●●●●●
●
●●
●●●
●●
●
●
●
●●●
●
●●●
●
●
●●●
●
●
●●●
●●
●●●
●●
●●●
●
●
●
●
●
●●
●●
●
●
●
●●●●
●●●
●
●●
●
●
●
●●
●●●●
●●●●●
●
●
●●
●●●●
●●
●●●
●
●
●●●
● ●●● ●
●●
●
●
●
●●●●
●
● ●
●●
●●
●
●●●
●
●●●●● ●●●
●●●
●●● ●●
●●●
● ●●●
●●●
●●●●●●
●●●●●
●
●●●
●●● ●●●
●●●●●● ●
●●
●●●
●●
●●●●●●● ●●●
●●●
●●●
●●● ●●●
●
●
●
●●●
●
●
●
●●● ●●
●●●●
●●●
●●● ●
●●●●●
●●
●
China, 0 China, 0.45 China, 1.8 China, 4.05 China, 7.65
China, 11.25 China, 15.75 China, 21.6 China, 28.8 China, 36
Norway, 0 Norway, 0.45 Norway, 1.8 Norway, 4.05 Norway, 7.65
Norway, 11.25 Norway, 15.75 Norway, 21.6 Norway, 28.8 Norway, 36
6.0
6.5
7.0
6.0
6.5
7.0
6.0
6.5
7.0
6.0
6.5
7.0
39.0
39.5
40.0
40.5
39.0
39.5
40.0
40.5
39.0
39.5
40.0
40.5
39.0
39.5
40.0
40.5
39.0
39.5
40.0
40.5
1 kT (eV−1)
Spe
cies
rich
ness
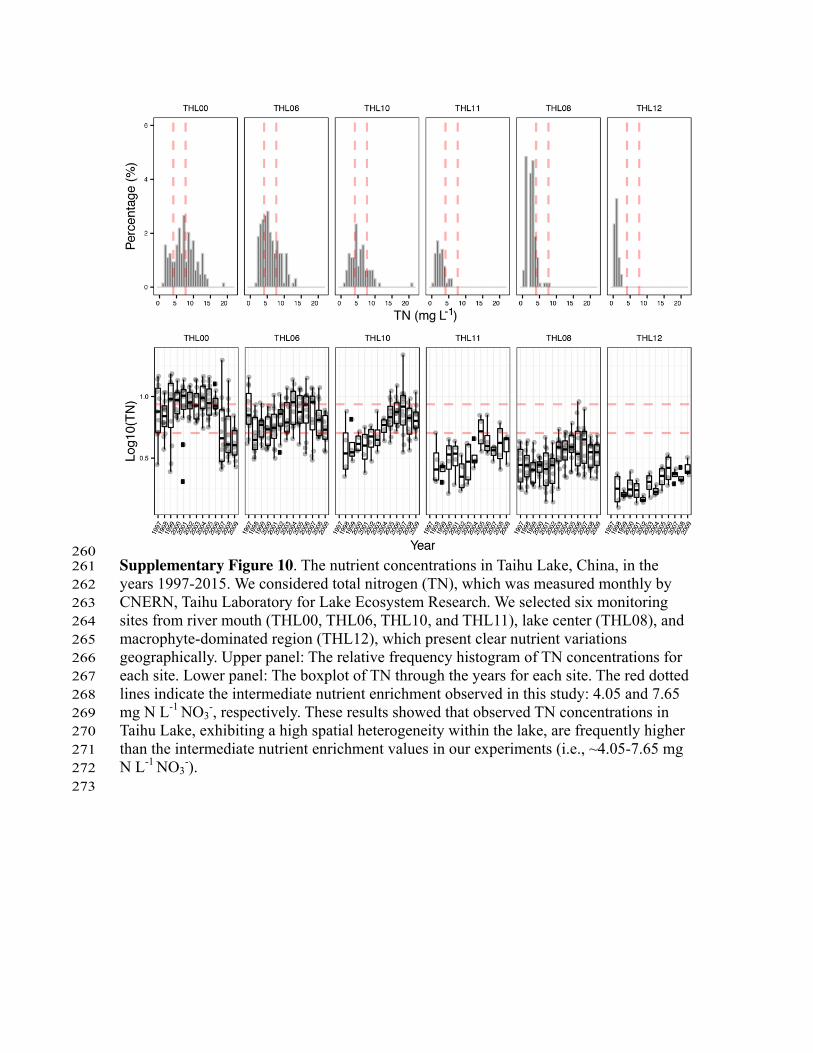
260 Supplementary Figure 10. The nutrient concentrations in Taihu Lake, China, in the 261 years 1997-2015. We considered total nitrogen (TN), which was measured monthly by 262 CNERN, Taihu Laboratory for Lake Ecosystem Research. We selected six monitoring 263 sites from river mouth (THL00, THL06, THL10, and THL11), lake center (THL08), and 264 macrophyte-dominated region (THL12), which present clear nutrient variations 265 geographically. Upper panel: The relative frequency histogram of TN concentrations for 266 each site. Lower panel: The boxplot of TN through the years for each site. The red dotted 267 lines indicate the intermediate nutrient enrichment observed in this study: 4.05 and 7.65 268 mg N L-1 NO3
-, respectively. These results showed that observed TN concentrations in 269 Taihu Lake, exhibiting a high spatial heterogeneity within the lake, are frequently higher 270 than the intermediate nutrient enrichment values in our experiments (i.e., ~4.05-7.65 mg 271 N L-1 NO3
-). 272 273
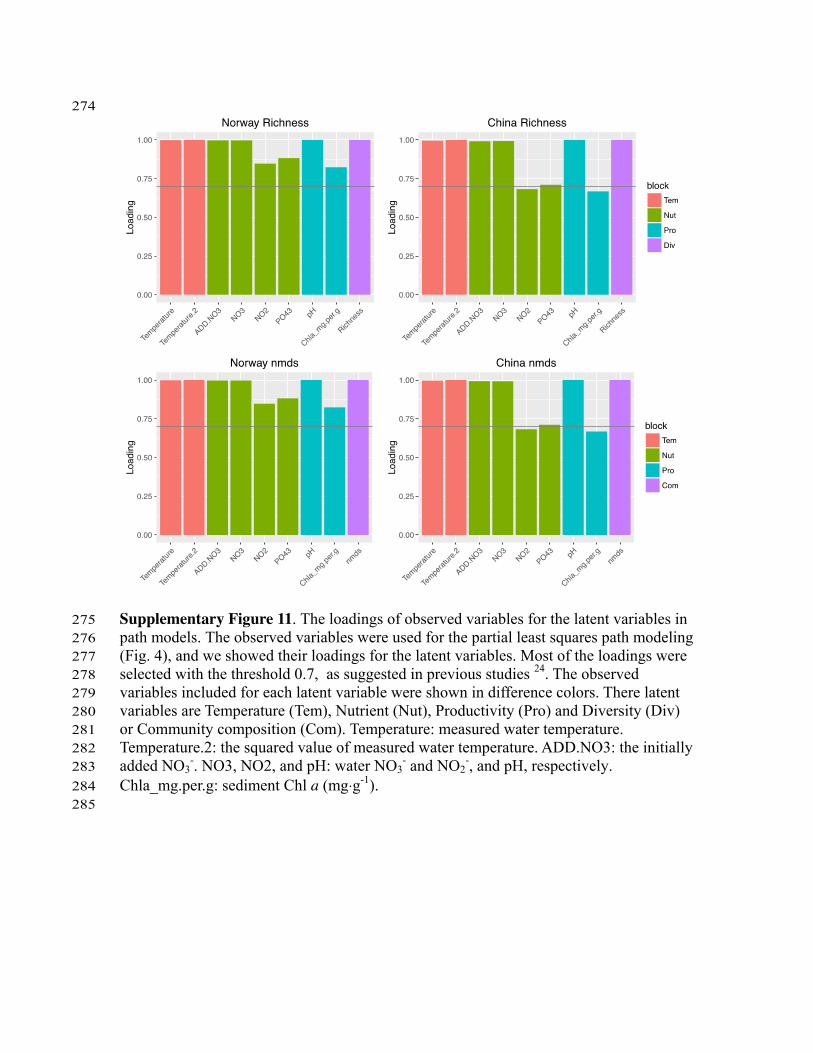
274
Supplementary Figure 11. The loadings of observed variables for the latent variables in 275 path models. The observed variables were used for the partial least squares path modeling 276 (Fig. 4), and we showed their loadings for the latent variables. Most of the loadings were 277 selected with the threshold 0.7, as suggested in previous studies 24. The observed 278 variables included for each latent variable were shown in difference colors. There latent 279 variables are Temperature (Tem), Nutrient (Nut), Productivity (Pro) and Diversity (Div) 280 or Community composition (Com). Temperature: measured water temperature. 281 Temperature.2: the squared value of measured water temperature. ADD.NO3: the initially 282 added NO3
-. NO3, NO2, and pH: water NO3- and NO2
-, and pH, respectively. 283 Chla_mg.per.g: sediment Chl a (mg⋅g-1). 284 285
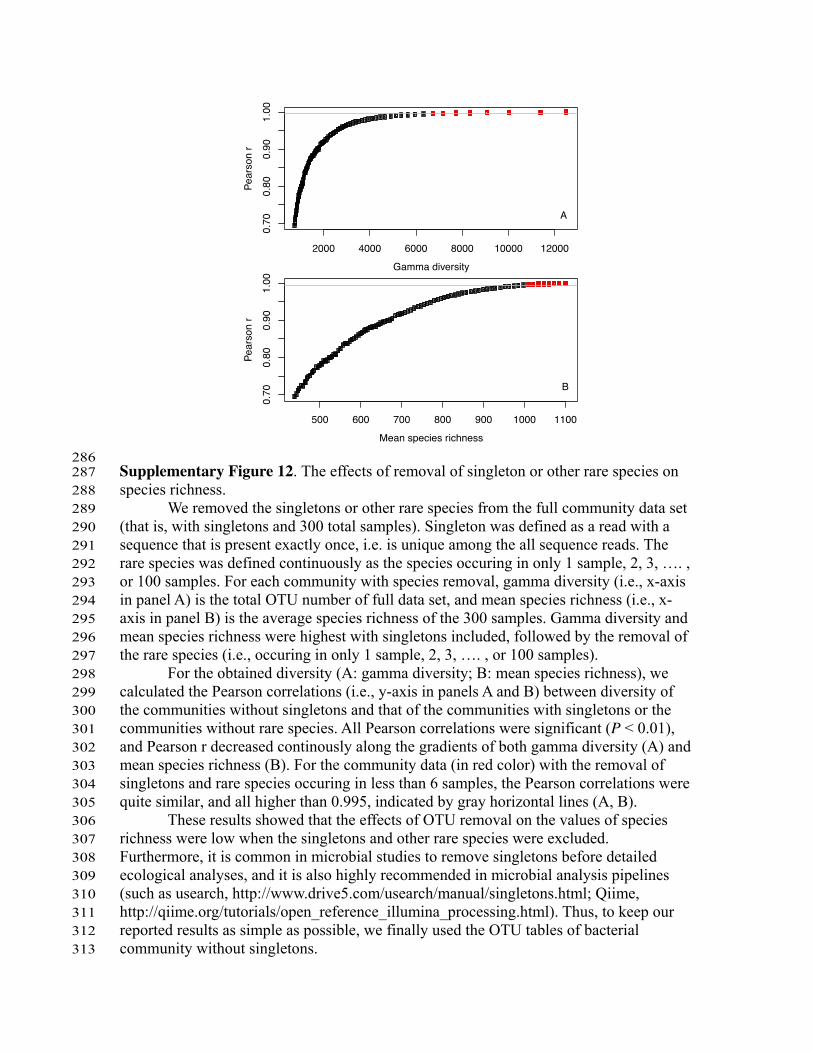
286 Supplementary Figure 12. The effects of removal of singleton or other rare species on 287 species richness. 288
We removed the singletons or other rare species from the full community data set 289 (that is, with singletons and 300 total samples). Singleton was defined as a read with a 290 sequence that is present exactly once, i.e. is unique among the all sequence reads. The 291 rare species was defined continuously as the species occuring in only 1 sample, 2, 3, …. , 292 or 100 samples. For each community with species removal, gamma diversity (i.e., x-axis 293 in panel A) is the total OTU number of full data set, and mean species richness (i.e., x-294 axis in panel B) is the average species richness of the 300 samples. Gamma diversity and 295 mean species richness were highest with singletons included, followed by the removal of 296 the rare species (i.e., occuring in only 1 sample, 2, 3, …. , or 100 samples). 297
For the obtained diversity (A: gamma diversity; B: mean species richness), we 298 calculated the Pearson correlations (i.e., y-axis in panels A and B) between diversity of 299 the communities without singletons and that of the communities with singletons or the 300 communities without rare species. All Pearson correlations were significant (P < 0.01), 301 and Pearson r decreased continously along the gradients of both gamma diversity (A) and 302 mean species richness (B). For the community data (in red color) with the removal of 303 singletons and rare species occuring in less than 6 samples, the Pearson correlations were 304 quite similar, and all higher than 0.995, indicated by gray horizontal lines (A, B). 305
These results showed that the effects of OTU removal on the values of species 306 richness were low when the singletons and other rare species were excluded. 307 Furthermore, it is common in microbial studies to remove singletons before detailed 308 ecological analyses, and it is also highly recommended in microbial analysis pipelines 309 (such as usearch, http://www.drive5.com/usearch/manual/singletons.html; Qiime, 310 http://qiime.org/tutorials/open_reference_illumina_processing.html). Thus, to keep our 311 reported results as simple as possible, we finally used the OTU tables of bacterial 312 community without singletons. 313
Supplementary References 314 315 1. Wang J, et al. Phylogenetic beta diversity in bacterial assemblages across 316
ecosystems: deterministic versus stochastic processes. ISME J 7, 1310-317 1321 (2013). 318
319 2. Liu Y, et al. Bacterial responses to environmental change on the Tibetan 320
Plateau over the past half century. Environ Microbiol 18, 1930-1941 321 (2016). 322
323 3. Barberán A, et al. Continental-scale distributions of dust-associated 324
bacteria and fungi. Proc Natl Acad Sci U S A 112, 5756-5761 (2015). 325 326 4. Martiny JBH, et al. Microbial biogeography: Putting microorganisms on 327
the map. Nat Rev Microbiol 4, 102-112 (2006). 328 329 5. Wetzel RG. Limnology. Academic Press (2001). 330 331 6. MacArthur RH, Wilson EO. The theory of island biogeography. Princeton 332
Univ Pr (1967). 333 334 7. Whittaker RJ, Fernández-Palacios JM. Island biogeography: ecology, 335
evolution, and conservation. Oxford University Press, USA (2007). 336 337 8. Fukami T. Historical Contingency in Community Assembly: Integrating 338
Niches, Species Pools, and Priority Effects. Annu Rev Ecol Evol Syst 46, 339 1-23 (2015). 340
341 9. Hervàs A, Camarero L, Reche I, Casamayor EO. Viability and potential 342
for immigration of airborne bacteria from Africa that reach high mountain 343 lakes in Europe. Environ Microbiol 11, 1612-1623 (2009). 344
345 10. Hervas A, Casamayor EO. High similarity between bacterioneuston and 346
airborne bacterial community compositions in a high mountain lake area. 347 FEMS Microbiol Ecol 67, 219-228 (2009). 348
349 11. Barberán A, Henley J, Fierer N, Casamayor EO. Structure, inter-annual 350
recurrence, and global-scale connectivity of airborne microbial 351 communities. Sci Total Environ 487, 187-195 (2014). 352
353 12. Wang J, Shen J, Zhang L, Liu E. Spatial heterogeneity of oxygen 354
exchange between sediment-water interface in lakes. J Lake Sci 21, 474-355 482 (2009). 356
357 13. Wang J, Shen J, Zhang L, Fan C, Li W, Pan J. Sediment-water nutrient 358
fluxes and the effects of oxygen in Lake Dianchi and Lake Fuxian, Yunnan 359 Province. J Lake Sci 22, 640-648 (2010). 360
361 14. Zhou J, Bruns MA, Tiedje JM. DNA recovery from soils of diverse 362
composition. Appl Environ Microbiol 62, 316-322 (1996). 363 364
15. Shen J, Zhang L, Guo J, Ray JL, He J. Impact of long-term fertilization 365 practices on the abundance and composition of soil bacterial communities 366 in Northeast China. Appl Soil Ecol 46, 119-124 (2010). 367
368 16. Wang J, et al. Regional and global elevational patterns of microbial 369
species richness and evenness. Ecography, DOI: 10.1111/ecog.02216 370 (2017). 371
372 17. Caporaso JG, et al. QIIME allows analysis of high-throughput community 373
sequencing data. Nat Meth 7, 335-336 (2010). 374 375 18. Wang J, Soininen J, He J, Shen J. Phylogenetic clustering increases with 376
elevation for microbes. Environ Microbiol Rep 4, 217-226 (2012). 377 378 19. Magoč T, Salzberg SL. FLASH: fast length adjustment of short reads to 379
improve genome assemblies. Bioinformatics 27, 2957-2963 (2011). 380 381 20. Edgar RC. UPARSE: highly accurate OTU sequences from microbial 382
amplicon reads. Nat Meth 10, 996-998 (2013). 383 384 21. DeSantis TZ, et al. Greengenes, a chimera-checked 16S rRNA gene 385
database and workbench compatible with ARB. Appl Environ Microbiol 386 72, 5069-5072 (2006). 387
388 22. Caporaso JG, Bittinger K, Bushman FD, DeSantis TZ, Andersen GL, 389
Knight R. PyNAST: a flexible tool for aligning sequences to a template 390 alignment. Bioinformatics 26, 266-267 (2010). 391
392 23. Wang Q, Garrity GM, Tiedje JM, Cole JR. Naive Bayesian Classifier for 393
Rapid Assignment of rRNA Sequences into the New Bacterial Taxonomy. 394 Appl Environ Microbiol 73, 5261-5267 (2007). 395
396 24. Sanchez G. PLS path modeling with R. Trowchez Editions (2013). 397 398 399
Related Documents