JOURNAL OF THE WORLD AQUACULTURE SOCIETY Vol. 44, No. 2 April, 2013 Nutrient Assimilation by First-Feeding African Catfish, Clarias gariepinus , Assessed Using Stable Isotope Analysis Uchechukwu Enyidi 1 , Mikko Kiljunen, Roger I. Jones and Juhani Pirhonen Department of Biological and Environmental Science, University of Jyv¨ askyl¨ a, P.O. Box 35, FIN-40014 University of Jyv¨ askyl¨ a, Finland Jouni Vielma Finnish Game and Fisheries Research Institute, Jyv¨ askyl¨ a Game and Fisheries Research, Survontie 9, FIN-40500 Jyv¨ askyl¨ a, Finland Abstract Knowledge of ingredients assimilation and biomass contribution to recipient fish is important in feed formulation. The stable isotopes of 13 C and 15 N were used to investigate the assimilation and biomass contribution of bambaranut, Voandzeia subterranea , meal (BNM), corn, Zea mays , meal (CM) and fish meal (FM), in FM substituted diets of first feeding African catfish, Clarias gariepinus , during a 30-d experiment. The catfish larvae were stocked at 40 fish/15 L three replicate glass aquaria. Larvae were fed with experimental diets varying FM, BNM, and CM. Proportions of FM : BNM : CM in the experimental diets were: feed 1 (F1) 60:20:20; feed 2 (F2) 40:40:20; feed 3 (F3) 20:60:20; and feed 4 (F4) 20:20:60. Feeds and larval stable isotopes of δ 13 C and δ 15 N were analyzed. Larval specific growth rates (SGRs) were high, enhancing incorporation of dietary δ 13 C and δ 15 N. The SGR was highest for catfish fed F1 and F2 but significantly lower for those on F3 and F4. Results of δ 13 C and δ 15 N analyses showed that the biomass contribution from FM was similar to BNM, which were better than CM at equal inclusion levels. The nitrogen contribution per ingredient to larval somatic crude protein was increasing with increases in ingredient inclusion and assimilation. Stable isotope analysis is useful for analyzing assimilation and utilization of nutrients. The substitution of fish meal and fish oil with plant proteins and oil holds great potential in enhancing the future of aquaculture (FAO 2008). When replacing fish meal (FM) with plant-based diets, it is important to know the assimilation and partitioning of nutrients from the compounded feed by the recipient fish (Beltr´ an et al. 2009). Feed ingredient utilization and digestibility in aquaculture are traditionally determined by digestibility tests either by using inert chemical markers such as chromium oxide (Glencross et al. 2003; Gaylord and Barrows 2008; Oliveira et al. 2008) or with radioactive 14 C (Hovde et al. 2005). Radioactive markers have also been used for measuring nutrient digestibility and assimilation in fish larvae (Conceic ¸˜ ao et al. 2001; Izquierdo et al. 2001; Morais et al. 2006), but because they pose risks 1 Corresponding author. to users their use is subject to strict regulations (Preston et al. 1996; Schlechtriem et al. 2004). Ratios of naturally occurring stable isotopes of carbon ( 12 C/ 13 C) and nitrogen ( 14 N/ 15 N), usually expressed as δ 13 C and δ 15 N values (‰), could provide an alternative approach to measuring nutrient assimilation and retention in fish. For the approach to be successful, feed ingredients used in compounding diets for stable isotope studies should be designed so that they have different isotopic signatures (Post 2002; Beltr´ an et al. 2009; Redmond 2010). Variable isotope signatures of the ingredients enable analyses of routing and assimilation using stable isotope ratios of carbon and nitrogen (Schlechtriem et al. 2004; Jomori et al. 2008; Beltr´ an et al. 2009). In animals, stable isotope ratios of carbon and nitrogen reflect their food isotopic ratios with a © Copyright by the World Aquaculture Society 2013 161

Welcome message from author
This document is posted to help you gain knowledge. Please leave a comment to let me know what you think about it! Share it to your friends and learn new things together.
Transcript
JOURNAL OF THEWORLD AQUACULTURE SOCIETY
Vol. 44, No. 2April, 2013
Nutrient Assimilation by First-Feeding African Catfish, Clariasgariepinus , Assessed Using Stable Isotope Analysis
Uchechukwu Enyidi1, Mikko Kiljunen, Roger I. Jones and Juhani Pirhonen
Department of Biological and Environmental Science, University of Jyvaskyla, P.O. Box 35,FIN-40014 University of Jyvaskyla, Finland
Jouni Vielma
Finnish Game and Fisheries Research Institute, Jyvaskyla Game and Fisheries Research,Survontie 9, FIN-40500 Jyvaskyla, Finland
AbstractKnowledge of ingredients assimilation and biomass contribution to recipient fish is important in
feed formulation. The stable isotopes of 13C and 15N were used to investigate the assimilation andbiomass contribution of bambaranut, Voandzeia subterranea , meal (BNM), corn, Zea mays , meal(CM) and fish meal (FM), in FM substituted diets of first feeding African catfish, Clarias gariepinus ,during a 30-d experiment. The catfish larvae were stocked at 40 fish/15 L three replicate glass aquaria.Larvae were fed with experimental diets varying FM, BNM, and CM. Proportions of FM : BNM : CMin the experimental diets were: feed 1 (F1) 60:20:20; feed 2 (F2) 40:40:20; feed 3 (F3) 20:60:20; andfeed 4 (F4) 20:20:60. Feeds and larval stable isotopes of δ13C and δ15N were analyzed. Larval specificgrowth rates (SGRs) were high, enhancing incorporation of dietary δ13C and δ15N. The SGR washighest for catfish fed F1 and F2 but significantly lower for those on F3 and F4. Results of δ13C andδ15N analyses showed that the biomass contribution from FM was similar to BNM, which were betterthan CM at equal inclusion levels. The nitrogen contribution per ingredient to larval somatic crudeprotein was increasing with increases in ingredient inclusion and assimilation. Stable isotope analysisis useful for analyzing assimilation and utilization of nutrients.
The substitution of fish meal and fish oilwith plant proteins and oil holds great potentialin enhancing the future of aquaculture (FAO2008). When replacing fish meal (FM) withplant-based diets, it is important to know theassimilation and partitioning of nutrients fromthe compounded feed by the recipient fish(Beltran et al. 2009). Feed ingredient utilizationand digestibility in aquaculture are traditionallydetermined by digestibility tests either by usinginert chemical markers such as chromium oxide(Glencross et al. 2003; Gaylord and Barrows2008; Oliveira et al. 2008) or with radioactive14C (Hovde et al. 2005). Radioactive markershave also been used for measuring nutrientdigestibility and assimilation in fish larvae(Conceicao et al. 2001; Izquierdo et al. 2001;Morais et al. 2006), but because they pose risks
1 Corresponding author.
to users their use is subject to strict regulations(Preston et al. 1996; Schlechtriem et al. 2004).
Ratios of naturally occurring stable isotopesof carbon (12C/13C) and nitrogen (14N/15N),usually expressed as δ13C and δ15N values(‰), could provide an alternative approach tomeasuring nutrient assimilation and retentionin fish. For the approach to be successful,feed ingredients used in compounding dietsfor stable isotope studies should be designedso that they have different isotopic signatures(Post 2002; Beltran et al. 2009; Redmond2010). Variable isotope signatures of theingredients enable analyses of routing andassimilation using stable isotope ratios ofcarbon and nitrogen (Schlechtriem et al. 2004;Jomori et al. 2008; Beltran et al. 2009). Inanimals, stable isotope ratios of carbon andnitrogen reflect their food isotopic ratios with a
© Copyright by the World Aquaculture Society 2013
161
162 ENYIDI ET AL.
small fractionation or trophic shift (DeNiro andEpstein 1981). The lighter isotopes (12C and14N) are more readily used in body metabolism(DeNiro and Epstein 1981; Fry 2006), makingthe body enriched with heavier isotopes (13Cand 15N) (DeNiro and Epstein 1981; Oliveet al. 2003; Fry 2006; Dubois et al. 2007).
Most studies using stable isotopes haveexamined nutrient assimilation from two pro-tein sources and biomass contribution usingsimple stable isotope linear mixing mod-els (Gamboa-Delgado et al. 2008; Gamboa-Delgado and Le Vay 2009; Beltran et al.2009; Martínez-Rocha et al. 2012). Such mod-els assume no variations in input variablessuch as isotope signatures of dietary sources orconsumers (Phillips and Gregg 2001; Phillips2001), and do not yield reliable results when thefood sources have variable C : N ratio and con-centration (Robbins et al. 2002; Parnell et al.2010). Moreover, when the number of dietsources exceeds by more than 1 the num-ber of analyzed isotopes, there can be nodefinite solution to the linear mixing model(Phillips and Gregg 2003; Parnell et al. 2010).Recently introduced Bayesian-based mixingmodels (Moore and Semmens 2008; Parnellet al. 2010) can handle multiple source con-tributions by generating probability ranges forthe contribution of different diet sources.
Some previous studies have used δ13C andδ 15N analyses to examine contributions ofingredients in FM-substituted diets for shellfish(Gamboa-Delgado and Le Vay 2009; Redmondet al. 2010) or to trace dietary protein sourcein fin fishes (Beltran et al. 2009) or replace-ment of sulphur, carbon, and nitrogen due todiet change trace by δ13C, δ15N, and δ34S iso-topes (Hesslein et al. 1993). However, we hadnoted that such methods have not been appliedin multiprotein source nutrient partitioning andcontribution to biomass of cultured fin fishes,nor have Bayesian mixing models been used foranalyzing nutrient partitioning and assimilationfrom multiple protein sources. This researchwas designed to examine larval African cat-fish nutrient assimilation from compounded drydiets and biomass contribution of ingredientsusing stable isotopes. Three protein sources
with different δ13C and δ15N isotopic signa-tures were selected for this experiment. Thisenabled their contribution to fish biomass andtheir nutrient partitioning and nutrient routing tobe estimated more accurately from each compo-nent. The three ingredients selected were bam-baranut, Voandzeia subterranea , meal (BNM),corn, Zea mays , meal (CM), and FM. The feedingredient isotope signatures were traced to thefish biomass that made it is possible to quantifythe amount of nutrient assimilated per ingredi-ent, while differences in the δ15N and δ13C ofthe fish and feed revealed the catfish fractiona-tion of the diets and showed their contributionto somatic crude protein.
Materials and Methods
Experimental Fish
African catfish larvae were stocked in threereplicate 15-L flow-through glass aquaria perdiet at 40 larvae/aquarium for all treatmentdiets. The larvae in tanks fed with FM, BNM,or CM were stocked at 70 larvae/aquarium,because larvae were taken every 5 d from eachof them during sampling as will be describedbelow. The survival rate was not analyzed forthese fishes. Water flow rate was adjusted to400 mL/min, light intensity at the tank surfacewas approximately 15 lx (HD 9221 lux meter,Delta OHM, Padua, Italy), and photoperiod wasD16 : L8.
Diet Formulation and Feeding
Experimental diets were produced by substi-tuting FM with BNM and CM at four differentlevels. There was no vitamin or mineral premixadded to the diets as the larval catfish growthand assimilation of the ingredients were exam-ined in their raw form. Experimental diets werelabeled as feed 1 (F1) to feed 4 (F4). The %inclusion levels of FM : BNM : CM ranged from20 to 60%. In addition, three more diets (FM,BNM, and CM) were produced based entirelyon the individual ingredients (Table 1).
Appropriate levels of the ingredients weremeasured and 0.2 L of water was added tothe dough and mixed with an electric mixer.

CATFISH ASSIMILATION OF FISH MEAL AND PLANT PROTEINS 163
Table 1. Composition and proximate values of diets used in feeding first-feeding African catfish larvae for 30 d.a
Ingredients F1 F2 F3 F4 FM BNM CM
Bambaranut meal 20 40 60 20 100Corn meal 20 20 20 60 100Fish meal 60 40 20 20 100Total (%) 100 100 100 100 100 100 100(%) Proximate compositionMoisture 7.13 6.22 5.61 5.07 6.70 5.50 6.00Crude protein 47.80 38.08 28.20 23.00 65.50 21.00 8.00Lipids 9.50 7.89 6.90 4.30 12.00 8.00 1.98Ash 6.68 8.43 8.45 8.34 5.89 0.23 1.00
aIngredients levels for compounding feed (F1–F4) are in percentages (%).
There was no fish oil added to mixture. Mixedingredients were preconditioned at 100 C forapproximately 20 min. Preconditioned doughwas pelleted using a kitchen meat mincer.Pelleted feeds were oven dried at 70 C for 18h and dried pellets were ground to dust andstored at −20 C. After formulation, sampleswere taken of each feed patch for proximateand isotope analyses. The catfish were fed byhand four times per day ad libitum for 30 dwith the experimental diets. Precautions weretaken to avoid over feeding of the larvae andescape of food particles with outflow water.
Sampling
At the beginning of the experiment, fivelarvae were placed individually into separateglass vials and stored at −80 C until analyses.Thereafter every 5 d, five fish larvae (or 4on the last sampling day) were taken fromeach of the aquaria where larvae were fedwith single ingredient diets (BNM, CM, andFM). The larvae were weighed and individuallyplaced in a glass vial and stored under −80 Ctill analyzed. Three replicate samples werelater analyzed as described below. The fishwere always starved for 18 h before collectionto ensure evacuation of the feed and fecalmatter from their guts. Larval African catfishcan evacuate the gut in less than 11 h,especially with continuous feeding (culturetemperature 28 C) (García-Ortega et al. 2010).The following parameters were calculated foreach aquarium: Specific growth rate (SGR,%/day) of the larvae was calculated as 100
(Ln W 2 – Ln W 1)/t , where W 1 and W 2 wereaverage weights in grams at the start and theend of the experiment and t was the length ofthe experiment in days (i.e., 30).
Survival = 100 × Final number of fish
/Initial number of fish
Average weight gain (AWG)
= Initial average weight (g)
− final average weight (g)
Feed samples were dried at 70 C in an ovento a constant weight and moisture content wasmeasured as the difference between wet and drysamples. The crude protein value of the dietswere derived from the formula N × 6.25, where6.25 is the conversion factor of total nitrogen toprotein (this assumes all nitrogen were comingfrom fish sample analyzed) (Levey et al. 2000).The nitrogen value (N) was obtained during theisotope analyses. Lipid analysis of the sampleswas done by chloroform–methanol extractionat a ratio of 2:1, a modification of the methoddescribed by Kainz et al. (2004).
Stable Isotope Analyses
Feed samples and the catfish larvae werefreeze-dried and ground to powder, and a sam-ple of 0.4–0.6 mg was precisely weighedinto tin cups (D4057 Elemental Microanalysis,Devon, UK). Three replicate samples were ana-lyzed at the stable isotope laboratory of theUniversity of Jyvaskyla using a Carlo ErbaFlash EA1112 elemental analyzer coupled to

164 ENYIDI ET AL.
a Thermo Finnigan DELTAplusAdvantage con-tinuous flow stable isotope-ratio mass spec-trometer.
The stable isotope ratio output results areexpressed in standard delta (δ) notation asppt (‰) relative to the international standardof Vienna Pee Dee belemnite for carbon andatmospheric N2 for nitrogen. Two replicateinternal laboratory standards (pike muscle)were placed after every 10 samples. Theanalysis also yielded %C and %N values andhence also C : N ratios for samples.
The observed nitrogen contribution from FM,BNM, and CM to the somatic crude proteincontent of the fish was estimated by firstdetermining the crude protein of fish. Thecrude protein values per mean assimilationof the specific ingredient (from SIAR results)estimates the nitrogen contribution. The sumtotal of the ingredients contribution to the crudeprotein equals the fish crude protein content.This was calculated as follows:
Somatic crude protein = %N × 6.25
where %N is from the isotope analyses.Observed nitrogen contribution to crude pro-tein (%) N(FM, BNM,CM) was calculated as, forexample, for FM,
(%) N(FM) = (N (%) × 6.25)
× (Xass(FM) × %nitrogen of (FM)
)
/(Xass(FM) × %nitrogen of (FM)
)
+ Xass(BNM) × %nitrogen of (BNM)
+ Xass(CM) × %nitrogen of (CM)
where FM, BNM, and CM are the ingredientsused for the feeds.
(%) N(FM,BNM,CM)
= %Nitrogen from either FM,
BNM, or CM in the diet (F1 − F4)
N (%) = %Nitrogen of fish
Xass = Mean assimilation of
ingredients from SIAR model.
The multiplier 6.25 is a constant for esti-mating crude proteins from determined samplenitrogen value. The whole N is assumed tocome from fish sample analyzed (Levey et al.2000).
Observed nitrogen contribution to fishbiomass from feed was calculated by mul-tiplying the mean assimilation value of theingredient from SIAR by the %N of diet ingre-dient and dividing this by sum total of samecalculation for FM, BNM, and CM as follows:
N(FM,BNM,CM) = (Xass FM × N%of diet)
/ (Xass FM × N% of diet)
+ Xass BNM × N% of diet
+ Xass CM × N%gof diet.
where FM, BNM, and CM are ingredients ofthe diets
Xass(FM,BNM,CM) = Mean assilimation
of ingredient from SIAR model.
The predicted nitrogen contribution is similarto the above but the multiplier X ass (FM, BNM,CM)
(i.e., the assimilation of either FM, BNM, orCM) was changed to X D (FM, BNM, CM), whichwas the inclusion level of the ingredient (eitherFM, BNM or CM) in the diets F1 to F4. Thevalues were calculated as follows:
N(FM;BNM;CM) = (XD(FM) × N%of diet
)/
(XD(FM) × N%of diet + XD(BNM)
×N%of diet + XD(CM) × N%of diet)
where D stands for feed (diet), X D(FM) repre-sents the inclusion level of the ingredient (FM,BNM, CM) in diet.
Statistical Analyses
The possible statistical differences in δ13Cand δ15N values of the feeds and the larvae,
CATFISH ASSIMILATION OF FISH MEAL AND PLANT PROTEINS 165
as well as differences in growth and survivalwere analyzed using ANOVA, and in case ofsignificant differences LSD test was used forpost hoc comparisons. Linear regression anal-ysis was used in analyzing nitrogen contribu-tions and relationship between C : N and SGR,using version 18 PASW statistics. Tank averagevalue was used as the observational unit, andP < 0.05 was used as the level of statisticalsignificance.
SIAR Model
The assimilation of nutrients by the catfishwas analyzed with the model Stable IsotopeAnalyses in R (SIAR, Version 4). SIAR is freelydownloadable software at the Comprehensive RArchive Network site (CRAN) – http://cran.r-project.org/ (Parnell et al. 2010). R version 15.0was used.
SIAR is sensitive to isotope fractionationand incorporates the isotopic ratio and con-centration of nitrogen and carbon (Parnellet al. 2010; Layman et al. 2012). Fractionationvalues of diets was initially planned to be fromlarvae fed single diet (FM, BNM, or CM).However, with some of the single diets the fishisotopic signature did not achieve an asymp-totic value with diet (indicating equilibration)by the end of the experiment. Thereforelarval fractionation (�13C‰ and �15N‰) wascalculated from the averages of the valuesfrom all mixed diet experiments (F1–F4)as �13C/�15N = δK consumer − δK diet, whereK = 13C or 15N. The estimated fractionation
values were (�13C ± SD = −0.18 ± 0.98,�15N ± SD = 3.3 ± 0.61), and these are veryclose to typical values reported in the literature.
Results
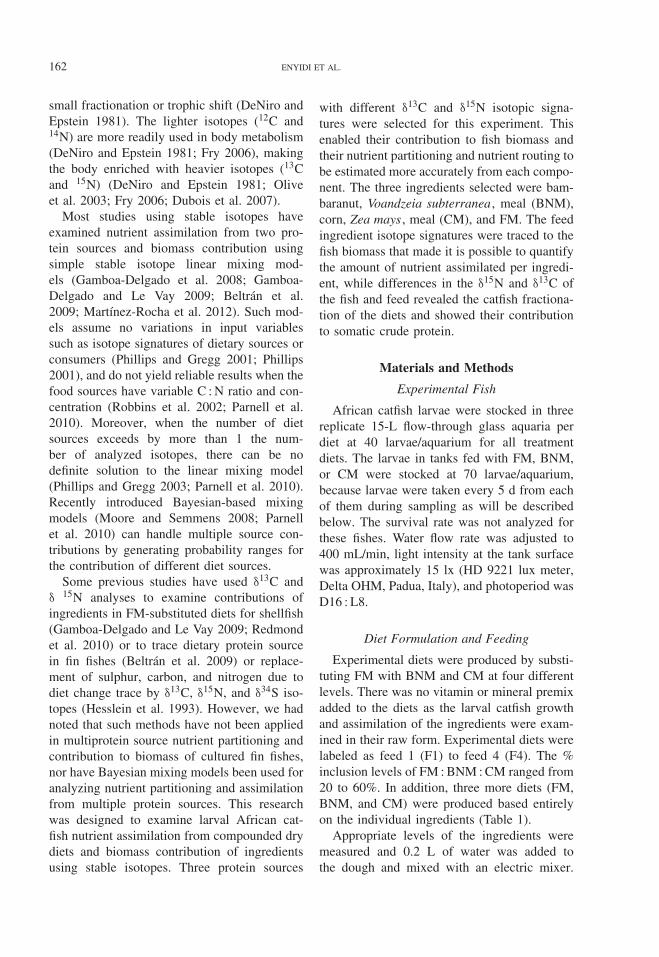
The first-feeding African catfish readilyaccepted the treatment diets. The mean SGR ofthe catfish fed F1 was significantly (P < 0.05)higher than those fed with F2 as well as thoseon F3 and F4. However SGR of F2 fed catfishwas significantly (P < 0.05) higher than thosefed F3 and F4 (Table 2). The SGR was neg-atively related to the C : N ratio of the mixedfeeds F1–F4 (Fig. 1). At the end of the exper-iment, African catfish larvae fed with F1 weresignificantly larger than those fed with F2, F3,and F4. The fish fed F4 were significantlysmaller than those in any other group (Table 2).Average weight gain (AWG) of the larvae fol-lowed a similar pattern to SGR (Table 2). How-ever, survival of the larvae was different fromgrowth pattern. The larvae fed with F3 and F4had higher survival than those fed with F1.Larval survival was not significantly differentbetween larvae fed F3 and F2 (Table 2). Thecatfish fed single diets (FM, BNM, and CM)did not grow as fast as those fed mixed dietsand they were significantly different from eachother (Table 2).
The graphical analyses of single diet fraction-ation (Fig. 2) showed that the catfish δ15N andδ13C equilibrated with the diets before the endof the experiment (Day 30) with the exceptionof δ15N of BNM and δ15N of CM. The isotope
Table 2. Initial weight, final weight, specific growth rate (SGR), average weight gain (AWG), and survival of larvalAfrican catfish fed for 30 d with diets F1 to F4 varying in fish meal (FM), bambaranut meal (BNM), and corn meal (CM)content.12
Feed Initial weight (g) Final weight (g) SGR (%) AWG (g) Survival (%)
F1 0.013 ± 0.0ns 0.168 ± 0.02a 8.520 ± 0.46a 0.155 ± 0.02a 36.66 ± 20.05b
F2 0.012 ± 0.0ns 0.114 ± 0.01ab 7.440 ± 0.39b 0.102 ± 0.01b 49.16 ± 12.58ab
F3 0.012 ± 0.0ns 0.086 ± 0.01b 6.590 ± 0.57c 0.075 ± 0.01c 60.00 ± 8.66a
F4 0.014 ± 0.0ns 0.071 ± 0.02c 5.340 ± 0.36d 0.057 ± 0.02d 58.33 ± 18.05a
FM 0.026 ± 0.0ns 0.085 ± 0.04A 3.920 ± 0.02A 0.059 ± 0.01A n/aBNM 0.013 ± 0.0ns 0.024 ± 0.02B 2.010 ± 0.01B 0.011 ± 0.03B n/aCM 0.012 ± 0.0ns 0.016 ± 0.01C 0.820 ± 0.03C 0.003 ± 0.01C n/a
1Values not followed by the same superscript are significantly different (P < 0.05).2The larvae fed with single diets (FM, BNM, and CM) were weighed individually and analyzed separately from the
fish fed with mixed diets.

166 ENYIDI ET AL.
Figure 1. Relationship between specific growth rate of African catfish larvae and the carbon: nitrogen (C : N) ratio ofthe experimental diets. ( y = −0.30 x + 10.26, R2= 0.95, P = 0.03).
fractionation values obtained from calculationsusing averages of all mixed diets were veryclose to the values for catfish fed FM that equi-librated in the single diet experiments (�13C−1.10 ± 0.55 and �15N 3.0 ± 0.06) (Fig. 2).
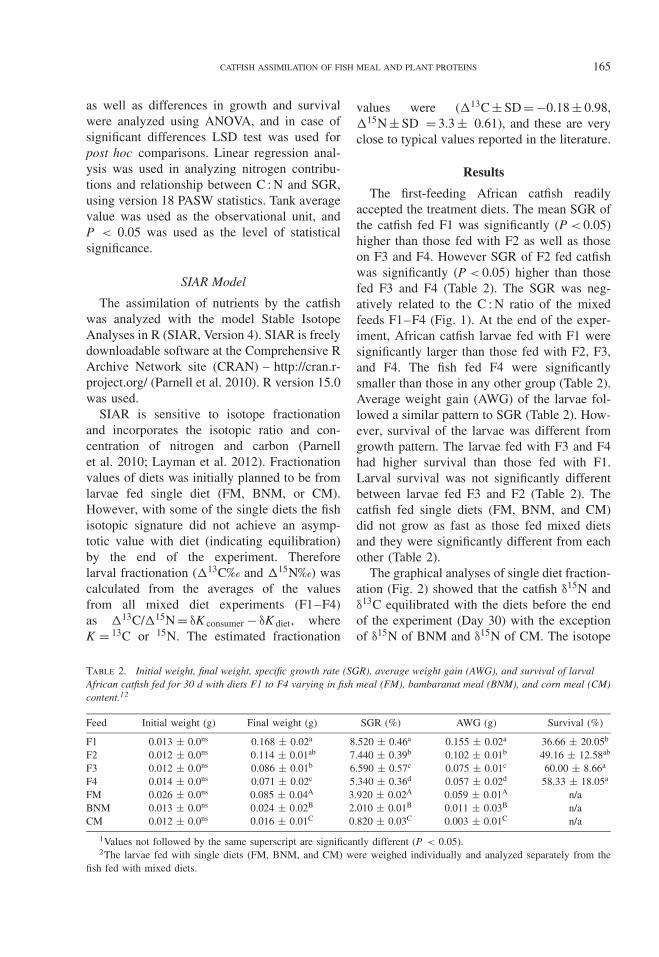
The three feed ingredient sources (BNM,CM, and FM) had divergent isotope signatures(Table 3; Fig. 3). CM had typical δ13C valuesfor a C4 plant source (−10‰ to −14‰)
whereas BNM values reflected a C3 plantsource (−22‰ to −30‰) (Fig. 3). Larvalcatfish isotope signatures resembled that oftheir respective diet plus some fractionation(Fig. 3). Consequently the isotope signaturesof the larvae fed with F1 orientated toward FMwhile those on F3 were more toward BNMand on F4 more toward CM (Fig. 3). The C : Nratios of the feeds showed an increase from F1
Figure 2. Stable isotope signatures of five replicate African catfish larvae fed with single diets of fish meal (FM),bambaranut meal (BNM), or corn meal (CM) for 30 d. Horizontal lines represent isotope values of feeds: (A) δ13CBNM R2 = 0.43, δ15N BNM R2 = 0.79, (B) δ13C CM R2 = 0.65, δ15N CM R2 = 0.24, (C) δ13C FM R2 = 0.14, δ15NFM R2 = 0.38.
CATFISH ASSIMILATION OF FISH MEAL AND PLANT PROTEINS 167
Table 3. δ13C(‰) and δ15N (‰) values, percentagecarbon (%C), percentage nitrogen (%N) andcarbon : nitrogen concentration ratios (C : N) of pelleteddiets (F1–F4) with varying proportions of fish meal (FM),bambaranut meal (BNM), and corn meal (CM) and thesingle diets FM, BNM, and CM used in feeding larvalAfrican catfish for 30 d.1
Feed δ13C(‰) δ15N(‰) %C %N C : N
F1 −20.72 9.01 48.08 6.86 7.01F2 −21.50 7.36 46.08 5.30 8.68F3 −22.37 4.93 45.98 4.06 11.33F4 −17.07 7.48 44.60 2.62 17.02FM −21.50 10.14 49.32 10.48 4.70BNM −26.78 0.08 42.94 3.10 13.82CM −10.79 5.62 43.10 1.42 30.20
1 See Table 1 for details of feed compositions.
Figure 3. Isotope signature bi-plot for fish meal (FM),bambaranut meal (BNM), and corn meal (CM), andfor larval African catfish at the end of a 30-d feedingexperiment fed four experimental diets (F1 to F4) varyingin FM, BNM, and CM inclusion levels. See Table 1 fordetails of feed composition. F1 to F4 represent feed 1 tofeed 4 and the inclusion percentage are inset per feedtype. Note that isotope values for feed ingredient havebeen corrected for trophic fractionation (�13C ± SD =−0.18 ± 0.98, �15N ± SD = 3.3 ± 0.61).
to F4 and this was also reflected in the larvae(Table 4). The catfish showed an increase inpercentage carbon content (%C) from feed F1to feed F4 (Table 4).
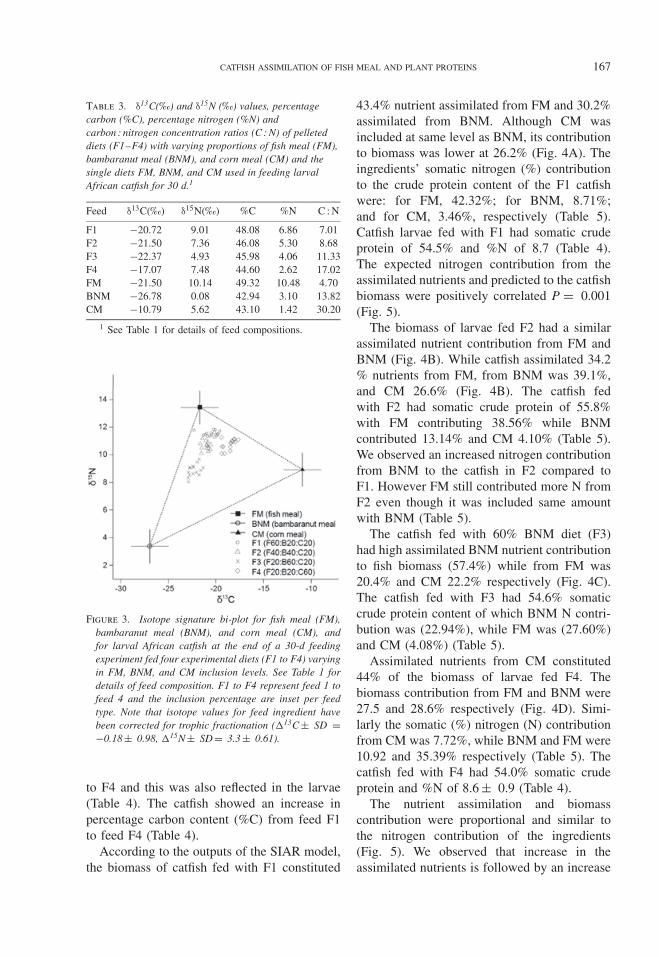
According to the outputs of the SIAR model,the biomass of catfish fed with F1 constituted
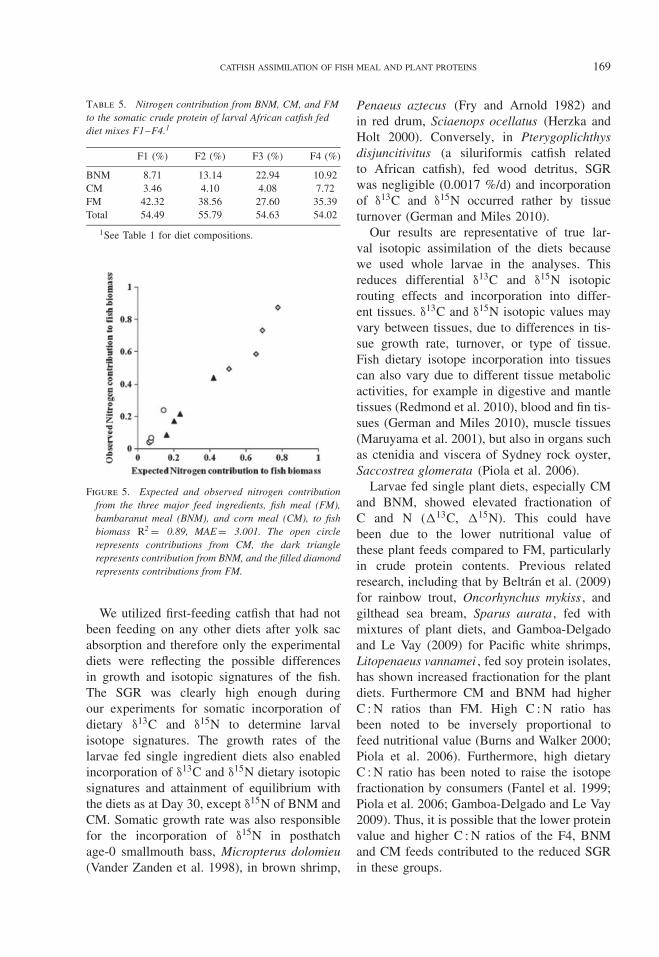
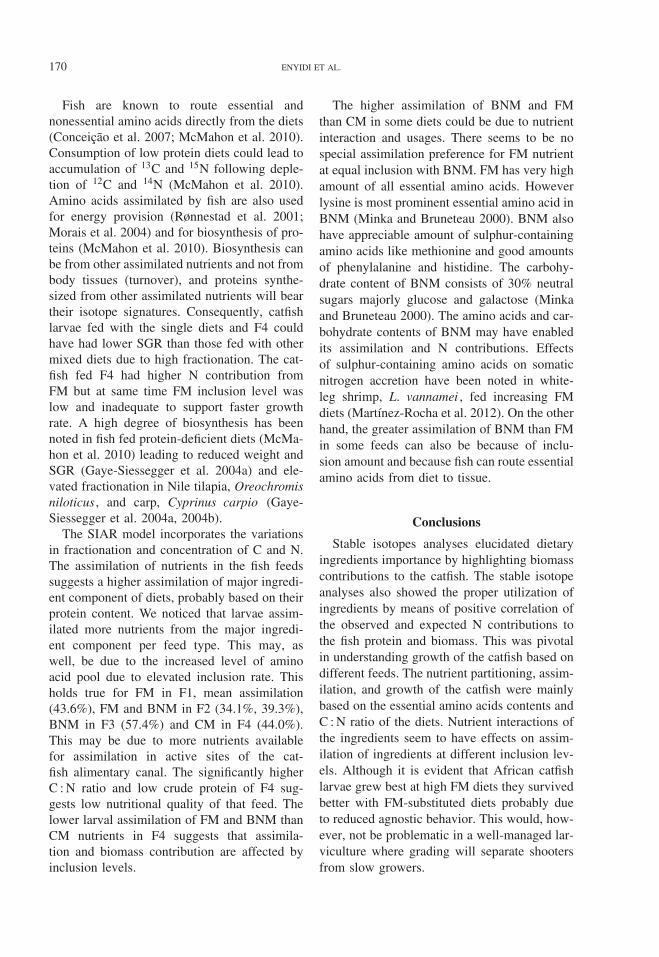
43.4% nutrient assimilated from FM and 30.2%assimilated from BNM. Although CM wasincluded at same level as BNM, its contributionto biomass was lower at 26.2% (Fig. 4A). Theingredients’ somatic nitrogen (%) contributionto the crude protein content of the F1 catfishwere: for FM, 42.32%; for BNM, 8.71%;and for CM, 3.46%, respectively (Table 5).Catfish larvae fed with F1 had somatic crudeprotein of 54.5% and %N of 8.7 (Table 4).The expected nitrogen contribution from theassimilated nutrients and predicted to the catfishbiomass were positively correlated P = 0.001(Fig. 5).
The biomass of larvae fed F2 had a similarassimilated nutrient contribution from FM andBNM (Fig. 4B). While catfish assimilated 34.2% nutrients from FM, from BNM was 39.1%,and CM 26.6% (Fig. 4B). The catfish fedwith F2 had somatic crude protein of 55.8%with FM contributing 38.56% while BNMcontributed 13.14% and CM 4.10% (Table 5).We observed an increased nitrogen contributionfrom BNM to the catfish in F2 compared toF1. However FM still contributed more N fromF2 even though it was included same amountwith BNM (Table 5).
The catfish fed with 60% BNM diet (F3)had high assimilated BNM nutrient contributionto fish biomass (57.4%) while from FM was20.4% and CM 22.2% respectively (Fig. 4C).The catfish fed with F3 had 54.6% somaticcrude protein content of which BNM N contri-bution was (22.94%), while FM was (27.60%)and CM (4.08%) (Table 5).
Assimilated nutrients from CM constituted44% of the biomass of larvae fed F4. Thebiomass contribution from FM and BNM were27.5 and 28.6% respectively (Fig. 4D). Simi-larly the somatic (%) nitrogen (N) contributionfrom CM was 7.72%, while BNM and FM were10.92 and 35.39% respectively (Table 5). Thecatfish fed with F4 had 54.0% somatic crudeprotein and %N of 8.6 ± 0.9 (Table 4).
The nutrient assimilation and biomasscontribution were proportional and similar tothe nitrogen contribution of the ingredients(Fig. 5). We observed that increase in theassimilated nutrients is followed by an increase

168 ENYIDI ET AL.
Table 4. The δ13C (‰) and δ15N (‰) values, %C and %N and C : N ratios of larval African catfish fed diets (F1–F4)varying proportions of fish meal (FM), bambaranut meal (BNM), and CM and single diets FM, BNM, and CM for 30 d.1
Feed δ13C(‰) δ15N(‰) %C %N C : N
F1 −20.53 ± 0.72a 11.56 ± 0.74a 43.66 ± 2.21c 8.72 ± 1.31a 5.16 ± 0.60a
F2 −20.99 ± 0.41ab 10.67 ± 0.34a 45.82 ± 1.32b 8.92 ± 0.74a 5.17 ± 0.32a
F3 −22.32 ± 0.52b 8.86 ± 0.43b 47.96 ± 1.64ab 8.74 ± 0.79a 5.53 ± 0.16b
F4 −18.59 ± 0.57a 10.76 ± 0.38a 49.54 ± 2.29a 8.64 ± 0.97a 5.80 ± 0.06c
FM −20.72 ± 0.16B 12.47 ± 0.58B 43.36 ± 5.86A 9.01 ± 1.66A 4.92 ± 1.40A
BNM −22.70 ± 1.15C 10.82 ± 0.62C 42.94 ± 6.20B 8.72 ± 2.02B 5.13 ± 0.15B
CM −15.24 ± 0.38A 13.90 ± 0.96A 43.10 ± 2.63A 7.55 ± 1.02C 5.98 ± 0.87C
1See Table 1 for details of feed compositions. Values are averages of three replicates ± SD.
Figure 4. SIAR isotope mixing model results for larval African catfish proportional nutrient assimilation from fish meal(FM), bambaranut meal (BNM), and corn meal (CM) in four different feed mixtures: (A) F1 (FM60 : BNM20 : CM20);(B) F2 (FM40 : BNM40 : CM20); (C) F3 (FM20 : BNM60 : CM20); and (D) F4 (FM20 : BNM20 : CM60). See Table 1 fordetails of the feeds F1 to F4.
in N contribution. Similarly, increasingingredients inclusion amount increases theamount assimilated and contribution to fishbiomass (Table 5; Fig. 5).
Discussion
The isotopic changes in a consumer feda new diet can arise from turnover (i.e.,metabolic breakdown of old tissues resultingfrom previous diets and replacement withfresh tissues from the new diet) or from fast
growth rate (i.e., biomass accretions as a result
of intake from the new diet). Nongrowing
organisms or very slow growers will reflect
metabolic breakdown but fast growing fish
incorporate new isotopes through their growth
rate (Hesslein et al. 1993; Herzka and Holt
2000). The benefits of fast growth to dietary
isotope incorporation had been previously noted
(Fry and Arnold 1982; Herzka and Holt 2000;
Sakano et al. 2005; Redmond et al. 2010).
CATFISH ASSIMILATION OF FISH MEAL AND PLANT PROTEINS 169
Table 5. Nitrogen contribution from BNM, CM, and FMto the somatic crude protein of larval African catfish feddiet mixes F1–F4.1
F1 (%) F2 (%) F3 (%) F4 (%)
BNM 8.71 13.14 22.94 10.92CM 3.46 4.10 4.08 7.72FM 42.32 38.56 27.60 35.39Total 54.49 55.79 54.63 54.02
1See Table 1 for diet compositions.
Figure 5. Expected and observed nitrogen contributionfrom the three major feed ingredients, fish meal (FM),bambaranut meal (BNM), and corn meal (CM), to fishbiomass R2 = 0.89, MAE = 3.001. The open circlerepresents contributions from CM, the dark trianglerepresents contribution from BNM, and the filled diamondrepresents contributions from FM.
We utilized first-feeding catfish that had notbeen feeding on any other diets after yolk sacabsorption and therefore only the experimentaldiets were reflecting the possible differencesin growth and isotopic signatures of the fish.The SGR was clearly high enough duringour experiments for somatic incorporation ofdietary δ13C and δ15N to determine larvalisotope signatures. The growth rates of thelarvae fed single ingredient diets also enabledincorporation of δ13C and δ15N dietary isotopicsignatures and attainment of equilibrium withthe diets as at Day 30, except δ15N of BNM andCM. Somatic growth rate was also responsiblefor the incorporation of δ15N in posthatchage-0 smallmouth bass, Micropterus dolomieu(Vander Zanden et al. 1998), in brown shrimp,
Penaeus aztecus (Fry and Arnold 1982) andin red drum, Sciaenops ocellatus (Herzka andHolt 2000). Conversely, in Pterygoplichthysdisjuncitivitus (a siluriformis catfish relatedto African catfish), fed wood detritus, SGRwas negligible (0.0017 %/d) and incorporationof δ13C and δ15N occurred rather by tissueturnover (German and Miles 2010).
Our results are representative of true lar-val isotopic assimilation of the diets becausewe used whole larvae in the analyses. Thisreduces differential δ13C and δ15N isotopicrouting effects and incorporation into differ-ent tissues. δ13C and δ15N isotopic values mayvary between tissues, due to differences in tis-sue growth rate, turnover, or type of tissue.Fish dietary isotope incorporation into tissuescan also vary due to different tissue metabolicactivities, for example in digestive and mantletissues (Redmond et al. 2010), blood and fin tis-sues (German and Miles 2010), muscle tissues(Maruyama et al. 2001), but also in organs suchas ctenidia and viscera of Sydney rock oyster,Saccostrea glomerata (Piola et al. 2006).
Larvae fed single plant diets, especially CMand BNM, showed elevated fractionation ofC and N (�13C, �15N). This could havebeen due to the lower nutritional value ofthese plant feeds compared to FM, particularlyin crude protein contents. Previous relatedresearch, including that by Beltran et al. (2009)for rainbow trout, Oncorhynchus mykiss , andgilthead sea bream, Sparus aurata , fed withmixtures of plant diets, and Gamboa-Delgadoand Le Vay (2009) for Pacific white shrimps,Litopenaeus vannamei , fed soy protein isolates,has shown increased fractionation for the plantdiets. Furthermore CM and BNM had higherC : N ratios than FM. High C : N ratio hasbeen noted to be inversely proportional tofeed nutritional value (Burns and Walker 2000;Piola et al. 2006). Furthermore, high dietaryC : N ratio has been noted to raise the isotopefractionation by consumers (Fantel et al. 1999;Piola et al. 2006; Gamboa-Delgado and Le Vay2009). Thus, it is possible that the lower proteinvalue and higher C : N ratios of the F4, BNMand CM feeds contributed to the reduced SGRin these groups.
170 ENYIDI ET AL.
Fish are known to route essential andnonessential amino acids directly from the diets(Conceicao et al. 2007; McMahon et al. 2010).Consumption of low protein diets could lead toaccumulation of 13C and 15N following deple-tion of 12C and 14N (McMahon et al. 2010).Amino acids assimilated by fish are also usedfor energy provision (Rønnestad et al. 2001;Morais et al. 2004) and for biosynthesis of pro-teins (McMahon et al. 2010). Biosynthesis canbe from other assimilated nutrients and not frombody tissues (turnover), and proteins synthe-sized from other assimilated nutrients will beartheir isotope signatures. Consequently, catfishlarvae fed with the single diets and F4 couldhave had lower SGR than those fed with othermixed diets due to high fractionation. The cat-fish fed F4 had higher N contribution fromFM but at same time FM inclusion level waslow and inadequate to support faster growthrate. A high degree of biosynthesis has beennoted in fish fed protein-deficient diets (McMa-hon et al. 2010) leading to reduced weight andSGR (Gaye-Siessegger et al. 2004a) and ele-vated fractionation in Nile tilapia, Oreochromisniloticus , and carp, Cyprinus carpio (Gaye-Siessegger et al. 2004a, 2004b).
The SIAR model incorporates the variationsin fractionation and concentration of C and N.The assimilation of nutrients in the fish feedssuggests a higher assimilation of major ingredi-ent component of diets, probably based on theirprotein content. We noticed that larvae assim-ilated more nutrients from the major ingredi-ent component per feed type. This may, aswell, be due to the increased level of aminoacid pool due to elevated inclusion rate. Thisholds true for FM in F1, mean assimilation(43.6%), FM and BNM in F2 (34.1%, 39.3%),BNM in F3 (57.4%) and CM in F4 (44.0%).This may be due to more nutrients availablefor assimilation in active sites of the cat-fish alimentary canal. The significantly higherC : N ratio and low crude protein of F4 sug-gests low nutritional quality of that feed. Thelower larval assimilation of FM and BNM thanCM nutrients in F4 suggests that assimila-tion and biomass contribution are affected byinclusion levels.
The higher assimilation of BNM and FMthan CM in some diets could be due to nutrientinteraction and usages. There seems to be nospecial assimilation preference for FM nutrientat equal inclusion with BNM. FM has very highamount of all essential amino acids. Howeverlysine is most prominent essential amino acid inBNM (Minka and Bruneteau 2000). BNM alsohave appreciable amount of sulphur-containingamino acids like methionine and good amountsof phenylalanine and histidine. The carbohy-drate content of BNM consists of 30% neutralsugars majorly glucose and galactose (Minkaand Bruneteau 2000). The amino acids and car-bohydrate contents of BNM may have enabledits assimilation and N contributions. Effectsof sulphur-containing amino acids on somaticnitrogen accretion have been noted in white-leg shrimp, L. vannamei , fed increasing FMdiets (Martínez-Rocha et al. 2012). On the otherhand, the greater assimilation of BNM than FMin some feeds can also be because of inclu-sion amount and because fish can route essentialamino acids from diet to tissue.
Conclusions
Stable isotopes analyses elucidated dietaryingredients importance by highlighting biomasscontributions to the catfish. The stable isotopeanalyses also showed the proper utilization ofingredients by means of positive correlation ofthe observed and expected N contributions tothe fish protein and biomass. This was pivotalin understanding growth of the catfish based ondifferent feeds. The nutrient partitioning, assim-ilation, and growth of the catfish were mainlybased on the essential amino acids contents andC : N ratio of the diets. Nutrient interactions ofthe ingredients seem to have effects on assim-ilation of ingredients at different inclusion lev-els. Although it is evident that African catfishlarvae grew best at high FM diets they survivedbetter with FM-substituted diets probably dueto reduced agnostic behavior. This would, how-ever, not be problematic in a well-managed lar-viculture where grading will separate shootersfrom slow growers.

CATFISH ASSIMILATION OF FISH MEAL AND PLANT PROTEINS 171
Acknowledgments
We are grateful to T. Sinisalo for helping inallocating time for isotope analysis and JuhaAhonen for help in the water systems andtemperature control during the fish culture.
Literature CitedBeltran, M., J. Fernandez-Borras, F. Medale, J. Perez-
Sanchez, S. Kaushik, and J. Blasco. 2009. Naturalabundance of 15N and 13C in fish tissues and the useof stable isotopes as dietary protein tracers in rainbowtrout and gilthead sea bream. Aquaculture Nutrition15:9–18.
Burns, A. and K. F. Walker. 2000. Biofilms as foodfor decapods, (Atyidae, Palaemonidae), in the riverMurray, South Australia. Hydrobiologia 437:83–90.
Conceicao, L. E. C., J. Skjermo, G. Skjak-Bræk, and J.A. J. Verreth. 2001. Effect of an immunostimulatingalginate on protein turnover of turbot, Scophthalmusmaximus L., we wanted to examine larvae. FishPhysiology and Biochemistry 24:207–212.
Conceicao, L. E. C., S. Morais, and I. Rønnestad. 2007Tracers in fish larvae nutrition: a review of methodsand applications. Aquaculture 267:62–75.
DeNiro, M. J. and S. Epstein. 1981. Influence of diets onthe distribution of nitrogen in animals. Geochimica etCosmochimica Acta 45:341–351.
Dubois, S., B. Jean-Loui, B. Bertrand, and S. Lefebvre.2007. Isotope trophic-step fractionation of suspension-feeding species: implications for food partitioning incoastal ecosystem. Journal of Experimental MarineBiology and Ecology 351:121–128.
Fantel, M. S., A. I. Dittel, S. Schwalm, C. E. Epifanio,and M. L. Fogel. 1999. A food web analysis ofthe juvenile crab, Callinectes sapidus , using stableisotopes in whole animals and individual amino acids.Oecologia 120:416–426.
FAO. 2008. FAO Aquaculture production: quantities 1950-2006, Aquaculture production: values 1984-2006;capture production: 1950-2006; Fisheries Department,Fishery Information data and statistical unit. Fishstatplus: universal software for fishery statistical timeseries. Commodities production and trade: 1950-2006;vers.2.30. FAO, Rome, Italy.
Fry, B. 2006. Stable isotope ecology. Springer Science,New York, New York, USA.
Fry, B. and C. Arnold. 1982. Rapid 13C/12C turnoverduring growth of brown shrimp, Penaeus aztecus .Oecologia 54:200–2004.
Gamboa-Delgado, J. and L. Le Vay. 2009. Nitrogen stableisotopes as indicators of the relative contribution of soyprotein and fish meal to tissue growth in Pacific whiteshrimp, Litopenaeus vannamei , fed compounded diets.Aquaculture 291:115–123.
Gamboa-Delgado, J., J. P. Canavate, R. Zerolo, and L.Le Vay. 2008. Natural carbon stable isotope ratiosas indicators of the relative contributions of live and
inert diets to growth in larval Senegalese sole, Soleasenegalensis . Aquaculture 280:190–197.
García-Ortega, A., J. A. J. Verreth, K. Vermis, H.J. Nelis, P. Sorgeloos, and M. W. A. Verstegen.2010. Laboratory investigation of daily food intakeand gut evacuation in larvae of African catfish,Clarias gariepinus , under different feeding conditions.Aquaculture International 18:119–134.
Gaye-Siessegger, J., U. Focken, H. Abel, and K. Becker.2004a. Individual protein balance strongly influenceδ15N and δ13C values in Nile tilapia, Oreochromisniloticus . Naturwissenschaften 91:90–93.
Gaye-Siessegger, J., U. Focken, S. Muetzel, H. Abel,and K. Becker. 2004b. Feeding level and individualmetabolic rate affect δ13C and δ15N values in carp:implications for web studies. Oecologia 138:175–183.
Gaylord, G. L. and T. F. Barrows. 2008. Appar-ent digestibility of gross nutrients from feedstuffsin extruded feeds for rainbow trout, Oncorhynchusmykiss . Journal of the World Aquaculture Society39:827–834.
German, D. P. and R. D. Miles. 2010. Stable car-bon and nitrogen incorporation in blood and fin tis-sue of the catfish, Pterygoplichthys disjunctivus (Sil-uriformes, Loricariidae). Environmental Biology ofFishes 89:117–133.
Glencross, B. D., T. Boujard, and S. J. Kaushik. 2003.Influence of oligosaccharides on the digestibility oflupin meals when fed to rainbow trout, Oncorhynchusmykiss . Aquaculture 219:703–713.
Herzka, S. Z. and G. J. Holt. 2000. Changes in isotopiccomposition of red drum, Sciaenops ocellatus , larvaein response to dietary shifts: potential applications tosettlement studies. Canadian Journal of Fisheries andAquatic Sciences 57:137–147.
Hesslein, R. H., K. A. Hallard, and P. Ramlal. 1993.Replacement of sulfur, carbon and nitrogen in tissueof growing broad whitefish, Coregonus nasus , inresponse to a change in diet traced by δ34S, δ13C,and δ15N. Canadian Journal of Fisheries and AquaticSciences 50:2071–2076.
Horvath, L., T. Szab, and J. Burke. 1997. Hatchery test-ing of GnRH analogue-containing pellets on ovulationin four cyprinid species. Polish Archives of Hydrobi-ology 44:221–226.
Hovde, S. C., M. C. Vidal, I. Opstad, and A. J. Raae.2005. Design and synthesis of 14C-labelled proteinas tools for protein digestion studies in fish larvae.Aquaculture Nutrition 11:395–401.
Izquierdo, M. S., H. Fernandez-Palacios, and A. G. J.Tacon. 2001. Effect of broodstock nutrition on repro-ductive performance of fish. Aquaculture 197:25–42.
Jomori, R. K., C. Ducatti, D. J. Carneiro, and M. C.Portella. 2008. Stable carbon (δ13C) and nitrogen(δ15N) isotopes as natural indicators of live and dryfood in Piaractus mesopotamicus , (Holmberg 1887)larval tissue. Aquaculture Research 39:370–381.
Kainz, M., M. T. Arts, and A. Mazumder. 2004. Essentialfatty acids in the planktonic food web and their
172 ENYIDI ET AL.
ecological role for higher trophic levels. Limnologyand Oceanography 49:1784–1793.
Layman, C. A., M. S. Araujo, R. Boucek, C. M.Hammerschlag-Peyer, E. Harrison, Z. R. Jud, P.Matich, A. E. Rosenblatt, J. J. Vaudo, L. A.Yeager, D. M. Post, and S. Bearhop. 2012. Applyingstable isotopes to examine food-web structure: anoverview of analytical tools. Biological Reviews ofthe Cambridge Philosophical Society 87:545–562.
Levey, D. J., H. A. Bissell, and S. F. O’Keefe. 2000. Con-version of nitrogen to protein and amino acids in wildfruits. Journal of Chemical Ecology 26:1749–1763.
Martínez-Rocha, L., J. Gamboa-Delgado, M. Nieto-Lopez, D. Ricque-Marie, and L. E. Cruz-Suarez.2012. Incorporation of dietary nitrogen from fishmeal and pea meal, Pisum sativum , in muscletissue of Pacific white shrimp, Litopenaeus van-namei , fed low protein compound diets. AquacultureResearch 2012:1–13. DOI: 10.1111/j.1365-2109.2011.03083.x.
Maruyama, A., Y. Yamada, B. Rusuwa, and M. Yuma.2001. Changes in stable nitrogen isotopes ratio in themuscle tissue of a migratory goby, Rhinogobius , sp.,in a natural setting. Canadian Journal of Fisheries andAquatic Sciences 58:2125–2128.
McMahon, K. W., M. L. Fogel, T. S. Elsdon, andS. R. Thorrold. 2010. Carbon isotope fractionationof amino acids in fish muscle reflects biosynthesisand isotopic routing from dietary protein. Journal ofAnimal Ecology 79:1132–1141.
Minka, S. R. and M. Bruneteau. 2000. Partial chemicalcomposition of bambara pea (Vigna subterranea (L.)Verde). Food Chemistry 68:273–276.
Moore, J. W. and B. X. Semmens. 2008. Incorporatinguncertainty and prior information into stable isotopemixing models. Ecology Letters 11:470–480.
Morais, S., M. Lacuisse, L. E. C. Conceicao, M.T. Dinis, and I. Rønnestad. 2004. Ontogeny ofthe digestive capacity of Senegalese sole, Soleasenegalenses , with respect to digestion, absorptionand metabolism of amino acids from artemia. MarineBiology 145:243–250.
Morais, S., M. Torten, O. Nixon, S. Lutzky, L. E. C.Conceicao, M. T. Dinis, A. Tandler, and W. Koven.2006. Food intake and absorption are affected bydietary lipid level and lipid source in seabream, Sparusaurata L., larvae. Journal of Experimental MarineBiology and Ecology 331:51–63.
Olive, P. J. W., J. K. Pinnegar, N. V. C. Polunin, G.Richards, and R. Welch. 2003. Isotope trophic-stepfractionation: a dynamic equilibrium model. Journal ofAnimal Ecology 72:608–617.
Oliveira, A. C. B., L. A. Martinelli, M. Z. Moreira,and J. E. P. Cyrino. 2008. Determination of apparentdigestibility coefficient in fish by stable carbon iso-topes. Aquaculture Nutrition 14:10–13.
Parnell, A. C., R. Inger, S. Bearhop, and A. L. Jackson.2010. Source partitioning using isotopes: coping withtoo much variations. PLoS ONE 5:e9672.
Phillips, D. L. 2001. Mixing models in analyses of dietusing multiple stable isotopes: a critique. Oecologia127:166–170.
Phillips, D. L. and J. W. Gregg. 2001. Uncertainty insource partitioning using stable isotopes. Oecologia127:171–179.
Phillips, D. L. and J. W. Gregg. 2003. Source partitioningusing stable isotopes: coping with too many sources.Oecologia 136:261–269.
Piola, R. F., S. K. Moore, and I. M. Suthers. 2006.Carbon and nitrogen stable isotopes analysis of threetypes of oyster tissue in an impacted estuary. EstuarineCoastal and Shelf Science 66:255–266.
Post, D. M. 2002. Using stable isotopes to estimate trophicposition: models, methods and assumptions. Ecology83:703–718.
Preston, N. P., D. M. Smith, D. M. Kellaway, andS. E. Bunn. 1996. The use of enriched 15N as anindicator of the assimilation of individual proteinsources from compound diet for juvenile Penaeusmonodon . Aquaculture 147:249–259.
Redmond, K. J., T. Magnesen, P. K. Hansen, Ø. Strand,and S. Meier. 2010. Stable isotopes and fatty acids astracers of the assimilation of salmon fish feed in bluemussels, Mytilus edulis . Aquaculture 298:202–210.
Robbins, C. T., G. V. Hilderbrand, and S. D. Farley.2002. Incorporating concentration dependence in sta-ble isotope mixing models: a response to Phillips andKoch (2002). Oecologia 133:10–13.
Rønnestad, I., C. R. Rojas-Garca, S. K. Tonheim,and L. E. C. Conceicao. 2001. In vivo studies ofdigestion and nutrient assimilation in marine fishlarvae. Aquaculture 201:161–175.
Sakano, H., E. Fujiwara, S. Nohara, and H. Ueda. 2005.Estimation of nitrogen turnover rate of Oncorhynchusnerka . Environmental Biology of Fishes 72:13–18.
Schlechtriem, C., U. Focken, and K. Becker. 2004. Stableisotopes as a tool for nutrient assimilation studiesin larval fish feeding on live food. Aquatic Ecology38:93–100.
Vander Zanden, M. J., M. Hulshof, M. S. Ridgway, andJ. B. Rasmussen. 1998. Application of stable isotopestechniques to trophic studies of age-0 smallmouthbass. Transactions of the Americans Fisheries Society127:729–739.
Related Documents
![Clarias gariepinus - SciELO · 1844 )], black-bass [Micropterus salmoides (Lacepede, 1802)], and recently, the walking catfish [Clarias gariepinus (Burchell, 1822)]. Fish species](https://static.cupdf.com/doc/110x72/5b85ba5b7f8b9a9a4d8b5172/clarias-gariepinus-1844-black-bass-micropterus-salmoides-lacepede-1802.jpg)


![An Appraisal of Introduced African Catfish Clarias ... · of introduced African catfish is poorly understood [2,4]. African sharptooth catfish Clarias gariepinus is arguably the most](https://static.cupdf.com/doc/110x72/5eaeac3e62773f09dd34694f/an-appraisal-of-introduced-african-catfish-clarias-of-introduced-african-catfish.jpg)