PEER REVIEWED Numerical Study of Suspension Plasma Spraying Amirsaman Farrokhpanah 1 • Thomas W. Coyle 2 • Javad Mostaghimi 1 Submitted: 28 May 2016 / in revised form: 2 November 2016 / Published online: 8 December 2016 Ó ASM International 2016 Abstract A numerical study of suspension plasma spray- ing is presented in the current work. The liquid suspension jet is replaced with a train of droplets containing the sus- pension particles injected into the plasma flow. Atomiza- tion, evaporation, and melting of different components are considered for droplets and particles as they travel toward the substrate. Effect of different parameters on particle conditions during flight and upon impact on the substrate is investigated. Initially, influence of the torch operating conditions such as inlet flow rate and power is studied. Additionally, effect of injector parameters like injection location, flow rate, and angle is examined. The model used in the current study takes high-temperature gradients and non-continuum effects into account. Moreover, the important effect of change in physical properties of sus- pension droplets as a result of evaporation is included in the model. These mainly include variations in heat transfer properties and viscosity. Utilizing this improved model, several test cases have been considered to better evaluate the effect of different parameters on the quality of particles during flight and upon impact on the substrate. Keywords droplet breakup particle trajectory suspension plasma spraying suspension viscosity Introduction Suspension plasma spraying is emerging as a powerful coating technique for depositing high-quality thermal bar- rier coatings. Fine ceramic powders can be used to create stable suspensions in fluids like water or ethanol which are then injected into a plasma jet. The heat from plasma will evaporate the carrier fluid and eventually melt the solid content. The suspension droplets go through several breakups before evaporation is complete. A detailed understanding of how process operating parameters affect the properties of the deposited coating is of great impor- tance. Physical properties of the suspension and operating conditions of the plasma torch, along with injection parameters, i.e., position, angle, and speed, play important roles in this process. Various experimental and numerical studies have been performed on suspension plasma spraying (SPS). The numerical and experimental study by Fazilleau et al. (Ref 1) focused on interaction between YSZ-ethanol suspension droplets and gas flow in DC plasma spraying. Suspension was injected at a 60° angle aiming the center point of the nozzle exit. It was shown that plasma flow’s asymmetry due to liquid injection becomes deteriorated at 15 mm downstream of the nozzle exit. Therefore, after 10-15 mm, solvent in the suspension has completely evaporated and the solid contents are uniformly mixed with the plasma gas. Their study also pointed out that gas flow velocity varia- tions induced by voltage fluctuations in 200-ls time win- dows play important role in stimulating droplet breakups. In the second part of their study (Ref 2), effect of gas This article is an invited paper selected from presentations at the 2016 International Thermal Spray Conference, held May 10-12, 2016, in Shanghai, P.R. China, and has been expanded from the original presentation. & Amirsaman Farrokhpanah [email protected] 1 Mechanical and Industrial Engineering Department, University of Toronto, Toronto, ON, Canada 2 Materials Science and Engineering, University of Toronto, Toronto, ON, Canada 123 J Therm Spray Tech (2017) 26:12–36 DOI 10.1007/s11666-016-0502-9

Welcome message from author
This document is posted to help you gain knowledge. Please leave a comment to let me know what you think about it! Share it to your friends and learn new things together.
Transcript
PEER REVIEWED
Numerical Study of Suspension Plasma Spraying
Amirsaman Farrokhpanah1 • Thomas W. Coyle2 • Javad Mostaghimi1
Submitted: 28 May 2016 / in revised form: 2 November 2016 / Published online: 8 December 2016
� ASM International 2016
Abstract A numerical study of suspension plasma spray-
ing is presented in the current work. The liquid suspension
jet is replaced with a train of droplets containing the sus-
pension particles injected into the plasma flow. Atomiza-
tion, evaporation, and melting of different components are
considered for droplets and particles as they travel toward
the substrate. Effect of different parameters on particle
conditions during flight and upon impact on the substrate is
investigated. Initially, influence of the torch operating
conditions such as inlet flow rate and power is studied.
Additionally, effect of injector parameters like injection
location, flow rate, and angle is examined. The model used
in the current study takes high-temperature gradients and
non-continuum effects into account. Moreover, the
important effect of change in physical properties of sus-
pension droplets as a result of evaporation is included in
the model. These mainly include variations in heat transfer
properties and viscosity. Utilizing this improved model,
several test cases have been considered to better evaluate
the effect of different parameters on the quality of particles
during flight and upon impact on the substrate.
Keywords droplet breakup � particle trajectory �suspension plasma spraying � suspension viscosity
Introduction
Suspension plasma spraying is emerging as a powerful
coating technique for depositing high-quality thermal bar-
rier coatings. Fine ceramic powders can be used to create
stable suspensions in fluids like water or ethanol which are
then injected into a plasma jet. The heat from plasma will
evaporate the carrier fluid and eventually melt the solid
content. The suspension droplets go through several
breakups before evaporation is complete. A detailed
understanding of how process operating parameters affect
the properties of the deposited coating is of great impor-
tance. Physical properties of the suspension and operating
conditions of the plasma torch, along with injection
parameters, i.e., position, angle, and speed, play important
roles in this process.
Various experimental and numerical studies have been
performed on suspension plasma spraying (SPS). The
numerical and experimental study by Fazilleau et al. (Ref
1) focused on interaction between YSZ-ethanol suspension
droplets and gas flow in DC plasma spraying. Suspension
was injected at a 60� angle aiming the center point of the
nozzle exit. It was shown that plasma flow’s asymmetry
due to liquid injection becomes deteriorated at 15 mm
downstream of the nozzle exit. Therefore, after 10-15 mm,
solvent in the suspension has completely evaporated and
the solid contents are uniformly mixed with the plasma gas.
Their study also pointed out that gas flow velocity varia-
tions induced by voltage fluctuations in 200-ls time win-
dows play important role in stimulating droplet breakups.
In the second part of their study (Ref 2), effect of gas
This article is an invited paper selected from presentations at the 2016
International Thermal Spray Conference, held May 10-12, 2016, in
Shanghai, P.R. China, and has been expanded from the original
presentation.
& Amirsaman Farrokhpanah
1 Mechanical and Industrial Engineering Department,
University of Toronto, Toronto, ON, Canada
2 Materials Science and Engineering, University of Toronto,
Toronto, ON, Canada
123
J Therm Spray Tech (2017) 26:12–36
DOI 10.1007/s11666-016-0502-9
fluctuations on solid particle flights was investigated using a
simplified 2D model. Effects of plasma parameters on drag
and heat transfer of solid particles were included using cor-
rection methods. Their model, however, assumed constant
properties for injected particles. Obtained results suggested
an optimum substrate standoff distance of 40-60 mm.
Waldbillig et al. (Ref 3) performed an experimental
study on the effects of torch nozzle size, power, and plasma
gas velocity on SPS YSZ coatings. They concluded that the
lowest permeability in coatings can be achieved by using
small nozzles and high plasma flow rates, while higher
deposition efficiency is a result of lower flow rates with
small nozzles.
Jabbari et al. (Ref 4) performed a numerical study of
nickel-ethanol suspension spraying. Similarly, Jadidi et al.
(Ref 5) had numerically focused on flight and impact of
nickel-ethanol suspension droplets near the substrate and
upon impact. Factors such as particle speeds and trajecto-
ries along with the shape and position of the substrate were
studied. Their results showed that decreasing the sub-
strate’s standoff location from 60 to 40 mm can increase
particles’ temperature at substrate by 6%.
Rampon et al. (Ref 6) studied application of SPS in pro-
ducing solid-oxide fuel cells. Their experiment on spraying
YSZ suspension in water reported a shift from mono-modal
particle size distribution to multimodal with the increase in
gas Weber number from 5 to 24. More importantly, they
concluded that the suspension breakups and droplet size
distributions were affected by the viscosity of the suspen-
sions. Their results showed that at high Weber numbers,
Ohnesorge number, or viscosity of the suspensions, can
become the dominant factor. It has to be noted though that
their calculation of Weber and Ohnesorge numbers did not
include change in physical properties during flight, i.e.,
viscosity of the suspension droplets was assumed to remain
constant and equal to its initial value at injection time.
Studies like this indicate that the physical properties of
suspension materials can have significant impact on the
SPS process. For instance, they can tremendously control
the atomization process. Suspension defragmentation is a
result of domination of different forces acting on the dro-
plets, i.e., (i) inertia and shear forces resulting from the
relative velocities between the droplet and plasma gas, (ii)
instabilities induced by surface tension forces resisting
increase in the surface area of the droplets, and (iii) viscous
forces that act by dissipating the instabilities. Three non-
dimensional numbers can be used for evaluating the
importance of each force compared to another, Weber
number We ¼ qgv2reldp=rp
� �, Reynolds number Re ¼ð
qgvreldp=lgÞ, and Ohnesorge number Oh ¼ lp=�
ffiffiffiffiffiffiffiffiffiffiffiffiffiffiqprpdp
pÞ. q is the density, l is the dynamic viscosity, r is
the surface tension coefficient, d is droplet diameter, and
vrel is the relative velocity between a droplet and plasma
gas. Subscripts p and g refer to properties of suspension
droplets/particles and plasma gas, respectively. If any of
the physical properties were to change, these non-dimen-
sional numbers will be affected, and these results have
different patterns of physical phenomena.
Weber number plays an important role in determining
the breakup regimes of suspension droplets. Its value can
vary due to changes in gas density, relative velocity, droplet
diameter, and surface tension. As the suspension jet is
injected into the torch, the values for gas density and rela-
tive velocity will change. Meillot et al. (Ref 7)’s study
showed that the jet’s Weber has a rapid growth upon
entering the plasma flow due to high relative velocity and
gas density. This value is then reduced with further pene-
tration. As the jet reaches near the torch center line, Weber
will grow again slowly. Droplet diameters are typically
controlled by problem parameters such as the injector’s size
and geometry. Surface tension of droplets can also influence
Weber values. For pure liquids, this value will remain
constant as the droplets travel in the domain. For suspen-
sions, however, surface tension values may differ. In the
preparation process of the suspension, the addition of the
solid content to the solvent typically results in a mixture
with surface tension values lower than the solvent’s original
surface tension. It is, however, reasonable to assume that
this lower surface tension value will not drastically change
with the evaporation of the liquid content (Ref 6), and
hence, its effect on Weber number and breakup regimes is
neglected in current scope. The viscosity of the suspension,
however, as already suggested by many researches (Ref
3, 8-11), goes through significant changes when the liquid
content evaporates. The changing value of viscosity can
potentially become a key factor in determining droplets’
breakup regime. While changes in viscosity do not affect
Weber values directly, effect of viscosity on breakup
according to experimental studies becomes important when
Oh[ 0.1 (Ref 12). As the Oh increases, the criticalWe also
increases which can be estimated for large Oh as (Ref 13)
Wec ¼ Wec;Oh!0 1þ 1:077Oh1:6� �
ðEq 1Þ
The critical We marks the transition between breakup
regimes (Ref 12), and theoretically, drops will experience
breakups for values larger than Wec. During the suspension
flight, as the liquid content evaporates, the viscosity of the
suspension increases. This increase in dynamic viscosity
(lp) will consequently increase Ohnesorge number (Oh).
According to correlations like Eq 1, this leads to increases
in the Wec. In other words, as the droplets loose liquid
solvent, they become more resistant to breakups.
In the current study, different available models for
prediction of suspension viscosities are reviewed and more
J Therm Spray Tech (2017) 26:12–36 13
123
suitable models to fit ceramic suspensions of interest are
examined. Moreover, different parameters influencing final
estimations of viscosity values such as maximum packing
factors are studied. Using a 3-dimensional numerical sim-
ulation of a simplified plasma torch, suspension droplets
are injected into the plasma flow and are tracked as they go
through evaporation and breakup from injection port to the
point of impact on the substrate. Various parameters that
influence SPS process are then varied to examine their
effects on the final particles that impact on the substrate.
The goal is to find the range of input parameters that results
in the highest quality of particles reaching the substrate,
particles that ideally have lost all their moisture content
and are at a higher temperature. At the injection port,
parameters that can vary are injection angle, velocity, and
location. The effects of torch power and mass flow rate are
also examined. For the suspension material, the proper
choice of the viscosity model is examined and tested
against available experimental data.
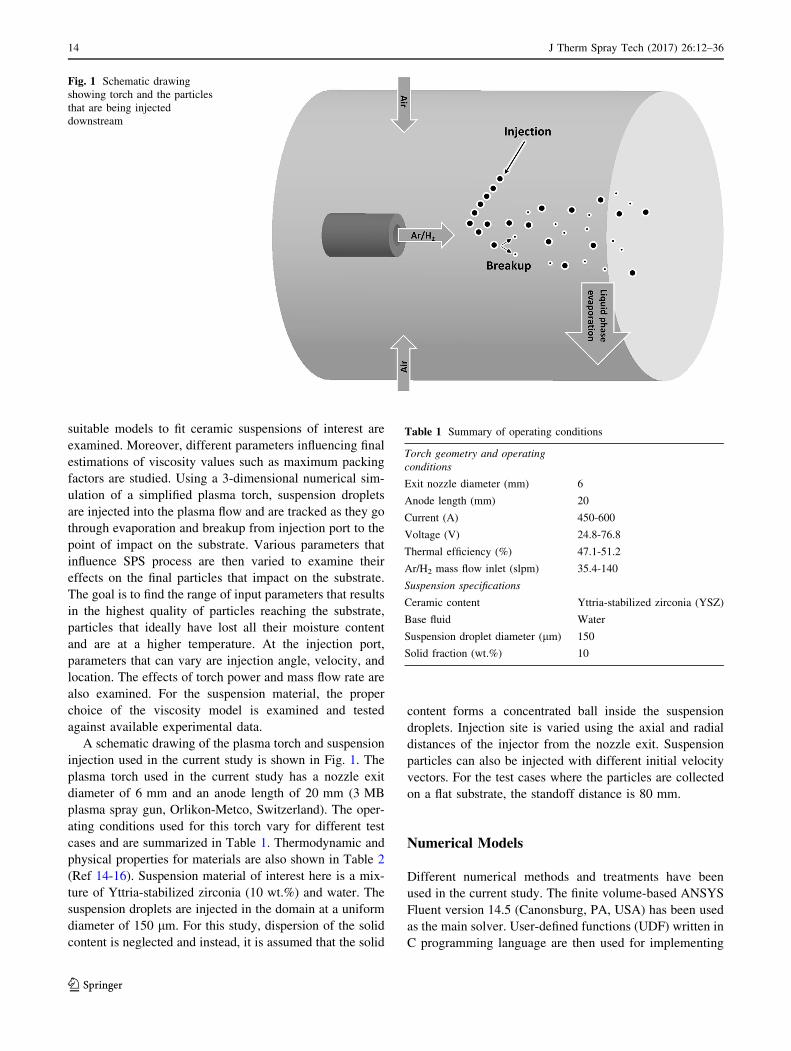
A schematic drawing of the plasma torch and suspension
injection used in the current study is shown in Fig. 1. The
plasma torch used in the current study has a nozzle exit
diameter of 6 mm and an anode length of 20 mm (3 MB
plasma spray gun, Orlikon-Metco, Switzerland). The oper-
ating conditions used for this torch vary for different test
cases and are summarized in Table 1. Thermodynamic and
physical properties for materials are also shown in Table 2
(Ref 14-16). Suspension material of interest here is a mix-
ture of Yttria-stabilized zirconia (10 wt.%) and water. The
suspension droplets are injected in the domain at a uniform
diameter of 150 lm. For this study, dispersion of the solid
content is neglected and instead, it is assumed that the solid
content forms a concentrated ball inside the suspension
droplets. Injection site is varied using the axial and radial
distances of the injector from the nozzle exit. Suspension
particles can also be injected with different initial velocity
vectors. For the test cases where the particles are collected
on a flat substrate, the standoff distance is 80 mm.
Numerical Models
Different numerical methods and treatments have been
used in the current study. The finite volume-based ANSYS
Fluent version 14.5 (Canonsburg, PA, USA) has been used
as the main solver. User-defined functions (UDF) written in
C programming language are then used for implementing
Table 1 Summary of operating conditions
Torch geometry and operating
conditions
Exit nozzle diameter (mm) 6
Anode length (mm) 20
Current (A) 450-600
Voltage (V) 24.8-76.8
Thermal efficiency (%) 47.1-51.2
Ar/H2 mass flow inlet (slpm) 35.4-140
Suspension specifications
Ceramic content Yttria-stabilized zirconia (YSZ)
Base fluid Water
Suspension droplet diameter (lm) 150
Solid fraction (wt.%) 10
Fig. 1 Schematic drawing
showing torch and the particles
that are being injected
downstream
14 J Therm Spray Tech (2017) 26:12–36
123
procedures not originally supported by the Fluent solver.
The simulation process can be broken into two main stages.
Initially, the flow of the plasma gas exiting the nozzle at high
speed and temperature is calculated. The discrete phase
models are then used to track suspension droplets inside the
flow. To avoid numerical complications, instead of injecting
a continuous stream of suspension at the beginning, a train of
already atomized suspension droplets is injected into the
flow. The momentum and heat transfer equations for the gas
and particles are coupled in order to capture the effect of
particles on the gas flow and vice versa. The evaporation of
the liquid phase (here water) inside suspension droplets is
reflected in the gas flow by adding species source terms for
water vapor. In the following sections, governing equations
used in the numerical simulation of the torch and suspension
droplets are reviewed.
Torch Model
The plasma torch model utilized here is schematically
shown in Fig. 1. The plume is simplified to a jet of fluid
entering the domain at high speed and temperature. The
torch carries a premixed Ar-H2 gas mixture into atmo-
spheric air. As suspension droplets get injected into the
plasma jet, evaporation of liquid phase will also add water
vapor to the plasma gas composition. At each cell in the
domain, temperature-dependant thermodynamic properties
of the plasma gas are calculated based on the mass/volume
fraction of each component in this mixture. The chemical
reactions and arc influences are neglected. Instead, a vol-
umetric heat source is added inside the torch nozzle. Using
torch operating conditions, i.e., current (I), voltage (V), and
thermal efficiency (g), this volumetric heat source can be
estimated as
_Q ¼ gEI
XðEq 2Þ
X is the volume of the anode. Inclusion of thermal effi-
ciency eliminates the need for adding heat losses at the torch
walls and radiation losses. In order to avoid a long torch
entrance length, a fully developed turbulent velocity profile
in the form of power-law is taken at the Ar-H2 inlet, i.e.,
u rð Þ ¼ umax
r
R
� �1=n
ðEq 3Þ
For the turbulence model, different models and resolutions
were tested here. The realizable k � � model with the
standard wall functions was found to produce the best
results at a low computational cost. To avoid deficiencies
of the k � � model in axisymmetric frameworks (Ref 17),
the flow domain has been fully resolved in three dimen-
sions here. Although this eventually adds to the computa-
tion time, it was proven to be useful in better capturing
trajectories of the suspension droplets injected into the flow
in 3D. The extra computational cost is also partially
recovered as the k � � model is computationally less
expensive compared to other methods such as RSM (Ref
15). The turbulent intensity at the inlet is approximately
(Ref 15)
It ¼ 0:16Re�1=8DH ðEq 4Þ
ReDH is the Reynolds number based on the hydraulic
diameter of the torch nozzle. Using this prescribed turbu-
lent intensity, the turbulent kinetic energy is calculated as
k ¼ 3
2u2avgI
2t ðEq 5Þ
and the value of turbulent dissipation rate is evaluated
using
� ¼ C3=4l
k3=2
LðEq 6Þ
Cl = 0.09 is an empirical constant, and L is the length
scale approximated to be 0.07 of the hydraulic diameter.
Suspension Particle Model
To avoid numerical complications of primary fragmenta-
tion of liquid jets, separate droplets are injected rather than
a continuous jet of suspension liquid. The droplets are
tracked in a Lagrangian framework as they travel in the
domain. The liquid phase in the suspension starts
Table 2 Materials properties
YSZ
q ðkg=m3Þ 5560
l Pa sð Þ 0.029
r ðN=mÞ 0.43
Cp ðJ=kg KÞ
¼
1:0634310�6T3 � 2:18895310�3T2 þ 1:709671T
þ 1:466367102; 273\T\873
678:5; T [ 873
8>><
>>:
DHsf ðkJ=kgÞ 710
k ðW=m KÞ 2.4
Tmp Kð Þ 2975
Water
q ðkg=m3Þ 998.2
l Pa sð Þ 0.001003
r ðN=mÞ 0.038(a)
Cp ðJ=kg KÞ 4182
DHfg kJ=molð Þ Eq 22
k ðW=m KÞ 0.6
Tbp Kð Þ 373
(a) YSZ-water mixture
J Therm Spray Tech (2017) 26:12–36 15
123
evaporating as the droplets receive heat from the plasma
flow. Heat losses due to radiation from the droplets to the
surroundings are also included. The plasma plume, how-
ever, is assumed to be optically thin. As the liquid phase
vanishes, the concentration of solid contents in the sus-
pension grows. This leads to change in some physical
properties, especially viscosity. When the solvent has
completely evaporated, the solid contents are tracked until
they reach the melting point. After melting, physical
properties of particles is the same as that of the molten
ceramic. In the following sections, equations and models
governing each of these transitions are presented in detail.
Momentum
Suspension droplets/particles here are tracked in Lagran-
gian manner using a two-way coupled discrete phase
model. Plasma gas with the velocity (u) accelerates parti-
cles inside the domain. Particle acceleration is calculated
using a balance between forces acting on the particles and
their inertia in the form of (Ref 15)
dup
dt¼ FD u� up
� �þ F ðEq 7Þ
Here, FD is the drag force given as
FD ¼ 18lqpd2p
CDRe
24ðEq 8Þ
The drag coefficient CD is calculated from instantaneous
Reynolds number of each particle
CDf ¼24
ReðEq 9Þ
for Re\ 0.01,
CDf ¼24
Reþ 3:156Re� 0:18þ0:05 logReð Þ ðEq 10Þ
for 0.01\Re\ 0.2, and
CDf ¼24
Reþ 6
1þffiffiffiffiffiffiRe
p þ 0:4 ðEq 11Þ
for the range 0.2\Re\ 105 based on empirical correla-
tions for small spherical particle sizes (5-100 lm) (Ref 18).
For particles in moving in plasma flow, this drag coefficient
needs to be modified to take effects of variable properties
due to temperature gradient and non-continuum (Knudsen
effects) into account. Influence of Basset history term is
neglected for particles smaller than 100 lm (Ref 19).
Effect of variable property is added using proposed method
of Lee et al. (Ref 20). Non-continuum effects also become
important for Knudsen number regime 10-2\Kn\ 1
(Ref 19). This is also considered using correction terms of
Chyou et al. (Ref 21) and Chen et al. (Ref 22). A
superposition of these corrections, as proposed by Pfender
(Ref 19), can be used to calculate the final drag coefficient
in the form of
CD ¼ CDf � f1 � f2 ðEq 12Þ
where correction factors for strong variation of properties
and non-continuum effects are
f1 ¼q1l1qflf
� ��0:45
f2 ¼ 1þ 2� a
a
� �c
1þ c
� �4
PrfKn�
�0:45ðEq 13Þ
The subscript f means that properties are calculated at
droplet’s film temperature (Tcell ? Tp)/2. a is the thermal
accommodation coefficient, c is the heat capacity ratio, and
Prf is the gas Prandtl number evaluated at film temperature.
Here, Kn* is the Knudsen number based on using effective
molecular mean free path (keff) and droplet diameter (dp).
keff is calculated from
keff ¼2 �K
qf �Vf�Cp
Prf ðEq 14Þ
with �Vf , �Cp, and �K being average thermal velocity, specific
heat, and thermal conductivity, respectively.
F in Eq 7 takes thermophoretic effects into account.
Thermophoretic forces are exerted on small particles
traveling in gas with temperature gradient and are in the
opposite direction to this gradient (Ref 15). This force is
added using proposed method of Talbot et al. (Ref 23)
F ¼ � 6pdpl2Cs K� þ CtKnð Þ
q 1þ 3CmKnð Þ 1þ 2K� þ 2CtKnð Þ1
mpT
oT
ox
ðEq 15Þ
K* is the ratio of fluid to particle thermal conductivities, mp
is the mass of particle, Cs = 1.17, Ct = 2.18, and
Cm = 1.14. Brownian forces are neglected since there are
not many submicron particles involved in test cases here.
The effects of turbulence on dispersing the particles are
included using stochastic tracking method. This method
calculates particle trajectories taking instantons turbulent
velocity fluctuations into account.
Breakup Model
The suspension jet after injection will experience several
stages of breakup before reaching the substrate. These
breakups need to be included in the numerical method.
Melliot et al. (Ref 24) numerically studied breakup of a
train of YSZ-water suspension droplets in the plasma gas.
Similarly, Vincent et al. (Ref 25) used LES-VOF to capture
the atomization process of a continuous liquid jet of water
injected into the plasma flow. In these simulations,
16 J Therm Spray Tech (2017) 26:12–36
123
evaporation of liquid phase is neglected. Moreover, the
domain of study has been limited to the area close to nozzle
exit. Implementation of numerical simulations like these
into large-scale models, like the one used in the current
study, makes solution computationally expensive. Direct
simulation of atomization process demands a very fine
mesh resolution at fragmentation points and also solving a
fluid surface tracking model like VOF (Ref 26). To over-
come these issues in the current study, suspension is
injected into the domain in the form of droplets. This
means that the primary breakup has already taken place.
For the secondary breakups and the rest, KHRT (Kelvin-
Helmholtz/Rayleigh-Taylor) model (Ref 27, 28) is used.
This method, which is applicable to high Weber number
flows (Ref 15), combines effect of aerodynamic forces
which create Kelvin-Helmholtz waves along with Ray-
leigh-Taylor instabilities caused by acceleration of drops
into the free stream. These mechanisms capture breakup
using drop’s surface wave growth: fastest growing insta-
bility will cause the drop to breakup.
For the suspension of study here, the viscosity is updated
at each iteration based on drop’s concentration. Breakup
model is also influenced by this change in viscosity.
Aggregate explosions are neglected here; hence, no
breakup occurs till all the solvent is evaporated and all
solid content has melted. When a molten drop is formed
from solid material, breakup is resumed.
Heat Transfer
Heating and cooling due to convective heat transfer,
evaporation, and radiation at droplet’s surface ARE gov-
erned by (Ref 15)
mpCp
dTp
dt¼ hAp T1 � Tp
� �þ �Apr T4
1 � T4p
� �
� dmp
dtDHfg ðEq 16Þ
where r is the Stephan Boltzmann constant, � is the
emissivity for droplets, mp is the mass of each droplet, cp is
the heat capacity, T? is the ambient temperature, Tp is the
droplet temperature, h is the convective heat transfer
coefficient, dmp/dt is the evaporation rate, and hfg is the
latent heat of the liquid phase. The convective heat transfer
coefficient is calculated with the help of Nusselt number
using Ranz-Marshal correlation
Nuf ¼ 2:0þ 0:6Re1=2d Pr1=3 ðEq 17Þ
Red is Reynolds number based on droplet diameter and Pr
is gas phase Prandtl number. Similar to momentum, effects
of temperature gradients and Knudsen number are included
using correction factors. Final Nusselt number is corrected
using (Ref 22, 29)
Nu ¼ hdp
k1¼ Nuf � fh1 � fh2 ðEq 18Þ
with fh1.fh2 = (f1.f2)1/0.45. As the solvent inside droplets
evaporates, heat transfer mechanisms changes. If initial
suspension has low ceramic concentration, a shell of molten
ceramic might form imprisoning solvent inside (Ref 9). Also
during solvent evaporation, the cloud of ceramic particles
may get scattered as a result of sudden explosion. Taking all
these effects into account is nearly impossible due to lack of
sufficient empirical correlations. Hence, it is reasonable to
make simplifying assumptions. Inclusion of explosion and
shell formation effects are left for future studies. Instead, it is
assumed that evaporation continues till all the liquid content
in the droplets is evaporated. Prohibiting scattering of solid
particles before they are melted together will possibly result
in a larger prediction for final particle sizes.
Evaporation of the Liquid Phase
During initial stages of droplets’ flight, the liquid phase
starts to evaporate. As this phase evaporates, the suspen-
sion’s concentration varies significantly as it goes from
being dilute to becoming a slurry of moist solid particles
that will dry out. The evaporation rate can be corrected to
match the drying process of solid-liquid mixtures. Evapo-
ration of the solid content is negligible through all stages.
The drying rate of the mixture can be calculated using two
different methods. Where experimental data for calibration
is available, the model presented by Stendal (Ref 30) and
Seader et al. (Ref 31) for solid-liquid slurries can be used to
estimate the evaporation rate
dmp
dt¼ mp
dW
dt¼ mpf Wð Þ exp �DHfg
RTp
� �ðEq 19Þ
where W is the wet basis moisture content, and R the
universal gas constant. f(W) is evaluated using experi-
mental data for every particular suspension. Where
empirical data for calculation of f(W) is not available, the
evaporation and mass transfer rates can be obtained using
Sherwood number correlation (Ref 15)
Sh ¼ kcdp
D¼ 2þ 0:6Re0:5d Sc1=3 ðEq 20Þ
D is the binary diffusion coefficient, Schmidt number is
Sc = l/qD, and kc is the mass transfer coefficient. By
taking an estimate for the binary diffusion coefficient, the
mass transfer coefficient becomes available using Eq 20.
Therefore, the evaporation rate can be calculated using
dmp
dt¼ kcMAp Cs � Cbð Þ ðEq 21Þ
where M is the molecular weight of the liquid content and
Cs and Cb are vapor concentrations at drop’s surface and
J Therm Spray Tech (2017) 26:12–36 17
123
the bulk of gas, respectively. The latent heat of evaporation
here is evaluated at droplets’ temperature using
DHfg ¼ �0:0438926Tp þ 57:0735 kJ=molð Þ ðEq 22Þ
for water (Ref 32) and using
DHfg ¼ A exp �aTp
Tc
� �1� Tp
Tc
� �b
kJ=molð Þ ðEq 23Þ
for ethanol from (Ref 33, 34), with A ¼ 50:43 kJ=mol,
Tc ¼ 513:9K, a = -0.4475, and b = 0.4989. As droplets
go through multiple breakups before the liquid phase is
completely evaporated, the solid content of each droplet is
estimated using the assumption that each breakup divides
the solid content in the droplet evenly between the forming
children based on their diameters.
Melting of the Solid Content
After the liquid phase is completely evaporated, the solid
content is heated till reaching the melting point of the solid
material. Cp values for particles are now only calculated
from the properties of the solid material. Viscosity values
are also adjusted in the absence of liquid phase. This means
that when the fraction of liquid content in each drop
becomes negligible, the viscosity for the mixture, which
now consists of only solid particles, is set to a large value
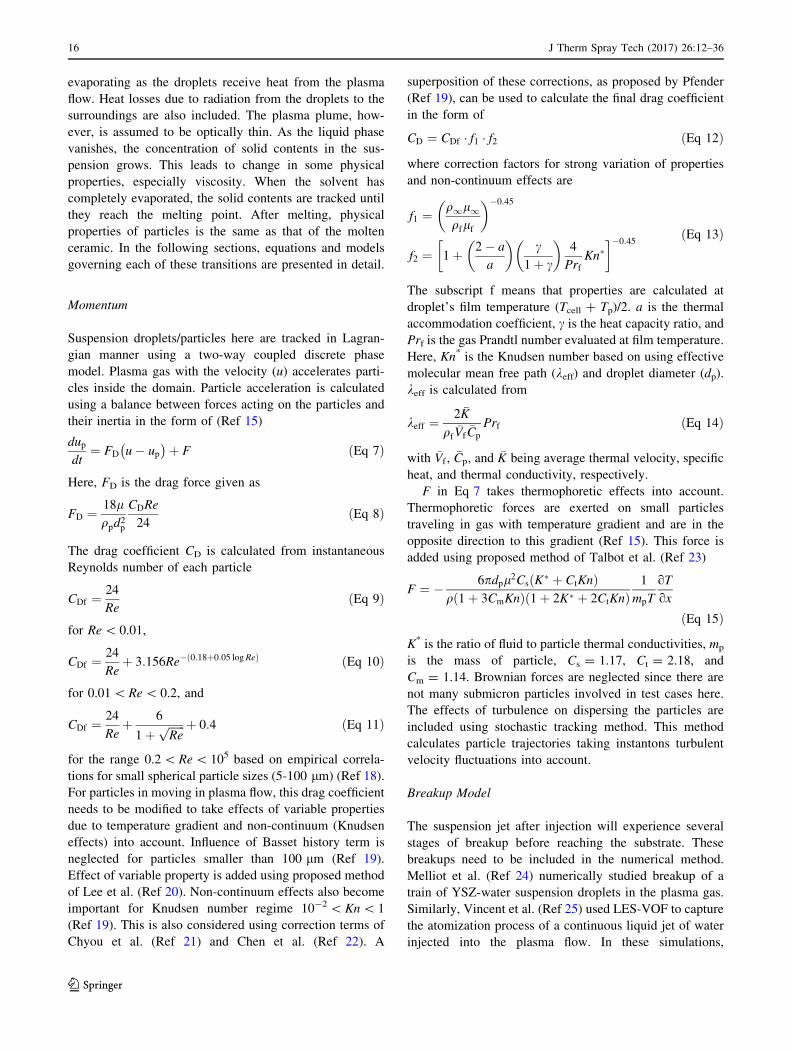
to mimic non-molten solid matter. This is demonstrated in
Fig. 2 for YSZ. In a 10-K window around the melting
temperature, the viscosity is linearly dropped from this
large value to the value for molten YSZ. This will also be
an estimate for the mushy behavior of the melting process.
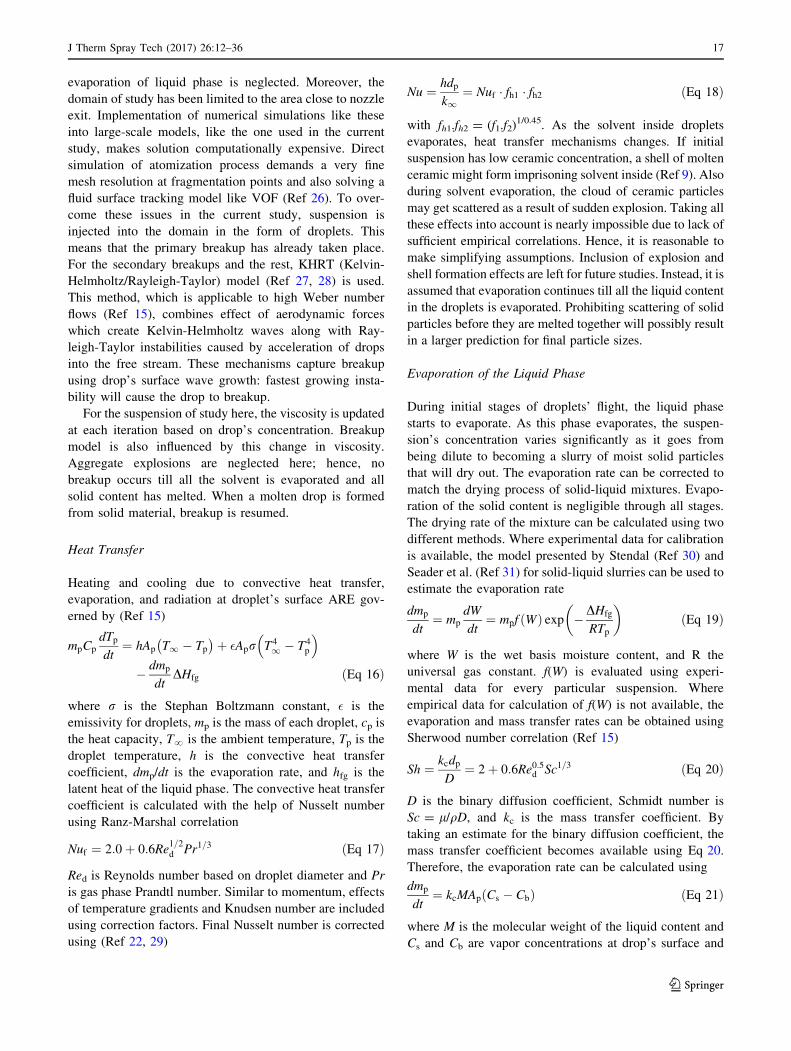
The latent heat consumed during melting process is also
included by modifying Cp values of YSZ. This is done
using
C ¼Cs T � T1
Cm þ L
T2 � T1T1\T\T2
Cl T � T2
8><
>:ðEq 24Þ
where T1 and T2 mark the temperature range over which
the melting occurs, and L, is the latent heat. For simplicity,
Cm is chosen to be (Cs ? Cl)/2 here. This also demon-
strated in Fig. 3 for YSZ suspension.
Surface tension coefficient also undergoes various
changes during the evaporation of the liquid phase. As a
wide-ranging set of information on surface tension versus
concentration is not available for ceramic suspensions, in
the current study, when liquid phase is present in droplets,
surface tension is approximated to have the same value as
that of the liquid phase. When the liquid phase is evapo-
rated and the solid content has melted, the surface tension
of the molten ceramic is used thereafter. In between these
two limits, no breakup of the droplets is allowed, and
hence, the surface tension values are not of interest.
Effective Viscosity
With the evaporation of the liquid phase, the concentration
of solid matter in droplets changes. Consequently, the
viscosity of the mixture needs to be updated. Many studies
have used analytical and empirical tools for evaluating
suspension viscosities at different solid content concen-
trations. Einstein’s viscosity model is among the first that
predicts viscosity of a dilute suspension of spherical dro-
plets using (Ref 35)
lr ¼ 1þ 2:5/ ðEq 25Þ
with / being the volume fraction of solid particles in
suspension (Vsolid/Vtotal). For higher concentrations, this
Fig. 2 Mushy zone effect on
viscosity values of YSZ
18 J Therm Spray Tech (2017) 26:12–36
123
equation was modified by Guth et al. (Ref 36) to take
interaction between solid particles into account in the form
of
lr ¼ 1þ 2:5/þ 14:1/2 ðEq 26Þ
where lr is the relative viscosity of the suspension to the
pure fluid viscosity, shown as
lr ¼lefflliq
ðEq 27Þ
Using empirical data, Thomas enhanced this model to form
(Ref 37)
lr ¼ 1þ 2:5/þ 10:05/2 þ AeB/ ðEq 28Þ
where A = 0.00273 and B = 16.6. For larger droplets at
higher concentrations and by taking effects of particle
interactions into account, Toda el al. (Ref 8) proposed
using
lr ¼1þ 0:5k/� /
1� k/ð Þ2 1� /ð ÞðEq 29Þ
where k is a parameter obtained using empirical results
and has been reported to be in the form of k = 1 ? 0.6/for spherical particles in water (*5 lm radius). Models
mentioned above do not take effects of maximum packing
fraction, /m, into account. /m is the largest possible
volume fraction that can be achieved by adding solid
particles to the suspension. Physical shape of particles
along with their electric charge can affect the value of /m.
Since theoretically suspension viscosity should converge
to infinity for solid concentrations close to /m (Ref 10), it
is important to include this parameter into the model.
Krieger et al. (Ref 38) have proposed inclusion of /m in
the form of
lr ¼ 1� //m
� �� l½ �/m
ðEq 30Þ
Here [l] is the intrinsic viscosity defined as the limiting
value shown by Eq 31, which dominates suspension
behavior at low concentrations (Ref 39) and is given by
(Ref 40)
l½ � ¼ lim/!0
lim_c!0
lr � 1ð Þ=/ð Þ ðEq 31Þ
It is common to approximate [l] to 2.5, which is derived byapplying Eq 31 to Einstein’s model in Eq 25. Dabak et al.
(Ref 41) also proposed a model containing another
empirically adjustable variable, N, given as
lr ¼ 1þ l½ �/N 1� /
/m
� �
2
4
3
5
N
ðEq 32Þ
N is a flow-related variable and is taken to be 2 for high
shear rates (Ref 42). More recently, Senapati et al. (Ref 43)
has proposed an improved model that takes effects of
particles size distribution along with shear rate into account
lr ¼ S 1þ l½ �_cn
//m � /
� � NðEq 33Þ
where _c is the shear rate and n is the flow behavior index in
the power-law equation (s ¼ K _cn). Parameter S is calcu-
lated from S = 10CU/d50 where CU is the coefficient of
uniformity calculated from CU = d60/d10.
Predictions of models mentioned above show deficiencies
which were tested here against available data for ceramic
suspensions. A more recent model by Horri et al. (Ref 44),
however, shows close predictions for ceramic suspensions.
The relative viscosity of Horri, which is valid over a wide
range of concentrations and shear rates, is in the form of
Fig. 3 Effect of latent heat of
melting on Cp values
J Therm Spray Tech (2017) 26:12–36 19
123
lr ¼ 1þ 2:5/þ K//
/m � /
� �2
ðEq 34Þ
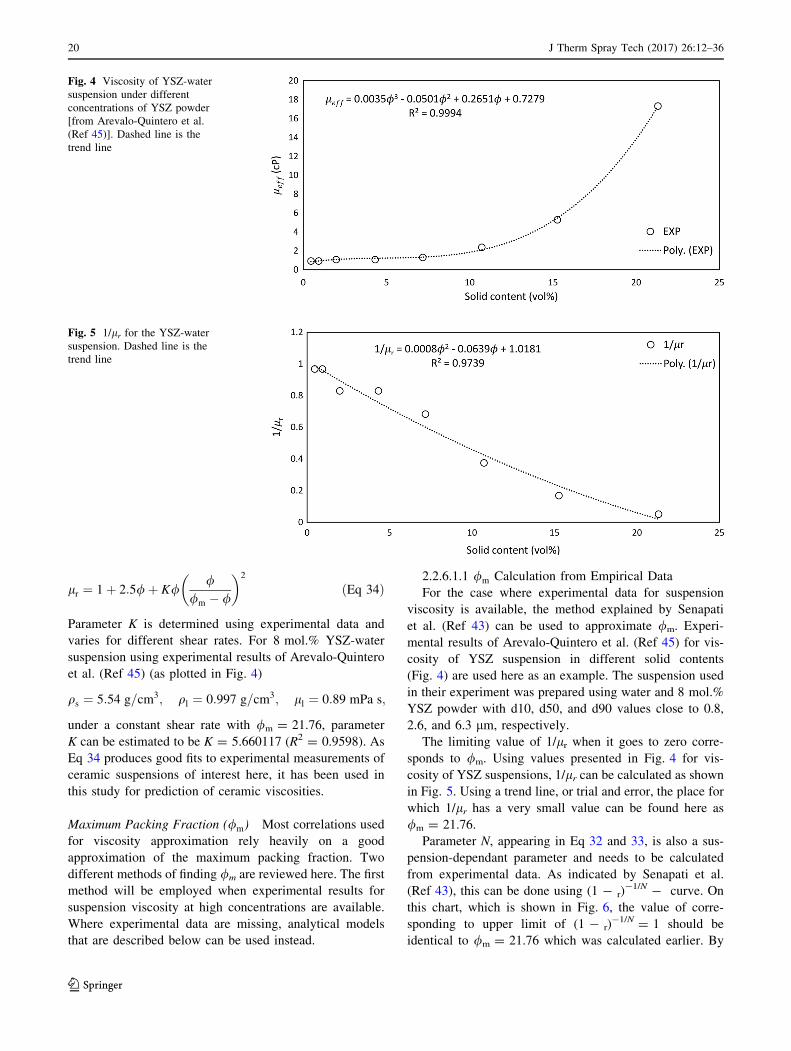
Parameter K is determined using experimental data and
varies for different shear rates. For 8 mol.% YSZ-water
suspension using experimental results of Arevalo-Quintero
et al. (Ref 45) (as plotted in Fig. 4)
qs ¼ 5:54 g=cm3; ql ¼ 0:997 g=cm3; ll ¼ 0:89 mPa s;
under a constant shear rate with /m = 21.76, parameter
K can be estimated to be K = 5.660117 (R2 = 0.9598). As
Eq 34 produces good fits to experimental measurements of
ceramic suspensions of interest here, it has been used in
this study for prediction of ceramic viscosities.
Maximum Packing Fraction (/m) Most correlations used
for viscosity approximation rely heavily on a good
approximation of the maximum packing fraction. Two
different methods of finding /m are reviewed here. The first
method will be employed when experimental results for
suspension viscosity at high concentrations are available.
Where experimental data are missing, analytical models
that are described below can be used instead.
2.2.6.1.1 /m Calculation from Empirical Data
For the case where experimental data for suspension
viscosity is available, the method explained by Senapati
et al. (Ref 43) can be used to approximate /m. Experi-
mental results of Arevalo-Quintero et al. (Ref 45) for vis-
cosity of YSZ suspension in different solid contents
(Fig. 4) are used here as an example. The suspension used
in their experiment was prepared using water and 8 mol.%
YSZ powder with d10, d50, and d90 values close to 0.8,
2.6, and 6.3 lm, respectively.
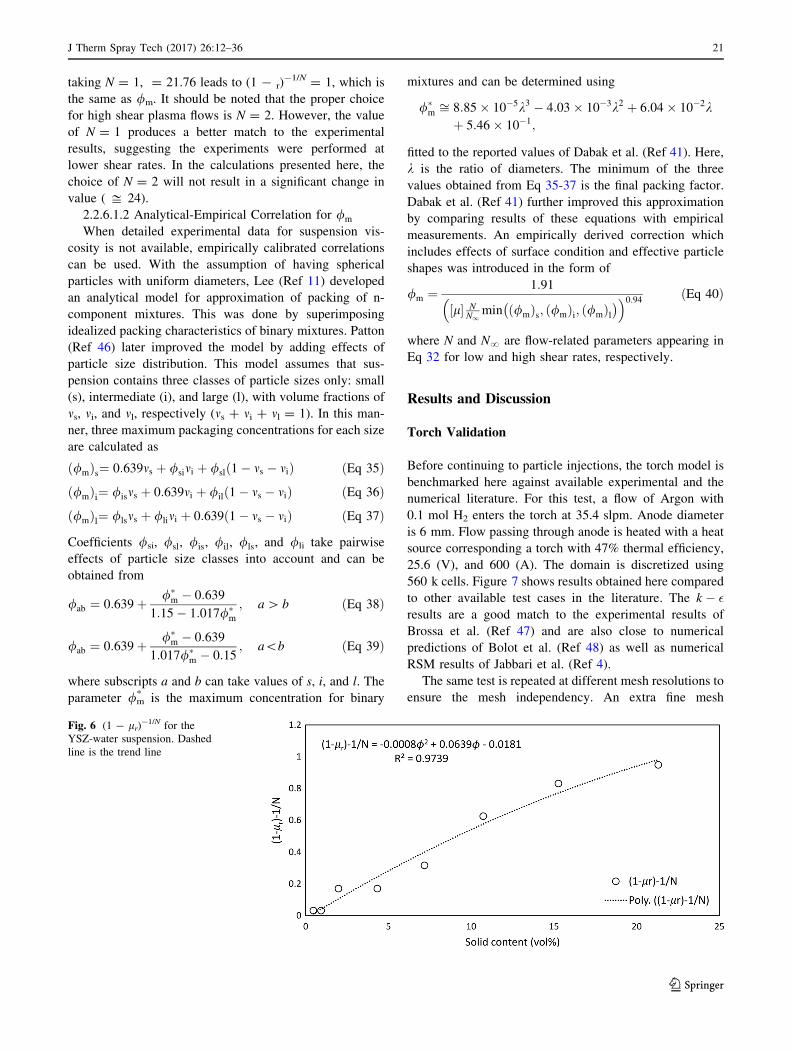
The limiting value of 1/lr when it goes to zero corre-
sponds to /m. Using values presented in Fig. 4 for vis-
cosity of YSZ suspensions, 1/lr can be calculated as shown
in Fig. 5. Using a trend line, or trial and error, the place for
which 1/lr has a very small value can be found here as
/m = 21.76.
Parameter N, appearing in Eq 32 and 33, is also a sus-
pension-dependant parameter and needs to be calculated
from experimental data. As indicated by Senapati et al.
(Ref 43), this can be done using (1 - r)-1/N - curve. On
this chart, which is shown in Fig. 6, the value of corre-
sponding to upper limit of (1 - r)-1/N = 1 should be
identical to /m = 21.76 which was calculated earlier. By
Fig. 4 Viscosity of YSZ-water
suspension under different
concentrations of YSZ powder
[from Arevalo-Quintero et al.
(Ref 45)]. Dashed line is the
trend line
Fig. 5 1/lr for the YSZ-water
suspension. Dashed line is the
trend line
20 J Therm Spray Tech (2017) 26:12–36
123
taking N = 1, = 21.76 leads to (1 - r)-1/N = 1, which is
the same as /m. It should be noted that the proper choice
for high shear plasma flows is N = 2. However, the value
of N = 1 produces a better match to the experimental
results, suggesting the experiments were performed at
lower shear rates. In the calculations presented here, the
choice of N = 2 will not result in a significant change in
value ( % 24).
2.2.6.1.2 Analytical-Empirical Correlation for /m
When detailed experimental data for suspension vis-
cosity is not available, empirically calibrated correlations
can be used. With the assumption of having spherical
particles with uniform diameters, Lee (Ref 11) developed
an analytical model for approximation of packing of n-
component mixtures. This was done by superimposing
idealized packing characteristics of binary mixtures. Patton
(Ref 46) later improved the model by adding effects of
particle size distribution. This model assumes that sus-
pension contains three classes of particle sizes only: small
(s), intermediate (i), and large (l), with volume fractions of
ms, mi, and ml, respectively (ms ? mi ? ml = 1). In this man-
ner, three maximum packaging concentrations for each size
are calculated as
/mð Þs¼ 0:639ms þ /simi þ /sl 1� ms � mið Þ ðEq 35Þ
/mð Þi¼ /isms þ 0:639mi þ /il 1� ms � mið Þ ðEq 36Þ
/mð Þl¼ /lsms þ /limi þ 0:639 1� ms � mið Þ ðEq 37Þ
Coefficients /si, /sl, /is, /il, /ls, and /li take pairwise
effects of particle size classes into account and can be
obtained from
/ab ¼ 0:639þ /�m � 0:639
1:15� 1:017/�m
; a[ b ðEq 38Þ
/ab ¼ 0:639þ /�m � 0:639
1:017/�m � 0:15
; a\b ðEq 39Þ
where subscripts a and b can take values of s, i, and l. The
parameter /m* is the maximum concentration for binary
mixtures and can be determined using
/�m ffi 8:85 10�5k3 � 4:03 10�3k2 þ 6:04 10�2k
þ 5:46 10�1;
fitted to the reported values of Dabak et al. (Ref 41). Here,
k is the ratio of diameters. The minimum of the three
values obtained from Eq 35-37 is the final packing factor.
Dabak et al. (Ref 41) further improved this approximation
by comparing results of these equations with empirical
measurements. An empirically derived correction which
includes effects of surface condition and effective particle
shapes was introduced in the form of
/m ¼ 1:91
l½ � NN1
min /mð Þs; /mð Þi; /mð Þl� �� �0:94
ðEq 40Þ
where N and N? are flow-related parameters appearing in
Eq 32 for low and high shear rates, respectively.
Results and Discussion
Torch Validation
Before continuing to particle injections, the torch model is
benchmarked here against available experimental and the
numerical literature. For this test, a flow of Argon with
0.1 mol H2 enters the torch at 35.4 slpm. Anode diameter
is 6 mm. Flow passing through anode is heated with a heat
source corresponding a torch with 47% thermal efficiency,
25.6 (V), and 600 (A). The domain is discretized using
560 k cells. Figure 7 shows results obtained here compared
to other available test cases in the literature. The k � �
results are a good match to the experimental results of
Brossa et al. (Ref 47) and are also close to numerical
predictions of Bolot et al. (Ref 48) as well as numerical
RSM results of Jabbari et al. (Ref 4).
The same test is repeated at different mesh resolutions to
ensure the mesh independency. An extra fine mesh
Fig. 6 (1 - lr)-1/N for the
YSZ-water suspension. Dashed
line is the trend line
J Therm Spray Tech (2017) 26:12–36 21
123
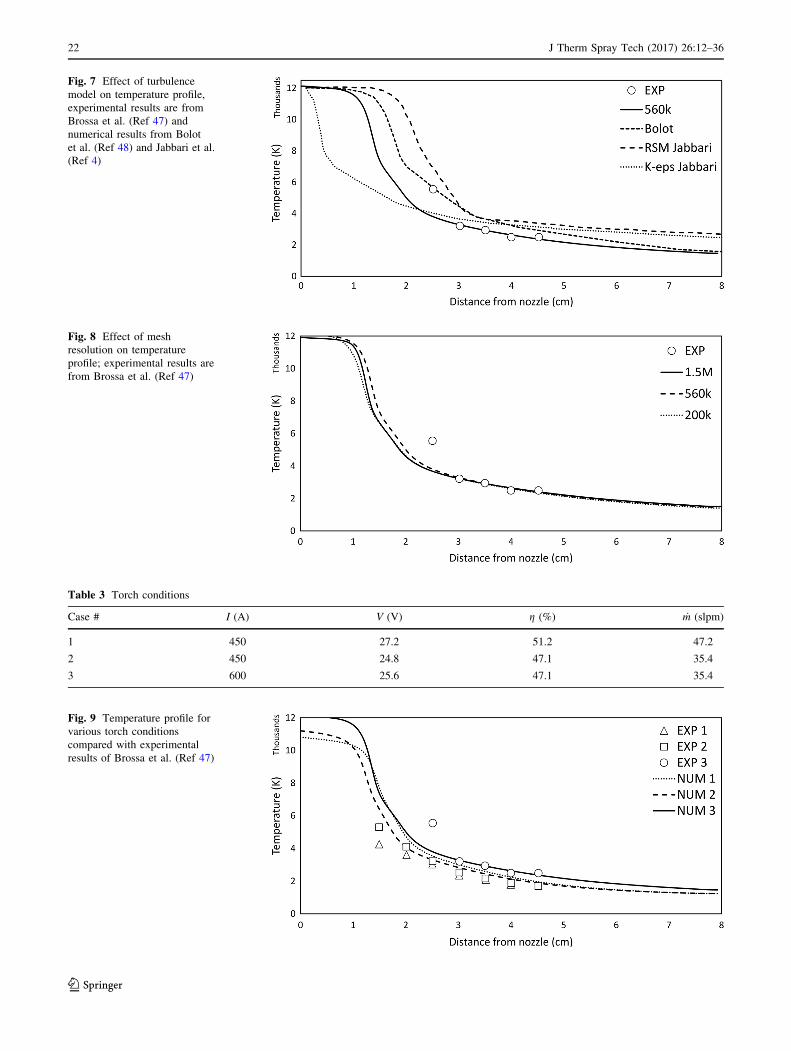
Fig. 8 Effect of mesh
resolution on temperature
profile; experimental results are
from Brossa et al. (Ref 47)
Table 3 Torch conditions
Case # I (A) V (V) g (%) _m (slpm)
1 450 27.2 51.2 47.2
2 450 24.8 47.1 35.4
3 600 25.6 47.1 35.4
Fig. 9 Temperature profile for
various torch conditions
compared with experimental
results of Brossa et al. (Ref 47)
Fig. 7 Effect of turbulence
model on temperature profile,
experimental results are from
Brossa et al. (Ref 47) and
numerical results from Bolot
et al. (Ref 48) and Jabbari et al.
(Ref 4)
22 J Therm Spray Tech (2017) 26:12–36
123
resolution (1.5 M cells) and a coarser resolution (200 k
cells) are used for that matter. Results of these test cases
are presented in Fig. 8. As evident, the fine resolution of
560 k cells produces close results to the extra fine
resolution of 15 M. The rest of test cases in this paper are
performed at this resolution.
The torch model has also been tested against experi-
mental results of Brossa (Ref 47) for different torch
Fig. 12 Viscosity predictions
for 8 mol.% YSZ-water
Fig. 11 Ohnesorge number vs.
flight time for YSZ-water
suspension particle injected into
the domain
Fig. 10 Velocity and
temperature profile on the torch
center line against experimental
and numerical results of Meillot
et al. (Ref 49)
J Therm Spray Tech (2017) 26:12–36 23
123
operating conditions. Table 3 shows torch conditions for
each of these test cases. Numerical results obtained here
are plotted in Fig. 9. The torch geometry used here is
slightly different from Brossa’s experimental setup. The
outer diameter of the Brossa’s torch is 7.88 mm against a
6 mm diameter here. Brossa’s torch also has a diverging
nozzle which is not accounted for at this time. Numerical
results here, similar to other studies, manage to capture the
general temperature trend of the torch and are close to the
experimental data. Closer accuracies can be achieved by
using better implementations of the arc, which has been left
for future studies. Another test case is also performed for
comparison against results reported by Meillot et al. (Ref
49). The operating conditions are 60slpm flow rate on a
torch with arc current of 500A and a voltage of 65 V. The
value for thermal efficiency is 50%. Results for this test
case are shown in Fig. 10.
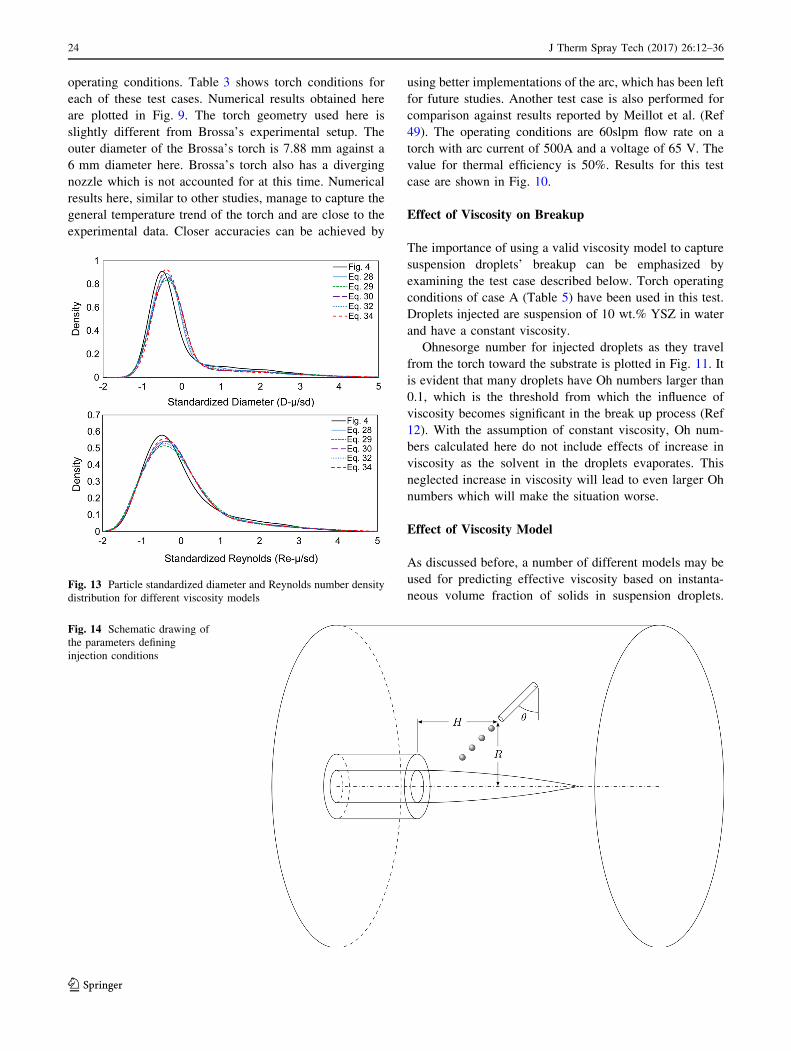
Effect of Viscosity on Breakup
The importance of using a valid viscosity model to capture
suspension droplets’ breakup can be emphasized by
examining the test case described below. Torch operating
conditions of case A (Table 5) have been used in this test.
Droplets injected are suspension of 10 wt.% YSZ in water
and have a constant viscosity.
Ohnesorge number for injected droplets as they travel
from the torch toward the substrate is plotted in Fig. 11. It
is evident that many droplets have Oh numbers larger than
0.1, which is the threshold from which the influence of
viscosity becomes significant in the break up process (Ref
12). With the assumption of constant viscosity, Oh num-
bers calculated here do not include effects of increase in
viscosity as the solvent in the droplets evaporates. This
neglected increase in viscosity will lead to even larger Oh
numbers which will make the situation worse.
Effect of Viscosity Model
As discussed before, a number of different models may be
used for predicting effective viscosity based on instanta-
neous volume fraction of solids in suspension droplets.
Fig. 14 Schematic drawing of
the parameters defining
injection conditions
Fig. 13 Particle standardized diameter and Reynolds number density
distribution for different viscosity models
24 J Therm Spray Tech (2017) 26:12–36
123
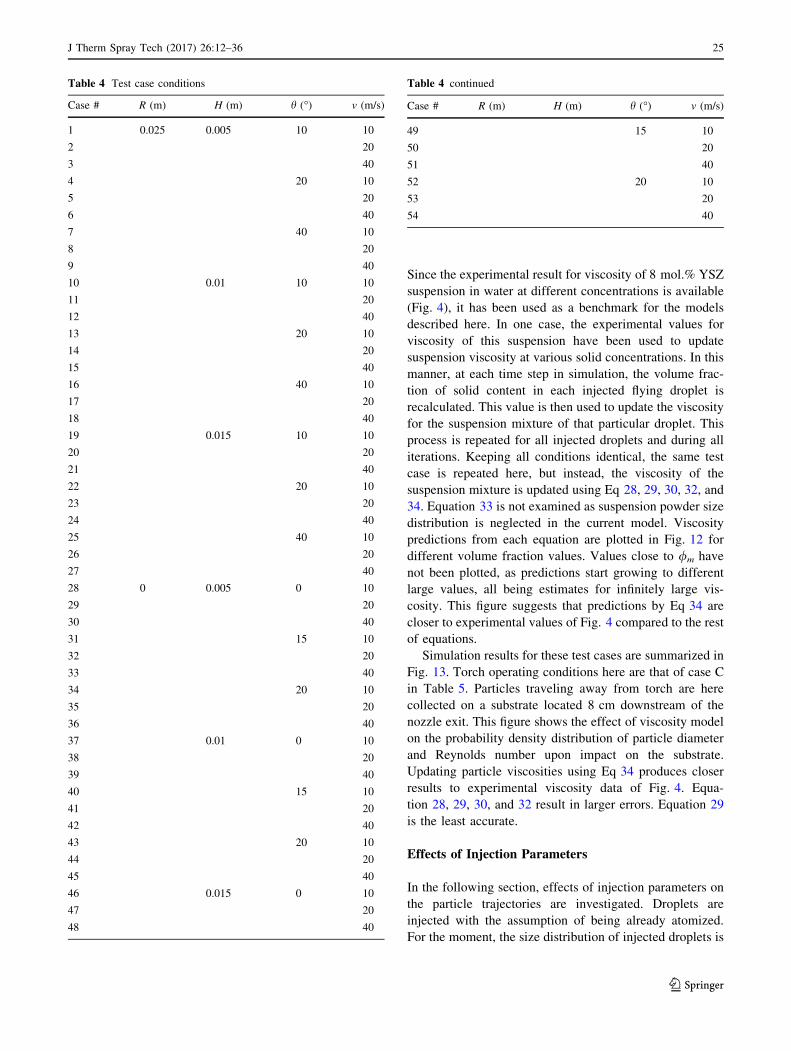
Since the experimental result for viscosity of 8 mol.% YSZ
suspension in water at different concentrations is available
(Fig. 4), it has been used as a benchmark for the models
described here. In one case, the experimental values for
viscosity of this suspension have been used to update
suspension viscosity at various solid concentrations. In this
manner, at each time step in simulation, the volume frac-
tion of solid content in each injected flying droplet is
recalculated. This value is then used to update the viscosity
for the suspension mixture of that particular droplet. This
process is repeated for all injected droplets and during all
iterations. Keeping all conditions identical, the same test
case is repeated here, but instead, the viscosity of the
suspension mixture is updated using Eq 28, 29, 30, 32, and
34. Equation 33 is not examined as suspension powder size
distribution is neglected in the current model. Viscosity
predictions from each equation are plotted in Fig. 12 for
different volume fraction values. Values close to /m have
not been plotted, as predictions start growing to different
large values, all being estimates for infinitely large vis-
cosity. This figure suggests that predictions by Eq 34 are
closer to experimental values of Fig. 4 compared to the rest
of equations.
Simulation results for these test cases are summarized in
Fig. 13. Torch operating conditions here are that of case C
in Table 5. Particles traveling away from torch are here
collected on a substrate located 8 cm downstream of the
nozzle exit. This figure shows the effect of viscosity model
on the probability density distribution of particle diameter
and Reynolds number upon impact on the substrate.
Updating particle viscosities using Eq 34 produces closer
results to experimental viscosity data of Fig. 4. Equa-
tion 28, 29, 30, and 32 result in larger errors. Equation 29
is the least accurate.
Effects of Injection Parameters
In the following section, effects of injection parameters on
the particle trajectories are investigated. Droplets are
injected with the assumption of being already atomized.
For the moment, the size distribution of injected droplets is
Table 4 Test case conditions
Case # R (m) H (m) h (�) v (m/s)
1 0.025 0.005 10 10
2 20
3 40
4 20 10
5 20
6 40
7 40 10
8 20
9 40
10 0.01 10 10
11 20
12 40
13 20 10
14 20
15 40
16 40 10
17 20
18 40
19 0.015 10 10
20 20
21 40
22 20 10
23 20
24 40
25 40 10
26 20
27 40
28 0 0.005 0 10
29 20
30 40
31 15 10
32 20
33 40
34 20 10
35 20
36 40
37 0.01 0 10
38 20
39 40
40 15 10
41 20
42 40
43 20 10
44 20
45 40
46 0.015 0 10
47 20
48 40
Table 4 continued
Case # R (m) H (m) h (�) v (m/s)
49 15 10
50 20
51 40
52 20 10
53 20
54 40
J Therm Spray Tech (2017) 26:12–36 25
123
neglected and it is assumed that all droplets have the same
diameter. Injection is controlled by four parameters:
(i) velocity magnitude of droplets at injection time (v), (ii)
injection angle (h), (iii) height (H), which is the injector’s
distance from the torch exit, and (iv) radial distance (R),
which is the injector’s distance from the center line of the
torch. A schematic drawing of these parameters is shown in
Fig. 14.
After injection, droplets are tracked and undergo
breakups, evaporation, or they may coalesce with one
another. The liquid phase evaporates during flight, and then
solid phase starts melting. To save computational time,
radiation heat losses are not considered for the test cases in
the current section. Molten particles are carried toward the
substrate. In place of the substrate, 8 cm downstream of the
torch, a wall is placed to capture the particles impacting the
substrate. The torch used for the calculations here has a
nozzle diameter of 6 mm and thermal efficiency of 47%
and is operated at 25.6 (V) and 600 (A). For Ar-H2 gas
mixture, according to (Ref 22), the accommodation coef-
ficient (a) and c in Eq 13 are assumed to be 0.8 and 1.411,
respectively.
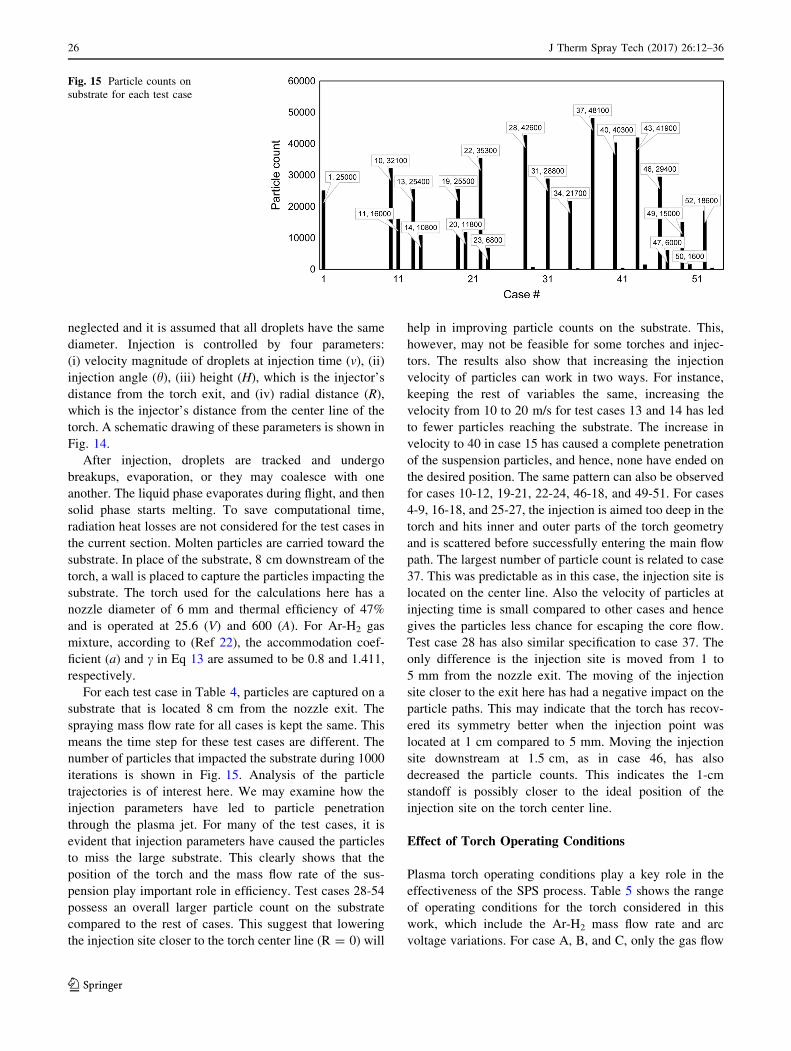
For each test case in Table 4, particles are captured on a
substrate that is located 8 cm from the nozzle exit. The
spraying mass flow rate for all cases is kept the same. This
means the time step for these test cases are different. The
number of particles that impacted the substrate during 1000
iterations is shown in Fig. 15. Analysis of the particle
trajectories is of interest here. We may examine how the
injection parameters have led to particle penetration
through the plasma jet. For many of the test cases, it is
evident that injection parameters have caused the particles
to miss the large substrate. This clearly shows that the
position of the torch and the mass flow rate of the sus-
pension play important role in efficiency. Test cases 28-54
possess an overall larger particle count on the substrate
compared to the rest of cases. This suggest that lowering
the injection site closer to the torch center line (R = 0) will
help in improving particle counts on the substrate. This,
however, may not be feasible for some torches and injec-
tors. The results also show that increasing the injection
velocity of particles can work in two ways. For instance,
keeping the rest of variables the same, increasing the
velocity from 10 to 20 m/s for test cases 13 and 14 has led
to fewer particles reaching the substrate. The increase in
velocity to 40 in case 15 has caused a complete penetration
of the suspension particles, and hence, none have ended on
the desired position. The same pattern can also be observed
for cases 10-12, 19-21, 22-24, 46-18, and 49-51. For cases
4-9, 16-18, and 25-27, the injection is aimed too deep in the
torch and hits inner and outer parts of the torch geometry
and is scattered before successfully entering the main flow
path. The largest number of particle count is related to case
37. This was predictable as in this case, the injection site is
located on the center line. Also the velocity of particles at
injecting time is small compared to other cases and hence
gives the particles less chance for escaping the core flow.
Test case 28 has also similar specification to case 37. The
only difference is the injection site is moved from 1 to
5 mm from the nozzle exit. The moving of the injection
site closer to the exit here has had a negative impact on the
particle paths. This may indicate that the torch has recov-
ered its symmetry better when the injection point was
located at 1 cm compared to 5 mm. Moving the injection
site downstream at 1.5 cm, as in case 46, has also
decreased the particle counts. This indicates the 1-cm
standoff is possibly closer to the ideal position of the
injection site on the torch center line.
Effect of Torch Operating Conditions
Plasma torch operating conditions play a key role in the
effectiveness of the SPS process. Table 5 shows the range
of operating conditions for the torch considered in this
work, which include the Ar-H2 mass flow rate and arc
voltage variations. For case A, B, and C, only the gas flow
Fig. 15 Particle counts on
substrate for each test case
26 J Therm Spray Tech (2017) 26:12–36
123
rate is varied. Torch power is also varied using the voltage
value. For cases A, D, and E, the change in voltage gen-
erates power variations of 7235, 14,470, and 21,704 W,
respectively. The mass flow rate for these three cases is
kept identical (35.4 slpm). In all test cases, the right
boundary of the domain at 8 cm is a large substrate.
In all these cases, the injected suspension is 10 wt.%
YSZ-water. Droplets are injected with a uniform initial
diameter of 150 lm. The injector properties for these test
cases are R ¼ 0:005 m, H ¼ 0:005 m, h ¼ 10, and
v ¼ 10 m/s. Injection flow rate is kept constant at
1.92E-4 kg/s. The suspension viscosity is corrected uti-
lizing Fig. 4. Evaporation of water, breakup and coales-
cence of liquid suspension and molten drops, and radiation
heat losses are all taken into account.
Two particular aspects affecting the droplets/particles
are of interest. First is the conditions during its flight, e.g.,
shear forces exerted on the droplets at each particular point
of their flight path. The second area of interest is particle
conditions upon impact on the substrate. Conditions such
as particle temperature, diameter, and velocity play an
important role in defining the final finish of the coating. In
the following sections, for test cases A-E, initially droplet
conditions during flight are examined. Afterward, particle
properties upon impact on the substrate are investigated.
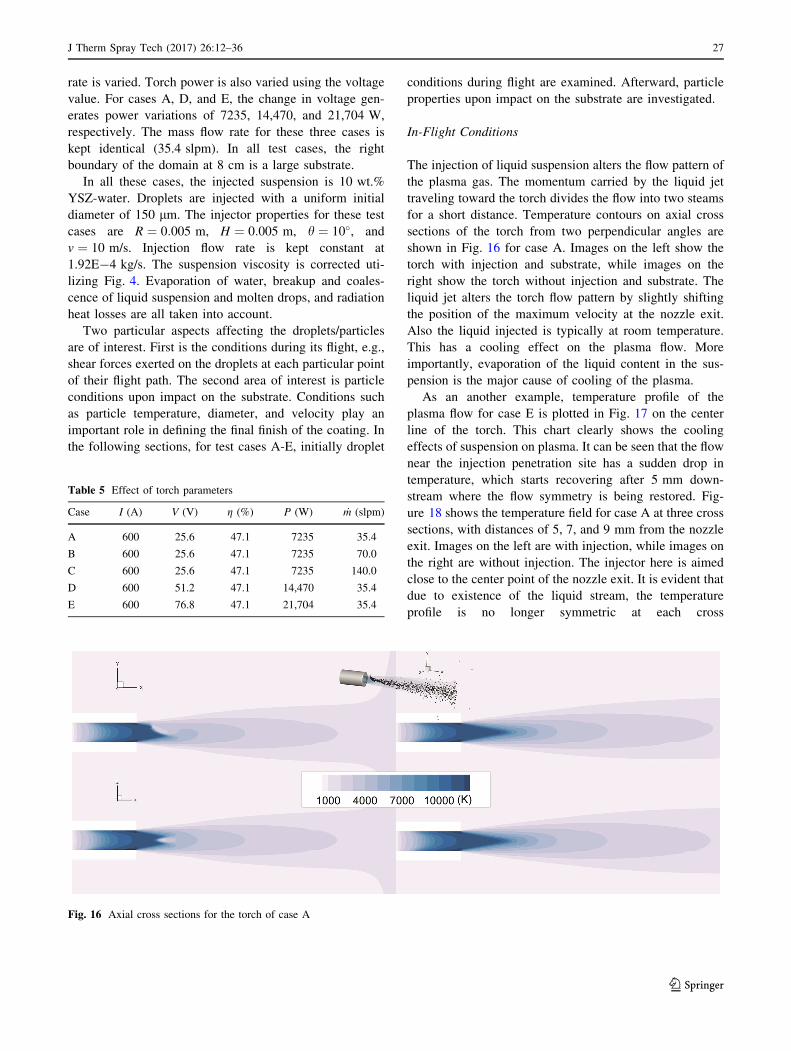
In-Flight Conditions
The injection of liquid suspension alters the flow pattern of
the plasma gas. The momentum carried by the liquid jet
traveling toward the torch divides the flow into two steams
for a short distance. Temperature contours on axial cross
sections of the torch from two perpendicular angles are
shown in Fig. 16 for case A. Images on the left show the
torch with injection and substrate, while images on the
right show the torch without injection and substrate. The
liquid jet alters the torch flow pattern by slightly shifting
the position of the maximum velocity at the nozzle exit.
Also the liquid injected is typically at room temperature.
This has a cooling effect on the plasma flow. More
importantly, evaporation of the liquid content in the sus-
pension is the major cause of cooling of the plasma.
As an another example, temperature profile of the
plasma flow for case E is plotted in Fig. 17 on the center
line of the torch. This chart clearly shows the cooling
effects of suspension on plasma. It can be seen that the flow
near the injection penetration site has a sudden drop in
temperature, which starts recovering after 5 mm down-
stream where the flow symmetry is being restored. Fig-
ure 18 shows the temperature field for case A at three cross
sections, with distances of 5, 7, and 9 mm from the nozzle
exit. Images on the left are with injection, while images on
the right are without injection. The injector here is aimed
close to the center point of the nozzle exit. It is evident that
due to existence of the liquid stream, the temperature
profile is no longer symmetric at each cross
Fig. 16 Axial cross sections for the torch of case A
Table 5 Effect of torch parameters
Case I (A) V (V) g (%) P (W) _m (slpm)
A 600 25.6 47.1 7235 35.4
B 600 25.6 47.1 7235 70.0
C 600 25.6 47.1 7235 140.0
D 600 51.2 47.1 14,470 35.4
E 600 76.8 47.1 21,704 35.4
J Therm Spray Tech (2017) 26:12–36 27
123
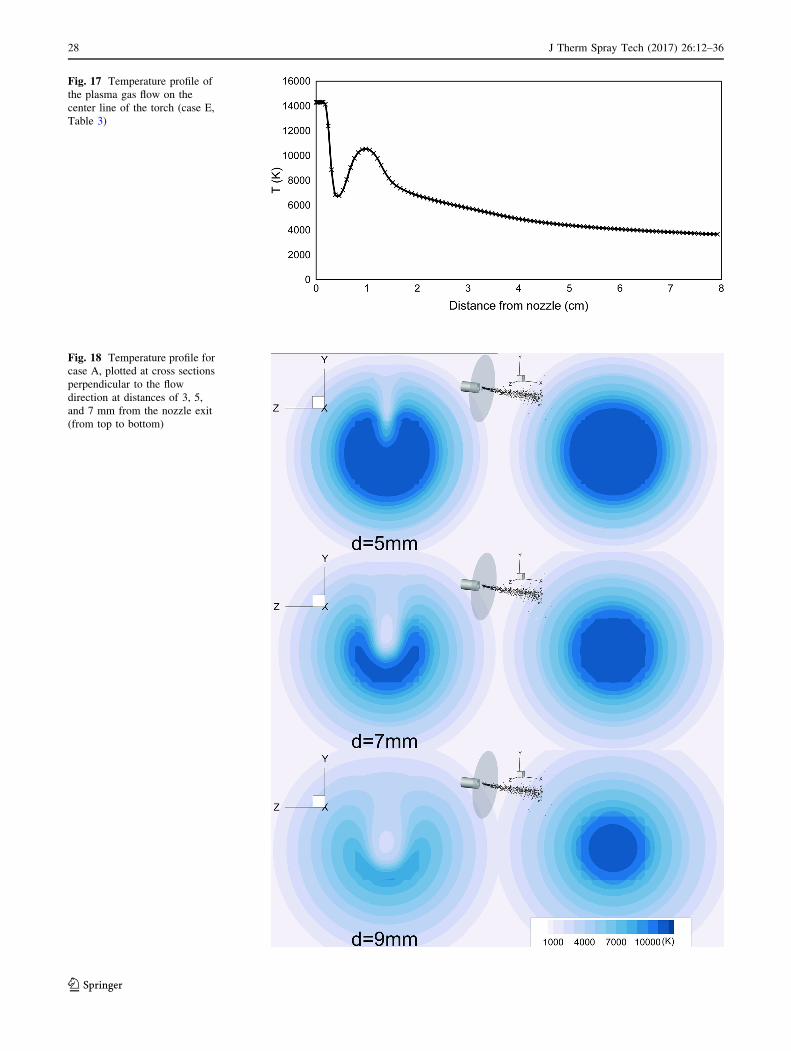
Fig. 18 Temperature profile for
case A, plotted at cross sections
perpendicular to the flow
direction at distances of 3, 5,
and 7 mm from the nozzle exit
(from top to bottom)
Fig. 17 Temperature profile of
the plasma gas flow on the
center line of the torch (case E,
Table 3)
28 J Therm Spray Tech (2017) 26:12–36
123
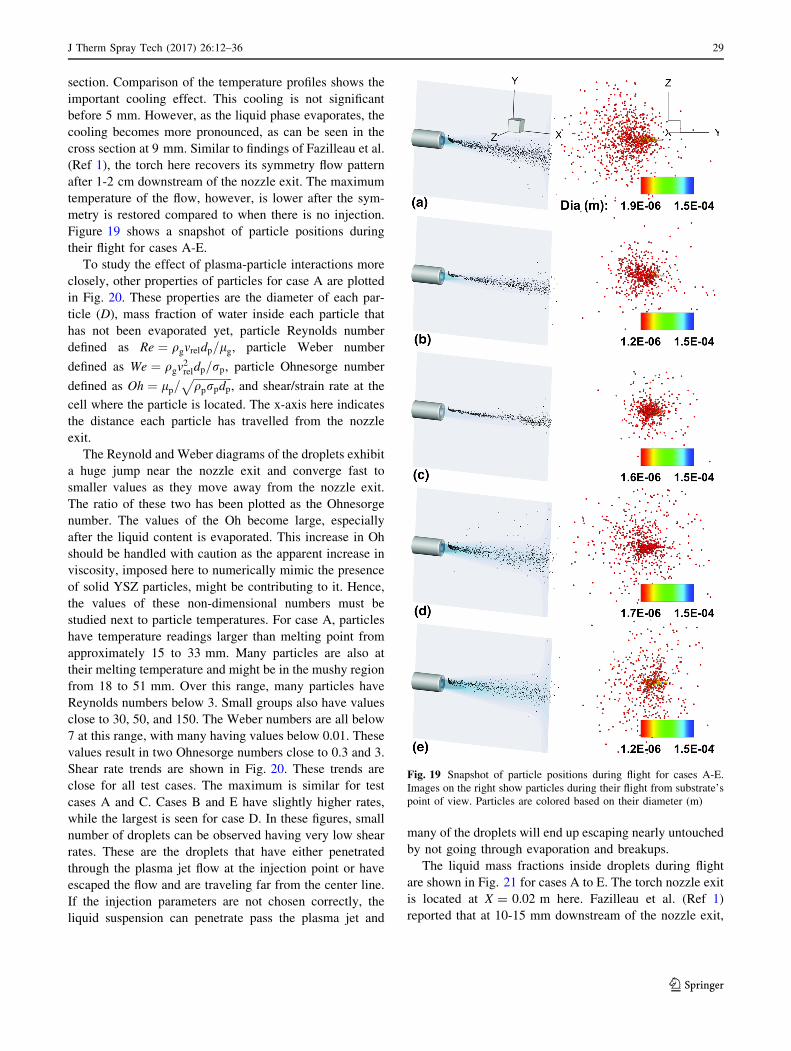
section. Comparison of the temperature profiles shows the
important cooling effect. This cooling is not significant
before 5 mm. However, as the liquid phase evaporates, the
cooling becomes more pronounced, as can be seen in the
cross section at 9 mm. Similar to findings of Fazilleau et al.
(Ref 1), the torch here recovers its symmetry flow pattern
after 1-2 cm downstream of the nozzle exit. The maximum
temperature of the flow, however, is lower after the sym-
metry is restored compared to when there is no injection.
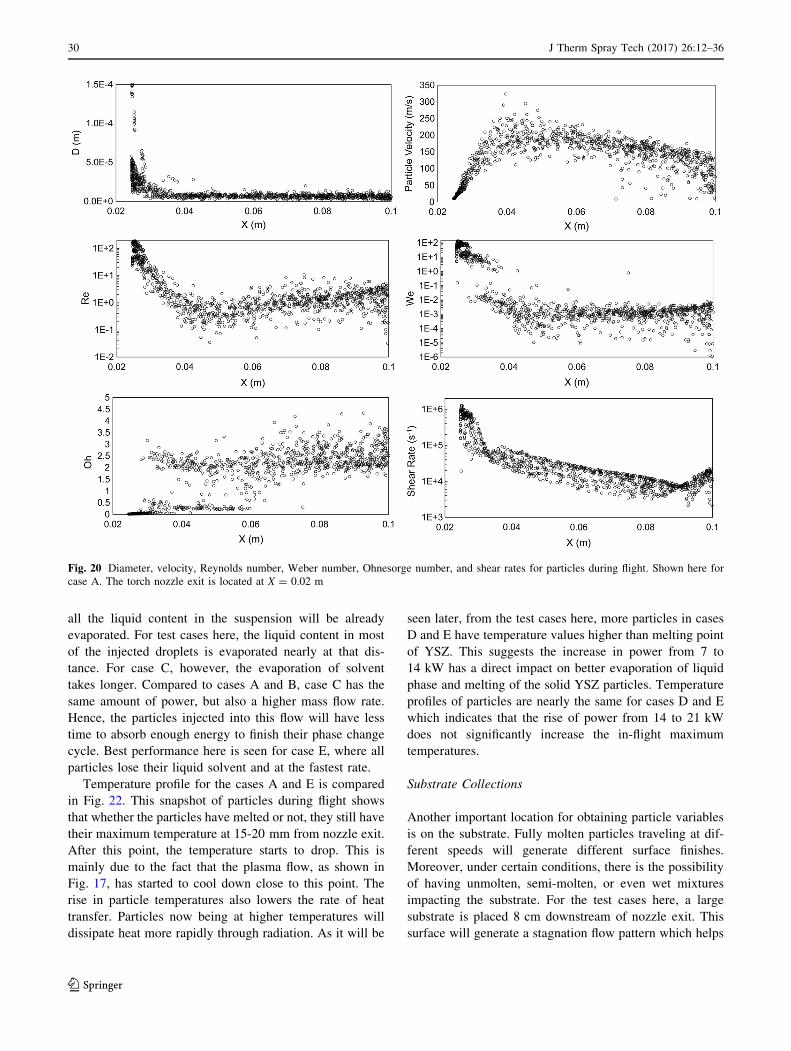
Figure 19 shows a snapshot of particle positions during
their flight for cases A-E.
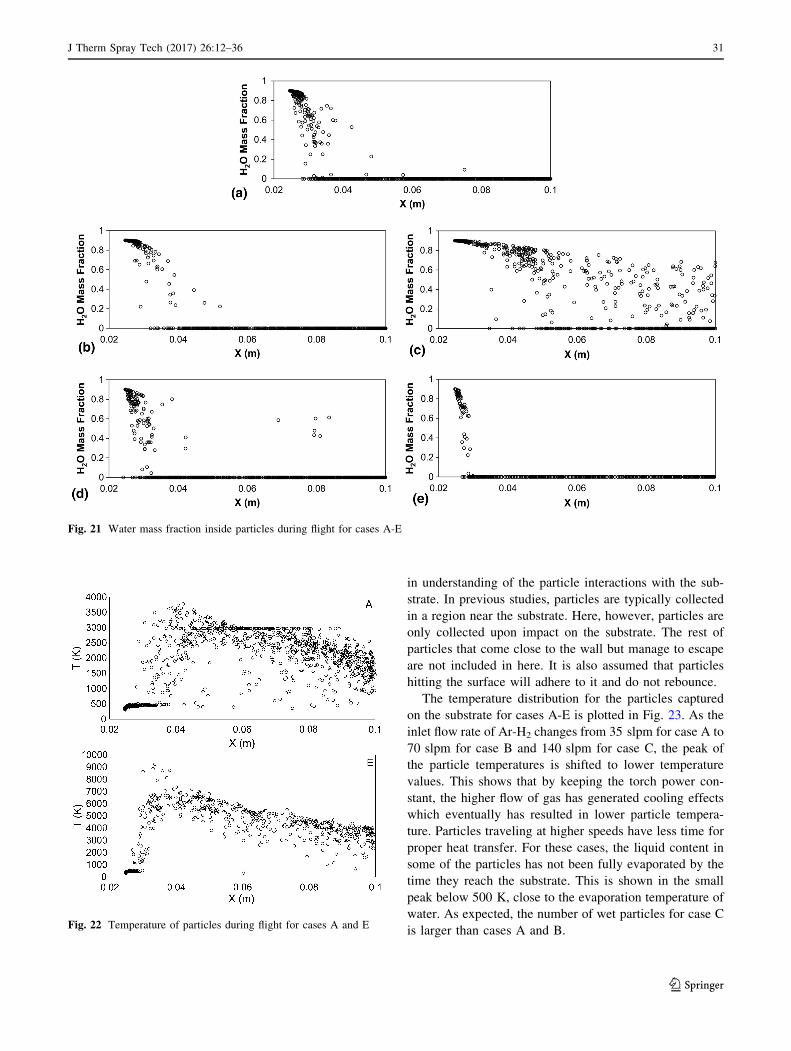
To study the effect of plasma-particle interactions more
closely, other properties of particles for case A are plotted
in Fig. 20. These properties are the diameter of each par-
ticle (D), mass fraction of water inside each particle that
has not been evaporated yet, particle Reynolds number
defined as Re ¼ qgvreldp=lg, particle Weber number
defined as We ¼ qgv2reldp=rp, particle Ohnesorge number
defined as Oh ¼ lp=ffiffiffiffiffiffiffiffiffiffiffiffiffiffiqprpdp
p, and shear/strain rate at the
cell where the particle is located. The x-axis here indicates
the distance each particle has travelled from the nozzle
exit.
The Reynold and Weber diagrams of the droplets exhibit
a huge jump near the nozzle exit and converge fast to
smaller values as they move away from the nozzle exit.
The ratio of these two has been plotted as the Ohnesorge
number. The values of the Oh become large, especially
after the liquid content is evaporated. This increase in Oh
should be handled with caution as the apparent increase in
viscosity, imposed here to numerically mimic the presence
of solid YSZ particles, might be contributing to it. Hence,
the values of these non-dimensional numbers must be
studied next to particle temperatures. For case A, particles
have temperature readings larger than melting point from
approximately 15 to 33 mm. Many particles are also at
their melting temperature and might be in the mushy region
from 18 to 51 mm. Over this range, many particles have
Reynolds numbers below 3. Small groups also have values
close to 30, 50, and 150. The Weber numbers are all below
7 at this range, with many having values below 0.01. These
values result in two Ohnesorge numbers close to 0.3 and 3.
Shear rate trends are shown in Fig. 20. These trends are
close for all test cases. The maximum is similar for test
cases A and C. Cases B and E have slightly higher rates,
while the largest is seen for case D. In these figures, small
number of droplets can be observed having very low shear
rates. These are the droplets that have either penetrated
through the plasma jet flow at the injection point or have
escaped the flow and are traveling far from the center line.
If the injection parameters are not chosen correctly, the
liquid suspension can penetrate pass the plasma jet and
many of the droplets will end up escaping nearly untouched
by not going through evaporation and breakups.
The liquid mass fractions inside droplets during flight
are shown in Fig. 21 for cases A to E. The torch nozzle exit
is located at X = 0.02 m here. Fazilleau et al. (Ref 1)
reported that at 10-15 mm downstream of the nozzle exit,
Fig. 19 Snapshot of particle positions during flight for cases A-E.
Images on the right show particles during their flight from substrate’s
point of view. Particles are colored based on their diameter (m)
J Therm Spray Tech (2017) 26:12–36 29
123
all the liquid content in the suspension will be already
evaporated. For test cases here, the liquid content in most
of the injected droplets is evaporated nearly at that dis-
tance. For case C, however, the evaporation of solvent
takes longer. Compared to cases A and B, case C has the
same amount of power, but also a higher mass flow rate.
Hence, the particles injected into this flow will have less
time to absorb enough energy to finish their phase change
cycle. Best performance here is seen for case E, where all
particles lose their liquid solvent and at the fastest rate.
Temperature profile for the cases A and E is compared
in Fig. 22. This snapshot of particles during flight shows
that whether the particles have melted or not, they still have
their maximum temperature at 15-20 mm from nozzle exit.
After this point, the temperature starts to drop. This is
mainly due to the fact that the plasma flow, as shown in
Fig. 17, has started to cool down close to this point. The
rise in particle temperatures also lowers the rate of heat
transfer. Particles now being at higher temperatures will
dissipate heat more rapidly through radiation. As it will be
seen later, from the test cases here, more particles in cases
D and E have temperature values higher than melting point
of YSZ. This suggests the increase in power from 7 to
14 kW has a direct impact on better evaporation of liquid
phase and melting of the solid YSZ particles. Temperature
profiles of particles are nearly the same for cases D and E
which indicates that the rise of power from 14 to 21 kW
does not significantly increase the in-flight maximum
temperatures.
Substrate Collections
Another important location for obtaining particle variables
is on the substrate. Fully molten particles traveling at dif-
ferent speeds will generate different surface finishes.
Moreover, under certain conditions, there is the possibility
of having unmolten, semi-molten, or even wet mixtures
impacting the substrate. For the test cases here, a large
substrate is placed 8 cm downstream of nozzle exit. This
surface will generate a stagnation flow pattern which helps
Fig. 20 Diameter, velocity, Reynolds number, Weber number, Ohnesorge number, and shear rates for particles during flight. Shown here for
case A. The torch nozzle exit is located at X = 0.02 m
30 J Therm Spray Tech (2017) 26:12–36
123
in understanding of the particle interactions with the sub-
strate. In previous studies, particles are typically collected
in a region near the substrate. Here, however, particles are
only collected upon impact on the substrate. The rest of
particles that come close to the wall but manage to escape
are not included in here. It is also assumed that particles
hitting the surface will adhere to it and do not rebounce.
The temperature distribution for the particles captured
on the substrate for cases A-E is plotted in Fig. 23. As the
inlet flow rate of Ar-H2 changes from 35 slpm for case A to
70 slpm for case B and 140 slpm for case C, the peak of
the particle temperatures is shifted to lower temperature
values. This shows that by keeping the torch power con-
stant, the higher flow of gas has generated cooling effects
which eventually has resulted in lower particle tempera-
ture. Particles traveling at higher speeds have less time for
proper heat transfer. For these cases, the liquid content in
some of the particles has not been fully evaporated by the
time they reach the substrate. This is shown in the small
peak below 500 K, close to the evaporation temperature of
water. As expected, the number of wet particles for case C
is larger than cases A and B.
Fig. 21 Water mass fraction inside particles during flight for cases A-E
Fig. 22 Temperature of particles during flight for cases A and E
J Therm Spray Tech (2017) 26:12–36 31
123
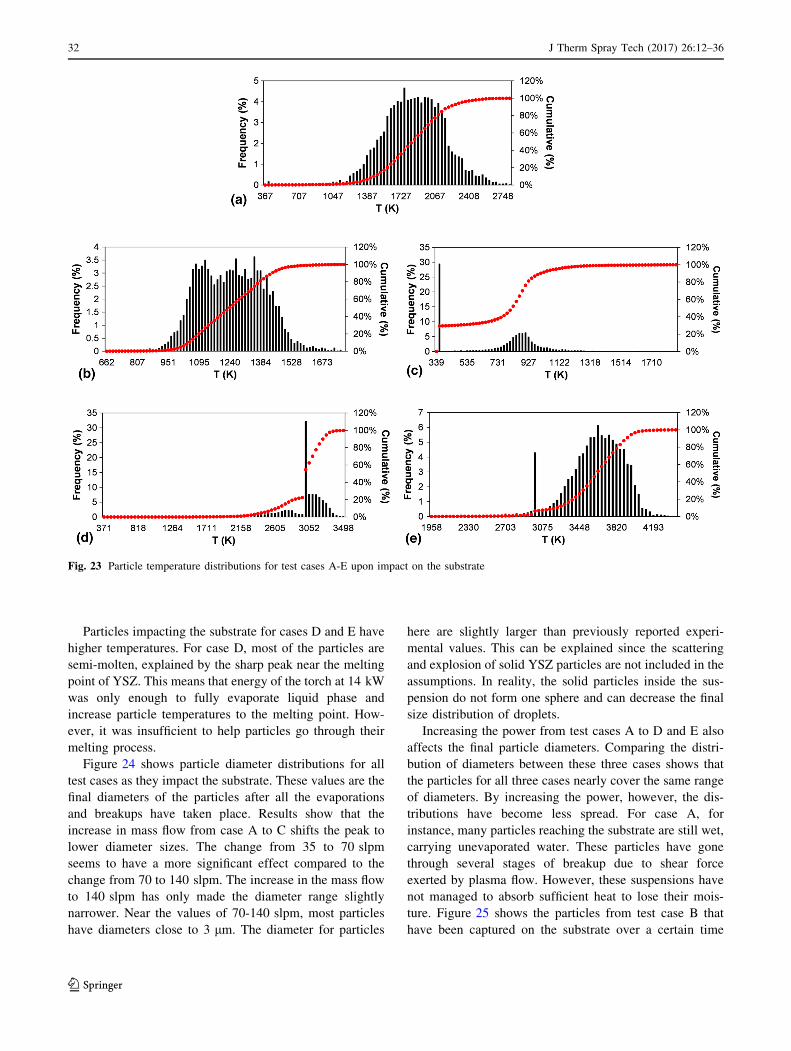
Particles impacting the substrate for cases D and E have
higher temperatures. For case D, most of the particles are
semi-molten, explained by the sharp peak near the melting
point of YSZ. This means that energy of the torch at 14 kW
was only enough to fully evaporate liquid phase and
increase particle temperatures to the melting point. How-
ever, it was insufficient to help particles go through their
melting process.
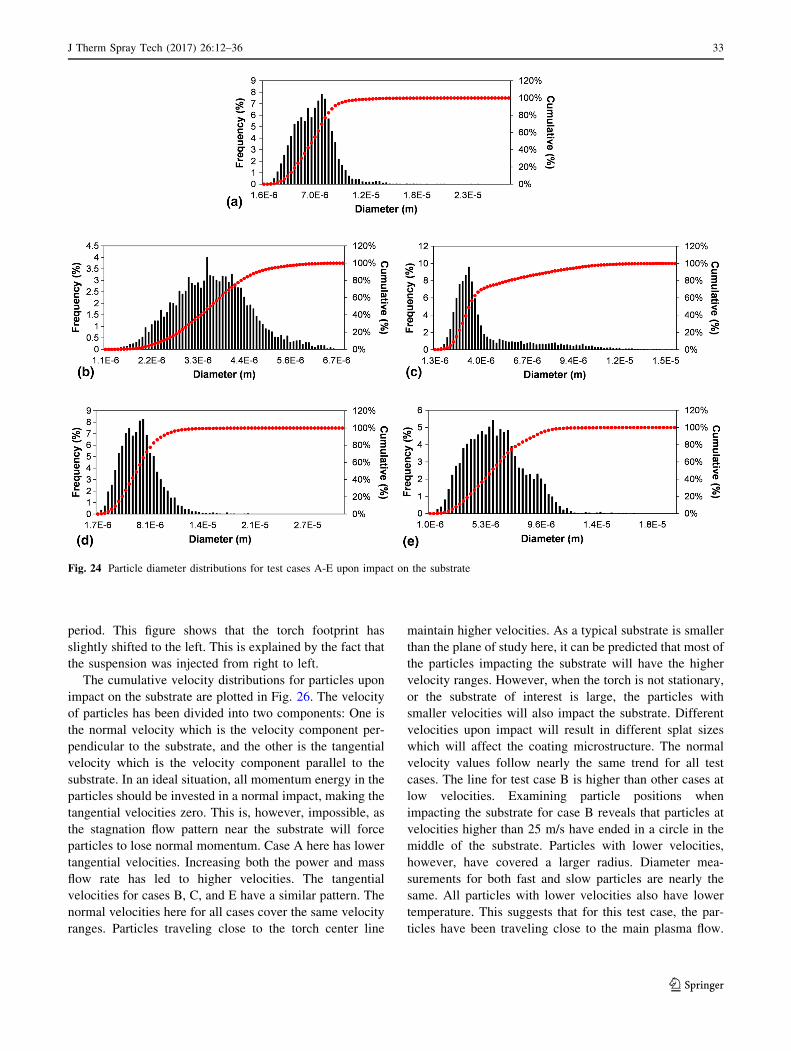
Figure 24 shows particle diameter distributions for all
test cases as they impact the substrate. These values are the
final diameters of the particles after all the evaporations
and breakups have taken place. Results show that the
increase in mass flow from case A to C shifts the peak to
lower diameter sizes. The change from 35 to 70 slpm
seems to have a more significant effect compared to the
change from 70 to 140 slpm. The increase in the mass flow
to 140 slpm has only made the diameter range slightly
narrower. Near the values of 70-140 slpm, most particles
have diameters close to 3 lm. The diameter for particles
here are slightly larger than previously reported experi-
mental values. This can be explained since the scattering
and explosion of solid YSZ particles are not included in the
assumptions. In reality, the solid particles inside the sus-
pension do not form one sphere and can decrease the final
size distribution of droplets.
Increasing the power from test cases A to D and E also
affects the final particle diameters. Comparing the distri-
bution of diameters between these three cases shows that
the particles for all three cases nearly cover the same range
of diameters. By increasing the power, however, the dis-
tributions have become less spread. For case A, for
instance, many particles reaching the substrate are still wet,
carrying unevaporated water. These particles have gone
through several stages of breakup due to shear force
exerted by plasma flow. However, these suspensions have
not managed to absorb sufficient heat to lose their mois-
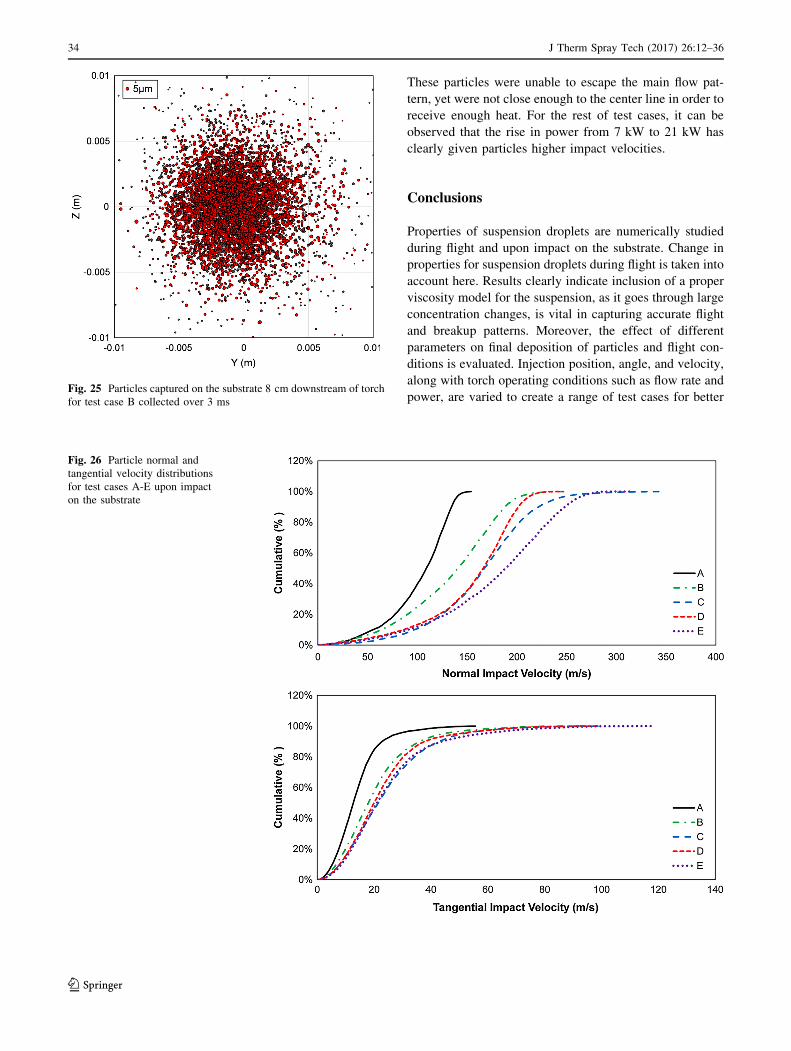
ture. Figure 25 shows the particles from test case B that
have been captured on the substrate over a certain time
Fig. 23 Particle temperature distributions for test cases A-E upon impact on the substrate
32 J Therm Spray Tech (2017) 26:12–36
123
period. This figure shows that the torch footprint has
slightly shifted to the left. This is explained by the fact that
the suspension was injected from right to left.
The cumulative velocity distributions for particles upon
impact on the substrate are plotted in Fig. 26. The velocity
of particles has been divided into two components: One is
the normal velocity which is the velocity component per-
pendicular to the substrate, and the other is the tangential
velocity which is the velocity component parallel to the
substrate. In an ideal situation, all momentum energy in the
particles should be invested in a normal impact, making the
tangential velocities zero. This is, however, impossible, as
the stagnation flow pattern near the substrate will force
particles to lose normal momentum. Case A here has lower
tangential velocities. Increasing both the power and mass
flow rate has led to higher velocities. The tangential
velocities for cases B, C, and E have a similar pattern. The
normal velocities here for all cases cover the same velocity
ranges. Particles traveling close to the torch center line
maintain higher velocities. As a typical substrate is smaller
than the plane of study here, it can be predicted that most of
the particles impacting the substrate will have the higher
velocity ranges. However, when the torch is not stationary,
or the substrate of interest is large, the particles with
smaller velocities will also impact the substrate. Different
velocities upon impact will result in different splat sizes
which will affect the coating microstructure. The normal
velocity values follow nearly the same trend for all test
cases. The line for test case B is higher than other cases at
low velocities. Examining particle positions when
impacting the substrate for case B reveals that particles at
velocities higher than 25 m/s have ended in a circle in the
middle of the substrate. Particles with lower velocities,
however, have covered a larger radius. Diameter mea-
surements for both fast and slow particles are nearly the
same. All particles with lower velocities also have lower
temperature. This suggests that for this test case, the par-
ticles have been traveling close to the main plasma flow.
Fig. 24 Particle diameter distributions for test cases A-E upon impact on the substrate
J Therm Spray Tech (2017) 26:12–36 33
123
These particles were unable to escape the main flow pat-
tern, yet were not close enough to the center line in order to
receive enough heat. For the rest of test cases, it can be
observed that the rise in power from 7 kW to 21 kW has
clearly given particles higher impact velocities.
Conclusions
Properties of suspension droplets are numerically studied
during flight and upon impact on the substrate. Change in
properties for suspension droplets during flight is taken into
account here. Results clearly indicate inclusion of a proper
viscosity model for the suspension, as it goes through large
concentration changes, is vital in capturing accurate flight
and breakup patterns. Moreover, the effect of different
parameters on final deposition of particles and flight con-
ditions is evaluated. Injection position, angle, and velocity,
along with torch operating conditions such as flow rate and
power, are varied to create a range of test cases for betterFig. 25 Particles captured on the substrate 8 cm downstream of torch
for test case B collected over 3 ms
Fig. 26 Particle normal and
tangential velocity distributions
for test cases A-E upon impact
on the substrate
34 J Therm Spray Tech (2017) 26:12–36
123
understanding of the suspension spraying process. These
cases show that the final faith of the injected droplets is
related to all parameters involved. Different parameters,
however, have different impacts on the overall outcome.
For injector operating conditions, test cases show that
injection of suspension at high mass flow rates can result in
a complete penetration through the plasma plume. It can
also be concluded that under the conditions of the current
study, the best SPS deposition rates are achieved when
injection needle is placed close to the torch center line and
near 1 cm from nozzle exit. Droplets also need to be
injected at a low velocity. These injection conditions
introduce the least amount of disturbances in torch flow
pattern and allow more particles to be carried toward the
substrate. For injection of water suspensions, it is clearly
important to have enough power at the torch to make sure
the cooling effects of evaporating water are recovered.
Otherwise, in many cases, the liquid content might not
effectively evaporate and lead to the impact of wet mix-
tures on the substrate. Results here also indicate that
increasing the torch power enhances particle qualities on
the substrate better compared to increasing the inlet mass
flow rate.
References
1. J. Fazilleau, C. Delbos, V. Rat, J.-F. Coudert, P. Fauchais, and B.
Pateyron, Phenomena Involved in Suspension Plasma Spraying
Part 1: Suspension Injection and Behavior, Plasma Chem. Plasma
Process., 2006, 26(4), p 371-391
2. C. Delbos, J. Fazilleau, V. Rat, J.-F. Coudert, P. Fauchais, and B.
Pateyron, Phenomena Involved in Suspension Plasma Spraying
Part 2: Zirconia Particle Treatment and Coating Formation,
Plasma Chem. Plasma Process., 2006, 26(4), p 393-414
3. D. Waldbillig and O. Kesler, Effect of Suspension Plasma
Spraying Process Parameters on YSZ Coating Microstructure and
Permeability, Surf. Coat. Technol., 2011, 205(23), p 5483-5492
4. F. Jabbari, M. Jadidi, R. Wuthrich, and A. Dolatabadi, A
Numerical Study of Suspension Injection in Plasma-Spraying
Process, J. Therm. Spray Technol., 2014, 23(1-2), p 3-13
5. M. Jadidi, M. Mousavi, S. Moghtadernejad, and A. Dolatabadi, A
Three-Dimensional Analysis of the Suspension Plasma Spray
Impinging on a Flat Substrate, J. Therm. Spray Technol., 2015,
24(1-2), p 11-23
6. R. Rampon, C. Filiatre, and G. Bertrand, Suspension Plasma
Spraying of YPSZ Coatings: Suspension Atomization and
Injection, J. Therm. Spray Technol., 2008, 17(1), p 105-114
7. E. Meillot, S. Vincent, C. Caruyer, D. Damiani, and J. Calta-
girone, Modelling the Interactions Between a Thermal Plasma
Flow and a Continuous Liquid Jet in a Suspension Spraying
Process, J. Phys. D Appl. Phys., 2013, 46(22), p 224017
8. K. Toda and H. Furuse, Extension of Einstein’s Viscosity
Equation to that for Concentrated Dispersions of Solutes and
Particles, J. Biosci. Bioeng., 2006, 102(6), p 524-528
9. D. Chen, E.H. Jordan, and M. Gell, Effect of Solution Concen-
tration on Splat Formation and Coating Microstructure Using the
Solution Precursor Plasma Spray Process, Surf. Coat. Technol.,
2008, 202(10), p 2132-2138
10. J.S. Chong, E.B. Christiansen, and A.D. Baer, Rheology of
Concentrated Suspensions, J. Appl. Polym. Sci., 1971, 15(8),p 2007-2021
11. D.I. Lee, Packing of Spheres and Its Effect on Viscosity of
Suspensions, J. Paint Technol., 1970, 42(550), p 579
12. N. Ashgriz, Handbook of Atomization and Sprays: Theory and
Applications, Springer, New York, 2011
13. R.S. Brodkey, The Phenomena of Fluid Motions, Courier Cor-
poration, 1995
14. C. Kang, H. Ng, and S. Yu, Comparative Study of Plasma Spray
Flow Fields and Particle Behavior Near to Flat Inclined Sub-
strates, Plasma Chem. Plasma Process., 2006, 26(2), p 149-175
15. A.F. Ansys, ANSYS Fluent Theory Guide, 15.0 ed., ANSYS Inc.,
2013.
16. T.C.-M. Wu, M. Bussmann, and J. Mostaghimi, The Impact of a
Partially Molten YSZ Particle, J. Therm. Spray Technol., 2009,
18(5-6), p 957-964
17. S. Pope, An Explanation of the Turbulent Round-Jet/Plane-Jet
Anomaly, AIAA J., 1978, 16(3), p 279-281
18. F.M. White and I. Corfield, Viscous Fluid Flow, Vol 3, McGraw-
Hill, New York, 2006
19. E. Pfender, Particle Behavior in Thermal Plasmas, Plasma Chem.
Plasma Process., 1989, 9(1), p 167S-194S
20. Y. Lee, K. Hsu, and E. Pfender, Modeling of Particles Injected
into a Dc Plasma Jet, Proceedings of the 5th International Sym-
posium on Plasma Chemistry, 1981
21. Y. Chyou and E. Pfender, Behavior of Particulates in Thermal
Plasma Flows, Plasma Chem. Plasma Process., 1989, 9(1), p 45-
71
22. X. Chen and E. Pfender, Effect of the Knudsen Number on Heat
Transfer to a Particle Immersed into a Thermal Plasma, Plasma
Chem. Plasma Process., 1983, 3(1), p 97-113
23. L. Talbot, R. Cheng, R. Schefer, and D. Willis, Thermophoresis
of Particles in a Heated Boundary Layer, J. Fluid Mech., 1980,
101(4), p 737-758
24. E. Meillot, R. Vert, C. Caruyer, D. Damiani, and M. Vardelle,
Manufacturing Nanostructured YSZ Coatings by Suspension
Plasma Spraying (SPS): Effect of Injection Parameters, J. Phys.
D Appl. Phys., 2011, 44(19), p 194008
25. S. Vincent, G. Balmigere, C. Caruyer, E. Meillot, and J.-P. Cal-
tagirone, Contribution to the Modeling of the Interaction Between
a Plasma Flow and a Liquid Jet, Surf. Coat. Technol., 2009,
203(15), p 2162-2171
26. M. Bussmann, J. Mostaghimi, and S. Chandra, On a Three-Di-
mensional Volume Tracking Model of Droplet Impact, Phys.
Fluids (1994-Present), 1999, 11(6), p 1406-1417
27. J. Beale and R. Rolf D, Modeling Spray Atomization with the
Kelvin-Helmholtz/Rayleigh-Taylor hybrid Model, Atomization
Sprays, 1999, 9(6), p 623-650
28. M. A. Patterson and R. Rolf, Modeling the Effects of Fuel Spray
Characteristics on Diesel Engine Combustion and Emission, SAE
Technical Paper, 1998
29. X. Chen and E. Pfender, Behavior of Small Particles in a Thermal
Plasma Flow, Plasma Chem. Plasma Process., 1983, 3(3), p 351-
366
30. E.A.R. Stendal, Multiphase Flows in Cyclone Separators
Modeling the Classification and Drying of Solid Particles Using
CFD, Chalmers University of Technology, Gothenburg, 2013
31. E.J. Henley, J.D. Seader, and D.K. Roper, Separation Process
Principles, Wiley, New York, 2011
32. K.N. Marsh and K. Marsh, Recommended Reference Materials
for the Realization of Physicochemical Properties, Blackwell,
Oxford, 1987
J Therm Spray Tech (2017) 26:12–36 35
123
33. V. Majer and V. Svoboda, Enthalpies of Vaporization of Organic
Compounds: A Critical Review and Data Compilation, Black-
well, Oxford, 1985
34. W.E. Acree, Jr., and J.S. Chickos, Phase Transition Enthalpy
Measurements of Organic and Organometallic Compounds, NIST
Chemistry WebBook, NIST Standard Reference Database Num-
ber 69, P.J. Linstrom and W.G. Mallard, Eds., National Institute
of Standards and Technology, Gaithersburg, MD. Retrieved
September, 2016 from http://webbook.nist.gov
35. A. Einstein, Eine neue Bestimmung der Molekuldimensionen,
Ann. Phys., 1906, 324(2), p 289-306
36. E. Guth and R. Simha, Untersuchungen uber die Viskositat von
Suspensionen und Losungen. 3. Uber die Viskositat von Kugel-
suspensionen, Kolloid-Zeitschrift, 1936, 74(3), p 266-275
37. D.G. Thomas, Transport Characteristics of Suspension: VIII.
A Note on the Viscosity of Newtonian Suspensions of Uniform
Spherical Particles, J. Colloid Sci., 1965, 20(3), p 267-277
38. I.M. Krieger and T.J. Dougherty, A Mechanism for non-Newto-
nian Flow in Suspensions of Rigid Spheres, Trans. Soc. Rheol.,
1959, 3(1), p 137-152
39. C.A. Shook and M.C. Roco, Slurry Flow: Principles and Prac-
tice, Elsevier, Amsterdam, 2015
40. L.L. Schramm, Suspensions; Basic Principles, Suspensions:
Fundamentals and Applications in the Petroleum Industry,
American Chemical Society, Washington, DC, 1996, p 3–44
41. T. Dabak and O. Yucel, Shear Viscosity Behavior of Highly
Concentrated Suspensions at Low and High Shear-Rates, Rheol.
Acta, 1986, 25(5), p 527-533
42. H. Eilers, Die Viskositat von Emulsionen hochviskoser Stoffe als
Funktion der Konzentration, Kolloid-Zeitschrift, 1941, 97(3),p 313-321
43. P.K. Senapati, B.K. Mishra, and A. Parida, Modeling of
Viscosity for Power Plant Ash Slurry at Higher Concentra-
tions: Effect of Solids Volume Fraction, Particle Size and
Hydrodynamic Interactions, Powder Technol., 2010, 197(1),p 1-8
44. B.A. Horri, P. Ranganathan, C. Selomulya, and H. Wang, A New
Empirical Viscosity Model for Ceramic Suspensions, Chem. Eng.
Sci., 2011, 66(12), p 2798-2806
45. O. Arevalo-Quintero, D. Waldbillig, and O. Kesler, An Investi-
gation of the Dispersion of YSZ, SDC, and Mixtures of YSZ/
SDC Powders in Aqueous Suspensions for Application in Sus-
pension Plasma Spraying, Surf. Coat. Technol., 2011, 205(21),p 5218-5227
46. T.C. Patton, Paint Flow and Pigment Dispersion, Interscience,
1964, p 479
47. M. Brossa and E. Pfender, Probe Measurements in Thermal
Plasma Jets, Plasma Chem. Plasma Process., 1988, 8(1),p 75-90
48. R. Bolot, M. Imbert, and C. Coddet, Mathematical Modeling of a
Free Plasma Jet Discharging into Air and Comparison with Probe
Measurements, Thermal Spray: A United Forum for Scientific
and Technological Advances, 1997, p 549–555
49. E. Meillot, D. Guenadou, and C. Bourgeois, Three-Dimension
and Transient DC Plasma Flow Modeling, Plasma Chem. Plasma
Process., 2008, 28(1), p 69-84
36 J Therm Spray Tech (2017) 26:12–36
123
Related Documents