Commissioned and published by the Humanitarian Practice Network at ODI Number 52 September 2005 Network Paper About HPN The Humanitarian Practice Network at the Overseas Development Institute is an independent forum where field workers, managers and policymakers in the humanitarian sector share information, analysis and experience. The views and opinions expressed in HPN’s publications do not necessarily state or reflect those of the Humanitarian Policy Group or the Overseas Development Institute. Overseas Development Institute 111 Westminster Bridge Road London SE1 7JD United Kingdom Tel. +44 (0) 20 7922 0300 Fax. +44 (0) 20 7922 0399 HPN e-mail: [email protected] HPN website: www.odihpn.org Britain’s leading independent think-tank on international development and humanitarian issues HPN Humanitarian Practice Network Managed by Humanitarian Policy Group Francesco Checchi and Les Roberts Interpreting and using mortality data in humanitarian emergencies A primer for non-epidemiologists In brief • Mortality data, properly collected, interpreted and used, have much to contribute to the appropriateness and effectiveness of humanitarian action in emergencies, and to advocacy on behalf of populations in crises. Most actors involved in relief will one day be confronted by such data, but the different ways in which this information can be collected, and their potential pitfalls, are not yet common knowledge among non-epidemiologists. • This Network Paper describes the practice and purpose of that branch of epidemiology concerned with population mortality. It sets out the key indicators used to express mortality data, different options for how to measure mortality rates and suggestions for how to assess, interpret and use mortality reports. The paper also discusses the politics of mortality figures. • The paper’s aim is to enable readers to critically interpret mortality study reports, and to understand how these are used (or misused) to formulate policy. The intended audience is therefore all humanitarian actors, policy-makers, the media and members of affected communities, who may be called upon to comment on or make use of mortality studies, regardless of their technical background.

Welcome message from author
This document is posted to help you gain knowledge. Please leave a comment to let me know what you think about it! Share it to your friends and learn new things together.
Transcript
Commissioned and published by the Humanitarian Practice Network at ODI
Number 52September 2005
Network Paper
About HPNThe Humanitarian Practice Network at theOverseas Development Institute is an independent forum where field workers, managers and policymakers in the humanitariansector share information, analysis and experience.The views and opinions expressed in HPN’s publications do not necessarily state or reflectthose of the Humanitarian Policy Group or theOverseas Development Institute.
Overseas Development Institute111 Westminster Bridge RoadLondon SE1 7JDUnited Kingdom
Tel. +44 (0) 20 7922 0300Fax. +44 (0) 20 7922 0399
HPN e-mail: [email protected] website: www.odihpn.org
Britain’s leading independent think-tank on international developmentand humanitarian issues
HPNHumanitarian Practice Network
Managed by
Humanitarian Policy Group
Francesco Checchi and Les Roberts
Interpreting and using mortality data in humanitarian emergenciesA primer for non-epidemiologists
In brief• Mortality data, properly collected, interpreted and used, have much to contribute to the appropriateness and effectiveness of humanitarian action in emergencies, and to advocacy on behalf ofpopulations in crises. Most actors involved in relief will one day be confronted by suchdata, but the different ways in which this information can be collected, and their potential pitfalls, are not yet common knowledge among non-epidemiologists.
• This Network Paper describes the practiceand purpose of that branch of epidemiologyconcerned with population mortality. It sets out the key indicators used to express mortality data, different options for how tomeasure mortality rates and suggestions forhow to assess, interpret and use mortalityreports. The paper also discusses the politicsof mortality figures.
• The paper’s aim is to enable readers to critically interpret mortality study reports, andto understand how these are used (or misused) to formulate policy. The intendedaudience is therefore all humanitarian actors,policy-makers, the media and members ofaffected communities, who may be called upon to comment on or make use of mortalitystudies, regardless of their technical background.
i
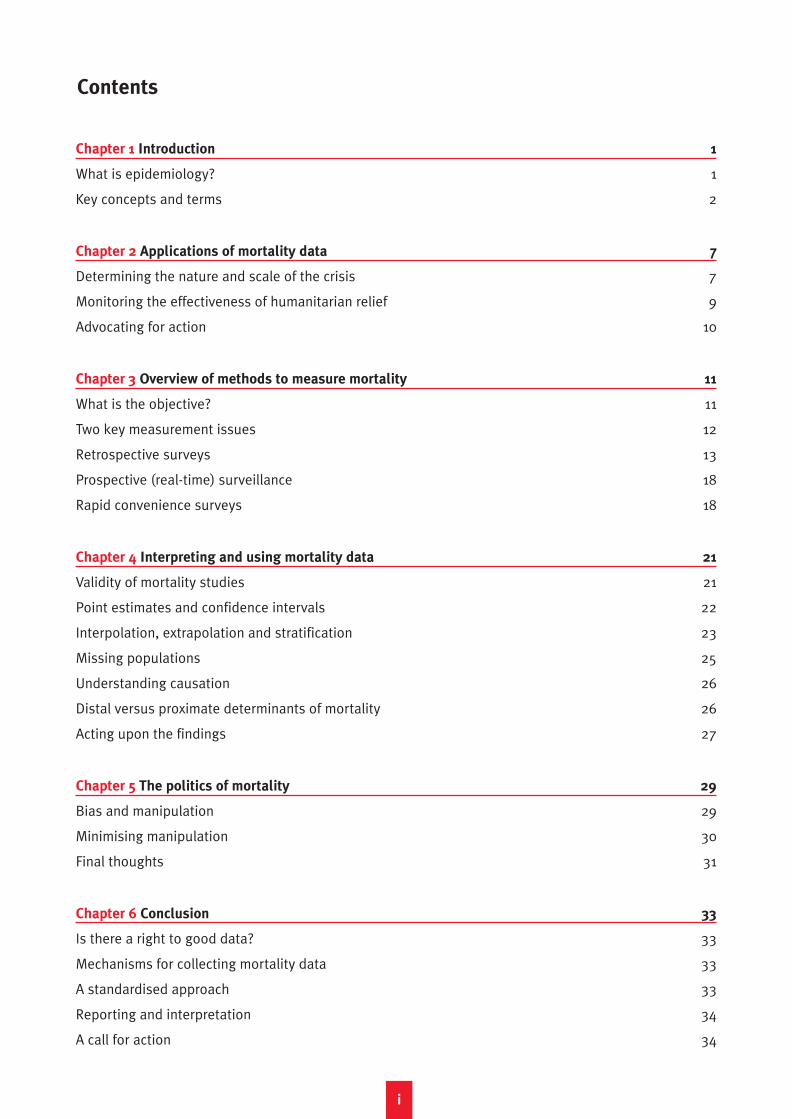
Chapter 1 Introduction 1
What is epidemiology? 1
Key concepts and terms 2
Chapter 2 Applications of mortality data 7
Determining the nature and scale of the crisis 7
Monitoring the effectiveness of humanitarian relief 9
Advocating for action 10
Chapter 3 Overview of methods to measure mortality 11
What is the objective? 11
Two key measurement issues 12
Retrospective surveys 13
Prospective (real-time) surveillance 18
Rapid convenience surveys 18
Chapter 4 Interpreting and using mortality data 21
Validity of mortality studies 21
Point estimates and confidence intervals 22
Interpolation, extrapolation and stratification 23
Missing populations 25
Understanding causation 26
Distal versus proximate determinants of mortality 26
Acting upon the findings 27
Chapter 5 The politics of mortality 29
Bias and manipulation 29
Minimising manipulation 30
Final thoughts 31
Chapter 6 Conclusion 33
Is there a right to good data? 33
Mechanisms for collecting mortality data 33
A standardised approach 33
Reporting and interpretation 34
A call for action 34
Contents

Interpreting and using mortality data in humanitarian emergencies
Annex 1 Glossary 35
Figures and tables
Figure 1 An illustration of the potential problems with the estimation of population at risk in
the simplified mortality rate expression (deaths per persons per unit time)
Figure 2 Illustration of the typical evolution of mortality in two types of crisis
Figure 3 Choices for retrospective and prospective estimation of mortality in Darfur, Sudan,
2004
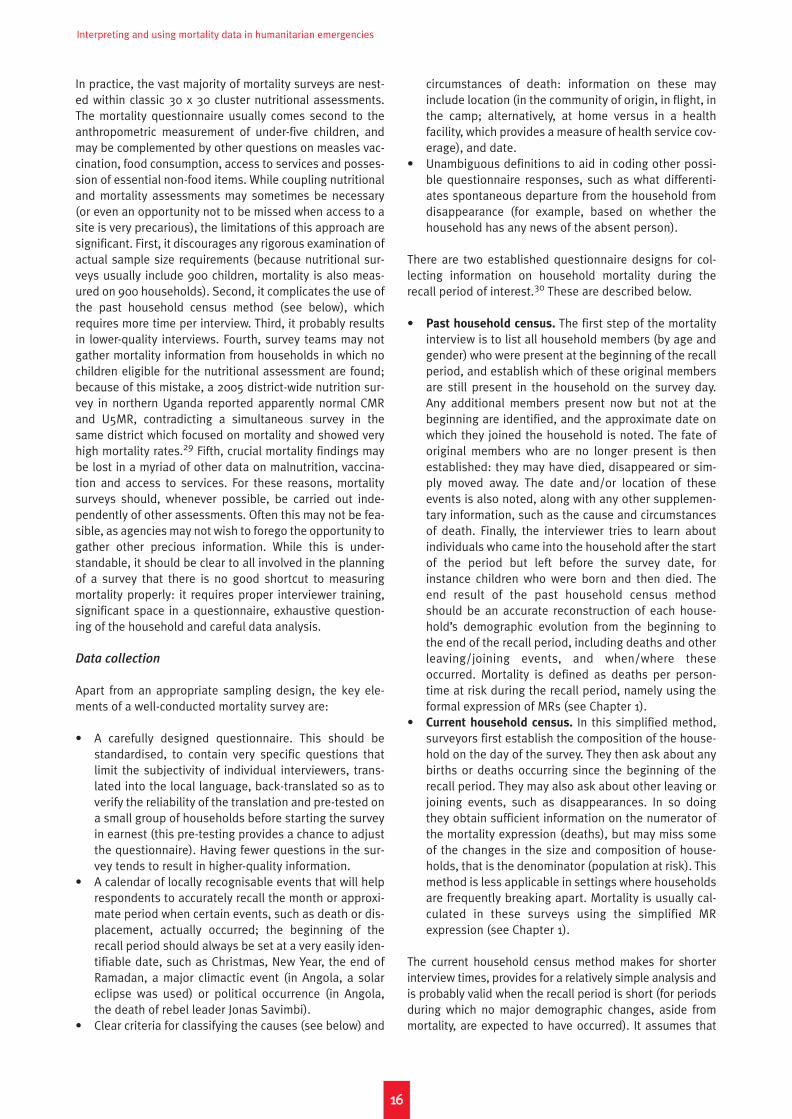
Figure 4 Cluster sampling design in a camp
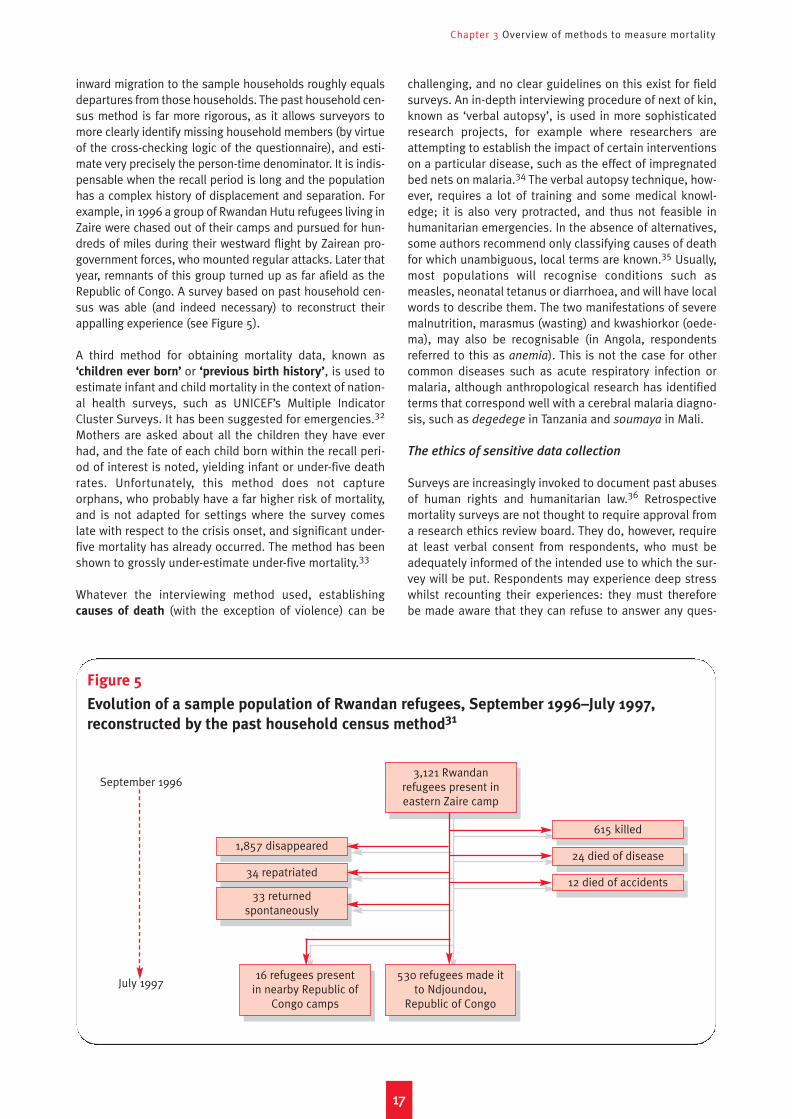
Figure 5 Evolution of a sample population of Rwandan refugees, September 1996–July 1997,
reconstructed by the past household census method
Table 1 Common indicators of population mortality in emergencies
Table 2 Mortality thresholds commonly used to define emergency situations
Table 3 Crude mortality rates in selected recent acute emergencies
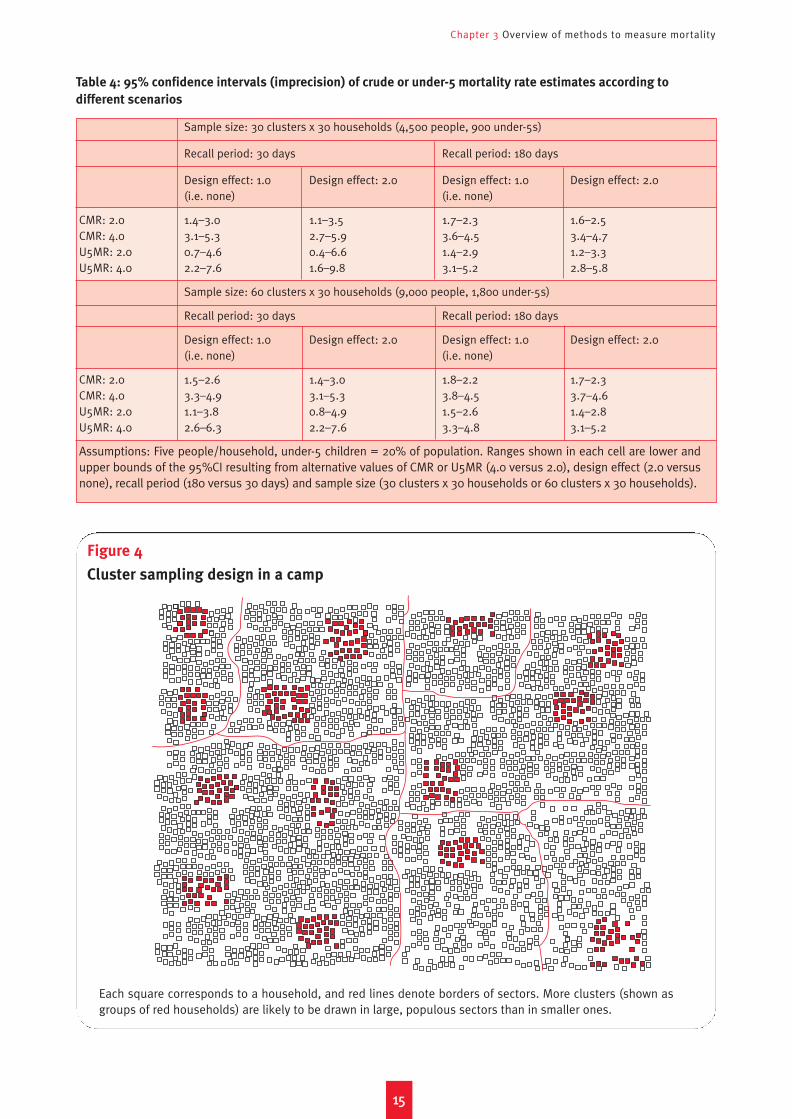
Table 4 95% confidence intervals (imprecision) of crude or under-5 mortality rate estimates
according to different scenarios
Table 5 Comparison of relative strengths and weaknesses of surveys and surveillance for
estimating mortality
Table 6 Estimates of violent deaths per day in occupied Iraq
ii
3
8
11
15
17
5
7
9
15
19
30
Humanitarian emergencies are chaotic, continuouslyevolving phenomena. Their magnitude and pace oftenoverwhelm the capacity of individual relief workers oragencies to fully appreciate their true scope and evolution.Sector-oriented relief organisations tend to focus on spe-cific perceived needs and may lack breadth of vision, justas organisations with oversight roles, such as governmentsor UN agencies, may sometimes lack sufficient depth. Inthe face of evident injustice and suffering, it is difficult tomaintain objectivity. Depending on one’s perspective, itmay be professionally or emotionally more expedient toconvince oneself and others that the situation of affectedpopulations is either much better, or much worse, than itreally is.
Years ago, one of the authors of this paper, returning froma long stay in Liberia with Médecins Sans Frontières (MSF),was asked by a Parisian taxi driver why MSF did nothing tohelp the Parisian working class who, he said, were allfalling sick that winter; he then started listing members ofhis family who had been ill with the ’flu, coughs and arthri-tis. Suffering is indeed everywhere, but some populationsexperience extraordinary crises due to natural disasters,war, political repression, displacement, hunger and epi-demic disease. The common denominator of these publichealth emergencies, and indeed their ultimate measure, isthe spiritual and physical harm they inflict on individualhuman beings. The former type of harm is difficult to detectand quantify (although lately the importance of doing so isincreasingly recognised).1 As for physical harm, in humani-tarian emergencies its most extreme form – death – takeson rudimentary mathematical connotations as an increasein mortality from levels considered ‘normal’ in non-crisistimes. Information on mortality, and on its evolution overtime, is strikingly eloquent, offering an immediately com-prehensible, overarching view of the physical experience ofaffected populations over a given time interval. It is to apopulation in distress what vital signs are to a patient.
The starting premise of this paper is that the primary, mostimmediate goal of humanitarian relief is to prevent excessmorbidity and mortality. Similarly, any excess mortalityshould lead to a reaction. In this respect, mortality is theprime indicator by which to assess the impact of a crisis,the magnitude of needs and the adequacy of the humani-tarian response.
What is epidemiology?
Epidemiology can be defined as the study of the distribu-tion of human diseases, and of factors influencing their fre-quency. The Parisian taxi driver, however caring a familyman, is everything modern epidemiology tries not to be: hedemonstrates no sense of relative measures; he does notdistinguish between preventable and non-preventable
morbidity, or between fatal and non-fatal diseases; hemakes a claim of great distress based on no temporal com-parison; and, worse still, he draws his sample from anunlucky set of people who happen to surround him, andthen applies his findings to the general populace. The sub-discipline of epidemiology (and demography) that focuseson population mortality attempts to replace such subjec-tive impressions and semi-quantitative guesses withobjective, precise estimates of the human toll of an emer-gency and, if possible, to describe at least its proximatecauses.
For those who practice this science, recent years offermuch reason for encouragement. In response to severaldramatic setbacks, the largely unregulated humanitariansector has strengthened its capacity for quality andaccountability, with initiatives such as the Sphere Projectand the Active Learning Network for Accountability andPerformance in Humanitarian Action (ALNAP). At the heartof accountability is hard evidence of the appropriatenessand effectiveness of relief interventions. In many cases,only well-conducted epidemiological evaluations are capa-ble of furnishing this evidence: thus, the primacy of dataover hearsay seems to be taking a decisive hold. In partic-ular, there is a broad consensus that mortality must be theultimate measure of how an emergency is evolving.
But there is equally great cause for concern. Unlike chaosphysics, mortality epidemiology is a remarkably accessiblefield (as we hope to show in this paper). As such, mortalitydata are extremely liable to misinterpretation and manipu-lation. Many would argue that recent years have seen theincreasing use of relief as a tool for applying internationalpolitical pressure or improving the image of occupyingpowers among the local population. In a context where thedistinction between what is political and what is impartial-ly humanitarian is vague and often confused, scientificallyobjective mortality reports can easily clash with politicalexpectations. During the recent conflicts in Kosovo, Darfurand Iraq, contradictory versions of events, includingreports of civilian deaths, were offered by opposing sides,anti- and pro-war groups or their international backers.Though only partly heeded, proper epidemiological mor-tality studies conducted in all three contexts helped to dis-qualify at least one of these versions of events, and to rec-tify another. Even in Niger, a relatively peaceful country, thenutritional crisis of 2005 was apparently becoming a polit-ical tool.2 While the extent of the emergency was not yetfully clear as of August 2005, Niger’s president defendedhis view that there were no major problems by pointing outthat people on the street ‘looked well-fed’.
Our Parisian taxi driver might have found this conclusionflawless, but it bears no resemblance to evidence-basedneeds assessment. Our belief is that mortality data, prop-
1
Chapter 1
Introduction
Interpreting and using mortality data in humanitarian emergencies
erly collected, interpreted and used, have much to con-tribute to the appropriateness and effectiveness of human-itarian action in emergencies, and to advocacy on behalf ofpopulations in crises. Most actors involved in relief will oneday be confronted by such data, but the different ways inwhich this information can be collected, and their potentialpitfalls, are not yet common knowledge among non-epi-demiologists. This paper addresses some of these issues,in the conviction that greater awareness of the sciencebehind mortality figures will help to maximise their opera-tional relevance and use, whilst reducing the likelihood ofmisinterpretation and manipulation.
This paper is not intended to be a course on how to meas-ure mortality in emergencies, nor does it provide detailedderivations of the statistical theory underpinning this meas-urement. Nor does it present a systematic review of paststudies of mortality in emergencies. Where appropriate, werefer the interested reader to further, more in-depth sourcesof information.3 Rather, the paper is written from the stand-point of the end-user of mortality data. We present key indi-cators used to express these data, different options for howto measure mortality rates and suggestions for how toassess, interpret and use mortality reports. There is also adiscussion of the politics of mortality figures. The papercannot be exhaustive: its focus is on enabling readers tocritically interpret mortality study reports, and to under-stand how these are used (or misused) to formulate policy.The intended audience is therefore all humanitarian actors,policy-makers, the media and members of affected commu-nities, who may be called upon to comment on or make useof mortality studies, regardless of their technical back-ground. It should be noted here that epidemiology is anevolving science: new methods not covered in this papermay well be introduced in coming years.
Key concepts and terms
Mortality indicators, and specifically mortality rates, areexpressed and calculated in different ways. This section ismeant to provide readers with a common lexicon. We dis-cuss units of measurement, and mention other commonmortality indicators. These terms and concepts will then beused throughout the paper. A more extensive list of termsis contained in the Glossary (see pp. 35–36).
Mortality rates
In August 2005, a BBC report stated that, according to doc-tors, 15 children every week were dying from malnutritionin the Maradi region of Niger.4 While the death of any onechild from hunger is a horrible event, one can hardly be sat-isfied with this single figure. How many children live in theMaradi region? How many die every week usually, anddoes 15 constitute a significant increase? Apart from chil-dren dying from malnutrition, are others dying from condi-tions associated with it, like diarrhoea? Are they counted inthis figure? How were these deaths ascertained? Thisexample illustrates that an absolute number of deaths,taken in isolation, is very difficult to interpret. It becomes
much more meaningful when it is related to a clearly spec-ified population over a precise period of time, and thencompared to expected mortality patterns in that popula-tion when no crisis is occurring.
To do this, we usually present mortality in terms of a rate.The term ‘rate’ is (mis)used in many contexts; strictlyspeaking, it should only be applied to express the frequen-
cy with which events occur as time goes on (i.e. ratesshould always refer to a unit of time). A mortality rate (MR)therefore expresses the number of events (deaths) thatoccur in a population of known size that is at risk for thedeath event during a specific period of time (usually calledthe recall period). We speak of populations at risk becausemortality is measured in a clearly defined population (suchas ‘all displaced persons currently living in a camp withinGulu District, northern Uganda’). Being present within thatpopulation during the recall period (say ‘January to July2005’) defines one’s exposure to the risk of death, as far asthe survey is concerned.
There are three ways of expressing MRs: the first (deathsper person-time) is formal and more rigorous. The second(deaths per persons per time) is a more intuitive and, inmost cases, sufficiently accurate simplification, and wediscuss this first. The third is deaths that occur within apopulation by a certain age: indicators using this conceptare not often cited in emergencies (although they are by nomeans irrelevant), and are not discussed here.∗
The simplified expression of mortality rates. The simpli-fied expression of mortality rates (deaths per persons perunit time) is described in Box 1. This paper uses thismethod of expressing MRs wherever possible. It assumesthat each individual, with the exception of those who dieand those who are born, spends the entire recall periodwithin the population of interest, i.e. is present from thestart to the end. Given this assumption, what should beconsidered the population at risk during the period?Neither the population present at the beginning nor thatpresent at the end are satisfactory solutions, since not allwho were there at the start made it to the end (because ofdeaths during the period), and not all present at the endwere there throughout (because of births). As a compro-mise, we estimate a mid-period (or mid-point) population
by (i) taking the population at the end; (ii) adding one halfof the deaths during the period; and (iii) subtracting onehalf of the births, assuming information was collected onthese (if not, we simply take the population at the end andadd one half of the deaths).
2
* Infant and child mortality rates refer respectively to deaths under
one year of age and deaths under five years of age, out of 1,000 live
births during a specified year. The maternal mortality ratio is the
number of women dying from pregnancy-related causes out of
100,000 live births during a specified year. Methods to measure
these indicators are very different from those used to measure mor-
tality rates in emergencies. Maternal mortality ratios can, however,
reach very high levels (exceeding 1,000/100,000) in crisis-stricken
populations, in great part due to lack of emergency obstetric care.
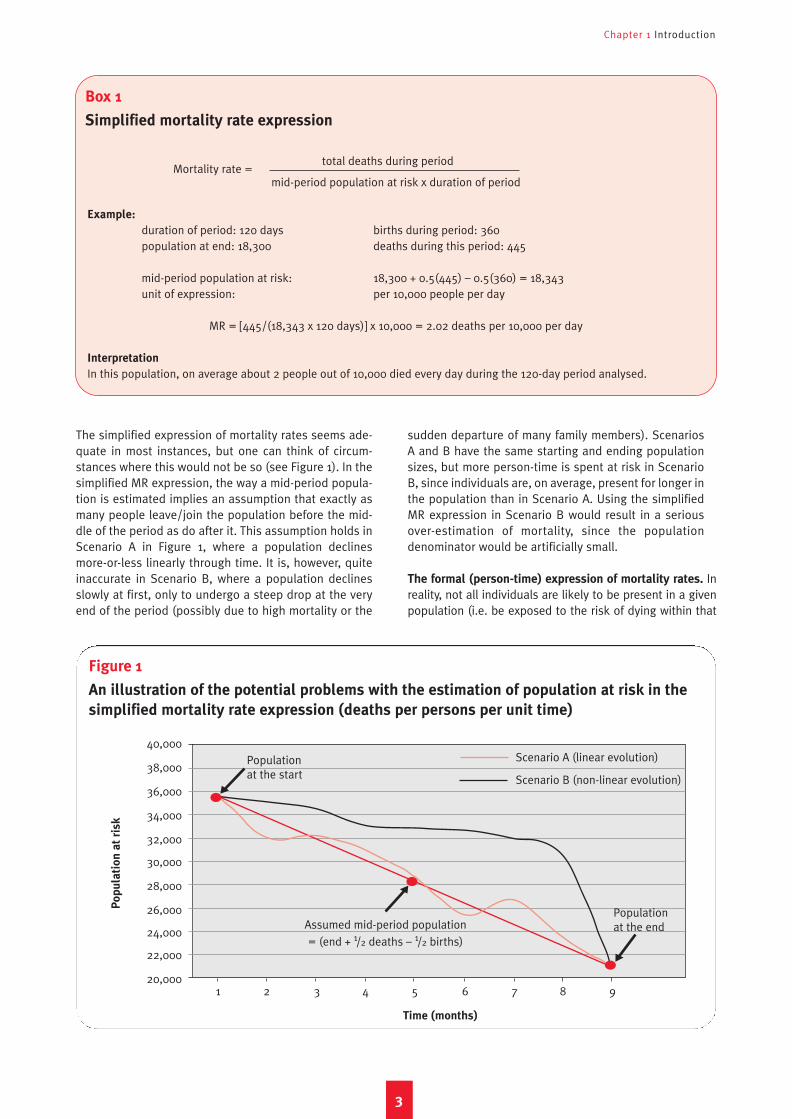
The simplified expression of mortality rates seems ade-quate in most instances, but one can think of circum-stances where this would not be so (see Figure 1). In thesimplified MR expression, the way a mid-period popula-tion is estimated implies an assumption that exactly asmany people leave/join the population before the mid-dle of the period as do after it. This assumption holds inScenario A in Figure 1, where a population declinesmore-or-less linearly through time. It is, however, quiteinaccurate in Scenario B, where a population declinesslowly at first, only to undergo a steep drop at the veryend of the period (possibly due to high mortality or the
sudden departure of many family members). ScenariosA and B have the same starting and ending populationsizes, but more person-time is spent at risk in ScenarioB, since individuals are, on average, present for longer inthe population than in Scenario A. Using the simplifiedMR expression in Scenario B would result in a seriousover-estimation of mortality, since the populationdenominator would be artificially small.
The formal (person-time) expression of mortality rates. Inreality, not all individuals are likely to be present in a givenpopulation (i.e. be exposed to the risk of dying within that
Chapter 1 Introduction
3
Box 1
Simplified mortality rate expression
Figure 1
An illustration of the potential problems with the estimation of population at risk in the
simplified mortality rate expression (deaths per persons per unit time)
Mortality rate =total deaths during period
mid-period population at risk x duration of period
Example:
duration of period: 120 days births during period: 360population at end: 18,300 deaths during this period: 445
mid-period population at risk: 18,300 + 0.5(445) – 0.5(360) = 18,343unit of expression: per 10,000 people per day
MR = [445/(18,343 x 120 days)] x 10,000 = 2.02 deaths per 10,000 per day
Interpretation
In this population, on average about 2 people out of 10,000 died every day during the 120-day period analysed.
Po
pu
lati
on
at
ris
k
Scenario A (linear evolution)
Scenario B (non-linear evolution)
Assumed mid-period population
= (end + 1/2 deaths – 1/2 births)
1 2 3 4 5 6 7 8 9
40,000
38,000
36,000
34,000
32,000
30,000
28,000
26,000
24,000
22,000
20,000
Time (months)
Population at the end
Population at the start
Interpreting and using mortality data in humanitarian emergencies
population) throughout the entire recall period: some ofthose present at the beginning will migrate away, die or dis-appear; others will join the population at some point afterthe start of the period, due to birth, immigration/further dis-placement influx or family reunification; yet others mightjoin the population after the start of the period and leave itbefore the end (for example babies who die soon after birth).Furthermore, certain events, like departures or deaths, maybe concentrated in a specific portion of the period, as wesaw above. In short, not all individuals spend an equalamount of time (or person-time) in the population. The for-mal expression of MRs takes this into account, and consistsof deaths per total person-time at risk spent by the popula-tion during the period of interest (for instance three deathsper 10,000 person-days). When total person-time is comput-ed, each individual counts in the denominator of the MRexpression only for the portion of the time period of interestthat he/she actually spent in the population studied (Box 2).
The two expressions (simplified and formal) are practicallyinterchangeable. It should be stressed that person-time MRand its simplified version express exactly the same quantity,and in most cases they are statistically indistinguishablefrom each other. The expression ‘deaths per person-days’ isequivalent to ‘deaths per persons per day’. Calculating per-son-time is, however, not just an academic exercise: thisapproach is, in fact, indispensable when the recall periodrefers more to a situation rather than a precise length of time– such as, for example, when we wish to distinguish the MR
during a refugee population’s stay in a host country campfrom the MR during their flight to the camp. Probably not allrefugees left and arrived at the same time. The recall periodis thus different for each individual, and working with per-son-time is the only feasible approach in this case (this isdiscussed in more depth in Chapter 3).
The above are considered crude mortality rates (CMR).*
They include all age groups and all causes of death.
Different units, same mathematics. Readers may find MRsexpressed in different units, such as deaths per 1,000 peo-ple per month (or per 1,000 person-months) and deathsper 1,000 people per year (or per 1,000 person-years). Inacute emergencies, however, it makes more sense to use ashort time interval, and the expression deaths per 10,000
per day is most commonly employed. As a reference, 1death per 10,000 per day = 3 deaths per 1,000 per month= 36 deaths per 1,000 per year.
Mortality rates in sub-groups or sub-periods. Mortalityrates can refer to sub-groups within the population (Table1), for example recently displaced refugees versus long-time residents, or certain age groups. Under-five mortality
rate, or U5MR, is the most commonly presented age-spe-cific MR, since it is generally indicative of the general stateof health of a population. In these cases, both the numera-tor and the denominator change (for example the numberof under-five deaths/population under five years). MR inspecific sub-periods can also be calculated, for individualmonths, during an armed incursion or in an epidemic, forexample. The implications of these sub-analyses are dis-cussed in Chapter 4.
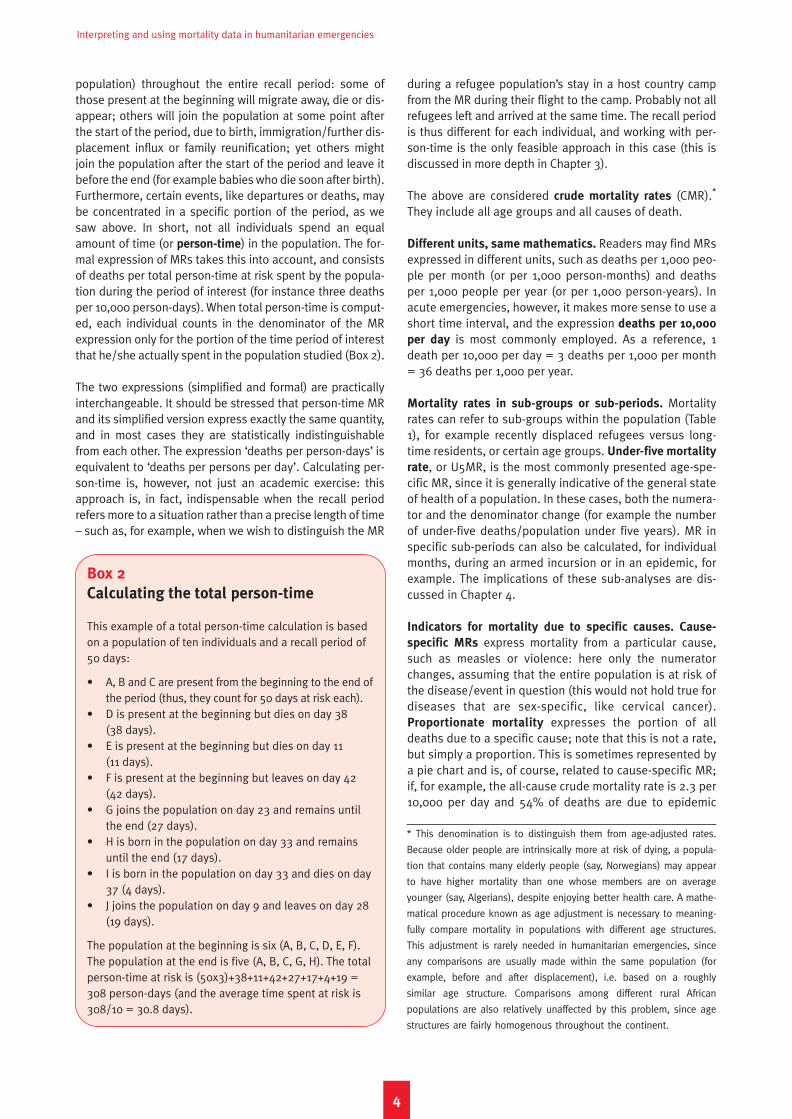
Indicators for mortality due to specific causes. Cause-
specific MRs express mortality from a particular cause,such as measles or violence: here only the numeratorchanges, assuming that the entire population is at risk ofthe disease/event in question (this would not hold true fordiseases that are sex-specific, like cervical cancer).Proportionate mortality expresses the portion of alldeaths due to a specific cause; note that this is not a rate,but simply a proportion. This is sometimes represented bya pie chart and is, of course, related to cause-specific MR;if, for example, the all-cause crude mortality rate is 2.3 per10,000 per day and 54% of deaths are due to epidemic
4
Box 2
Calculating the total person-time
This example of a total person-time calculation is basedon a population of ten individuals and a recall period of50 days:
• A, B and C are present from the beginning to the end ofthe period (thus, they count for 50 days at risk each).
• D is present at the beginning but dies on day 38 (38 days).
• E is present at the beginning but dies on day 11 (11 days).
• F is present at the beginning but leaves on day 42 (42 days).
• G joins the population on day 23 and remains untilthe end (27 days).
• H is born in the population on day 33 and remainsuntil the end (17 days).
• I is born in the population on day 33 and dies on day37 (4 days).
• J joins the population on day 9 and leaves on day 28(19 days).
The population at the beginning is six (A, B, C, D, E, F).The population at the end is five (A, B, C, G, H). The totalperson-time at risk is (50x3)+38+11+42+27+17+4+19 =308 person-days (and the average time spent at risk is308/10 = 30.8 days).
* This denomination is to distinguish them from age-adjusted rates.
Because older people are intrinsically more at risk of dying, a popula-
tion that contains many elderly people (say, Norwegians) may appear
to have higher mortality than one whose members are on average
younger (say, Algerians), despite enjoying better health care. A mathe-
matical procedure known as age adjustment is necessary to meaning-
fully compare mortality in populations with different age structures.
This adjustment is rarely needed in humanitarian emergencies, since
any comparisons are usually made within the same population (for
example, before and after displacement), i.e. based on a roughly
similar age structure. Comparisons among different rural African
populations are also relatively unaffected by this problem, since age
structures are fairly homogenous throughout the continent.
Chapter 1 Introduction
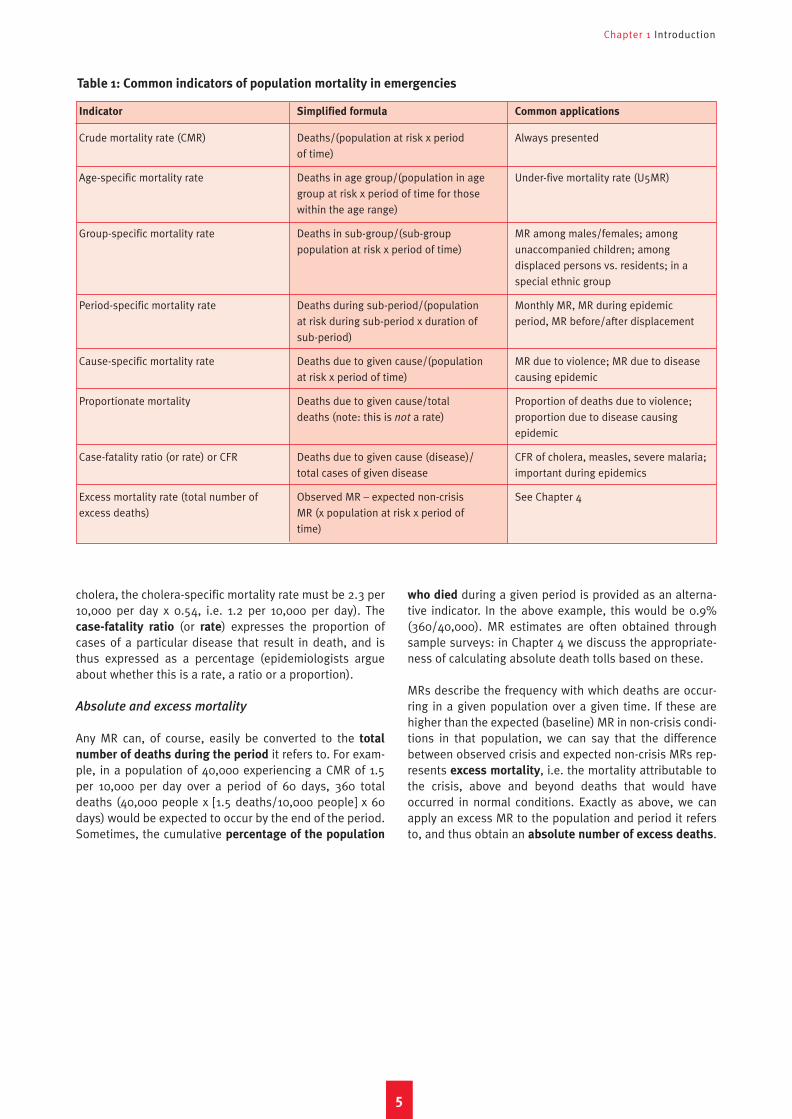
cholera, the cholera-specific mortality rate must be 2.3 per10,000 per day x 0.54, i.e. 1.2 per 10,000 per day). Thecase-fatality ratio (or rate) expresses the proportion ofcases of a particular disease that result in death, and isthus expressed as a percentage (epidemiologists argueabout whether this is a rate, a ratio or a proportion).
Absolute and excess mortality
Any MR can, of course, easily be converted to the total
number of deaths during the period it refers to. For exam-ple, in a population of 40,000 experiencing a CMR of 1.5per 10,000 per day over a period of 60 days, 360 totaldeaths (40,000 people x [1.5 deaths/10,000 people] x 60days) would be expected to occur by the end of the period.Sometimes, the cumulative percentage of the population
who died during a given period is provided as an alterna-tive indicator. In the above example, this would be 0.9%(360/40,000). MR estimates are often obtained throughsample surveys: in Chapter 4 we discuss the appropriate-ness of calculating absolute death tolls based on these.
MRs describe the frequency with which deaths are occur-ring in a given population over a given time. If these arehigher than the expected (baseline) MR in non-crisis condi-tions in that population, we can say that the differencebetween observed crisis and expected non-crisis MRs rep-resents excess mortality, i.e. the mortality attributable tothe crisis, above and beyond deaths that would haveoccurred in normal conditions. Exactly as above, we canapply an excess MR to the population and period it refersto, and thus obtain an absolute number of excess deaths.
5
Indicator
Crude mortality rate (CMR)
Age-specific mortality rate
Group-specific mortality rate
Period-specific mortality rate
Cause-specific mortality rate
Proportionate mortality
Case-fatality ratio (or rate) or CFR
Excess mortality rate (total number ofexcess deaths)
Simplified formula
Deaths/(population at risk x period of time)
Deaths in age group/(population in agegroup at risk x period of time for thosewithin the age range)
Deaths in sub-group/(sub-group population at risk x period of time)
Deaths during sub-period/(population at risk during sub-period x duration ofsub-period)
Deaths due to given cause/(populationat risk x period of time)
Deaths due to given cause/totaldeaths (note: this is not a rate)
Deaths due to given cause (disease)/total cases of given disease
Observed MR – expected non-crisisMR (x population at risk x period oftime)
Common applications
Always presented
Under-five mortality rate (U5MR)
MR among males/females; among unaccompanied children; among displaced persons vs. residents; in aspecial ethnic group
Monthly MR, MR during epidemic period, MR before/after displacement
MR due to violence; MR due to diseasecausing epidemic
Proportion of deaths due to violence;proportion due to disease causingepidemic
CFR of cholera, measles, severe malaria;important during epidemics
See Chapter 4
Table 1: Common indicators of population mortality in emergencies

6
Determining the nature and scale of the crisis
Crude and under-5 mortality rates are key indicators toevaluate the magnitude of a crisis, and a doubling of non-crisis (baseline) mortality is taken to define an emergencysituation. However, different views exist on whetherabsolute or context-specific thresholds should be used.Different typologies of crisis result in different mortalitypatterns. In humanitarian emergencies, how high the mor-tality rate is (scale) and what people die from (nature) arekey starting points for planning the size and programmaticfocus of the humanitarian response. Unfortunately, unlikethe assessment of food security, mortality epidemiologycan only detect the occurrence of a crisis after health con-ditions have deteriorated.
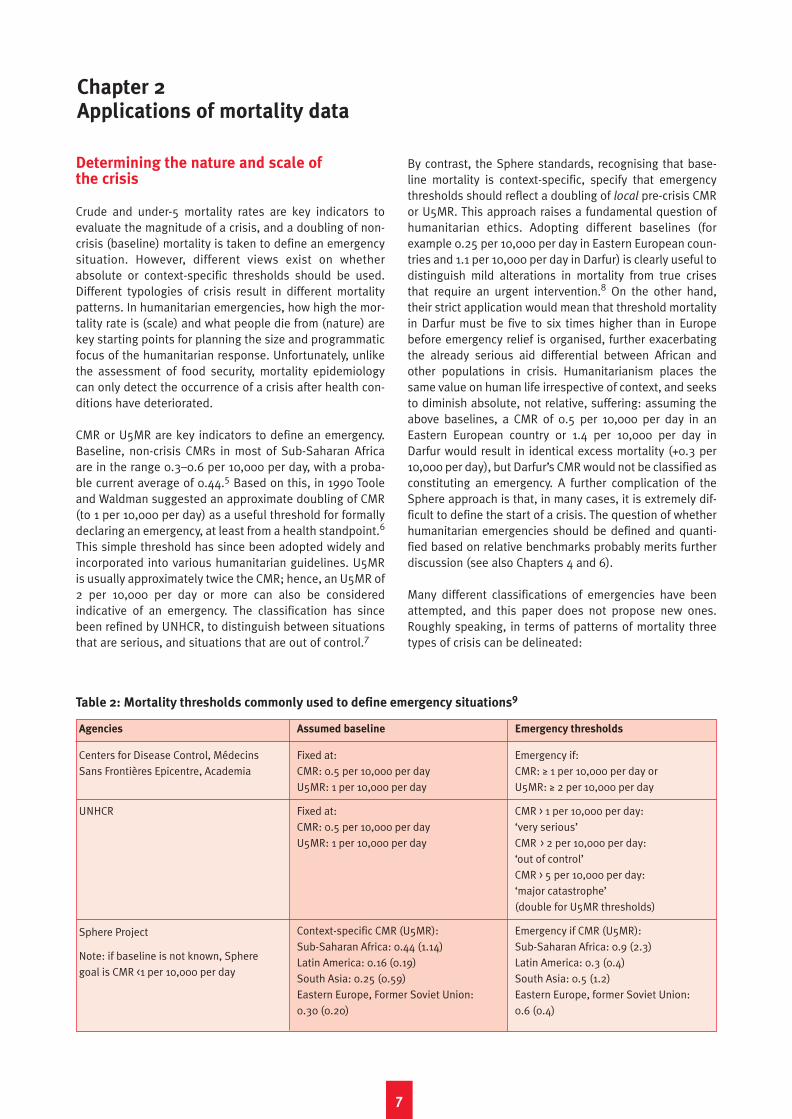
CMR or U5MR are key indicators to define an emergency.Baseline, non-crisis CMRs in most of Sub-Saharan Africaare in the range 0.3–0.6 per 10,000 per day, with a proba-ble current average of 0.44.5 Based on this, in 1990 Tooleand Waldman suggested an approximate doubling of CMR(to 1 per 10,000 per day) as a useful threshold for formallydeclaring an emergency, at least from a health standpoint.6
This simple threshold has since been adopted widely andincorporated into various humanitarian guidelines. U5MRis usually approximately twice the CMR; hence, an U5MR of2 per 10,000 per day or more can also be consideredindicative of an emergency. The classification has sincebeen refined by UNHCR, to distinguish between situationsthat are serious, and situations that are out of control.7
By contrast, the Sphere standards, recognising that base-line mortality is context-specific, specify that emergencythresholds should reflect a doubling of local pre-crisis CMRor U5MR. This approach raises a fundamental question ofhumanitarian ethics. Adopting different baselines (forexample 0.25 per 10,000 per day in Eastern European coun-tries and 1.1 per 10,000 per day in Darfur) is clearly useful todistinguish mild alterations in mortality from true crisesthat require an urgent intervention.8 On the other hand,their strict application would mean that threshold mortalityin Darfur must be five to six times higher than in Europebefore emergency relief is organised, further exacerbatingthe already serious aid differential between African andother populations in crisis. Humanitarianism places thesame value on human life irrespective of context, and seeksto diminish absolute, not relative, suffering: assuming theabove baselines, a CMR of 0.5 per 10,000 per day in anEastern European country or 1.4 per 10,000 per day inDarfur would result in identical excess mortality (+0.3 per10,000 per day), but Darfur’s CMR would not be classified asconstituting an emergency. A further complication of theSphere approach is that, in many cases, it is extremely dif-ficult to define the start of a crisis. The question of whetherhumanitarian emergencies should be defined and quanti-fied based on relative benchmarks probably merits furtherdiscussion (see also Chapters 4 and 6).
Many different classifications of emergencies have beenattempted, and this paper does not propose new ones.Roughly speaking, in terms of patterns of mortality threetypes of crisis can be delineated:
7
Chapter 2Applications of mortality data
Agencies
Centers for Disease Control, MédecinsSans Frontières Epicentre, Academia
UNHCR
Sphere Project
Note: if baseline is not known, Spheregoal is CMR <1 per 10,000 per day
Assumed baseline
Fixed at:CMR: 0.5 per 10,000 per dayU5MR: 1 per 10,000 per day
Fixed at:CMR: 0.5 per 10,000 per dayU5MR: 1 per 10,000 per day
Context-specific CMR (U5MR):Sub-Saharan Africa: 0.44 (1.14)Latin America: 0.16 (0.19)South Asia: 0.25 (0.59)Eastern Europe, Former Soviet Union:0.30 (0.20)
Emergency thresholds
Emergency if:CMR: ≥ 1 per 10,000 per day orU5MR: ≥ 2 per 10,000 per day
CMR > 1 per 10,000 per day: ‘very serious’CMR > 2 per 10,000 per day: ‘out of control’CMR > 5 per 10,000 per day: ‘major catastrophe’(double for U5MR thresholds)
Emergency if CMR (U5MR):Sub-Saharan Africa: 0.9 (2.3)Latin America: 0.3 (0.4)South Asia: 0.5 (1.2)Eastern Europe, former Soviet Union: 0.6 (0.4)
Table 2: Mortality thresholds commonly used to define emergency situations9
Interpreting and using mortality data in humanitarian emergencies
• Sudden natural disasters, in which most mortalityoccurs as a result of the mechanical force of the ele-ments or resulting injuries, and is therefore concentrat-ed in a period of hours or days; further peaks in mor-tality can, however, occur weeks after the disaster as aresult of hygiene- or flooding-related epidemics (forexample, cholera after floods in Mozambique in 2000).
• Acute emergencies due to large-scale armed conflictand/or rapid displacement; where these result in relo-cation of the population to camps, CMR is known to fallprogressively as a result of better protection and thearrival of humanitarian aid, although neglect of vacci-nation and disease control efforts can lead to devastat-ing epidemics of diarrhoeal diseases or measles.
• Slowly evolving, chronic or intermittent emergencies
in which mortality may increase slowly over the courseof months and years from near-normal levels, as aresult of the progressive breakdown of health infra-structures, loss of livelihoods, isolation from interna-tional aid and nutritional problems, or in which CMRcan display regular peaks as a result of poor harvests,displacement waves, low-level conflict or epidemicsaffecting a chronically vulnerable population.
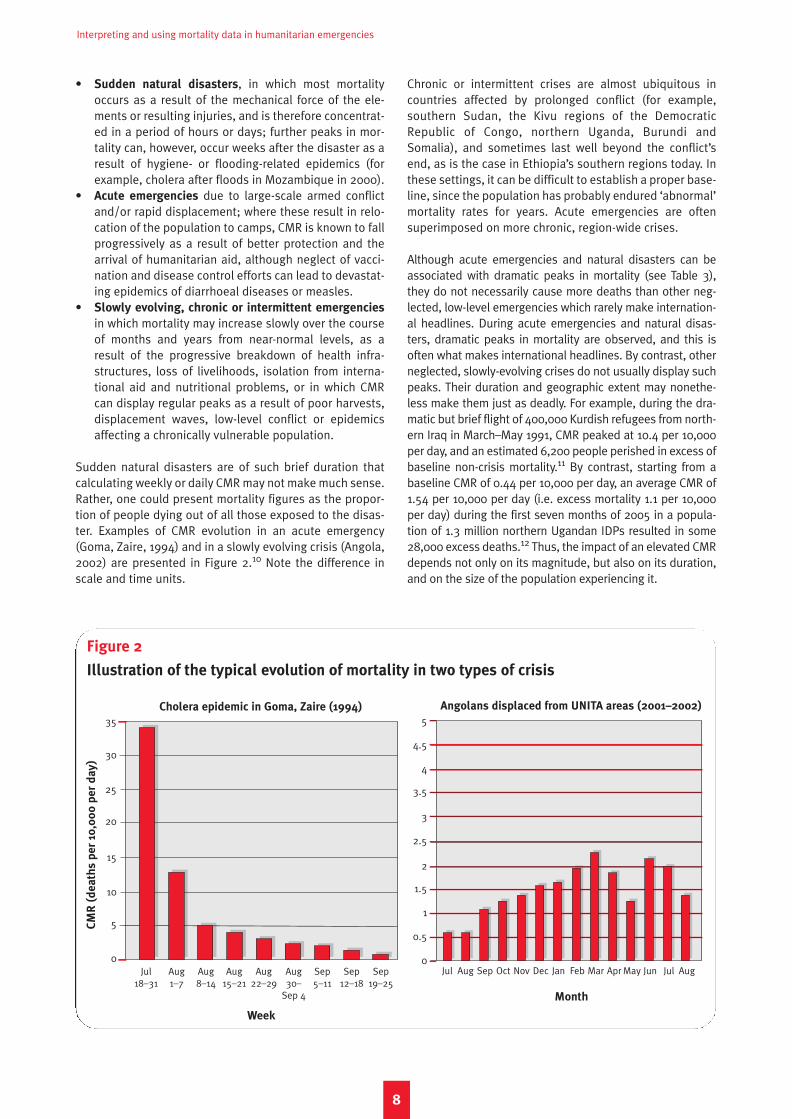
Sudden natural disasters are of such brief duration thatcalculating weekly or daily CMR may not make much sense.Rather, one could present mortality figures as the propor-tion of people dying out of all those exposed to the disas-ter. Examples of CMR evolution in an acute emergency(Goma, Zaire, 1994) and in a slowly evolving crisis (Angola,2002) are presented in Figure 2.10 Note the difference inscale and time units.
Chronic or intermittent crises are almost ubiquitous incountries affected by prolonged conflict (for example,southern Sudan, the Kivu regions of the DemocraticRepublic of Congo, northern Uganda, Burundi andSomalia), and sometimes last well beyond the conflict’send, as is the case in Ethiopia’s southern regions today. Inthese settings, it can be difficult to establish a proper base-line, since the population has probably endured ‘abnormal’mortality rates for years. Acute emergencies are oftensuperimposed on more chronic, region-wide crises.
Although acute emergencies and natural disasters can beassociated with dramatic peaks in mortality (see Table 3),they do not necessarily cause more deaths than other neg-lected, low-level emergencies which rarely make internation-al headlines. During acute emergencies and natural disas-ters, dramatic peaks in mortality are observed, and this isoften what makes international headlines. By contrast, otherneglected, slowly-evolving crises do not usually display suchpeaks. Their duration and geographic extent may nonethe-less make them just as deadly. For example, during the dra-matic but brief flight of 400,000 Kurdish refugees from north-ern Iraq in March–May 1991, CMR peaked at 10.4 per 10,000per day, and an estimated 6,200 people perished in excess ofbaseline non-crisis mortality.11 By contrast, starting from abaseline CMR of 0.44 per 10,000 per day, an average CMR of1.54 per 10,000 per day (i.e. excess mortality 1.1 per 10,000per day) during the first seven months of 2005 in a popula-tion of 1.3 million northern Ugandan IDPs resulted in some28,000 excess deaths.12 Thus, the impact of an elevated CMRdepends not only on its magnitude, but also on its duration,and on the size of the population experiencing it.
8
Figure 2
Illustration of the typical evolution of mortality in two types of crisis
CM
R (
de
ath
s p
er
10,0
00
pe
r d
ay
)
Jul Aug Aug Aug Aug Aug Sep Sep Sep 18–31 1–7 8–14 15–21 22–29 30– 5–11 12–18 19–25
Sep 4
35
30
25
20
15
10
5
0
Week
Angolans displaced from UNITA areas (2001–2002)Cholera epidemic in Goma, Zaire (1994)
Jul Aug Sep Oct Nov Dec Jan Feb Mar Apr May Jun Jul Aug
5
4.5
4
3.5
3
2.5
2
1.5
1
0.5
0
Month
Chapter 2 Applications of mortality data
Monitoring the effectiveness of humanitarian relief
Whether or not mortality is established at the outset of acrisis, follow-up mortality studies are crucial to monitortrends and evaluate relief interventions. Individual pro-grammes should probably not be judged on the basis ofmortality data. CMR and U5MR, however, are key impactindicators for the entire relief operation. In addition, cause-of-death data can provide invaluable insights as to whatservices need to be bolstered, and are a key quality-controlmeasure for health-related programmes.
Well-run relief programmes should be needs-driven,should strive to achieve certain standards and should pro-duce indicators for monitoring and evaluation.14 In addi-tion to reporting on indicators of process (default ratesfrom supplementary feeding programmes; percent ofbirths attended by a clinician) and output (coverage offood distributions; litres of water provided per person perday), more sophisticated, quality-assured programmesshould also be able to generate outcome data, such asmalnutrition prevalence or the incidence of diarrhoeal dis-eases. In an emergency, any concrete impact of the human-itarian intervention must be reflected in decreased mortal-ity (or alternatively the prevention of some excess mortali-ty). Indeed, the primary goal of any comprehensive human-itarian programme should be to reduce mortality rates toat least the pre-crisis level. Mortality data can and shouldbe used to evaluate the entire relief effort, viewed as anintegrated system.
On the other hand, CMR and U5MR alone do not usuallyhelp to clearly identify specific gaps in the humanitarianresponse. Impact in terms of lives saved can be difficult todetermine for individual and sector-specific programmes,unless the occurrence of a specific health event, for exam-ple a deadly measles outbreak, clearly points to specificweak areas in the humanitarian response, in this case vac-cination, as in Gode, Ethiopia, in 2000.15 For most causesof death, a reduction in mortality is the product of multi-sectoral work: for example, a decreased MR from acute res-piratory infections can be a result of improved shelter,
greater access to quality outpatient and inpatient care,better nutrition and higher income.
Similarly, based on causes of death it is difficult to estab-lish which programmes are responsible for the least impacton mortality: reductions in MR due to individual pro-grammes are relatively small and can be very difficult todemonstrate with any statistical precision. This means thatit would be hard to set MR reduction targets for any indi-vidual programme, since in many cases several agenciesare contributing to the same sector: one agency may be incharge of primary health care, for example, while anothermay operate in-patient facilities. The success of one pro-gramme usually depends on the success of related ones. Ingeneral, the more focused an intervention is on one dead-ly disease, such as vaccination to stop meningitis ormeasles outbreaks, the more easily success can be shownby mortality data.
Ideally, establishing a starting point MR (i.e. during the firstweeks of the crisis) will help in planning an adequateresponse and judging progress. For example, given a start-ing point CMR of 10 per 10,000 per day, decreasing this to0.5 per 10,000 per day versus 2 per 10,000 per day areobviously not equivalent tasks. If no such starting measureis available, mortality should still be monitored: the targetmust not change as a function of the problem’s magnitude– rather, it must always be to bring mortality down to pre-crisis levels as soon as possible. Let circumstances, suchas inaccessibility or insurmountable logistics problems,then temper our condemnation of any failure to meet thattarget.
In short, the measurement of mortality is an essential com-ponent of any effective public health intervention duringhealth emergencies, from advocacy and planning to pro-gramme monitoring. Conducting a relief programme with-out any evidence of the extent and causes of mortality, orhow these evolve over time, may be inefficient, not cost-effective and, ultimately, ethically questionable. Noresponsible physician would forget to check whether his orher patient was alive at the end of a procedure. The paral-lel with the health status of an entire population does not
9
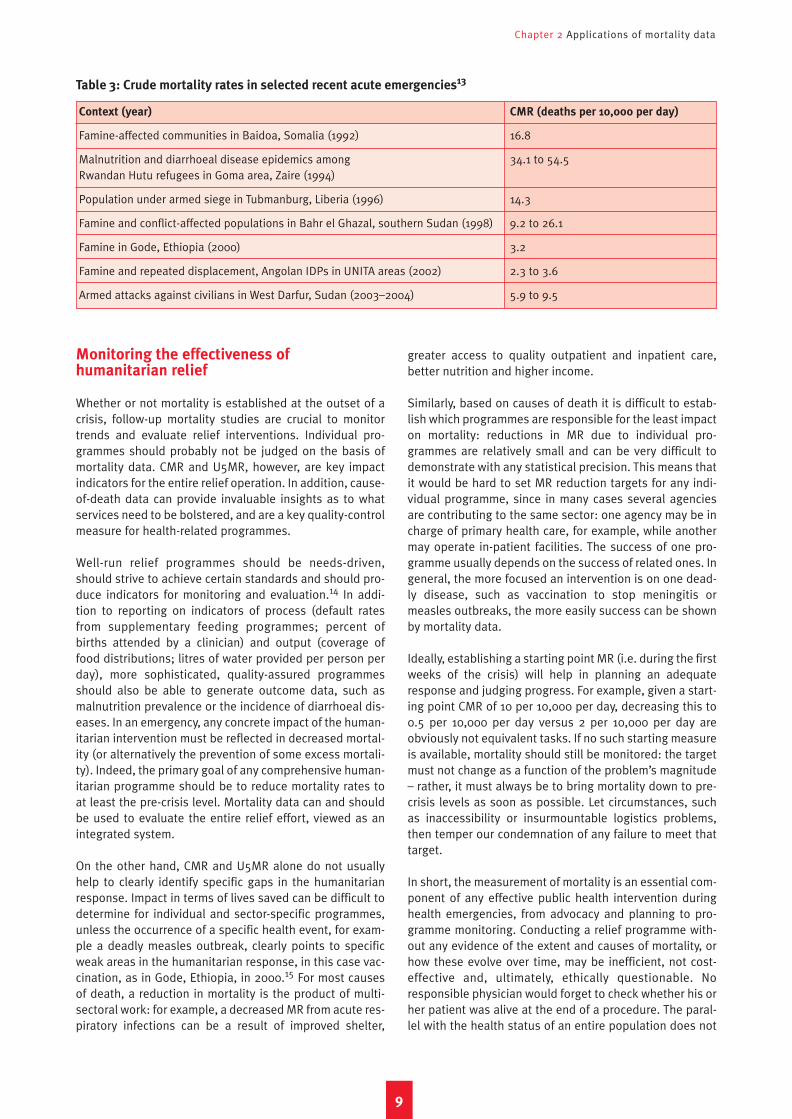
Context (year) CMR (deaths per 10,000 per day)
Famine-affected communities in Baidoa, Somalia (1992) 16.8
Malnutrition and diarrhoeal disease epidemics among 34.1 to 54.5Rwandan Hutu refugees in Goma area, Zaire (1994)
Population under armed siege in Tubmanburg, Liberia (1996) 14.3
Famine and conflict-affected populations in Bahr el Ghazal, southern Sudan (1998) 9.2 to 26.1
Famine in Gode, Ethiopia (2000) 3.2
Famine and repeated displacement, Angolan IDPs in UNITA areas (2002) 2.3 to 3.6
Armed attacks against civilians in West Darfur, Sudan (2003–2004) 5.9 to 9.5
Table 3: Crude mortality rates in selected recent acute emergencies13
Interpreting and using mortality data in humanitarian emergencies
10
seem too daring. Failure to collect data on mortality ratesand causes of death can be attributed to several factors,including the sub-division of health sector responsibilitiesamong several agencies, a lack of skills and training amonghealth staff, a reliance on incomplete surveillance mecha-nisms and a wish by belligerents or donor nations not tomake the data available for public scrutiny.
Advocating for action
Mortality studies have occasionally played a prominentrole in attracting aid and international political interest to acrisis. They can also serve to document the direct and indi-rect impact of war and population displacement.
The immediacy and alarming nature of mortality figurescan, on occasion, have a profound impact (for better orworse) on the international response to a crisis. In Baidoa,Somalia, a 1992 survey measured a CMR of 16.8 per 10,000per day, and estimated that 75% of under-fives had diedduring a seven-month period.16 These results were animportant contributing factor in the US administration’sdecision to send an intervention force.17 In the DRC,repeated country-wide surveys have put excess mortalitysince the start of the conflict in 1998 at 3.8 million.18
Publication of the first of these surveys in 2000, widelyreported in the international press, was associated with adoubling of humanitarian aid to DRC.19
On the other hand, a survey in Iraq put at 100,000 thedeath toll from violence since the end of the 2003 inva-sion, and suggested convincingly that the tactics beingused by Coalition forces had resulted in heavy civilian
casualties.20 Yet almost a year later no credible evidenceexisted that the occupying forces were doing any better atprotecting the lives of civilians, as required under theGeneva Conventions. In West and South Darfur, repeatedsurveys in 2004 highlighted widespread killing of civil-ians, yet as of August 2005 these actions continued.21 Innorthern Uganda, possibly the world’s most neglected cri-sis in 2005, repeated reports of high CMR have notencouraged international attention to that conflict, andfunding requests for relief for a displaced population of upto two million have gone largely unmet.22 A survey con-ducted in July 2005, almost 20 years after the start of con-flict, estimated that 1,000 excess deaths per week wereoccurring in the three most affected districts, belyingimpressions that the war was abating by showing a farhigher number of violent deaths and abductions thanreported in the media.23
At the very least, epidemiological documentation of pastmortality directly or indirectly due to violence and war canserve as a historical record for future generations, in thehope that accumulating overwhelming evidence on thepublic health impact of all armed conflict, however techno-logically sophisticated, will stimulate the peaceful resolu-tion of conflicts – as well as improving humanitarian prac-tice and fostering greater respect for humanitarian law.24
This chapter has described the different goals of mortalitystudies – crisis assessment, advocacy and impact monitor-ing. These are not necessarily irreconcilable among them-selves. They may, however, imply substantially differentchoices of methodology and analysis period, as discussedin the next chapter.
11
What is the objective?
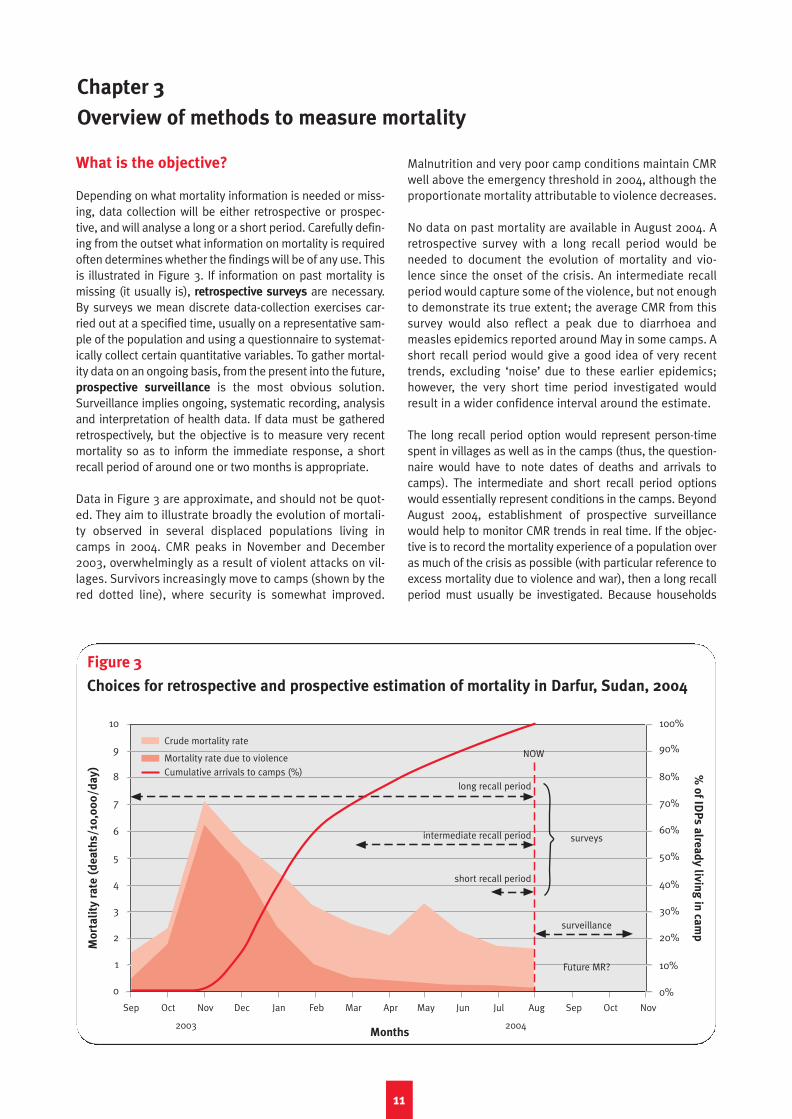
Depending on what mortality information is needed or miss-ing, data collection will be either retrospective or prospec-tive, and will analyse a long or a short period. Carefully defin-ing from the outset what information on mortality is requiredoften determines whether the findings will be of any use. Thisis illustrated in Figure 3. If information on past mortality ismissing (it usually is), retrospective surveys are necessary.By surveys we mean discrete data-collection exercises car-ried out at a specified time, usually on a representative sam-ple of the population and using a questionnaire to systemat-ically collect certain quantitative variables. To gather mortal-ity data on an ongoing basis, from the present into the future,prospective surveillance is the most obvious solution.Surveillance implies ongoing, systematic recording, analysisand interpretation of health data. If data must be gatheredretrospectively, but the objective is to measure very recentmortality so as to inform the immediate response, a shortrecall period of around one or two months is appropriate.
Data in Figure 3 are approximate, and should not be quot-ed. They aim to illustrate broadly the evolution of mortali-ty observed in several displaced populations living incamps in 2004. CMR peaks in November and December2003, overwhelmingly as a result of violent attacks on vil-lages. Survivors increasingly move to camps (shown by thered dotted line), where security is somewhat improved.
Malnutrition and very poor camp conditions maintain CMRwell above the emergency threshold in 2004, although theproportionate mortality attributable to violence decreases.
No data on past mortality are available in August 2004. Aretrospective survey with a long recall period would beneeded to document the evolution of mortality and vio-lence since the onset of the crisis. An intermediate recallperiod would capture some of the violence, but not enoughto demonstrate its true extent; the average CMR from thissurvey would also reflect a peak due to diarrhoea andmeasles epidemics reported around May in some camps. Ashort recall period would give a good idea of very recenttrends, excluding ‘noise’ due to these earlier epidemics;however, the very short time period investigated wouldresult in a wider confidence interval around the estimate.
The long recall period option would represent person-timespent in villages as well as in the camps (thus, the question-naire would have to note dates of deaths and arrivals tocamps). The intermediate and short recall period optionswould essentially represent conditions in the camps. BeyondAugust 2004, establishment of prospective surveillancewould help to monitor CMR trends in real time. If the objec-tive is to record the mortality experience of a population overas much of the crisis as possible (with particular reference toexcess mortality due to violence and war), then a long recallperiod must usually be investigated. Because households
Chapter 3
Overview of methods to measure mortality
Figure 3
Choices for retrospective and prospective estimation of mortality in Darfur, Sudan, 2004
10
9
8
7
6
5
4
3
2
1
0
100%
90%
80%
70%
60%
50%
40%
30%
20%
10%
0%
Months
Sep Oct Nov Dec Jan Feb Mar Apr May Jun Jul Aug Sep Oct Nov
2003 2004
long recall period
intermediate recall period
short recall period
Crude mortality rate
Mortality rate due to violenceCumulative arrivals to camps (%)
surveys
surveillance
Future MR?
NOW
Mo
rta
lity
ra
te (
de
ath
s/
10,0
00
/d
ay
) % o
f IDP
s a
lrea
dy
livin
g in
cam
p

Interpreting and using mortality data in humanitarian emergencies
can go through significant changes over many months of cri-sis (displacement, births and family reunifications, disap-pearances and departures), a relatively complex question-naire will be required, and the survey might have to distin-guish mortality according to whether it occurred before orafter important changes in households’ status, such as relo-cation to a camp. Thinking in terms of person-time will be cru-cial to estimate this.
The average MR from surveys with long recall periods willreflect a mixture of conditions, and may mask an undetectedor unquantifiable phenomenon, such as a measles epidem-ic, making it difficult to draw conclusions either about veryrecent mortality or about the overall impact of the crisis.Careful interviewing about when deaths occurred can partlyremedy this; however, breaking down the findings into sev-eral periods (for example months) will result in wider confi-dence intervals for each period (see Chapter 4), since lessperson-time is sampled than for the entire recall period.
The degree to which causes of death are investigated is alsoaffected by the survey objective. A survey designed to docu-ment past acts of war will try to classify the type of violentdeath (physical blow, bullet wound, bomb explosion). A sur-vey oriented more towards public health intervention willattempt to rank leading causes of death (measles, diar-rhoea) so as to highlight immediate public health priorities.Obviously, much depends on what information is alreadyavailable: for example, well-collected health centre informa-tion on proportionate mortality could already delineatetrends in causes of death; mortality surveys would add tothis by quantifying death tolls in the community.
Two key measurement issues
Here we discuss different types of bias (non-sampling error)that can affect the validity of mortality data, and explain howsample size and other factors affect the precision (samplingerror) of a mortality estimate (its confidence interval).
Epidemiology confronts two fundamental problems: bias,or systematic/non-sampling error; and imprecision, ornon-systematic/sampling error. The measurement of mor-tality in emergencies is heavily affected by both, mainlysince (i) objective information on deaths (such as centrallystored death certificates, or clearly marked graves) is usu-ally not available, with consequent reliance on oral report-ing by the family of the deceased; and (ii) populations areoften far too large to be surveyed exhaustively, makingsome form of sampling necessary.
About bias (non-sampling error)
Preventing bias means ensuring that the data generatedtruly reflect the situation in the population studied, and arenot distorted by flaws in the way the information is collect-ed. These flaws can usually not be corrected afterwards,and are to some extent always present. No serious mortal-ity report fails to acknowledge them, or to discuss theirlikely effect on the findings’ validity. Indeed, potential for
bias abounds in mortality epidemiology, and it is worth-while mentioning here a few common sources of this (notethat the denominations below are not all canonical epi-demiological terms):
• Household selection bias. If only a sample of house-holds is drawn from the population, is this sample trulyrepresentative of other households? Instances in whichthis is likely not to be the case include:– when the sample is not random, i.e. when not every
household in the population has an equal chance ofbeing included in the mortality study (perhaps onlythe most accessible communities are sampled dueto security concerns)
– when certain types of household are systematicallyleft out after being selected (perhaps no one is hometo provide information, and the surveyors make noattempt to trace or revisit absent household mem-bers; it may well be that unattended householdshave on average a different mortality experience).
• Household size reporting bias. Mortality surveys caneasily be misinterpreted by the population as registra-tion exercises which will lead to some relief goodsbeing distributed to them. This can lead to inflation oftrue household size and, because the denominator ofthe mortality expression becomes artificially large, toan under-estimation of the mortality rate.
• Event recall bias. This bias applies to retrospectivemortality studies only. It is postulated that, if the recallperiod that respondents are asked about is exception-ally long (more than one year), under-reporting ofdeaths, or erroneous reporting of their date, can occurdue to forgetfulness; alternatively, certain kinds ofdeath, such as violent ones, are remembered morevividly. These perceived constraints lead surveys tolimit the duration of the recall period, usually to nomore than one and a half years. The true risk of recallbias is, however, hard to gauge, probably varies widelybetween settings, and may be over-emphasised. Itseems reasonable to presume that, if families in indus-trialised countries can easily provide details about pastdeaths, people affected by humanitarian emergenciesin developing countries should be just as capable ofrecalling these events accurately, especially whenassisted by a calendar of locally significant events.
• Event reporting bias. Aside from recall, there may beseveral reasons why respondents (or interviewers – seeChapter 5) will tend to over- or under-report deaths. Ifthe household has strong links with an armed group, itmay under-report violent deaths of family membersbelonging to that group. In some cultures, neonataldeaths may be perceived differently from other deaths.There can also be over-reporting if respondents per-ceive that this will increase their chances of obtainingaid, or multiple reporting of the same death (two neigh-bouring households may be part of the same extendedfamily, and could both report an individual’s death astaking place within their household).
• Survival bias. If the survey is retrospective, the onlyhouseholds which can be interviewed are those for
12
Chapter 3 Overview of methods to measure mortality
whom at least one member survives to the time of thesurvey. Some households, however, may simply havedisappeared, either because all members died, orbecause the lone survivors, such as orphans, joined adifferent household. Because these extinguishedhouseholds cannot be interviewed, mortality is under-estimated. The extent of survival bias depends on fourfactors: size of households (small family nuclei aremore likely to disappear), duration of the recall period,mortality rate (the higher the rate, the greater the sur-vival bias), and clustering of the risk of death (for exam-ple if a missile hit a particular neighbourhood).
About imprecision (sampling error)
A mortality result may be satisfyingly unbiased, but disap-pointingly imprecise if it is derived from an inadequatesample. Imprecision refers to the degree of uncertainty(approximation) around the study estimate.
Sample-based surveys should all report a best (or point)estimate of mortality: 3.2 per 10,000 per day, for example.They should also report the degree of uncertainty associ-ated with this estimate, given in the form of a confidence
interval (CI, consisting of a lower and upper value, forexample 1.8 to 5.6 per 10,000 per day). Box 3 illustrateshow to interpret CIs mathematically.
The broader the CI, the greater the range of plausibleresults – that is, the less precise the estimate. This breadthis influenced by the following factors:
• The sample size. Intuition suggests that, if mortality in apopulation of 100,000 is being estimated, sampling onlyten households will yield very imprecise results, even ifthese ten households are drawn perfectly randomly fromthe population and provide very reliable information. Thesmaller the sample size, the broader the CI.
• The length of the recall period. Investigating a periodof 100 days will yield more precision than a ten-dayperiod: in the formal expression of mortality rate, thedenominator consists of person-time. In general, theshorter the period, the broader the CI.
• The extent of mortality itself. At higher MRs, with sampleand population size remaining the same, CIs will bebroader in absolute terms, but narrower in relative terms,i.e. as percent variation compared to the point estimate.
• The sampling design, i.e. how the sample is drawn.Cluster surveys pay for simplicity with reduced precisionbecause of a design (cluster) effect (this is discussedbelow). Cluster designs thus result in broader CIs.
These effects are illustrated in Table 4 (p. 15) for hypothet-ical values of the above factors.
Retrospective surveys
Because populations are often too large to be studiedexhaustively, surveys almost always try to estimate mor-tality based on a sample. Different options exist for draw-
13
Box 3
Confidence intervals based on an
example from Darfur, 200425
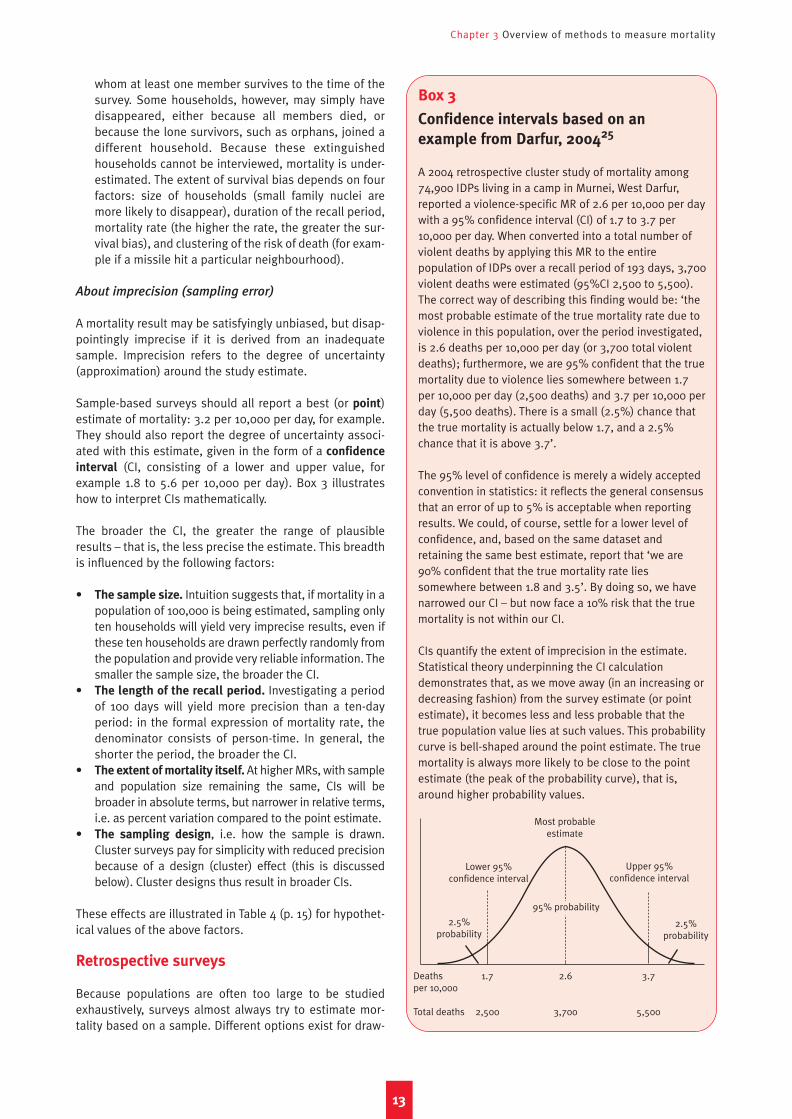
A 2004 retrospective cluster study of mortality among74,900 IDPs living in a camp in Murnei, West Darfur,reported a violence-specific MR of 2.6 per 10,000 per daywith a 95% confidence interval (CI) of 1.7 to 3.7 per10,000 per day. When converted into a total number ofviolent deaths by applying this MR to the entirepopulation of IDPs over a recall period of 193 days, 3,700violent deaths were estimated (95%CI 2,500 to 5,500).The correct way of describing this finding would be: ‘themost probable estimate of the true mortality rate due toviolence in this population, over the period investigated,is 2.6 deaths per 10,000 per day (or 3,700 total violentdeaths); furthermore, we are 95% confident that the truemortality due to violence lies somewhere between 1.7per 10,000 per day (2,500 deaths) and 3.7 per 10,000 perday (5,500 deaths). There is a small (2.5%) chance thatthe true mortality is actually below 1.7, and a 2.5%chance that it is above 3.7’.
The 95% level of confidence is merely a widely acceptedconvention in statistics: it reflects the general consensusthat an error of up to 5% is acceptable when reportingresults. We could, of course, settle for a lower level ofconfidence, and, based on the same dataset andretaining the same best estimate, report that ‘we are90% confident that the true mortality rate liessomewhere between 1.8 and 3.5’. By doing so, we havenarrowed our CI – but now face a 10% risk that the truemortality is not within our CI.
CIs quantify the extent of imprecision in the estimate.Statistical theory underpinning the CI calculationdemonstrates that, as we move away (in an increasing ordecreasing fashion) from the survey estimate (or pointestimate), it becomes less and less probable that thetrue population value lies at such values. This probabilitycurve is bell-shaped around the point estimate. The truemortality is always more likely to be close to the pointestimate (the peak of the probability curve), that is,around higher probability values.
Deaths 1.7 2.6 3.7per 10,000
Total deaths 2,500 3,700 5,500
2.5%probability
2.5%probability
Most probableestimate
Lower 95%confidence interval
Upper 95%confidence interval
95% probability
Interpreting and using mortality data in humanitarian emergencies
ing a representative (that is, unbiased) sample, but clustersampling is the most used because of feasibility issues. Itdoes, however, have important limitations. Apart fromsampling designs, surveys rely on well-constructed ques-tionnaires: the current and past household census meth-ods are two approaches to gathering mortality data forindividual households.
Sampling methods
Assuming that the population cannot be surveyed exhaus-tively, and once the required sample size is established,the challenge becomes how to select households to besampled so that they are representative of the populationbeing studied. There are three established methods fordoing this:
• Simple random sampling. This method requires a list-ing (sampling frame) of all households in the commu-nity, and some unique identification for each, such as anumber. Households are chosen by drawing randomnumbers. In practice such a listing is almost neveravailable or very incomplete: therefore, this samplingmethod is rarely feasible.
• Systematic random sampling. This method does notrely on any listing, but does require that households begrouped in some identifiable way, such as in villages orcamps, and that the total number of households becounted. Only the first household is drawn entirely atrandom; subsequently, every nth household in thesequence is selected based on the required sampling
step (equal to the total number of households dividedby the required sample size). In addition to geographi-cally distinct settlements, this method can occasionallybe applied where households are taking refuge in pub-lic buildings, and can thus rapidly be counted, as in a2003 survey in northern Uganda.26
• Cluster sampling. By far the most frequently usedmethod, cluster sampling is a simple way to draw a rep-resentative sample even where (as in most circum-stances) there is neither a listing nor a known totalnumber of households (that is, no individual householdsampling frame), and households are arranged inchaotic patterns. Clusters are groups of neighbouringhouseholds (usually 30 or more) out of which only thefirst is chosen at random, and the remainder by prox-imity, usually by picking the household closest to theone just surveyed (see Figure 4). Cluster sampling sim-ply requires knowledge of administrative or geographicdivisions within the population (districts; villages; sec-tors of a camp), and of their population size (in fact,only a measure of the relative size of each sub-divisionis truly necessary). The more populous the sub-divi-sion, the more clusters it is allocated. The total numberof clusters varies depending on the desired samplesize, but should never be lower than 25, below whichstatistical theories underpinning the estimation start tobreak down (this is intuitive: basing one’s estimate ona certain number of clusters, say 30 or 40, does ensurethat a reasonable range of situations is sampled,
whereas if only three or four clusters were picked, itwould be unlikely that these represent the full diversityof mortality experiences within the population).27
Among these methods, cluster sampling is the most appro-priate in the field. However, it suffers from two major draw-backs:
• A mortality estimate is provided for the entire popula-tion, but geographic sub-divisions within this popula-tion cannot be studied (that is, no estimates can begenerated for, say, individual districts or camp sectors;this will be discussed in the next section) unless a dis-tinct sample of 30 or more clusters is selected for allthe sub-divisions.
• Precision is lower than with a random or systematicsurvey of similar sample size. Because of their proxim-ity, households belonging to each cluster are likely toresemble each other much more than if the householdswere selected entirely at random in the population.There is, therefore, a loss in sampling variability (orrather, excessive homogeneity within clusters). Thisphenomenon is known as the design effect (or clustereffect), and results in wider CIs around the estimate (asshown in Table 4). Anticipating this problem, clustersurveys usually assume a design effect of 2, and adjusttheir sample size accordingly (a design effect of 2results in a doubling of sample size). Mortality causesthat make households within clusters more homoge-neous (and, conversely, increase heterogeneity amongclusters) are responsible for high design effects: in sur-veys conducted in West Darfur, design effects up to 11.3were noted, largely attributable to the fact that vio-lence, the dominant cause of death, had affectedhouseholds in some clusters far more than others.28
In practice, 30 clusters (and occasionally more) of at least30 households (so 900 households or more) are sampled.Increasing the number of clusters is statistically preferableto increasing the number of households per cluster (lessdesign effect, and so improved precision). On the otherhand, one advantage of cluster sampling is that it enablesrapid household selection while limiting the movement ofsurvey teams to a few random points (the starting points ofeach cluster), which can be very important when time,logistics and/or security concerns are paramount: in thisrespect, varying the number of households per cluster willbe more advantageous. In summary, a 50 cluster x 30households/cluster survey will be more precise, whereas a30 x 50 survey may be more feasible.
It should be noted that the above cluster method impliespopulation-proportional sampling, that is, areas withgreater population are allocated more clusters. Spatial sam-
pling, whereby clusters are distributed proportionally to sur-face area, can partially be applied to mortality surveys (forexample, a Global Positioning System can be used to selectthe first household in a cluster). The spatial approach poten-tially suffers from a rural bias, in that people or settlementswith more space are more likely to be sampled.
14
Chapter 3 Overview of methods to measure mortality
1155
Table 4: 95% confidence intervals (imprecision) of crude or under-5 mortality rate estimates according to
different scenarios
Sample size: 30 clusters x 30 households (4,500 people, 900 under-5s)
Recall period: 30 days Recall period: 180 days
Design effect: 1.0 Design effect: 2.0 Design effect: 1.0 Design effect: 2.0(i.e. none) (i.e. none)
CMR: 2.0 1.4–3.0 1.1–3.5 1.7–2.3 1.6–2.5CMR: 4.0 3.1–5.3 2.7–5.9 3.6–4.5 3.4–4.7U5MR: 2.0 0.7–4.6 0.4–6.6 1.4–2.9 1.2–3.3U5MR: 4.0 2.2–7.6 1.6–9.8 3.1–5.2 2.8–5.8
Sample size: 60 clusters x 30 households (9,000 people, 1,800 under-5s)
Recall period: 30 days Recall period: 180 days
Design effect: 1.0 Design effect: 2.0 Design effect: 1.0 Design effect: 2.0(i.e. none) (i.e. none)
CMR: 2.0 1.5–2.6 1.4–3.0 1.8–2.2 1.7–2.3CMR: 4.0 3.3–4.9 3.1–5.3 3.8–4.5 3.7–4.6U5MR: 2.0 1.1–3.8 0.8–4.9 1.5–2.6 1.4–2.8U5MR: 4.0 2.6–6.3 2.2–7.6 3.3–4.8 3.1–5.2
Assumptions: Five people/household, under-5 children = 20% of population. Ranges shown in each cell are lower andupper bounds of the 95%CI resulting from alternative values of CMR or U5MR (4.0 versus 2.0), design effect (2.0 versusnone), recall period (180 versus 30 days) and sample size (30 clusters x 30 households or 60 clusters x 30 households).
Figure 4
Cluster sampling design in a camp
Each square corresponds to a household, and red lines denote borders of sectors. More clusters (shown asgroups of red households) are likely to be drawn in large, populous sectors than in smaller ones.
In practice, the vast majority of mortality surveys are nest-ed within classic 30 x 30 cluster nutritional assessments.The mortality questionnaire usually comes second to theanthropometric measurement of under-five children, andmay be complemented by other questions on measles vac-cination, food consumption, access to services and posses-sion of essential non-food items. While coupling nutritionaland mortality assessments may sometimes be necessary(or even an opportunity not to be missed when access to asite is very precarious), the limitations of this approach aresignificant. First, it discourages any rigorous examination ofactual sample size requirements (because nutritional sur-veys usually include 900 children, mortality is also meas-ured on 900 households). Second, it complicates the use ofthe past household census method (see below), whichrequires more time per interview. Third, it probably resultsin lower-quality interviews. Fourth, survey teams may notgather mortality information from households in which nochildren eligible for the nutritional assessment are found;because of this mistake, a 2005 district-wide nutrition sur-vey in northern Uganda reported apparently normal CMRand U5MR, contradicting a simultaneous survey in thesame district which focused on mortality and showed veryhigh mortality rates.29 Fifth, crucial mortality findings maybe lost in a myriad of other data on malnutrition, vaccina-tion and access to services. For these reasons, mortalitysurveys should, whenever possible, be carried out inde-pendently of other assessments. Often this may not be fea-sible, as agencies may not wish to forego the opportunity togather other precious information. While this is under-standable, it should be clear to all involved in the planningof a survey that there is no good shortcut to measuringmortality properly: it requires proper interviewer training,significant space in a questionnaire, exhaustive question-ing of the household and careful data analysis.
Data collection
Apart from an appropriate sampling design, the key ele-ments of a well-conducted mortality survey are:
• A carefully designed questionnaire. This should bestandardised, to contain very specific questions thatlimit the subjectivity of individual interviewers, trans-lated into the local language, back-translated so as toverify the reliability of the translation and pre-tested ona small group of households before starting the surveyin earnest (this pre-testing provides a chance to adjustthe questionnaire). Having fewer questions in the sur-vey tends to result in higher-quality information.
• A calendar of locally recognisable events that will helprespondents to accurately recall the month or approxi-mate period when certain events, such as death or dis-placement, actually occurred; the beginning of therecall period should always be set at a very easily iden-tifiable date, such as Christmas, New Year, the end ofRamadan, a major climactic event (in Angola, a solareclipse was used) or political occurrence (in Angola,the death of rebel leader Jonas Savimbi).
• Clear criteria for classifying the causes (see below) and
circumstances of death: information on these mayinclude location (in the community of origin, in flight, inthe camp; alternatively, at home versus in a healthfacility, which provides a measure of health service cov-erage), and date.
• Unambiguous definitions to aid in coding other possi-ble questionnaire responses, such as what differenti-ates spontaneous departure from the household fromdisappearance (for example, based on whether thehousehold has any news of the absent person).
There are two established questionnaire designs for col-lecting information on household mortality during therecall period of interest.30 These are described below.
• Past household census. The first step of the mortalityinterview is to list all household members (by age andgender) who were present at the beginning of the recallperiod, and establish which of these original membersare still present in the household on the survey day.Any additional members present now but not at thebeginning are identified, and the approximate date onwhich they joined the household is noted. The fate oforiginal members who are no longer present is thenestablished: they may have died, disappeared or sim-ply moved away. The date and/or location of theseevents is also noted, along with any other supplemen-tary information, such as the cause and circumstancesof death. Finally, the interviewer tries to learn aboutindividuals who came into the household after the startof the period but left before the survey date, forinstance children who were born and then died. Theend result of the past household census methodshould be an accurate reconstruction of each house-hold’s demographic evolution from the beginning tothe end of the recall period, including deaths and otherleaving/joining events, and when/where theseoccurred. Mortality is defined as deaths per person-time at risk during the recall period, namely using theformal expression of MRs (see Chapter 1).
• Current household census. In this simplified method,surveyors first establish the composition of the house-hold on the day of the survey. They then ask about anybirths or deaths occurring since the beginning of therecall period. They may also ask about other leaving orjoining events, such as disappearances. In so doingthey obtain sufficient information on the numerator ofthe mortality expression (deaths), but may miss someof the changes in the size and composition of house-holds, that is the denominator (population at risk). Thismethod is less applicable in settings where householdsare frequently breaking apart. Mortality is usually cal-culated in these surveys using the simplified MRexpression (see Chapter 1).
The current household census method makes for shorterinterview times, provides for a relatively simple analysis andis probably valid when the recall period is short (for periodsduring which no major demographic changes, aside frommortality, are expected to have occurred). It assumes that
1166
Interpreting and using mortality data in humanitarian emergencies
Chapter 3 Overview of methods to measure mortality
1177
inward migration to the sample households roughly equalsdepartures from those households. The past household cen-sus method is far more rigorous, as it allows surveyors tomore clearly identify missing household members (by virtueof the cross-checking logic of the questionnaire), and esti-mate very precisely the person-time denominator. It is indis-pensable when the recall period is long and the populationhas a complex history of displacement and separation. Forexample, in 1996 a group of Rwandan Hutu refugees living inZaire were chased out of their camps and pursued for hun-dreds of miles during their westward flight by Zairean pro-government forces, who mounted regular attacks. Later thatyear, remnants of this group turned up as far afield as theRepublic of Congo. A survey based on past household cen-sus was able (and indeed necessary) to reconstruct theirappalling experience (see Figure 5).
A third method for obtaining mortality data, known as‘children ever born’ or ‘previous birth history’, is used toestimate infant and child mortality in the context of nation-al health surveys, such as UNICEF’s Multiple IndicatorCluster Surveys. It has been suggested for emergencies.32
Mothers are asked about all the children they have everhad, and the fate of each child born within the recall peri-od of interest is noted, yielding infant or under-five deathrates. Unfortunately, this method does not captureorphans, who probably have a far higher risk of mortality,and is not adapted for settings where the survey comeslate with respect to the crisis onset, and significant under-five mortality has already occurred. The method has beenshown to grossly under-estimate under-five mortality.33
Whatever the interviewing method used, establishingcauses of death (with the exception of violence) can be
challenging, and no clear guidelines on this exist for fieldsurveys. An in-depth interviewing procedure of next of kin,known as ‘verbal autopsy’, is used in more sophisticatedresearch projects, for example where researchers areattempting to establish the impact of certain interventionson a particular disease, such as the effect of impregnatedbed nets on malaria.34 The verbal autopsy technique, how-ever, requires a lot of training and some medical knowl-edge; it is also very protracted, and thus not feasible inhumanitarian emergencies. In the absence of alternatives,some authors recommend only classifying causes of deathfor which unambiguous, local terms are known.35 Usually,most populations will recognise conditions such asmeasles, neonatal tetanus or diarrhoea, and will have localwords to describe them. The two manifestations of severemalnutrition, marasmus (wasting) and kwashiorkor (oede-ma), may also be recognisable (in Angola, respondentsreferred to this as anemia). This is not the case for othercommon diseases such as acute respiratory infection ormalaria, although anthropological research has identifiedterms that correspond well with a cerebral malaria diagno-sis, such as degedege in Tanzania and soumaya in Mali.
The ethics of sensitive data collection
Surveys are increasingly invoked to document past abusesof human rights and humanitarian law.36 Retrospectivemortality surveys are not thought to require approval froma research ethics review board. They do, however, requireat least verbal consent from respondents, who must beadequately informed of the intended use to which the sur-vey will be put. Respondents may experience deep stresswhilst recounting their experiences: they must thereforebe made aware that they can refuse to answer any ques-
Figure 5
Evolution of a sample population of Rwandan refugees, September 1996–July 1997,
reconstructed by the past household census method31
September 1996
July 1997
1,857 disappeared
34 repatriated
33 returned spontaneously
3,121 Rwandan refugees present in eastern Zaire camp
530 refugees made it to Ndjoundou,
Republic of Congo
16 refugees present in nearby Republic of
Congo camps
615 killed
24 died of disease
12 died of accidents
Interpreting and using mortality data in humanitarian emergencies
tions. Finally, they must be assured of confidentiality, andtheir names should never be recorded for survey purposes.In general, all data on violence must be treated with theutmost care, from collection to publication. Furthermore,semi-public interviews by rapidly trained surveyors are notan acceptable vehicle for gathering information on eventssuch as rape or torture, which may cause profound mentaltrauma and social stigma in their survivors. Nevertheless,rape in particular has been cited as a systematic, purpose-ful war crime, and it seems important to quantify its fullextent more rigorously than is possible through collatingsporadic reports from health facilities, which probablyvastly under-estimate the true burden.37 To do this, exist-ing methods from industrialised countries may have to beadapted for emergency settings (a full discussion of theepidemiology of sexual violence is beyond the scope ofthis paper). Care must also be taken to ensure that surveyteams and their sponsoring agencies do not face intolera-ble security risks as a result of such studies.
How many resources are necessary for a survey?
Mortality surveys are intense, full-time, but brief efforts.They should only be led by experienced people, preferablywith epidemiology and statistics training, and backed upby a senior scientist for questions on design, questionnairebuilding and analysis. Teams of full-time, literate surveyorsare needed, preferably able to converse in local languagesand the language of the survey leader, along with ade-quate transport and logistics back-up (food, communica-tions devices, stationery and, preferably, a computer). Thenumber of teams often determines the duration of the sur-vey (one team is usually made up of two people, and cancomplete between one and two clusters per day). On theother hand, limiting the number of teams probably ensuresbetter trained teams, and better monitoring. Execution ofthe survey, including data entry, analysis and reporting,can take between one week and one month.
Prospective (real-time) surveillance
Mortality surveillance systems require teams of trainedhome visitors who record deaths as they occur in popula-tions of known size. This approach should always be con-sidered, as it enables real-time monitoring of mortalitytrends, facilitating a quick reaction. It does, however,require ongoing supervision.
Surveillance of mortality implies active detection of alldeaths occurring in the community, not just in health struc-tures. To this end, teams of home visitors need to be organ-ised, each of whom is assigned to a specific sector or vil-lage, and tasked to visit each household in his/her catch-ment area on a regular basis (every day or once a week) soas to inquire about any deaths, as well as to regularlyupdate the total population size of the area, thereby pro-viding a reliable denominator for the MR calculation. Insome cases, local residents can be trained to record alldeaths in their community. Methods to estimate popula-tion size accurately (and their limitations) are beyond the
scope of this paper, but the importance of working withreliable population figures should not be underestimatedwhen implementing surveillance systems. Rough esti-mates, such as from food distribution data, may be rea-sonable to start with, but should as soon as possible bereplaced by figures obtained either though a validated esti-mation and mapping exercise, or, better still, a full (andunbiased) census and registration. Partly because of this,surveillance requires a considerable number of home visi-tors – at least one per 1,000 people.38
The analysis of surveillance data is relatively straightforwardand can be performed by anyone armed with a pencil. Forexample, if at the end of the week a home visitor reports fourdeaths in a sector of 1,540 people, the CMR must be 4/1,540x 10,000/7 days = 3.7 per 10,000 per day. For surveillance tomake any sense in an emergency, such analysis must beweekly. This provides an opportunity to observe trends inreal-time, and mount a rapid response. It should be notedthat, especially if small sub-populations such as camp sec-tors are under observation, some apparent weekly fluctua-tions may simply be a result of chance: in the above example,one death would yield a CMR less than 1 per 10,000 per day,whereas with two the emergency threshold would becrossed. Similarly, if population estimates are updatedupwards or downwards, MR will appear to shift suddenly,while actual mortality may have remained unchanged.
Generally, the presence of an active, prospective surveil-lance system, coupled with other crucial community healthactivities such as nutritional screening, referral of severecases and health information, is a sign of programmaticquality, and of a proactive rather than reactive approach tohumanitarian relief. Epidemiology is often employed whenepidemics strike or an unexplained deterioration in healthstatus occurs, but this is hardly good timing: the primaryuse of epidemiology in emergencies should be to preventand detect health problems. Mortality surveillance is,therefore, highly advisable from the very onset of anyhumanitarian intervention.
Surveys and surveillance
Surveys and surveillance are by no means mutually exclu-sive, but could rather be seen as complementary. Their rela-tive strengths and weaknesses are listed in Table 5.Surveillance enables real-time monitoring of mortalitytrends, and thus a quicker reaction. However, it also requiressome regular epidemiological supervision, and its qualitymay not be sustainable over many months. Furthermore, it isappropriate mostly for camp-dwelling or regimented popu-lations. Surveys can generate very reliable data, but do notreflect trends in sufficient detail. On the other hand, they canbe adapted to almost any setting, however remote and ardu-ous, and constitute a one-time effort.
Rapid convenience surveys
In order to obtain results rapidly and with minimal effort,surveys are sometimes carried out without a proper sam-
1188
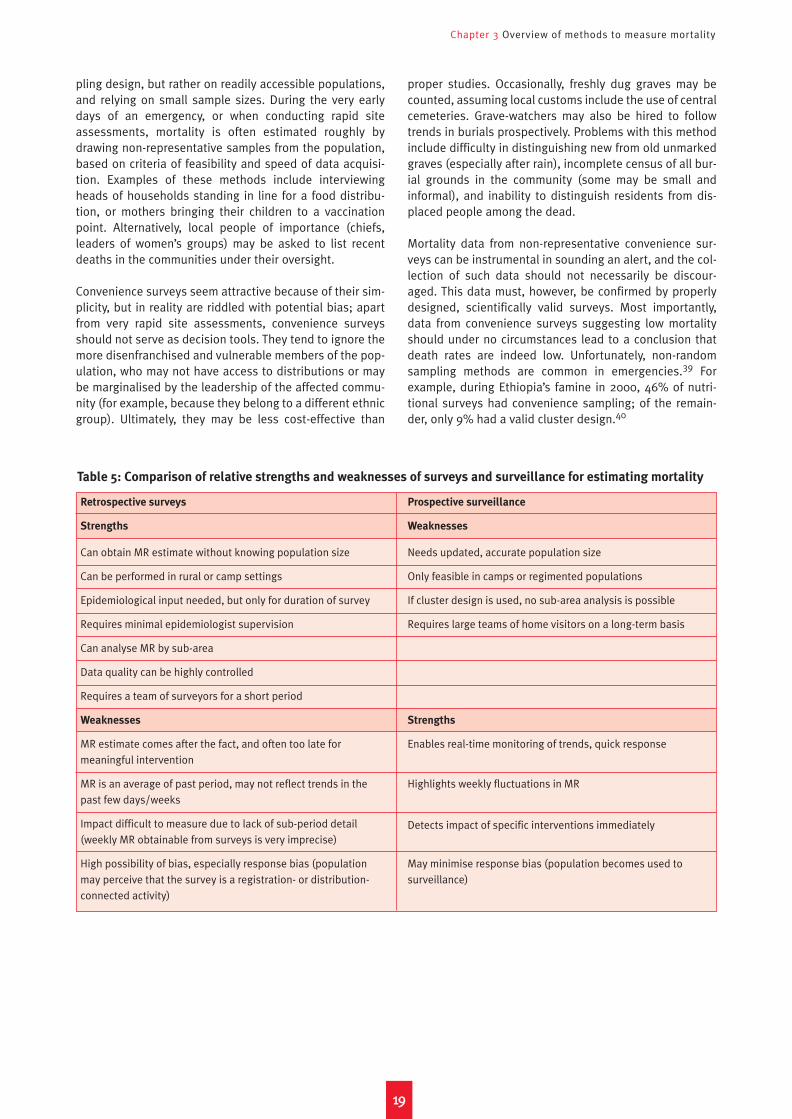
Chapter 3 Overview of methods to measure mortality
Retrospective surveys
Strengths
Can obtain MR estimate without knowing population size
Can be performed in rural or camp settings
Epidemiological input needed, but only for duration of survey
Requires minimal epidemiologist supervision
Can analyse MR by sub-area
Data quality can be highly controlled
Requires a team of surveyors for a short period
Weaknesses
MR estimate comes after the fact, and often too late for meaningful intervention
MR is an average of past period, may not reflect trends in thepast few days/weeks
Impact difficult to measure due to lack of sub-period detail(weekly MR obtainable from surveys is very imprecise)
High possibility of bias, especially response bias (populationmay perceive that the survey is a registration- or distribution-connected activity)
Prospective surveillance
Weaknesses
Needs updated, accurate population size
Only feasible in camps or regimented populations
If cluster design is used, no sub-area analysis is possible
Requires large teams of home visitors on a long-term basis
Strengths
Enables real-time monitoring of trends, quick response
Highlights weekly fluctuations in MR
Detects impact of specific interventions immediately
May minimise response bias (population becomes used tosurveillance)
1199
pling design, but rather on readily accessible populations,and relying on small sample sizes. During the very earlydays of an emergency, or when conducting rapid siteassessments, mortality is often estimated roughly bydrawing non-representative samples from the population,based on criteria of feasibility and speed of data acquisi-tion. Examples of these methods include interviewingheads of households standing in line for a food distribu-tion, or mothers bringing their children to a vaccinationpoint. Alternatively, local people of importance (chiefs,leaders of women’s groups) may be asked to list recentdeaths in the communities under their oversight.
Convenience surveys seem attractive because of their sim-plicity, but in reality are riddled with potential bias; apartfrom very rapid site assessments, convenience surveysshould not serve as decision tools. They tend to ignore themore disenfranchised and vulnerable members of the pop-ulation, who may not have access to distributions or maybe marginalised by the leadership of the affected commu-nity (for example, because they belong to a different ethnicgroup). Ultimately, they may be less cost-effective than
proper studies. Occasionally, freshly dug graves may becounted, assuming local customs include the use of centralcemeteries. Grave-watchers may also be hired to followtrends in burials prospectively. Problems with this methodinclude difficulty in distinguishing new from old unmarkedgraves (especially after rain), incomplete census of all bur-ial grounds in the community (some may be small andinformal), and inability to distinguish residents from dis-placed people among the dead.
Mortality data from non-representative convenience sur-veys can be instrumental in sounding an alert, and the col-lection of such data should not necessarily be discour-aged. This data must, however, be confirmed by properlydesigned, scientifically valid surveys. Most importantly,data from convenience surveys suggesting low mortalityshould under no circumstances lead to a conclusion thatdeath rates are indeed low. Unfortunately, non-randomsampling methods are common in emergencies.39 Forexample, during Ethiopia’s famine in 2000, 46% of nutri-tional surveys had convenience sampling; of the remain-der, only 9% had a valid cluster design.40
Table 5: Comparison of relative strengths and weaknesses of surveys and surveillance for estimating mortality

2200
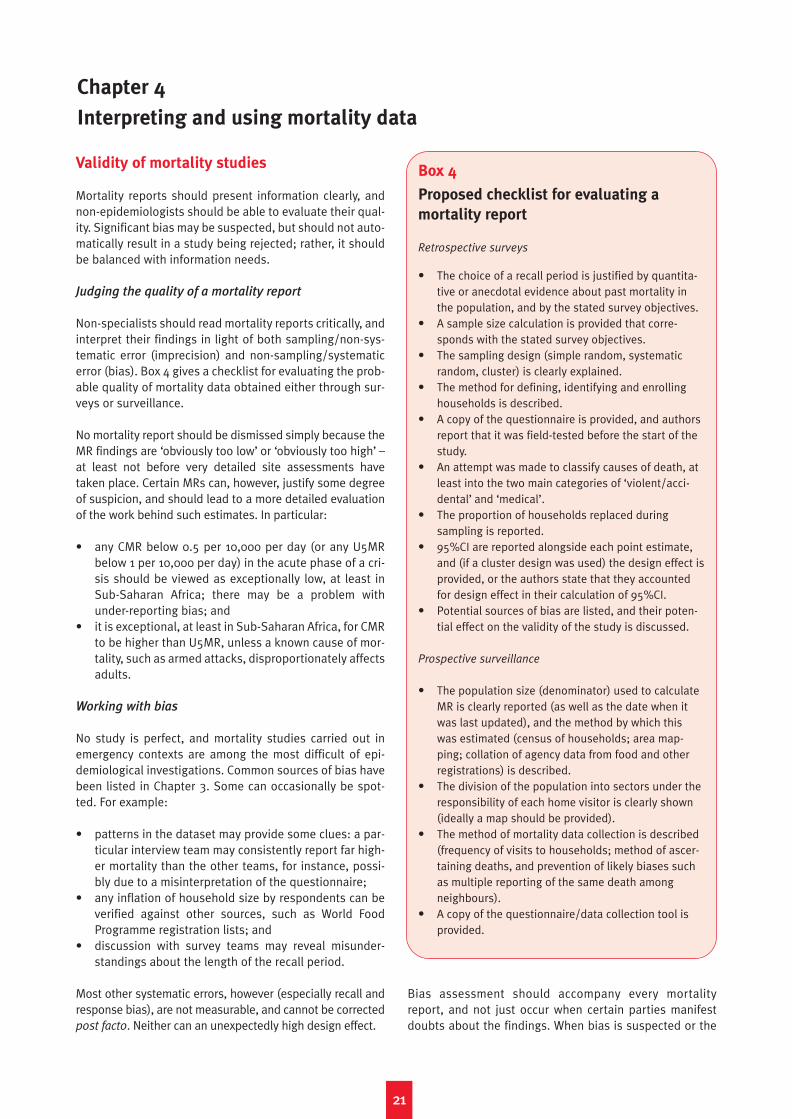
Validity of mortality studies
Mortality reports should present information clearly, andnon-epidemiologists should be able to evaluate their qual-ity. Significant bias may be suspected, but should not auto-matically result in a study being rejected; rather, it shouldbe balanced with information needs.
Judging the quality of a mortality report
Non-specialists should read mortality reports critically, andinterpret their findings in light of both sampling/non-sys-tematic error (imprecision) and non-sampling/systematicerror (bias). Box 4 gives a checklist for evaluating the prob-able quality of mortality data obtained either through sur-veys or surveillance.
No mortality report should be dismissed simply because theMR findings are ‘obviously too low’ or ‘obviously too high’ –at least not before very detailed site assessments havetaken place. Certain MRs can, however, justify some degreeof suspicion, and should lead to a more detailed evaluationof the work behind such estimates. In particular:
• any CMR below 0.5 per 10,000 per day (or any U5MRbelow 1 per 10,000 per day) in the acute phase of a cri-sis should be viewed as exceptionally low, at least inSub-Saharan Africa; there may be a problem withunder-reporting bias; and
• it is exceptional, at least in Sub-Saharan Africa, for CMRto be higher than U5MR, unless a known cause of mor-tality, such as armed attacks, disproportionately affectsadults.
Working with bias
No study is perfect, and mortality studies carried out inemergency contexts are among the most difficult of epi-demiological investigations. Common sources of bias havebeen listed in Chapter 3. Some can occasionally be spot-ted. For example:
• patterns in the dataset may provide some clues: a par-ticular interview team may consistently report far high-er mortality than the other teams, for instance, possi-bly due to a misinterpretation of the questionnaire;
• any inflation of household size by respondents can beverified against other sources, such as World FoodProgramme registration lists; and
• discussion with survey teams may reveal misunder-standings about the length of the recall period.
Most other systematic errors, however (especially recall andresponse bias), are not measurable, and cannot be correctedpost facto. Neither can an unexpectedly high design effect.
Bias assessment should accompany every mortalityreport, and not just occur when certain parties manifestdoubts about the findings. When bias is suspected or the
2211
Chapter 4
Interpreting and using mortality data
Box 4
Proposed checklist for evaluating a
mortality report
Retrospective surveys
• The choice of a recall period is justified by quantita-tive or anecdotal evidence about past mortality inthe population, and by the stated survey objectives.
• A sample size calculation is provided that corre-sponds with the stated survey objectives.
• The sampling design (simple random, systematicrandom, cluster) is clearly explained.
• The method for defining, identifying and enrollinghouseholds is described.
• A copy of the questionnaire is provided, and authorsreport that it was field-tested before the start of thestudy.
• An attempt was made to classify causes of death, atleast into the two main categories of ‘violent/acci-dental’ and ‘medical’.
• The proportion of households replaced during sampling is reported.
• 95%CI are reported alongside each point estimate,and (if a cluster design was used) the design effect isprovided, or the authors state that they accountedfor design effect in their calculation of 95%CI.
• Potential sources of bias are listed, and their poten-tial effect on the validity of the study is discussed.
Prospective surveillance
• The population size (denominator) used to calculateMR is clearly reported (as well as the date when itwas last updated), and the method by which thiswas estimated (census of households; area map-ping; collation of agency data from food and otherregistrations) is described.
• The division of the population into sectors under theresponsibility of each home visitor is clearly shown(ideally a map should be provided).
• The method of mortality data collection is described(frequency of visits to households; method of ascer-taining deaths, and prevention of likely biases suchas multiple reporting of the same death amongneighbours).
• A copy of the questionnaire/data collection tool is provided.
Interpreting and using mortality data in humanitarian emergencies
results are questioned, the attitude must be cool-headedand scientific. If the study is of great importance, a panel ofexperts could rapidly be assembled to review its method-ology and analysis, and decide how realistic the findingsare in light of all available data about the health status ofthe surveyed population.
When deciding whether to accept a moderate risk of biasand act upon the findings, relief managers might wish toreflect on the following:
• what is the size of population to which the mortalityfindings apply? The bigger the population, the biggerthe potential mistake;
• how will the data be used, and with what urgency arethey needed?;
• is it likely that another survey can be performed in thenear future, or that surveillance can rapidly be imple-mented?; and
• are there other sources of data, such as mortuaries orclinics, that could confirm or refute these findings?
It should be noted that not all significantly biased data arenecessarily useless:
• if an under-estimate is suspected and the MR stillexceeds the emergency threshold, the survey, howeverbiased, still indicates that urgent action is needed;
• in case of an under-estimate and reported MRs belowemergency thresholds, one cannot conclude that thereis no emergency; and
• if an over-estimate is suspected, repeating the surveybecomes necessary, unless the reported MR is belowthe emergency threshold, which indicates strongly thatthe situation is under control.
Point estimates and confidence intervals
In any MR estimate – say 2.5 per 10,000 per day, 95%CI 1.6to 3.9 – the point estimate (2.5) is the most likely value ofmortality, and the confidence interval (1.6 to 3.9) express-es the degree of uncertainty around it. Both should bereported, but their interpretation becomes difficult in bor-derline situations, where mortality is close to the emer-gency threshold.
How precise can we be?
Assuming that the survey relied on representative sam-pling and controlled other potential sources of bias, thepoint estimate is the most likely value of mortality in thepopulation of interest. The point estimate is therefore thevalue to which an emergency threshold should be com-pared. As discussed above, the confidence intervaldescribes the degree of uncertainty surrounding the pointestimate; it is not a reflection of bias, but rather of sam-pling imprecision. Both point estimates and CIs areextremely informative, and both should be reported whendescribing mortality in any population.
The narrower the CI, the more confident one can be about theresult of the survey. But how narrow is narrow, and howbroad is broad? There are, unfortunately, no cut-offs todecide this, and much depends on the actual MR. Commonsense, however, would not be satisfied with, say, a finding ofCMR 2.0 per 10,000 per day and a 95%CI ranging from 0.3 to5.8. Such a finding would denote poor survey design, name-ly that investigators did not define from the outset a samplesize that would be sufficient to detect elevated mortality withsufficient precision. Obviously, the CI from such a survey willbecome narrower if we accept a lower level of confidence –90%, 80%, 70% and so on. Whether 95% confidence is actu-ally too strict a standard in the context of emergency mortal-ity surveys perhaps deserves further discussion among theexperts, since the implications of CIs in this context are verydifferent from those in most other areas of epidemiology. Ingeneral, the less regret one will have when acting on data (interms of deaths averted, or costs incurred) that are in error,the less important confidence intervals become. For exam-ple, a high child mortality estimate attributed to measleswould be likely to lead to an immunisation and vitamin Acampaign which, even if uncalled for, might still serve thosechildren in years to come. An equally high error in estimatingmortality attributed to violence might lead to a military ordiplomatic response which, if inappropriate, would induce arelatively large amount of regret.
As the case may be, lowering the level of confidence can-not replace the requirement for properly designed surveysand adequate sample sizes. At the very least, surveysshould have a sample size that is sufficient to clearly iden-tify seriously elevated mortality. Without wishing to bedogmatic, we suggest that a minimum of 900 households(30 clusters x 30 households) and a recall period of at leastthree months should be investigated whenever possible(or 450 households if random sampling can be done). Thissample size detects a CMR of 1.5 per 10,000 per day with±0.5 per 10,000 per day precision, assuming a typicalhousehold size of five individuals.
Sometimes, access to populations in crisis may be patchy atbest, and for a variety of reasons (the population is on themove; the agency is hesitant to deploy survey teams due tosecurity reasons), one may decide to carry out a study witha less than adequate sample size, especially if there is astrong suspicion that CMR could be high. In this case, 450households (30 clusters x 15 households, or 225 with ran-dom sampling) may be acceptable. This sample size woulddetect a CMR of 2.0 per 10,000 per day with precision ±1.0.
Proposed interpretation rules
If surveys are carried out, one of the following four scenar-ios may be encountered. We propose below a set ofresponses corresponding to each:
• Scenario 1: Both the point estimate and the 95%CI are
clearly above the emergency threshold (example: CMR
2.3 per 10,000 per day, 95%CI 1.3 to 3.1). The emergency
2222
Chapter 4 Interpreting and using mortality data
2233
is not under control and significant excess mortality hasoccurred, even if the lower bound of the CI is considered.The situation could be as bad as the upper bound of theCI. An urgent improvement and scaling up of relief oper-ations is needed; data on causes of death reported bythe survey, as well as other available assessments, maypoint to those interventions which are likely to be mostbeneficial. Repeat surveys and/or surveillance should beplanned so as to monitor the evolution of mortality.
• Scenario 2: The point estimate crosses the emergency
threshold, but the 95%CI includes values below it
(example: CMR 1.1 per 10,000 per day, 95%CI 0.6 to
1.6). The relief community has little choice in the shortterm but to act upon the assumption of an out-of-con-trol situation, and thus strengthen humanitarian assis-tance. In so doing, it accepts the risk that the reliefoperation may be excessive compared to needs.Repeat surveys and/or surveillance are urgently need-ed to confirm and monitor this finding.
• Scenario 3: The point estimate is below the emer-
gency threshold, but the upper 95%CI crosses it
(example: CMR 0.8 per 10,000 per day, 95%CI 0.4 to
1.3). Such a result is encouraging, but there is evidencethat excess mortality persists. Indeed, mortality couldbe as high as the upper CI. There is insufficient evi-dence to justify scaling down relief operations. Therelief community should compare this finding with anyprevious estimates available, and decide whether adownward or upper trend is evident. Most importantly,a repeat survey should be organised, this time with suf-ficient sample size to show a clear reduction of MRbelow the emergency threshold.
• Scenario 4: Both the point estimate and the 95%CI are
clearly below the emergency threshold (example:
CMR 0.5/10,000, 95%CI 0.2 to 0.8). The emergency isunder control, and relief efforts, at least from the stand-point of minimising mortality, are probably adequate(note that other services, such as psychological careand schooling, may still be scarce). The upper 95%CI,however, suggests that mortality may still be elevatedcompared to baseline levels, and repeat surveys orprospective surveillance are necessary.
As discussed in the previous chapter, good precision insurveys requires a significant sample size, a relatively longrecall period and a low design effect. When mortality isvery high, achieving very good precision is not crucial. Theoperational response to a CMR of 20 per 10,000 per day isunlikely to differ much from the response to a CMR of 10per 10,000 per day, and even a broad CI will succeed in con-veying the gravity of such a situation. In borderline situa-tions, however, the limitations of survey sampling becomeall but insurmountable: for example, assuming a recallperiod of six months and cluster sampling with designeffect of 2.0, classifying a CMR of 1.1 per 10,000 per day asbeing unequivocally above the emergency threshold wouldrequire a precision of ±0.1 per 10,000 per day (that is, alower 95%CI bound not below 1.0), namely a sample of46,953 households. Epidemiologists sometimes struggle
to convey this important limitation when arguing for ade-quate resources for surveys, and explaining their findingsto non-specialist audiences. In short, in situations whereonly survey data are available, and where the CI is bothabove and below the emergency threshold, the interpreta-tion is mostly conservative, and assumes worst-case sce-narios; it should, however, be informed by a good dose ofobjectivity and common sense.
It must be noted that a well-organised, weekly prospectivesurveillance system which captures deaths in the popula-tion exhaustively through a capillary network of home visi-tors will yield absolute MRs with no CIs around them (thatis, no sampling error), thereby circumventing scenarios 2and 3 above. Quality surveillance is certainly superior toquality surveys when MR is close to emergency thresholds;furthermore, it generates weekly updates that will clearlyhighlight any declining or increasing trend.
Whenever mortality data are interpreted, there will proba-bly always be a range of vested interests attempting todemonstrate that an emergency is continuing, or that it isdefinitely over. Entrusting the conduct and interpretationof mortality studies to experienced staff who are inde-pendent from major political powers and who can exercisescientific objectivity is of great importance if misuse ofdata is to be prevented.
Confidence intervals and proportionate mortality
There is perhaps one situation in which the importance ofCIs is diminished, namely when a single cause of death isoverwhelmingly responsible for the excess mortalityobserved. For example, in 2003–2004 a population of75,000 West Darfurians experienced a CMR of 9.5 per10,000 per day before reaching Murnei camp, and 93% ofthese deaths were due to violence.41 This dramatic findingalone is probably sufficiently eloquent, and CIs here wouldnot add much operationally relevant information.
This example assumes that the survey captured a sufficientnumber of deaths to yield precise estimates of proportion-ate mortality. The proportion of deaths due to any givencause also has a CI associated with it, if this proportion isdrawn from a sample. This CI becomes broader as the totalnumber of deaths decreases, and as the design effectbecomes larger. For example, four diarrhoea-related deathsout of a total of ten reported, and 40 diarrhoea deaths out of100 would both yield a proportionate mortality of 40%, butthe respective 95%CIs (assuming a design effect of 2.0)would be 7% to 83% and 27% to 55%. Proportionate mor-tality data should thus be interpreted with caution whenthey are based only on a small number of deaths.
Interpolation, extrapolation and stratification
Mortality rates may be generalised to total numbers ofdeaths in the population and period studied (this is called
Interpreting and using mortality data in humanitarian emergencies
interpolation). Extrapolation (application of the findings todifferent populations and periods) is more risky, but maybe performed cautiously if certain conditions are met.Stratification refers to sub-group (or sub-period) analysis.Mortality estimates in sub-groups are always less precisethan in the entire sample. Single sample cluster surveys donot allow for sub-area stratification. This is a major limita-tion of this sampling design.
Estimating death tolls within and outside the
study period and population
Total death toll figures have a far greater policy and mediaimpact than mortality rates. Whereas epidemiologists maybe satisfied with the information provided in MRs, reliefprogramme managers, NGO communications and fundrais-ing staff, donors, politicians and journalists are far moreinterested in the hard numbers.
We define interpolation as the process by which mortalityrate findings are applied to the entire population fromwhich the sample was drawn, so as to obtain total numbersof deaths or percentages of the population that died overthe recall period being investigated. We call extrapolation
any extension of the findings to a population and/or peri-od that was not represented by the sample. If the survey iswell-conducted and relatively bias-free, results may beconsidered representative of the population from whichthe sample was drawn, during the period of time coveredby the questionnaire. Interpolation is therefore statistical-ly justified and readily performed (see Box 5). However,death-toll estimates may sometimes be very imprecise.The first response when considering such a figure shouldbe to ask for a confidence interval, and a CI should accom-pany, if not supersede, any total death toll estimate.
Extrapolation has little scientific justification, and cangreatly distort actual survey findings, discrediting individ-ual research groups and the disciplines of demography,epidemiology and statistics. Nevertheless, at least oneunderstandable reason why extrapolation is often per-formed can be cited: where it is insufficient and/or impos-sible to collect data. Extrapolation across different popula-tions works by association: if two populations appear to beexperiencing similar conditions, for example the same pat-terns of disease or food security, or a similar proximity toconflict, it is assumed that the mortality experience of onecan be applied to the other. Extrapolation to periods beforeor after that investigated by the survey is more risky, andmore difficult to justify.
We believe that extrapolation is not acceptable when any
of the conditions below are met:
• it applies a mortality finding to a far wider area/popu-lation than that covered by the survey which generatedthat finding, and does so without any attempt to com-pare qualitative and quantitative data on the popula-tion surveyed with data on the populations to whichthe extrapolation is applied;
• it relies on highly unreliable population figures;• it is driven essentially by political motives, or a precon-
ceived notion of what mortality ‘must be’; and• it is a short-cut around the requirement for rigorous
surveys and surveillance.
Conversely, we believe that some form of cautious extrap-olation, guided by logic and a deep knowledge of the fieldcontext, and accompanied by detailed acknowledgementof its likely limitations, is acceptable and occasionally evenuseful when all of the following conditions are met:
• data from several different surveys/surveillance sys-tems are available and, though they may not cover theentire population experiencing the crisis (or may reflectdifferent periods in this crisis), they do offer somedegree of geographical representation;
• it would clearly be impossible or very difficult to collectexhaustive data on the entire population of interest; and
• the agency performing the extrapolation has an objec-tive view of the situation.
There are as yet no guidelines about how to performextrapolation in mortality measurement, and every case islikely to be different. Whatever extrapolated estimate isprovided, however, should be accompanied by a full expla-nation of how it was derived, and of the assumptionsmade. A range of likely lower- and upper-end values, ratherthan a single value, may be a more prudent and meaning-ful way of expressing and interpreting such estimates.
Significant examples of recent interpolations and/or cau-tious extrapolations performed on the basis of mortalitystudies can be cited from:
• the Goma area of eastern Zaire (now the DemocraticRepublic of Congo), where epidemiological investiga-tions in the wake of the 1994 Rwandan refugee influx(and based in this case on both surveillance and sur-veys) reported that almost 10% of the population haddied during the first month of the crisis, mostly due todiarrhoeal disease epidemics;42
• Kosovo, where a survey done after the 1999 withdraw-al of Yugoslav forces estimated a total death toll of12,000 due to violence;43
• the DRC, where nationwide surveys by the InternationalRescue Committee have put at 3.8 million the totalnumber of excess deaths due to conflict since 1998;44
• Iraq, where a conservative interpolated estimate putexcess deaths after the 2003 invasion at 98,000(95%CI 8,000 to 194,000).45 A noteworthy aspect ofthis survey was the decision by the authors to excludefrom the analysis a cluster in the city of Falluja whichaccounted for a disproportionate number of violentdeaths, and for which the possibility of strong biascould not entirely be discounted.
• Darfur, where a WHO survey, combined with other site-specific surveys and projections, led to an estimate inSeptember 2004 of 4,500 to 9,000 excess deaths permonth in a population of 1.8 million IDPs. A recent doc-
2244
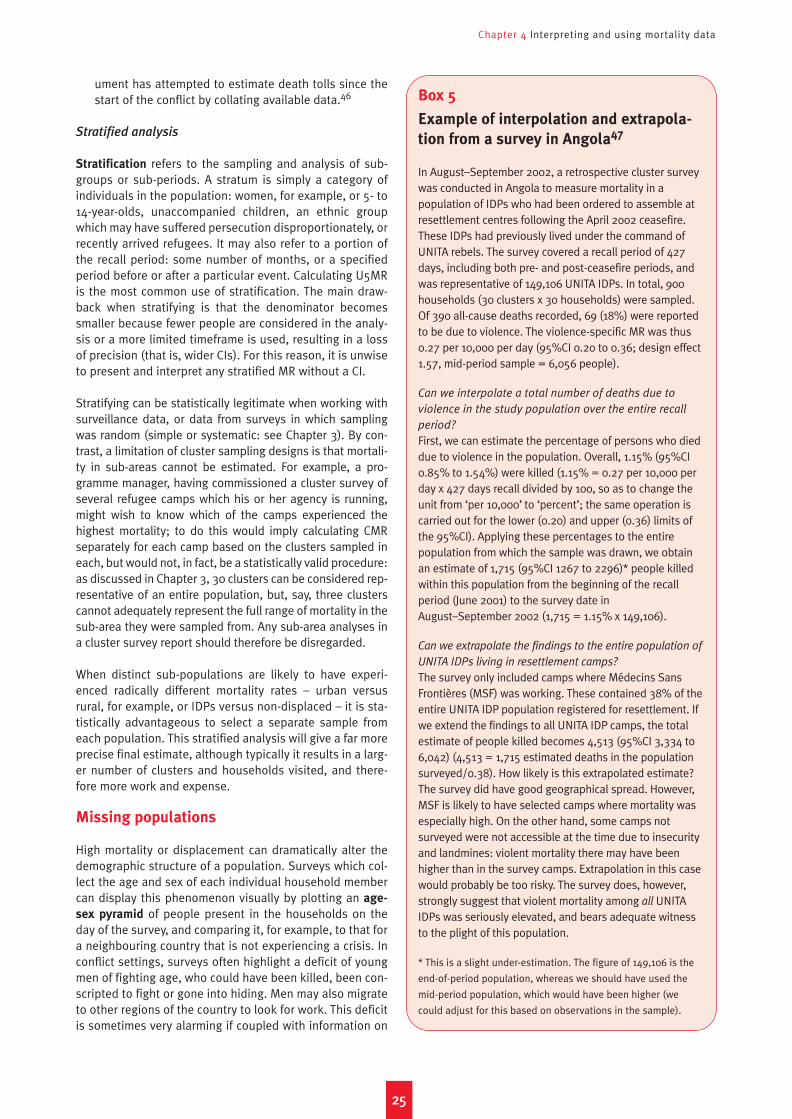
Chapter 4 Interpreting and using mortality data
2255
ument has attempted to estimate death tolls since thestart of the conflict by collating available data.46
Stratified analysis
Stratification refers to the sampling and analysis of sub-groups or sub-periods. A stratum is simply a category ofindividuals in the population: women, for example, or 5- to14-year-olds, unaccompanied children, an ethnic groupwhich may have suffered persecution disproportionately, orrecently arrived refugees. It may also refer to a portion ofthe recall period: some number of months, or a specifiedperiod before or after a particular event. Calculating U5MRis the most common use of stratification. The main draw-back when stratifying is that the denominator becomessmaller because fewer people are considered in the analy-sis or a more limited timeframe is used, resulting in a lossof precision (that is, wider CIs). For this reason, it is unwiseto present and interpret any stratified MR without a CI.
Stratifying can be statistically legitimate when working withsurveillance data, or data from surveys in which samplingwas random (simple or systematic: see Chapter 3). By con-trast, a limitation of cluster sampling designs is that mortali-ty in sub-areas cannot be estimated. For example, a pro-gramme manager, having commissioned a cluster survey ofseveral refugee camps which his or her agency is running,might wish to know which of the camps experienced thehighest mortality; to do this would imply calculating CMRseparately for each camp based on the clusters sampled ineach, but would not, in fact, be a statistically valid procedure:as discussed in Chapter 3, 30 clusters can be considered rep-resentative of an entire population, but, say, three clusterscannot adequately represent the full range of mortality in thesub-area they were sampled from. Any sub-area analyses ina cluster survey report should therefore be disregarded.
When distinct sub-populations are likely to have experi-enced radically different mortality rates – urban versusrural, for example, or IDPs versus non-displaced – it is sta-tistically advantageous to select a separate sample fromeach population. This stratified analysis will give a far moreprecise final estimate, although typically it results in a larg-er number of clusters and households visited, and there-fore more work and expense.
Missing populations
High mortality or displacement can dramatically alter thedemographic structure of a population. Surveys which col-lect the age and sex of each individual household membercan display this phenomenon visually by plotting an age-
sex pyramid of people present in the households on theday of the survey, and comparing it, for example, to that fora neighbouring country that is not experiencing a crisis. Inconflict settings, surveys often highlight a deficit of youngmen of fighting age, who could have been killed, been con-scripted to fight or gone into hiding. Men may also migrateto other regions of the country to look for work. This deficitis sometimes very alarming if coupled with information on
Box 5
Example of interpolation and extrapola-
tion from a survey in Angola47
In August–September 2002, a retrospective cluster surveywas conducted in Angola to measure mortality in apopulation of IDPs who had been ordered to assemble atresettlement centres following the April 2002 ceasefire.These IDPs had previously lived under the command ofUNITA rebels. The survey covered a recall period of 427days, including both pre- and post-ceasefire periods, andwas representative of 149,106 UNITA IDPs. In total, 900households (30 clusters x 30 households) were sampled.Of 390 all-cause deaths recorded, 69 (18%) were reportedto be due to violence. The violence-specific MR was thus0.27 per 10,000 per day (95%CI 0.20 to 0.36; design effect1.57, mid-period sample = 6,056 people).
Can we interpolate a total number of deaths due to
violence in the study population over the entire recall
period?
First, we can estimate the percentage of persons who dieddue to violence in the population. Overall, 1.15% (95%CI0.85% to 1.54%) were killed (1.15% = 0.27 per 10,000 perday x 427 days recall divided by 100, so as to change theunit from ‘per 10,000’ to ‘percent’; the same operation iscarried out for the lower (0.20) and upper (0.36) limits ofthe 95%CI). Applying these percentages to the entirepopulation from which the sample was drawn, we obtainan estimate of 1,715 (95%CI 1267 to 2296)* people killedwithin this population from the beginning of the recallperiod (June 2001) to the survey date inAugust–September 2002 (1,715 = 1.15% x 149,106).
Can we extrapolate the findings to the entire population of
UNITA IDPs living in resettlement camps?
The survey only included camps where Médecins SansFrontières (MSF) was working. These contained 38% of theentire UNITA IDP population registered for resettlement. Ifwe extend the findings to all UNITA IDP camps, the totalestimate of people killed becomes 4,513 (95%CI 3,334 to6,042) (4,513 = 1,715 estimated deaths in the populationsurveyed/0.38). How likely is this extrapolated estimate?The survey did have good geographical spread. However,MSF is likely to have selected camps where mortality wasespecially high. On the other hand, some camps notsurveyed were not accessible at the time due to insecurityand landmines: violent mortality there may have beenhigher than in the survey camps. Extrapolation in this casewould probably be too risky. The survey does, however,strongly suggest that violent mortality among all UNITAIDPs was seriously elevated, and bears adequate witnessto the plight of this population.
* This is a slight under-estimation. The figure of 149,106 is the
end-of-period population, whereas we should have used the
mid-period population, which would have been higher (we
could adjust for this based on observations in the sample).
Interpreting and using mortality data in humanitarian emergencies
systematic violence in the region. Its consequences arealso significant, as the resulting women-headed house-holds are often more vulnerable than the average (andshould thus be identified and targeted for additionalrelief/protection). HIV/AIDS has resulted in a dramaticthinning of the population as age progresses: older agegroups are increasingly a minority, and children under 15are demographically dominant. Where under-five mortalityis high, one can also observe a thinning of the under-fiveage group with respect to older age groups, and of theunder-one group if infant mortality is particularly elevated.Some demographic information is, however, necessary tomake the link between high child mortality and the shapeof an age-sex pyramid: reduced fertility can also lead toshrinkage in the youngest age groups.
Understanding causation
Cause-of-death information (other than violence) is oftennot specific, and thus may have only limited operationalrelevance. Certain causes of death, such as malaria andrespiratory diseases, can be difficult to diagnose.Moreover, mortality studies mostly do not explore the dis-tal determinants of poor health. War and displacementincrease the risk of disease and poor disease outcome –emergency relief can only address some of this risk.
Violent causes of death are easily recognisable providedlittle response bias occurs (that is, respondents are hon-est), and can have immediate implications for the protec-tion of civilians and international advocacy. The age andsex profile of such deaths must be investigated carefully.Any killing of children and women clearly points to viola-tions of humanitarian law. Many violent deaths amongadult men may reflect casualties among combatants. It willsometimes be difficult to appraise this proportion, andsuch information should generally not be requested ofrespondents, as it may place them at risk. Backgroundknowledge on the evolution of the crisis, evidence on thecomposition and location of combatant armies and anec-dotal accounts of how and against whom violence was per-petrated can help in deciding whether adult male violentdeaths are mostly civilian in nature.
As discussed in Chapter 3, classifying medical causes ofdeath in mortality surveys is very difficult in the absence ofverbal autopsy techniques. The validity of such data isuncertain. Causes of death are probably more easily inter-pretable and more relevant in children:
• Neonatal tetanus is usually recognisable because ofthe spasm typically associated with it; tetanus deaths,if noted frequently in the sample, suggest poor antena-tal care.
• Measles is usually well-classified, but its true burdentends to be under-estimated, since the characteristicrash is not always visible and many measles deaths aredue to complications such as acute respiratory infec-tions or diarrhoea; the occurrence of measles deaths in
the sample should lead to a recommendation to rein-force vaccination services.
• Malaria and ARI have great symptom overlap and areoften confused in clinical practice; surveys will almostcertainly not discriminate any better between the two,unless a serious malaria epidemic is occurring.48
• Diarrhoea can probably be classified with reasonablespecificity if interviewers find a locally valid definition ofwhat constitutes severe diarrhoea; high proportionatemortality due to diarrhoea should lead to better nutrition(see below) and water and sanitation; however, bloodydiarrhoea, and especially epidemic shigellosis (whichrequires a specific response, including adapted antibi-otics), may go unnoticed in mortality studies.
• Malnutrition itself causes few deaths, even in nutrition-al crises: most malnutrition-related deaths will be dueto severe diarrhoea and dehydration, and others tomalaria or acute respiratory infections; indeed, malnu-trition is considered to be the underlying cause foralmost half of preventable childhood deaths.49
Malnutrition and mortality rates correlate well in emer-gencies.50 Thus, high global acute malnutrition preva-lence, greater than 10%, should always be assumed tocause excess mortality, primarily in children.
Information on the causes of infectious disease death inadults is usually of limited operational relevance, with onepossible exception: a high proportionate mortality due todiarrhoea is unusual in adults, and indicates that a seriousepidemic of either cholera or shigellosis may be occurring.Along with improved water and sanitation services, such afinding should lead to reinforced surveillance and a fullepidemiological investigation.
Lastly, it should be noted that causes of death say very lit-tle about social, economic and anthropological obstacleson the road from illness to cure: it is very difficult simplybased on mortality data to decide whether, for example,new health centres should be opened, or a community sen-sitisation campaign conducted to encourage patients andcaregivers to seek early care at existing facilities.
Distal versus proximate determinants ofmortality
There is a limit to the potential benefits of relief, whichbecomes more and more apparent the closer one gets to thescene of the action. Emergency relief deals with the proximatecauses of mortality, but rarely affects the most distal ones. Nowater and sanitation intervention, however well-conducted,can fully ameliorate the ill-effects of overcrowding and poorsite planning, just as no food and nutritional programme canever replace the naturally balanced and plentiful diet of apopulation allowed to farm and trade freely. For example, atthe time of writing about 1.5 million northern Ugandans areprevented by systematic armed terror from leaving over-crowded and unsanitary displacement sites: even a furtivetrip outside the camps, to cultivate once well-tended fields,can result in death, abduction, rape or mutilation.
2266
Chapter 4 Interpreting and using mortality data
Beyond the direct effects of violence, displacement and/ora breakdown of health and other infrastructures triggers amyriad of other domino effects, increasing the risk of vari-ous fatal and debilitating diseases, and decreasing theprobability of recovery. Examples include:
• Tuberculosis (TB) treatment presently requires at leastsix months of directly observed therapy and follow-up,which most relief agencies are reluctant to commencein the acute phase of emergencies; diagnosing new TBcases, as well as cases of TB treatment failure, requireslaboratory facilities.
• The reproductive rate (transmissibility) of measles andmeningitis is higher in overcrowded refugee/IDP campscompared to other settings.51 This means that epidemicstend to spread faster (leaving less time for reaction). Italso means that, in order to prevent epidemics throughherd immunity, measles and meningitis vaccination cam-paigns must achieve a higher coverage in refugee campsthan they must in, for example, Western Europe.
• The resurgence of sleeping sickness (human Africantrypanosomiasis) in Sub-Saharan Africa is largelyattributed to wars in Angola, the Congos, Sudan andUganda, where a large epidemic in the late 1980s wasprobably initiated by imported cases among southernSudanese refugees.
A review of communicable disease risks in emergenciesand of their determinants was recently published byConnolly et al.52
Acting upon the findings
Any evidence of excess mortality should lead to a reaction.The amount of evidence needed in order to act depends on(i) how much can reasonably be collected; and (ii) what thedata will be used for. When data are insufficient, the crite-rion for action should be to minimise the risk of overlook-ing or under-estimating a crisis.
Emergency thresholds revisited
We have stressed the difficulties in interpreting MRs whenthey are very close to the emergency threshold. It is veryimportant, however, not to lose sight of the fact that anysuch threshold is (and always will be) merely an arbitraryvalue, whose role is primarily to provide a framework forevaluating the magnitude of an emergency, and for justifyingthe implementation of a relief operation. Although the evi-dence for this is empirical at best, there is a recognitionamong relief workers that, in most emergencies (apart fromthose occurring in industrialised countries), even the mostefficient and needs-driven relief operation will struggle tobring CMR far below 1 per 10,000 per day: therefore, theemergency threshold, or rather the target of CMR<1 per10,000 per day (and U5MR<2 per 10,000 per day) is perhapsbest viewed as a reflection of the degree to which humani-tarian assistance can – and therefore should – minimiseexcess mortality in affected populations. Thresholds are
immensely important alarm bells. However, mortality inexcess of baseline expectations is the more fundamentalindicator: whether expressed in terms of MRs or actual totalexcess deaths derived by interpolation or extrapolation, thisis actually the most informative measure of the impact of anemergency, and that which best describes the gap whichremains to be filled by humanitarian agencies. Any excessmortality should lead to an immediate reaction. The Sphereapproach of considering context-specific baseline MR maymake more sense as a way to estimate excess mortality thanas a starting point for defining thresholds, since the calcula-tion of excess mortality requires knowledge of what theexpected non-crisis MR is in the setting in question.
How much evidence is needed?
Mortality data are usually insufficient, yet important deci-sions must be taken rapidly based on them. How much evi-dence on mortality is actually needed to justify a reactionlargely depends on the programmatic focus of the study.
Magnitude of the emergency. Objectively deciding howmuch humanitarian and political assistance a population incrisis needs requires an implicit risk analysis. This analysisbalances the provider risk of over-estimating the extent ofa crisis (and thus deploying an unjustified amount ofresources) with the beneficiary risk of under-estimating orfailing to detect a crisis, with consequent excess mortality.Both risks are probably maximised when no data are avail-able, and both are reduced by well-conducted mortalitystudies. The larger the population at risk, the greater thepotential consequences of inaction.
A problem arises when mortality data do not cover the entireaffected population, and filling all the knowledge gapswould either take too long or is not feasible due to govern-ment hostility or lack of access, funding and/or epidemio-logical know-how. Most in the humanitarian communitywould probably be prepared to accept a relatively highprovider risk, if this meant keeping the beneficiary risk to aminimum. Furthermore, it seems logical that populationsshould not be punished with a higher beneficiary risk simplybecause data on their health status cannot be collected.How much evidence is needed is, therefore, a question ofhow much can reasonably be collected without putting onhold an urgent humanitarian response. This done, the pro-grammatic interpretation should, as suggested above whendiscussing bias and confidence intervals, be cautiously con-servative, leading to action based on worst-case scenarios,while recognising that this entails a significant provider risk.
Monitoring trends. If a relief operation is ongoing, andindividual sites within the target area continue to reporthigh MRs, it would be reckless to scale down programmessimply based on qualitative impressions. Indeed, the bur-den of proof during monitoring is on the side of theprovider and its donors, who should only justify a reduc-tion in assistance based on evidence of decreased mortal-ity everywhere. Common sense suggests that sites which
2277
Interpreting and using mortality data in humanitarian emergencies
cannot be monitored due to insufficient resources or inac-cessibility are more likely to experience elevated mortality– all the more reason to make conservative assumptionswhen data are missing.
Advocacy. Where populations in crisis are inaccessible,mortality studies can sometimes open a small window ontheir plight: for example, surveys of small groups ofBurmese Karen refugees in Thailand and North Koreanmigrants to China have corroborated qualitative informa-tion about human rights abuses in Burma and famine inNorth Korea.53 At the very least, such studies confirmedthe existence of phenomena vehemently denied by therespective governments. Mortality studies have occasion-ally been able to estimate the full impact of a crisis, as inKosovo and the DRC.54 Between these two extremes lies awealth of fragmentary information produced by site- andperiod-specific studies which, were it assembled in onedocument, would demonstrate, for any country and set-ting, the striking extent to which war and socio-economicvulnerability to disasters have both direct and indirecteffects on human health.55
If mortality studies are to be used as an advocacy tool,then they should be designed to be as representative aspossible of the entire population and period during whichthe crisis (or, more specifically, the violence) took place.Failing this, epidemiology’s achievement may simply be toconfirm that a certain threshold of acceptability has beencrossed, for which those who initiated the crisis, or failedto prevent it, should now be held accountable. Such epi-demiological findings can then be integrated into a wider
appraisal of the crisis, which combines hard data and qual-itative information.
Predicting mortality in time
When emergencies strike, the question on many minds is‘how many people will die if no help reaches them intime?’. There is an understandable and even healthy wishto use past experience to forecast the evolution of mortal-ity. Past attempts to do this have, however, met with littlesuccess. For example, in 1996 allied forces invaded Huturefugee camps in eastern Zaire (ostensibly to drive out theRwandan génocidaire militia based there), and deniedaccess to humanitarian agencies. MSF epidemiologistsestimated that CMR would climb to ten per 10,000 per day,and that 13,600 people would die within three weeks, aclaim that led to a call for military intervention. The claimwas in fact wrong: in reality, the diversion of aid by the mili-tia controlling the camps had created a false perception ofhow much assistance was necessary to maintain therefugees. In July 2003, the United States Agency forInternational Development (USAID) predicted that, in theabsence of significant aid, CMR in Darfur would eventuallyclimb to 20 per 10,000 per day.56 CMR thankfully did notreach such levels. Although these particular attempts mayhave been somewhat rudimentary, it is conceivable that, in the future, through a combination of mathematical modelling, advanced demographic techniques and expertfeedback, realistic projections of mortality scenarios in acrisis (or at least of a likely range of outcomes) couldinform advocacy for more assistance and access to affect-ed populations.
2288
Numbers have political uses in many facets of our lives,from unemployment and other economic indicators tonumbers of asylum-seekers. It is no surprise that figuresdescribing the number of people dying in emergencies willalso be used for political ends. The idea of people dying,especially non-combatants dying in times of conflict,always provokes sympathy in onlookers. Prolonged violentconflict almost always results in excess mortality, eitherdirectly from the violence, or indirectly, from economic andsocial disruption. Those who are responsible for the con-flict or who are benefiting from it will want to downplay theissue of civilian deaths. Those who oppose a conflict willwant to highlight the human cost.
Unlike deaths from old age and chronic diseases, deathsresulting from the direct and indirect consequences of vio-lence are best prevented by the cessation of the violence.Thus, public health workers pursuing the fundamental taskof averting death in times of war often find their work andrecommendations more politically oriented than they arein non-conflict settings. Moreover, virtually all publichealth researchers begin studying a pattern of disease ordeath because they are fundamentally opposed to thoseepisodes of disease or death occurring. While thisapproach seems scientific when discussing a specificpathogen, researchers who set out to document the ill-effects of war are often accused of having a political agen-da. By implication, their work is suspect.
The political problems associated with mortality data can bedivided into two types: problems associated with data col-lection and acceptance of the findings; and problems asso-ciated with the exaggeration or minimisation of the results.While these problems can often arise with surveillance data,the discussion here focuses on mortality survey data, as it ismost commonly at the centre of political controversies.
Bias and manipulation
Following the Gulf War of 1991, the destruction induced andthe economic sanctions imposed resulted in concern insome quarters for the health of the Iraqi people. A researchteam from Harvard University hired and trained young, well-educated Jordanians to collect a sample of data from withinIraq in an attempt to measure under-five mortality. Theresults, published in The Lancet, implied that hundreds ofthousands of children had died as a result of the invasionand the disruption that followed.57 Post-publication, areview of the data showed that one interviewer recordedmany, if not most, of the excess deaths. An embarrassingretraction was requested by a Harvard review committee.
Interviewer-induced biases can also work in the oppositedirection. In 2001, the International Rescue Committeeconducted a mortality survey in Kalima health zone in the
DRC. Investigators hired two interviewers suggested byOxfam who could speak some French. The investigatorsquickly became concerned about the rigour of one of theinterviewers, who found only child deaths. He was there-fore watched closely. On the second day, an investigatoroverheard the suspect interviewer being told of a violentdeath. When the data forms were handed to the investiga-tor, that death was not listed. A second visit to the houseconfirmed that the death had indeed occurred. It wasdecided that the interviewer would not be confronted, butall his data sheets were excluded from the analysis. It wassubsequently discovered that the suspect interviewer livedwith the rebel chief of security in Kalima, and that Oxfamhad been manipulated into suggesting this individual.Another member of the household later attempted to givediamonds to the investigators, presumably to get themarrested.58 Investigators suspect that the interviewer hadattempted to under-report deaths to minimise the evi-dence of high mortality in an area where the rebel govern-ment was both brutal and unpopular.
This sort of bias may also be induced by the interviewees.Data collected in 1999 during an immunisation survey inKatana health zone in the DRC showed that mothers whoapproached interviewers in public areas were twice as like-ly to have immunisation cards as mothers who were foundat their homes. Thus, the availability or eagerness of peo-ple to be interviewed can induce a bias which shows theimportance of rigorous survey-enrolment procedures.Likewise, Taylor and Becker have both highlighted theunder-reporting of infant and child deaths during sur-veys.59 In particular, when mothers recalled all the childrenborn to them, they excluded most births that resulted in aninfant death if the woman being interviewed was over 19years of age. It is believed that older women who haveexperienced more births and who had to recall births morethan a year or two years before simply did not, knowinglyor unknowingly, report most infant deaths.
While these two examples may not constitute politically-motivated under-reporting, the potential exists for grossunder-reporting for political purposes. For example, a sur-vey in the DRC by the International Rescue Committee in2002 found under-five mortality of 5.8 per 1,000 permonth, much higher than the 3.4 per 1,000 per monthreported by a UNICEF Multiple Indicator Cluster Survey(MICS) conducted the same year.60 The head of UNICEF’sMICS programme believed that this discrepancy arosebecause the MICS survey, which asked mothers aboutbirths and under-five deaths among their family in the pastfive years, suffered from the same under-reportingdescribed by Taylor a decade earlier. While few publichealth scientists who read both reports believed theUNICEF finding, the DRC government cited only the UNICEFfigure because the IRC finding would have meant that the
2299
Chapter 5
The politics of mortality
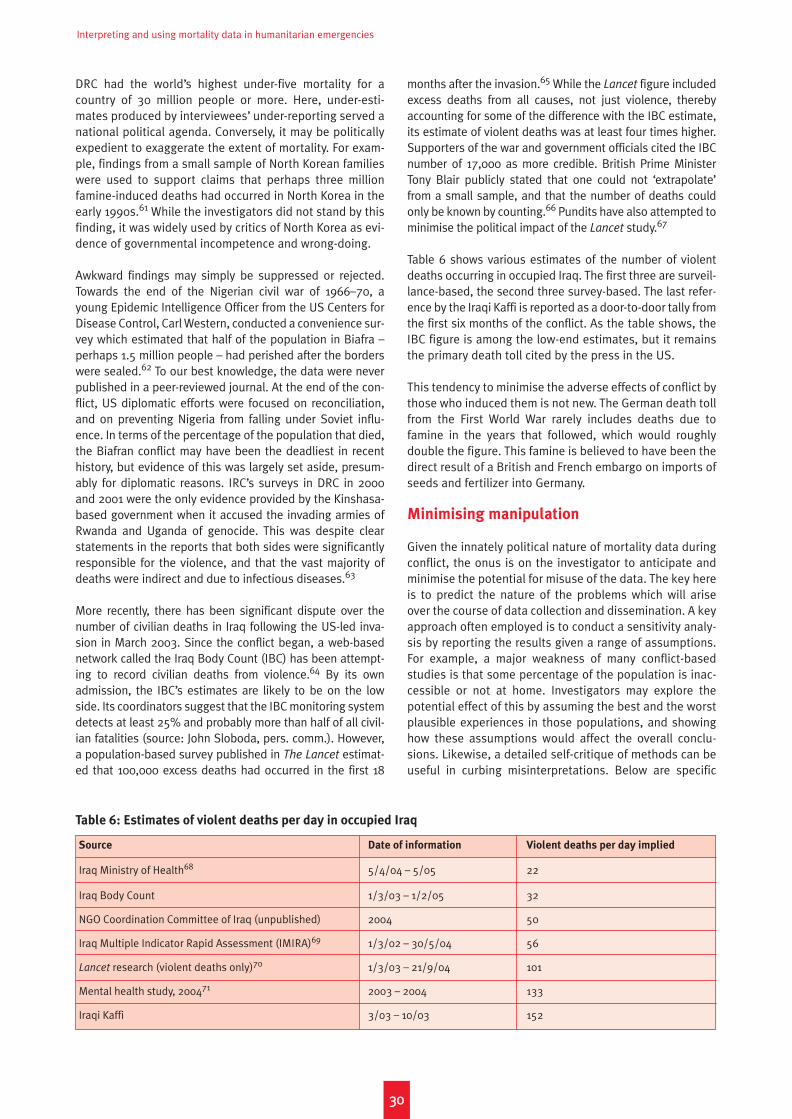
Interpreting and using mortality data in humanitarian emergencies
DRC had the world’s highest under-five mortality for acountry of 30 million people or more. Here, under-esti-mates produced by interviewees’ under-reporting served anational political agenda. Conversely, it may be politicallyexpedient to exaggerate the extent of mortality. For exam-ple, findings from a small sample of North Korean familieswere used to support claims that perhaps three millionfamine-induced deaths had occurred in North Korea in theearly 1990s.61 While the investigators did not stand by thisfinding, it was widely used by critics of North Korea as evi-dence of governmental incompetence and wrong-doing.
Awkward findings may simply be suppressed or rejected.Towards the end of the Nigerian civil war of 1966–70, ayoung Epidemic Intelligence Officer from the US Centers forDisease Control, Carl Western, conducted a convenience sur-vey which estimated that half of the population in Biafra –perhaps 1.5 million people – had perished after the borderswere sealed.62 To our best knowledge, the data were neverpublished in a peer-reviewed journal. At the end of the con-flict, US diplomatic efforts were focused on reconciliation,and on preventing Nigeria from falling under Soviet influ-ence. In terms of the percentage of the population that died,the Biafran conflict may have been the deadliest in recenthistory, but evidence of this was largely set aside, presum-ably for diplomatic reasons. IRC’s surveys in DRC in 2000and 2001 were the only evidence provided by the Kinshasa-based government when it accused the invading armies ofRwanda and Uganda of genocide. This was despite clearstatements in the reports that both sides were significantlyresponsible for the violence, and that the vast majority ofdeaths were indirect and due to infectious diseases.63
More recently, there has been significant dispute over thenumber of civilian deaths in Iraq following the US-led inva-sion in March 2003. Since the conflict began, a web-basednetwork called the Iraq Body Count (IBC) has been attempt-ing to record civilian deaths from violence.64 By its ownadmission, the IBC’s estimates are likely to be on the lowside. Its coordinators suggest that the IBC monitoring systemdetects at least 25% and probably more than half of all civil-ian fatalities (source: John Sloboda, pers. comm.). However,a population-based survey published in The Lancet estimat-ed that 100,000 excess deaths had occurred in the first 18
months after the invasion.65 While the Lancet figure includedexcess deaths from all causes, not just violence, therebyaccounting for some of the difference with the IBC estimate,its estimate of violent deaths was at least four times higher.Supporters of the war and government officials cited the IBCnumber of 17,000 as more credible. British Prime MinisterTony Blair publicly stated that one could not ‘extrapolate’from a small sample, and that the number of deaths couldonly be known by counting.66 Pundits have also attempted tominimise the political impact of the Lancet study.67
Table 6 shows various estimates of the number of violentdeaths occurring in occupied Iraq. The first three are surveil-lance-based, the second three survey-based. The last refer-ence by the Iraqi Kaffi is reported as a door-to-door tally fromthe first six months of the conflict. As the table shows, theIBC figure is among the low-end estimates, but it remainsthe primary death toll cited by the press in the US.
This tendency to minimise the adverse effects of conflict bythose who induced them is not new. The German death tollfrom the First World War rarely includes deaths due tofamine in the years that followed, which would roughlydouble the figure. This famine is believed to have been thedirect result of a British and French embargo on imports ofseeds and fertilizer into Germany.
Minimising manipulation
Given the innately political nature of mortality data duringconflict, the onus is on the investigator to anticipate andminimise the potential for misuse of the data. The key hereis to predict the nature of the problems which will ariseover the course of data collection and dissemination. A keyapproach often employed is to conduct a sensitivity analy-sis by reporting the results given a range of assumptions.For example, a major weakness of many conflict-basedstudies is that some percentage of the population is inac-cessible or not at home. Investigators may explore thepotential effect of this by assuming the best and the worstplausible experiences in those populations, and showinghow these assumptions would affect the overall conclu-sions. Likewise, a detailed self-critique of methods can beuseful in curbing misinterpretations. Below are specific
3300
Table 6: Estimates of violent deaths per day in occupied Iraq
Source Date of information Violent deaths per day implied
Iraq Ministry of Health68 5/4/04 – 5/05 22
Iraq Body Count 1/3/03 – 1/2/05 32
NGO Coordination Committee of Iraq (unpublished) 2004 50
Iraq Multiple Indicator Rapid Assessment (IMIRA)69 1/3/02 – 30/5/04 56
Lancet research (violent deaths only)70 1/3/03 – 21/9/04 101
Mental health study, 200471 2003 – 2004 133
Iraqi Kaffi 3/03 – 10/03 152
Chapter 5 The politics of mortality
problems, and measures to reduce those biases in themortality reporting process.
• Interviewers are making up deaths. Have investigatorswith interviewers as much as possible, make sure thatsome trusted investigators are locals or fluent in thelocal dialect, investigators are shown a death certifi-cate or a grave for a sample or all decedents, analysedata to see if some interviewers have disparate results.
• Interviewers are hiding deaths. Have investigatorswith interviewers as much as possible, make sure thatsome trusted investigators are locals or fluent in thelocal dialect, revisit a subset of households with trust-ed or new interviewers, attempt to confirm findingswith local official records (which, however, almostalways underestimate mortality).
• Those who need to act will not accept the results.
Avoid inflammatory language or recommendations, fol-low a peer-reviewed publication process, develop acadre of experts who can explain or defend the data, beconservative in the reporting of the data.
• Groups are taking data out of context and overstating
the results. Be conservative in the presentation ofresults, have a detailed limitations section describinghow the data should not be interpreted or used, devel-op a cadre of experts who are familiar with both thedata and the methods, who can explain or defend thedata and publicly correct any misuses of the data.
Final thoughts
Measuring mortality in times of war is a complex and politi-cally volatile operation. Leaders in the field suggest that oneside is usually responsible for most civilian deaths.72 Thus,the results of mortality surveys often have the effect of
accusing a particular group or regime of murder. Adding tothe volatility of the subject is the fact that no organisation ischarged with documenting deaths in times of war. Thosethat do so are usually self-selected, driven by humanitarianimperatives, and working for a non-governmental agencywith limited political clout. In most major conflicts a deathtoll is never established while the fighting is under way.Thus, not only is the subject of war deaths political in nature,but the media and world community at large have littleopportunity to digest and respond to death-toll information.
For some, the political nature of mortality is itself an argu-ment against acquiring data on it. But if the purpose ofpublic health data is to avert death and suffering, wartimemortality data should have a higher priority than datashowing the number of cases in a disease outbreak, orother epidemiological data commonly collected. This isbecause war-related deaths are all within human control,but the field of war epidemiology is so nascent that thetools for preventing these deaths, be they legal, military ormedia-based, are largely undeveloped. The political atten-tion given to estimates of conflict-induced death has thepotential to set precedents and influence future conflictsand the development of International Humanitarian Law. Atpresent, when water supplies are destroyed or people fleefrom their homes and die from the indirect consequencesof violence, there is no mechanism by which internationallaw can try the perpetrators. Because indirect deaths usu-ally outnumber violent deaths, this means that most of themortality induced by combatants is ignored. Through theconsistent and rigorous collection of mortality estimates,the perpetrators of war can be held responsible for theiractions, and the wealthy societies that sponsor wars inplaces like Chechnya and Iraq may for once be brought tounderstand the consequences of their actions.
3311

3322
Is there a right to good data?
In February 2005, a report by the Washington Post rightlyreferred to mortality estimates in Darfur as ‘statisticalanarchy’.73 At the time of writing, disparate attempts,essentially based on extrapolation and educated guess-work, have been made to quantify the death toll from thatconflict.74 In this confusion of figures, we may perhapslose sight of two critical points. First, these rough esti-mates are the response of civil society to a government’sdenial of killing, rape, pillage and other atrocities conduct-ed by militia operating with its connivance and/or opensupport; they are an attempt to quantify the humanitariandisaster caused by these attacks, measure the level of vio-lence, and thereby give some voice to the survivors.Second, ‘statistical anarchy’ is inevitable when govern-ments discourage or openly obstruct the objective assess-ment of the health status of populations in crises, andwhen combatants threaten relief workers75 or intimidatevictims.76 Preventing the collection and dissemination ofobjective data on the plight of a conflict-affected popula-tion, or manipulating existing figures, are stratagemsthrough which belligerents try to forestall public scrutiny oftheir actions and intents. Missing and misleading data canbe as deadly as shells. In future crises, we must demandmore strongly unfettered access for the scientific assess-ment of what affected populations have undergone, andwhat they require for dignified survival.
Mechanisms for collecting mortality data
Even where there is reasonably good access, resources forsurveys are sometimes allocated inadequately and toolate; good-quality prospective surveillance systems areusually not considered a programmatic priority; and reliefagencies may act without coordination and without properreflection about what sort of data they need. Mechanismsshould thus urgently be put in place to:
• establish the magnitude of an emergency from the out-set;
• implement mortality surveillance systems and/or regu-lar monitoring surveys; and
• where humanitarian assistance arrives too late, docu-ment the past health impact of any crisis.
The kind of comprehensive, geographically representativedata necessary to evaluate a relief operation in its entiretycan best be collected when agencies work in coordinationand pool their resources, while assigning the implementa-tion of epidemiological work to a reputed, impartialresearch body. Well-planned, sufficiently sampled surveyscovering the entire population affected by a crisis willremove the need for risky extrapolation of scarce site-spe-cific mortality findings. The budgets of large relief opera-
tions can easily run into tens of millions of dollars a year;even a region-wide comprehensive survey will rarely costmore than $100,000, and will usually cost less. It does notseem unreasonable to use 1% (or even 5%) of a reliefbudget to help assess whether the other 99% (or 95%) ishaving an impact. The point is not to do many surveys, butto do a few well: ideally, epidemiologists should aim forredundancy.
Who should carry out such surveys? Ideally, documentingdeath and suffering occurring in or induced by UN memberstates should fall within the functions of UN agenciesthemselves. In the past, the UN has largely not fulfilled thisrole. NGOs and academic centres have partly filled the gap,establishing a proven track record in implementing surveysand surveillance systems. Recently, however, the WorldHealth Organisation has successfully led region-wide mor-tality assessments in both Darfur and northern Uganda.Direct UN involvement may not always be possible, espe-cially if the survey objectives include documenting pastviolence and abuses: typically, this is due to stringentsecurity rules or the vital need to maintain relations withbelligerent parties. In such cases, however, the UN shouldactively support and empower an impartial, reputableagency or academic institution to collect mortality data,and insist on seeking out full documentation on the impactof the crisis.
A standardised approach
As the centrality of mortality figures is increasingly accept-ed, an increasing onus is placed on epidemiologists andagencies sponsoring their work to collect good-qualitydata. The consequences of bad science can be counted inhuman lives when, on the basis of incorrect findings, agen-cies or donors decide to scale down or abandon life-savingactivities, or allocate them improperly. Standardisation ofmethods is probably the best guarantee against biased,imprecise and otherwise contestable results, especially ifmore agencies become involved in the collection of mor-tality data. We have attempted to lay out certain corerequirements of any mortality-data collection, such as theproper training of home visitors, regular updating of popu-lation figures and an adequate sample size. TheStandardised Monitoring and Assessment of Relief andTransitions (SMART) initiative is developing guidelines andtools for mortality and other emergency assessments, andhas published a step-by-step protocol for nutrition andmortality assessments.77 Such initiatives are welcome, butthe challenge will lie in disseminating these standards.
Making sure that there is professional capacity to collectand interpret valid health data is as important as standar-dising methods. Experienced epidemiologists are in shortsupply: as with other health professionals, many tend to
3333
Chapter 6
Conclusion
Interpreting and using mortality data in humanitarian emergencies
leave the humanitarian sector for more stable work. In thisrespect, not-for-profit institutes with a strong link to fieldoperations and proven scientific expertise, such asEpicentre or some academic centres of excellence, are des-perately needed to infuse experience and judgment intoorganisations wishing to collect and use mortality data.
Reporting and interpretation
We have attempted to provide basic suggestions for inter-preting point estimates and confidence intervals, perform-ing interpolation and extrapolation, and acting on the basisof imperfect data. There is, however, a need for further dis-cussion and consensus-building among epidemiologistsand relief programme managers, to ensure that consisten-cy and scientific rigour prevail in the reporting and use ofmortality data. Likewise, resources for fast expert review ofstudy protocols and reports should be made available toless experienced research teams.
Further discussion on emergency thresholds will also beuseful, since there is an obvious divergence of approach(for example, between Sphere and other institutions):standardising these thresholds internationally can only bebeneficial and guarantee equal assessment of any crisis. Atthe same time, the discussion on thresholds must notdivert attention from the primary aim of humanitarian pro-grammes, namely reducing any excess mortality. In sum-mary, thresholds are still needed so as to set targets thatrelief operations must be geared to reach. Data on excessmortality, however, are equally needed so as to highlightthe limits of relief and the need for political action toaddress the root causes of mortality, as well as giving ameasure of the gap still to be bridged.
A call for action
The worst fate of a mortality report is oblivion. We do notknow how many of the mortality studies performed in thepast have actually led to significant improvements in thehealth status of surveyed communities. An analysis of these
studies’ operational impact would be very helpful in clarify-ing this. What is clear, however, is that in many crises excessmortality remains unacceptably high, and neither humani-tarian assistance nor measures to protect civilians can beconsidered sufficient. In the case of Darfur, the DRC, Ugandaand many other emergencies, the evidence of mortality hasfailed to elicit an appropriate international response.
Nevertheless, epidemiology in general, and mortality stud-ies in particular, are increasingly appreciated as key tools toguide humanitarian action and foster respect for humanitar-ian law. The UK Department for International Developmenthas instigated an initiative to refine benchmarks for human-itarian action and impact assessment. Concurrently, there isa drive for the creation of a Humanitarian Severity Index, inwhich mortality data, standardised and understood by allconcerned actors, will be fundamental.
The fact that relief efforts may be unfailingly evaluated bya professional financial accountant but only seldom by aproject evaluation specialist can only decrease the effec-tiveness of aid agencies, and lessen their credibility.Similarly, the incomplete quantification of government-sponsored violence in places like Chechnya and Darfur is amajor blemish on the record of the international communi-ty. We can easily do better, and recording the rates and cir-cumstances of deaths during all crises seems like a mini-mal start. We hope therefore that future years will seemore resources allocated in a timely fashion to operationalresearch, and that mortality findings in emergencies willhelp to hold combatants, host governments, relief agen-cies, donors, international governments and the mediaaccountable for their failures to respect, protect and assistaffected populations. Equally, these studies may docu-ment successes in the management of crises. Mortality-data collection should continue to be conducted in a spiritof impartial and needs-driven humanitarianism, with theprimary purpose of improving assistance to populations inneed. The responsibility for properly interpreting and usingthese data lies, not just with scientists, but with the entirerelief community.
3344
Some of the terms below have a more general meaning in
epidemiology. Here we present their specific meaning in
the context of mortality-data collection.
Age-adjusted mortality rate: mortality rate that takes intoaccount the age structure of the population to which itrefers. Used to compare mortality in populations withvery different age structures.
Age-sex pyramid: graph of the sex and age-group distribu-tion of the population. Used in mortality studies toobserve possible alterations in the demographics ofthe population as a result of high mortality or popula-tion loss in a particular age group or sex.
Age-specific mortality rate: mortality rate in a specific agegroup. See under-5 mortality rate for an example.
Baseline mortality rate: mortality rate before the crisis(similar to non-crisis mortality rate).
Bias: systematic error during data collection which resultsin a distortion of the findings (in mortality studies, anover- or under-estimation of mortality).
Case-fatality ratio or rate: the proportion of cases of agiven disease that result in death. Often abbreviated toCFR.
Cause-specific mortality rate: the mortality rate due to aspecific disease (e.g. cholera) or phenomenon (e.g. violence).
Child mortality rate: the number of children under fiveyears of age dying per 1,000 live births in a given year.
Cluster sampling: a sampling design commonly used inretrospective mortality surveys when comprehensivelists of individual households cannot be obtained.Clusters are groups of households of which the first ischosen at random, and the remainder by a rule of prox-imity (e.g. second closest). In a cluster mortality survey,30 or more clusters are usually sampled from the targetstudy population, and each cluster usually contains atleast 30 households.
CMR: see crude mortality rate.Confidence interval: a range that expresses the level of
approximation, or imprecision, around the point esti-
mate. Also known as a margin of error. 95% confidenceintervals are usually presented: we are thus 95% confi-dent that the true population estimate lies within therange of the confidence interval.
Convenience survey: survey that is not based on a ran-domly selected, representative sample, but rather ondata from households/individuals that can easily bereached or observed (e.g. people standing in a food-distribution queue).
Crude mortality rate: mortality rate among all age groupsand due to all causes. Often abbreviated to CMR.
Death rate: equivalent to mortality rate (some authorsprefer the former).
Design effect: phenomenon caused by cluster sampling,and which increases the sampling error or imprecision.
Households/individuals within a cluster resemble eachother because of their proximity, thus resulting in anoverall loss in sampling variability.
Emergency threshold: mortality rate above which an emer-gency is said to be occurring. Usually taken as a crude
mortality rate of 1 per 10,000 per day, or as an under-5
mortality rate of 2 per 10,000 per day.Excess mortality, excess mortality rate: mortality above
what would be expected based on the non-crisis mor-
tality rate in the population of interest. Excess mortali-ty is thus mortality that is attributable to the crisis con-ditions. It can be expressed as a rate (the differencebetween observed and non-crisis mortality rates), or asa total number of excess deaths.
Extrapolation: mathematical attempt to extend the find-ings of a mortality study to a population and/or periodthat was not represented by the sample.
Imprecision: phenomenon whereby there is a lot of uncer-tainty or approximation around a point estimate
obtained from a sample (does not apply to surveillancedata which reflect the entire population, or to studies inwhich each household is interviewed). Imprecision isreflected in the width of the confidence interval aroundthe point estimate. There is always some imprecisionin a result based on a sample. The degree of impreci-sion of a mortality estimate is determined by sample
size, length of the recall period, sampling design anddesign effect (if any), and the mortality rate itself.
Infant mortality rate: number of infants below one year olddying per 1,000 live births in a given year.
Interpolation: mathematical process by which mortality-rate findings are applied to the entire population thatthe study is representative of, so as to obtain totalnumbers of deaths or percentages of the populationthat died over the recall period investigated.
Maternal mortality ratio: number of women dying of preg-nancy-related causes out of 100,000 live births in agiven year.
Mid-period population: estimated population at risk at themiddle point of the recall period. Used in the routinesimplified expression of mortality rate.
Mid-point population: see mid-period population.Mortality rate: number of deaths occurring in a given popu-
lation at risk during a specified time period (also knownas the recall period). In emergencies, usually expressedas deaths per 10,000 persons per day; alternatively, asdeaths per 1,000 persons per month or per year.
Non-crisis mortality rate: mortality rate which would beexpected to occur in a given population if there were nocrisis.
Non-sampling error: see bias.Non-systematic error: see imprecision.Person-time: cumulative time spent by each individual
at risk in the population. Used in the formal expressionof mortality rates, and necessary when comparing
3355
Annex 1
Glossary
Interpreting and using mortality data in humanitarian emergencies
mortality rates in periods that are different in length foreach individual in the population (e.g. before versusafter arrival to a camp).
Point estimate: most likely value for the parameter ofinterest (e.g. crude mortality rate) obtained through asample survey. A point estimate should always beaccompanied by a confidence interval.
Population-proportional sampling: approach to selectionof clusters or households to be sampled, whereby morepopulous sections of the study area are allocated pro-portionately more clusters or households.
Proportionate mortality: fraction of all deaths due to aspecific cause.
Recall bias: bias due to imperfect recall by questionnairerespondents of events in their households. Usuallyresults in an under-estimation of mortality.
Recall period: period of interest in the measurement of amortality rate, i.e. the interval of time to which the mor-tality rate in a given population refers.
Reporting bias: bias due to (often intentional) under- orover-reporting of information, such as number ofdeaths or household size.
Sample size: number of clusters/households/individualsthat a survey sets out to include, i.e. interview.
Sampling design: method by which households to be sam-pled are selected within the target population.
Sampling error: see imprecision.Sampling frame: list of households, or sub-sections of the
study area/population, used to allocate clusters orselect households to be sampled.
Sampling step: distance between one sampled cluster andthe next, or one sampled household and the next, onthe sampling frame.
Selection bias: type of bias whereby a specific kind ofhousehold is systematically excluded from the survey,and thus not represented in the results. May result inboth over- and under-estimation of mortality.
Simple random sampling: sampling design whereby anindividual sampling frame of households is estab-lished, and households to be sampled are selectedusing random numbers.
Spatial sampling: approach to selection of clusters orhouseholds to be sampled, whereby clusters and/orhouseholds are allocated proportionately to surfacearea within the study area. Alternative to population-
proportional sampling.Stratification: sampling and analysis of sub-groups or sub-
periods.Surveillance (prospective): ongoing collection of epidemi-
ological data, with real-time analysis. Mortality surveil-lance systems usually rely on home visitors who recorddeaths in households on a weekly basis.
Survey (retrospective): study of past mortality in a popu-lation using a standardised questionnaire that isadministered to the entire population or, more com-monly, to a randomly selected sample.
Survival bias: type of selection bias specific to retro-spective surveys, whereby households that disappearduring the recall period because of the death of allmembers and consequent disintegration are not rep-resented in the sample. It occurs when high and/orvery clustered mortality persists for a long period.Survival bias always results in an under-estimation ofmortality.
Systematic error: see bias.Systematic random sampling: sampling design whereby
an individual sampling frame of households is estab-lished, and households to be sampled are selectedusing a constant sampling step (i.e. every nth house-hold).
Under-5 mortality rate: number of deaths occurring in agiven population of under-five children during a speci-fied time period. Often abbreviated to U5MR.
3366
1 R. F. Mollica et al., ‘Mental Health in Complex Emergencies’, The
Lancet, 2004;364(9450):2058–67.
2 See ‘Niger Leader “Ignorant” of Hunger’, BBC News, 12 August
2005, http://news.bbc.co.uk/2/hi/africa/4144642.stm.
3 P. Salama, P. Spiegel, L. Talley and R. Waldman, ‘Lessons Learned
from Complex Emergencies Over Past Decade’, The Lancet,
2004;364(9447):1801–13.
4 ‘Niger Leader “Ignorant” of Hunger’.
5 Centers for Disease Control, ‘Famine-affected, Refugee, and
Displaced Populations: Recommendations for Public Health
Issues’, MMWR Recomm Rep, 1992;41(RR-13):1-76; Sphere
Project, Sphere Handbook, revised ed., 2004, www.spherepro-
ject.org.
6 M. J. Toole and R. J. Waldman, ‘Prevention of Excess Mortality in
Refugee and Displaced Populations in Developing Countries’,
JAMA, 1990;263(24):3296–302.
7 UNHCR, Handbook for Emergencies, second ed. (Geneva: UNHCR,
2000).
8 D. Guha-Sapir and O. Degomme, Darfur: Counting the Deaths
(Brussels: Centre for Research on the Epidemiology of Disasters,
2005).
9 P. Salama et al., ‘Lessons Learned from Complex Emergencies over
Past Decade’, The Lancet, 2004;364(9447):1801–13; Médecins
Sans Frontières, Refugee Health: An Approach to Emergency
Situations (London: Macmillan Education Ltd, 1997); Epicentre,
Rapid Health Assessment of Refugee or Displaced Populations
(Paris: Médecins Sans Frontières, 1999); UNHCR, Handbook for
Emergencies, second ed. (Geneva: UNHCR, 2000); Sphere Project,
Sphere Handbook, revised ed., 2004, www.sphereproject.org.
10 L. Roberts and M. J. Toole, ‘Cholera Deaths in Goma’, The Lancet,
1995;346(8987):1431 ; T. Grein, F. Checchi, J. M. Escriba et al.,
‘Mortality Among Displaced Former UNITA Members and Their
Families in Angola: A Retrospective Cluster Survey’, BMJ,
2003;327(7416):650.
11 Centers for Disease Control, ‘Public Health Consequences of Acute
Displacement of Iraqi Citizens – March–May 1991’, MMWR Morb
Mortal Wkly Rep, 1991;40(26):443–7.
12 World Health Organisation, Health and Mortality Survey among
Internally Displaced Persons in Gulu, Kitgum and Pader Districts,
Northern Uganda (Geneva: WHO, 2005).
13 P. S Moore et al., ‘Mortality Rates in Displaced and Resident
Populations of Central Somalia During 1992 Famine’, The Lancet,
1993;341(8850):935–8; Goma Epidemiology Group, ‘Public Health
Impact of Rwandan Refugee Crisis: What Happened in Goma,
Zaire, in July, 1994?’, The Lancet, 1995;345(8946):339–44; P.
Nabeth, M. J. Michelet, G. Le Gallais and W. Claus, ‘Demographic
and Nutritional Consequences of Civil War in Liberia’, The Lancet,
1997;349(9044):59–60; H. Creusvaux et al., ‘Famine in Southern
Sudan’, The Lancet, 1999;354(9181):832; P. Salama et al.,
‘Malnutrition, Measles, Mortality, and the Humanitarian Response
During a Famine in Ethiopia’, JAMA, 2001;286(5):563–71; N. Ford
‘Slow Response to Angola’s Food Crisis’, The Lancet,
2002;360(9329):334–61; E. Depoortere, F. Checchi, F. Broillet et
al., ‘Violence and Mortality in West Darfur, Sudan (2003–04):
Epidemiological Evidence from Four Surveys’, The Lancet,
2004;364(9442):1315–20.
14 Sphere Handbook, 2004; MSF, Refugee Health: An Approach to
Emergency Situations.
15 P. Salama et al., ‘Malnutrition, Measles, Mortality, and the
Humanitarian Response During a Famine in Ehiopia’, JAMA,
2001;286(5):563–71.
16 Moore et al., ‘Mortality Rates in Displaced and Resident
Populations of Central Somalia’.
17 Mike Toole, personal communication.
18 B. Coghlan et al., Mortality in the Democratic Republic of Congo:
Results from a Nationwide Survey (Conducted April–July 2004)
(New York: International Rescue Committee, 2004).
19 L. Roberts, unpublished observations.
20 L. Roberts, R. Garfield, J. Khudhairi and G. Burnham, ‘Mortality
Before and After the 2003 Invasion of Iraq: Cluster Sample Survey’,
The Lancet, 2004;364(9448):1857–64.
21 Depoortere, Checchi, Broillet et al., ‘Violence and Mortality in West
Darfur, Sudan’; F. Grandesso et al., ‘Mortality and Malnutrition
Among Populations Living in South Darfur, Sudan: Results of 3
Surveys, September 2004’, JAMA, 2005;293(12):1490–4.
22 N. Nathan, M. Tatay, P. Piola, S. Lake and V. Brown, ‘High Mortality
in Displaced Populations of Northern Uganda’, The Lancet, 2004;
363(9418):1402.
23 WHO, Health and Mortality Survey Among Internally Displaced
Persons in Gulu, Kitgum and Pader Districts.
24 P. B. Spiegel and P. Salama, ‘War and Mortality in Kosovo,
1998–99: An Epidemiological Testimony’, The Lancet, 2000;355
(9222):2204–9.
25 Depoortere, Checchi, Broillet et al., ‘Violence and Mortality in
West Darfur, Sudan’.
26 Nathan et al., ‘High Mortality in Displaced Populations of Northern
Uganda’.
27 N. Binkin, K. Sullivan, N. Staehling and P. Nieburg, ‘Rapid Nutrition
Surveys: How Many Clusters Are Enough?’, Disasters,
1995;16:97–103; J. Katz, ‘Sample-size Implications for Population-
based Cluster Surveys of Nutritional Status’, Am J Clin Nutr, 1995;
61(1):155–60.
28 Depoortere, Checchi, Broillet et al., ‘Violence and Mortality in West
Darfur, Sudan’.
29 Francesco Checchi, unpublished observations.
30 B. A. Woodruff, ‘Measuring Mortality Rates in Cross-Sectional
Surveys: A Commentary’, Field Exchange, 2002;17:16–22.
31 Adapted from D. Legros, C. Paquet and P. Nabeth, ‘The Evolution of
Mortality Among Rwandan Refugees in Zaire Between 1994 and
1997’, in National Research Council (ed.), Forced Migration and
Mortality (Washington DC: National Academies Press, 2001): 52–68.
32 M. A. Myatt, ‘A Method for Estimating Mortality Rates Using
Previous Birth History’, Field Exchange, 2002;17:13–15.
33 W. R. Taylor, A. Chahnazarian, J. Weinman et al., ‘Mortality and Use
of Health Services Surveys in Rural Zaire’, Int J Epidemiol, 1993;22
Suppl 1; S. R. Becker, F. Diop and J. N. Thornton, ‘Infant and Child
Mortality in Two Counties of Liberia: Results of a Survey in 1988
and Trends Since 1984’, Int J Epidemiol, 1993;22 Suppl 1:S56–63.
3377
Notes
Interpreting and using mortality data in humanitarian emergencies
34 D. Chandramohan, G. H. Maude, L. C. Rodrigues and R. J. Hayes,
‘Verbal Autopsies for Adult Deaths: Their Development and
Validation in a Multicentre Study’, Trop Med Int Health,
1998;3(6):436–46.
35 Standardised Monitoring and Assessment of Relief and Transitions
programme (SMART), SMART Methodology, version 1, 2005.
36 Centers for Disease Control, ‘Public Health Consequences of Acute
Displacement of Iraqi Citizens’.
37 Amnesty International, ‘Sudan, Darfur – Rape as a Weapon of War’,
2004.
38 V. Brown et al., ‘Rapid Assessment of Population Size By Area
Sampling in Disaster Situations’, Disasters, 2001;25(2):164–71.
39 L. P. Boss, M. J. Toole and R. Yip, ‘Assessments of Mortality,
Morbidity, and Nutritional Status in Somalia during the 1991–1992
Famine: Recommendations for Standardization of Methods’, JAMA,
1994;272(5):371–6.
40 P. B. Spiegel, P. Salama, S. Maloney and A. van der Veen, ‘Quality
of Malnutrition Assessment Surveys Conducted During Famine in
Ethiopia’, JAMA, 2004;292(5):613–8.
41 Depoortere, Checchi, Broillet et al., ‘Violence and Mortality in West
Darfur, Sudan’.
42 Goma Epidemiology Group, ‘Public Health Impact of Rwandan
Refugee Crisis’.
43 Spiegel and Salama, ‘War and Mortality in Kosovo’.
44 Coghlan et al., Mortality in the Democratic Republic of Congo:
Results from a Nationwide Survey.
45 Roberts et al., ‘Mortality Before and After the 2003 Invasion of
Iraq’.
46 D. Nabarro, Sudan: Mortality Projections for Darfur (Geneva: World
Health Organisation, 2004); Guha-Sapir and Degomme, Darfur:
Counting the Deaths.
47 Grein et al., ‘Mortality Among Displaced Former UNITA Members
and Their Families in Angola’.
48 K. Kallander, J. Nsungwa-Sabiiti and S. Peterson, ‘Symptom
Overlap for Malaria and Pneumonia – Policy Implications for Home
Management Strategies’, Acta Trop, 2004;90:211–14.
49 R. E Black, S. S. Morris and J. Bryce, ‘Where and Why Are 10 Million
Children Dying Every Year?’, The Lancet, 2003;361(9376):2226–34.
50 SMART Methodology, version 1.
51 R. M. Anderson and R. M. May, Infectious Diseases of Humans:
Dynamics and Control (Oxford: Oxford University Press, 1991).
52 M. A. Connolly et al., ‘Communicable Diseases in Complex
Emergencies: Impact and Challenges, The Lancet,
2004;364(9449):1974–83.
53 F. Checchi, G. Elder, M. Schafer, E. Drouhin and D. Legros,
‘Consequences of Armed Conflict for an Ethnic Karen Population’,
The Lancet, 2003;362(9377):74–5; W. C. Robinson, M. K. Lee, K. Hill
and G. M. Burnham, ‘Mortality in North Korean Migrant
Households: A Retrospective Study’, The Lancet, 1999;354(9175):
291–5.
54 Spiegel et al., ‘War and Mortality in Kosovo, 1998–99’; Coghlan et
al., Mortality in the Democratic Republic of Congo.
55 C. J. Murray, G. King, A. D. Lopez, N. Tomijima and E. G. Krug,
‘Armed Conflict as a Public Health Problem’, BMJ, 2002;
324(7333):346–9; D. Guha-Sapir and W. G. Panhuis, ‘Conflict-relat-
ed Mortality: An Analysis of 37 Datasets’, Disasters, 2004;28(4):
418–28.
56 USAID, Projected Mortality Rates in Darfur, Sudan 2004–2005
(Washington DC: United States Agency for International
Development, 2004).
57 S. Zaidi and M. C. Smith Fawzi, ‘Health of Baghdad’s Children:
Letter to the Editor’, The Lancet, 1995;346(8988):1485.
58 L. Roberts and C. Labula, IRC, unpublished, 2001.
59 Taylor et al., ‘Mortality and Use of Health Services Surveys in Rural
Zaire’; Becker et al., ‘Infant and Child Mortality in Two Counties of
Liberia’.
60 L. Roberts, P. Ngoy, C. Mone et al., Mortality in the Democratic
Republic of the Congo: Results From a Nation-wide Survey (New
York: IRC, March 2003), http://www.theirc.org/DRCongo/
index.cfm.
61 A. Natsios, The Great North Korean Famine: Famine, Politics and
Foreign Policy (Washington DC: US Institute for Peace Press, 2002).
62 CDC, unpublished data.
63 L. Roberts et al., Mortality in the Democratic Republic of the Congo.
64 See http://www.iraqbodycount.org.
65 Roberts et al., ‘Mortality Before and After the 2003 Invasion of Iraq’.
66 ‘Blair Defends Assault on Falluja’, BBC News, 8 November 2004,
http://news.bbc.co.uk/1/hi/uk_politics/3993277.stm.
67 F. Kaplan, ‘100,000 Dead – Or 8,000: How Many Iraqi Civilians Have
Died as a Result of the War?’, Slate, 29 October 2004,
http://slate.msn.com/id/2108887.
68 Provided by R. Garfield, a consultant to the Iraqi Minister of Health,
3 June 2005. Confirmed by the Washington Post, 3 June 2005.
69 See Iraq Living Conditions Survey 2004, UNDP, http://www.iq.
undp.org/ILCS/overview.htm.
70 Roberts et al., ‘Mortality Before and After the 2003 Invasion of Iraq’.
71 C. W. Hoge et al., ‘Combat Duty in Iraq and Afghanistan, Mental
Health Problems, and Barriers to Care’, NEJM, 1 July 2004(351):13–21.
72 C. Bialik, ‘Counting the Civilian Dead in Iraq’, Wall Street Journal
Online, 5 August 2005.
73 ‘Lack of Access Muddies Death Toll in Darfur’, Washington Post, 7
February 2005, http://www.washingtonpost.com/wp-dyn/arti-
cles/A6186-2005Feb7.html.
74 See, for example, E. Reeves, ‘Darfur Mortality Update: June 30,
2005’, 1 July 2005; Guha-Sapir and Degomme, Darfur: Counting
the Deaths; ‘UN’s Darfur Death Estimate Soars’, BBC News, 14
March 2005, http://news.bbc.co.uk/2/hi/africa/4349063.stm; J.
Leaning and M. VanRooyen, ‘An Assessment of Mortality Studies in
Darfur, 2004–2005’, Humanitarian Exchange, no. 30, June 2005;
‘How Many Have Died in Darfur?’, BBC News, 16 February 2005,
http://news.bbc.co.uk/2/hi/africa/4268733.stm.
75 ‘Sudan Charges MSF Man Over Report’, BBC News, 30 May 2005,
http://news.bbc.co.uk/2/hi/africa/4593443.stm.
76 Médecins Sans Frontières, ‘The Crushing Burden of Rape – Sexual
Violence in Darfur’, 2005.
77 See http://www.smartindicators.org.
3388
Related Documents