Nuclear Magnetic Resonance Some atomic nuclei possess angular momentum also referred to as spin. This is given the quantum # I which can have integer and half integer values. Atomic Atomic I Examples Mass Number odd odd 1/2,3/2,.. 1 H, 19 F, 31 P odd even 1/2,3/2,.. 13 C, 17 O, 29 Si even odd 1,2,3, 2 H, 14 N, 10 B even even 0 12 C, 16 O

Welcome message from author
This document is posted to help you gain knowledge. Please leave a comment to let me know what you think about it! Share it to your friends and learn new things together.
Transcript

Nuclear Magnetic Resonance
Some atomic nuclei possess angular momentum alsoreferred to as spin. This is given the quantum # I which
can have integer and half integer values.
Atomic Atomic I ExamplesMass Number
odd odd 1/2,3/2,.. 1H, 19F, 31Podd even 1/2,3/2,.. 13C, 17O, 29Sieven odd 1,2,3, 2H, 14N,10Beven even 0 12C, 16O

When a nucleus is placed in a magnetic field the energy
splits based on the magnetic quantum # m where m goes
from I to –I in steps of 1 so that there are 2I+1 levels.
E Bo=0
+1/2
-1
0
+1
Bo-1/2
I=1/2
I=1
The energy difference between the levels isDE=g(h/2p)B0=hn
Where g (magnetogyric ratio) is a constant for a specific nucleus.
n=(g/2p)B0 is the Larmor Relationship
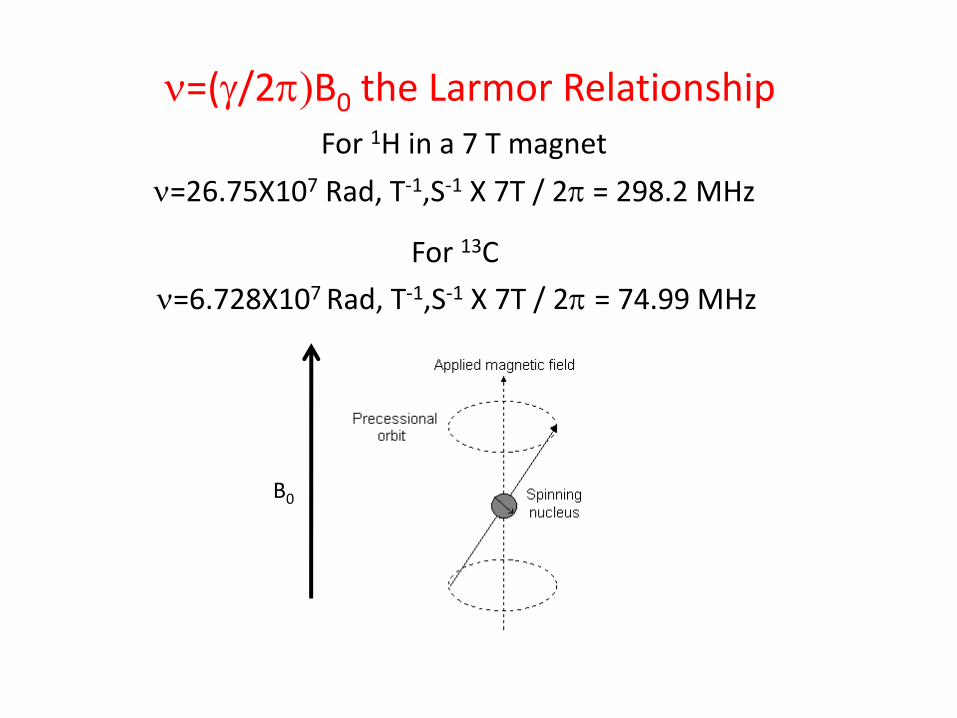
n=(g/2p)B0 the Larmor Relationship
n=26.75X10⁷ Rad, T-1,S-1 X 7T / 2p = 298.2 MHz
For 1H in a 7 T magnet
B0
For 13C
n=6.728X10⁷ Rad, T-1,S-1 X 7T / 2p = 74.99 MHz
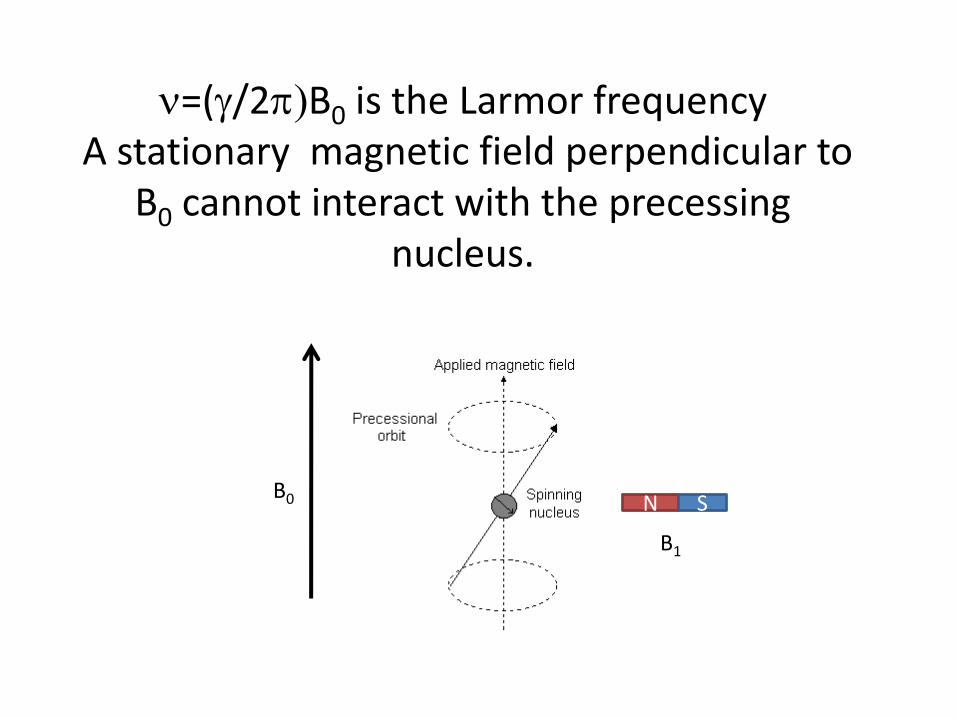
n=(g/2p)B0 is the Larmor frequencyA stationary magnetic field perpendicular to
B0 cannot interact with the precessingnucleus.
N SB0
B1

Oscillating Magnetic Field
Nuclear vector nutates into XY plane
http://www.fis.unipr.it
B1
A magnetic field rotating at the resonance frequency n causes the nucleus to nutate into the
XY plane.

How can one make a rotating magneticfield at the Larmor frequency? An RF signal is an
electromagnetic wave. The sine curvecan be decomposed into two counter
rotating magnetic fields.

n=(g/2p)B0 the Larmor Relationship
Z
X
Y
A voltage is produced in the coilthat oscillates at the precessional
frequency n.

Continuous Wave NMR
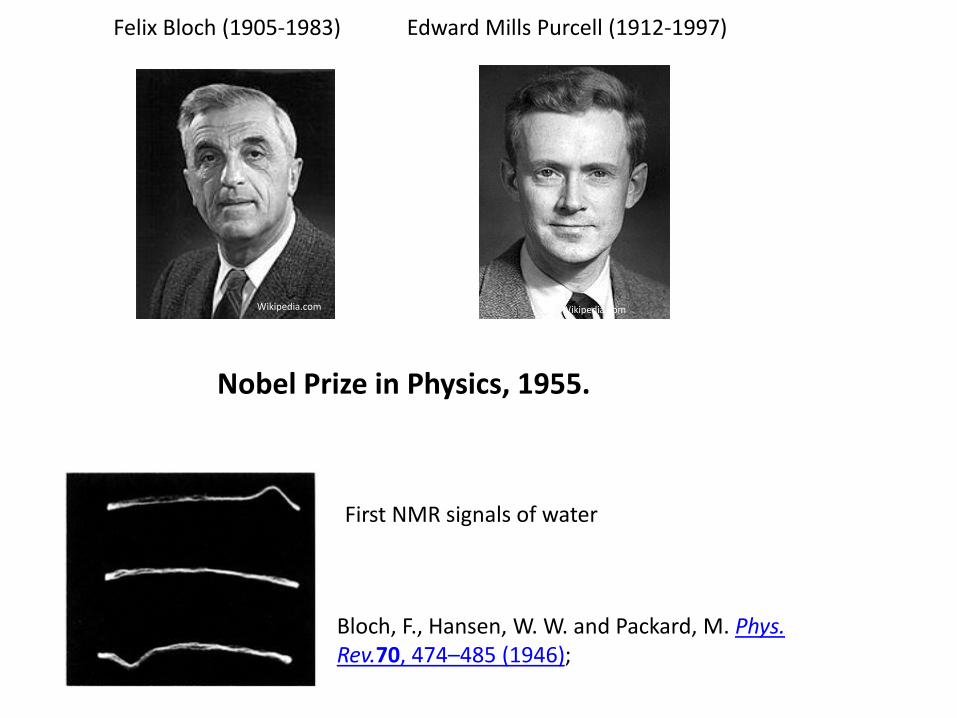
Edward Mills Purcell (1912-1997)
Wikipedia.com
Felix Bloch (1905-1983)
Nobel Prize in Physics, 1955.
Bloch, F., Hansen, W. W. and Packard, M. Phys. Rev.70, 474–485 (1946);
First NMR signals of water
Wikipedia.com

Bloch, F., Hansen, W. W. and Packard, M. Phys. Rev.70, 474–485 (1946);
First NMR signals of water
First NMR signals of ethanol (1951)
w=g (1-s) B0 s: Chemical Shift
CH3-CH2-OH
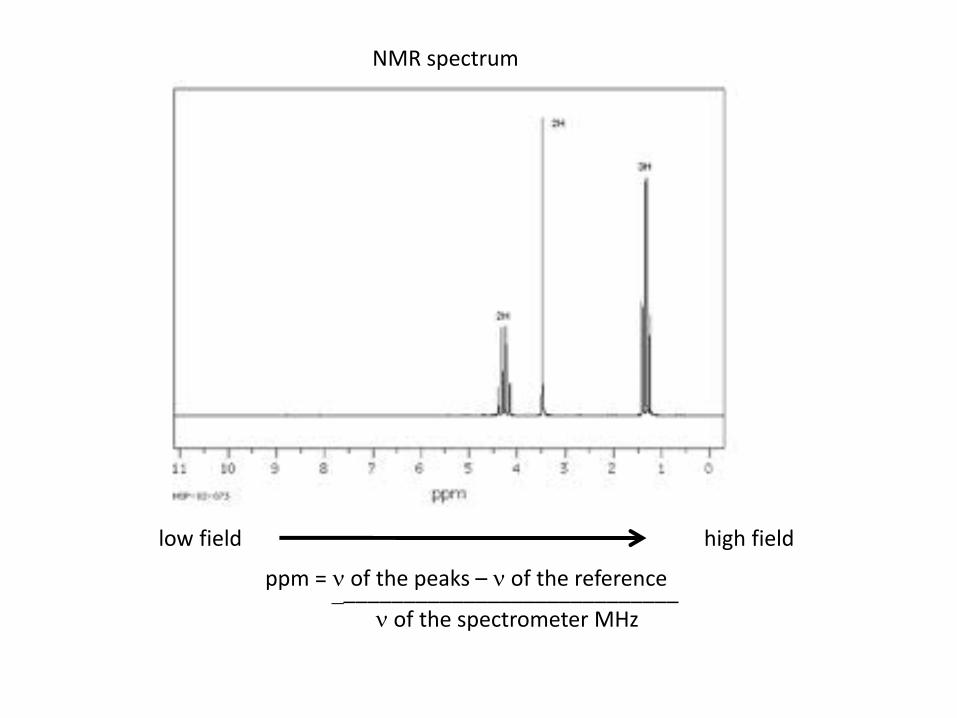
low field high field
NMR spectrum
ppm = n of the peaks – n of the reference
n of the spectrometer MHz_____________________________
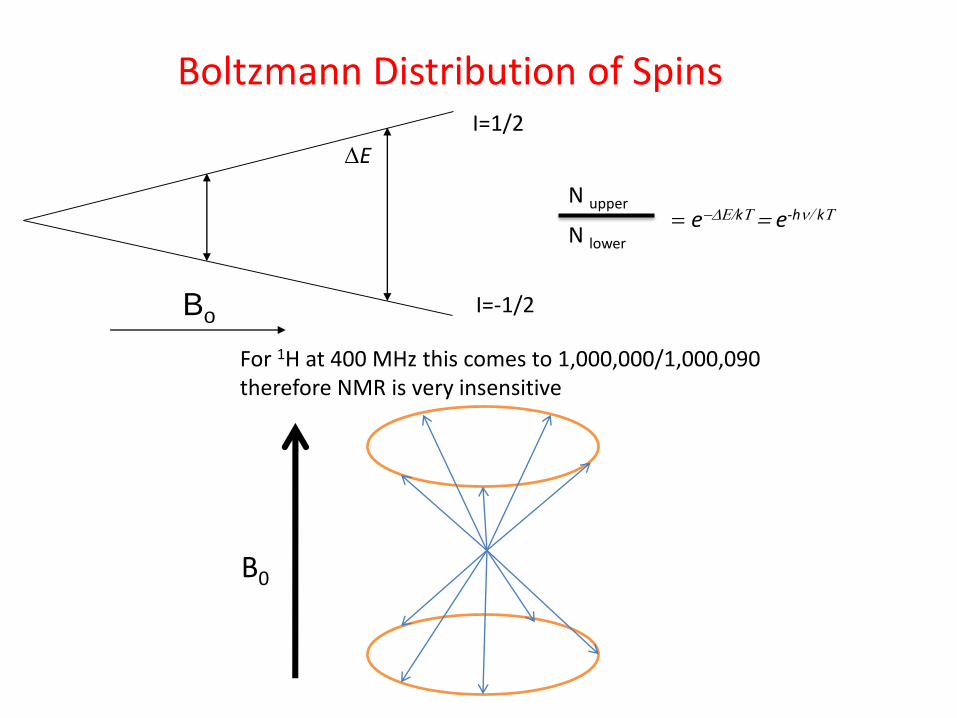
N upper
N lower
= e-DE/kT = e-hn/ kT
For 1H at 400 MHz this comes to 1,000,000/1,000,090therefore NMR is very insensitive
B0
BoI=-1/2
I=1/2
DE
Boltzmann Distribution of Spins
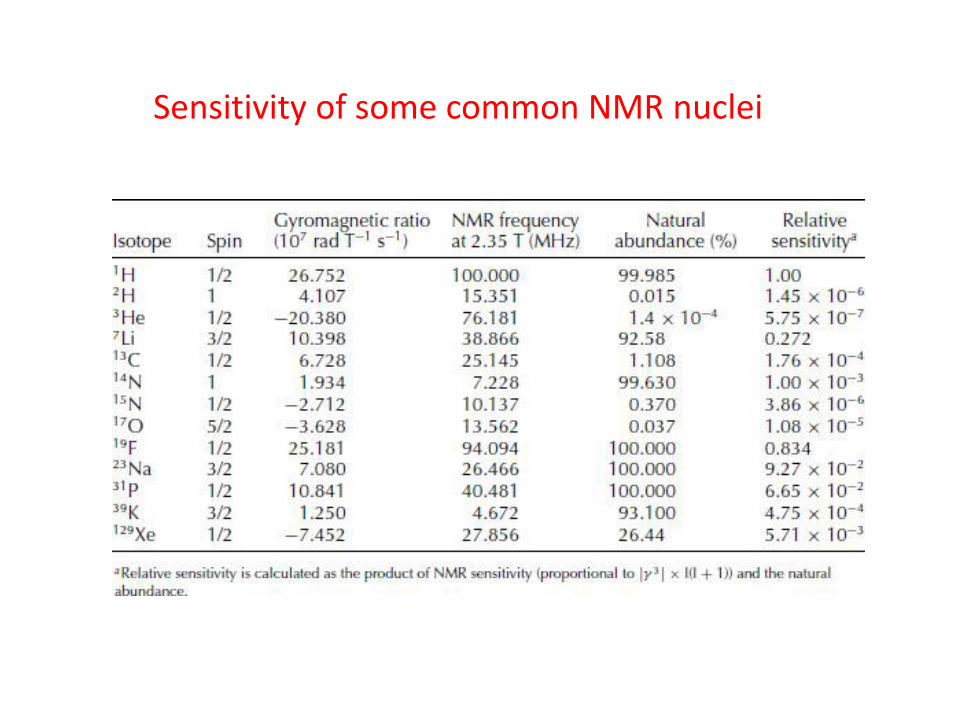
Sensitivity of some common NMR nuclei

If we want to observe a peak 1 Hz wide DE=hn
If n = 1Hz than DE=h
Uncertainty principle states DEDt~h
If DE=h then Dt=1 sec.
For 60 MHz NMR 10ppm = 600 Hz so a scan of 1 hzresolution takes 600 seconds or 10 min.
What is the Problem with Continuous Wave NMR?

NMR is weak so we have a poor signal to noise (S/N) ratio.We can increase the S/N by adding up a number of scans.
The rule is that the S/N increases as the square root of the change in the # of scans.
So to increase the signal to noise by a factor of 2 you need to collect 4 times the number of scans.
Therefore, for a 60 MHz spectrum that takes 10 minutes you would need to collect 4 scans or 40 minutes and for an increase of S/N of 4 times you would need 16 scans or 160 min (2hours 40 min).
What are the consequences of this problem?

How can we generate all frequencies at one time?
Very short square pulses produce a range of frequencies.
tp
Frequency range = +/- 1/tp
Therefore a 10 msec pulse producesa frequency range of +/- 100,000 hz
dsprelated.com
If we could observe all frequencies at one time we couldcollect a complete NMR spectrum in one second.
Solution to this problem
Z
X
Y
Z
X
Y
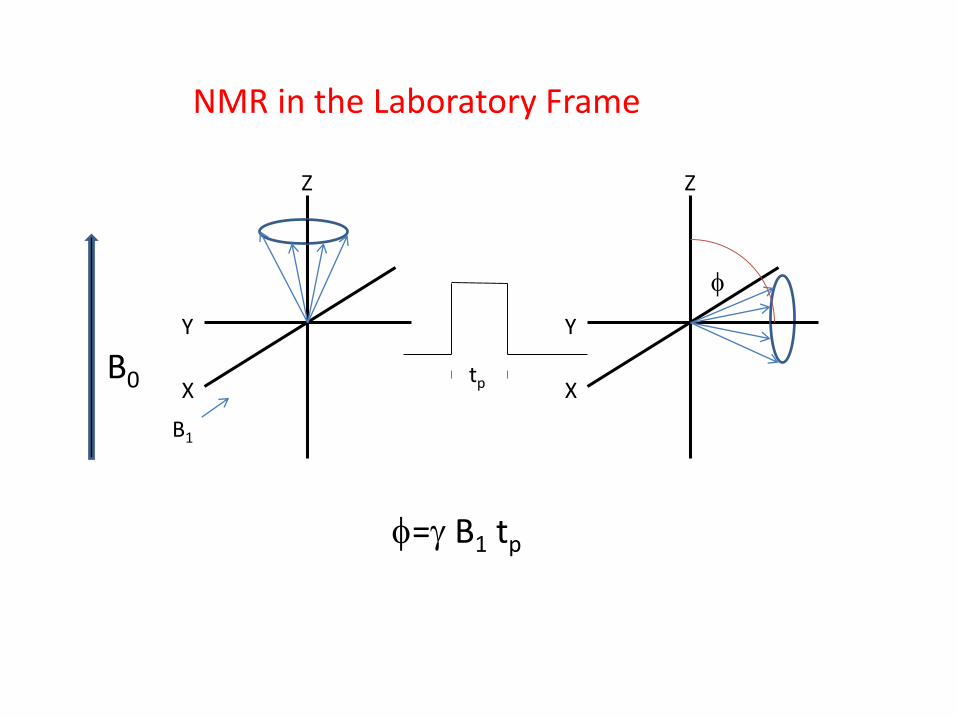
NMR in the Laboratory Frame
tp
f=g B1 tp
f
B0
B1

Z’
X’
Y’
Z’
X’
Y’
NMR in the Rotating Frame
Axes are rotating at the Larmor frequency
tp
f=g B1 tp
f
B1

Z’
X’
Y’
Z’
A voltage is produced in the coilthat oscillates at the precessional
frequency n.
tp
f=g B1 tp
Signal Detection in NMR
B0
B1

Free Induction Decay (FID)
Introduction to Spectroscopy, Pavia et al, 4th edition
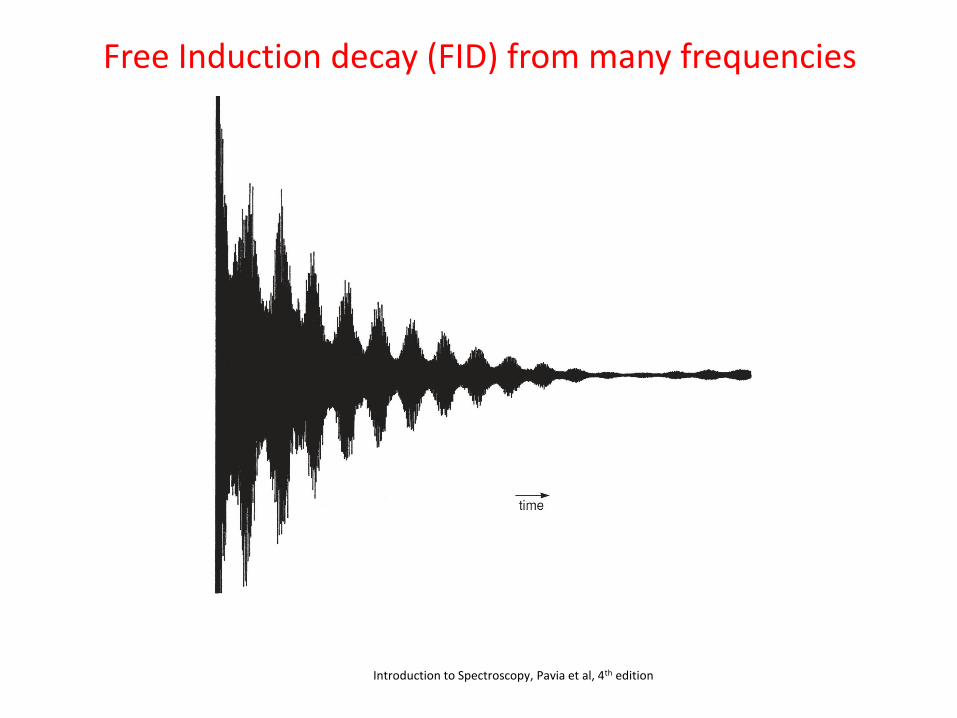
Free Induction decay (FID) from many frequencies
Introduction to Spectroscopy, Pavia et al, 4th edition

Fourier Transform
f(w) =
= coswt + isinwt
Re[f(w)]= f(t)coswtdt
Im[f(w)]= f(t)sinwtdt
www.cis.rit.edu/htbooks/nmr/

Actual NMR Experiment
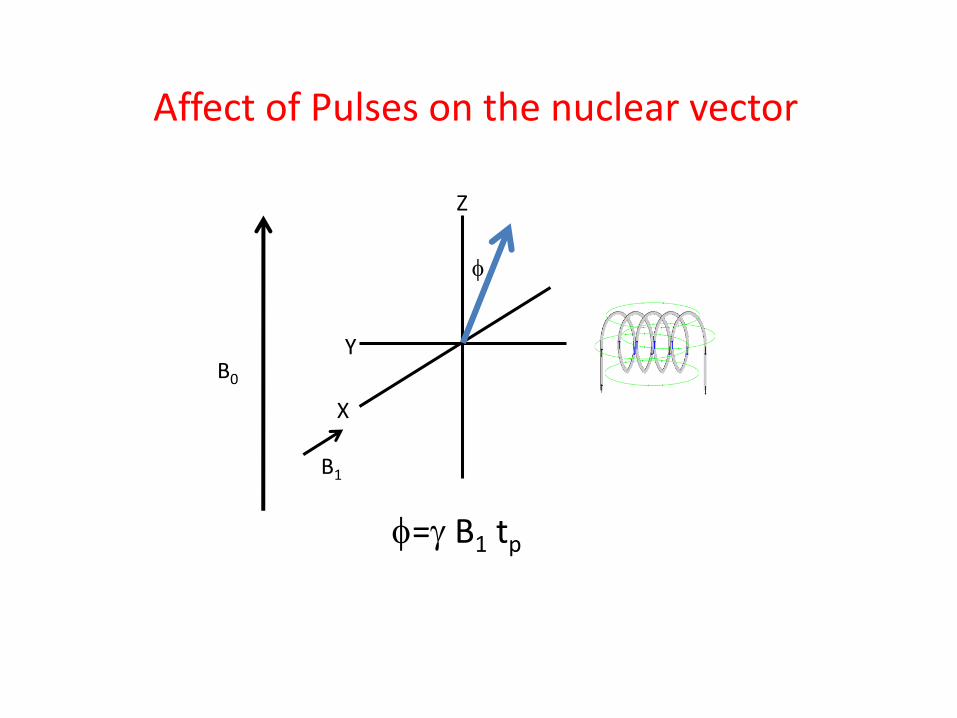
Affect of Pulses on the nuclear vector
f=g B1 tp
Z
X
Y
f
B0
B1

Pulse width experiment3msec increments

Phase of Peaks
B1
B1
Z’
X’
Y’
Z’
X’
Y’
Z’
X’
Y’
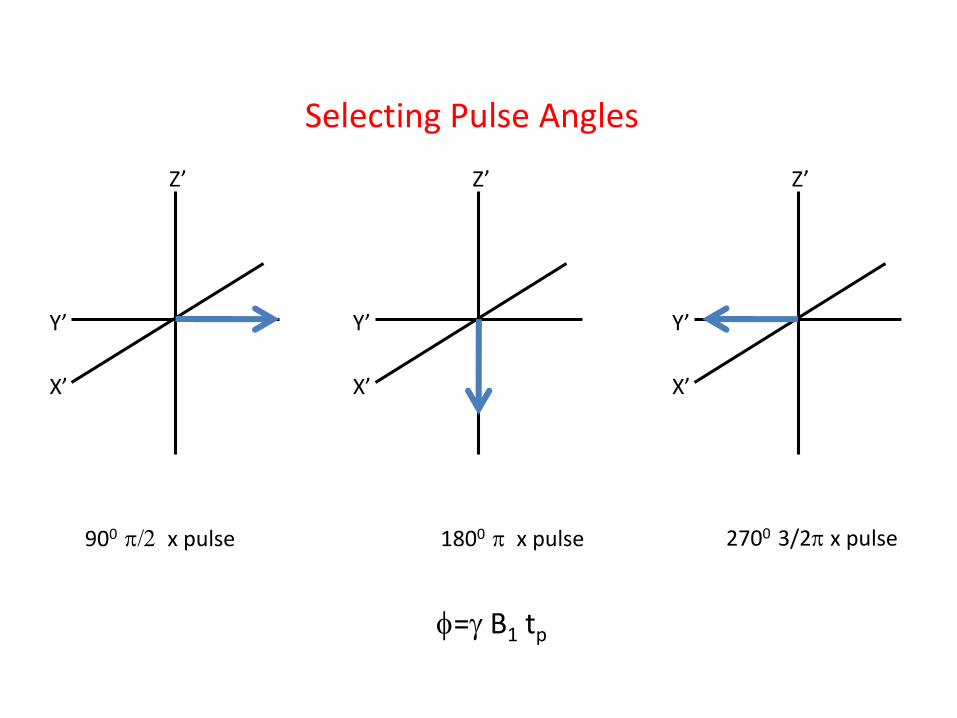
900 p/2 x pulse 1800 p x pulse 2700 3/2p x pulse
f=g B1 tp
Selecting Pulse Angles

Z’
X’
Y’
Z’
X’
Y’
Z’
X’
Y’
X’
Y’
Z’ Z’
X’
Y’
Phases
p/2, 900 Y
p, 1800 Yp/2, 900 -X
Z’
X’
Y’
p, 1800 X

Relaxation
Relaxation is the time that it takes the nuclei to returns to the equilibrium state.
There are two types of relaxation T1 and T2. T1 is referred to asLongitudinal or spin lattice and T2 is referred to a transverse or spin spin relaxation.
Hornak, Basics of NMR
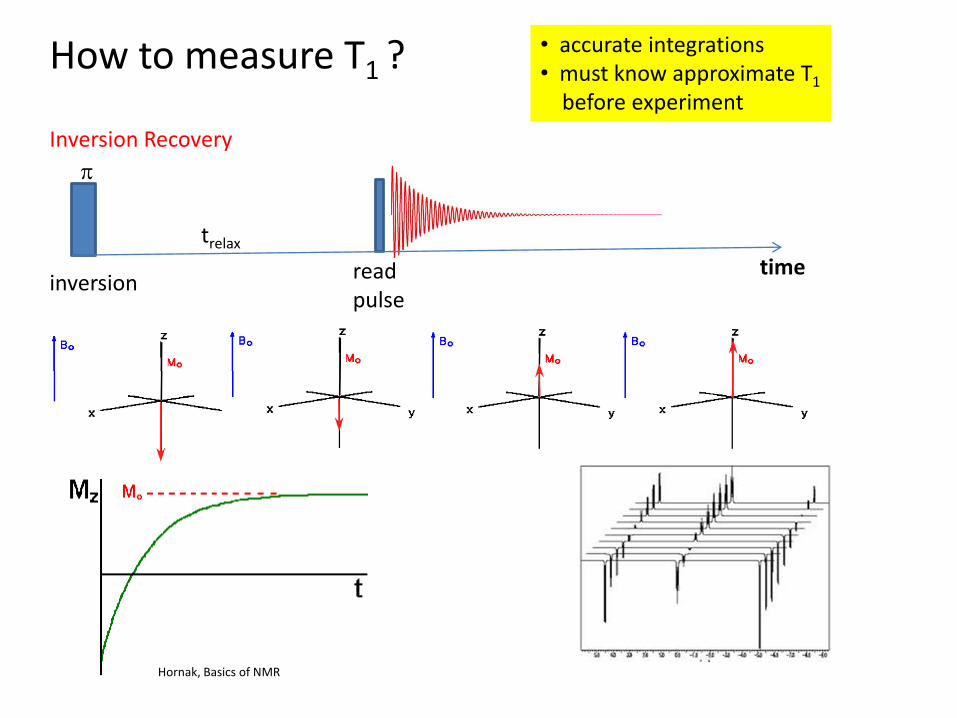
How to measure T1 ?
Inversion Recovery
inversion
trelax
readpulse
time
p
• accurate integrations• must know approximate T1
before experiment
Hornak, Basics of NMR

Spin Echo Experiment
d1
180x90x
t t
en.wikipedia.org
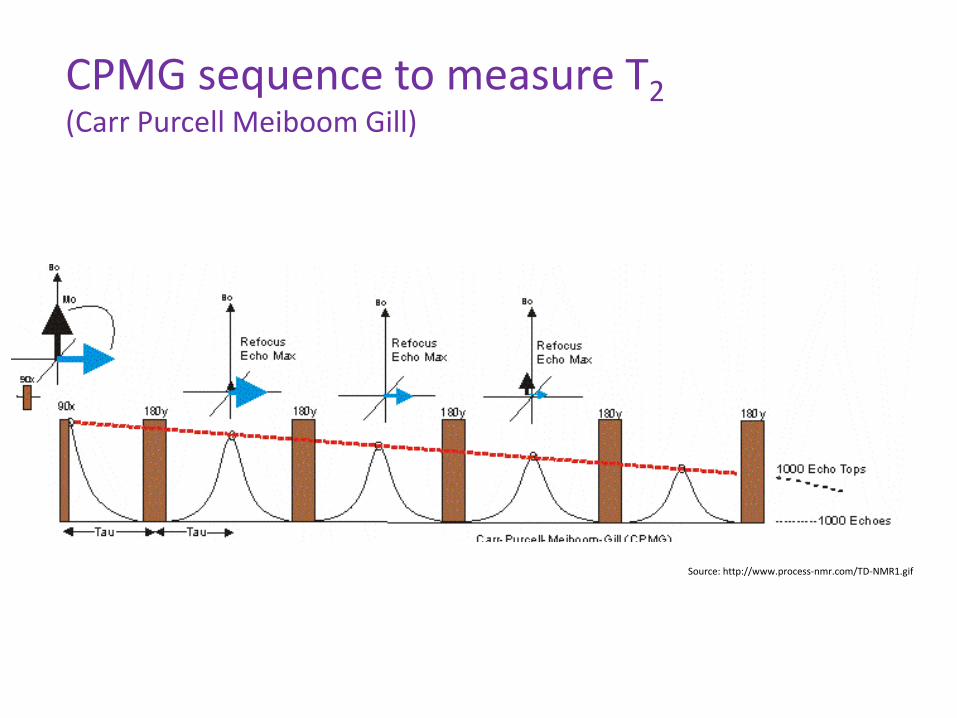
CPMG sequence to measure T2(Carr Purcell Meiboom Gill)
Source: http://www.process-nmr.com/TD-NMR1.gif

InstrumentationSome of the Nuts and Bolts
The signal coming back from the sample is in volts but computers do not understand volts.
In order to do this we need an ADC (analog to digital converter)but these have limitations in frequency range and voltage.
If you have a 500 MHz NMR and are observing 1H the actual signalvaries from 500,000,000 Hz to 500,005,000 Hz for a 10 PPM window.
If you could subtract the 500 MHz from this you would only need to look at 0 to 5000 Hz, the audio frequency range.
Preamp
transmitter
ADC
RECEIVER
Tocomputer
Preamp
transmitter
ADC
RECEIVER
Tocomputer
-

What does the nmr actually see?
Z’
X’
Y’
Frequency of transmitter
B1

Frequency of transmitter
Frequency of transmitter
Where do we put the transmitter?

Z’
X’
Y’
Phase Sensitivedetector
Phase Sensitivedetector
A
D
C
A
D
C
NMRsignal
ComputerMemory A
ComputerMemory B
0o reference
90o reference

Re[f(w)]= f(t)coswtdt A
Im[f(w)]= f(t)sinwtdt B
Sum
How do we convert the fid into a spectrum?

New Problem
Phase Sensitivedetector
Phase Sensitivedetector
A
D
C
A
D
C
ComputerMemory A
ComputerMemory B
0o reference
90o reference
What if ADC’s are not exactly matched?
Sum
Ghost peak

Phase Sensitivedetector
Phase Sensitivedetector
A
D
C
A
D
C
ComputerMemory A
ComputerMemory B
0o reference
90o reference
Phase Sensitivedetector
Phase Sensitivedetector
A
D
C
A
D
C
ComputerMemory A
ComputerMemory B
0o reference
90o reference
Scan 1
Scan 2 X-1

Cyclops Phase Cycling
Scan pulse phase receiver A B
1 X X +1 +2
2 Y Y -2 +1
3 -X -X -1 -2
4 -Y -Y +2 -1
A and B are separate memory locations1 stores the cos and 2 stores the sin
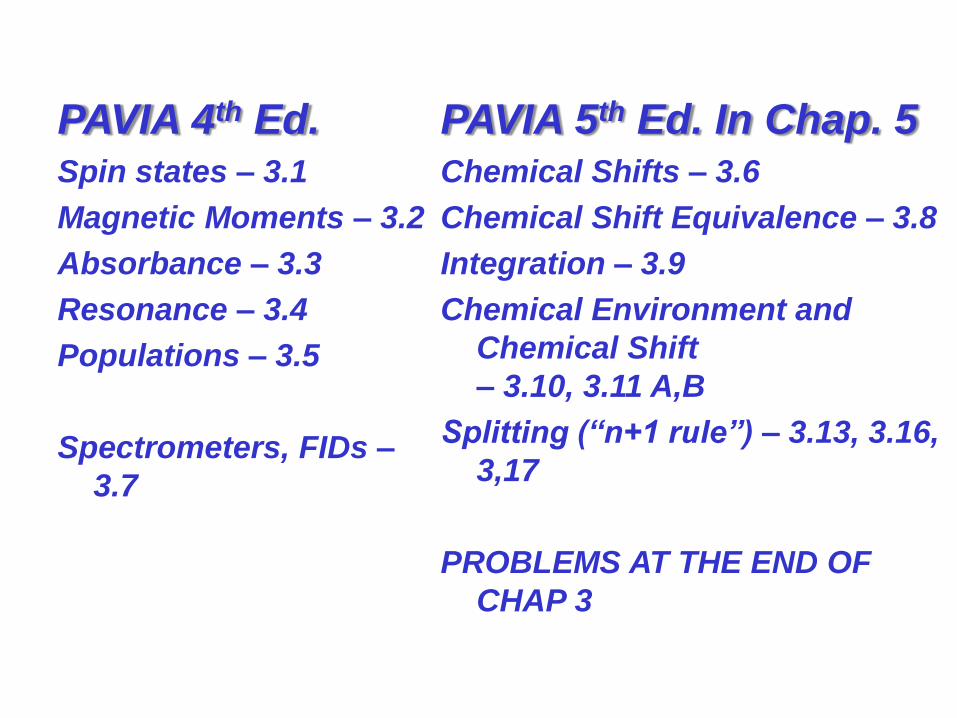
PAVIA 5th Ed. In Chap. 5Chemical Shifts – 3.6
Chemical Shift Equivalence – 3.8
Integration – 3.9
Chemical Environment and
Chemical Shift
– 3.10, 3.11 A,B
Splitting (“n+1 rule”) – 3.13, 3.16,
3,17
PROBLEMS AT THE END OF
CHAP 3
PAVIA 4th Ed. Spin states – 3.1
Magnetic Moments – 3.2
Absorbance – 3.3
Resonance – 3.4
Populations – 3.5
Spectrometers, FIDs –
3.7

Preview: Types of Information available from a 1H NMR spectrum
A 1H nuclear magnetic resonance spectrum contains information about the:
(a) number of different types of proton
(b) relative number of each type of proton
(c) proximity to functional groups
(d) the number of adjacent nuclei with spin
H
C
H
Cl C
H
H
H

(b) relative number of each type of proton
Which alkane is which?12 6
9 9
9 9
6 12

(c) proximity to functional groups - shielding and deshielding
Ha
B
E
Bo-BindBo
shielded
hν
hν
hν’
less shieldinghigher hv
“downfield”higher
more shieldinglower hv“upfield”lower
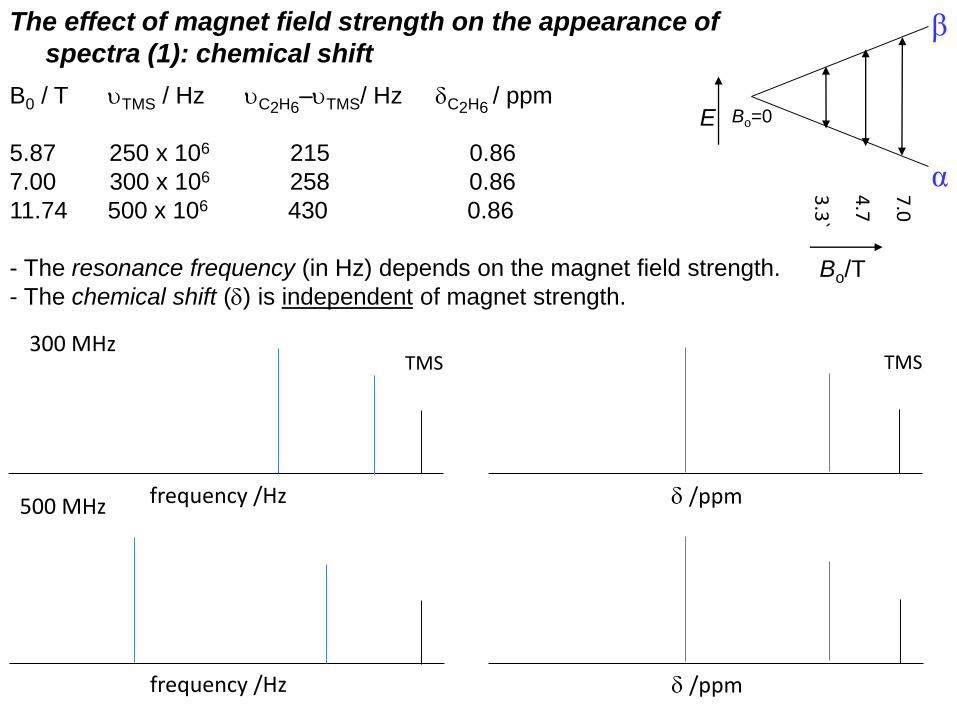
B0 / T TMS / Hz C2H6–TMS/ Hz C2H6
/ ppm
5.87 250 x 106 215 0.86
7.00 300 x 106 258 0.86
11.74 500 x 106 430 0.86
- The resonance frequency (in Hz) depends on the magnet field strength.
- The chemical shift () is independent of magnet strength.
TMS
Bo/T
E Bo=0
α
β7
.0
4.7
3.3
`
The effect of magnet field strength on the appearance of
spectra (1): chemical shift
TMS
frequency /Hz
frequency /Hz
/ppm
/ppm
300 MHz
500 MHz

DISPERSION AT DIFFERENT FREQUENCIES
7 T, 300 MHz instrument
14 T, 600 MHz instrument
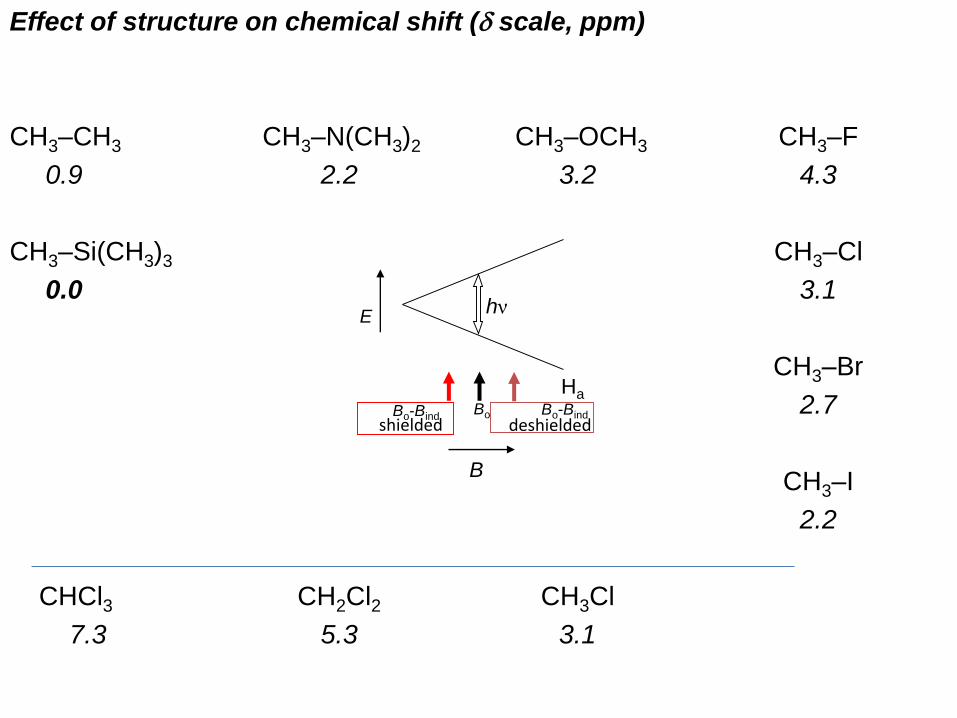
Effect of structure on chemical shift ( scale, ppm)
CH3–CH3 CH3–N(CH3)2 CH3–OCH3 CH3–F
0.9 2.2 3.2 4.3
CH3–Si(CH3)3 CH3–Cl
0.0 3.1
CH3–Br
2.7
CH3–I
2.2
CHCl3 CH2Cl2 CH3Cl
7.3 5.3 3.1
Ha
B
E
Bo-BindBo
shielded
hν
Bo-Binddeshielded

You will be provided with a copy of Table 9.1 on exams. This provides approximate ranges for values of
chemical shifts for particular types of protons. Remember that protons adjacent to two (or more) electron
withdrawing groups will appear further downfield than a proton adjacent to only one.
-Typical 1H NMR chemical shifts
Type of proton chemical shift ()
(CH3)4Si 0.00CH3-C-R (sp
3) 0.9 - 1.8
-CH2-C-R (sp3) 1.1 - 2.0
-CH-C-R (sp3) 1.3 - 2.1
H-C-N 2.2 - 2.9H-C-O 3.3 - 3.7H-C-Cl 3.1 - 4.1H-C-Br 2.7 - 4.1H-C-C=O 2.1 - 2.5H-C-C=C 1.6 - 2.6H-C-Ar 2.3 - 2.8H-C=O (sp
2) 9 - 10
H-C=C (sp2) 4.5 - 6.5
H-Ar (sp2) 6.5 - 8.5
H-C C (sp) 2.5
H-N (amine) 1 - 3H-OR (alcohol) 0.5 - 5H-OAr (phenol) 6 - 8H-O2CR (acid) 10 - 13
_=
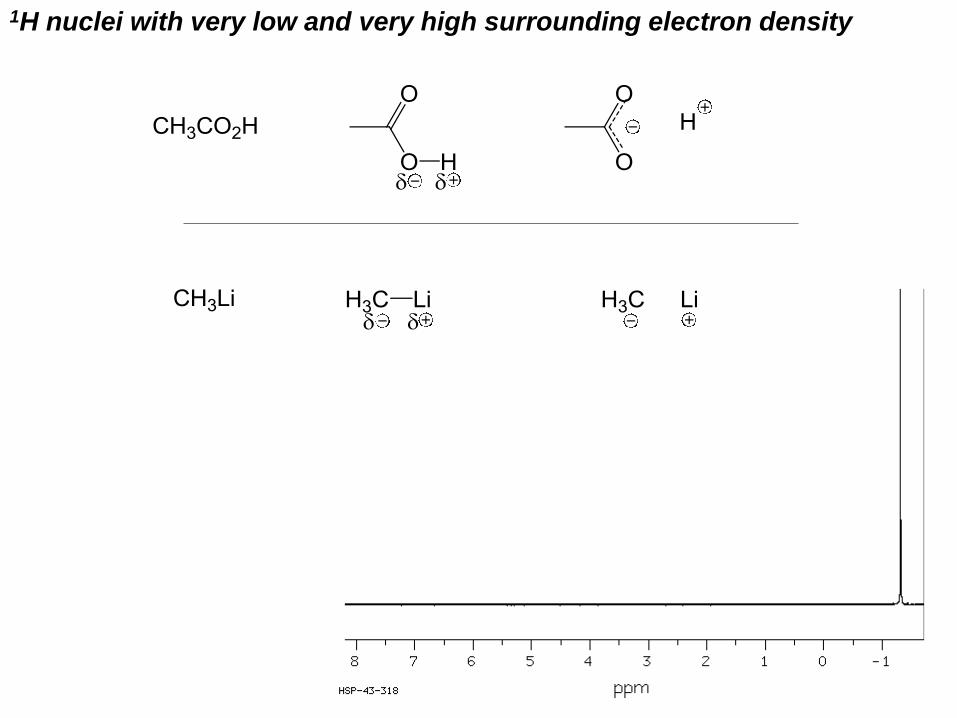
1H nuclei with very low and very high surrounding electron density

The effect of a substituent on 1H NMR chemical shift drops off rapidly
Chemical Shifts are not additive
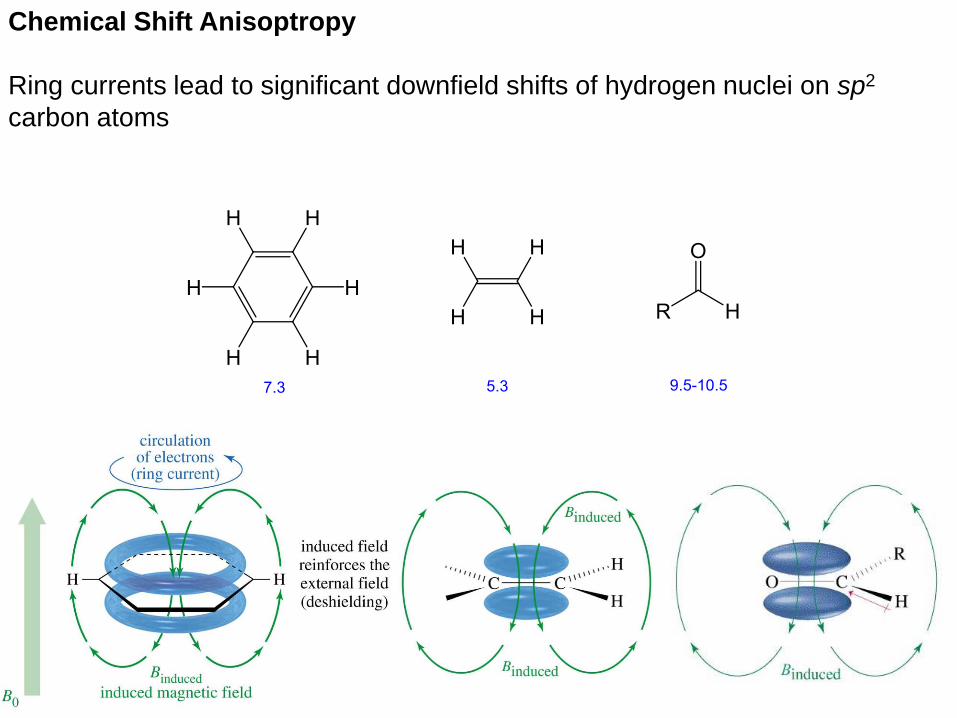
Chemical Shift Anisoptropy
Ring currents lead to significant downfield shifts of hydrogen nuclei on sp2
carbon atoms
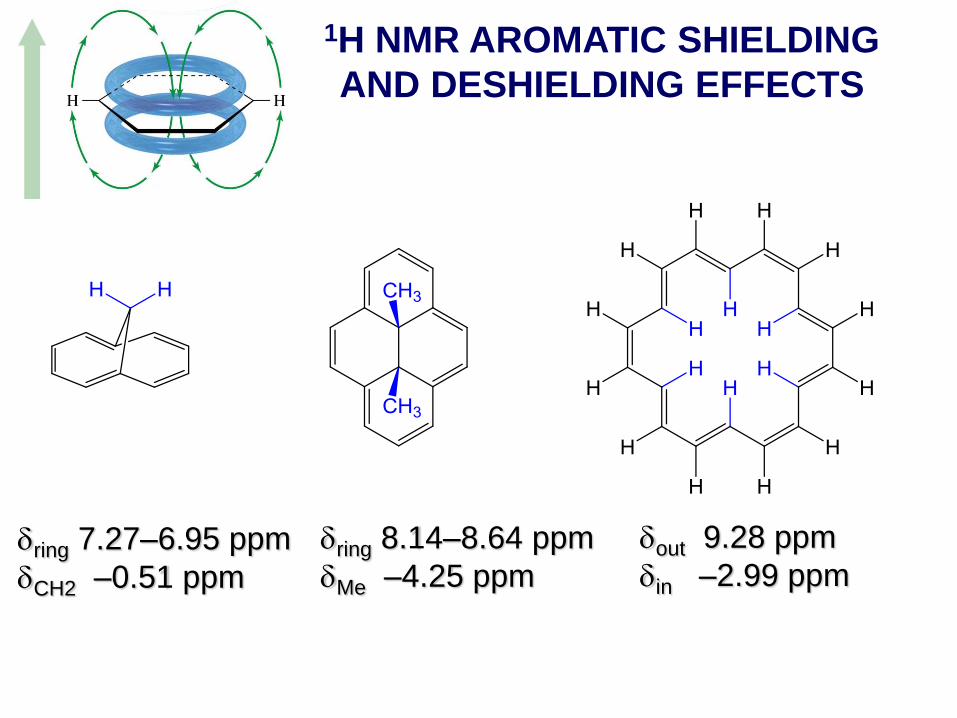
1H NMR AROMATIC SHIELDING
AND DESHIELDING EFFECTS
ring 8.14–8.64 ppm
Me –4.25 ppmring 7.27–6.95 ppm
CH2 –0.51 ppm
out 9.28 ppm
in –2.99 ppm
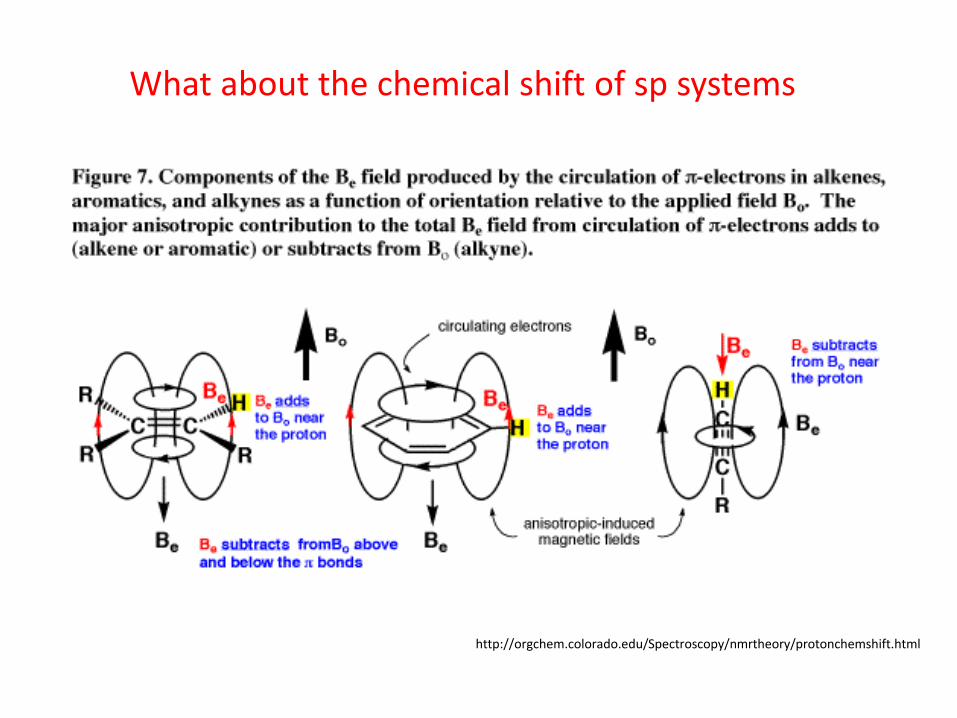
What about the chemical shift of sp systems
http://orgchem.colorado.edu/Spectroscopy/nmrtheory/protonchemshift.html
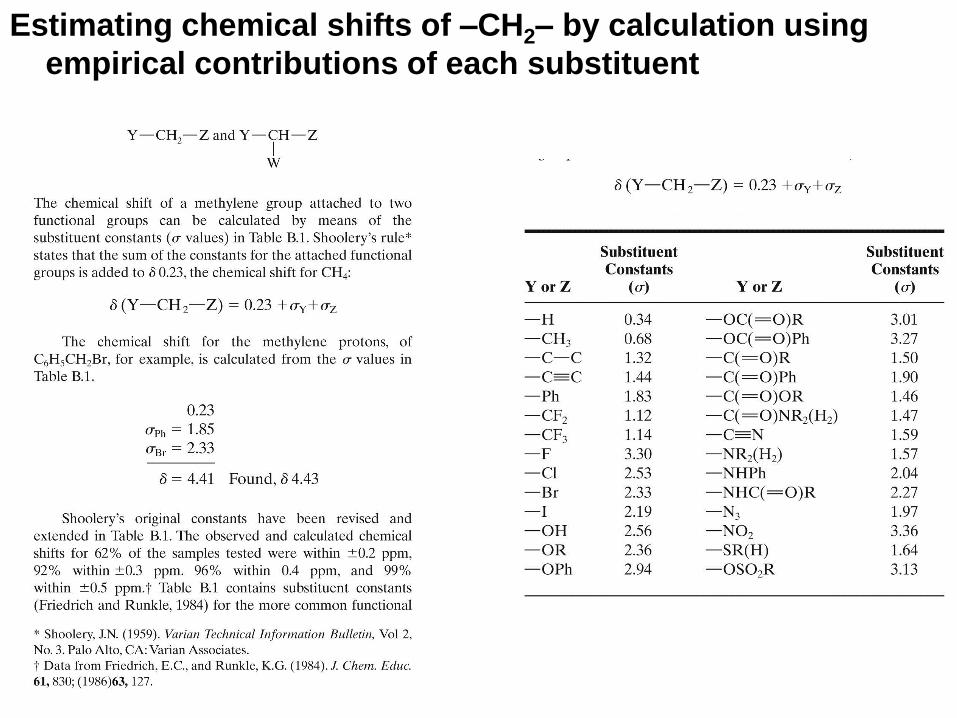
Estimating chemical shifts of –CH2– by calculation using
empirical contributions of each substituent
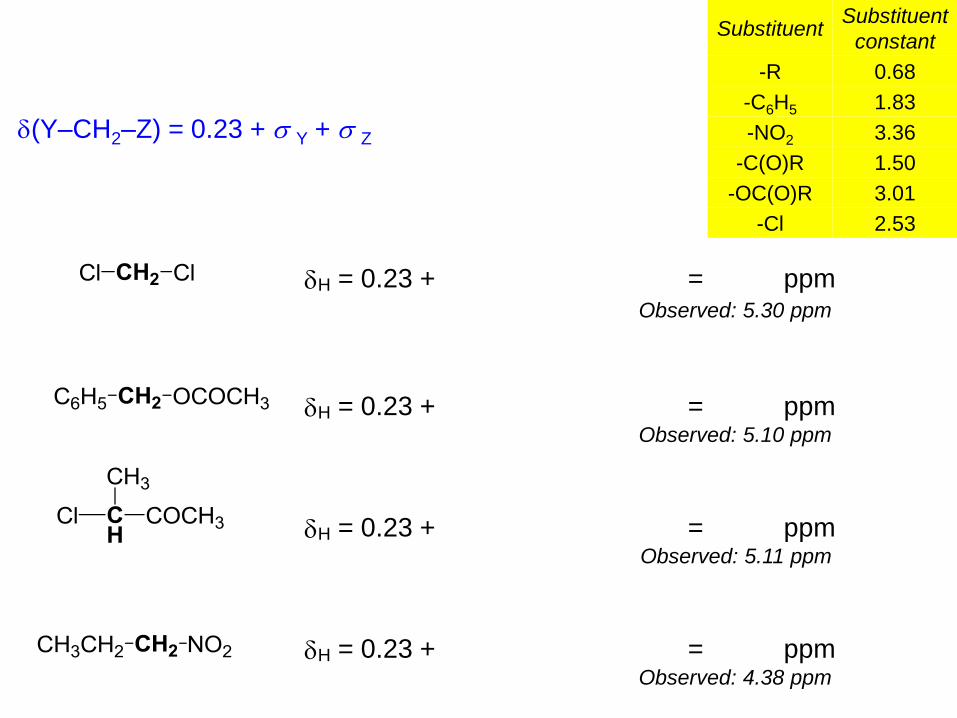
SubstituentSubstituent
constant
-R 0.68
-C6H5 1.83
-NO2 3.36
-C(O)R 1.50
-OC(O)R 3.01
-Cl 2.53
H = 0.23 + = ppmObserved: 5.30 ppm
H = 0.23 + = ppmObserved: 5.10 ppm
H = 0.23 + = ppmObserved: 5.11 ppm
H = 0.23 + = ppmObserved: 4.38 ppm
(Y–CH2–Z) = 0.23 + s Y + s Z

Instructions to download, install and launch ChemDraw
The ChemBioOffice software package is downloadable direct from
CambridgeSoft (NOT from GT's OIT). Access their site using Internet Explorer
or Firefox:
http://scistore.cambridgesoft.com/sitelicense.cfm?sid=100)
(i) Register with the site (button in top left)
(ii) Once registered, go back to the site licence page
(http://scistore.cambridgesoft.com/sitelicense.cfm?sid=100), enter you
gatech.edu email address. Follow directions to download the software
installer ("ChemBioOffice" for a PC; or "ChemBioDraw" for a Mac)
(iii) Install the software. You will be asked for a verification/activation code
during the installation. This will have been emailed to you (your email
program might have placed the message in your junk mail box - so check
there as well!) Enter the info in the installation process and proceed.
Launch the program to make sure it works.

Estimating chemical shifts using ChemDraw
CH 4.51 1.50 methine
0.17 1 alpha -C
1.98 1 alpha -Cl
0.86 1 alpha -C=O
CH2 4.41 1.37 methylene
3.08 1 alpha -N(=O)=O
-0.04 1 beta -C
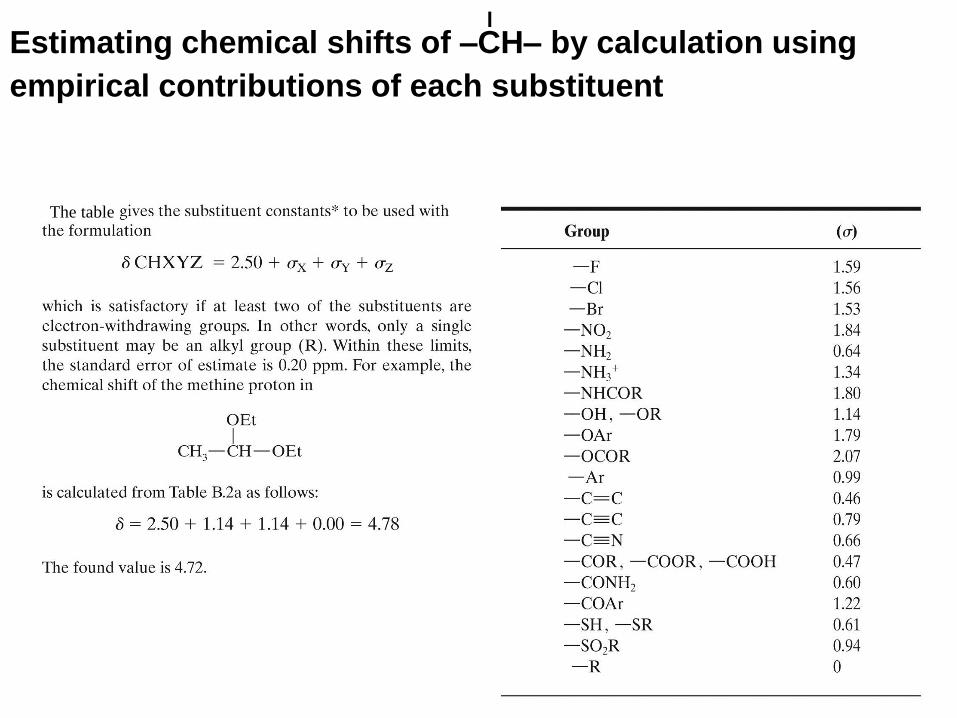
ˡEstimating chemical shifts of –CH– by calculation using
empirical contributions of each substituent
The table

Estimating chemical shifts of vinylic hydrogen atoms by
calculation using empirical contributions of each substituent
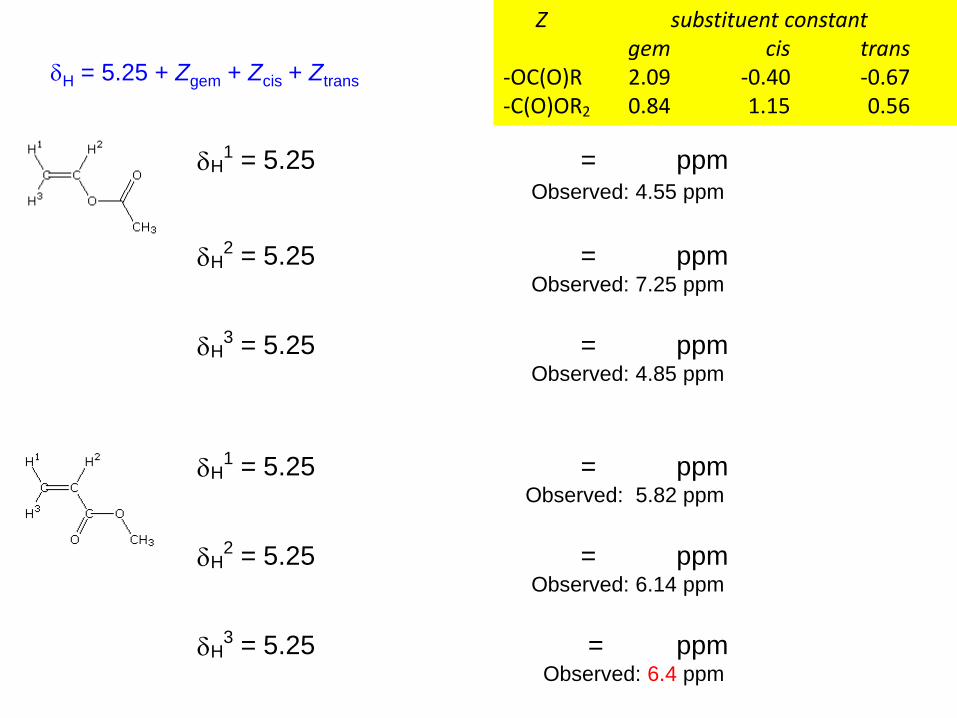
H1 = 5.25 = ppm
Observed: 4.55 ppm
H2 = 5.25 = ppm
Observed: 7.25 ppm
H3 = 5.25 = ppm
Observed: 4.85 ppm
H1 = 5.25 = ppm
Observed: 5.82 ppm
H2 = 5.25 = ppm
Observed: 6.14 ppm
H3 = 5.25 = ppm
Observed: 6.4 ppm
Z substituent constantgem cis trans
-OC(O)R 2.09 -0.40 -0.67-C(O)OR2 0.84 1.15 0.56
H = 5.25 + Zgem + Zcis + Ztrans

Using ChemDraw to estimate chemical shifts
H 7.25 5.25 1-ethylene
2.03 1 -OC(=O)-C gem
-0.03 general corrections
H 4.85 5.25 1-ethylene
-0.37 1 -OC(=O)-C cis
-0.03 general corrections
H 4.55 5.25 1-ethylene
-0.69 1 -OC(=O)-C trans
-0.01 general corrections
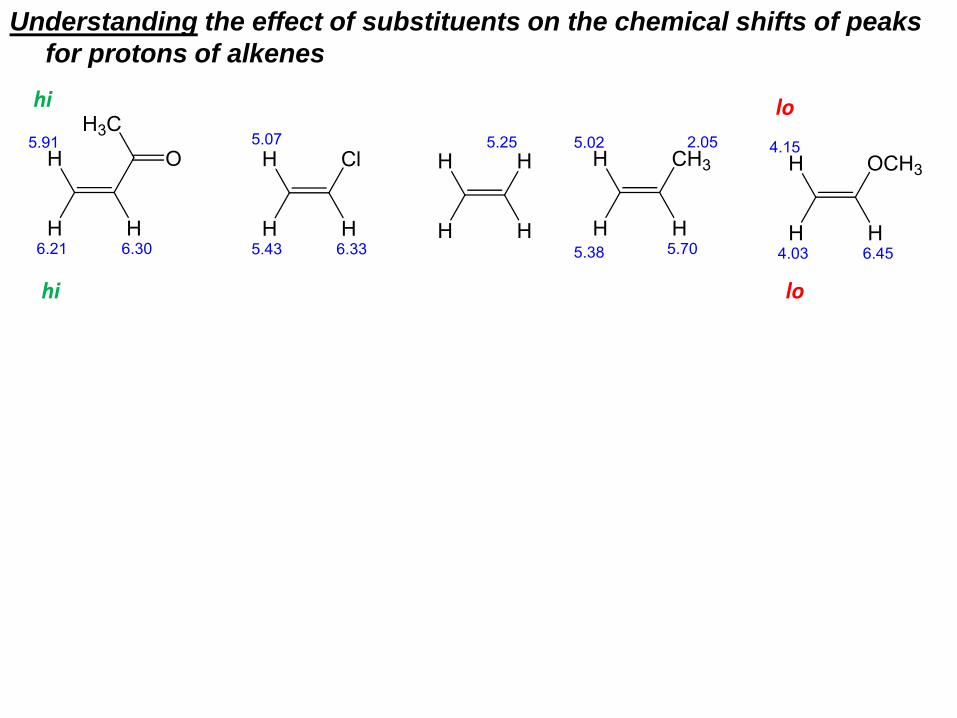
Understanding the effect of substituents on the chemical shifts of peaks
for protons of alkenes
hi
lohi
lo

H1 = 7.27 + = ppm
Observed: 7.50 ppm
H2 = 7.27 + = ppm
Observed: 8.20 ppm
H1 = 7.27 + = ppm
Observed: 8.03 ppm
dH2 = 7.27 + = ppm
Observed: 7.42 ppm
dH3 = 7.27 + = ppm
Observed: 7.53 ppm
substituent substituent constanto- m- p-
-C(O)OR -0.25 0.03 -0.13-NO2 0.95 0.26 0.38-Cl 0.03 -0.02 -0.09
Estimating chemical shifts of hydrogen atoms on benzene
rings
H = 7.27 + di
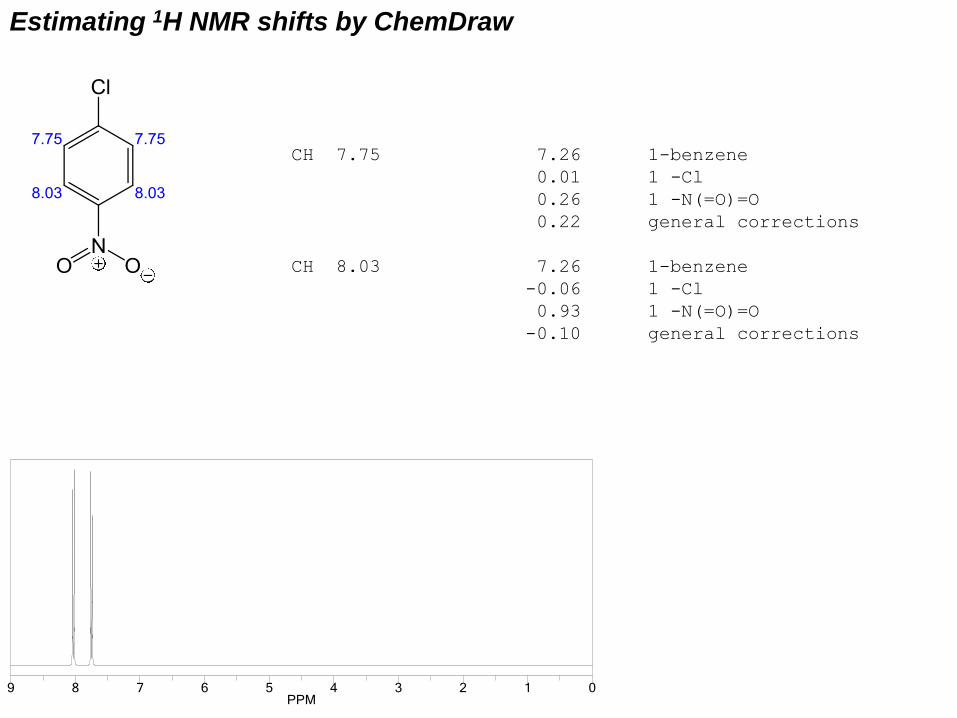
Estimating 1H NMR shifts by ChemDraw
CH 7.75 7.26 1-benzene
0.01 1 -Cl
0.26 1 -N(=O)=O
0.22 general corrections
CH 8.03 7.26 1-benzene
-0.06 1 -Cl
0.93 1 -N(=O)=O
-0.10 general corrections
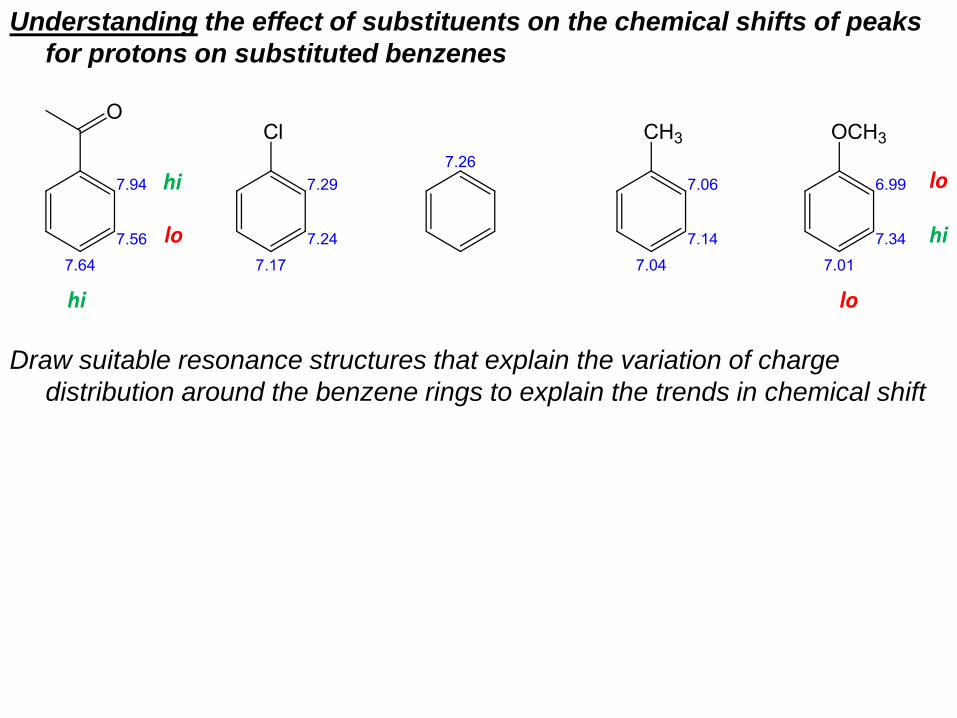
Understanding the effect of substituents on the chemical shifts of peaks
for protons on substituted benzenes
Draw suitable resonance structures that explain the variation of charge
distribution around the benzene rings to explain the trends in chemical shift
hi
lo
hi
hi
lo
lo

PAVIA 4th Ed. PAVIA 5th Ed. Chapter 7Coupling constants – 5.1
Mechanism of coupling – 5.2,6,17
Magnetic Equivalence – 5.3
Multiplets of Multiplets – 5.4,5
Protons on O – 5.7,8
Protons on N – 5.9-11
Second Order Spectra 5.12
Aromatic Compounds 5.13
Enatiotopic and Diastereotopic Protons 5.14,15,18,19

Coupling is only observed between non-equivalent protons.
The signal for a proton coupling to a set of N protons will be split into a multiplet
consisting of N+1 lines. The relative area of each peak within a multiplet can
be determined from Pascal’s triangle.
This is often referred to as the “N+1 rule” – but this only works for nuclei with nuclear spin quantum numbers, I = + ½ and –½ (e.g., 1H)
This is a special case of a more general “2NI+1 rule” (for all values of I).

Coupling with spins other than 1/2
CDCl3
CD3CCD3
OII

Measuring the Coupling Constants Pavia 5.1
3.7 3.8
ppm1.3 1.2
ppm
300 MHz
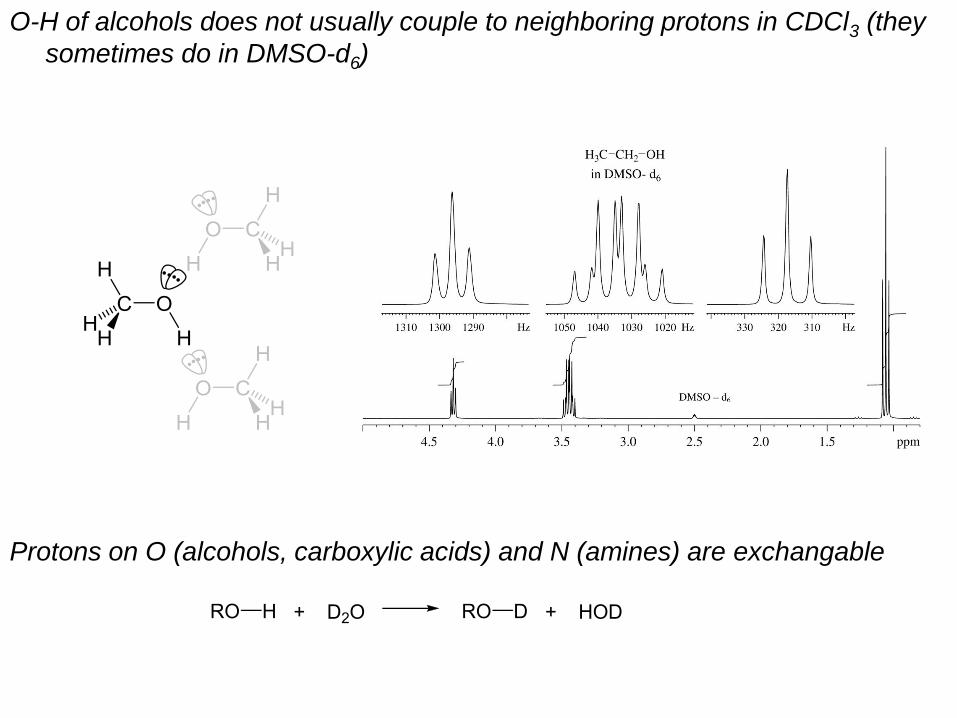
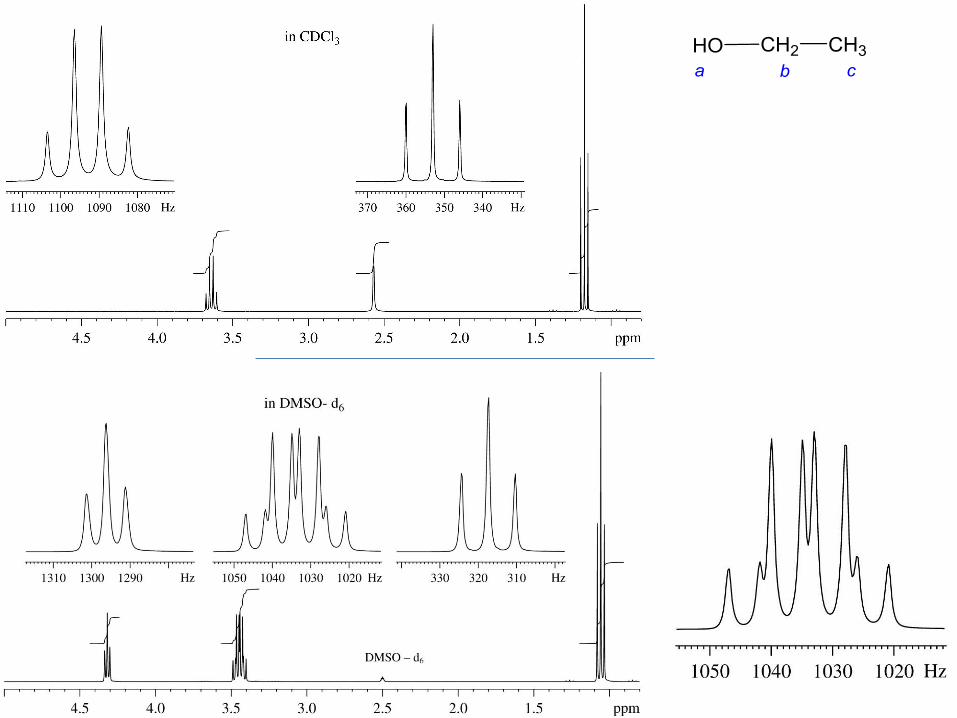
O-H of alcohols does not usually couple to neighboring protons in CDCl3 (they
sometimes do in DMSO-d6)
Protons on O (alcohols, carboxylic acids) and N (amines) are exchangable

The Origin of Coupling: Fermi contact interaction Pavia 5.2
e.g., three-bond coupling , 3J
1H nuclear magnetic moment polarizes spin of H1s electron.
Electrons with polarized spin then influence other electrons
(i.e., in bonding pairs of s bonds, and pairs of electrons
in hybrid orbitals of C)
Coupling is a through-bond effect
1H
C
C
1H
Pauli principle and
Hund’s rules
Parallel spin
1H nuclear
magnetic moment
polarizes 1s
electron spin of H
electron spin
polarizes
nuclear spin
Nuclear
spinElectron
spin
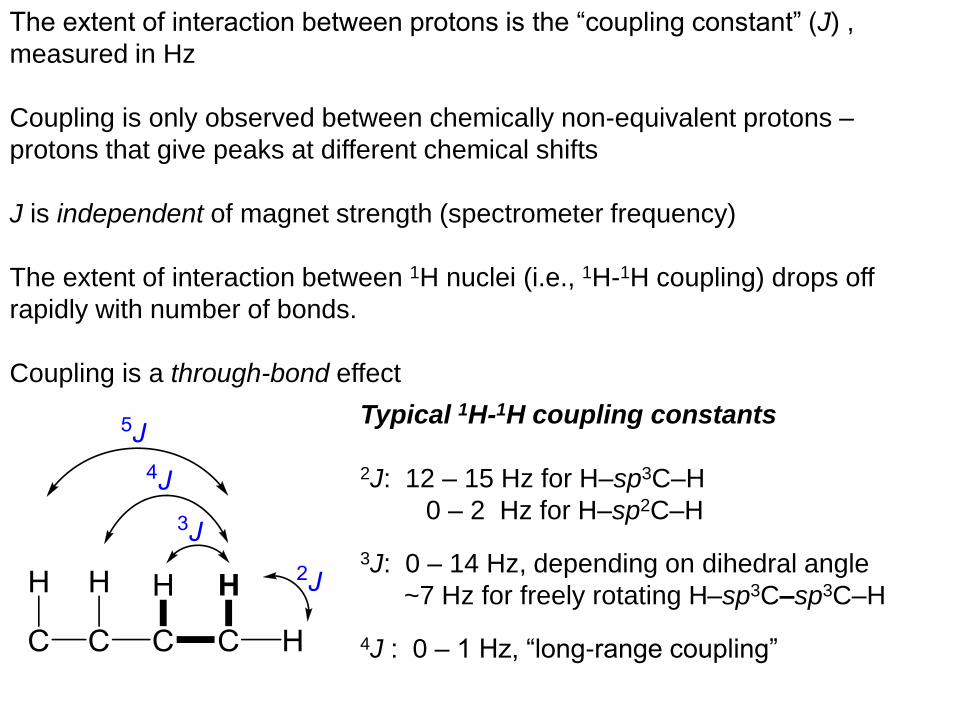
The extent of interaction between protons is the “coupling constant” (J) ,
measured in Hz
Coupling is only observed between chemically non-equivalent protons –
protons that give peaks at different chemical shifts
J is independent of magnet strength (spectrometer frequency)
The extent of interaction between 1H nuclei (i.e., 1H-1H coupling) drops off
rapidly with number of bonds.
Coupling is a through-bond effect
Typical 1H-1H coupling constants
2J: 12 – 15 Hz for H–sp3C–H
0 – 2 Hz for H–sp2C–H
3J: 0 – 14 Hz, depending on dihedral angle
~7 Hz for freely rotating H–sp3C–sp3C–H
4J : 0 – 1 Hz, “long-range coupling”

The resonance frequency is proportional to the magnet strength.
Coupling constants are not effected by the magnet strength.
TMS
The effect of magnet strength on the appearance of spectra (2): Coupling
constants are not effected by field strength (spectrometer frequency)
TMS
frequency /Hz
frequency /Hz
/ppm
/ppm

Some Common 1H-1H Coupling Constants, J (in Hz)
Two-bond coupling (geminal hydrogen atoms)
Three-bond coupling between hydrogen atoms on sp3 carbon atoms
Three-bond coupling (vicinal hydrogen atoms)
Free rotation Fixed conformations
typically ~7 Hz Jcis ~9 Hz (6-12)Jtrans ~6 Hz (4-8)
fcis ~0o
ftrans ~120o
f ~45o
Jbh-exo ~8 Hz
f ~78o
Jbh-end ~3 Hz
Remember – only chemically non-equivalent nuclei couple one another
Remember – only chemically non-equivalent nuclei couple one another
aa 180o J ~10 Hz
ae 60o J ~2 Hz

J. Am. Chem. Soc., 85, 2870 (1963)

Coupling between hydrogen atoms on sp2 carbon atoms
Vinylic coupling
Long-range (4-bond) allylic couplings
Remember – only chemically non-equivalent nuclei couple one another
3Jcis ~10 Hz (6-15) 3Jtrans ~16 Hz (11-18) 2Jgem ~1 Hz (0-5)
4Jtrans ~1-2 Hz 4Jcis ~1 Hz

Long-range (four-bond) couplings
Couplings between hydrogen atoms on substituted benzenes
Remember – only chemically non-equivalent nuclei couple one another
Jallylic ~1 Hz (0.3)
J ~0 Hz (0-1.5)
JW ~1 Hz
3Jo ~8 Hz (6-10)4Jm ~3 Hz (1-4)5Jp ~<1 Hz (0-2)
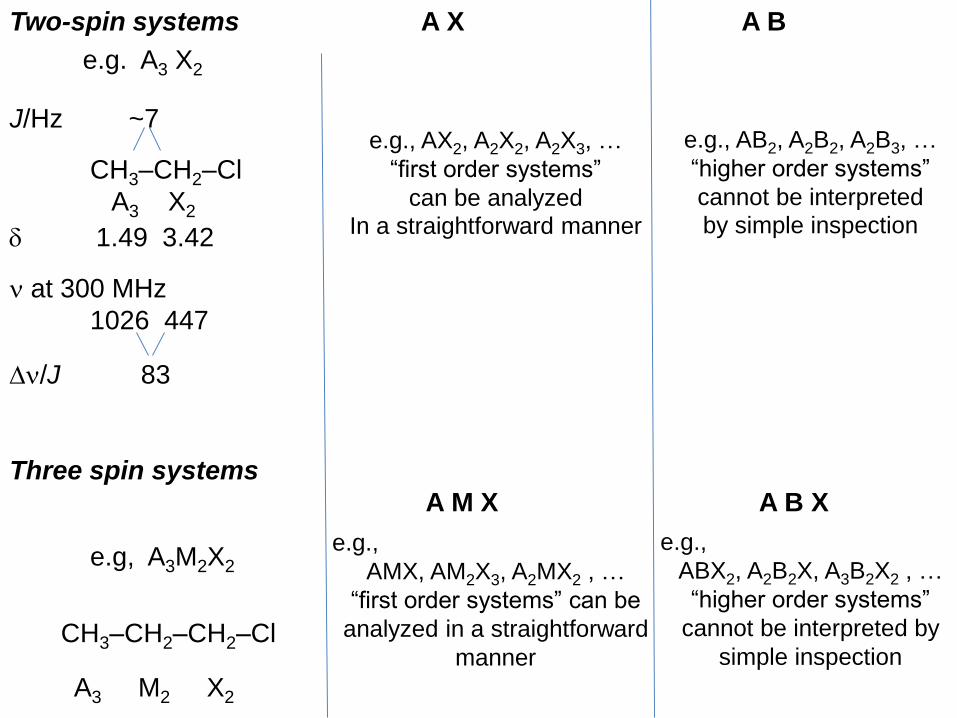
Two-spin systems A X A B
e.g. A3 X2
J/Hz ~7
CH3–CH2–Cl
A3 X2
1.49 3.42
n at 300 MHz
1026 447
Dn/J 83
Three spin systems
A M X A B X
e.g, A3M2X2
CH3–CH2–CH2–Cl
A3 M2 X2
e.g., AB2, A2B2, A2B3, …
“higher order systems”
cannot be interpreted
by simple inspection
e.g.,
ABX2, A2B2X, A3B2X2 , …
“higher order systems”
cannot be interpreted by
simple inspection
e.g., AX2, A2X2, A2X3, …
“first order systems”
can be analyzed
In a straightforward manner
e.g.,
AMX, AM2X3, A2MX2 , …
“first order systems” can be
analyzed in a straightforward
manner

The effect of magnet strength on the appearance of spectra (2): second
order spectra (Dn/J < 8) can be converted to first order spectra upon
increasing the field strength (spectrometer frequency)
J (Hz) ~7 ~7
CH3–CH2–CH2–Cl
A3 M2 X2
0.90 1.61 3.68
n at 60 MHz
54 97 221
Dn 43 124
Dn/J 6 18
n at 300 MHz
270 483 1104
Dn 213 621
Dn/J 30 89
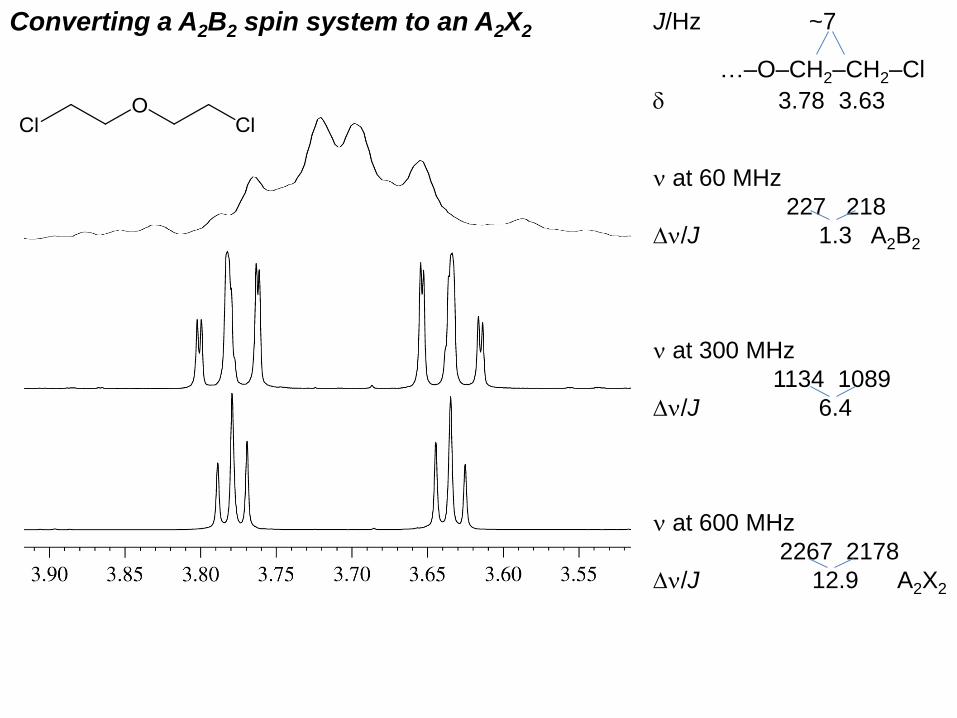
Converting a A2B2 spin system to an A2X2 J/Hz ~7
…–O–CH2–CH2–Cl
3.78 3.63
n at 60 MHz
227 218
Dn/J 1.3 A2B2
n at 300 MHz
1134 1089
Dn/J 6.4
n at 600 MHz
2267 2178
Dn/J 12.9 A2X2
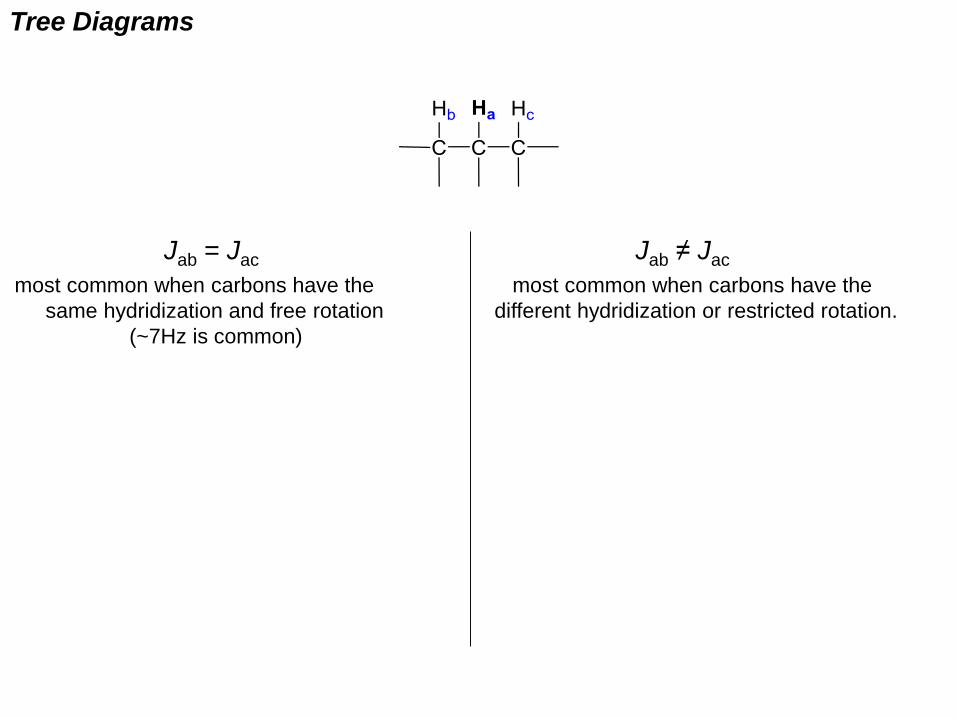
Tree Diagrams
Jab = Jac Jab ≠ Jac
most common when carbons have the most common when carbons have the
same hydridization and free rotation different hydridization or restricted rotation.
(~7Hz is common)

Jab = Jbc e.g. propyl groups, X-CH2CH2CH3

JXA ≠ JXB e.g. vinyl groups Pavia 5.5
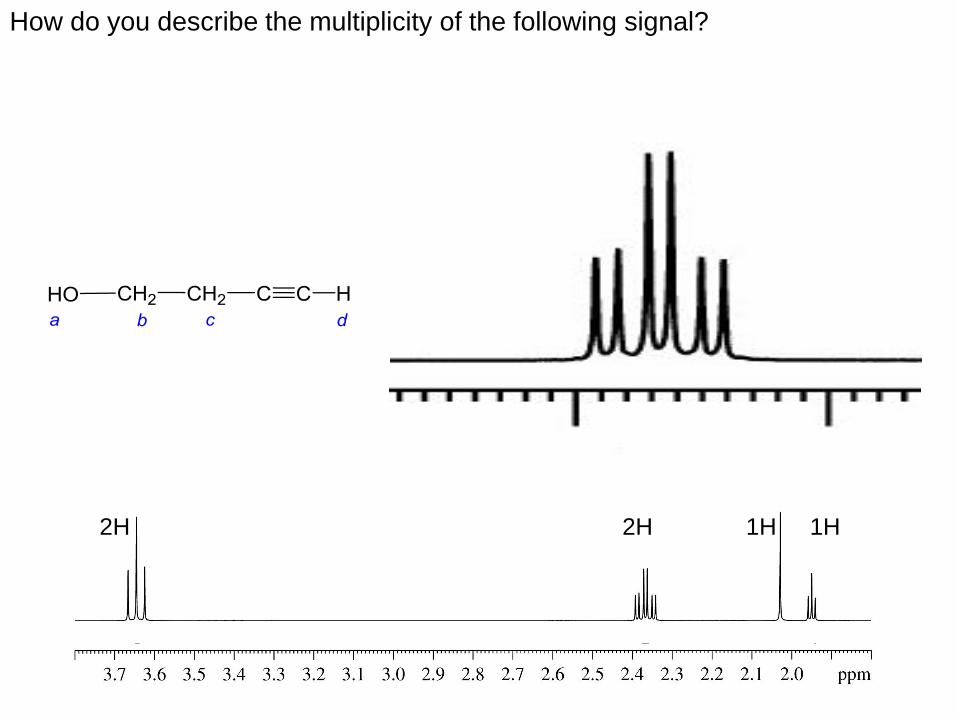
2H 2H 1H 1H
How do you describe the multiplicity of the following signal?
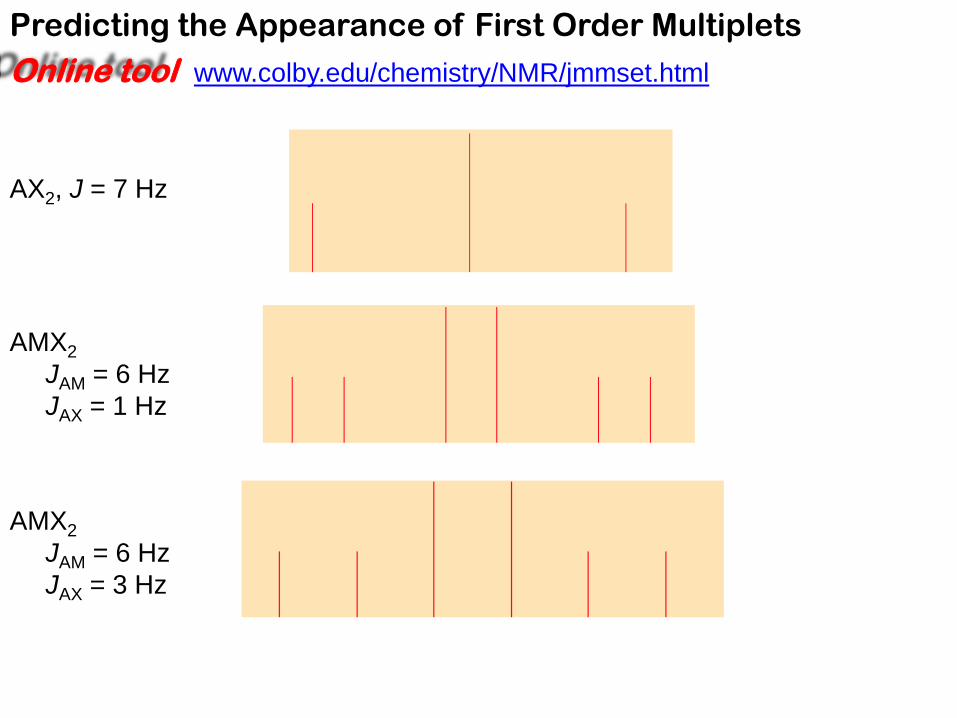
Predicting the Appearance of First Order Multiplets
Online tool www.colby.edu/chemistry/NMR/jmmset.html
AX2, J = 7 Hz
AMX2
JAM = 6 Hz
JAX = 1 Hz
AMX2
JAM = 6 Hz
JAX = 3 Hz
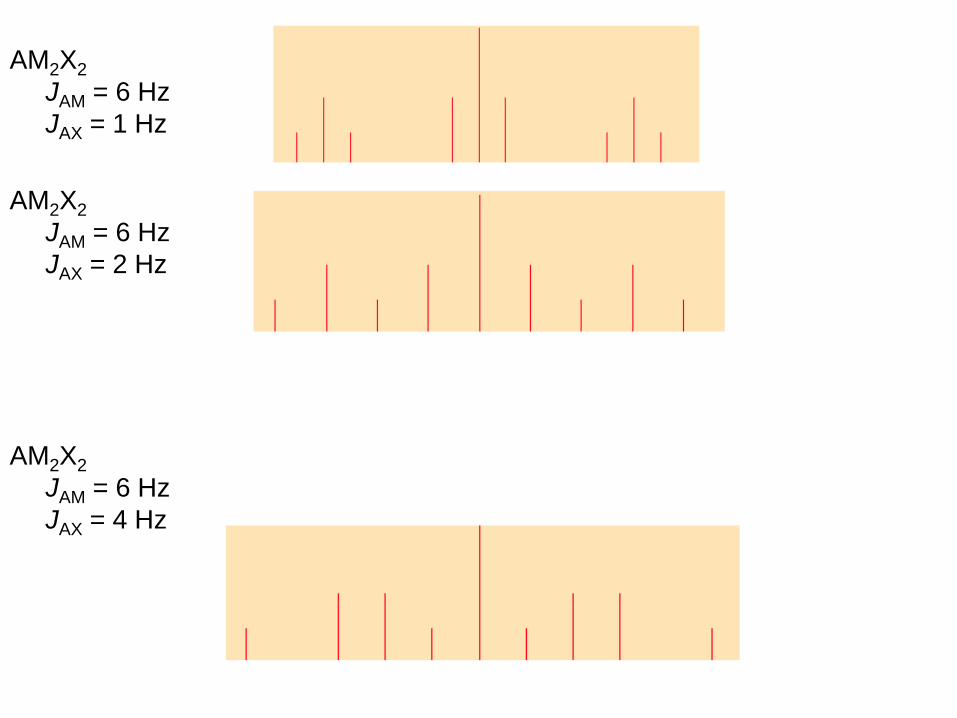
AM2X2
JAM = 6 Hz
JAX = 1 Hz
AM2X2
JAM = 6 Hz
JAX = 2 Hz
AM2X2
JAM = 6 Hz
JAX = 4 Hz
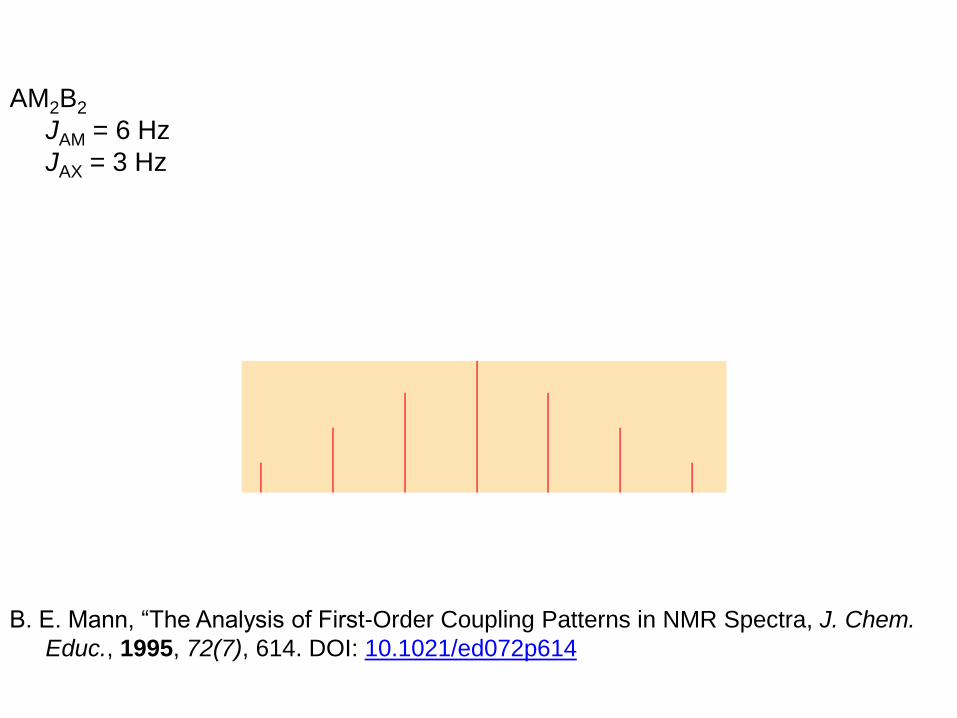
AM2B2
JAM = 6 Hz
JAX = 3 Hz
B. E. Mann, “The Analysis of First-Order Coupling Patterns in NMR Spectra, J. Chem.
Educ., 1995, 72(7), 614. DOI: 10.1021/ed072p614

10 Hz
How do you describe the multiplicity of the following signal?

10 Hz
How do you describe the multiplicity of the following signal?
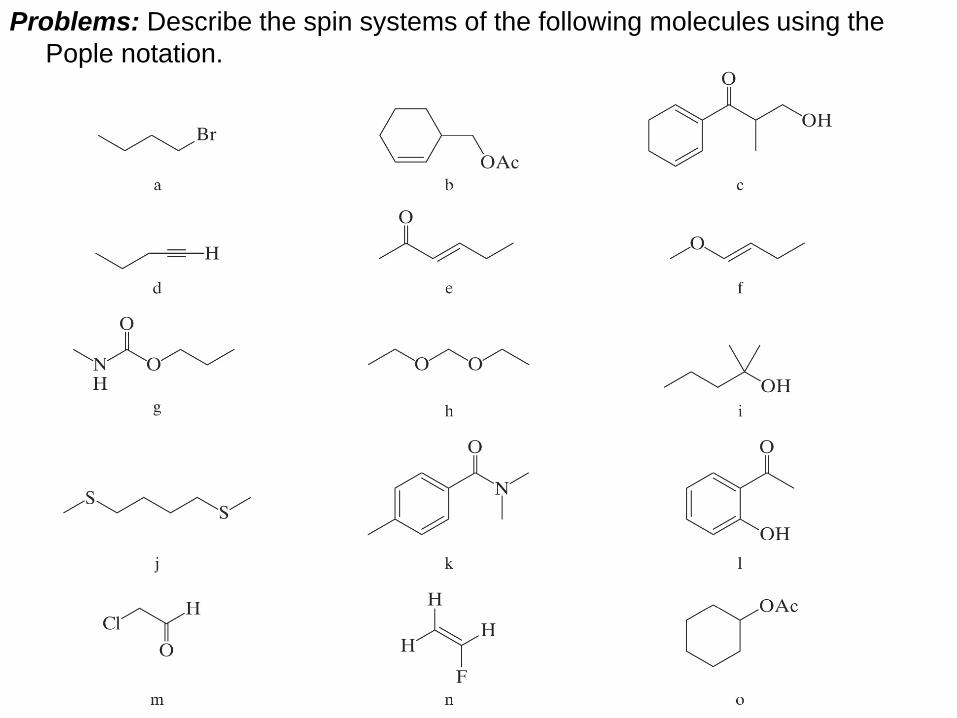
Problems: Describe the spin systems of the following molecules using the
Pople notation.
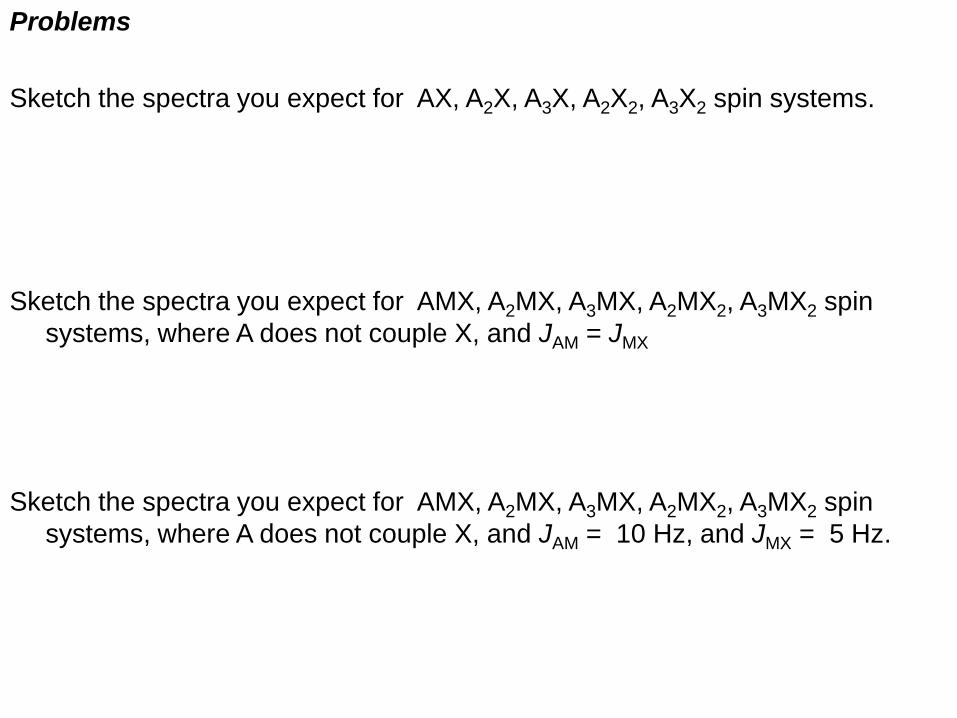
Problems
Sketch the spectra you expect for AX, A2X, A3X, A2X2, A3X2 spin systems.
Sketch the spectra you expect for AMX, A2MX, A3MX, A2MX2, A3MX2 spin
systems, where A does not couple X, and JAM = JMX
Sketch the spectra you expect for AMX, A2MX, A3MX, A2MX2, A3MX2 spin
systems, where A does not couple X, and JAM = 10 Hz, and JMX = 5 Hz.
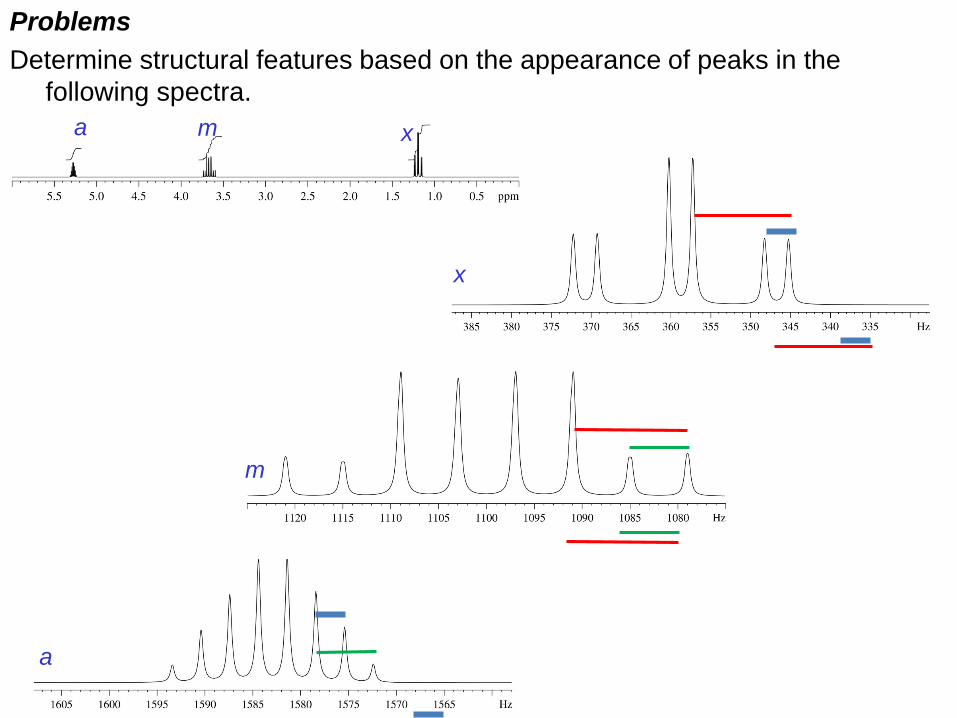
Problems
Determine structural features based on the appearance of peaks in the
following spectra.
a m x
a
m
x
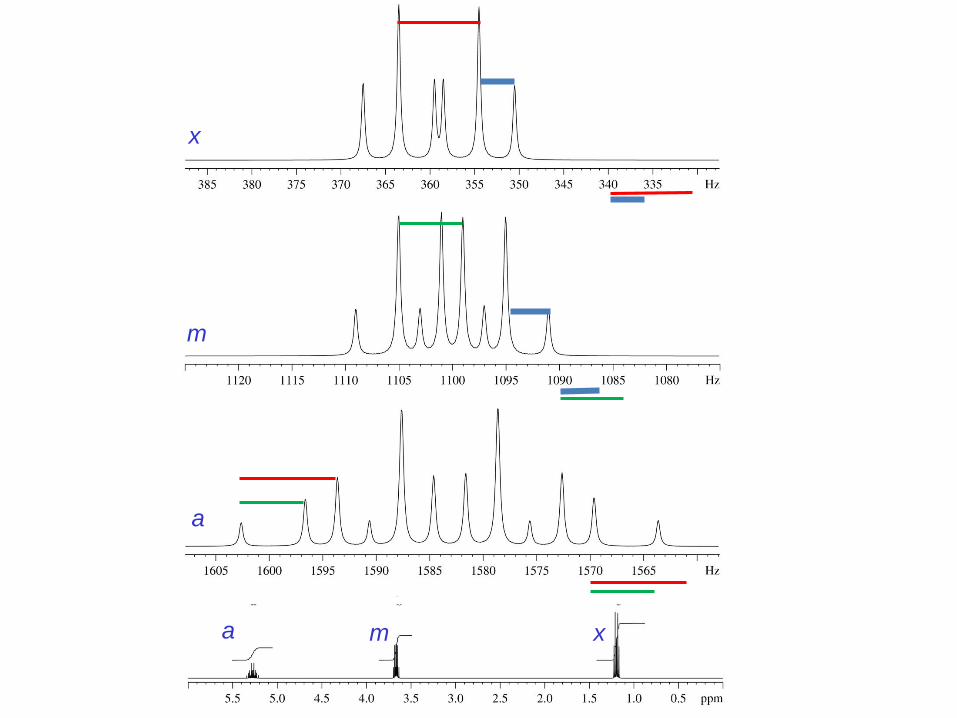
a m x
a
m
x

a m x
a
m
x

Magnetic Inequivalent Nuclei Pavia 5.4,13
- Two protons which are chemical shift equivalent (i.e., related by symmetry)
can be split by a second set of protons
e.g., an A2X2 system gives a t of t
- However, each proton of type A might couple differently to each proton X. In
this case, the two A protons are said to be "magnetically inequivalent”, and
are labeled A and A’. Protons X will also be magnetically inequivalent (i.e., X
and X’).
Remember, complex sets of peaks are observed (higher order spectra) if the
chemical shifts of the peaks are similar.
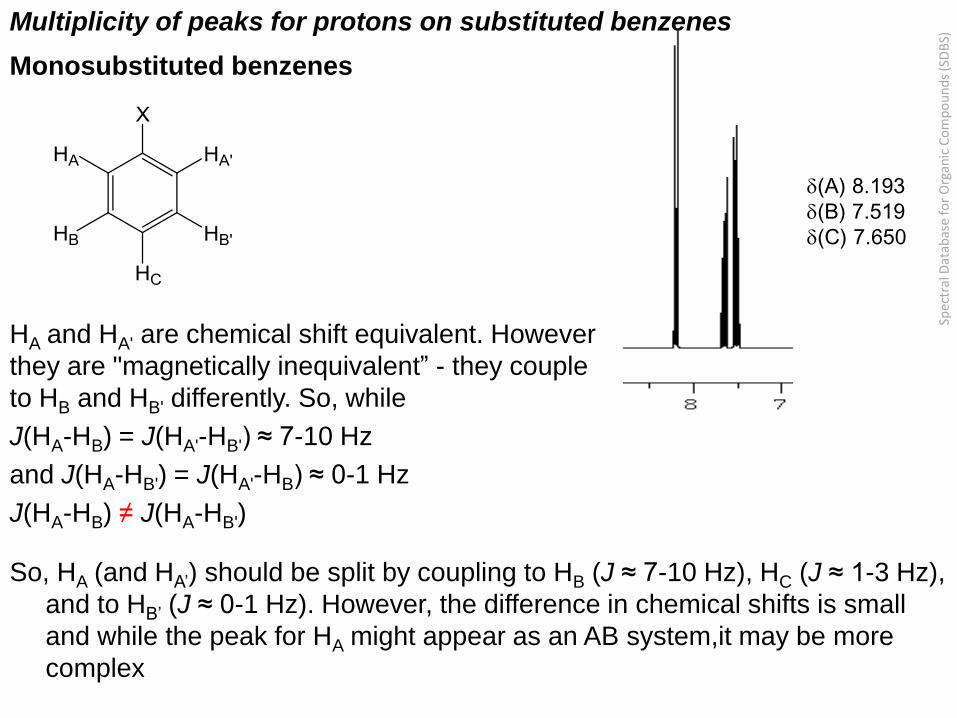
Monosubstituted benzenes
HA and HA' are chemical shift equivalent. However
they are "magnetically inequivalent” - they couple
to HB and HB' differently. So, while
J(HA-HB) = J(HA'-HB') ≈ 7-10 Hz
and J(HA-HB') = J(HA'-HB) ≈ 0-1 Hz
J(HA-HB) ≠ J(HA-HB')
So, HA (and HA’) should be split by coupling to HB (J ≈ 7-10 Hz), HC (J ≈ 1-3 Hz),
and to HB’ (J ≈ 0-1 Hz). However, the difference in chemical shifts is small
and while the peak for HA might appear as an AB system,it may be more
complex
(A) 8.193
(B) 7.519
(C) 7.650
Multiplicity of peaks for protons on substituted benzenes
Spec
tral
Dat
abas
e fo
r O
rgan
ic C
om
po
un
ds
(SD
BS)

Unsymmetrically para-disubstituted benzene
HA and HA' are chemical shift equivalent. However
they are "magnetically inequivalent” - they couple
to HB and HB' differently. So, while
J(HA-HB) = J(HA'-HB') ≈ 7-10 Hz
and J(HA-HB') = J(HA'-HB) ≈ 0-1 Hz
J(HA-HB) ≠ J(HA-HB')
So, HA (and HA’) should be split by coupling to HB
(J ≈ 7-10 Hz) and to HB’ (J ≈ 0-1 Hz). However,
the difference in chemical shifts is small and
while the peak for HA might appear as AB
system, it may be more complex
Spec
tral
Dat
abas
e fo
r O
rgan
ic C
om
po
un
ds
(SD
BS)

Symmetrical ortho disubstituted benzene
HA and HA' are chemical shift equivalent. However
they are "magnetically inequivalent” - they couple
to HB and HB' differently. So, while
J(HA-HB) = J(HA'-HB') ≈ 7-10 Hz
and J(HA-HB') = J(HA'-HB) ≈ 0-1 Hz
J(HA-HB) ≠ J(HA'-HB')
So, HA (and HA’) should be split by coupling to HB
(J ≈ 7-10 Hz) and to HB’ (J ≈ 0-1 Hz). However,
the difference in chemical shifts is small and
while the peak for HA might appear as AB
system, it may be more complex
Spec
tral
Dat
abas
e fo
r O
rgan
ic C
om
po
un
ds
(SD
BS)
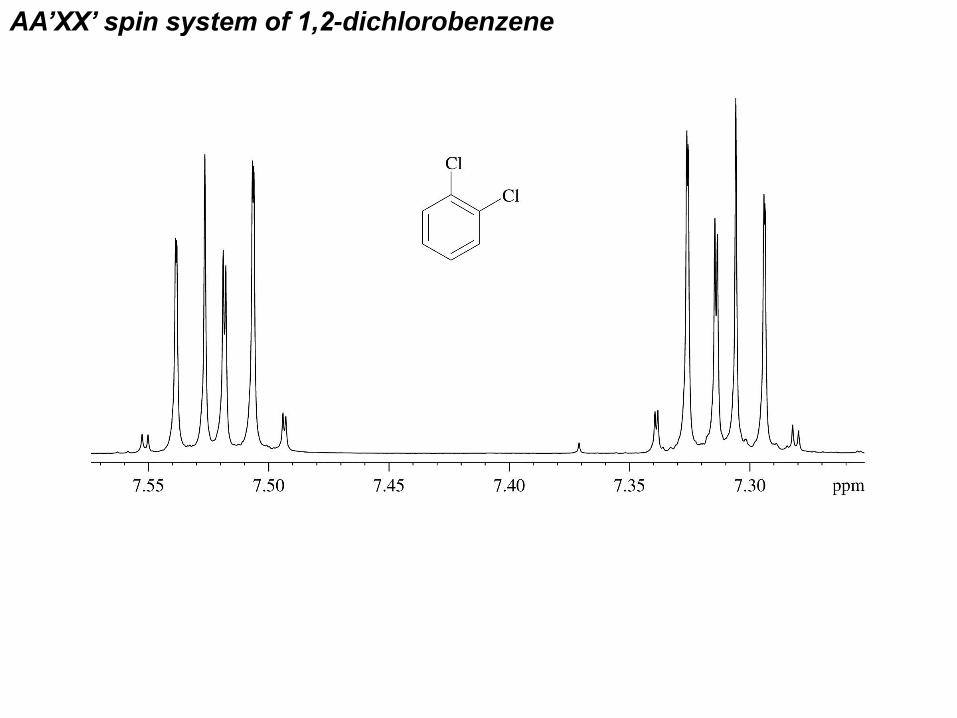
AA’XX’ spin system of 1,2-dichlorobenzene

Determining substitution patterns – Which one is which? Pavia 5.13

AA’BB’ spin system of a cyclic system
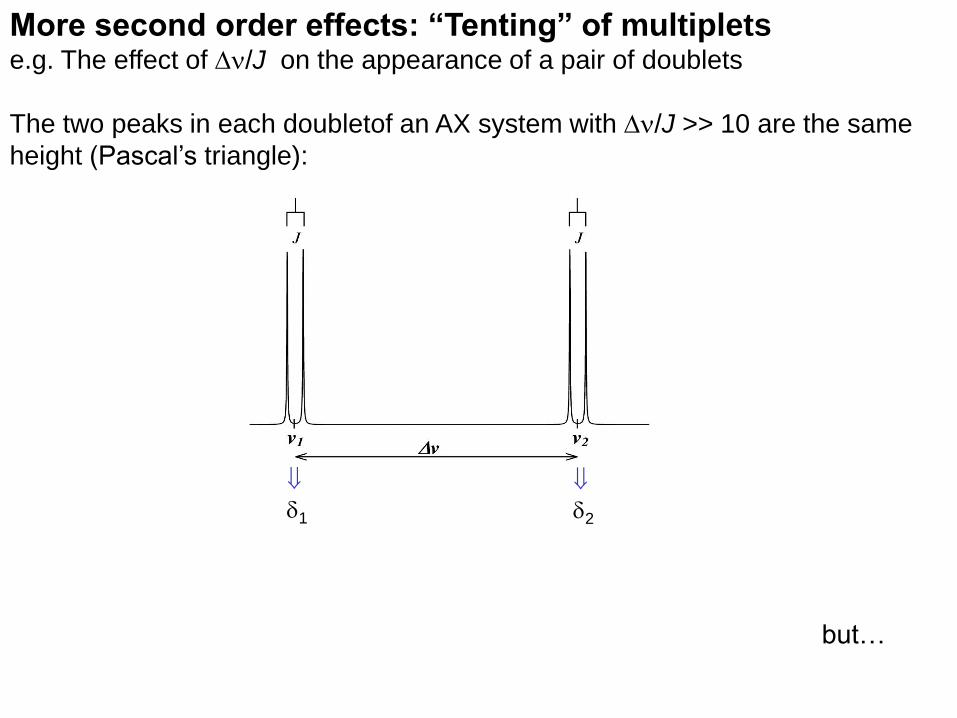
More second order effects: “Tenting” of multipletse.g. The effect of Dn/J on the appearance of a pair of doublets
The two peaks in each doubletof an AX system with Dn/J >> 10 are the same
height (Pascal’s triangle):
but…
1
2

… as Dn/J becomes < 8, the inside peaks increase in intensity relative to the outside peaks.
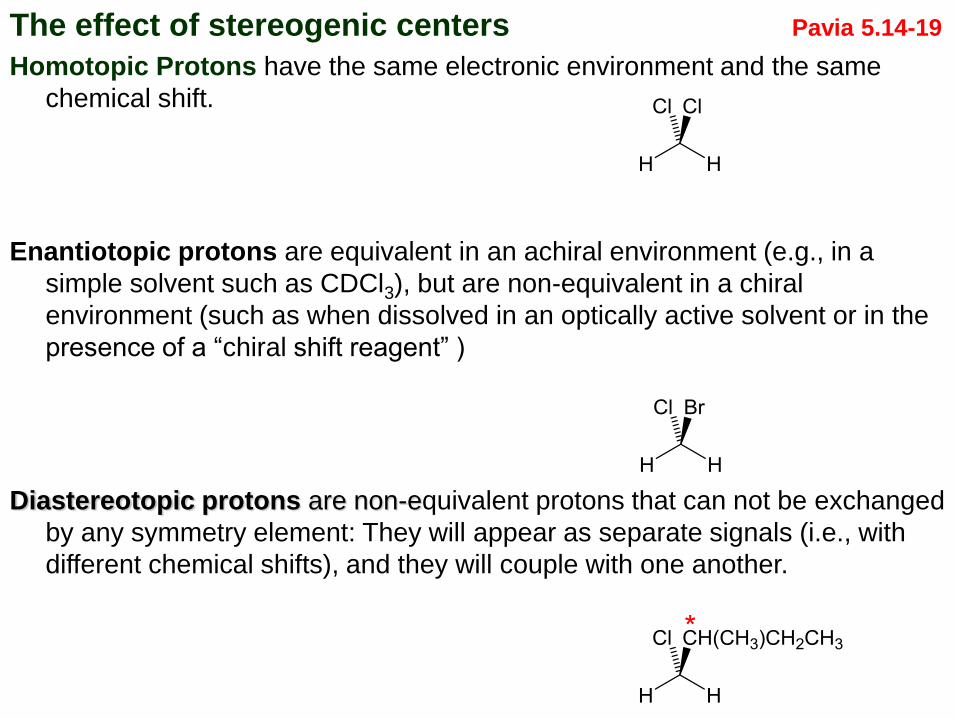
The effect of stereogenic centers Pavia 5.14-19
Homotopic Protons have the same electronic environment and the same
chemical shift.
Enantiotopic protons are equivalent in an achiral environment (e.g., in a
simple solvent such as CDCl3), but are non-equivalent in a chiral
environment (such as when dissolved in an optically active solvent or in the
presence of a “chiral shift reagent” )
Diastereotopic protons are non-equivalent protons that can not be exchanged
by any symmetry element: They will appear as separate signals (i.e., with
different chemical shifts), and they will couple with one another.

Diastereotopic protons
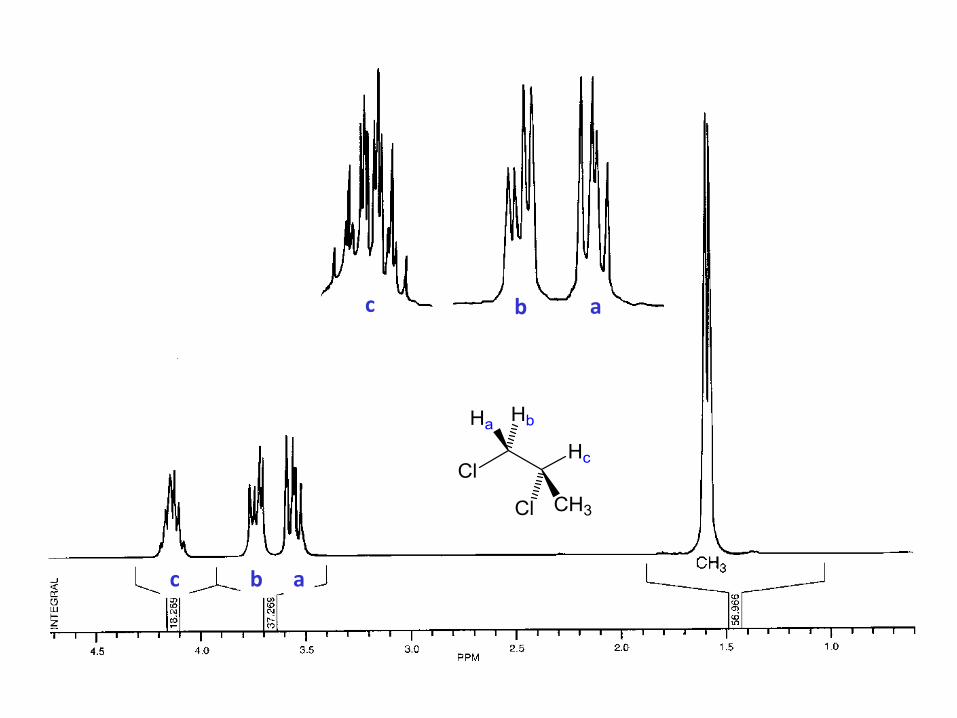
abc
abc
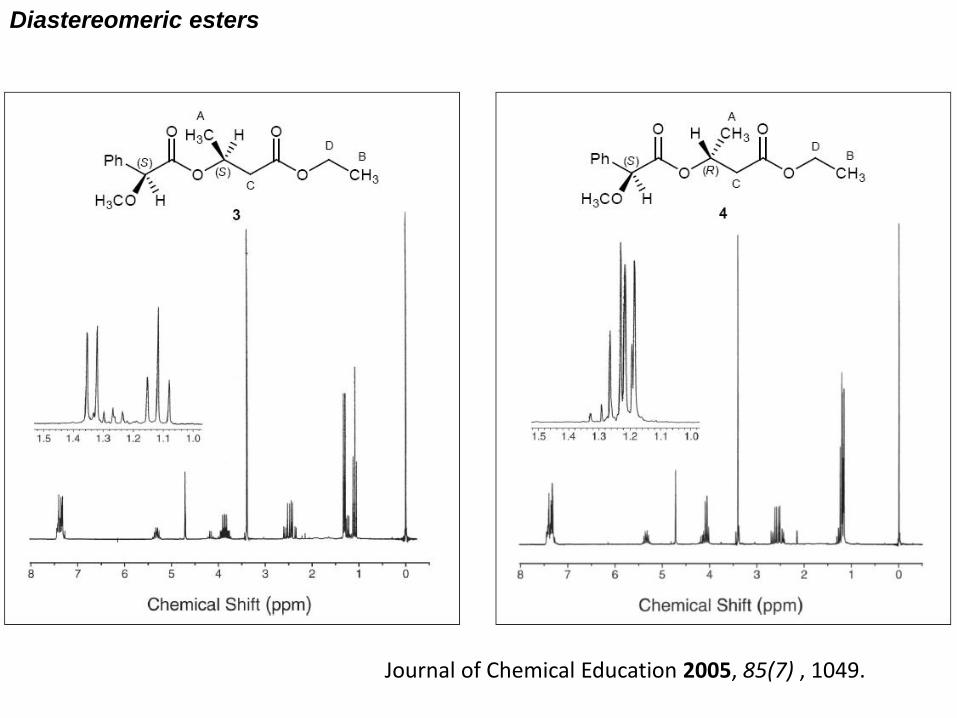
Journal of Chemical Education 2005, 85(7) , 1049.
Diastereomeric esters

Diastereomeric complexes formed between two enantiomers
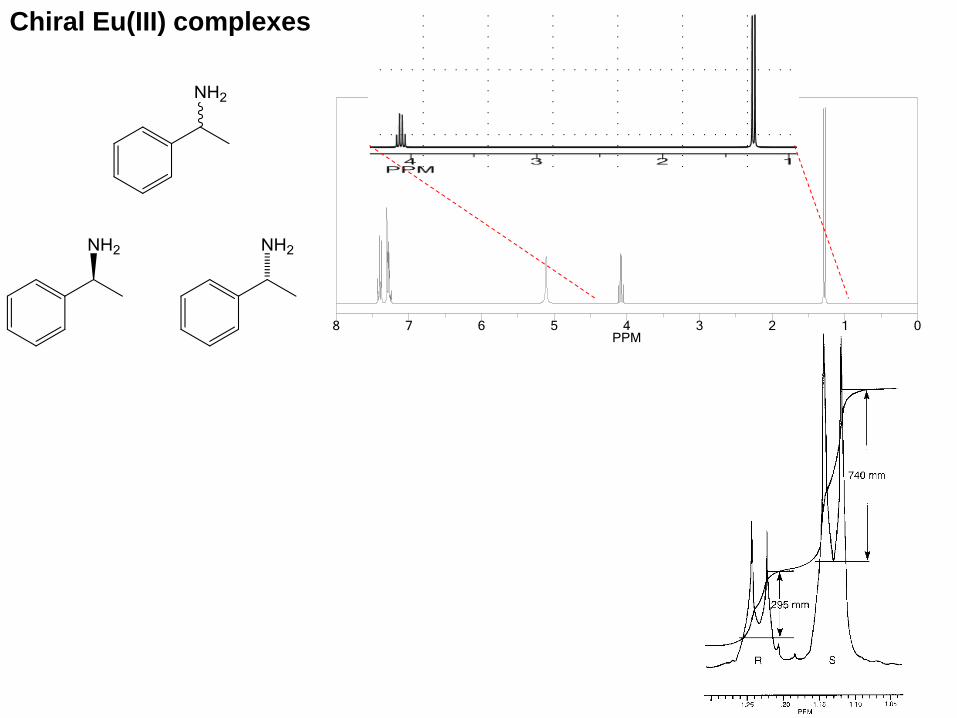
Chiral Eu(III) complexes

H2O
MORE COMPLEX STRUCTURES
CHALLENGES AND NEW TOOLS
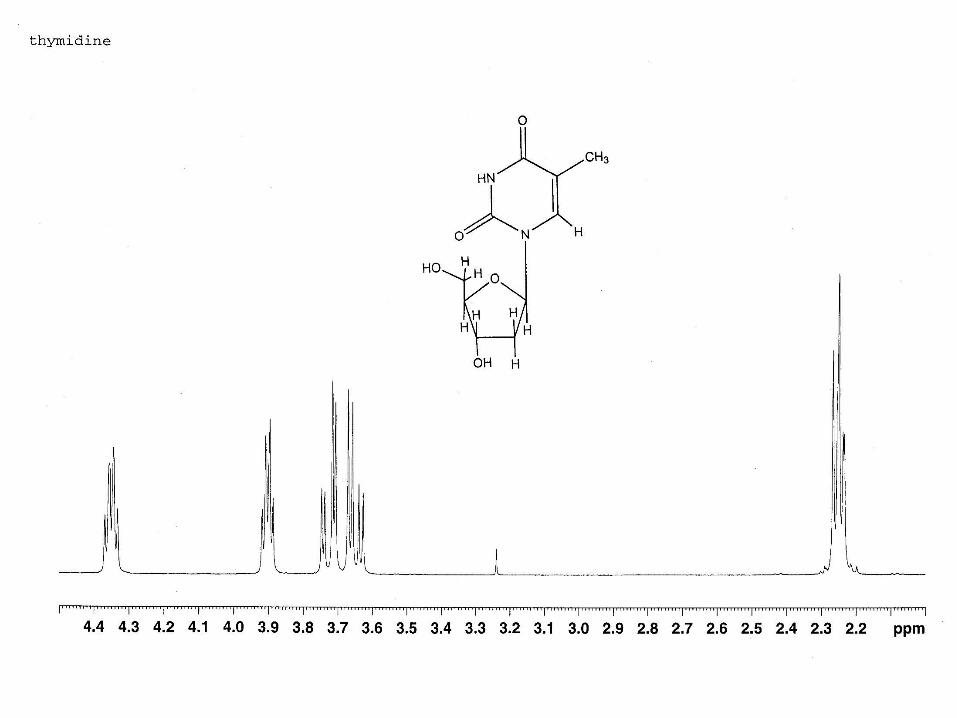
Thymidine


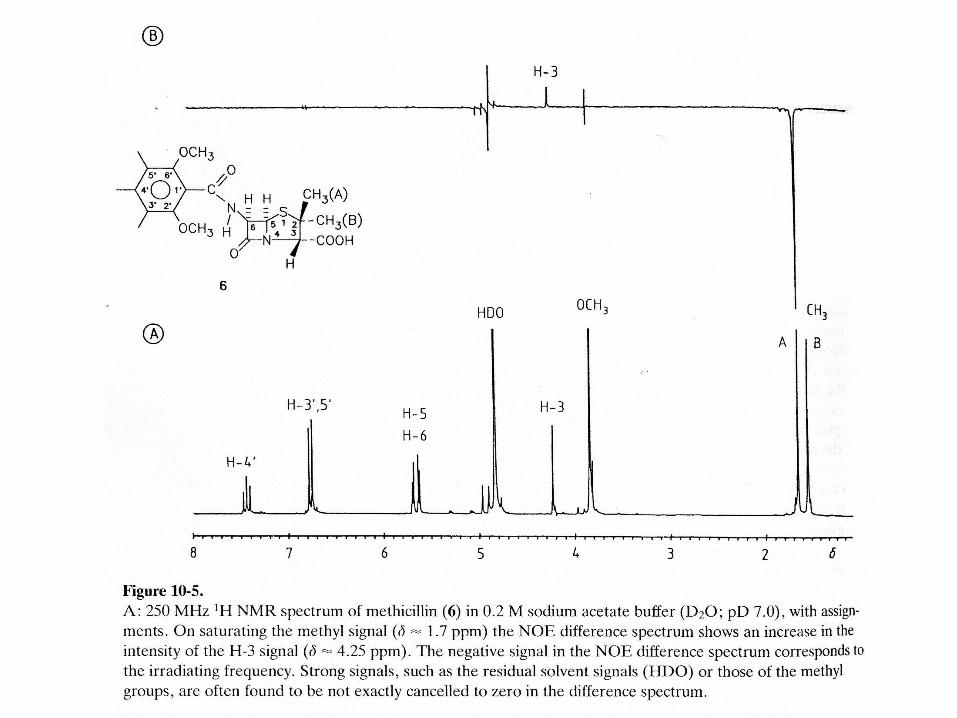
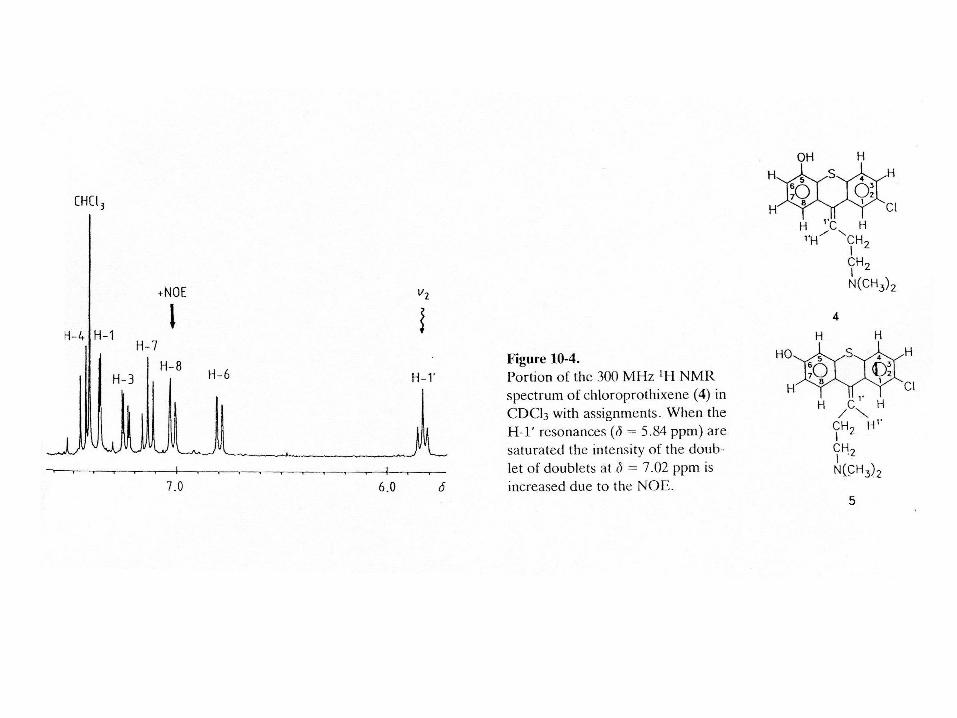
Nuclear Overhauser Effect
Basic One and Two Dimensional NMR spectroscopy, 5th Ed., Friebolin, Wiley-VCH
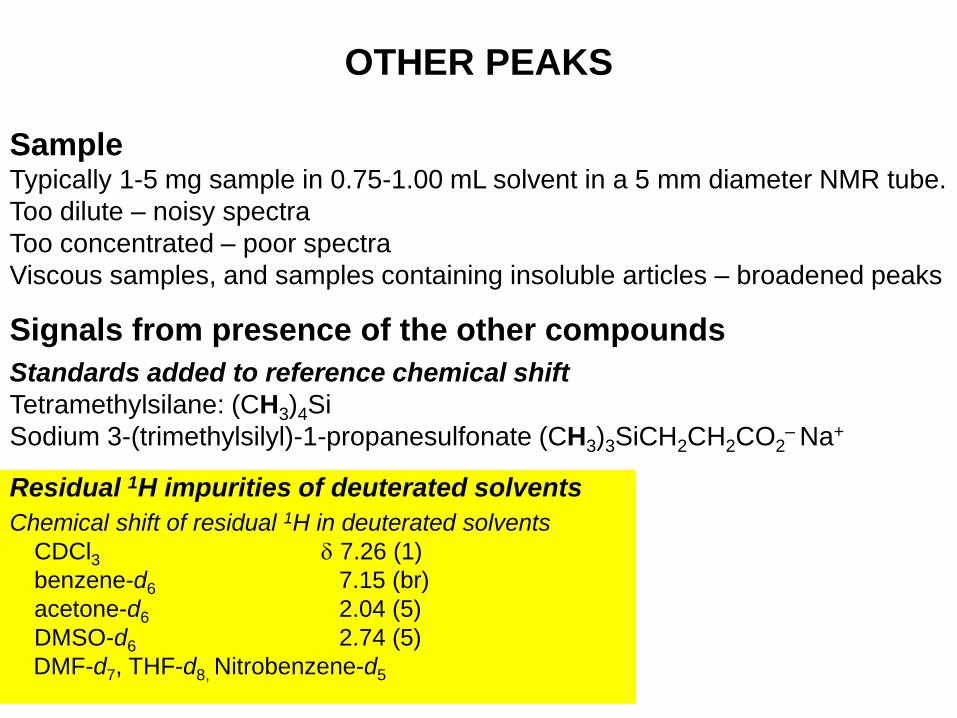
OTHER PEAKS
SampleTypically 1-5 mg sample in 0.75-1.00 mL solvent in a 5 mm diameter NMR tube.
Too dilute – noisy spectra
Too concentrated – poor spectra
Viscous samples, and samples containing insoluble articles – broadened peaks
Signals from presence of the other compounds
Standards added to reference chemical shift
Tetramethylsilane: (CH3)4Si
Sodium 3-(trimethylsilyl)-1-propanesulfonate (CH3)3SiCH2CH2CO2– Na+
Residual 1H impurities of deuterated solvents
Chemical shift of residual 1H in deuterated solvents
CDCl3 7.26 (1)
benzene-d6 7.15 (br)
acetone-d6 2.04 (5)
DMSO-d6 2.74 (5)
DMF-d7, THF-d8, Nitrobenzene-d5
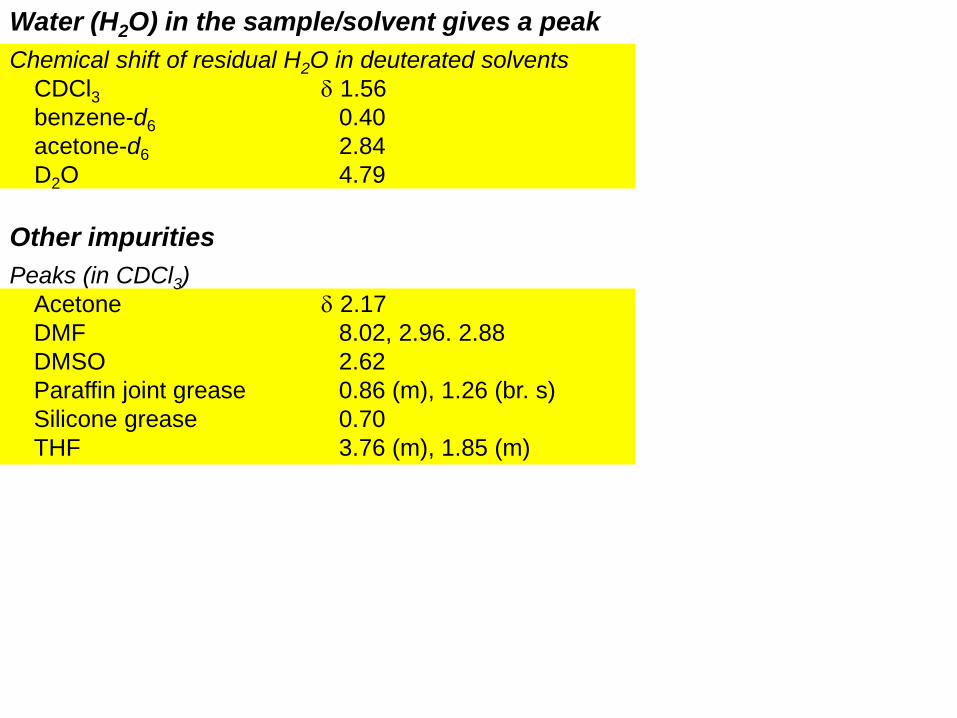
Water (H2O) in the sample/solvent gives a peak
Chemical shift of residual H2O in deuterated solvents
CDCl3 1.56
benzene-d6 0.40
acetone-d6 2.84
D2O 4.79
Other impurities
Peaks (in CDCl3)
Acetone 2.17
DMF 8.02, 2.96. 2.88
DMSO 2.62
Paraffin joint grease 0.86 (m), 1.26 (br. s)
Silicone grease 0.70
THF 3.76 (m), 1.85 (m)

Spinning side bands
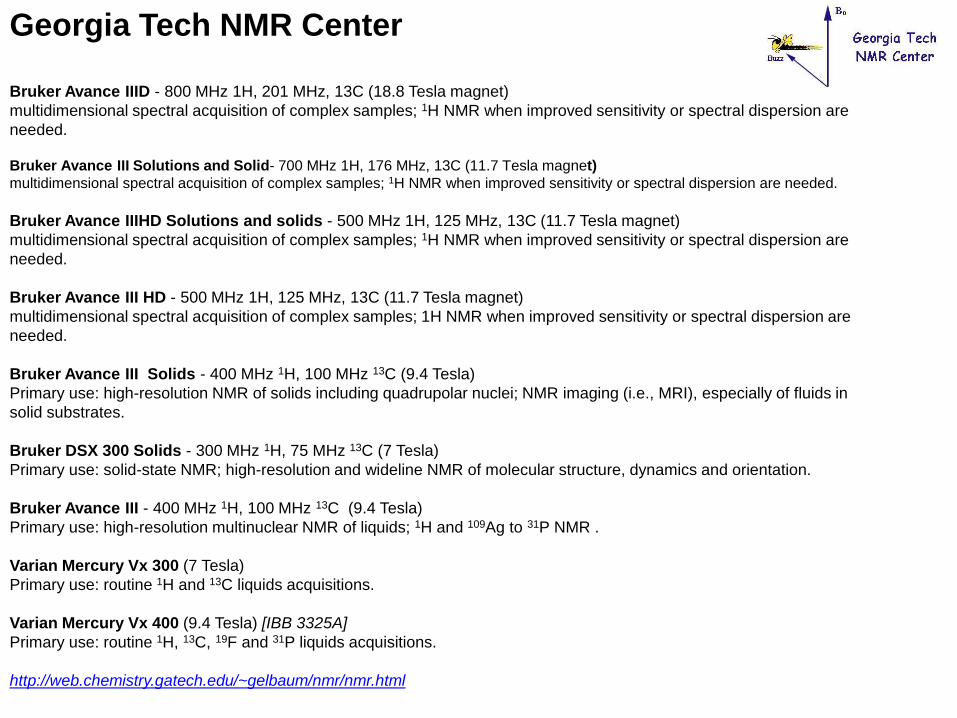
Georgia Tech NMR Center
Bruker Avance IIID - 800 MHz 1H, 201 MHz, 13C (18.8 Tesla magnet)
multidimensional spectral acquisition of complex samples; 1H NMR when improved sensitivity or spectral dispersion are
needed.
Bruker Avance III Solutions and Solid- 700 MHz 1H, 176 MHz, 13C (11.7 Tesla magnet)
multidimensional spectral acquisition of complex samples; 1H NMR when improved sensitivity or spectral dispersion are needed.
Bruker Avance IIIHD Solutions and solids - 500 MHz 1H, 125 MHz, 13C (11.7 Tesla magnet)
multidimensional spectral acquisition of complex samples; 1H NMR when improved sensitivity or spectral dispersion are
needed.
Bruker Avance III HD - 500 MHz 1H, 125 MHz, 13C (11.7 Tesla magnet)
multidimensional spectral acquisition of complex samples; 1H NMR when improved sensitivity or spectral dispersion are
needed.
Bruker Avance III Solids - 400 MHz 1H, 100 MHz 13C (9.4 Tesla)
Primary use: high-resolution NMR of solids including quadrupolar nuclei; NMR imaging (i.e., MRI), especially of fluids in
solid substrates.
Bruker DSX 300 Solids - 300 MHz 1H, 75 MHz 13C (7 Tesla)
Primary use: solid-state NMR; high-resolution and wideline NMR of molecular structure, dynamics and orientation.
Bruker Avance III - 400 MHz 1H, 100 MHz 13C (9.4 Tesla)
Primary use: high-resolution multinuclear NMR of liquids; 1H and 109Ag to 31P NMR .
Varian Mercury Vx 300 (7 Tesla)
Primary use: routine 1H and 13C liquids acquisitions.
Varian Mercury Vx 400 (9.4 Tesla) [IBB 3325A]
Primary use: routine 1H, 13C, 19F and 31P liquids acquisitions.
http://web.chemistry.gatech.edu/~gelbaum/nmr/nmr.html
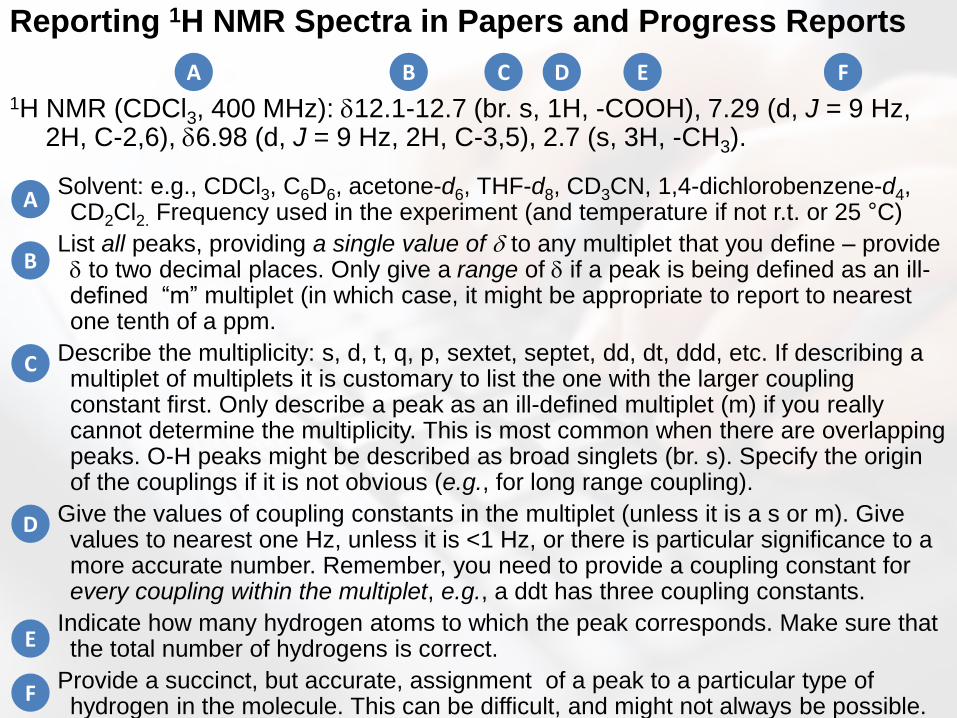
Reporting 1H NMR Spectra in Papers and Progress Reports
1H NMR (CDCl3, 400 MHz): 12.1-12.7 (br. s, 1H, -COOH), 7.29 (d, J = 9 Hz, 2H, C-2,6), 6.98 (d, J = 9 Hz, 2H, C-3,5), 2.7 (s, 3H, -CH3).
Solvent: e.g., CDCl3, C6D6, acetone-d6, THF-d8, CD3CN, 1,4-dichlorobenzene-d4, CD2Cl2. Frequency used in the experiment (and temperature if not r.t. or 25 °C)
List all peaks, providing a single value of to any multiplet that you define – provide to two decimal places. Only give a range of if a peak is being defined as an ill-defined “m” multiplet (in which case, it might be appropriate to report to nearest one tenth of a ppm.
Describe the multiplicity: s, d, t, q, p, sextet, septet, dd, dt, ddd, etc. If describing a multiplet of multiplets it is customary to list the one with the larger coupling constant first. Only describe a peak as an ill-defined multiplet (m) if you really cannot determine the multiplicity. This is most common when there are overlapping peaks. O-H peaks might be described as broad singlets (br. s). Specify the origin of the couplings if it is not obvious (e.g., for long range coupling).
Give the values of coupling constants in the multiplet (unless it is a s or m). Give values to nearest one Hz, unless it is <1 Hz, or there is particular significance to a more accurate number. Remember, you need to provide a coupling constant for every coupling within the multiplet, e.g., a ddt has three coupling constants.
Indicate how many hydrogen atoms to which the peak corresponds. Make sure that the total number of hydrogens is correct.
Provide a succinct, but accurate, assignment of a peak to a particular type of hydrogen in the molecule. This can be difficult, and might not always be possible.
A B C D E F
A
B
C
D
E
F

Determine the structures of the compounds for which the
spectra are provided on the following slides. You
considered the IR spectra alone, and the IR and MS
together, in previous sections. Now, with NMR data, you
should be able to identify a single compound.

Exact mass = 114.1043
Compound A


C.I. Exact mass = 116.1203
Compound B
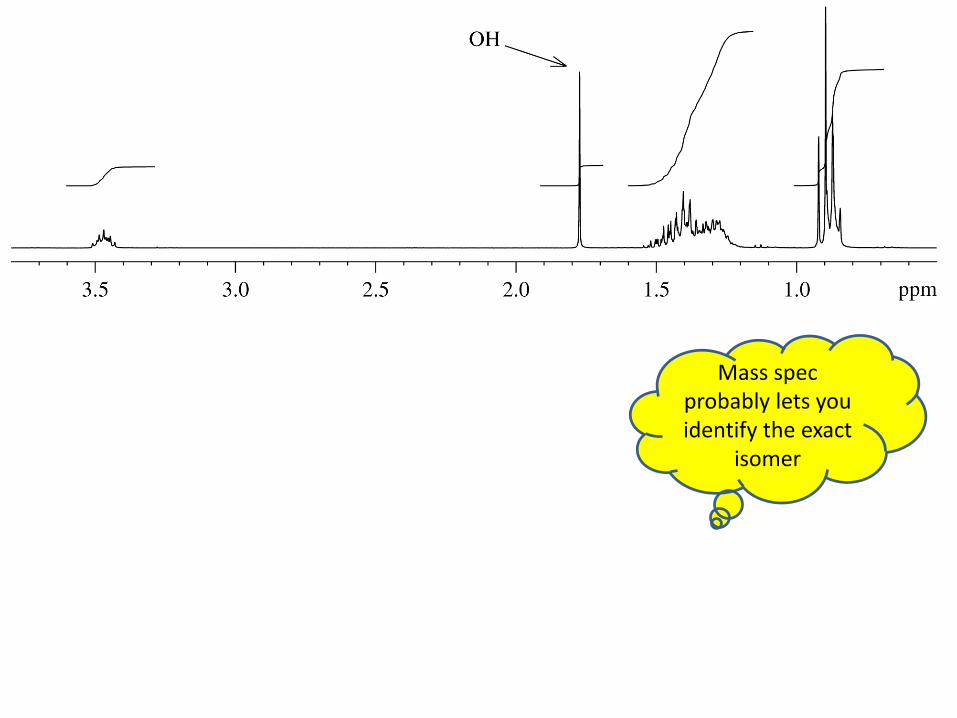
Mass spec probably lets you identify the exact
isomer

Exact mass = 169.9735
Compound C
There were probably 4 possibilities when we considered just the IR and MS – now look at
the NMR


Exact mass = 150.0041
Compound D

You might have nailed this one with the MS
alone – does the NMR confirm your choice?
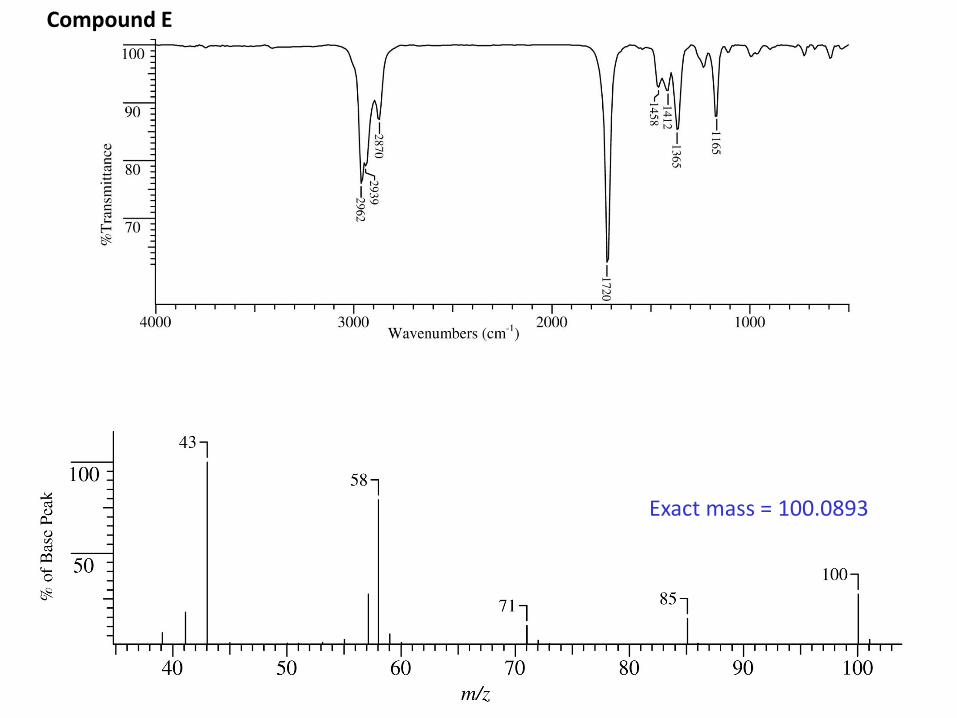
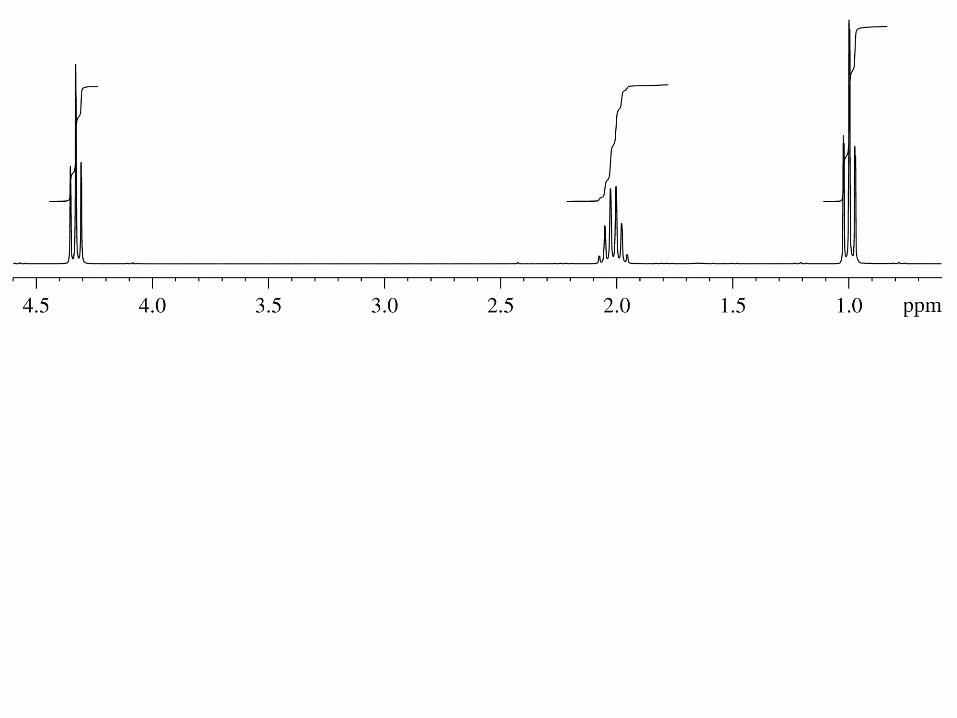
Exact mass = 100.0893
Compound E

Again, you might have got this structure using only the MS and IR, but the NMR should
reassure you that you have the correct structure

Exact mass = 74.0363
Compound F
Do you really need the NMR to solve
this one?


Compound G
The formula, IR and fragmentation pattern
are enough to solve this one, right?
Exact mass = 73.0896


C.I. Exact mass = 56.0261
Compound H
The formula and IR are enough to
solve this


C.I. Exact mass = 89.0474
Compound I
Which functional groups contains N and
O and have a distinctive set of IR
peaks?
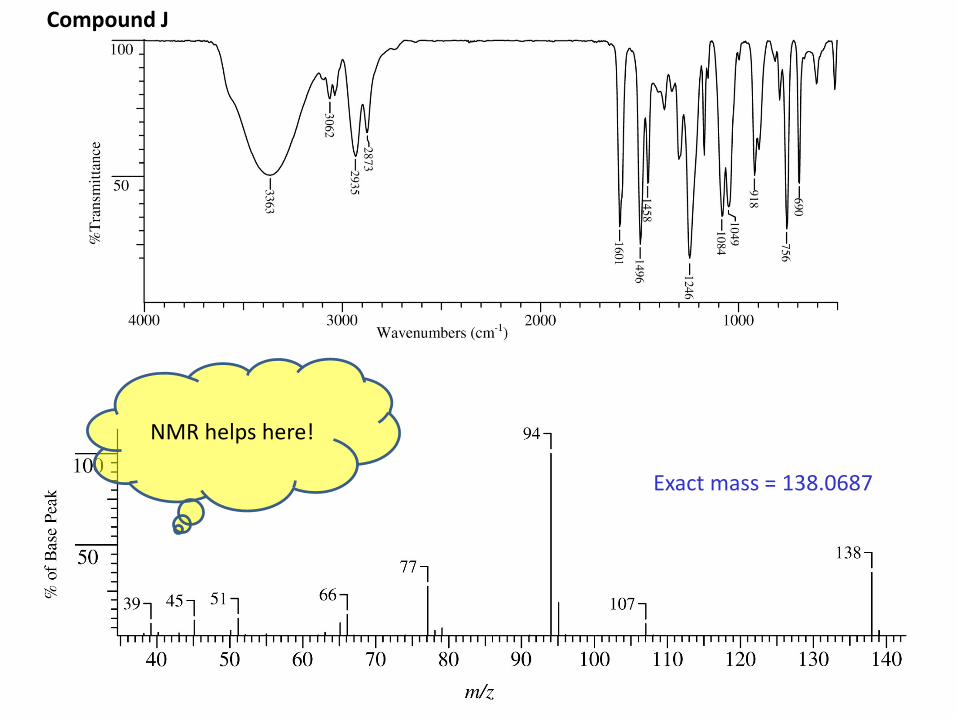
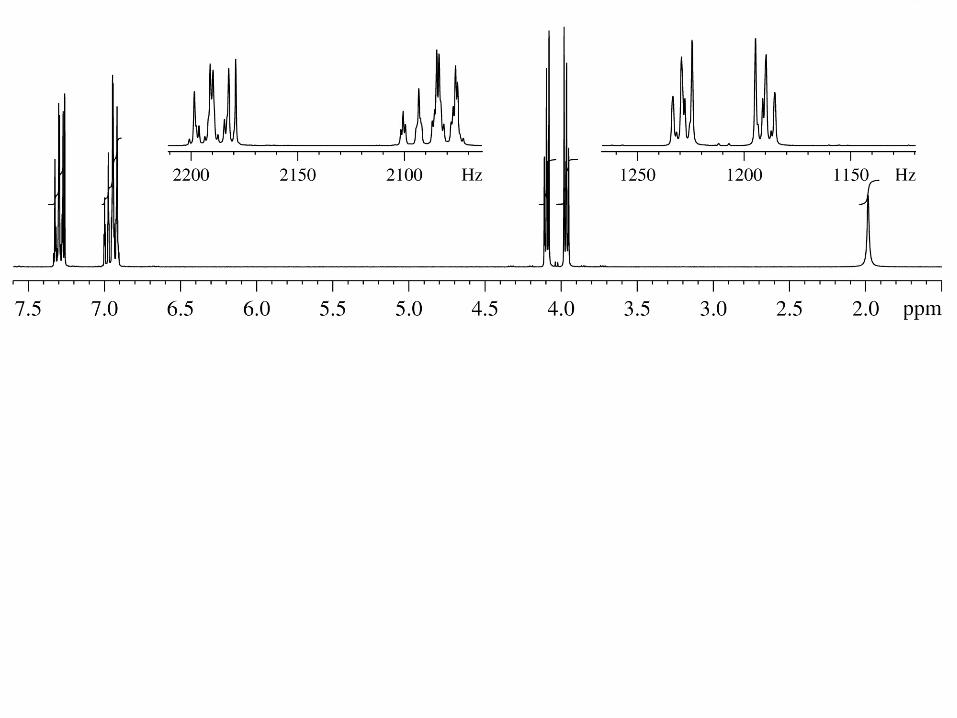
Exact mass = 138.0687
Compound J
NMR helps here!
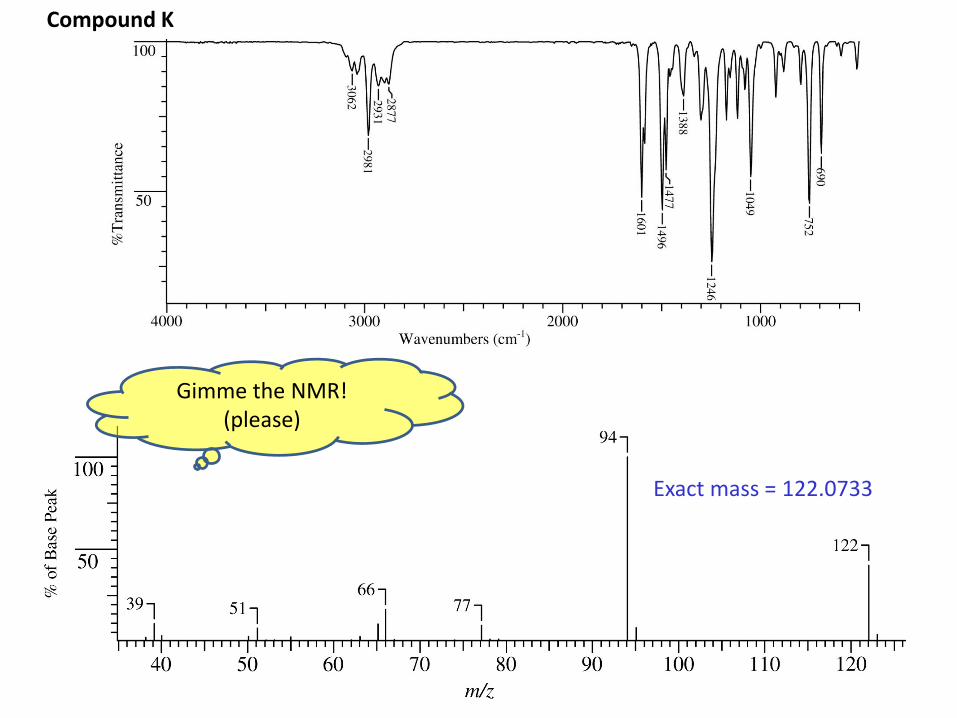
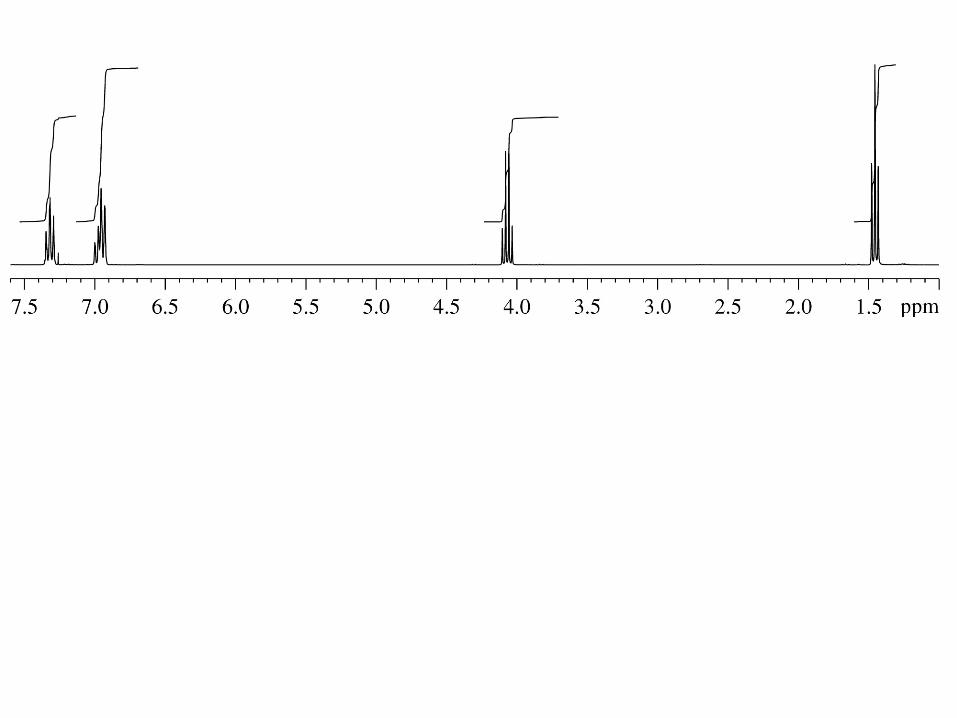
Exact mass = 122.0733
Compound K
Gimme the NMR! (please)
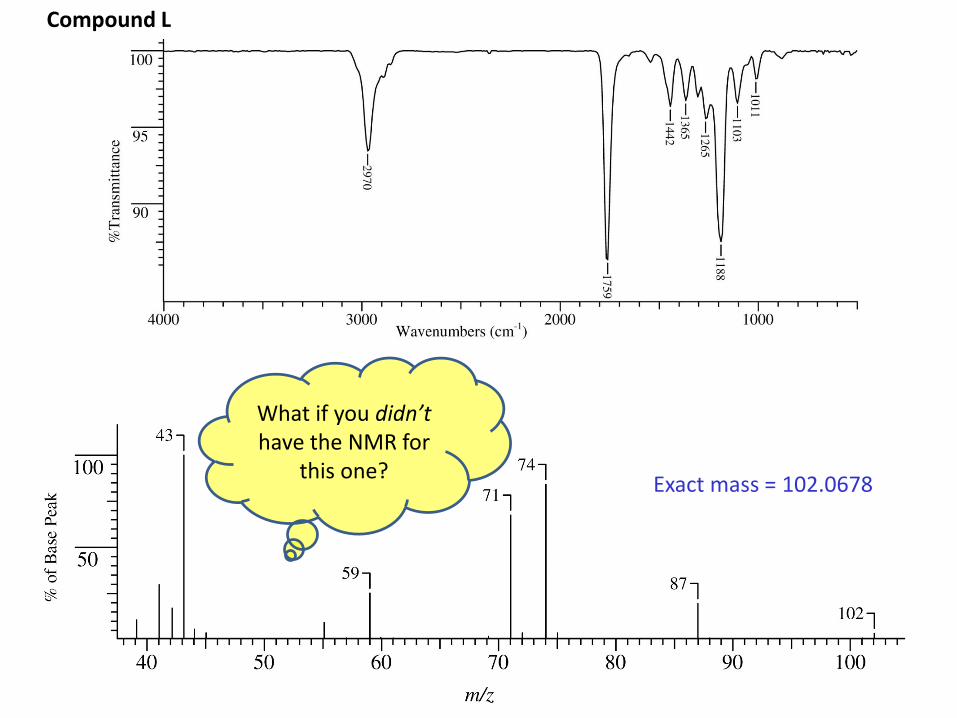
Exact mass = 102.0678
Compound L
What if you didn’t have the NMR for
this one?

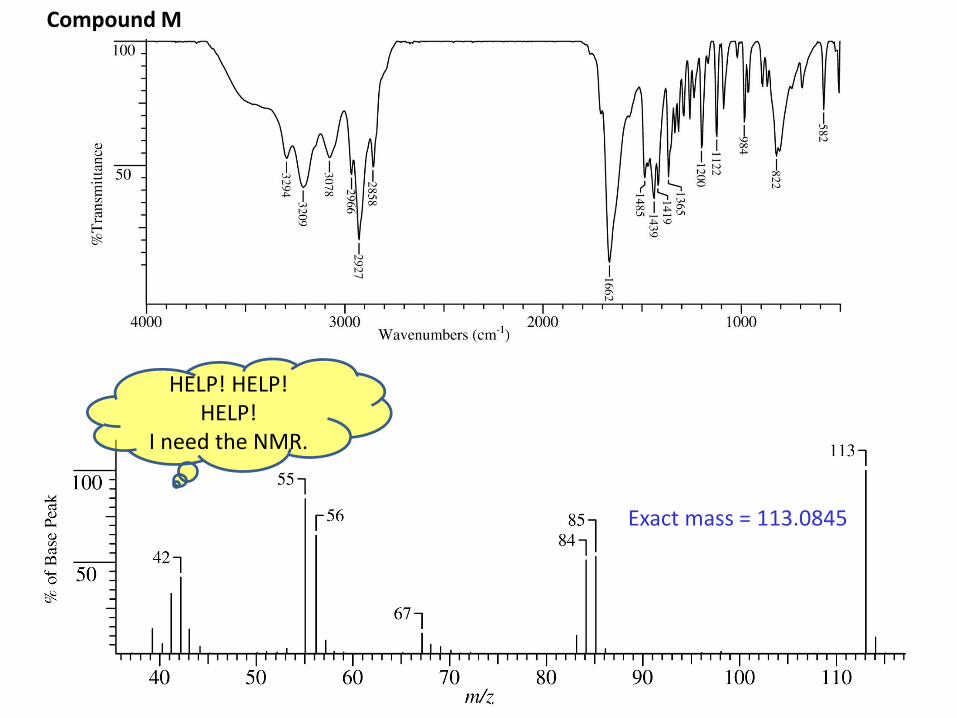
Exact mass = 113.0845
Compound M
HELP! HELP! HELP!
I need the NMR.
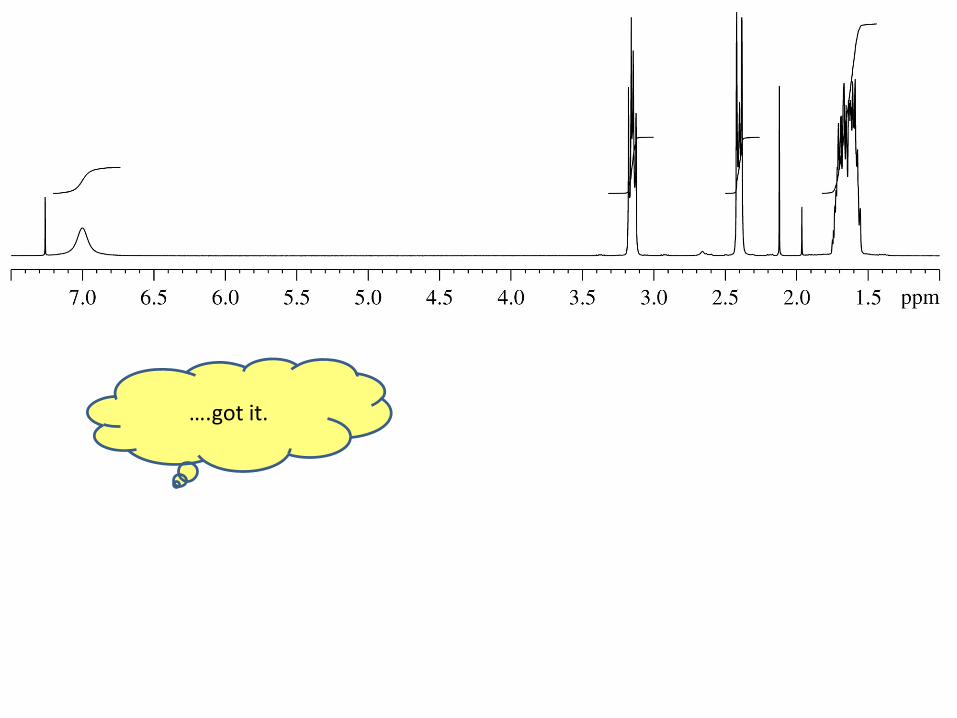
….got it.
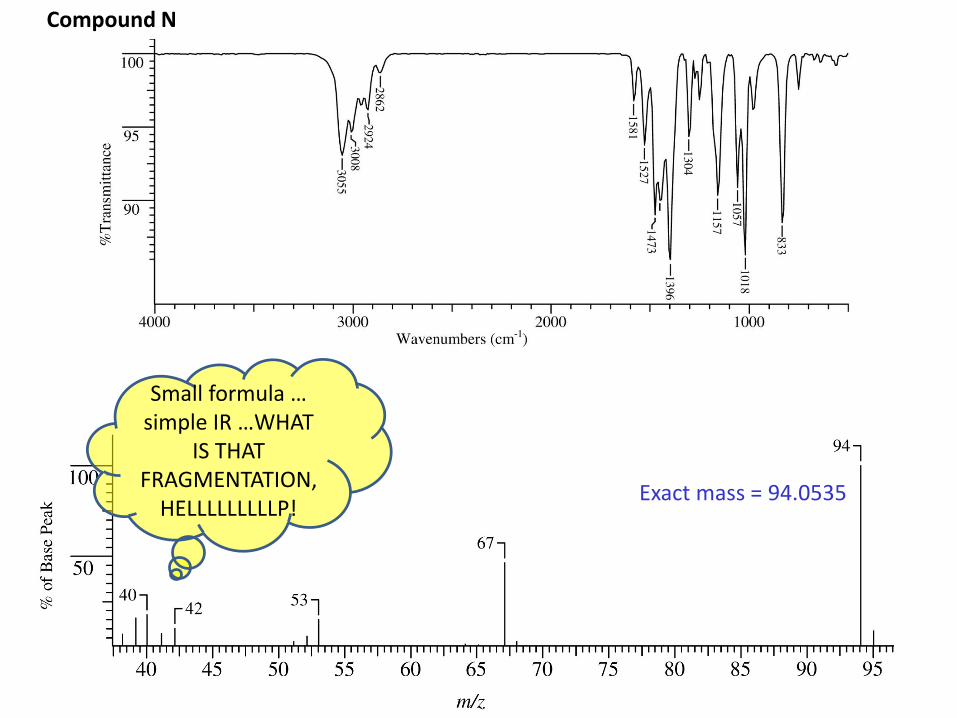
Exact mass = 94.0535
Compound N
Small formula … simple IR …WHAT
IS THAT FRAGMENTATION,
HELLLLLLLLLP!
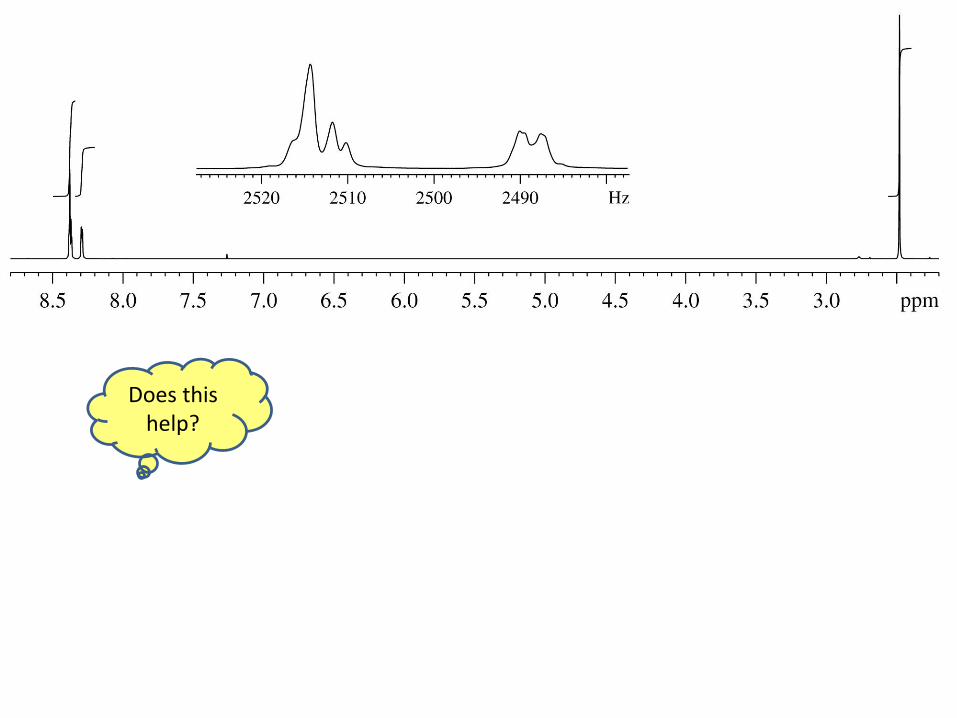
Does this help?
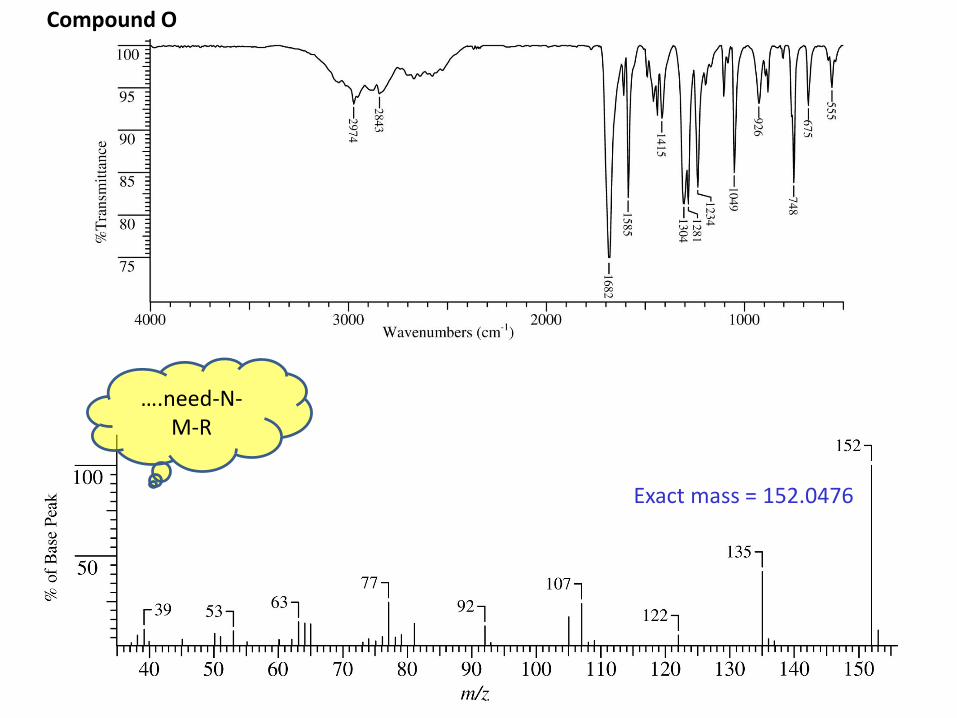
Exact mass = 152.0476
Compound O
….need-N-M-R

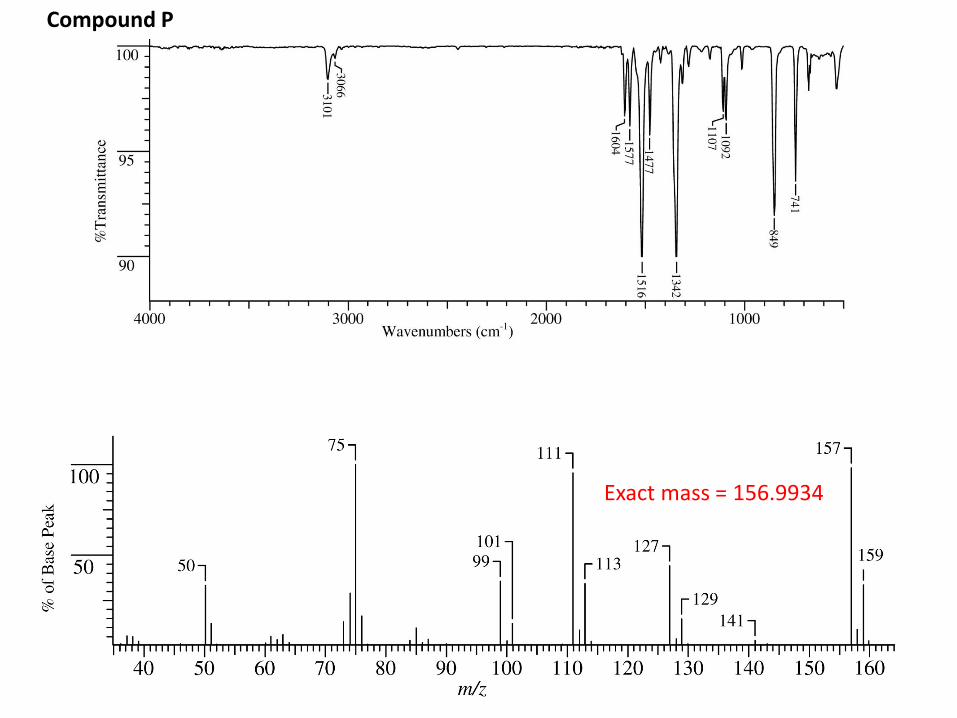
Exact mass = 156.9934
Compound P

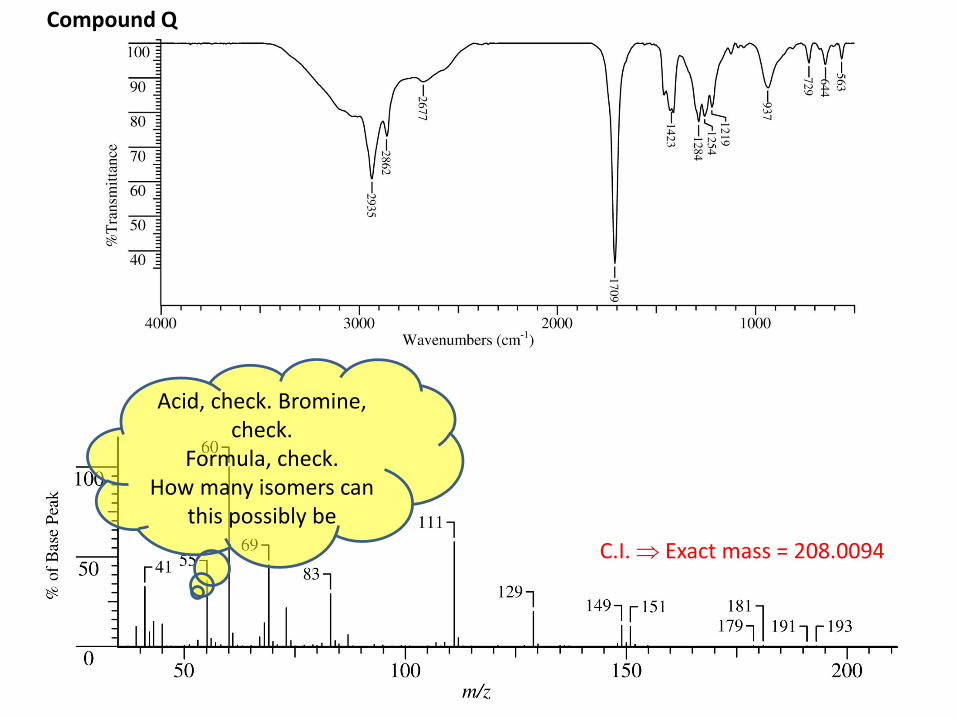
C.I. Exact mass = 208.0094
Compound Q
Acid, check. Bromine, check.
Formula, check.How many isomers can
this possibly be

UNO!
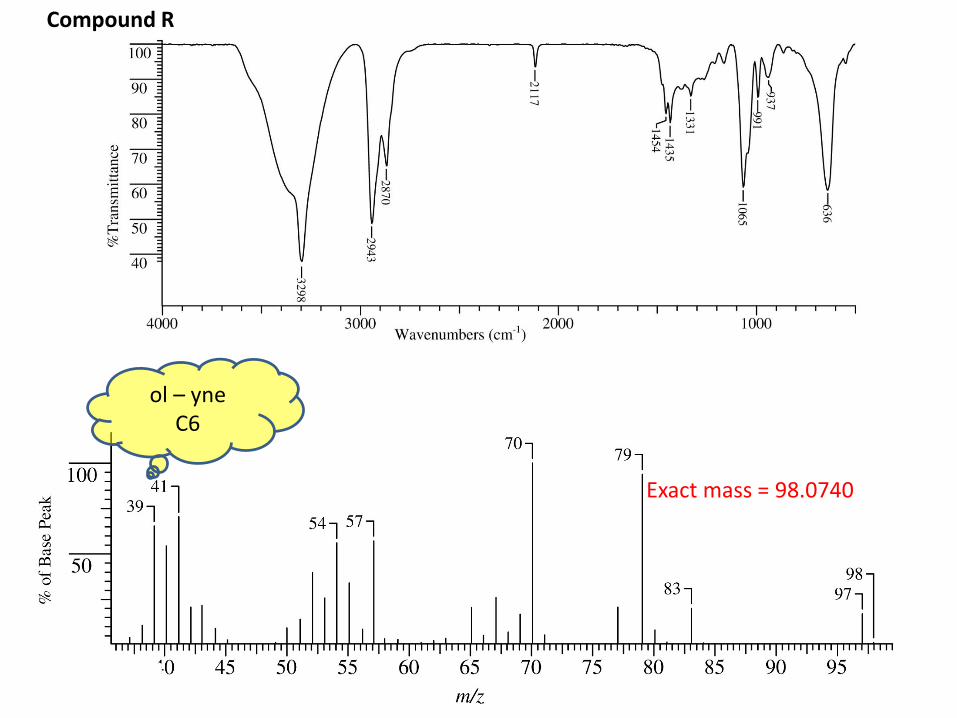
Exact mass = 98.0740
Compound R
ol – yneC6

Exact mass = 126.1041
Compound S
ketone

Cool 1H signal at
5.05!
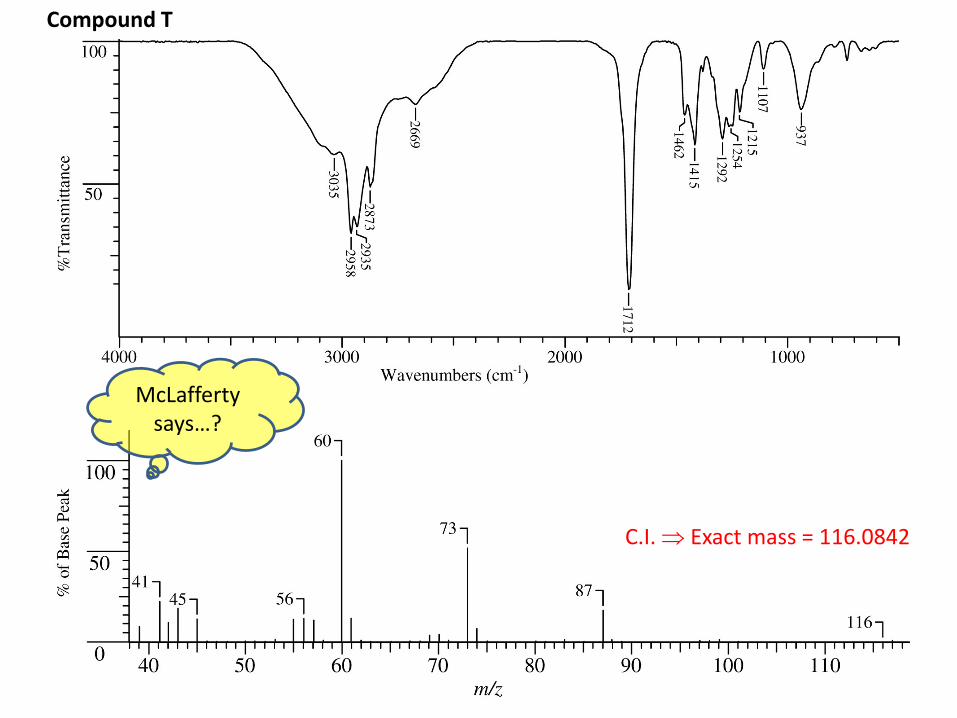
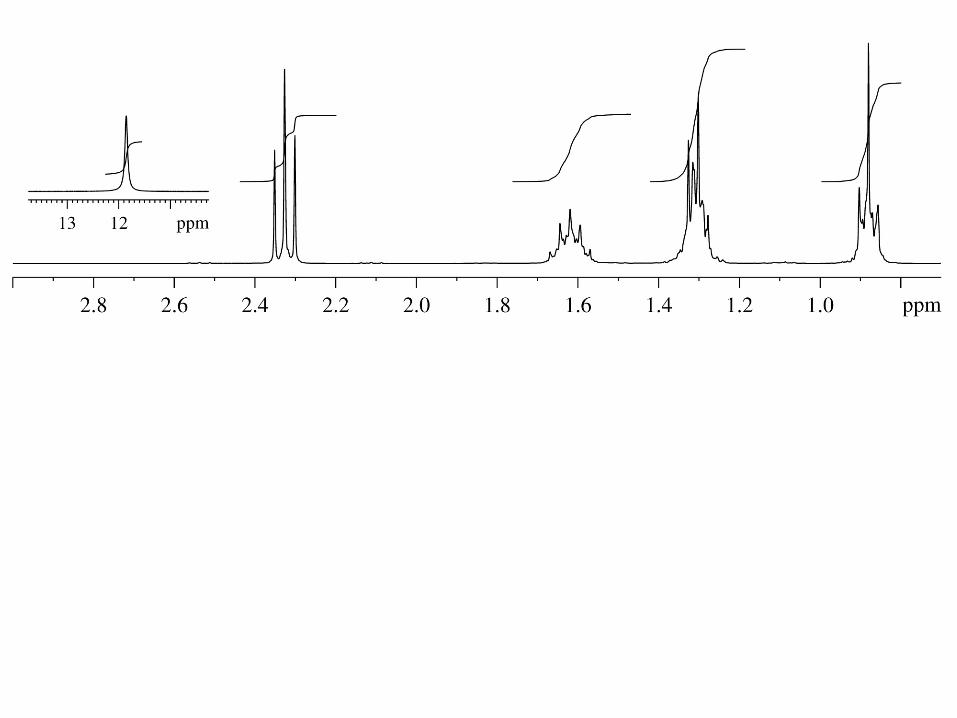
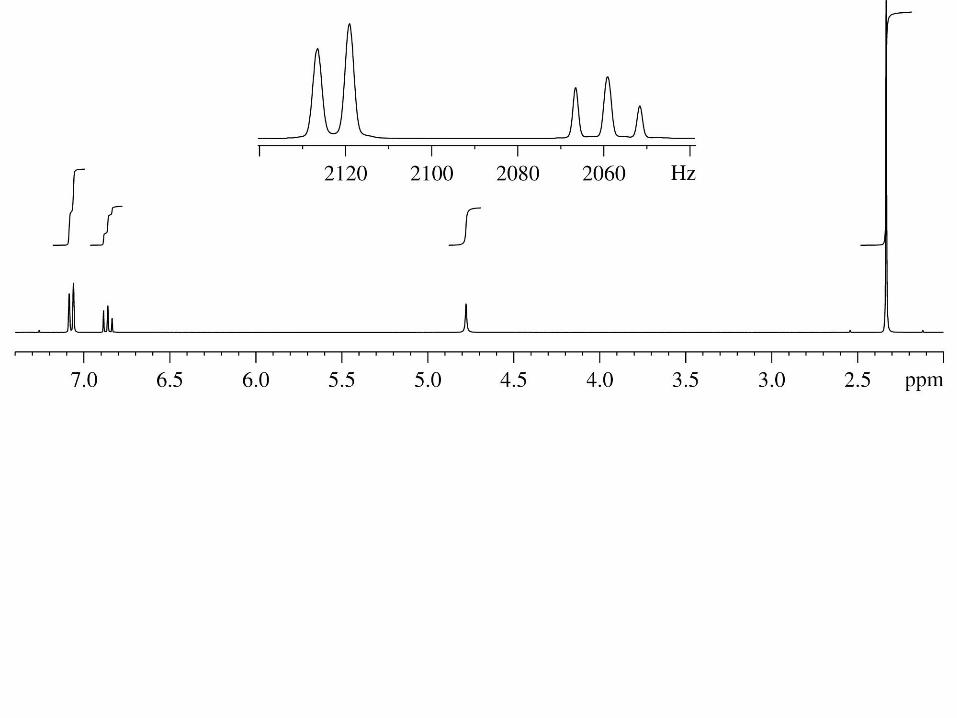
C.I. Exact mass = 116.0842
Compound T
McLafferty says…?

Exact mass = 161.9637
Compound U
A dichlorophenol, but which one?


Exact mass = 122.0733
Compound V
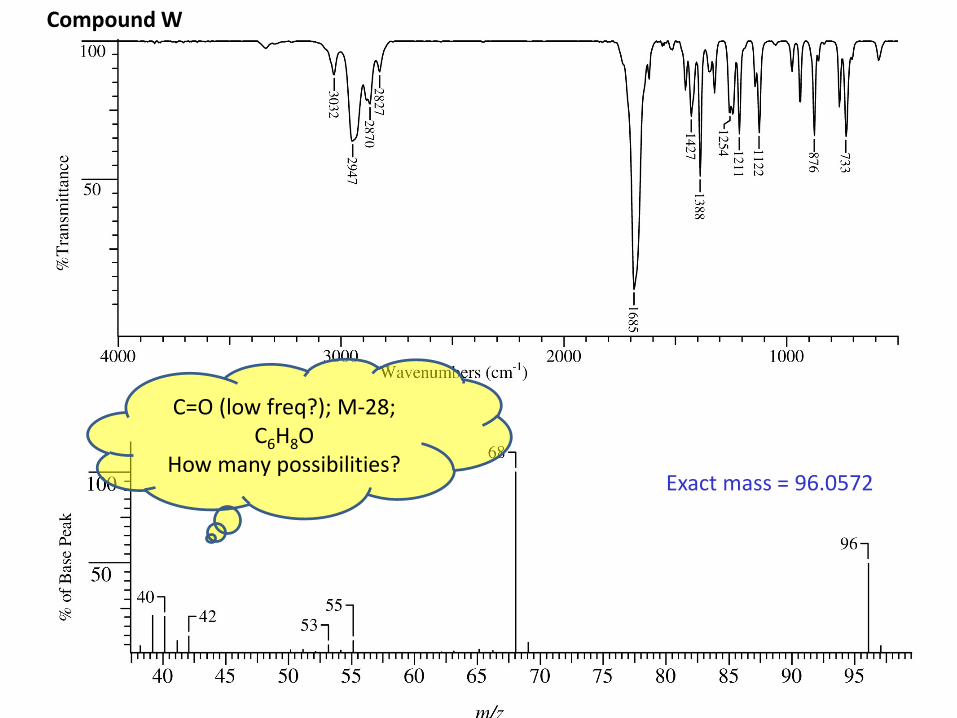
Exact mass = 96.0572
Compound W
C=O (low freq?); M-28; C6H8O
How many possibilities?

13C NMR SPECTROMETRY
Introduction
13C has nuclear spin (not 12C)
However, 13C is only present at 1.1% abundance
- Signals are weak, sample needs to be more concentrated
- Spectra usually acquired without multiplicity information
- Larger range of chemical shifts (0 to >200 ppm)


Types of information available from a 13C NMR spectrum
A 13C nuclear magnetic resonance spectrum contains information about the:
(a) number of different types of carbon
- Each peak corresponds to a different type of carbon
(b) type of carbons and proximity to functional groups
- Chemical shift provides information about the type
of carbon present
Unlike 1H NMR spectra, simple 13C NMR spectra do not provide information
about the:
relative number of each type of proton
(no integrals)
or
number of adjacent protons or carbons
(no coupling)
More advanced techniques, covered later in the class,
allow you to collect this information. This might be useful
In solving some structural problems.

Chart of general 13C chemical shifts

htt
p:/
/ww
w.c
hem
istr
y.cc
su.e
du
/gla
govi
ch/t
each
ing
/31
6/n
mr
13C chemical shifts: Carbonyls

htt
p:/
/ww
w.c
hem
istr
y.cc
su.e
du
/gla
govi
ch/t
each
ing
/31
6/n
mr
1H-coupled and “decoupled” 13C spectra
Coupling Constants Splitting due to attached 1H
13C–1H 2J (Hz)
sp3 115-125
sp2 150-170
sp 240-270
1H coupled 13C spectrum
1H decoupled 13C spectrum

a
(d)
b
(d)
c
(t)
d
(t)
e
(d)
f
(d)
g
(t)
i
(q)
j
(q)
h
(q)

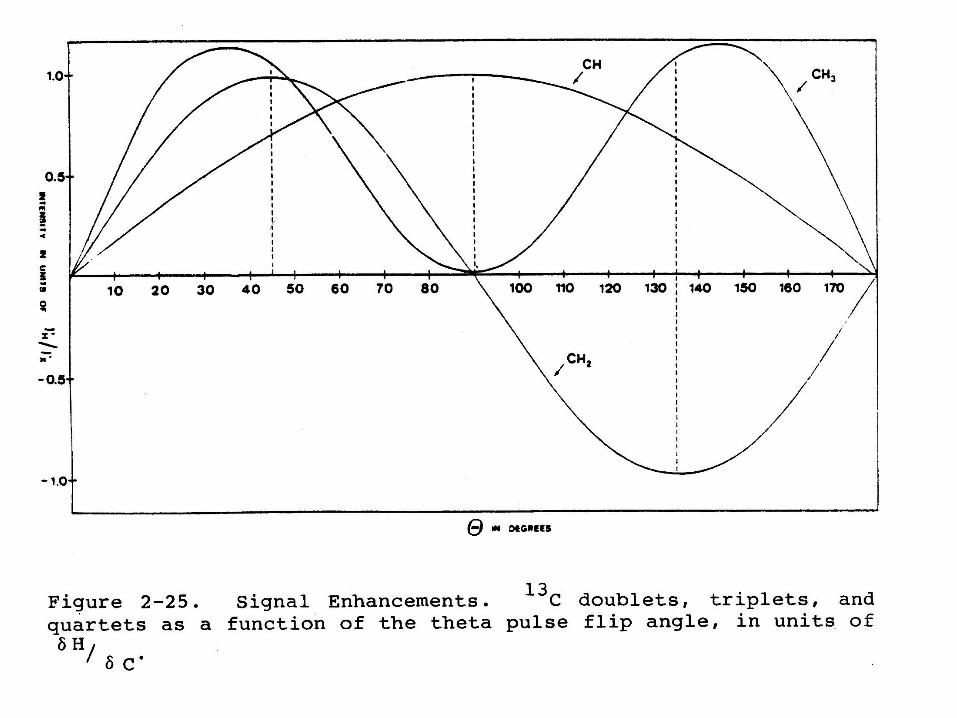
Attached Proton Test (APT)

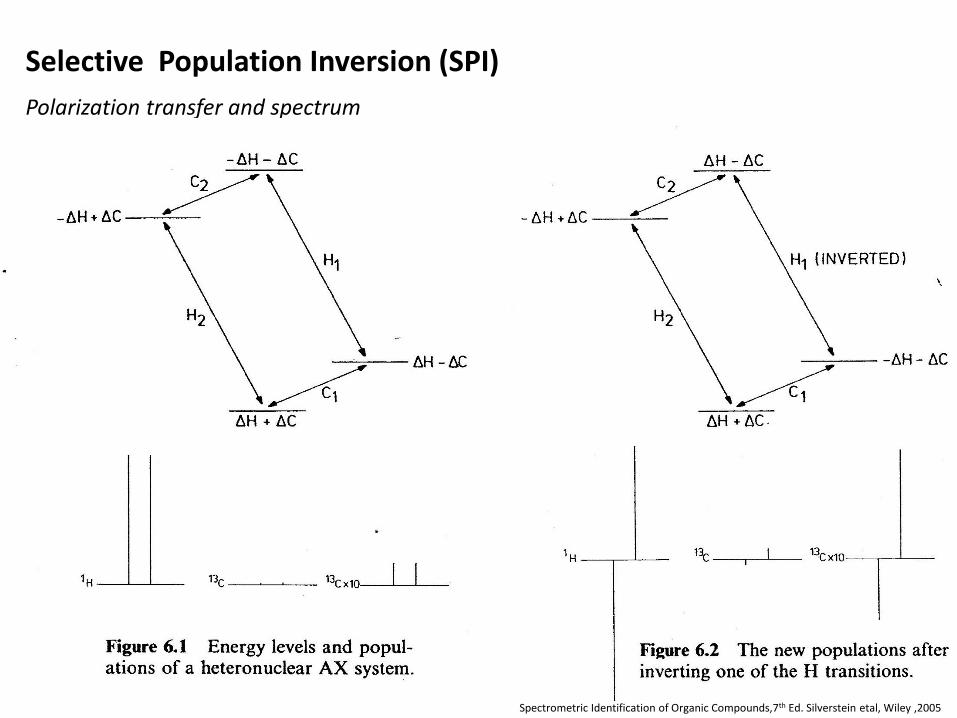
Selective Population Inversion (SPI)
Polarization transfer and spectrum
Spectrometric Identification of Organic Compounds,7th Ed. Silverstein etal, Wiley ,2005
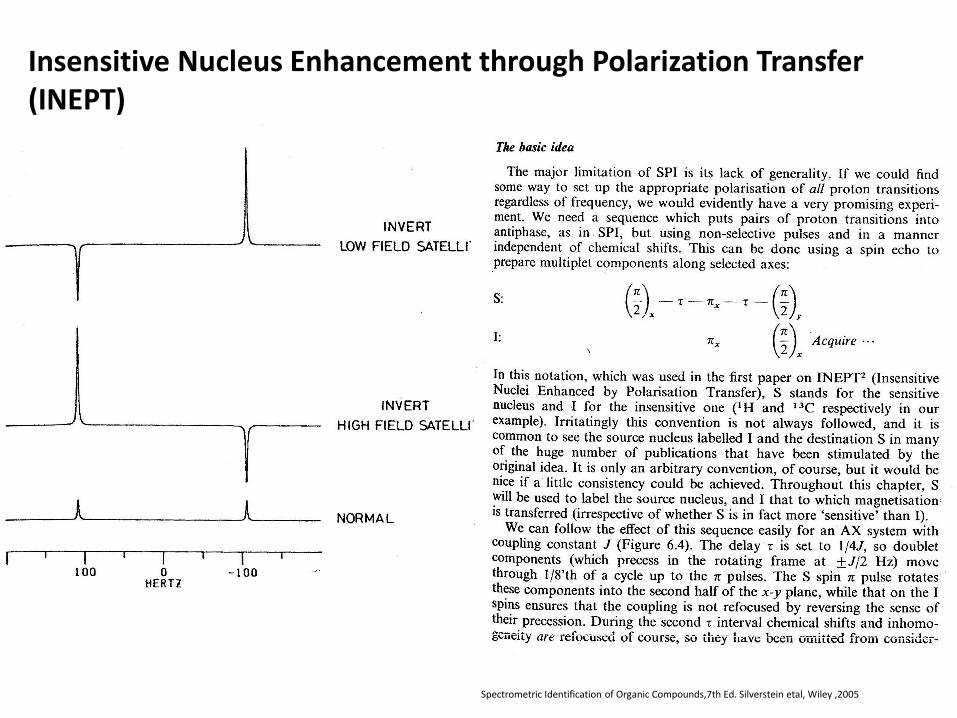
Insensitive Nucleus Enhancement through Polarization Transfer(INEPT)
Spectrometric Identification of Organic Compounds,7th Ed. Silverstein etal, Wiley ,2005
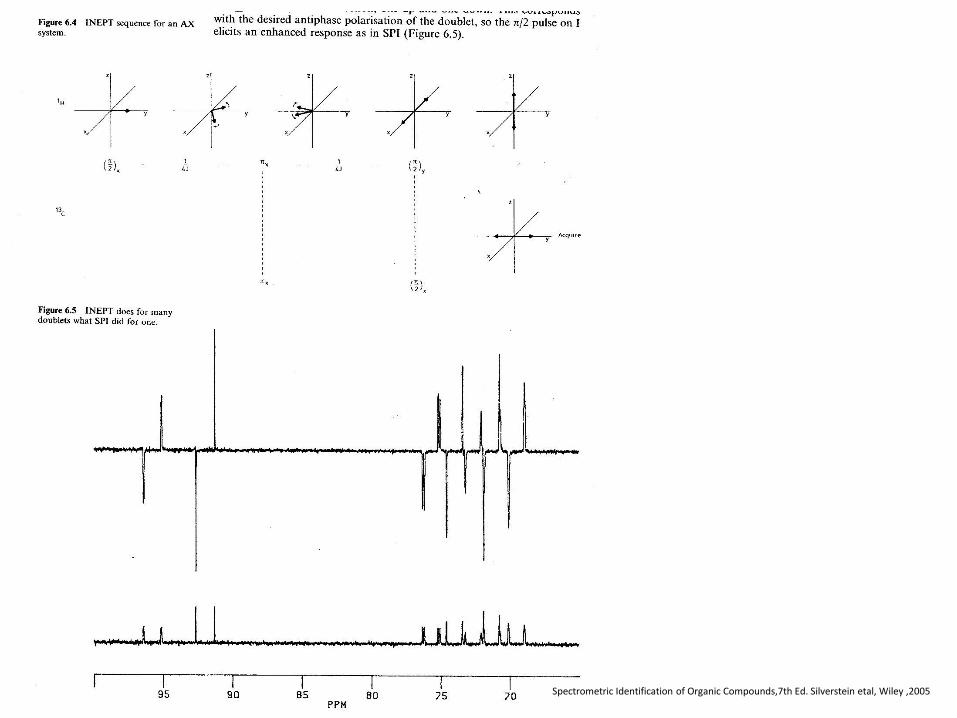
Spectrometric Identification of Organic Compounds,7th Ed. Silverstein etal, Wiley ,2005
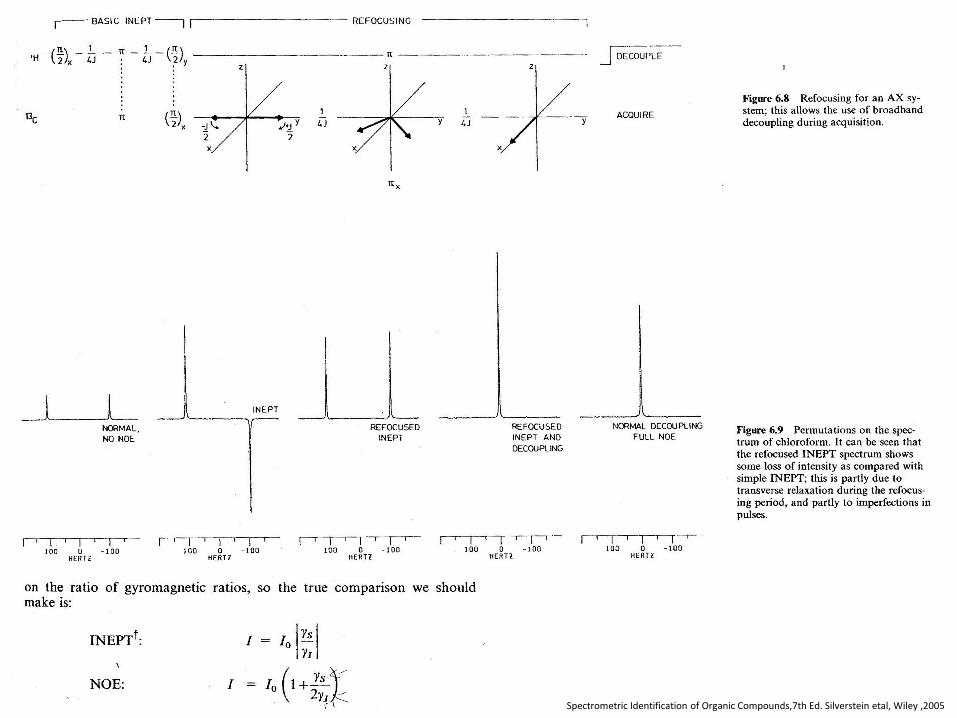
Spectrometric Identification of Organic Compounds,7th Ed. Silverstein etal, Wiley ,2005

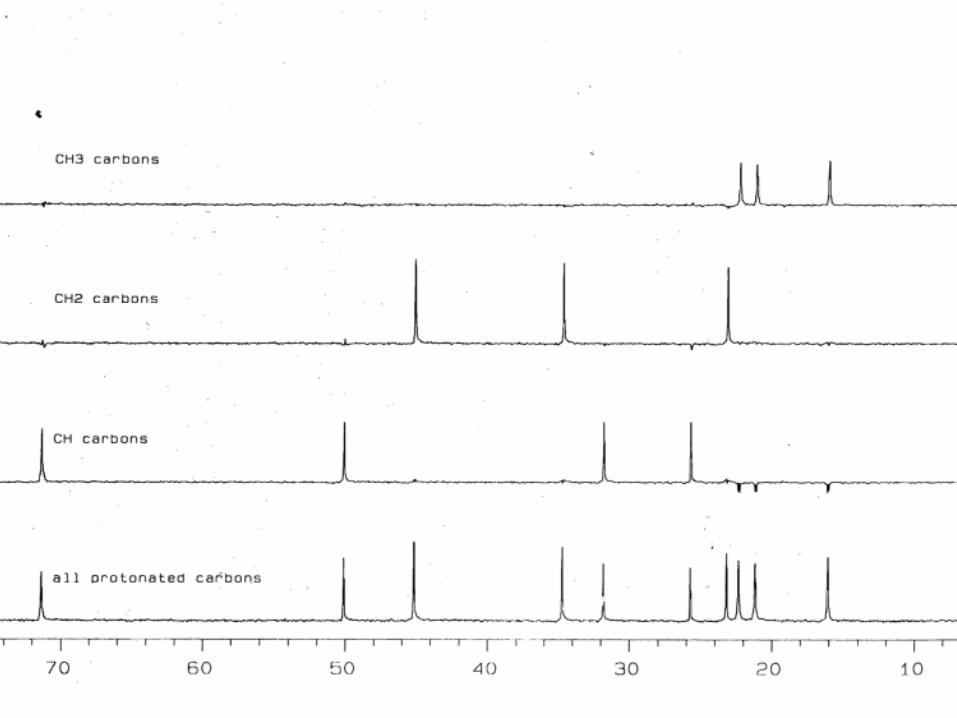
Distortionless Enhancement through Polarization Transfer (DEPT)


(a) number of different types of carbon- Each peak corresponds to a different type of carbon groups
Alkanes revisited - match spectra to structure12 6
9 9
9 9
6 12
1H 13C
A A
B B
C C
D D
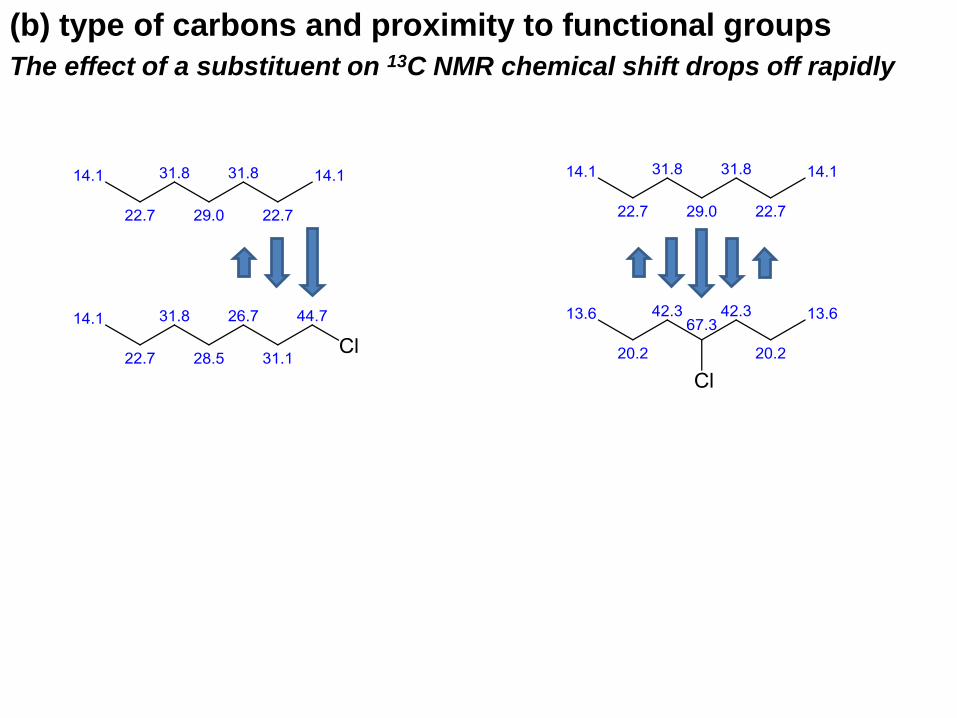
(b) type of carbons and proximity to functional groups
The effect of a substituent on 13C NMR chemical shift drops off rapidly
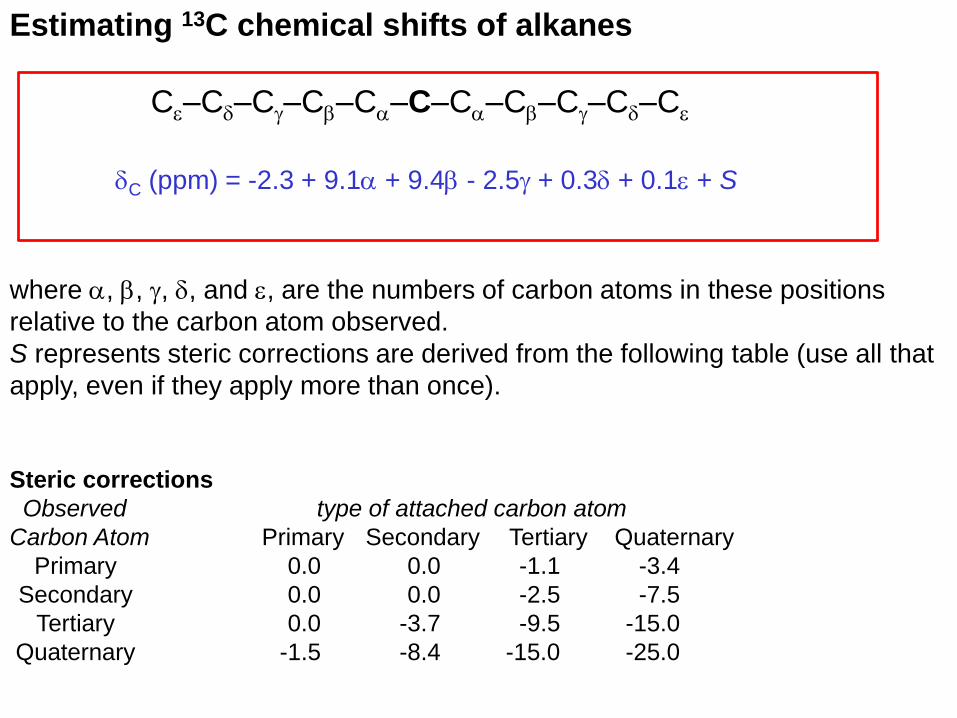
Estimating 13C chemical shifts of alkanes
C–C–Cg–C–C–C–C–C–Cg–C–C
C (ppm) = -2.3 + 9.1 + 9.4 - 2.5g + 0.3 + 0.1 + S
where , , g, , and , are the numbers of carbon atoms in these positions
relative to the carbon atom observed.
S represents steric corrections are derived from the following table (use all that
apply, even if they apply more than once).
Steric corrections
Observed type of attached carbon atom
Carbon Atom Primary Secondary Tertiary Quaternary
Primary 0.0 0.0 -1.1 -3.4
Secondary 0.0 0.0 -2.5 -7.5
Tertiary 0.0 -3.7 -9.5 -15.0
Quaternary -1.5 -8.4 -15.0 -25.0
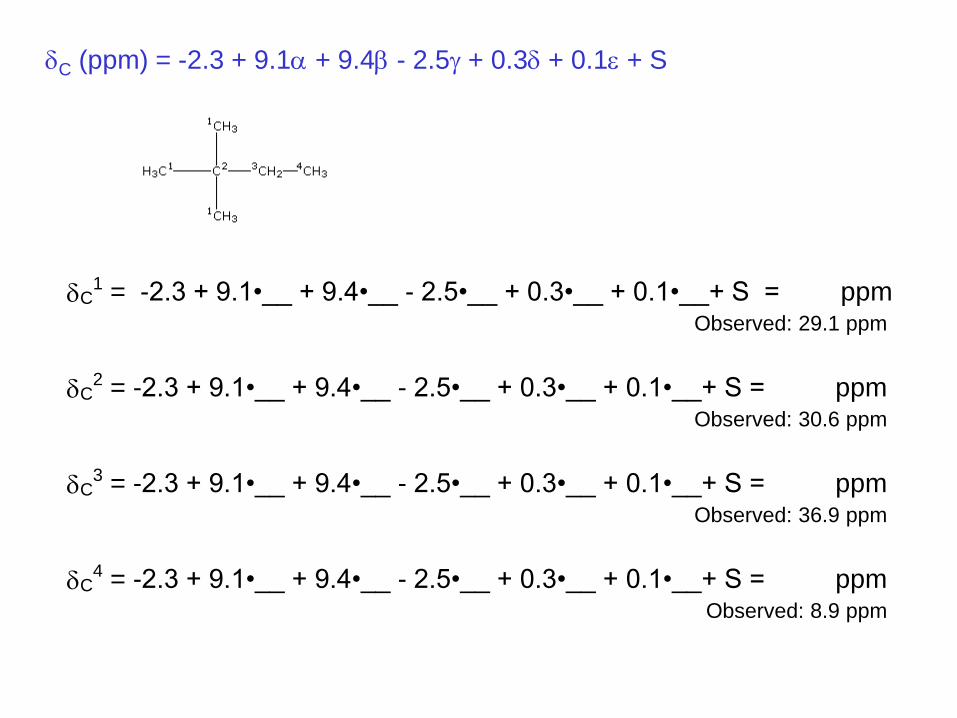
C (ppm) = -2.3 + 9.1 + 9.4 - 2.5g + 0.3 + 0.1 + S
C1 = -2.3 + 9.1•__ + 9.4•__ - 2.5•__ + 0.3•__ + 0.1•__+ S = ppm
Observed: 29.1 ppm
C2 = -2.3 + 9.1•__ + 9.4•__ - 2.5•__ + 0.3•__ + 0.1•__+ S = ppm
Observed: 30.6 ppm
C3 = -2.3 + 9.1•__ + 9.4•__ - 2.5•__ + 0.3•__ + 0.1•__+ S = ppm
Observed: 36.9 ppm
C4 = -2.3 + 9.1•__ + 9.4•__ - 2.5•__ + 0.3•__ + 0.1•__+ S = ppm
Observed: 8.9 ppm

ChemDraw predictions of chemical shift
C 35.9 -2.3 aliphatic
36.4 4 alpha -C
9.4 1 beta -C
-7.6 general corrections
CH2 39.1 -2.3 aliphatic
18.2 2 alpha -C
28.2 3 beta -C
-5.0 general corrections
(CH3)3 29.5 -2.3 aliphatic
9.1 1 alpha -C
28.2 3 beta -C
-2.5 1 gamma -C
-3.0 general corrections
CH3 7.0 -2.3 aliphatic
9.1 1 alpha -C
9.4 1 beta -C
-7.5 3 gamma -C
-1.7 general corrections
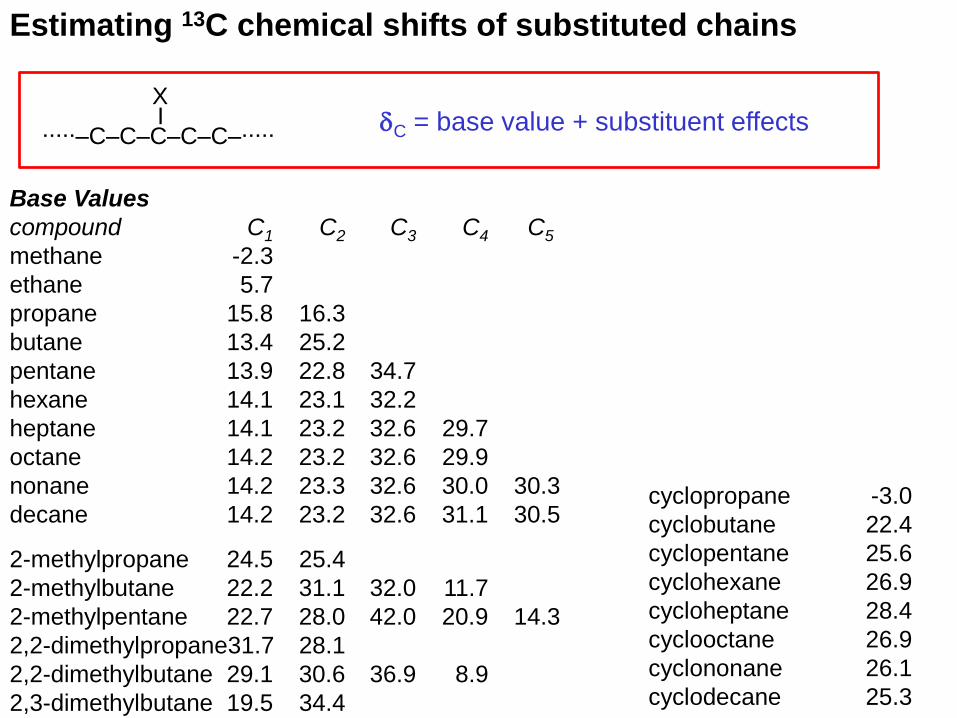
Estimating 13C chemical shifts of substituted chains
C = base value + substituent effects
Base Values
compound C1 C2 C3 C4 C5
methane -2.3
ethane 5.7
propane 15.8 16.3
butane 13.4 25.2
pentane 13.9 22.8 34.7
hexane 14.1 23.1 32.2
heptane 14.1 23.2 32.6 29.7
octane 14.2 23.2 32.6 29.9
nonane 14.2 23.3 32.6 30.0 30.3
decane 14.2 23.2 32.6 31.1 30.5
2-methylpropane 24.5 25.4
2-methylbutane 22.2 31.1 32.0 11.7
2-methylpentane 22.7 28.0 42.0 20.9 14.3
2,2-dimethylpropane31.7 28.1
2,2-dimethylbutane 29.1 30.6 36.9 8.9
2,3-dimethylbutane 19.5 34.4
cyclopropane -3.0
cyclobutane 22.4
cyclopentane 25.6
cyclohexane 26.9
cycloheptane 28.4
cyclooctane 26.9
cyclononane 26.1
cyclodecane 25.3
XI
∙∙∙∙∙–C–C–C–C–C–∙∙∙∙∙
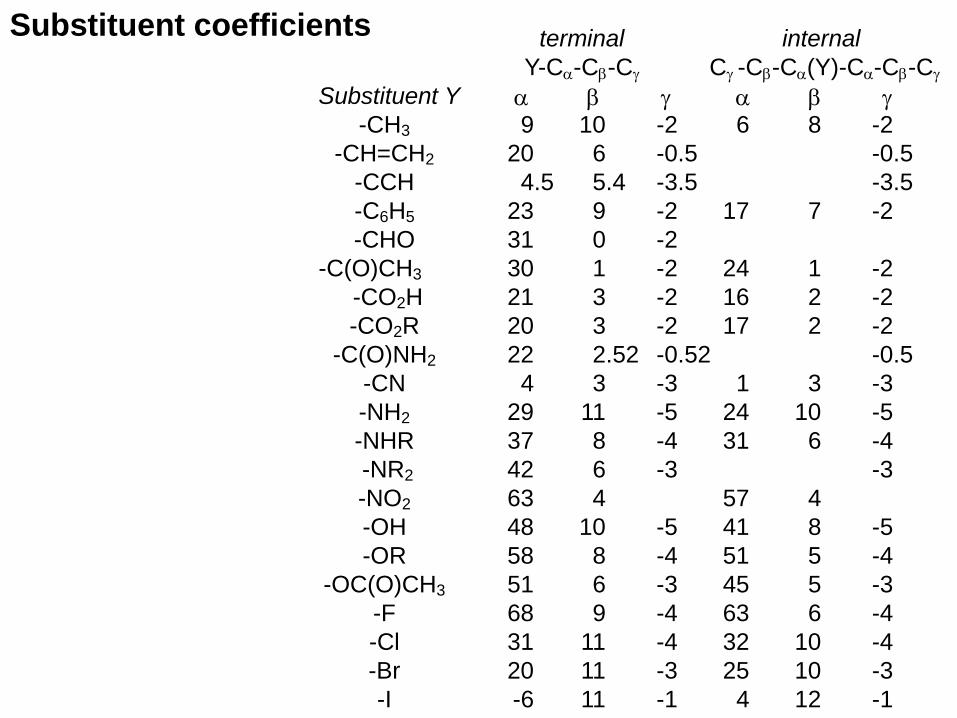
terminal internal
Y-C-C-Cg Cg -C-C(Y)-C-C-Cg
Substituent Y g g
-CH3 9 10 -2 6 8 -2
-CH=CH2 20 6 -0.5 -0.5
-CCH 4.5 5.4 -3.5 -3.5
-C6H5 23 9 -2 17 7 -2
-CHO 31 0 -2
-C(O)CH3 30 1 -2 24 1 -2
-CO2H 21 3 -2 16 2 -2
-CO2R 20 3 -2 17 2 -2
-C(O)NH2 22 2.52 -0.52 -0.5
-CN 4 3 -3 1 3 -3
-NH2 29 11 -5 24 10 -5
-NHR 37 8 -4 31 6 -4
-NR2 42 6 -3 -3
-NO2 63 4 57 4
-OH 48 10 -5 41 8 -5
-OR 58 8 -4 51 5 -4
-OC(O)CH3 51 6 -3 45 5 -3
-F 68 9 -4 63 6 -4
-Cl 31 11 -4 32 10 -4
-Br 20 11 -3 25 10 -3
-I -6 11 -1 4 12 -1
Substituent coefficients
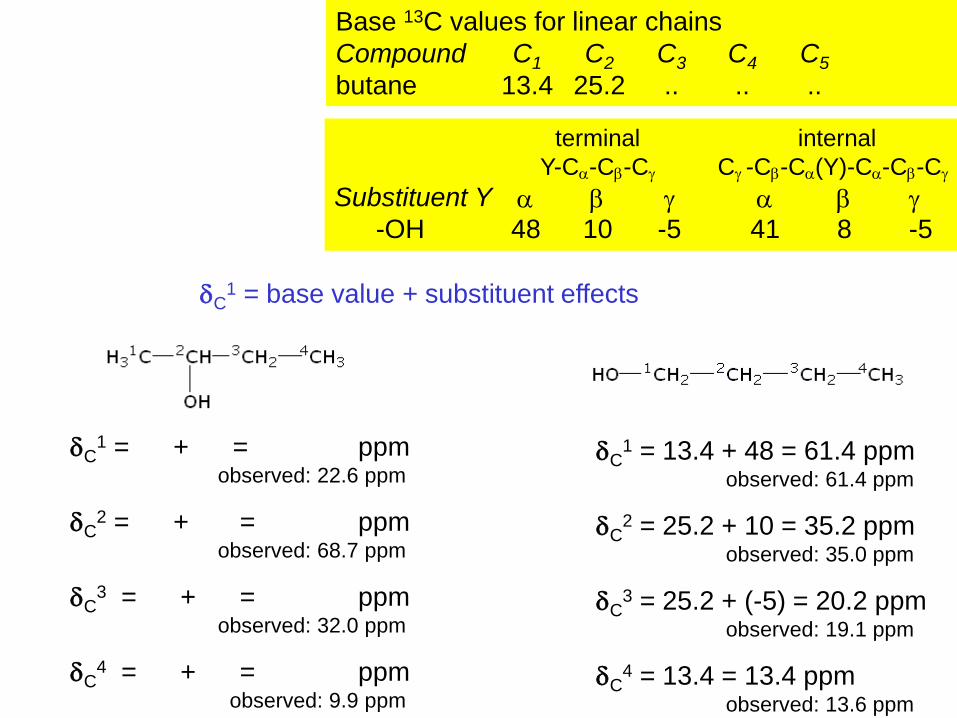
terminal internal
Y-C-C-Cg Cg -C-C(Y)-C-C-Cg
Substituent Y g g
-OH 48 10 -5 41 8 -5
C1 = + = ppm
observed: 22.6 ppm
C2 = + = ppm
observed: 68.7 ppm
C3 = + = ppm
observed: 32.0 ppm
C4 = + = ppm
observed: 9.9 ppm
Base 13C values for linear chains
Compound C1 C2 C3 C4 C5
butane 13.4 25.2 .. .. ..
C1 = 13.4 + 48 = 61.4 ppm
observed: 61.4 ppm
C2 = 25.2 + 10 = 35.2 ppm
observed: 35.0 ppm
C3 = 25.2 + (-5) = 20.2 ppm
observed: 19.1 ppm
C4 = 13.4 = 13.4 ppm
observed: 13.6 ppm
C1 = base value + substituent effects

ChemDraw predictions of chemical shift
CH2 62.5 -2.3 aliphatic
9.1 1 alpha -C
49.0 1 alpha -O
9.4 1 beta -C
-2.5 1 gamma -C
-0.2 general corrections
CH2 34.4 -2.3 aliphatic
18.2 2 alpha -C
9.4 1 beta -C
10.1 1 beta -O
-1.0 general corrections
CH2 18.7 -2.3 aliphatic
18.2 2 alpha -C
9.4 1 beta -C
-6.2 1 gamma -O
-0.4 general corrections
CH3 14.1 -2.3 aliphatic
9.1 1 alpha -C
9.4 1 beta -C
-2.5 1 gamma -C
0.3 1 delta -O
0.1 general corrections

Estimating 13C chemical shifts of carbons in alkenes
Cg–C–C–C1=C2–C'–C'–Cg '
C1 (ppm) = 123.3 + [ 10.6 + 7.2 - 1.5g] - [ 7.9' + 1.8' - 1.5g'] + S
where: , , g and ', ', g' are the number of carbon atoms at these positions
relative to the carbon atom observed
Steric corrections
C and C ' are trans (E-configuration) 0
C and C' are cis (Z-configuration) -1.1
Two alkyl substituents at C1 (i.e., two C) -4.8
Two alkyl substituents at C2 (i.e., two C') 2.5
Two or more alkyl substituents at C) 2.3

C1 = 123.3 + [10.6(2)] - [7.9(1)] + [(-4.8) + (-1.1)] = 130.7 ppm
Observed: 131.4 ppm
C2 = 123.3 + [10.6(1)] - [7.9(2)] + [(2.5) + (-1.1)] = 119.5 ppm
Observed: 118.7 ppm
C1 = 123.3 + [0] - [7.9(1) + 1.8(2) - 1.5(1)] + [0] = 113.3 ppm
Observed: 112.9 ppm
C2 = 123.3 + [10.6(1) + 7.2(2) - 1.5(1)] - [0] + [0] = 146.8 ppm
Observed: 144.9 ppm
Steric correctionsC and C ' are trans (E-configuration) 0
C and C' are cis (Z-configuration) -1.1
Two alkyl substituents at C1 (i.e., two C) -4.8
Two alkyl substituents at C2 (i.e., two C') 2.5
Two or more alkyl substituents at C) 2.3
C1 (ppm) = 123.3 + [ 10.6 + 7.2 - 1.5g] - [ 7.9' + 1.8' - 1.5g'] + S

C1 = 128.5 + + = ppm
observed: 121.0 ppm
C2 = 128.5 + + = ppm
observed: 161.4 ppm
C3 = 128.5 + + = ppm
observed:117.4 ppm
C4 = 128.5 + 1.6 + 5.8 = ppm
observed: 136.6 ppm
C5 = 128.5 + (-7.3) + 0.6 = ppm
observed: 119.6 ppm
C6 = 128.5 + 1.2 + 1.6 = ppm
observed: 133.6 ppm
Substituent (R) dipso dortho dmeta dpara
-CO2H 2.9 1.3 0.4 4.3
-OH 26.6 -12.7 1.6 -7.3
Estimating 13C chemical shifts of carbons of substituted
benzenes
C = 128.5 + di

ChemDraw predictions of chemical shift
C 113.1 128.5 1-benzene
-12.8 1 -O
2.1 1 -C(=O)-O
-4.7 general corrections
C 162.2 128.5 1-benzene
28.8 1 -O
1.6 1 -C(=O)-O
3.3 general corrections
CH 117.6 128.5 1-benzene
-12.8 1 -O
-0.1 1 -C(=O)-O
2.0 general corrections
CH 135.3 128.5 1-benzene
1.4 1 -O
5.2 1 -C(=O)-O
0.2 general corrections
CH 121.2 128.5 1-benzene
-7.4 1 -O
-0.1 1 -C(=O)-O
0.2 general corrections
CH 131.7 128.5 1-benzene
1.4 1 -O
1.6 1 -C(=O)-O
0.2 general corrections
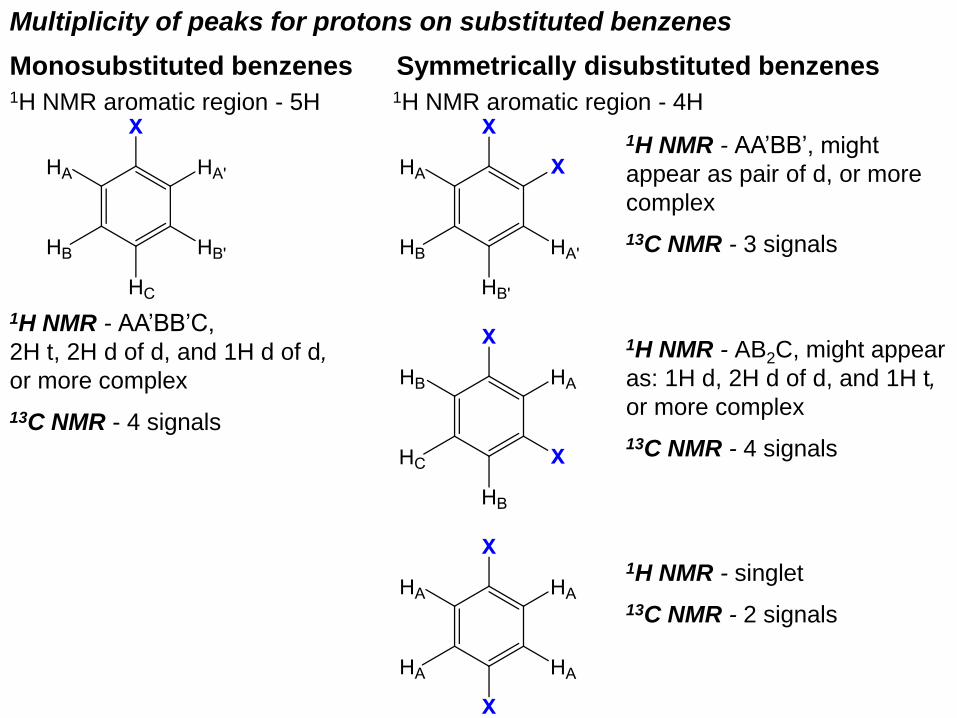
Monosubstituted benzenes Symmetrically disubstituted benzenes1H NMR aromatic region - 5H 1H NMR aromatic region - 4H
Multiplicity of peaks for protons on substituted benzenes
1H NMR - AA’BB’, might
appear as pair of d, or more
complex
13C NMR - 3 signals
1H NMR - AB2C, might appear
as: 1H d, 2H d of d, and 1H t,
or more complex
13C NMR - 4 signals
1H NMR - singlet
13C NMR - 2 signals
1H NMR - AA’BB’C,
2H t, 2H d of d, and 1H d of d,
or more complex
13C NMR - 4 signals
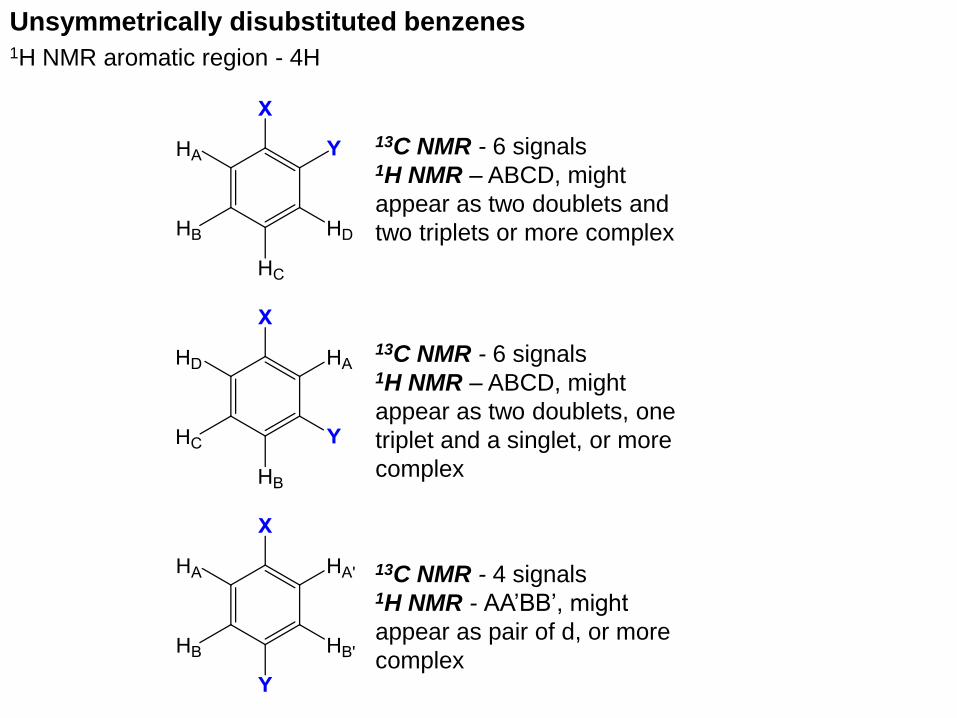
Unsymmetrically disubstituted benzenes1H NMR aromatic region - 4H
13C NMR - 6 signals1H NMR – ABCD, might
appear as two doublets and
two triplets or more complex
13C NMR - 6 signals1H NMR – ABCD, might
appear as two doublets, one
triplet and a singlet, or more
complex
13C NMR - 4 signals1H NMR - AA’BB’, might
appear as pair of d, or more
complex
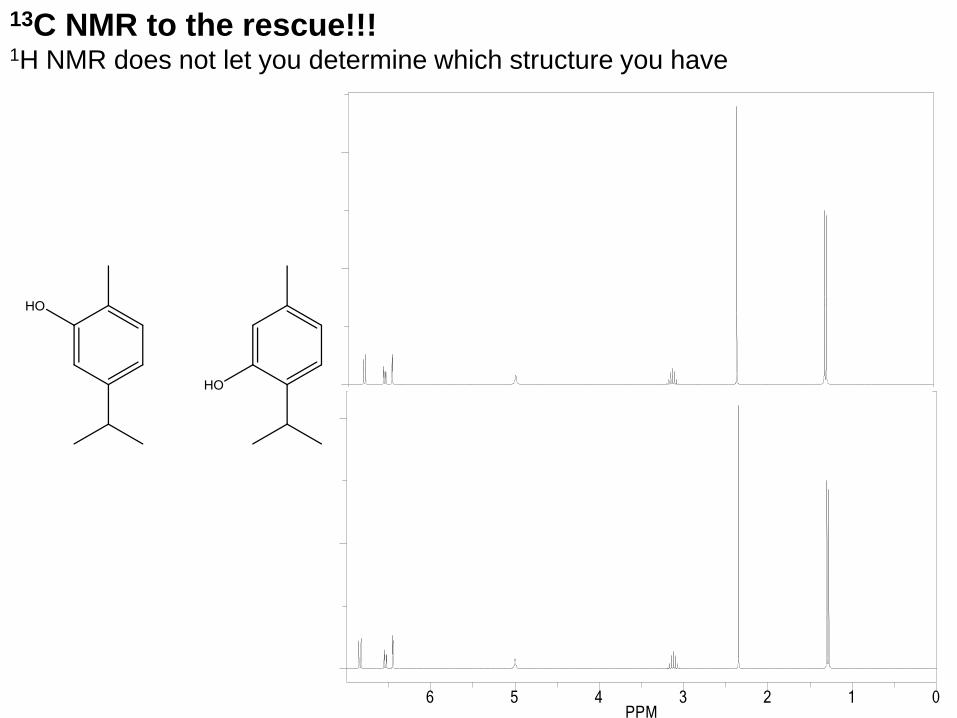
0123456PPM
0123456PPM
13C NMR to the rescue!!! 1H NMR does not let you determine which structure you have
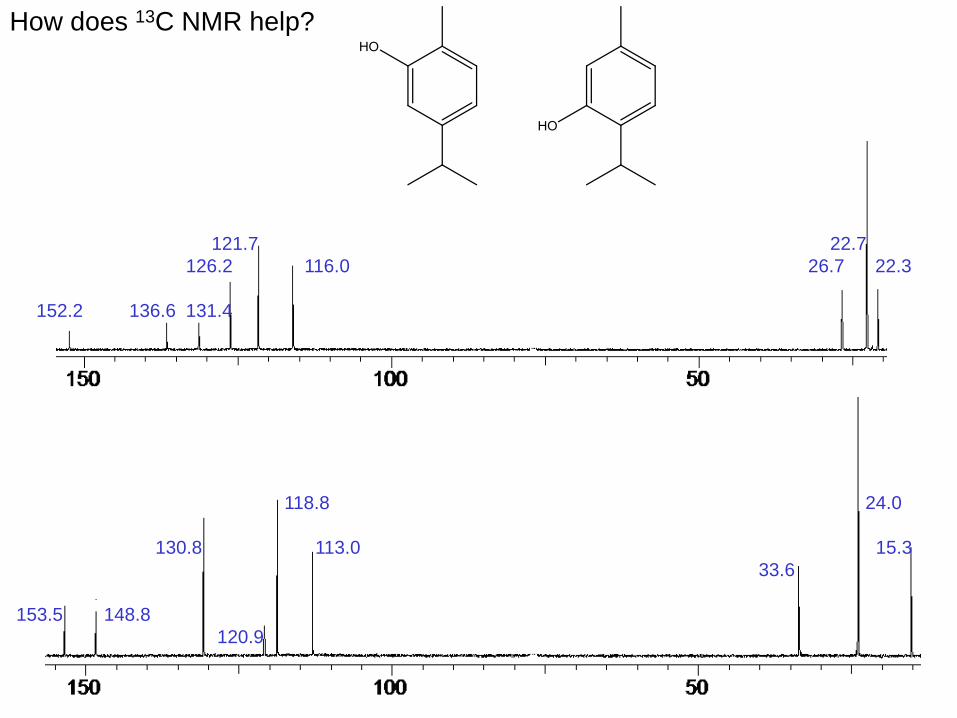
121.7 22.7
126.2 116.0 26.7 22.3
152.2 136.6 131.4
118.8 24.0
130.8 113.0 15.3
33.6
153.5 148.8
120.9
How does 13C NMR help?
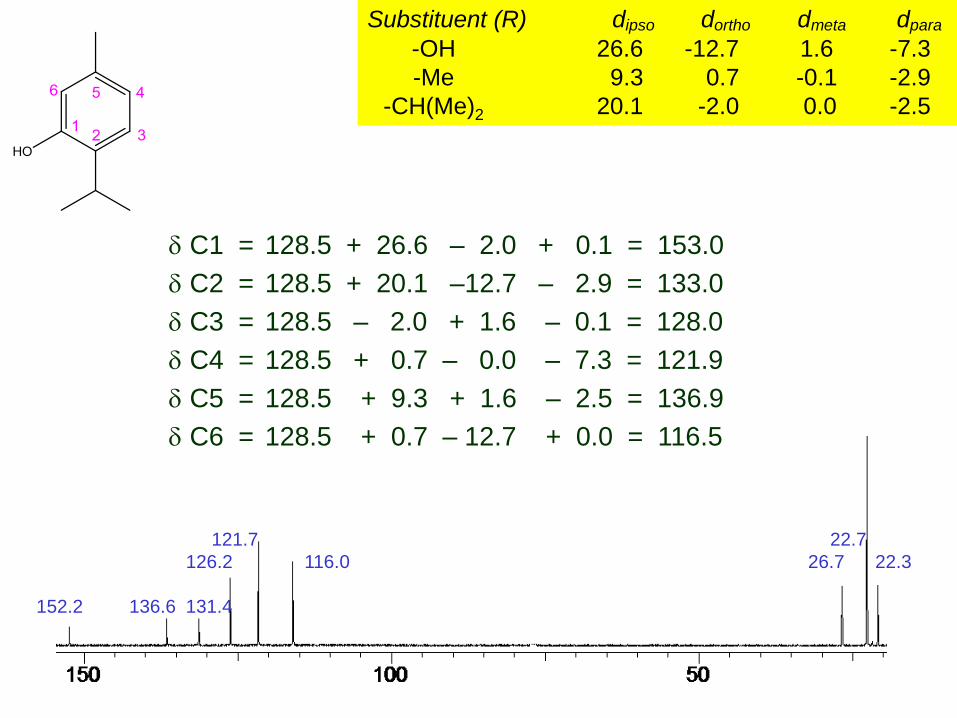
Substituent (R) dipso dortho dmeta dpara
-OH 26.6 -12.7 1.6 -7.3
-Me 9.3 0.7 -0.1 -2.9
-CH(Me)2 20.1 -2.0 0.0 -2.5
121.7 22.7
126.2 116.0 26.7 22.3
152.2 136.6 131.4
C1 = 128.5 + 26.6 – 2.0 + 0.1 = 153.0
C2 = 128.5 + 20.1 –12.7 – 2.9 = 133.0
C3 = 128.5 – 2.0 + 1.6 – 0.1 = 128.0
C4 = 128.5 + 0.7 – 0.0 – 7.3 = 121.9
C5 = 128.5 + 9.3 + 1.6 – 2.5 = 136.9
C6 = 128.5 + 0.7 – 12.7 + 0.0 = 116.5
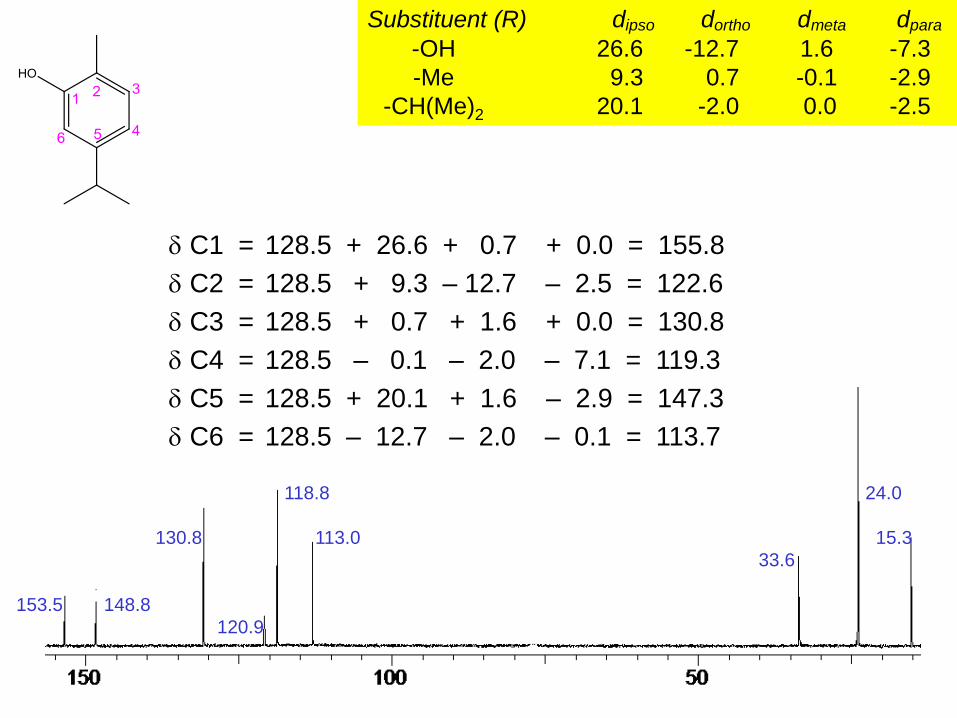
Substituent (R) dipso dortho dmeta dpara
-OH 26.6 -12.7 1.6 -7.3
-Me 9.3 0.7 -0.1 -2.9
-CH(Me)2 20.1 -2.0 0.0 -2.5
118.8 24.0
130.8 113.0 15.3
33.6
153.5 148.8
120.9
C1 = 128.5 + 26.6 + 0.7 + 0.0 = 155.8
C2 = 128.5 + 9.3 – 12.7 – 2.5 = 122.6
C3 = 128.5 + 0.7 + 1.6 + 0.0 = 130.8
C4 = 128.5 – 0.1 – 2.0 – 7.1 = 119.3
C5 = 128.5 + 20.1 + 1.6 – 2.9 = 147.3
C6 = 128.5 – 12.7 – 2.0 – 0.1 = 113.7

ADDITIONAL PEAKS
Signals from the presence of the other compounds
Standards added to reference chemical shift
Tetramethylsilane: (CH3)4Si
Sodium 3-(trimethylsilyl)-1-propanesulfonate (CH3)3SiCH2CH2CO2– Na+
Residual 13C of deuterated solvents
Chemical shift of 13C in deuterated solvents
CDCl3 77 ppm - 3 lines !?
Remember: peaks are not integrated. In general, H-substituted 13C give taller
peaks
SampleTypically 10-50 mg sample in 0.75-1.00 mL solvent in a 5 mm diameter NMR
tube. Too little, or too much, sample »» poor spectra

Reporting 1H decoupled 13C NMR Spectra in Papers and
Progress Reports
13C NMR (CDCl3, 100 MHz): 123.2 (###), 121.1 (###)….
Solvent: e.g., CDCl3, C6D6, acetone-d6, THF-d8, CD3CN, 1,4-dichlorobenzene-d4,
CD2Cl2. Frequency used in the experiment (and temperature if not r.t. or 25 °C).
Remember, a “400 MHz” spectrometer refers to the frequency for 1H NMR, which
corresponds to 100 MHz for 13C NMR.
List all peaks – provide to one decimal place. If the number of peaks is less than
the number of types of carbon atoms, because of coincidence chemical shifts, can
you assign any of the peaks to more than one type of carbon atom?
Provide a succinct, but accurate, assignment of a peak to a particular type of
hydrogen in the molecule. This can be difficult, and might not always be possible.
A B C
A
B
C
WORK PROBLEMS!!Pavia: Chapters 3, 4 and 5 (not questions dealing with 19F and 31P)
Do as many of the problems on these sites (except those with COSY spectra)
www.nd.edu/~smithgrp/structure/workbook.html
www.chem.ucla.edu/~webspectra/index.html
Related Documents