i NTIA Response to Notice of Inquiry, Establishing a Spectrum Monitoring Pilot Program Establishing a Spectrum Monitoring Pilot Program Submitted by Anoop Gupta Paula Boyd Staci Pies Development Manager Director Director Technology Policy Group Government and Regulatory Affairs Government and Regulatory Affairs [email protected] [email protected] [email protected] +1 (425) 705-3613 +1 (202) 263-5946 +1 (202) 263-5947 One Microsoft Way, Redmond, WA 98052 901 K Street, NW, Washington, DC 20001 901 K Street, NW, Washington, DC 20001 NTIA Response to Notice of Inquiry

Welcome message from author
This document is posted to help you gain knowledge. Please leave a comment to let me know what you think about it! Share it to your friends and learn new things together.
Transcript

i
NTIA Response to Notice of Inquiry, Establishing a Spectrum Monitoring Pilot Program
Establishing a Spectrum Monitoring Pilot Program
Submitted by
Anoop Gupta Paula Boyd Staci Pies
Development Manager Director Director
Technology Policy Group Government and Regulatory
Affairs
Government and Regulatory
Affairs
[email protected] [email protected] [email protected]
+1 (425) 705-3613 +1 (202) 263-5946 +1 (202) 263-5947
One Microsoft Way,
Redmond, WA 98052
901 K Street, NW,
Washington, DC 20001
901 K Street, NW,
Washington, DC 20001
NTIA Response to Notice
of Inquiry NTIA Response to Notice of
Inquiry

ii
NTIA Response to Notice of Inquiry, Establishing a Spectrum Monitoring Pilot Program
Table of Contents
1 Executive Summary ................................................................................................................. 3
2 Overall Response ..................................................................................................................... 4
3 Microsoft Spectrum Observatory Design ........................................................................ 6
4 Monitoring Unit Infrastructure Requirements ............................................................. 13
5 Specific Questions Response ............................................................................................. 14
6 Response Criteria ................................................................................................................... 20

Page 3
NTIA Response to Notice of Inquiry, Establishing a Spectrum Monitoring Pilot Program
1 Executive Summary
Microsoft has been running a Spectrum Observatory Program with the purpose of providing an
intuitive presentation of the usage of the wireless spectrum. The project is sponsored by
Microsoft's Technical Policy Group and the data is made freely available to the public. Data is
recorded through measurement units and is stored and processed for visualization through the
Windows Azure cloud.
Microsoft Spectrum Observatory collects and presents frequency spectrum usage data in a way
that interested parties can have an open discussion about current and future uses of allocated
frequency spectrum. The data collected on with this program has been used to inform research
and discussion in instances such as the following:
Characterizing Spectrum Goodness for Dynamic Spectrum Access
http://research.microsoft.com/apps/pubs/default.aspx?id=174795
MS Spectrum Observatory: Seeing Things NTIA Doesn't Want to See
http://www.marcus-spectrum.com/Blog/files/MSO913.html
Microsoft believes that the data gathered on spectrum utilization will help inform policy
discussions and decisions implicating various forms of spectrum management – ranging from
reallocation of spectrum for exclusive use licensing or unlicensed access to dynamic access to
allocated but unassigned spectrum.
To support this effort by collecting spectrum usage data, measurement units have been installed
by Microsoft in various locations around the world. Microsoft philosophy in developing this
program has been to keep costs low and to keep the solution flexible and open to others. We
are of the opinion that any solution that the NTIA develops should also have these philosophies
and should be collaborative in the approach that is taken. Using this experience, the following
document is a response to the NITA’s inquiry on spectrum monitoring.

Page 4
NTIA Response to Notice of Inquiry, Establishing a Spectrum Monitoring Pilot Program
2 Overall Response
The NTIA’s stated goals are very well aligned with the current goals of Microsoft’s Spectrum
Observatory.
The system would be designed and intended to interoperate with other third-party
measurement units and spectrum databases to enable academic and industry researchers,
commercial and government spectrum managers, and independent database managers to
implement and deploy their own data collection and dissemination systems.
Make available to interested parties criteria, requirements, parameters, designs, interfaces,
software, data sets, and other information generated at each phase of the project.
Prototype monitoring unit would be designed to run continuously at remote sites with
system control and data uploads performed over the Internet.
Standardized data sets would be accumulated and analyzed within the unit and uploaded
to a centralized database.
Based on the fully developed and tested prototype unit and subject to available funds, ten
or more identical spectrum measurement units would be built and deployed in up to ten
major metropolitan areas throughout the United States.
Once deployed, they would continuously monitor the spectrum and collect data in
predetermined frequency bands and upload them to the database.
Our experience in this space has led us to believe that it is a logistical and financial challenge for
a single party to install all new measurement units and continue to support the ongoing
operations of those units. Additionally, Microsoft sees benefits in making this a collaborative
effort involving parties in different locations, presenting different perspectives on data
collection, and potentially arriving at different conclusions about spectrum allocation and use
based on the data collected. These are benefits that can be derived from an open and
collaborative approach. As a result, Microsoft has started to look for partners within various
communities to aid in the installation and support of new measurement units. The installation
and support efforts over a calendar year are usually small, but are necessary in the case of
hardware or infrastructure failures. For normal operation, all of the monitoring and storage of
collected data to the cloud is completely automated. The benefits to partners are the following:
Free storage of measurement unit data in the cloud.
Additional data processing on the spectrum observatory data.
Different ways to visualize the spectrum data that has been measured and processed
such as power density, utilization, and spectrogram, with the potential for future
expansion and customization by partners.

Page 5
NTIA Response to Notice of Inquiry, Establishing a Spectrum Monitoring Pilot Program
Access to data from other measurement units
Free updates to the software and website
Microsoft’s architecture allows partners to integrate other radio types, and future additions will
also allow partners to add other types of analysis and visualizations. Additionally, we would like
to make this a tool that researchers, regulators, and other parties around the world can use by
allowing those that are participating to have finer grained control of the spectrum sensing that
is occurring at various sites, and then have the data available to them on the web. Eventually,
the vision is that the entire Spectrum Observatory solution would become a project that is
owned and managed by the community of partners that are established, with Microsoft being a
single voice in that partnership.

Page 6
NTIA Response to Notice of Inquiry, Establishing a Spectrum Monitoring Pilot Program
3 Microsoft Spectrum Observatory Design
The following diagrams illustrate the architectural approach that Microsoft took in developing
our Spectrum Observatory solution, which can be found here: http://spectrum-
observatory.cloudapp.net/

Page 7
NTIA Response to Notice of Inquiry, Establishing a Spectrum Monitoring Pilot Program
Home Page

Page 8
NTIA Response to Notice of Inquiry, Establishing a Spectrum Monitoring Pilot Program
Measurement Unit Details

Page 9
NTIA Response to Notice of Inquiry, Establishing a Spectrum Monitoring Pilot Program
Charts

Page 10
NTIA Response to Notice of Inquiry, Establishing a Spectrum Monitoring Pilot Program
Spectrogram

Page 11
NTIA Response to Notice of Inquiry, Establishing a Spectrum Monitoring Pilot Program
Occupancy
Power Density

Page 12
NTIA Response to Notice of Inquiry, Establishing a Spectrum Monitoring Pilot Program
System Design Details
Processing Workers
Web Services/Portal Site
UserImport Service & Application
1
3
12
Blob Storage
...
Azure
SQL Azure
...
Rule Engine
Input Queue
Output Queue
4
6
5
7
8
910
14 13
LiveId Service
2
11
Station Admin
...
(Not Yet Implemented)
Page 13
NTIA Response to Notice of Inquiry, Establishing a Spectrum Monitoring Pilot Program
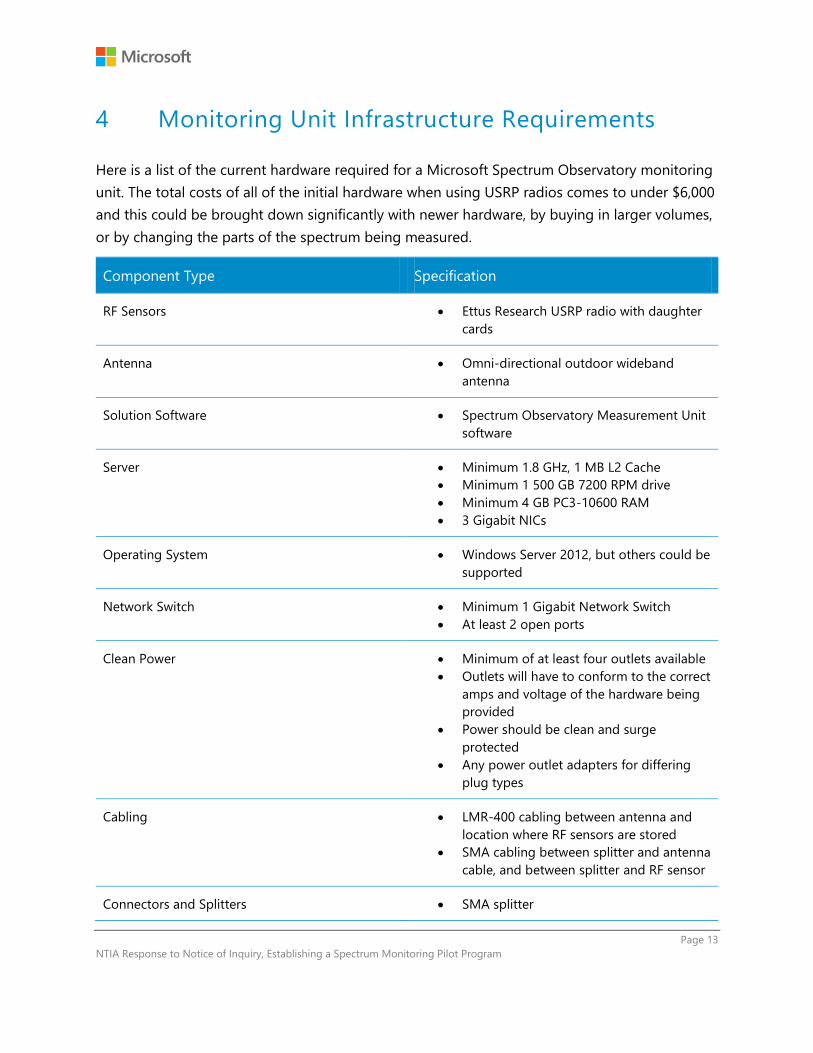
4 Monitoring Unit Infrastructure Requirements
Here is a list of the current hardware required for a Microsoft Spectrum Observatory monitoring
unit. The total costs of all of the initial hardware when using USRP radios comes to under $6,000
and this could be brought down significantly with newer hardware, by buying in larger volumes,
or by changing the parts of the spectrum being measured.
Component Type Specification
RF Sensors Ettus Research USRP radio with daughter
cards
Antenna Omni-directional outdoor wideband
antenna
Solution Software Spectrum Observatory Measurement Unit
software
Server Minimum 1.8 GHz, 1 MB L2 Cache
Minimum 1 500 GB 7200 RPM drive
Minimum 4 GB PC3-10600 RAM
3 Gigabit NICs
Operating System Windows Server 2012, but others could be
supported
Network Switch Minimum 1 Gigabit Network Switch
At least 2 open ports
Clean Power Minimum of at least four outlets available
Outlets will have to conform to the correct
amps and voltage of the hardware being
provided
Power should be clean and surge
protected
Any power outlet adapters for differing
plug types
Cabling LMR-400 cabling between antenna and
location where RF sensors are stored
SMA cabling between splitter and antenna
cable, and between splitter and RF sensor
Connectors and Splitters SMA splitter

Page 14
NTIA Response to Notice of Inquiry, Establishing a Spectrum Monitoring Pilot Program
Connector/Convertor between type N and
SMA
Internet Connection The connection must be able to support
0.22 megabits upload speed per second.
5 Specific Questions Response
5.1.1 How should a measurement system be designed to measure a variety
of emissions, including weak or intermittent signals, airborne platforms,
and radar systems, while keeping incremental costs in check?
Microsoft believes that any spectrum monitoring solution should be flexible so that it can be
applied to the largest number of areas.
We believe the design of the system should be relatively agnostic to the hardware and the
specific monitoring techniques that are doing the actual sensing. Microsoft accomplishes this by
splitting the overall data gather process into four different tiers.
Raw data capture by the RF sensor
Feature extraction
Upload to storage
Processing and bucketing
Since the raw data capture is the key to being able to measure different types of signals and we
are flexible with the types of hardware and the algorithm that is used to collect the raw data, we
are able to measure even weak signals. Intermittent signals are handled by revisiting each
spectrum band frequently to make sure that any transmission greater than a few seconds is
captured. Airborne and radar systems are often point to point which is a little more challenging,
but these can be handled by within our solution by deploying many sensors so that the
likelihood of capturing these point to point transmissions is increased. Additionally, by using
hardware to measure these specific signal types only when needed we are able to keep overall
costs low. In total the average Microsoft Spectrum Observatory measurement units’ hardware
costs under $6000 to monitor between 30 MHz and 4400 MHz and this number could be
brought down significantly if hardware was purchased in greater volumes or if the required area
of spectrum coverage is altered.

Page 15
NTIA Response to Notice of Inquiry, Establishing a Spectrum Monitoring Pilot Program
5.1.2 What types of measurement/monitoring techniques should be used
for the different types of radio services?
It is Microsoft’s belief that any monitoring system should allow for various different techniques
to be used so that improvements can be made over time and to take advantage of various
techniques for different uses. Microsoft has currently developed two different monitoring
techniques, but the solution that we have is open to other techniques to be integrated into the
solution over time. This is possible because the design that we created is flexible and splits the
monitoring/data capture from the rest of the solution. As a result, if the data capture technique
is changed, as long as the format of the data remains the same, the rest of the solution is able to
operate without additional changes. Additionally, the system is cognizant of different radio
services by integrating with systems like the FCC dashboard or its regional equivalent.
Depending on the use case the RBW and other parameters can be changes.
5.1.3 What frequency bands should initially be measured during the pilot
phase of the program?
The Microsoft Spectrum Observatory currently measures from 30 MHz to 6000 MHz because it is
a range that covers the frequency ranges commonly used today, to provide consumers with
wireless broadband connectivity – for all the commonly used fixed and mobile wireless air
interfaces. The solution itself also support other hardware types. Since we wanted to remain
hardware agnostic, we found that allowing for flexibility in the frequency bands that are
measured was the correct route for our purposes. By doing this, we are able to accommodate
more measurement units with specialized hardware for different frequency bands.
5.1.4 How should measurement and monitoring parameters (e.g.,
resolution and video bandwidths, sampling rate, dwell time, detector
selection, antennas, pre-selector filtering, dynamic range) be specified?
Again, the key goals that Microsoft had around developing a Spectrum Observatory was
flexibility. As a result, all of the parameters are configurable. Currently, these are set up on the
local measurement unit’s monitoring system, but to allow for even easier changes and to
centralize the management of observatory measurement units, Microsoft plans on storing these
settings in the cloud, which the measurement units can then access.

Page 16
NTIA Response to Notice of Inquiry, Establishing a Spectrum Monitoring Pilot Program
5.1.5 Which geographic locations within major metropolitan areas or other
communities throughout the country would provide the greatest value
for the pilot?
Microsoft has no comments on specific areas or communities that should be considered. We
would suggest that the selection process should include the following criteria:
Locations with high usage of available spectrum such as the top metropolitan areas in
the United States should be included.
Locations should be included within range of current federal and others users which are
currently under consideration for spectrum sharing and reallocation – such as users of
1.75-1.85 GHz and 3.5-3.65 GHz, as well as some of the 5 GHz users.
5.1.6 How should individual measurement units be deployed in each
community?
Microsoft has no comments on the specific deployment of the measurement units in each
community.
5.1.7 How could the long- or short-term placement of multiple fixed units
within the same general geographic area improve the accuracy and
reliability of the data collected in each community and at what
incremental cost?
There are potential advantages of placing multiple units in the same general geographic area. By
doing this, the data between two different observatories could be compared to verify results.
Also, additional conclusions could be reached by combining the data from two or more units.
The incremental costs should be no higher than the total costs of the hardware for the unit,
installation of the unit, costs for connectivity to backend services, and costs for processing and
storing the data. Some benefits of multiple sensors was shown in a recent ACM MobiCom paper,
and the associated blog.
5.1.8 How could mobile or portable units be utilized to supplement data
collected at fixed sites within a community and at what incremental
cost?
Mobile or portable units could be used to supplement data by temporarily acting as a secondary
site in a community. If it is considered a secondary site, the benefits are the same as a fixed
Page 17
NTIA Response to Notice of Inquiry, Establishing a Spectrum Monitoring Pilot Program
secondary site for the period of time that it is in the community. The incremental costs should
be no higher than the total costs of the hardware for the mobile or portable unit, transport of
the unit, costs for connectivity to backend services, and costs for processing and storing the
data.
5.1.9 How long should measurement data be collected to provide
statistically relevant results, particularly for intermittent operations, at
each geographic location?
The period of time required to collect statistically relevant results highly depends on the use of
the data that is collected. Generally speaking, longer periods of time are better than shorter, and
Microsoft has chosen to store one year’s worth of data in our Spectrum Observatory with
flexibility in the design of the solution to allow us to increase or decrease the period of data
stored. This could also be set up per monitoring unit, so that for specific locations data is stored
for much longer or much shorter periods of time. The data beyond these time frames is
automatically deleted to reduce maintenance costs. Additionally, the raw data in Microsoft’s
Spectrum Observatory can be downloaded by end users so that they can maintain a copy for
longer periods of time outside the system if there is a need.
5.1.10 How should the measurement system design take into account
variations in population densities, buildings, terrain and other factors
within or surrounding selected measurement locations (i.e., in urban,
suburban, and rural parts of a metropolitan area)?
Microsoft has chosen to be somewhat agnostic to the particulars of the area surrounding the
measurement units during the collection of data. The exact location of the data collection
should be recorded as well as the specifics of the equipment performing the data capture, but
analysis of the data and the effects of items like population densities, buildings, terrain and
other factors is something that we have left to the analysis of the data after it has been
captured.
5.1.11 What steps can be taken to eliminate or minimize the
possibility of ‘‘hidden nodes’’ when conducting measurements?
Microsoft uses a few techniques to minimize the presence of hidden nodes. The measurement
units use a low resolution bandwidth to detect low signals, or the ones that are not received by
the sensor due to obstructions. Furthermore, to reduce the presence of obstructions, some

Page 18
NTIA Response to Notice of Inquiry, Establishing a Spectrum Monitoring Pilot Program
measurement unit antennas are placed on buildings that do not have obstructions nearby.
Density of measurement units will also help reduce the presence of hidden terminals.
5.1.12 What kind of spectrum utilization and occupancy information
(e.g., precise received field strength levels, time-of day occupancy
percentages, times that signals are measured above specified
thresholds) would be most useful to spectrum stakeholders?
Microsoft believes that any monitoring solution should simply allow for collection and
presentation of data to users. Currently the Microsoft Spectrum Observatory has the following
chart types:
Spectrogram in a specific date range and at a specific location
Occupancy over various time scales and at a specific location
Power Density in a specific date range and at a specific location
Microsoft also provides the raw data behind these charts, so that any calculations that are
provided within our user interface can be independently verified. Over time, Microsoft plans on
giving end users the ability to add their own chart types by providing interfaces for them to
implement.
5.1.13 What detection thresholds should be used to measure and
characterize the usage patterns of incumbent systems?
Microsoft suggests looking at exiting research that has already been conducted in this space to
determine these thresholds, the following is an example:
Characterizing Spectrum Goodness for Dynamic Spectrum Access
http://research.microsoft.com/apps/pubs/default.aspx?id=174795
5.1.14 What data and information would be useful in evaluating
potential sharing compatibility with wireless broadband devices?
While the following are useful, there may be other data and information that is useful in
evaluating potential sharing compatibility with wireless broadband devices. It is important that
the raw monitoring data is made available so that this other information can be determined and
analyzed.
Occupancy percentage – This is the overall percentage of time that a specific area of the
spectrum is occupied.

Page 19
NTIA Response to Notice of Inquiry, Establishing a Spectrum Monitoring Pilot Program
Occupancy pattern – If a specific pattern for occupancy can be determined, then the
times when that area of the spectrum is not likely to be used is potentially a good
candidate for sharing. For example, if a specific area of the spectrum is only used for the
first 10 minutes of the hour, then the other 50 minutes could potentially be used for
sharing.
5.1.15 How can the gathered data and analysis better inform spectrum
policy decisions, enhance research and development of advanced
wireless technologies and services?
With more accurate and more up-to-date data about spectrum usage, researchers, analysts,
regulators, and industry can have better informed discussions about how to use spectrum more
efficiently – whether as a result of reallocation for exclusive use or through various forms of
spectrum sharing (or both). Also, all of these parties can also study the results of any policy
decisions to ensure that the intended results actually occurred, which can then inform and
improve future policy decisions in this space.
5.1.16 What data formats and evaluation tools should be employed?
Microsoft suggests that the data formats should be discussed and agreed upon by the industry.
By having a common data format, various monitoring solutions could be made to be
interoperable. This format should be extensible to allow new data to be added such as new
feature vectors. Additionally, the data format should be efficient in terms of the size so that a
minimum amount of storage is required to store the data, and a minimum amount of bandwidth
is required to transmit it.
Interoperability also aids in allowing new evaluation tools to be developed over time and at a
quicker pace since users can use the platform that suits them best, while having access to the
most data.
5.1.17 How can the large amounts of measurement data be effectively
managed, stored, and distributed?
Microsoft takes the approach of centralizing the measurement data in the cloud. Data storage is
relatively cheap in the cloud. The link below is a simple way of calculating monthly storage costs
in Windows Azure:
http://www.windowsazure.com/en-us/pricing/calculator/?scenario=data-management

Page 20
NTIA Response to Notice of Inquiry, Establishing a Spectrum Monitoring Pilot Program
Each measurement unit within Microsoft’s Spectrum Observatory is responsible for uploading
both the raw data as well as feature vectors like the min, max and average power within an area
of the spectrum for a specific time period. As a result, the workload is distributed, but all of the
data is available in one central place in the end. By storing the data in one central location,
Microsoft is able to provide access to either visualizations of the data or the raw data itself to
users of Microsoft’s Spectrum Observatory website.
5.1.18 What steps can be taken to ensure that sensitive or classified
information will not be revealed to unauthorized parties?
Security and access to the raw data are items that could be integrated into the solution that is
created. Microsoft Spectrum Observatory project allows users specific functionality based on
their current role which is determined by standard authentication and authorization techniques.
If they are viewing the data as a guest, they get only the basic functionality available on the site,
but if they sign into the site, then new functionality is revealed. Similar approaches could be
taken with any sensitive or classified information.
6 Response Criteria
Evaluate whether the proposed collection of information is necessary for the proper
performance of the functions of the agency, including whether the information will have
practical utility;
Evaluate the accuracy of the agency’s estimate of the burden of the proposed collection
of information, including the validity of the methodology and assumptions used;
Enhance the quality, utility, and clarity of the information to be collected; and
Minimize the burden of the collection of information on those who are expected to
respond, including the use of appropriate automated, electronic, mechanical, or other
technological collection techniques or other forms of information technology (e.g.,
permitting electronic submissions of responses).
Related Documents