U.S. DEPARTMENT OF COMMERCE • National Telecommunications and Information Administration report series NTIA Report TR-12-486 Case Study: Investigation of Interference into 5 GHz Weather Radars from Unlicensed National Information Infrastructure Devices, Part III John E. Carroll Geoffrey A. Sanders Frank H. Sanders Robert L. Sole

Welcome message from author
This document is posted to help you gain knowledge. Please leave a comment to let me know what you think about it! Share it to your friends and learn new things together.
Transcript
U.S. DEPARTMENT OF COMMERCE • National Telecommunications and Information Administration
report series
NTIA Report TR-12-486
Case Study: Investigation of Interference into 5 GHz Weather Radars from Unlicensed National Information
Infrastructure Devices, Part III
John E. Carroll Geoffrey A. Sanders
Frank H. Sanders Robert L. Sole

U.S. DEPARTMENT OF COMMERCE
June 2012
NTIA Report TR-12-486
Case Study: Investigation of Interference into 5 GHz Weather Radars from Unlicensed National Information
Infrastructure Devices, Part III
John E. Carroll Geoffrey A. Sanders
Frank H. Sanders Robert L. Sole

iii
DISCLAIMER
This report identifies certain commercial equipment and materials to specify adequately the technical aspects of the reported results. In no case does such identification imply recommendation or endorsement by the National Telecommunications and Information Administration (NTIA), nor does it imply that the material or equipment identified is the best available for this purpose.
NTIA acquired the interference data presented in this report from a legacy FAA Terminal Doppler Weather Radar (TDWR) receiver called the Sigmet RVP8. This is the receiver used at TDWR field stations as of the release of this report. A newer receiver, the Sigmet RVP9, is being developed by the FAA. NTIA plans an additional joint interference study with the FAA on this new receiver.
This report does not propose any interference thresholds for TDWR receiver protection; the FAA is responsible for determining interference criteria for its systems. Interference levels that are analyzed in this report are presented solely for the purpose of demonstrating the interference analysis process.

iv
v
CONTENTS
Figures............................................................................................................................................ vi
Tables ............................................................................................................................................ vii
Abbreviations ............................................................................................................................... viii
Executive Summary ....................................................................................................................... ix
1 Introduction ...................................................................................................................................1
2 Dynamic Frequency Selection Overview .....................................................................................4
3 Development of New FCC DFS Certification Waveforms ..........................................................5
4 Measurement and Analysis of U-NII Device Emission Spectra ...................................................6 4.1 Measurement Technique .......................................................................................................6 4.2 Measurement Results ............................................................................................................7
5 EMC Analysis for Interference Coupling from U-NII Devices to TDWRS ..............................10 5.1 Calculation of Mainbeam Coupling Distances and Coupling Factors between
U-NII Devices and TDWRS ................................................................................................10 5.2 Calculation of Coupling Factors into TDWR Antenna Sidelobes When U-NII
Devices Are Deployed at Lower Heights ............................................................................12 5.3 Description and Analysis of the TDWR Emission Spectrum .............................................13 5.4 EMC Coupling Analyses .....................................................................................................15
5.4.1 Mainbeam-to-Mainbeam Coupling ...........................................................................15 5.4.2 U-NII Mainbeam-to-TDWR Sidelobe Coupling ......................................................17
6 Results and Conclusions from the EMC Analysis ......................................................................19
7 References ...................................................................................................................................21
Appendix A . Calculated Frequency-Dependent Rejection (FDR) Curves and Coordination Distances between TDWR Receivers and U-NII Transmitters ...............................22
A.1 Calculation of Frequency-Distance Separation Curves to Protect TDWR Receiver .........22 A.2 Calculation of Frequency Dependent Rejection (FDR) .....................................................23
A.2.1 Frequency-Distance Curves for Frame-Based U-NII Systems ................................26 A.2.2 Frequency-Distance Curves for 802.11-Based U-NII Systems ...............................28
vi
FIGURES
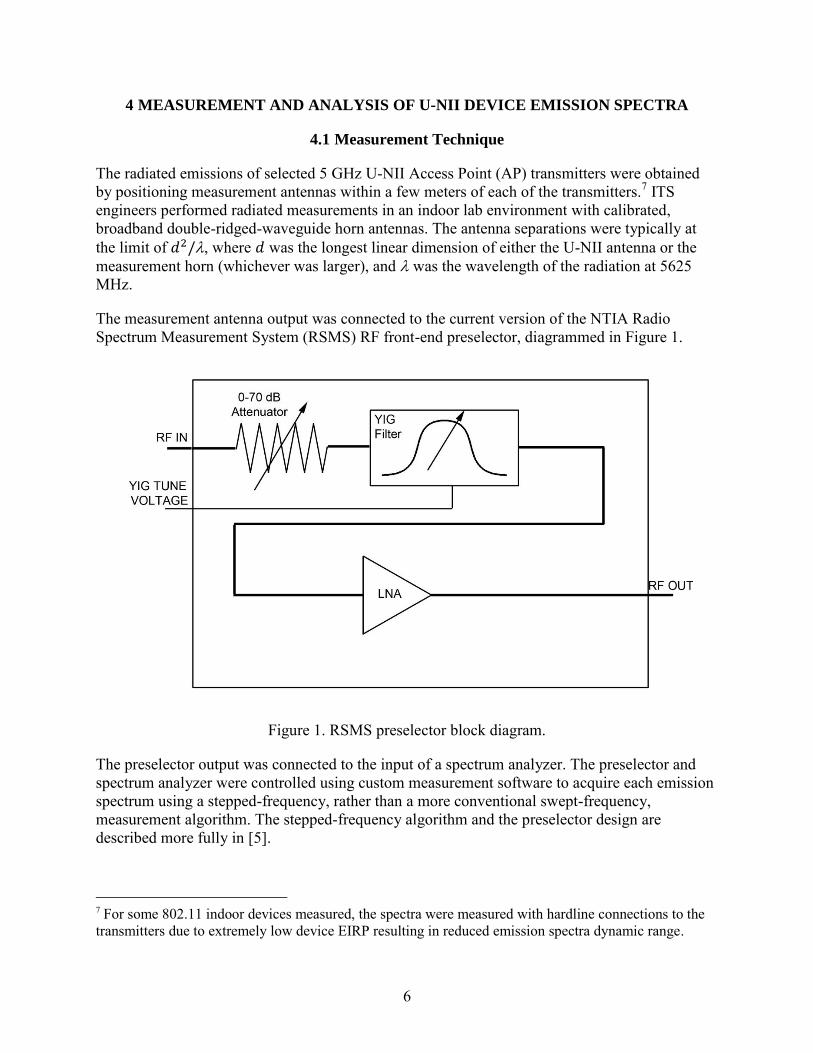
Figure 1. RSMS preselector block diagram. ....................................................................................6
Figure 2. Comparative radiated emission spectra for ten different 5 GHz U-NII transmitters, in a 1 MHz measurement bandwidth, referenced to peak fundamental power (dBc). ................................................................................................8
Figure 3. The central 200 MHz (100 MHz on each side of the fundamental frequency) of the U-NII emission spectra of Figure 1. ....................................................9
Figure 4. Mainbeam coupling geometry scenario for a TDWR and a U-NII. ...............................11
Figure 5. Power received from the TDWR at a U-NII location in Oklahoma City, OK throughout one complete monitor (or normal volume) scan. ..................................12
Figure 6. TDWR radiated emission spectrum in a 1 MHz bandwidth...........................................13
Figure 7. TDWR emission spectrum within 40 MHz of the fundamental frequency. .......................................................................................................................14
Figure A-1. TDWR measured IF frequency selectivity. ................................................................24
Figure A-2. TDWR IF response (normalized). ..............................................................................24
Figure A-3. FDR for TDWR IF selectivity for frame-based U-NII transmitters. ..........................25
Figure A-4. FDR for TDWR IF selectivity for 802.11-based U-NII transmitters. ........................25
Figure A-5. Distances needed to protect TDWR from frame-based U-NII transmitters (H = 304 meters, TDWR mainbeam coupling). .........................................26
Figure A-6. Distances needed to protect TDWR from frame-based U-NII transmitters (H = 152 meters, TDWR mainbeam coupling). .........................................27
Figure A-7. Distances needed to protect TDWR from frame-based U-NII transmitters (H = 30 meters, TDWR sidelobe coupling). ..............................................27
Figure A-8. Distances needed to protect TDWR receivers from 802.11-based U-NII transmitters (H = 304 meters, main-beam coupling). ..........................................28
Figure A-9. Distances needed to protect TDWR from 802.11-based U-NII transmitters (H = 152 meters, main-beam coupling). .....................................................29
Figure A-10. Distances needed to protect TDWR from 802.11-based U-NII transmitters (H = 30 meters, sidelobe coupling). ...........................................................29
vii
TABLES
Table 1. Newly developed Bin 1 Waveform certification test protocol for DFS certification. ......................................................................................................................5
Table 2. Parameters for mainbeam-to-mainbeam U-NII-to-TDWR EMC analysis. .....................15
Table 3. System parameters for U-NII mainbeam-to-TDWR sidelobe example EMC analysis. ................................................................................................................17
Table 4. Limits on U-NII EIRP on a TDWR frequency required to preclude interference to TDWR receivers at given separation distance. ......................................19
Table 5. Requirements for U-NII unwanted spectrum emission suppression at given separation distances from TDWRs for some example U-NII device EIRP levels. ........................................................................................................20
Table A-1. ITM Settings. ...............................................................................................................23
Table A-2. TDWR Parameters. ......................................................................................................23
Table A-3. U-NII emission spectra for FDR calculations for frame-based devices. .....................31
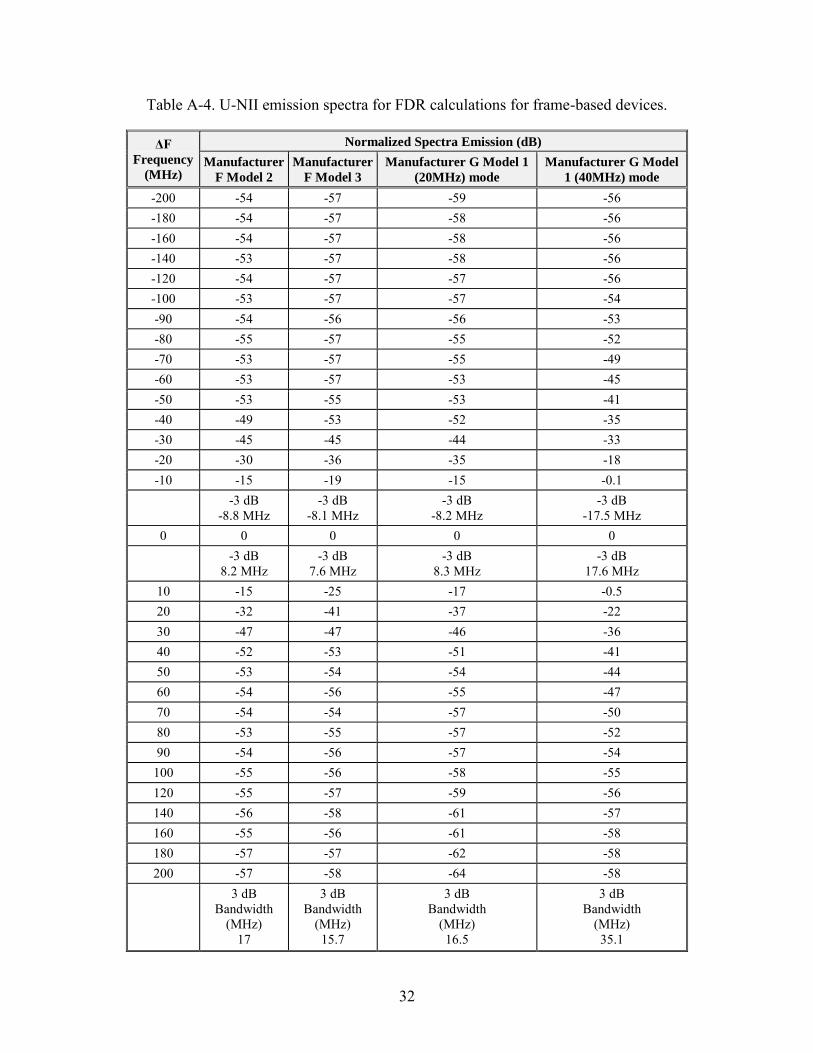
Table A-4. U-NII emission spectra for FDR calculations for frame-based devices. .....................32
viii
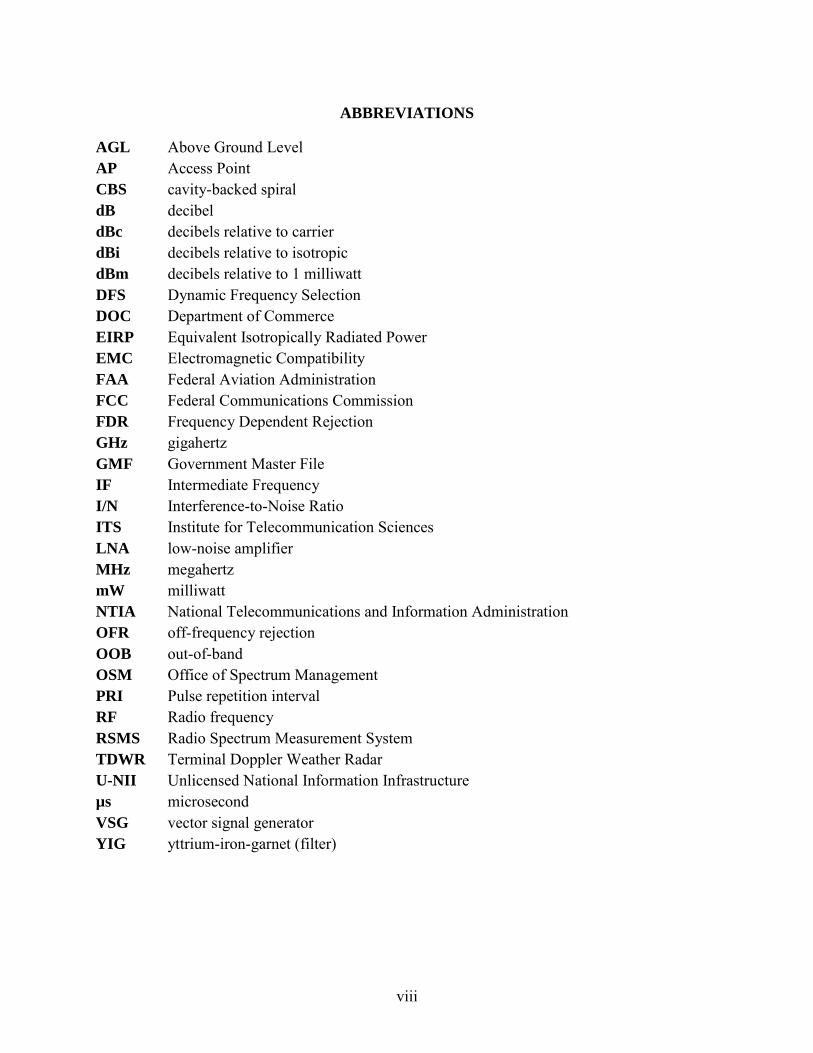
ABBREVIATIONS
AGL Above Ground Level AP Access Point CBS cavity-backed spiral dB decibel dBc decibels relative to carrier dBi decibels relative to isotropic dBm decibels relative to 1 milliwatt DFS Dynamic Frequency Selection DOC Department of Commerce EIRP Equivalent Isotropically Radiated Power EMC Electromagnetic Compatibility FAA Federal Aviation Administration FCC Federal Communications Commission FDR Frequency Dependent Rejection GHz gigahertz GMF Government Master File IF Intermediate Frequency I/N Interference-to-Noise Ratio ITS Institute for Telecommunication Sciences LNA low-noise amplifier MHz megahertz mW milliwatt NTIA National Telecommunications and Information Administration OFR off-frequency rejection OOB out-of-band OSM Office of Spectrum Management PRI Pulse repetition interval RF Radio frequency RSMS Radio Spectrum Measurement System TDWR Terminal Doppler Weather Radar U-NII Unlicensed National Information Infrastructure µs microsecond VSG vector signal generator YIG yttrium-iron-garnet (filter)
ix
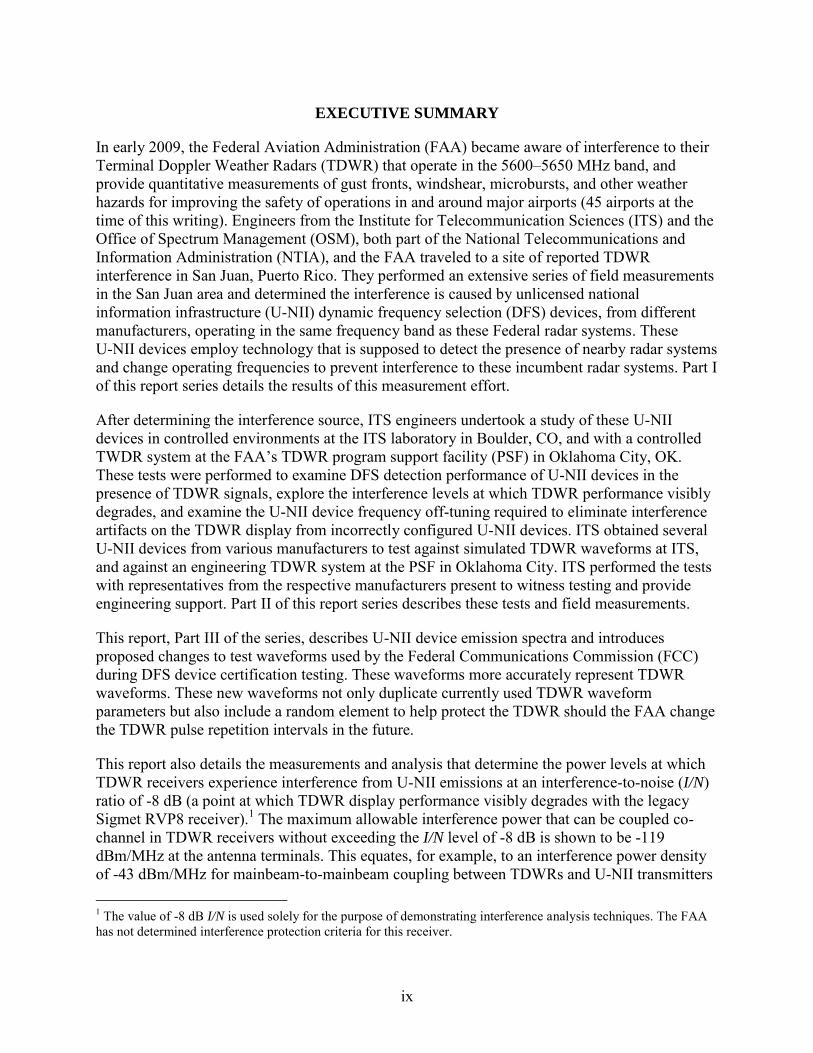
EXECUTIVE SUMMARY
In early 2009, the Federal Aviation Administration (FAA) became aware of interference to their Terminal Doppler Weather Radars (TDWR) that operate in the 5600–5650 MHz band, and provide quantitative measurements of gust fronts, windshear, microbursts, and other weather hazards for improving the safety of operations in and around major airports (45 airports at the time of this writing). Engineers from the Institute for Telecommunication Sciences (ITS) and the Office of Spectrum Management (OSM), both part of the National Telecommunications and Information Administration (NTIA), and the FAA traveled to a site of reported TDWR interference in San Juan, Puerto Rico. They performed an extensive series of field measurements in the San Juan area and determined the interference is caused by unlicensed national information infrastructure (U-NII) dynamic frequency selection (DFS) devices, from different manufacturers, operating in the same frequency band as these Federal radar systems. These U-NII devices employ technology that is supposed to detect the presence of nearby radar systems and change operating frequencies to prevent interference to these incumbent radar systems. Part I of this report series details the results of this measurement effort.
After determining the interference source, ITS engineers undertook a study of these U-NII devices in controlled environments at the ITS laboratory in Boulder, CO, and with a controlled TWDR system at the FAA’s TDWR program support facility (PSF) in Oklahoma City, OK. These tests were performed to examine DFS detection performance of U-NII devices in the presence of TDWR signals, explore the interference levels at which TDWR performance visibly degrades, and examine the U-NII device frequency off-tuning required to eliminate interference artifacts on the TDWR display from incorrectly configured U-NII devices. ITS obtained several U-NII devices from various manufacturers to test against simulated TDWR waveforms at ITS, and against an engineering TDWR system at the PSF in Oklahoma City. ITS performed the tests with representatives from the respective manufacturers present to witness testing and provide engineering support. Part II of this report series describes these tests and field measurements.
This report, Part III of the series, describes U-NII device emission spectra and introduces proposed changes to test waveforms used by the Federal Communications Commission (FCC) during DFS device certification testing. These waveforms more accurately represent TDWR waveforms. These new waveforms not only duplicate currently used TDWR waveform parameters but also include a random element to help protect the TDWR should the FAA change the TDWR pulse repetition intervals in the future.
This report also details the measurements and analysis that determine the power levels at which TDWR receivers experience interference from U-NII emissions at an interference-to-noise (I/N) ratio of -8 dB (a point at which TDWR display performance visibly degrades with the legacy Sigmet RVP8 receiver).1 The maximum allowable interference power that can be coupled co-channel in TDWR receivers without exceeding the I/N level of -8 dB is shown to be -119 dBm/MHz at the antenna terminals. This equates, for example, to an interference power density of -43 dBm/MHz for mainbeam-to-mainbeam coupling between TDWRs and U-NII transmitters 1 The value of -8 dB I/N is used solely for the purpose of demonstrating interference analysis techniques. The FAA has not determined interference protection criteria for this receiver.
x
at a distance of 8 km, or -22 dBm/MHz for TDWR sidelobe to U-NII mainbeam coupling at a distance of 2 km. These power density thresholds are a function of separation distance between TDWR receivers and U-NII transmitters.
This report analyzes the distances at which U-NII transmissions can be expected to routinely couple into TDWR receivers. U-NII devices on rooftops, towers, and other high points that are 153 m to 305 m (500 to 1000 ft) above ground level, as NTIA observed in San Juan, PR, will couple into TDWR mainbeams at distances within 25 km to 41 km (16 mi to 25 mi), respectively, of TDWR stations.
The Appendix presents frequency-dependent rejection (FDR) curves with generalized parameters to illustrate potential required coordination distances. With TDWR antenna main-beam coupling, the radars need about ±30 MHz of frequency separation from frame-based U-NII devices with a spatial distance of 5 to 10 km, depending on the U-NII device. For the on-frequency condition, the separation distance is about 95 km with a U-NII height of 305 meters and about 75 km for a U-NII height of 153 meters, both of which are typically beyond the line-of-sight distance between TDWR stations and U-NII devices. For TDWR antenna sidelobe coupling, the requirement is about ±30 MHz of frequency separation with a nominal distance less than 1 km. For the on-frequency condition, the separation distance is about 24 km.
With main-beam coupling and ±30 MHz of frequency separation from 20 MHz wide 802.11-based U-NII devices operating at an EIRP of +17 dBm,2 TDWRs need a protection distance of 11 km. For 40 MHz wide 802.11 devices with a frequency separation of ±30 MHz, the distance is 35 km; that distance is reduced to 15 km at a frequency separation of 50 MHz above the center frequency and 10 km below the center frequency with a 50 MHz frequency separation.
For the on-frequency condition for 802.11 devices with a U-NII EIRP of +17 dBm, the separation distance is about 94 km for U-NII antenna heights of 304 meters and about 75 km for U-NII antenna heights of 152 meters, both of which are beyond the typical line-of-sight separation distance between TDWR stations and U-NII devices.
With TDWR antenna sidelobe coupling to 802.11 device emissions, the frequency separation requirement from 20 MHz wide U-NII devices is about ±30 MHz with a spatial distance less than 1 km. For the case of 40 MHz wide 802.11-based U-NII devices, the required frequency separation is about ±40 MHz with a spatial separation distance of less than 1 km. For the on-frequency condition, the separation distance is about 22.5 km for the 20 MHz wide 802.11 transmitters and about 18 km for the 40 MHz wide 802.11 transmitter.
2 As defined in 47 CFR § 15.407(a).
CASE STUDY: INVESTIGATION OF INTERFERENCE INTO 5 GHZ WEATHER
RADARS FROM UNLICENSED NATIONAL INFORMATION INFRASTRUCTURE
DEVICES, PART III
John E. Carroll,3 Geoffrey Sanders,3 Frank H. Sanders,3 and Robert L. Sole4
In early 2009, the Federal Aviation Administration (FAA) became aware of interference to Terminal Doppler Weather Radars (TDWRs) that operate in the 5600–5650 MHz band and provide measurements of gust fronts, windshear, microbursts, and other weather hazards for improved safety of operations in and around airports. National Telecommunications and Information Administration (NTIA) engineers, with assistance from FAA engineers, determined the interference to be caused by some unlicensed national information infrastructure (U-NII) dynamic frequency selection (DFS) devices operating in the same frequency band as TDWR systems. These devices use DFS technology that is supposed to detect the presence of nearby co-channel radars and change operating frequencies to prevent interference to those radars. This report, the third of a three-part series, describes some U-NII emission spectra and introduces an additional set of TDWR test waveforms that the Federal Communications Commission (FCC) may use during DFS U-NII device testing. This report also explores the distances and geometries at which interference to TDWRs from U-NII devices is likely to occur.
Key words: dynamic frequency selection; electromagnetic compatibility; radar interference; radar performance degradation; RF interference; spectrum sharing technology; terminal Doppler weather radar; unlicensed national information infrastructure
1 INTRODUCTION
The Terminal Doppler Weather Radar (TDWR) system, introduced in 1993, operates in the 5600–5650 MHz band, and provides quantitative measurements of gust fronts, windshear, microbursts, and other weather hazards which the Federal Aviation Administration (FAA) uses to improve the safety of operations at major airports (45 airports at the time of this writing). “During the period from 1964 to 1986, at least 32 accidents and incidents have occurred in which windshear was identified as a contributing factor. These accidents resulted in over 600 fatalities and nearly 250 injuries. There is evidence to suggest that if undocumented “close calls” and general aviation statistics were included, these figures would be much higher.” [1] TDWRs improve the management of air traffic through forecasting of gust fronts and induced wind shifts,
3 Institute for Telecommunication Sciences (ITS), National Telecommunications and Information Administration (NTIA), U.S. Department of Commerce (DOC), Boulder, CO. 4 Office of Spectrum Management (OSM), NTIA, Washington, DC.
2
detection of precipitation, and detection of other hazardous weather phenomena, including turbulence and tornados.
Beginning in early 2009, the FAA became aware of interference to TDWRs, including one in San Juan, PR. An informal investigation by the FAA concluded that Unlicensed National Information Infrastructure (U-NII) devices were responsible. U-NII systems now operate in the 5250–5350 and 5470–5725 MHz bands, alongside many Federal radar systems, including the TDWR, but are required to employ dynamic frequency selection (DFS) technology to detect the presence of a nearby radar system and change operating frequencies to prevent interference to the radar. The Federal Communications Commission (FCC), the National Telecommunications and Information Administration (NTIA), other Federal agencies, and industry representatives collaborated to develop rules and compliance measurement procedures for U-NII devices equipped with DFS technology. After three years of bench and field testing prototypes from many manufacturers, the FCC finalized DFS rules in March 2006 and granted the first DFS device certification in August 2006. The U-NII devices are authorized to operate under Part 15 rules for unlicensed devices and as such they are not permitted to cause interference to allocated and protected systems. Descriptions and an overview of DFS technology are provided in [2] and [3].
At the request of the FAA, NTIA engineers from the Institute for Telecommunication Sciences (ITS) and the Office of Spectrum Management (OSM) performed a TDWR interference study in San Juan, Puerto Rico from March 9 to 20, 2009. They performed a series of field measurements that confirmed 5 GHz U-NII devices, from various manufacturers, as the interference source at San Juan. The results of these measurements appear in [2]. Building on the San Juan results, FAA engineers subsequently determined that similar interference at other TDWRs in the United States was caused by U-NII devices. Work at San Juan showed that only a minority of all DFS devices caused interference to TDWRs. The next step was to determine why only some DFS devices failed to detect local TDWR signals.
DFS testing moved later in 2009 to the ITS laboratory in Boulder, Colorado, and the FAA Mike Monroney Aeronautical Center TDWR program support facility (PSF) in Oklahoma City, Oklahoma. ITS engineers tested various 5 GHz U-NII devices in controlled laboratory and field environments against laboratory-generated TDWR signals and the signals of the PSF TDWR. Laboratory testing consisted of synthesizing 24 unique TDWR waveforms whose parameters were provided by the FAA. Those 24 waveforms were generated using an Agilent E4438C vector signal generator (VSG). ITS also performed supplemental laboratory testing of the U-NII devices against the “Bin 1 Waveform” [2] used in the FCC certification process. Overall, laboratory tests examined DFS detection performance of U-NII devices, from various manufacturers, in the presence of emulated TDWR signals.
Field testing took place at the PSF TDWR. This TDWR is not a part of the national operational network; the FAA made it available to NTIA for field testing. The field tests examined DFS detection performance of the same U-NII devices as had been examined in the laboratory in the presence of an actual, radiated TDWR signal. The field tests also determined the interference levels at which TDWR performance visibly degrades, examined the amount of U-NII device frequency off-tuning required to eliminate interference strobes from incorrectly configured
3
U-NII devices, and explored how U-NII device energy impacts TDWR performance when the interference couples into TDWR antenna sidelobes. Those results appear in [4].
This report describes the development of a set of new, more representative TDWR radar waveforms for the FCC to use during DFS device certification testing. These newly-developed waveforms contain randomizations that can provide limited protection for future TDWR pulse repetition intervals (PRIs), provided they are not radically different from existing waveforms.
This report also details the measurements and analysis required to determine the frequency separation needed to protect the TDWR legacy Sigmet RVP8 receiver from U-NII emissions to an interference-to-noise (I/N) ratio of -8 dB. At I/N ratios of greater than -8 dB, the data presented in [4] indicate TDWR display performance begins to visibly degrade. NTIA engineers performed RF emission spectra measurements of sampled 5 GHz U-NII transmitters at the ITS. Section 4 describes the methodology and results for these measurements. Using these measurement data, and a given scenario describing the geometry between a TDWR station and a U-NII transmitter, NTIA engineers have developed effective isotropic radiated power (EIRP) limits for U-NII devices that will protect TDWR receivers to an I/N level of -8 dB.
Section 5 of this report describes this electromagnetic compatibility (EMC) analysis. Finally, Section 6 provides a summary of results and conclusions from this EMC analysis. Appendix A contains detailed frequency versus distance separation curves that can be used to protect the TDWR given the frequency separation between the TDWR and the U-NII devices or the spatial distance between them.
4
2 DYNAMIC FREQUENCY SELECTION OVERVIEW
In June 2006, the FCC released a Memorandum Opinion and Order [3] containing an Appendix specifying measurement procedures for certifying U-NII devices for compliance with the DFS requirements in the 5250–5350 MHz and 5470–5725 MHz frequency bands. U-NII devices operating in these bands do not have to follow any FCC guidelines for modulation or coding schemes, but must detect and avoid incumbent Federal radar systems.
The operational behavior required of a U-NII device operating in the 5250–5350 MHz and 5470–5725 MHz frequency bands is:
1. U-NII devices must use DFS in order to detect nearby radar systems with received signal strength above the DFS detection threshold [3] of -62 or -64 dBm peak power.5 The required detection bandwidth [3] is specified as a minimum of 80% of the device’s 99% transmission power bandwidth.
2. Before a U-NII device can transmit on a channel, it must perform a Channel Availability Check [3] for 60 seconds to ensure no radar system is operating on the selected channel.
3. The U-NII device then transmits Network Initiation [3] signals that allow other U-NII devices to associate.
4. During normal operation, the U-NII device monitors the channel (called In-Service Monitoring [3]) to ensure that there are no radar systems on the Operating Channel [3].
5. If the U-NII device detects radar systems during In-Service Monitoring, the Operating Channel must be vacated to prevent interference to nearby radar systems.
6. Once the U-NII device has detected radar systems on a given channel, it must not utilize that channel for a minimum of 30 minutes.
Sections 6 and 7 in the Appendix of [3] specify five sets of radar test waveform types and FCC certification procedures for U-NII devices requiring DFS. The waveforms were developed by NTIA, the FCC, and ITS in coordination with the wireless industry. The waveforms simulate signals from various radars operating in the bands 5250–5350 and 5470–5725 MHz. The waveforms are generated by a test set-up designed and built by ITS and used by the FCC laboratory for device certification. Alternative test systems have been approved by the FCC.
The “Short Pulse Radar Type 1 Waveform,” hereafter referred to in this document as the “Bin 1 Waveform,” was developed specifically to protect the TDWR. It has a PRI of 1428 microseconds (µs), a pulse width of 1 µs, and 18 pulses per burst [3].
5 A detection threshold of -62 dBm applies to devices with less than 200 mW equivalently isotropically radiated power (EIRP) within the detection bandwidth. For devices with 200 mW or greater EIRP, the -64 dBm threshold applies. These values assume a receiver antenna gain of 0 dBi.
5
3 DEVELOPMENT OF NEW FCC DFS CERTIFICATION WAVEFORMS
During the testing described in [4], it became apparent that the Bin 1 Waveform currently used by the FCC for DFS certification testing does not accurately represent the actual TDWR waveforms. To alleviate this problem, new Bin 1 Waveforms have been proposed (jointly created by the FCC, NTIA, and industry representatives over the course of many months) that not only duplicate currently used TDWR waveforms but also include a random element to help protect the TDWR should any improvements be made to the system in the future if and when its waveform parameters are changed.
The existing DFS certification protocol for the Bin 1 Waveform requires that a minimum of 30 trials be performed with each trial consisting of a single burst of 18 1-µs long pulses with a fixed PRI of 1428 µs from each pulse to the next.
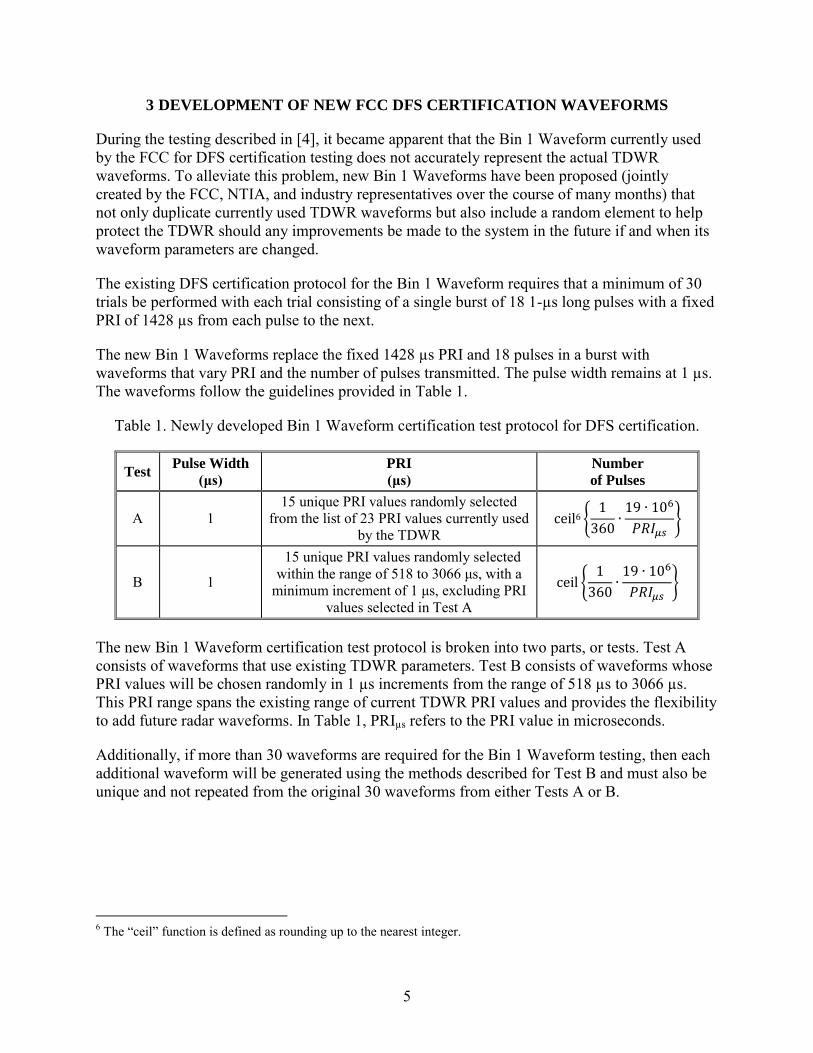
The new Bin 1 Waveforms replace the fixed 1428 µs PRI and 18 pulses in a burst with waveforms that vary PRI and the number of pulses transmitted. The pulse width remains at 1 µs. The waveforms follow the guidelines provided in Table 1.
Table 1. Newly developed Bin 1 Waveform certification test protocol for DFS certification.
Test Pulse Width
(μs)
PRI (μs)
Number of Pulses
A 1 15 unique PRI values randomly selected
from the list of 23 PRI values currently used by the TDWR
6 {
}
B 1
15 unique PRI values randomly selected within the range of 518 to 3066 μs, with a
minimum increment of 1 μs, excluding PRI values selected in Test A
{
}
The new Bin 1 Waveform certification test protocol is broken into two parts, or tests. Test A consists of waveforms that use existing TDWR parameters. Test B consists of waveforms whose PRI values will be chosen randomly in 1 µs increments from the range of 518 µs to 3066 µs. This PRI range spans the existing range of current TDWR PRI values and provides the flexibility to add future radar waveforms. In Table 1, PRIµs refers to the PRI value in microseconds.
Additionally, if more than 30 waveforms are required for the Bin 1 Waveform testing, then each additional waveform will be generated using the methods described for Test B and must also be unique and not repeated from the original 30 waveforms from either Tests A or B.
6 The “ceil” function is defined as rounding up to the nearest integer.
6
4 MEASUREMENT AND ANALYSIS OF U-NII DEVICE EMISSION SPECTRA
4.1 Measurement Technique
The radiated emissions of selected 5 GHz U-NII Access Point (AP) transmitters were obtained by positioning measurement antennas within a few meters of each of the transmitters.7 ITS engineers performed radiated measurements in an indoor lab environment with calibrated, broadband double-ridged-waveguide horn antennas. The antenna separations were typically at the limit of , where was the longest linear dimension of either the U-NII antenna or the measurement horn (whichever was larger), and was the wavelength of the radiation at 5625 MHz.
The measurement antenna output was connected to the current version of the NTIA Radio Spectrum Measurement System (RSMS) RF front-end preselector, diagrammed in Figure 1.
Figure 1. RSMS preselector block diagram.
The preselector output was connected to the input of a spectrum analyzer. The preselector and spectrum analyzer were controlled using custom measurement software to acquire each emission spectrum using a stepped-frequency, rather than a more conventional swept-frequency, measurement algorithm. The stepped-frequency algorithm and the preselector design are described more fully in [5].
7 For some 802.11 indoor devices measured, the spectra were measured with hardline connections to the transmitters due to extremely low device EIRP resulting in reduced emission spectra dynamic range.
7
The advantage of this combination of custom-built hardware and stepped-frequency algorithm for the acquisition of U-NII emission spectra is that the widest possible dynamic range is obtained in the resulting spectra, along with the best possible measurement system sensitivity. The variable front-end attenuator is used to adjust the effective sensitivity of the measurement system at each measured frequency, the stepped-frequency algorithm is used to allow the attenuator to be adjusted at each individual measurement frequency, and the YIG filter rejects strong off-frequency signal power when the measurement system is tuned to frequencies in the out-of-band (OOB) and spurious portions of the emission spectra.
While the NTIA/ITS measurement system is capable of achieving up to 140 dB of dynamic range under optimum conditions [5], the U-NII spectrum measurement results only spanned a dynamic range of between 75 and 90 dB, depending on which device was being measured. This result was due to the low EIRP power that the U-NII transmitters produced.
The bandwidth of the measurement system was 1 MHz. This was less than the emission bandwidth of any of the sampled U-NII transmitters. Using this bandwidth ensured that the ratio of power measured at the U-NII fundamental frequency to the power measured in the OOB and spurious regions of the emission spectra remained constant. If the measurement bandwidth exceeded the U-NII emission bandwidth, the ratio of power in the OOB and spurious regions to the power measured at the U-NII fundamental frequency would decrease, and the OOB and spurious emissions would appear higher than they really are relative to the power at fundamental frequency.
4.2 Measurement Results
Figures 2 and 3 show the measured emission spectra for the devices. The data presented in these figures show only the actual emissions of the U-NII devices; the measurement system noise floor is not shown for the sake of graphical clarity, but was measured to be -94 dBm in a 1 MHz bandwidth. Because each device transmitted at a unique EIRP and the measurement distance varied from one device to the next, the absolute power measured in a 1 MHz bandwidth varied from one to the next. Furthermore, the difference between the power measured at the fundamental frequency of each device and the total power that each device radiated varied as a function of of that bandwidth ratio.8 Therefore, plotting the raw measured spectra would be unhelpful in the context of this study.
Because each U-NII device transmitted a unique EIRP, and because the devices’ relatively low EIRPs turned out to be the limiting factor in the dynamic range of the measurements, the individual emission spectra for each device vary in dynamic range. The higher each device’s EIRP was, the wider the dynamic range over which its spectra were measured and are graphed in the figures. However for all U-NII devices tested, the emission measurements had enough dynamic range to analyze the potential for interference to TDWR receivers. 8 The total radiated power is fixed, but the power measured at the U-NII fundamental frequency varies as a function of 10log(Bmeas), where Bmeas is the measurement bandwidth, only when Bmeas < Bemission, where Bemission is the total U-NII emission bandwidth. In contrast, the power measured in the OOB and spurious regions is a power density that generally varies as 10log(Bmeas) for any value of Bmeas, even if Bmeas exceeds Bemission.
8
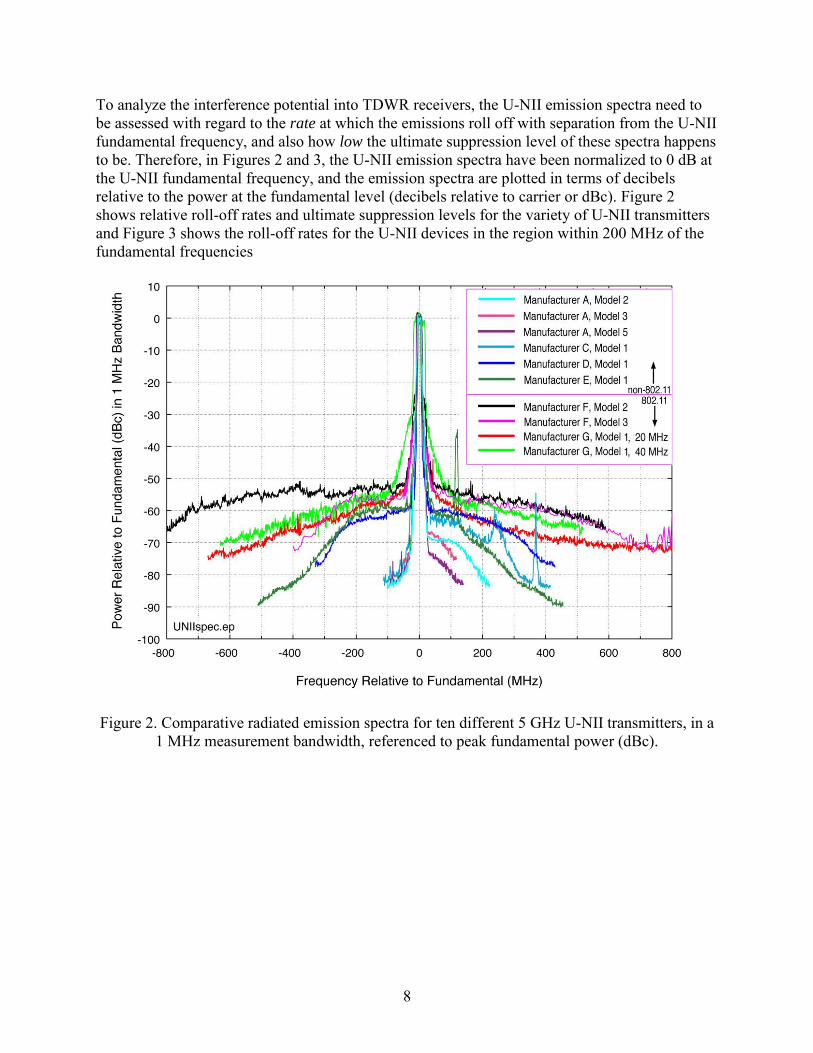
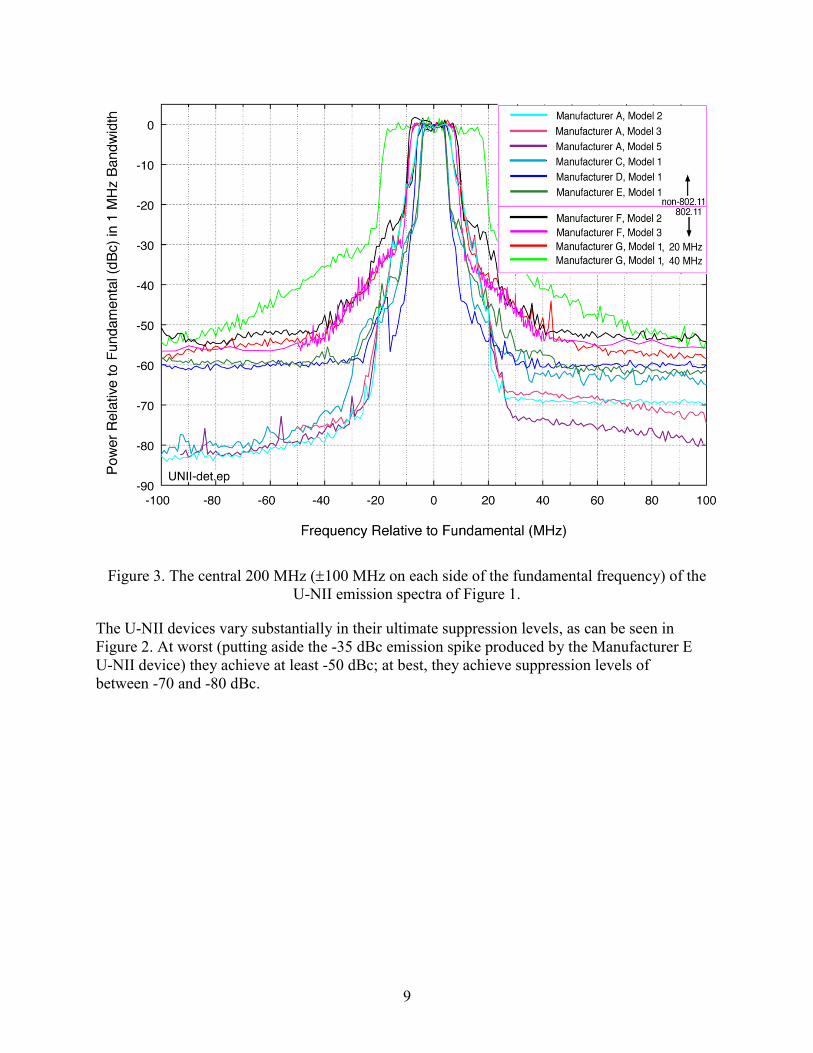
To analyze the interference potential into TDWR receivers, the U-NII emission spectra need to be assessed with regard to the rate at which the emissions roll off with separation from the U-NII fundamental frequency, and also how low the ultimate suppression level of these spectra happens to be. Therefore, in Figures 2 and 3, the U-NII emission spectra have been normalized to 0 dB at the U-NII fundamental frequency, and the emission spectra are plotted in terms of decibels relative to the power at the fundamental level (decibels relative to carrier or dBc). Figure 2 shows relative roll-off rates and ultimate suppression levels for the variety of U-NII transmitters and Figure 3 shows the roll-off rates for the U-NII devices in the region within 200 MHz of the fundamental frequencies
Figure 2. Comparative radiated emission spectra for ten different 5 GHz U-NII transmitters, in a 1 MHz measurement bandwidth, referenced to peak fundamental power (dBc).
9
Figure 3. The central 200 MHz (100 MHz on each side of the fundamental frequency) of the U-NII emission spectra of Figure 1.
The U-NII devices vary substantially in their ultimate suppression levels, as can be seen in Figure 2. At worst (putting aside the -35 dBc emission spike produced by the Manufacturer E U-NII device) they achieve at least -50 dBc; at best, they achieve suppression levels of between -70 and -80 dBc.
10
5 EMC ANALYSIS FOR INTERFERENCE COUPLING FROM U-NII DEVICES TO
TDWRS
Following the measurement of the emission spectra of the U-NII devices, ITS engineers performed an EMC analysis to determine what U-NII ultimate suppression limits are required to protect TDWRs from interference. These limits can then be used to determine the required frequency separation between U-NII devices and TDWRs to mitigate interference.
This analysis is divided into the following subsections:
1. Calculation of U-NII device distances from TDWRs that result in mainbeam coupling, and associated coupling factors.
2. Calculation of the sidelobe antenna coupling factors that can occur when U-NIIs are deployed at lower heights and at locations that are relatively close to TDWRs, but not in the TDWR antenna mainbeam, using the data presented in [4] as an example.
3. Description and analysis of the TDWR emission spectrum (which is required to understand the circumstances under which U-NII receivers’ DFS algorithms will see TDWR energy at amplitudes above the critical threshold of -64 dBm).
4. Calculations of U-NII device power levels that may couple energy into the TDWR antenna mainbeam and sidelobes without causing interference artifacts on the radar display.
5.1 Calculation of Mainbeam Coupling Distances and Coupling Factors between U-NII
Devices and TDWRS
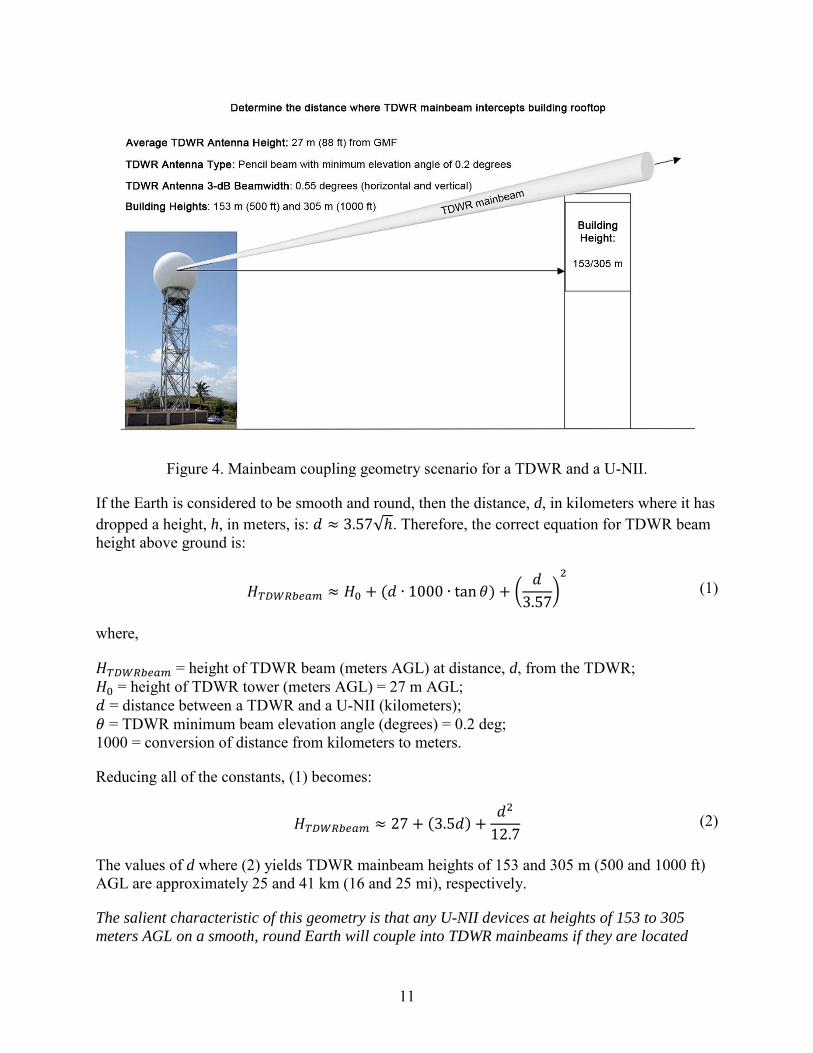
TDWR antennas have a mainbeam that is 0.55 degrees wide at the 3 dB points (in both vertical and horizontal polarizations) with 50 dBi of gain. Although the TDWR beam can be depressed to 0.5 degrees below horizontal, the beam is not ordinarily scanned below +0.2 degrees elevation angle. The question that presents itself for a mainbeam coupling analysis is: how far away (geographically) does a U-NII need to be, if it is deployed on a high tower or rooftop, to preclude coupling of its energy into the mainbeam of a nearby TDWR?
With an assumption that the U-NII height above ground level (AGL) might be 153 or 305 m (500 and 1000 ft, respectively),9 geometrical analysis needs to take into account the curvature of the Earth. Figure 4 provides a description of the geometry for these scenarios. Although the diagram in Figure 4 assumes flat terrain, rising terrain can create the same elevation effect for U-NII devices.
9 NTIA engineers observed these heights for U-NII devices in San Juan, PR. The FCC has documented such heights for U-NII devices as well; see http://transition.fcc.gov/Daily_Releases/Daily_Business/2012/db0319/DOC-313074A1.txt.
11
Figure 4. Mainbeam coupling geometry scenario for a TDWR and a U-NII.
If the Earth is considered to be smooth and round, then the distance, d, in kilometers where it has dropped a height, h, in meters, is: √ . Therefore, the correct equation for TDWR beam height above ground is:
(
)
(1)
where,
= height of TDWR beam (meters AGL) at distance, d, from the TDWR; = height of TDWR tower (meters AGL) = 27 m AGL; = distance between a TDWR and a U-NII (kilometers); = TDWR minimum beam elevation angle (degrees) = 0.2 deg; 1000 = conversion of distance from kilometers to meters.
Reducing all of the constants, (1) becomes:
(2)
The values of d where (2) yields TDWR mainbeam heights of 153 and 305 m (500 and 1000 ft) AGL are approximately 25 and 41 km (16 and 25 mi), respectively.
The salient characteristic of this geometry is that any U-NII devices at heights of 153 to 305
meters AGL on a smooth, round Earth will couple into TDWR mainbeams if they are located
12
within 25 to 41 km (16 to 25 mi) of a TDWR, respectively. With this geometry, any U-NII devices at these assumed heights couple energy into the 50 dBi-gain main-beam of the TDWR antenna and therefore have an antenna coupling factor of at least 50 dB (assuming the U-NII device antenna is 0 dBi; U-NII device antenna gain in the direction of a nearby TDWR will result in an even higher antenna coupling factor).
5.2 Calculation of Coupling Factors into TDWR Antenna Sidelobes When U-NII Devices
Are Deployed at Lower Heights
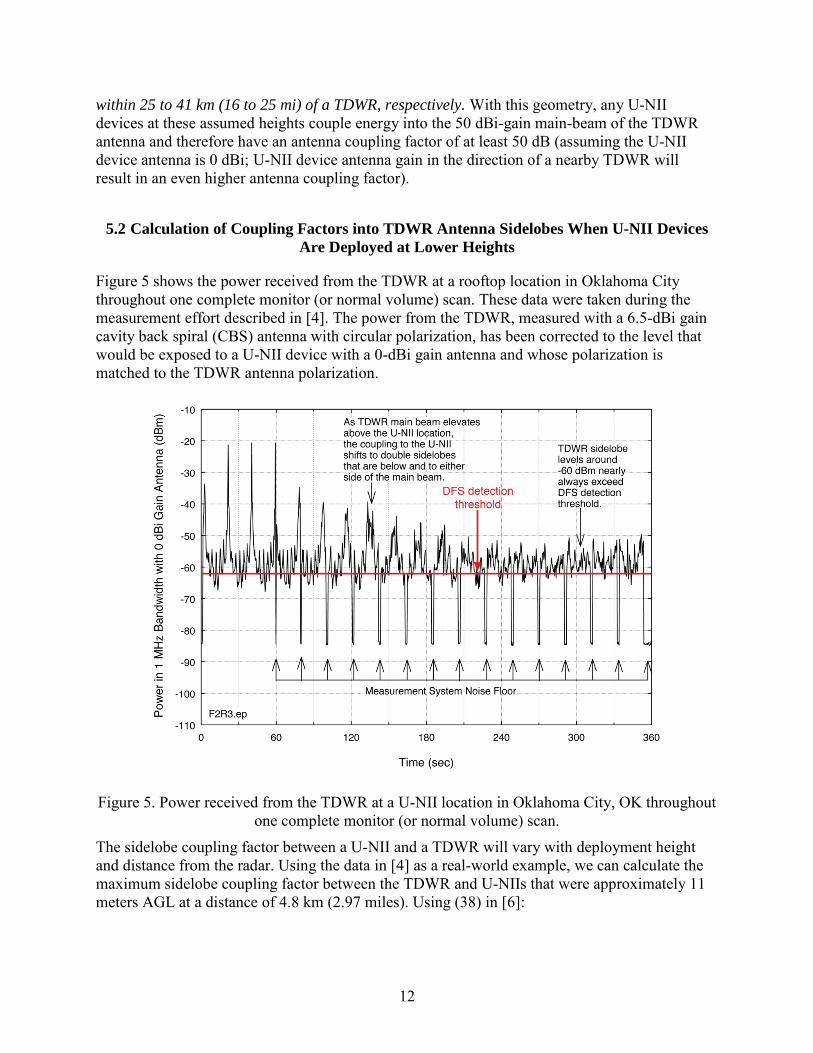
Figure 5 shows the power received from the TDWR at a rooftop location in Oklahoma City throughout one complete monitor (or normal volume) scan. These data were taken during the measurement effort described in [4]. The power from the TDWR, measured with a 6.5-dBi gain cavity back spiral (CBS) antenna with circular polarization, has been corrected to the level that would be exposed to a U-NII device with a 0-dBi gain antenna and whose polarization is matched to the TDWR antenna polarization.
Figure 5. Power received from the TDWR at a U-NII location in Oklahoma City, OK throughout one complete monitor (or normal volume) scan.
The sidelobe coupling factor between a U-NII and a TDWR will vary with deployment height and distance from the radar. Using the data in [4] as a real-world example, we can calculate the maximum sidelobe coupling factor between the TDWR and U-NIIs that were approximately 11 meters AGL at a distance of 4.8 km (2.97 miles). Using (38) in [6]:
13
(3)
where,
= receive power (dBm); = transmit power (dBm); = transmit gain (dBi); = receive gain (dBi); = frequency (MHz); = distance (km).
Re-arranging to solve for the gain of the TDWR antenna sidelobe:
. (4)
Using (4) and Figure 5 with = -20 dBm, = 84 dBm, = 0 dBi, = 5625 MHz, and = 4.8 km, the TDWR antenna sidelobe coupling factor is +17 dBi. This value is used in the subsequent EMC analysis.
5.3 Description and Analysis of the TDWR Emission Spectrum
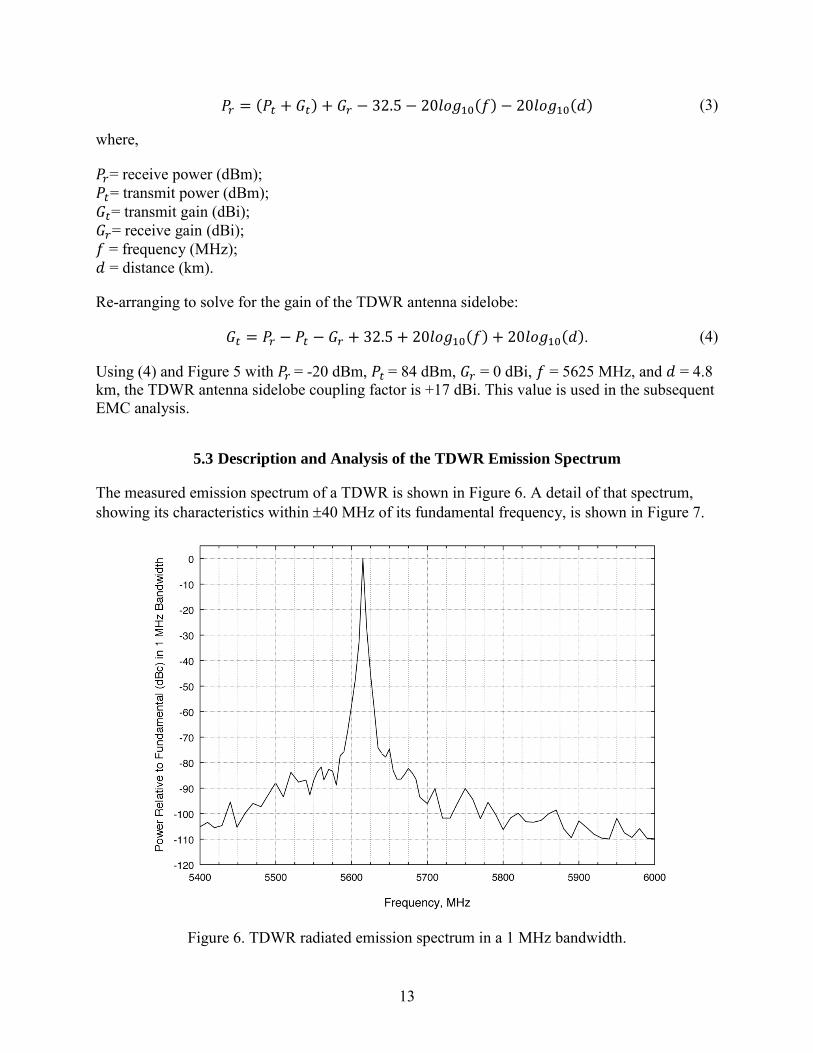
The measured emission spectrum of a TDWR is shown in Figure 6. A detail of that spectrum, showing its characteristics within 40 MHz of its fundamental frequency, is shown in Figure 7.
Figure 6. TDWR radiated emission spectrum in a 1 MHz bandwidth.
14
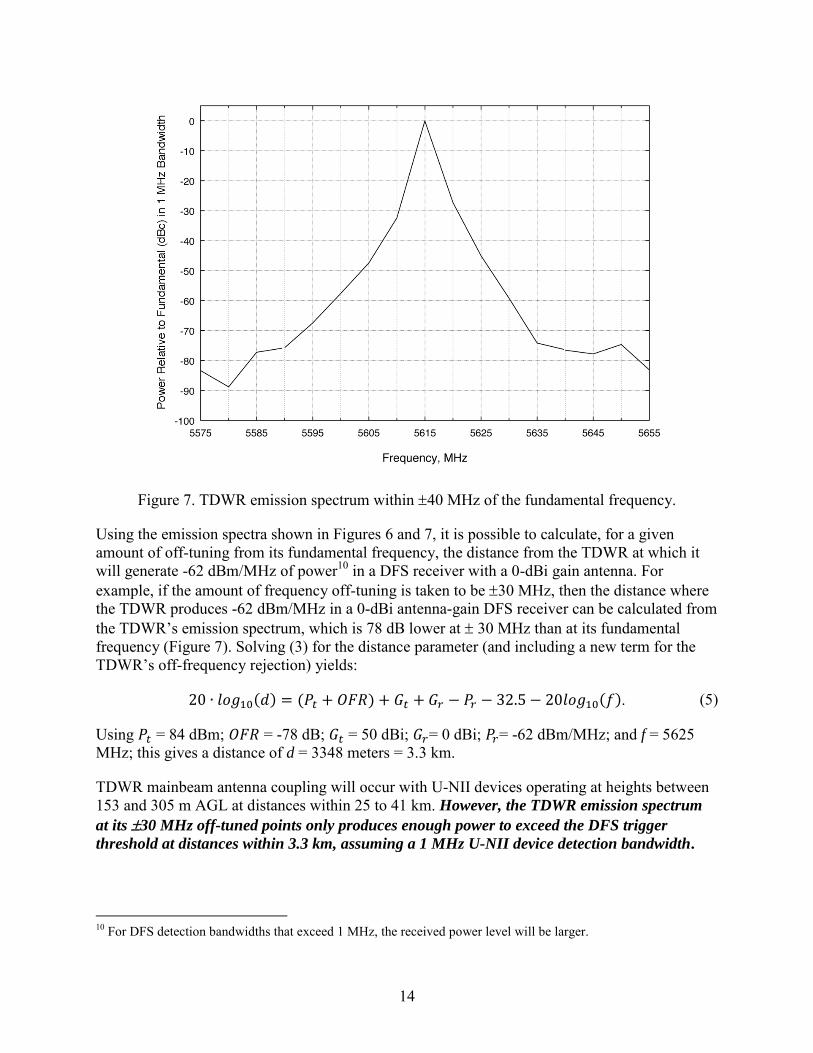
Figure 7. TDWR emission spectrum within 40 MHz of the fundamental frequency.
Using the emission spectra shown in Figures 6 and 7, it is possible to calculate, for a given amount of off-tuning from its fundamental frequency, the distance from the TDWR at which it will generate -62 dBm/MHz of power10 in a DFS receiver with a 0-dBi gain antenna. For example, if the amount of frequency off-tuning is taken to be 30 MHz, then the distance where the TDWR produces -62 dBm/MHz in a 0-dBi antenna-gain DFS receiver can be calculated from the TDWR’s emission spectrum, which is 78 dB lower at 30 MHz than at its fundamental frequency (Figure 7). Solving (3) for the distance parameter (and including a new term for the TDWR’s off-frequency rejection) yields:
. (5)
Using = 84 dBm; = -78 dB; = 50 dBi; = 0 dBi; = -62 dBm/MHz; and f = 5625 MHz; this gives a distance of d = 3348 meters = 3.3 km.
TDWR mainbeam antenna coupling will occur with U-NII devices operating at heights between 153 and 305 m AGL at distances within 25 to 41 km. However, the TDWR emission spectrum
at its 30 MHz off-tuned points only produces enough power to exceed the DFS trigger
threshold at distances within 3.3 km, assuming a 1 MHz U-NII device detection bandwidth.
10 For DFS detection bandwidths that exceed 1 MHz, the received power level will be larger.
15
5.4 EMC Coupling Analyses
A complete EMC analysis for TDWRs and U-NII devices requires that the minimum distance between TDWR stations and U-NII transmitters be specified along with a determination of the maximum I/N level that would be allowed in the TDWR receiver (e.g., -8 dB).11 Using those limits, compatible operations between TDWRs and U-NII devices can be realized. By examining the emission spectrum measurements of the U-NII devices, the minimum amount of frequency separation between U-NII transmitters and TDWRs can also be determined.
In the next two sub-sections, ITS presents analyses to determine the required suppression level of unwanted U-NII device emissions that would be needed based on two scenarios: mainbeam-to-mainbeam coupling, and U-NII antenna mainbeam to TDWR antenna sidelobe coupling. The methodology presented here can be extended to other scenarios as well; the Appendix presents general-purpose sets of distance-versus-frequency separation curves.
5.4.1 Mainbeam-to-Mainbeam Coupling
The goal is to determine the maximum EIRP that a U-NII device could transmit on a TDWR frequency without exceeding an I/N level of -8 dB in the TDWR receiver. This I/N limit is based on the U-NII device co-channel power on the TDWR frequency. The following calculations determine the maximum EIRP allowed from a U-NII device situated at a hypothetical distance of 8 km from a TDWR system. TDWR system parameters are given in Table 2.
Table 2. Parameters for mainbeam-to-mainbeam U-NII-to-TDWR EMC analysis.
Parameter Value
TDWR Receiver Bandwidth 1 MHz TDWR Receiver Noise Figure 1.4 dB
Loss Between TDWR Antenna Feed and Receiver Low Noise Amplifier Input 2 dB
TDWR Antenna Gain 50 dBi Separation Distance Between TDWR Station and
U-NII Transmitter 8 km (hypothetical)
Frequency of the TDWR 5625 MHz The energy coupling equation for these two systems is (using (3)):
(6)
where,
11 An of -8 dB is used only as an example to demonstrate the analytical approach. It approximates the level where strobes became barely visible in TDWR data with the radar’s newest receiver, the Sigmet RVP8, as documented in [4].
16
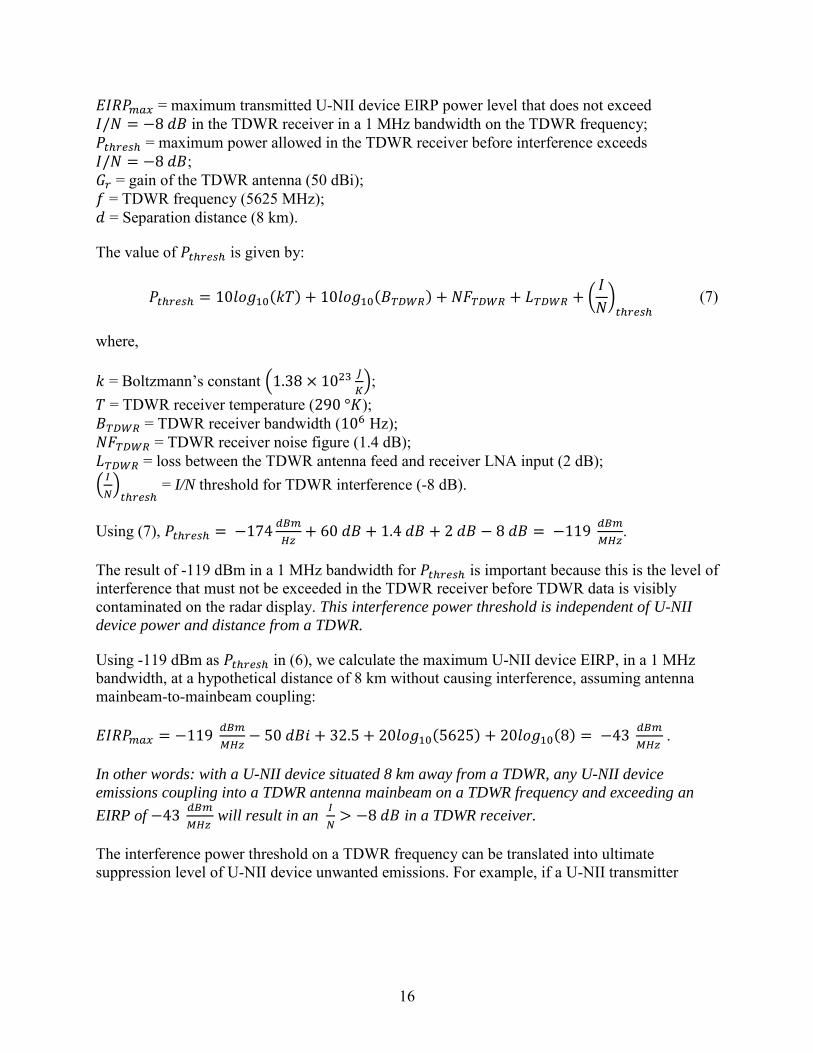
= maximum transmitted U-NII device EIRP power level that does not exceed in the TDWR receiver in a 1 MHz bandwidth on the TDWR frequency; = maximum power allowed in the TDWR receiver before interference exceeds ; = gain of the TDWR antenna (50 dBi); = TDWR frequency (5625 MHz); = Separation distance (8 km).
The value of is given by:
(
)
(7)
where,
= Boltzmann’s constant (
);
= TDWR receiver temperature ( ); = TDWR receiver bandwidth ( Hz); = TDWR receiver noise figure (1.4 dB); = loss between the TDWR antenna feed and receiver LNA input (2 dB); (
)
= I/N threshold for TDWR interference (-8 dB).
Using (7),
.
The result of -119 dBm in a 1 MHz bandwidth for is important because this is the level of interference that must not be exceeded in the TDWR receiver before TDWR data is visibly contaminated on the radar display. This interference power threshold is independent of U-NII
device power and distance from a TDWR.
Using -119 dBm as in (6), we calculate the maximum U-NII device EIRP, in a 1 MHz bandwidth, at a hypothetical distance of 8 km without causing interference, assuming antenna mainbeam-to-mainbeam coupling:
.
In other words: with a U-NII device situated 8 km away from a TDWR, any U-NII device
emissions coupling into a TDWR antenna mainbeam on a TDWR frequency and exceeding an
EIRP of
will result in an
in a TDWR receiver.
The interference power threshold on a TDWR frequency can be translated into ultimate suppression level of U-NII device unwanted emissions. For example, if a U-NII transmitter
17
hypothetically situated 8 km from a TDWR generated an EIRP of +17 dBm/MHz,12 then the ultimate suppression level of its unwanted emissions on the TDWR frequency would need to be at least
(
) relative to the power per megahertz at the U-NII
fundamental frequency.
If, conversely, the EIRP of a hypothetical U-NII transmitter were less than the maximum specified power of +17 dBm/MHz, then the required suppression would decrease by a corresponding amount. For example, if the U-NII device EIRP were 0 dBm/MHz, then the required minimum suppression value for the U-NII unwanted emissions on the TDWR frequency would only need to be relative to the power per megahertz at the fundamental frequency.
5.4.2 U-NII Mainbeam-to-TDWR Sidelobe Coupling
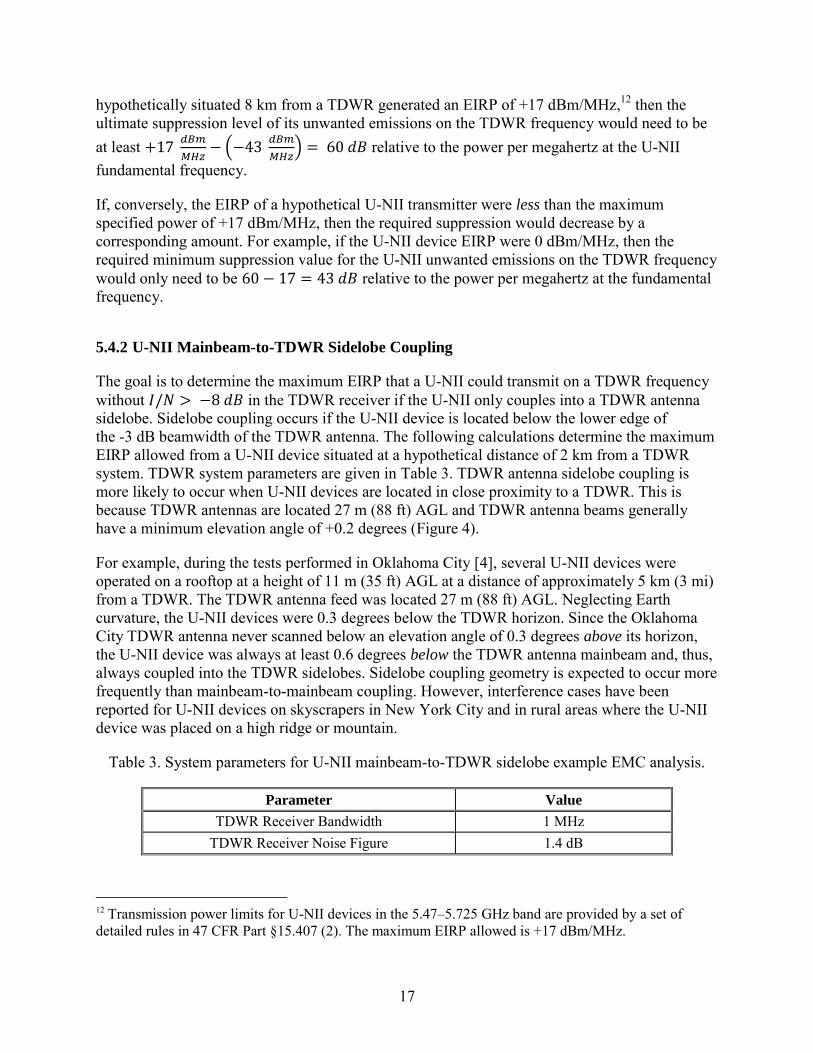
The goal is to determine the maximum EIRP that a U-NII could transmit on a TDWR frequency without in the TDWR receiver if the U-NII only couples into a TDWR antenna sidelobe. Sidelobe coupling occurs if the U-NII device is located below the lower edge of the -3 dB beamwidth of the TDWR antenna. The following calculations determine the maximum EIRP allowed from a U-NII device situated at a hypothetical distance of 2 km from a TDWR system. TDWR system parameters are given in Table 3. TDWR antenna sidelobe coupling is more likely to occur when U-NII devices are located in close proximity to a TDWR. This is because TDWR antennas are located 27 m (88 ft) AGL and TDWR antenna beams generally have a minimum elevation angle of +0.2 degrees (Figure 4).
For example, during the tests performed in Oklahoma City [4], several U-NII devices were operated on a rooftop at a height of 11 m (35 ft) AGL at a distance of approximately 5 km (3 mi) from a TDWR. The TDWR antenna feed was located 27 m (88 ft) AGL. Neglecting Earth curvature, the U-NII devices were 0.3 degrees below the TDWR horizon. Since the Oklahoma City TDWR antenna never scanned below an elevation angle of 0.3 degrees above its horizon, the U-NII device was always at least 0.6 degrees below the TDWR antenna mainbeam and, thus, always coupled into the TDWR sidelobes. Sidelobe coupling geometry is expected to occur more frequently than mainbeam-to-mainbeam coupling. However, interference cases have been reported for U-NII devices on skyscrapers in New York City and in rural areas where the U-NII device was placed on a high ridge or mountain.
Table 3. System parameters for U-NII mainbeam-to-TDWR sidelobe example EMC analysis.
Parameter Value
TDWR Receiver Bandwidth 1 MHz TDWR Receiver Noise Figure 1.4 dB
12 Transmission power limits for U-NII devices in the 5.47–5.725 GHz band are provided by a set of detailed rules in 47 CFR Part §15.407 (2). The maximum EIRP allowed is +17 dBm/MHz.
18
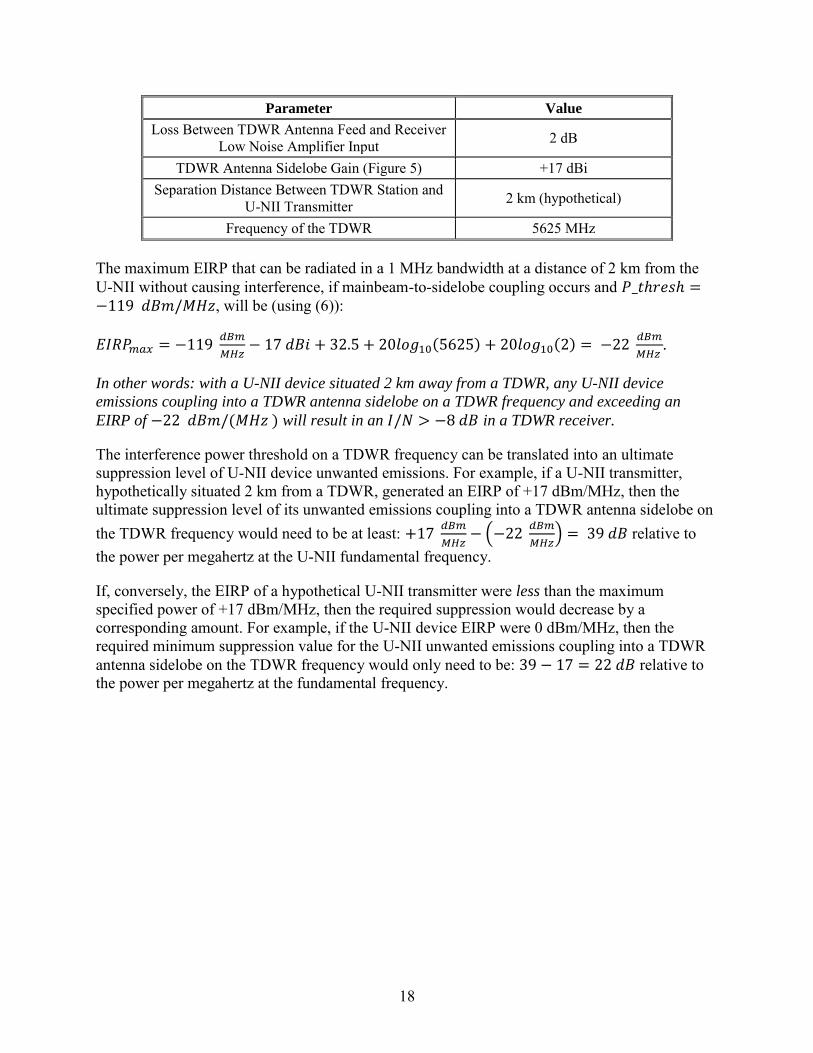
Parameter Value
Loss Between TDWR Antenna Feed and Receiver Low Noise Amplifier Input 2 dB
TDWR Antenna Sidelobe Gain (Figure 5) +17 dBi Separation Distance Between TDWR Station and
U-NII Transmitter 2 km (hypothetical)
Frequency of the TDWR 5625 MHz The maximum EIRP that can be radiated in a 1 MHz bandwidth at a distance of 2 km from the U-NII without causing interference, if mainbeam-to-sidelobe coupling occurs and , will be (using (6)):
.
In other words: with a U-NII device situated 2 km away from a TDWR, any U-NII device
emissions coupling into a TDWR antenna sidelobe on a TDWR frequency and exceeding an
EIRP of will result in an in a TDWR receiver.
The interference power threshold on a TDWR frequency can be translated into an ultimate suppression level of U-NII device unwanted emissions. For example, if a U-NII transmitter, hypothetically situated 2 km from a TDWR, generated an EIRP of +17 dBm/MHz, then the ultimate suppression level of its unwanted emissions coupling into a TDWR antenna sidelobe on the TDWR frequency would need to be at least:
(
) relative to
the power per megahertz at the U-NII fundamental frequency.
If, conversely, the EIRP of a hypothetical U-NII transmitter were less than the maximum specified power of +17 dBm/MHz, then the required suppression would decrease by a corresponding amount. For example, if the U-NII device EIRP were 0 dBm/MHz, then the required minimum suppression value for the U-NII unwanted emissions coupling into a TDWR antenna sidelobe on the TDWR frequency would only need to be: relative to the power per megahertz at the fundamental frequency.
19
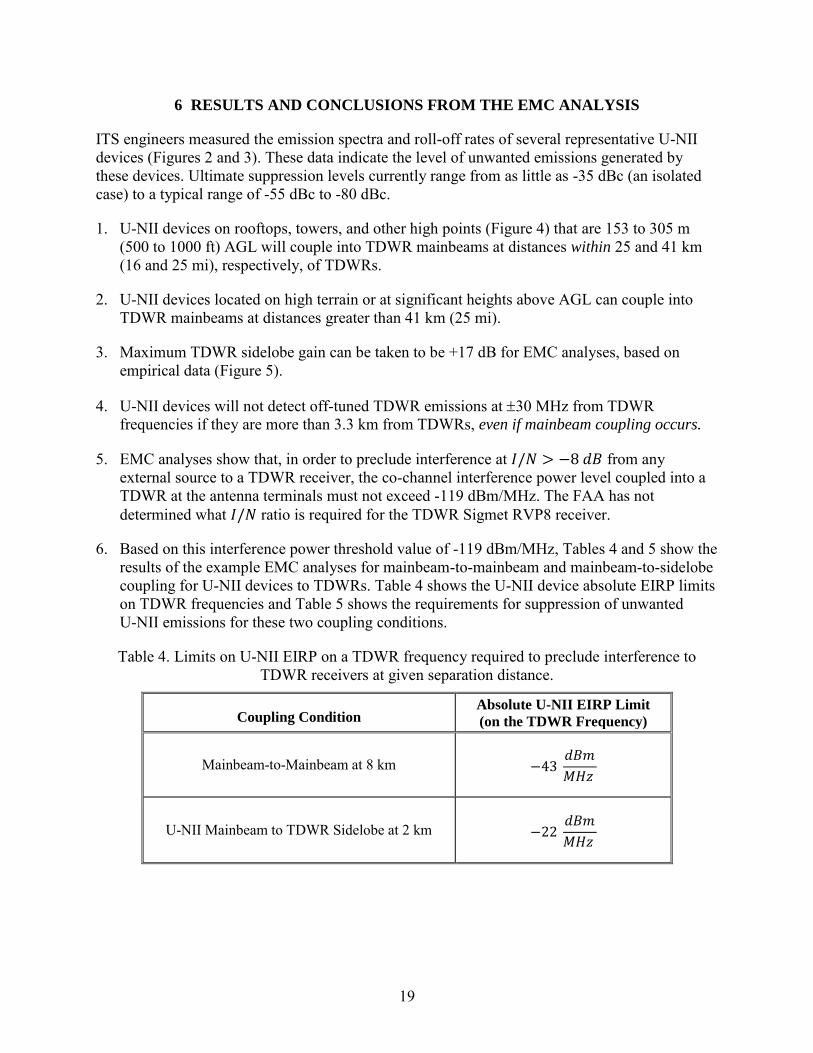
6 RESULTS AND CONCLUSIONS FROM THE EMC ANALYSIS
ITS engineers measured the emission spectra and roll-off rates of several representative U-NII devices (Figures 2 and 3). These data indicate the level of unwanted emissions generated by these devices. Ultimate suppression levels currently range from as little as -35 dBc (an isolated case) to a typical range of -55 dBc to -80 dBc.
1. U-NII devices on rooftops, towers, and other high points (Figure 4) that are 153 to 305 m (500 to 1000 ft) AGL will couple into TDWR mainbeams at distances within 25 and 41 km (16 and 25 mi), respectively, of TDWRs.
2. U-NII devices located on high terrain or at significant heights above AGL can couple into TDWR mainbeams at distances greater than 41 km (25 mi).
3. Maximum TDWR sidelobe gain can be taken to be +17 dB for EMC analyses, based on empirical data (Figure 5).
4. U-NII devices will not detect off-tuned TDWR emissions at 30 MHz from TDWR frequencies if they are more than 3.3 km from TDWRs, even if mainbeam coupling occurs.
5. EMC analyses show that, in order to preclude interference at from any external source to a TDWR receiver, the co-channel interference power level coupled into a TDWR at the antenna terminals must not exceed -119 dBm/MHz. The FAA has not determined what ratio is required for the TDWR Sigmet RVP8 receiver.
6. Based on this interference power threshold value of -119 dBm/MHz, Tables 4 and 5 show the results of the example EMC analyses for mainbeam-to-mainbeam and mainbeam-to-sidelobe coupling for U-NII devices to TDWRs. Table 4 shows the U-NII device absolute EIRP limits on TDWR frequencies and Table 5 shows the requirements for suppression of unwanted U-NII emissions for these two coupling conditions.
Table 4. Limits on U-NII EIRP on a TDWR frequency required to preclude interference to TDWR receivers at given separation distance.
Coupling Condition Absolute U-NII EIRP Limit
(on the TDWR Frequency)
Mainbeam-to-Mainbeam at 8 km
U-NII Mainbeam to TDWR Sidelobe at 2 km
20
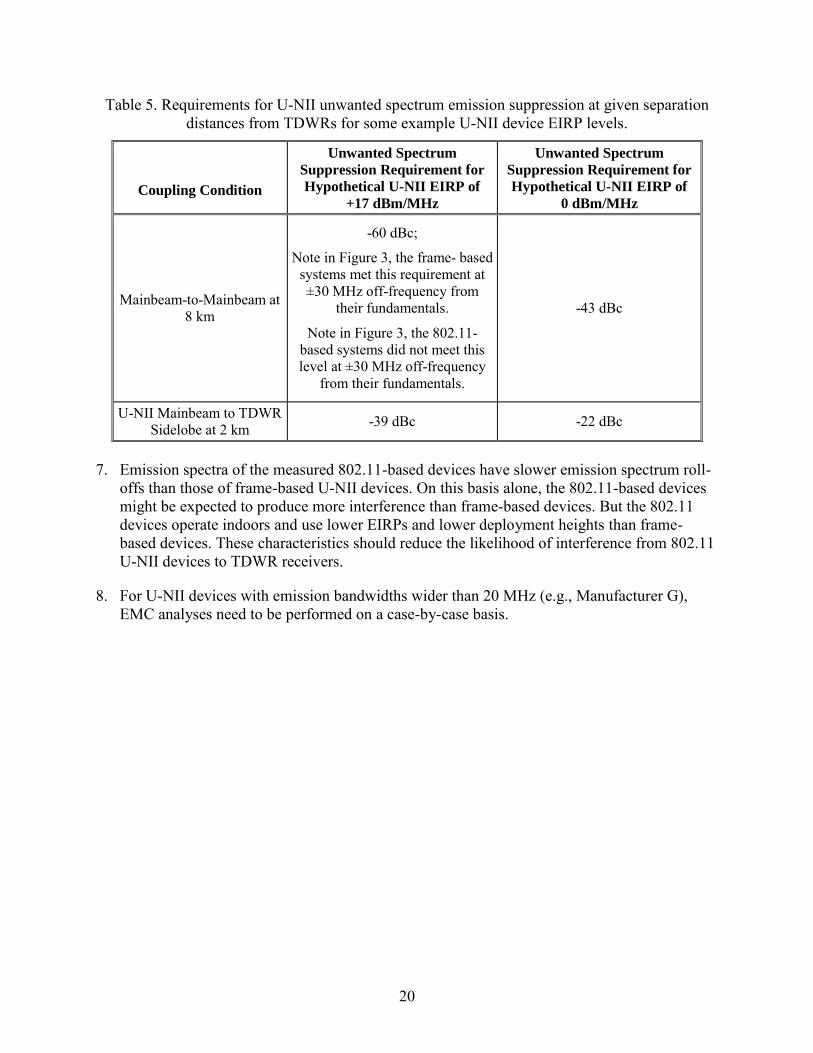
Table 5. Requirements for U-NII unwanted spectrum emission suppression at given separation distances from TDWRs for some example U-NII device EIRP levels.
Coupling Condition
Unwanted Spectrum
Suppression Requirement for
Hypothetical U-NII EIRP of
+17 dBm/MHz
Unwanted Spectrum
Suppression Requirement for
Hypothetical U-NII EIRP of
0 dBm/MHz
Mainbeam-to-Mainbeam at 8 km
-60 dBc;
Note in Figure 3, the frame- based systems met this requirement at ±30 MHz off-frequency from
their fundamentals.
Note in Figure 3, the 802.11- based systems did not meet this level at ±30 MHz off-frequency
from their fundamentals.
-43 dBc
U-NII Mainbeam to TDWR Sidelobe at 2 km -39 dBc -22 dBc
7. Emission spectra of the measured 802.11-based devices have slower emission spectrum roll-
offs than those of frame-based U-NII devices. On this basis alone, the 802.11-based devices might be expected to produce more interference than frame-based devices. But the 802.11 devices operate indoors and use lower EIRPs and lower deployment heights than frame-based devices. These characteristics should reduce the likelihood of interference from 802.11 U-NII devices to TDWR receivers.
8. For U-NII devices with emission bandwidths wider than 20 MHz (e.g., Manufacturer G), EMC analyses need to be performed on a case-by-case basis.
21
7 REFERENCES
[1] U.S. Department of Transportation, Federal Aviation Administration, Advisory Circular 00-54, Pilot Windshear Guide, Nov. 1988. http://rgl.faa.gov/Regulatory_and_Guidance_Library/rgAdvisoryCircular.nsf/list/AC%2000-54/$FILE/AC00-54.pdf, accessed on Sept. 25, 2010.
[2] Carroll, J. E., F. H. Sanders, R. L. Sole, and G. A. Sanders, “Case Study: Investigation of Interference into 5 GHz Weather Radars from Unlicensed National Information Infrastructure Devices, Part I,” NTIA Report TR-11-473, November 2010. Downloadable at: http://www.its.bldrdoc.gov/publications/2548.aspx.
[3] Federal Communications Commission, Revision of Parts 2 and 15 of the Commission’s Rules to Permit Unlicensed National Information Infrastructure (U-NII) devices in the 5 GHz band, ET Docket No.03-122, Memorandum Opinion and Order, 21 FCC Record 7672 (2006). http://hraunfoss.fcc.gov/edocs_public/attachmatch/FCC-06-96A1.pdf, accessed on Jul. 8, 2010.
[4] Carroll, J. E., F. H. Sanders, R. L. Sole, and G. A. Sanders, “Case Study: Investigation of Interference into 5 GHz Weather Radars from Unlicensed National Information Infrastructure Devices, Part II,” NTIA Report TR-11-479, July 2011. Downloadable at: http://www.its.bldrdoc.gov/publications/2554.aspx.
[5] Sanders, F.H., R.L. Hinkle, and B.J. Ramsey, “Measurement Procedures for the Radar Spectrum Engineering Criteria (RSEC),” NTIA Report TR-05-420, March 2005. Downloadable at: http://www.its.bldrdoc.gov/publications/2450.aspx.
[6] Sanders, F., “Derivations of Relationships Among Field Strength, Power in Transmitter-Receiver Circuits and Radiation Hazard Limits,” NTIA Memorandum TM-10-469, June 2010. Downloadable at: http://www.its.bldrdoc.gov/publications/2507.aspx.
22
APPENDIX A. CALCULATED FREQUENCY-DEPENDENT REJECTION (FDR)
CURVES AND COORDINATION DISTANCES BETWEEN TDWR RECEIVERS AND
U-NII TRANSMITTERS
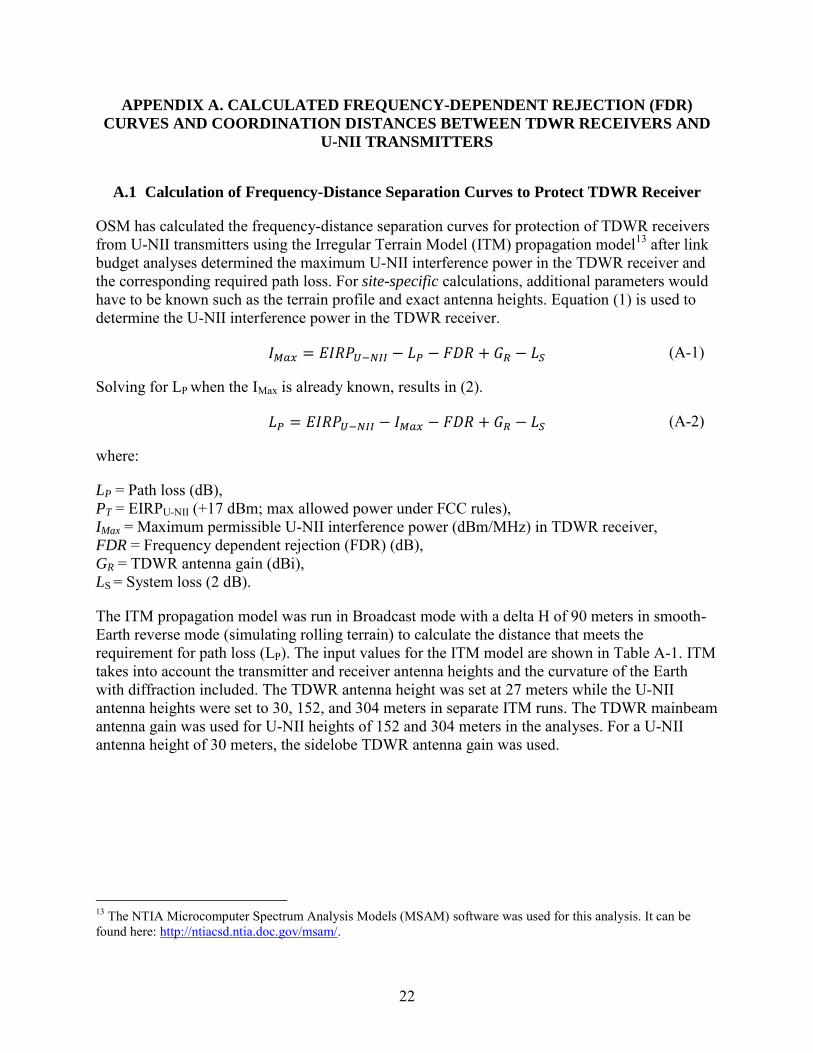
A.1 Calculation of Frequency-Distance Separation Curves to Protect TDWR Receiver
OSM has calculated the frequency-distance separation curves for protection of TDWR receivers from U-NII transmitters using the Irregular Terrain Model (ITM) propagation model13 after link budget analyses determined the maximum U-NII interference power in the TDWR receiver and the corresponding required path loss. For site-specific calculations, additional parameters would have to be known such as the terrain profile and exact antenna heights. Equation (1) is used to determine the U-NII interference power in the TDWR receiver.
(A-1)
Solving for LP when the IMax is already known, results in (2).
(A-2)
where:
LP = Path loss (dB), PT = EIRPU-NII (+17 dBm; max allowed power under FCC rules), IMax = Maximum permissible U-NII interference power (dBm/MHz) in TDWR receiver, FDR = Frequency dependent rejection (FDR) (dB), GR = TDWR antenna gain (dBi), LS = System loss (2 dB).
The ITM propagation model was run in Broadcast mode with a delta H of 90 meters in smooth-Earth reverse mode (simulating rolling terrain) to calculate the distance that meets the requirement for path loss (LP). The input values for the ITM model are shown in Table A-1. ITM takes into account the transmitter and receiver antenna heights and the curvature of the Earth with diffraction included. The TDWR antenna height was set at 27 meters while the U-NII antenna heights were set to 30, 152, and 304 meters in separate ITM runs. The TDWR mainbeam antenna gain was used for U-NII heights of 152 and 304 meters in the analyses. For a U-NII antenna height of 30 meters, the sidelobe TDWR antenna gain was used.
13 The NTIA Microcomputer Spectrum Analysis Models (MSAM) software was used for this analysis. It can be found here: http://ntiacsd.ntia.doc.gov/msam/.
23
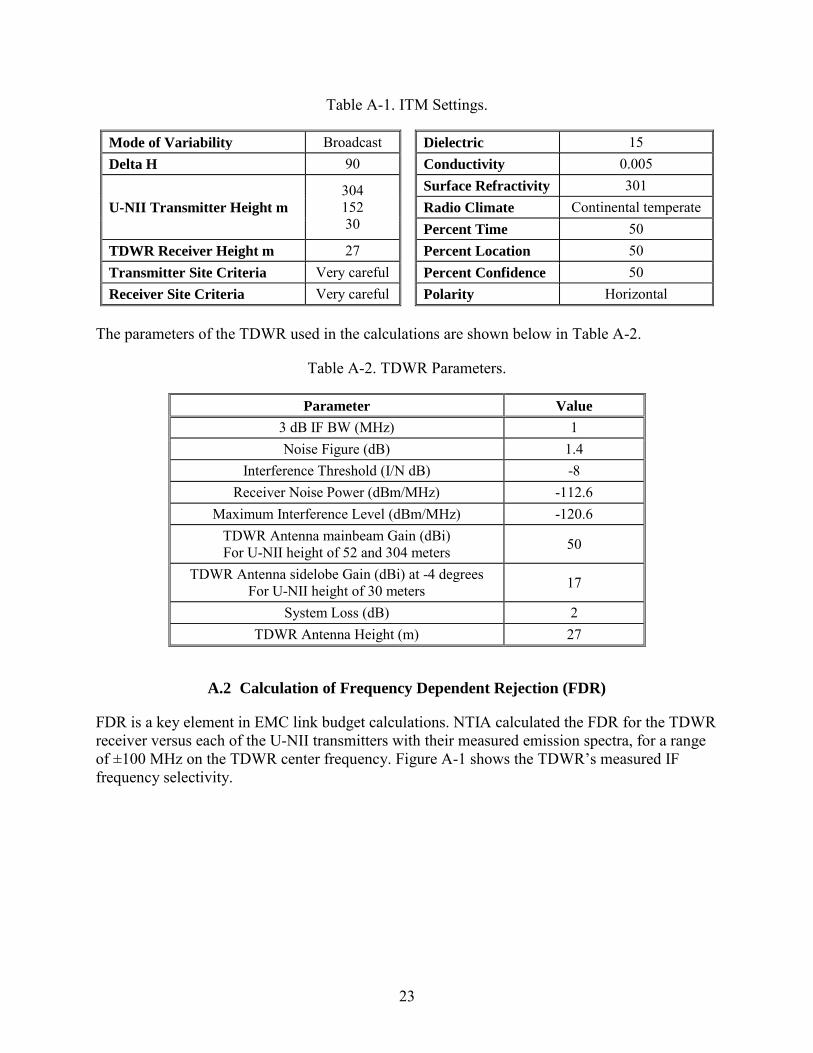
Table A-1. ITM Settings.
Mode of Variability Broadcast Dielectric 15 Delta H 90 Conductivity 0.005
U-NII Transmitter Height m
304 152 30
Surface Refractivity 301 Radio Climate Continental temperate Percent Time 50
TDWR Receiver Height m 27 Percent Location 50 Transmitter Site Criteria Very careful Percent Confidence 50 Receiver Site Criteria Very careful Polarity Horizontal
The parameters of the TDWR used in the calculations are shown below in Table A-2.
Table A-2. TDWR Parameters.
Parameter Value
3 dB IF BW (MHz) 1 Noise Figure (dB) 1.4
Interference Threshold (I/N dB) -8 Receiver Noise Power (dBm/MHz) -112.6
Maximum Interference Level (dBm/MHz) -120.6 TDWR Antenna mainbeam Gain (dBi) For U-NII height of 52 and 304 meters 50
TDWR Antenna sidelobe Gain (dBi) at -4 degrees For U-NII height of 30 meters 17
System Loss (dB) 2 TDWR Antenna Height (m) 27
A.2 Calculation of Frequency Dependent Rejection (FDR)
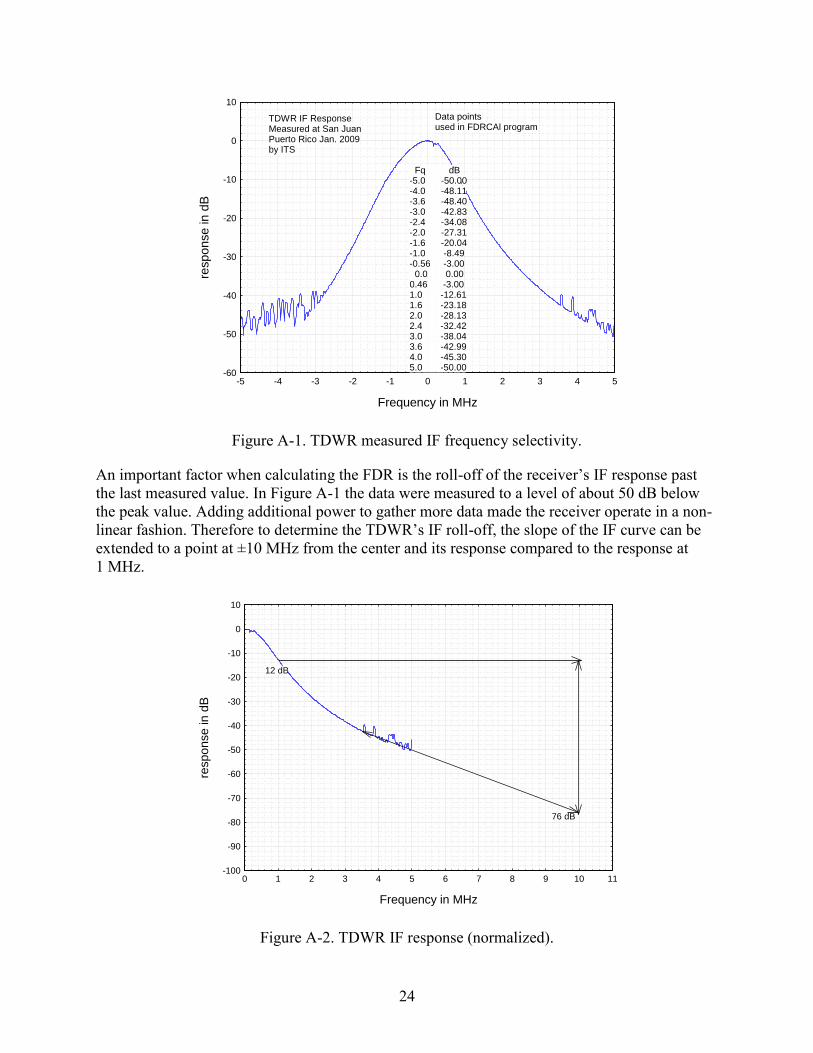
FDR is a key element in EMC link budget calculations. NTIA calculated the FDR for the TDWR receiver versus each of the U-NII transmitters with their measured emission spectra, for a range of ±100 MHz on the TDWR center frequency. Figure A-1 shows the TDWR’s measured IF frequency selectivity.
24
Figure A-1. TDWR measured IF frequency selectivity.
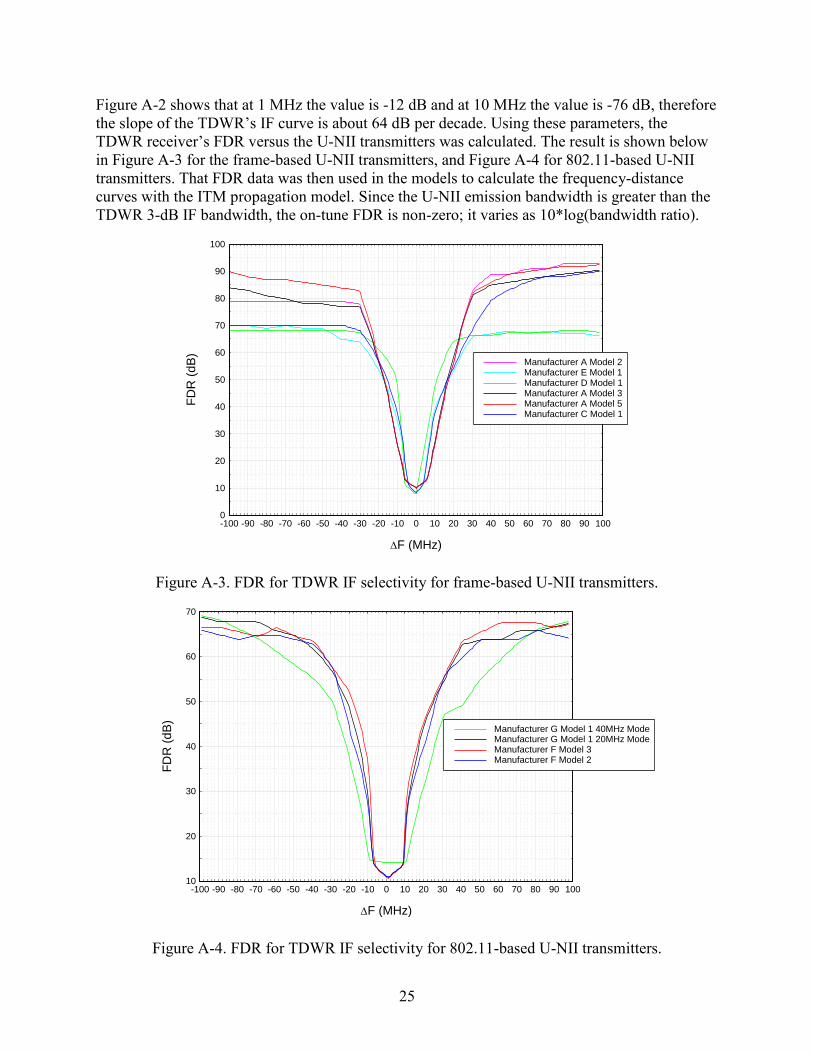
An important factor when calculating the FDR is the roll-off of the receiver’s IF response past the last measured value. In Figure A-1 the data were measured to a level of about 50 dB below the peak value. Adding additional power to gather more data made the receiver operate in a non-linear fashion. Therefore to determine the TDWR’s IF roll-off, the slope of the IF curve can be extended to a point at ±10 MHz from the center and its response compared to the response at 1 MHz.
Figure A-2. TDWR IF response (normalized).
-60
-50
-40
-30
-20
-10
0
10
-5 -4 -3 -2 -1 0 1 2 3 4 5
Data pointsused in FDRCAl program
TDWR IF ResponseMeasured at San JuanPuerto Rico Jan. 2009by ITS
Fq dB-5.0 -50.00-4.0 -48.11-3.6 -48.40-3.0 -42.83-2.4 -34.08-2.0 -27.31-1.6 -20.04-1.0 -8.49-0.56 -3.00 0.0 0.000.46 -3.001.0 -12.611.6 -23.182.0 -28.132.4 -32.423.0 -38.043.6 -42.994.0 -45.305.0 -50.00
Frequency in MHz
resp
on
se
in
dB
TDWR IF Response (normalized)
-100
-90
-80
-70
-60
-50
-40
-30
-20
-10
0
10
0 1 2 3 4 5 6 7 8 9 10 11
76 dB
12 dB
Frequency in MHz
respo
nse
in
dB
TDWR IF Response (normalized)
25
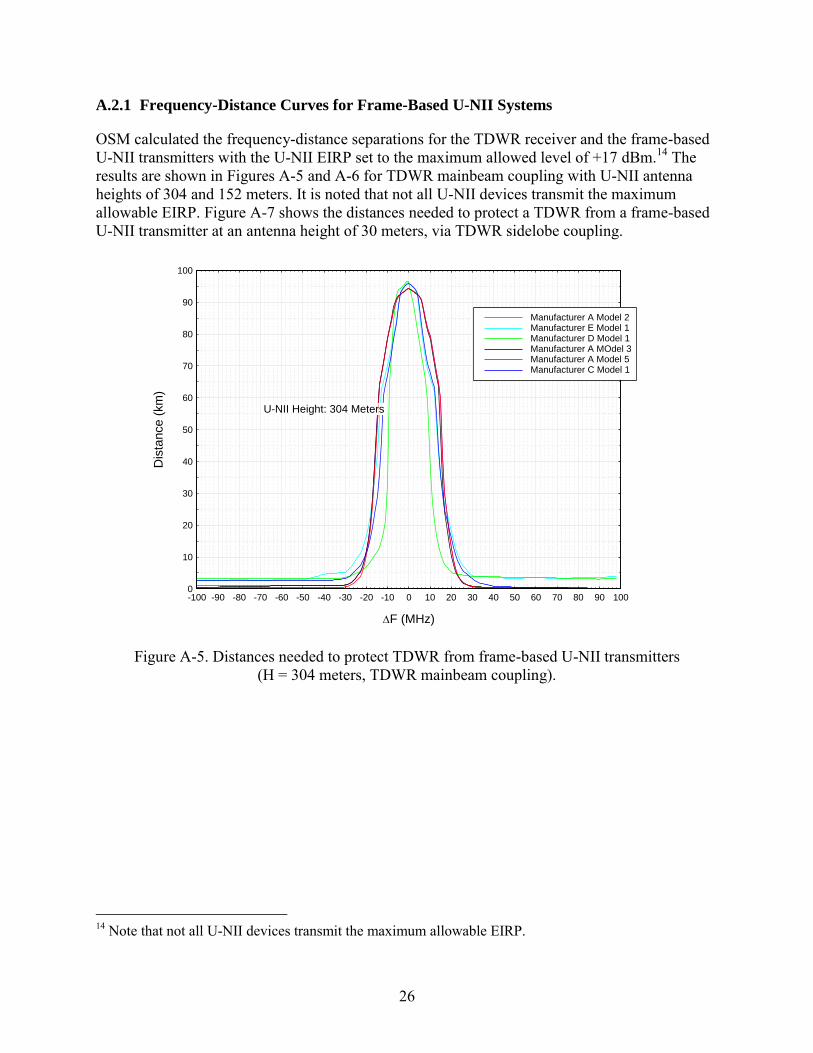
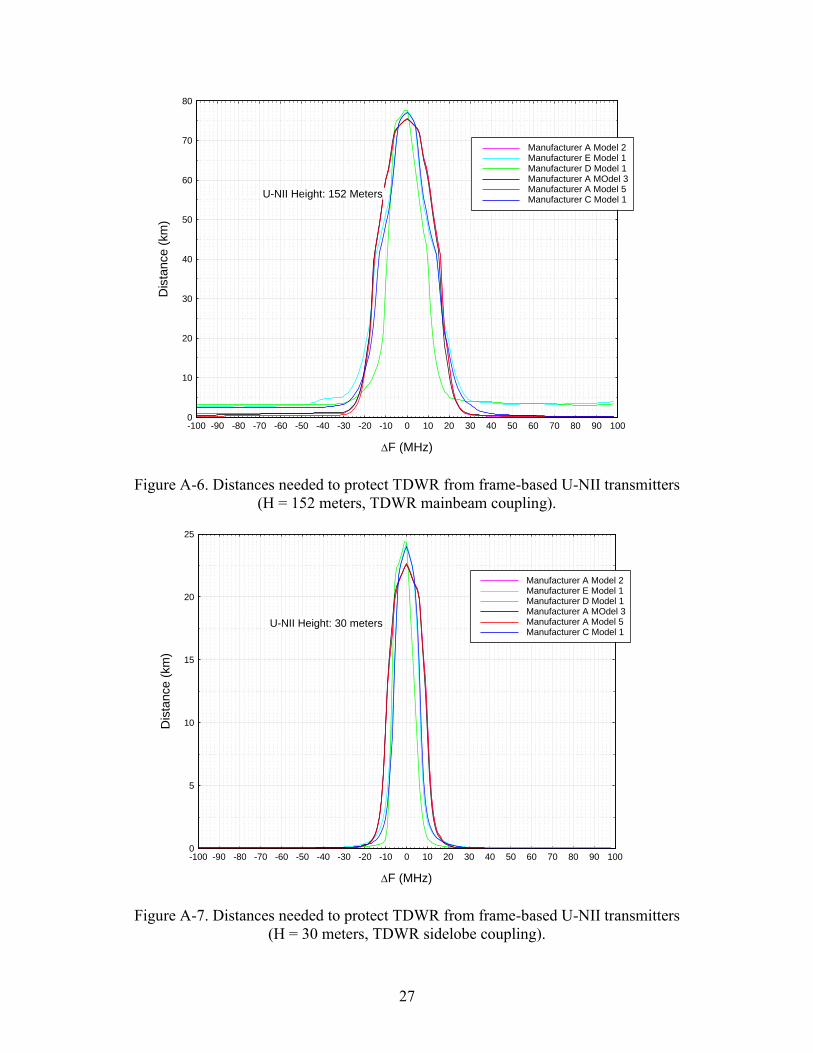
Figure A-2 shows that at 1 MHz the value is -12 dB and at 10 MHz the value is -76 dB, therefore the slope of the TDWR’s IF curve is about 64 dB per decade. Using these parameters, the TDWR receiver’s FDR versus the U-NII transmitters was calculated. The result is shown below in Figure A-3 for the frame-based U-NII transmitters, and Figure A-4 for 802.11-based U-NII transmitters. That FDR data was then used in the models to calculate the frequency-distance curves with the ITM propagation model. Since the U-NII emission bandwidth is greater than the TDWR 3-dB IF bandwidth, the on-tune FDR is non-zero; it varies as 10*log(bandwidth ratio).
Figure A-3. FDR for TDWR IF selectivity for frame-based U-NII transmitters.
Figure A-4. FDR for TDWR IF selectivity for 802.11-based U-NII transmitters.
0
10
20
30
40
50
60
70
80
90
100
-100 -90 -80 -70 -60 -50 -40 -30 -20 -10 0 10 20 30 40 50 60 70 80 90 100
Manufacturer A Model 2Manufacturer E Model 1Manufacturer D Model 1Manufacturer A Model 3Manufacturer A Model 5Manufacturer C Model 1
F (MHz)
FD
R (
dB
)
FDR for TDWR IF Selectivity versus Frame-based U-NII Transmitters
10
20
30
40
50
60
70
-100 -90 -80 -70 -60 -50 -40 -30 -20 -10 0 10 20 30 40 50 60 70 80 90 100
Manufacturer G Model 1 40MHz ModeManufacturer G Model 1 20MHz ModeManufacturer F Model 3Manufacturer F Model 2
F (MHz)
FD
R (
dB
)
FDR for TDWR IF Selectivity versus 802.11-based U-NII Transmitters
26
A.2.1 Frequency-Distance Curves for Frame-Based U-NII Systems
OSM calculated the frequency-distance separations for the TDWR receiver and the frame-based U-NII transmitters with the U-NII EIRP set to the maximum allowed level of +17 dBm.14 The results are shown in Figures A-5 and A-6 for TDWR mainbeam coupling with U-NII antenna heights of 304 and 152 meters. It is noted that not all U-NII devices transmit the maximum allowable EIRP. Figure A-7 shows the distances needed to protect a TDWR from a frame-based U-NII transmitter at an antenna height of 30 meters, via TDWR sidelobe coupling.
Figure A-5. Distances needed to protect TDWR from frame-based U-NII transmitters (H = 304 meters, TDWR mainbeam coupling).
14 Note that not all U-NII devices transmit the maximum allowable EIRP.
0
10
20
30
40
50
60
70
80
90
100
-100 -90 -80 -70 -60 -50 -40 -30 -20 -10 0 10 20 30 40 50 60 70 80 90 100
Manufacturer A Model 2Manufacturer E Model 1Manufacturer D Model 1Manufacturer A MOdel 3Manufacturer A Model 5Manufacturer C Model 1
U-NII Height: 304 Meters
F (MHz)
Dis
tance (
km
)
Distances to Protect TDWR from Frame-based U-NII Transmitters (304 Meters H)
27
Figure A-6. Distances needed to protect TDWR from frame-based U-NII transmitters (H = 152 meters, TDWR mainbeam coupling).
Figure A-7. Distances needed to protect TDWR from frame-based U-NII transmitters (H = 30 meters, TDWR sidelobe coupling).
0
10
20
30
40
50
60
70
80
-100 -90 -80 -70 -60 -50 -40 -30 -20 -10 0 10 20 30 40 50 60 70 80 90 100
Manufacturer A Model 2Manufacturer E Model 1Manufacturer D Model 1Manufacturer A MOdel 3Manufacturer A Model 5Manufacturer C Model 1
U-NII Height: 152 Meters
F (MHz)
Dis
tance (
km
)
Distances to Protect TDWR from Frame-based U-NII Transmitters (152 Meters H)
0
5
10
15
20
25
-100 -90 -80 -70 -60 -50 -40 -30 -20 -10 0 10 20 30 40 50 60 70 80 90 100
Manufacturer A Model 2Manufacturer E Model 1Manufacturer D Model 1Manufacturer A MOdel 3Manufacturer A Model 5Manufacturer C Model 1
U-NII Height: 30 meters
F (MHz)
Dis
tan
ce (
km
)
Distances to Protect TDWR from Frame-based U-NII Transmitters (30 meters H)
28
Figures A-5 and A-6 show that, with TDWR antenna main-beam coupling, the radar needs about ±30 MHz of frequency separation from the frame-based U-NII devices with a spatial distance of 5 to 10 km, depending on the U-NII device. For the on-frequency condition, the separation distance is about 95 km with a U-NII height of 305 meters and about 75 km for a U-NII height of 153 meters, both of which are typically beyond the line-of-sight distance between TDWR stations and U-NII devices.
Figure A-7 shows that with TDWR antenna sidelobe coupling the requirement is about ±30 MHz of frequency separation with a nominal spatial distance less than 1 km. For the on-frequency condition, the separation distance is about 24 km.
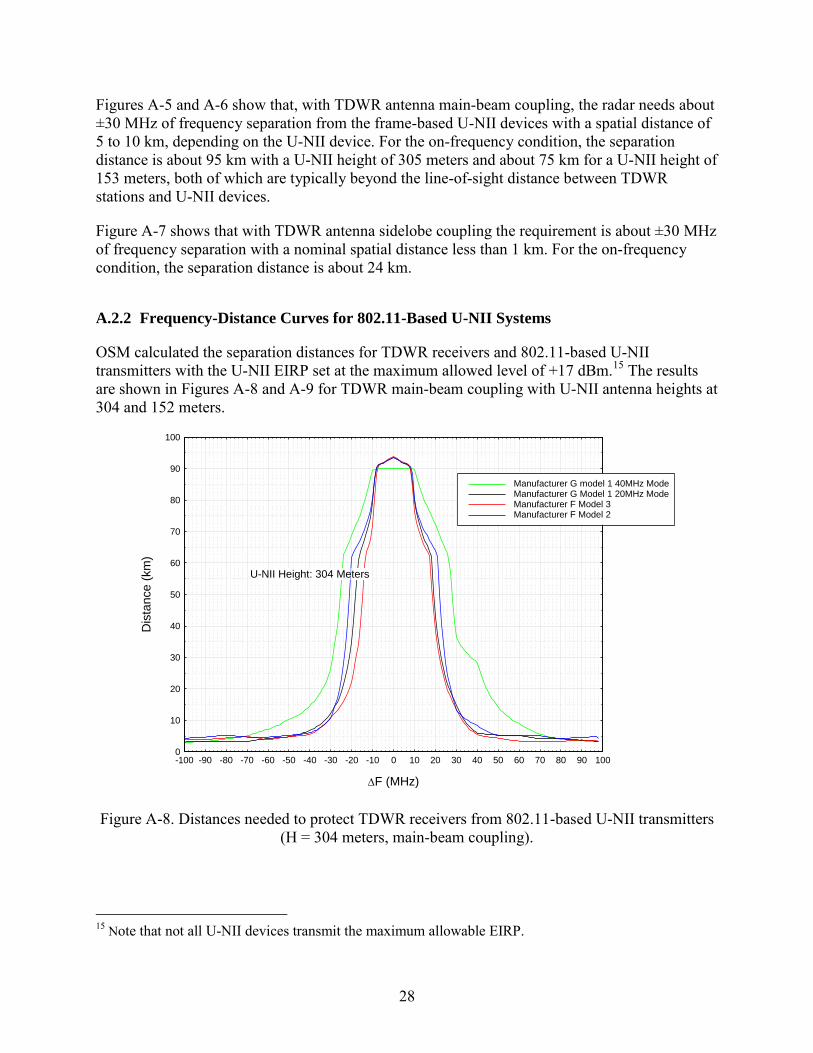
A.2.2 Frequency-Distance Curves for 802.11-Based U-NII Systems
OSM calculated the separation distances for TDWR receivers and 802.11-based U-NII transmitters with the U-NII EIRP set at the maximum allowed level of +17 dBm.15 The results are shown in Figures A-8 and A-9 for TDWR main-beam coupling with U-NII antenna heights at 304 and 152 meters.
Figure A-8. Distances needed to protect TDWR receivers from 802.11-based U-NII transmitters (H = 304 meters, main-beam coupling).
15 Note that not all U-NII devices transmit the maximum allowable EIRP.
0
10
20
30
40
50
60
70
80
90
100
-100 -90 -80 -70 -60 -50 -40 -30 -20 -10 0 10 20 30 40 50 60 70 80 90 100
Manufacturer G model 1 40MHz ModeManufacturer G Model 1 20MHz ModeManufacturer F Model 3Manufacturer F Model 2
U-NII Height: 304 Meters
F (MHz)
Dis
tan
ce (
km
)
Distances to Protect TDWR from 802.11-based U-NII Transmitters (304 Meters H)
29
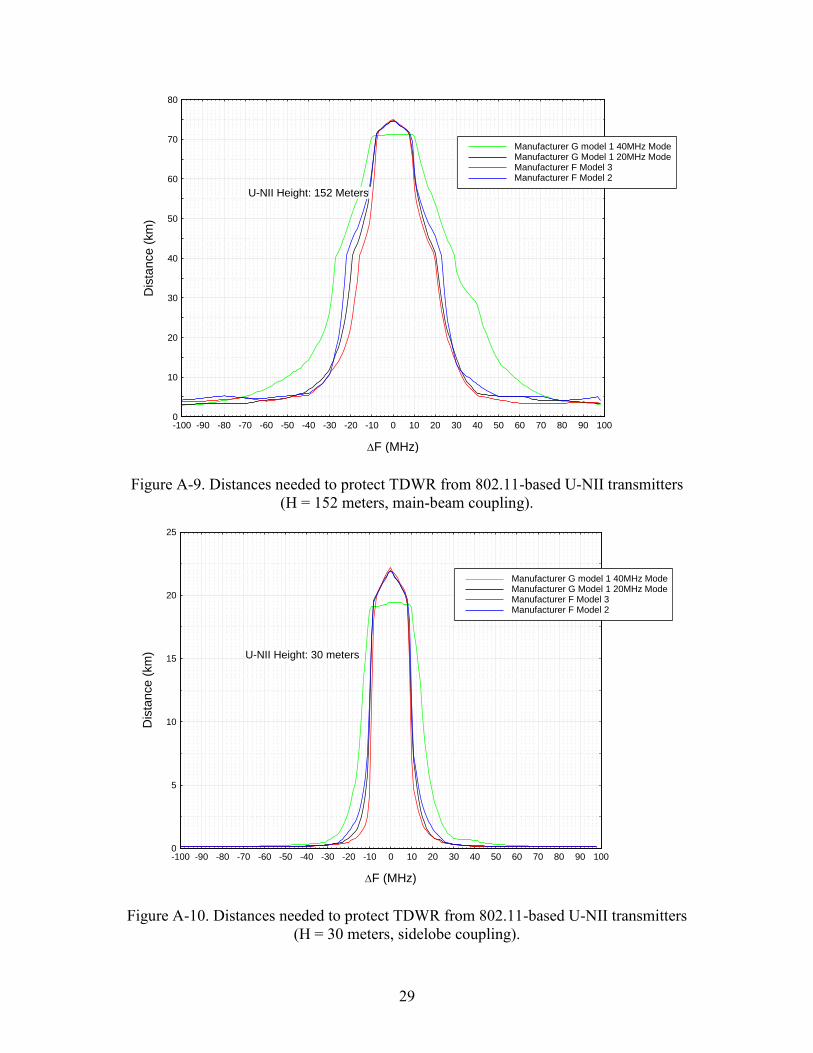
Figure A-9. Distances needed to protect TDWR from 802.11-based U-NII transmitters (H = 152 meters, main-beam coupling).
Figure A-10. Distances needed to protect TDWR from 802.11-based U-NII transmitters (H = 30 meters, sidelobe coupling).
0
10
20
30
40
50
60
70
80
-100 -90 -80 -70 -60 -50 -40 -30 -20 -10 0 10 20 30 40 50 60 70 80 90 100
Manufacturer G model 1 40MHz ModeManufacturer G Model 1 20MHz ModeManufacturer F Model 3Manufacturer F Model 2
U-NII Height: 152 Meters
F (MHz)
Dis
tance (
km
)
Distances to Protect TDWR from 802.11-based U-NII Transmitters (152 meters H)
0
5
10
15
20
25
-100 -90 -80 -70 -60 -50 -40 -30 -20 -10 0 10 20 30 40 50 60 70 80 90 100
Manufacturer G model 1 40MHz ModeManufacturer G Model 1 20MHz ModeManufacturer F Model 3Manufacturer F Model 2
U-NII Height: 30 meters
F (MHz)
Dis
tan
ce (
km
)
Distances to Protect TDWR from 802.11-based U-NII Transmitters (30 meters H)
30
Figures A-8 and A-9 show that, with main-beam coupling and ±30 MHz of frequency separation from the 20 MHz wide 802.11-based U-NII devices operating at an EIRP of +17 dBm, TDWRs need a protection distance of 11 km. For the 40 MHz wide 802.11 signal with a frequency separation of ±30 MHz the distance is 35 km. Note that since this 802.11 signal is not symmetrical, the lower side of its emission requires a protection distance of 26 km. That distance is reduced to 15 km at a frequency separation of 50 MHz above the center frequency and 10 km below the center frequency with a 50 MHz frequency separation.
As expected, the wider bandwidth of 40 MHz wide 802.11 signals results in greater separation distances when the devices are off-frequency. If the U-NII bandwidths were even wider (e.g., 80 and 160 MHz wide 802.11 channels), the separation distances will increase. Since the 802.11 devices have slower spectral roll-off than the frame-based devices (Figure 2) these results are expected.
For the on-frequency condition with a U-NII EIRP of +17 dBm, the separation distance is about 94 km for U-NII antenna heights of 304 meters and about 75 km for U-NII antenna heights of 152 meters, both of which are beyond the typical line-of-sight separation distance between TDWR stations and U-NII devices.
Figure A-10 shows that with TDWR antenna sidelobe coupling, the frequency separation requirement from the 20 MHz wide 802.11-based U-NII devices is about ±30 MHz with a spatial distance less than 1 km. For the case of the 40 MHz wide 802.11-based U-NII device, the required frequency separation is about ±40 MHz with a spatial separation distance of less than 1 km. For on-frequency condition, the separation distance is about 22.5 km for the 20 MHz wide 802.11 transmitters and about 18 km for the 40 MHz wide 802.11 transmitter.
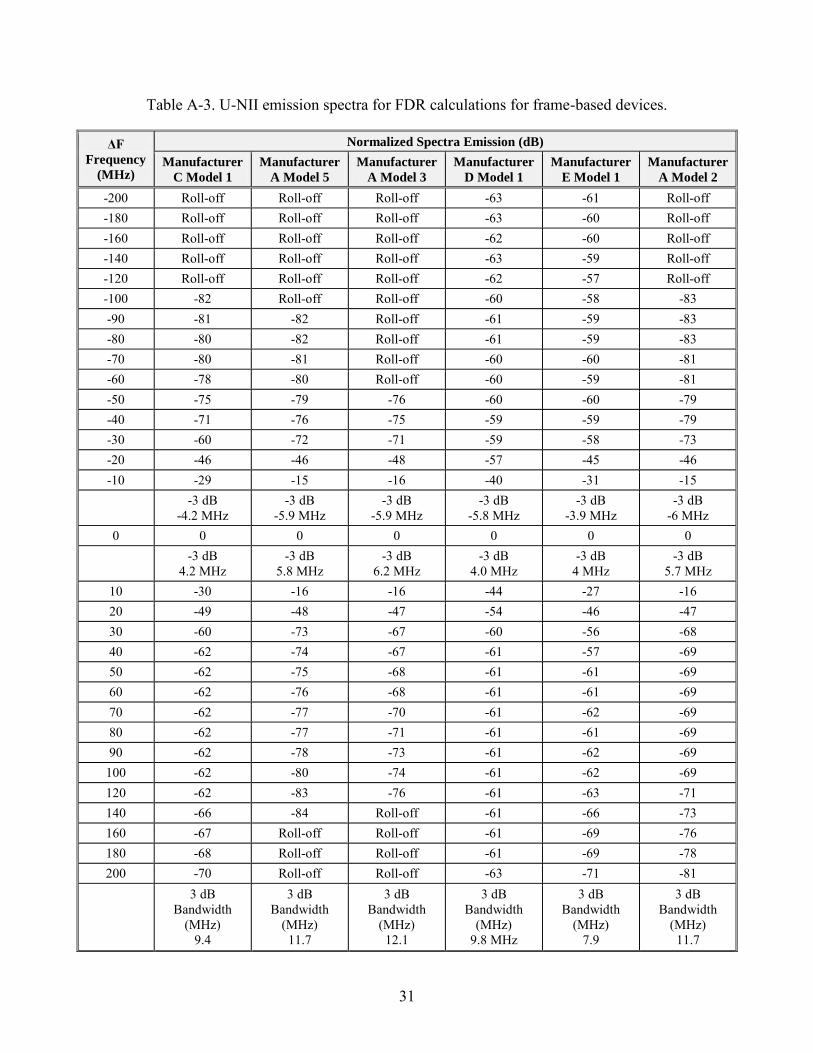
Tables A-3 and A-4 list the data points of U-NII emission spectra used for FDR calculations. The U-NII device emission spectra roll-off at 15 dB per decade when the value goes below the noise floor of the measurement system. A 15 dB per decade roll-off is typically used in calculations of solid-state transmitters. Where the fields contain data, the actual emission spectra level relative to the peak power is indicated.
31
Table A-3. U-NII emission spectra for FDR calculations for frame-based devices.
ΔF
Frequency
(MHz)
Normalized Spectra Emission (dB)
Manufacturer
C Model 1
Manufacturer
A Model 5
Manufacturer
A Model 3
Manufacturer
D Model 1
Manufacturer
E Model 1
Manufacturer
A Model 2
-200 Roll-off Roll-off Roll-off -63 -61 Roll-off -180 Roll-off Roll-off Roll-off -63 -60 Roll-off -160 Roll-off Roll-off Roll-off -62 -60 Roll-off -140 Roll-off Roll-off Roll-off -63 -59 Roll-off -120 Roll-off Roll-off Roll-off -62 -57 Roll-off -100 -82 Roll-off Roll-off -60 -58 -83 -90 -81 -82 Roll-off -61 -59 -83 -80 -80 -82 Roll-off -61 -59 -83 -70 -80 -81 Roll-off -60 -60 -81 -60 -78 -80 Roll-off -60 -59 -81 -50 -75 -79 -76 -60 -60 -79 -40 -71 -76 -75 -59 -59 -79 -30 -60 -72 -71 -59 -58 -73 -20 -46 -46 -48 -57 -45 -46 -10 -29 -15 -16 -40 -31 -15
-3 dB -4.2 MHz
-3 dB -5.9 MHz
-3 dB -5.9 MHz
-3 dB -5.8 MHz
-3 dB -3.9 MHz
-3 dB -6 MHz
0 0 0 0 0 0 0
-3 dB 4.2 MHz
-3 dB 5.8 MHz
-3 dB 6.2 MHz
-3 dB 4.0 MHz
-3 dB 4 MHz
-3 dB 5.7 MHz
10 -30 -16 -16 -44 -27 -16 20 -49 -48 -47 -54 -46 -47 30 -60 -73 -67 -60 -56 -68 40 -62 -74 -67 -61 -57 -69 50 -62 -75 -68 -61 -61 -69 60 -62 -76 -68 -61 -61 -69 70 -62 -77 -70 -61 -62 -69 80 -62 -77 -71 -61 -61 -69 90 -62 -78 -73 -61 -62 -69
100 -62 -80 -74 -61 -62 -69 120 -62 -83 -76 -61 -63 -71 140 -66 -84 Roll-off -61 -66 -73 160 -67 Roll-off Roll-off -61 -69 -76 180 -68 Roll-off Roll-off -61 -69 -78 200 -70 Roll-off Roll-off -63 -71 -81
3 dB Bandwidth
(MHz) 9.4
3 dB Bandwidth
(MHz) 11.7
3 dB Bandwidth
(MHz) 12.1
3 dB Bandwidth
(MHz) 9.8 MHz
3 dB Bandwidth
(MHz) 7.9
3 dB Bandwidth
(MHz) 11.7
32
Table A-4. U-NII emission spectra for FDR calculations for frame-based devices.
ΔF
Frequency
(MHz)
Normalized Spectra Emission (dB) Manufacturer
F Model 2
Manufacturer
F Model 3
Manufacturer G Model 1
(20MHz) mode
Manufacturer G Model
1 (40MHz) mode
-200 -54 -57 -59 -56 -180 -54 -57 -58 -56 -160 -54 -57 -58 -56 -140 -53 -57 -58 -56 -120 -54 -57 -57 -56 -100 -53 -57 -57 -54 -90 -54 -56 -56 -53 -80 -55 -57 -55 -52 -70 -53 -57 -55 -49 -60 -53 -57 -53 -45 -50 -53 -55 -53 -41 -40 -49 -53 -52 -35 -30 -45 -45 -44 -33 -20 -30 -36 -35 -18 -10 -15 -19 -15 -0.1
-3 dB -8.8 MHz
-3 dB -8.1 MHz
-3 dB -8.2 MHz
-3 dB -17.5 MHz
0 0 0 0 0
-3 dB 8.2 MHz
-3 dB 7.6 MHz
-3 dB 8.3 MHz
-3 dB 17.6 MHz
10 -15 -25 -17 -0.5 20 -32 -41 -37 -22 30 -47 -47 -46 -36 40 -52 -53 -51 -41 50 -53 -54 -54 -44 60 -54 -56 -55 -47 70 -54 -54 -57 -50 80 -53 -55 -57 -52 90 -54 -56 -57 -54
100 -55 -56 -58 -55 120 -55 -57 -59 -56 140 -56 -58 -61 -57 160 -55 -56 -61 -58 180 -57 -57 -62 -58 200 -57 -58 -64 -58
3 dB Bandwidth
(MHz) 17
3 dB Bandwidth
(MHz) 15.7
3 dB Bandwidth
(MHz) 16.5
3 dB Bandwidth
(MHz) 35.1
FORM NTIA-29 U.S. DEPARTMENT OF COMMERCE (4-80) NAT’L. TELECOMMUNICATIONS AND INFORMATION ADMINISTRATION
BIBLIOGRAPHIC DATA SHEET
1. PUBLICATION NO.
TR-12-486 2. Government Accession No.
3. Recipient’s Accession No.
4. TITLE AND SUBTITLE
Case Study: Investigation of Interference into 5 GHz Weather Radars from Unlicensed National Information Infrastructure Devices, Part III
5. Publication Date
June 2012 6. Performing Organization Code
ITS.M 7. AUTHOR(S)
John E. Carroll, Geoffrey A. Sanders, Frank H. Sanders, and Robert L. Sole 9. Project/Task/Work Unit No.
3152012-300 8. PERFORMING ORGANIZATION NAME AND ADDRESS
Institute for Telecommunication Sciences National Telecommunications & Information Administration U.S. Department of Commerce 325 Broadway Boulder, CO 80305
10. Contract/Grant Number.
11. Sponsoring Organization Name and Address
National Telecommunications & Information Administration Herbert C. Hoover Building 14th & Constitution Ave., NW Washington, DC 20230
12. Type of Report and Period Covered
14. SUPPLEMENTARY NOTES
15. ABSTRACT (A 200-word or less factual summary of most significant information. If document includes a significant bibliography or literature survey, mention it here.)
In early 2009, the Federal Aviation Administration (FAA) became aware of interference to Terminal Doppler Weather Radars (TDWRs) that operate in the 5600–5650 MHz band and provide measurements of gust fronts, windshear, microbursts, and other weather hazards for improved safety of operations in and around airports. National Telecommunications and Information Administration (NTIA) engineers, with assistance from FAA engineers, determined the interference to be caused by some unlicensed national information infrastructure (U-NII) dynamic frequency selection (DFS) devices operating in the same frequency band as TDWR systems. These devices use DFS technology that is supposed to detect the presence of nearby co-channel radars and change operating frequencies to prevent interference to those radars. This report, the third of a three-part series, describes some U-NII emission spectra and introduces an additional set of TDWR test waveforms that the Federal Communications Commission (FCC) may use during DFS U-NII device testing. This report also explores the distances and geometries at which interference to TDWRs from U-NII devices is likely to occur.
16. Key Words (Alphabetical order, separated by semicolons)
dynamic frequency selection; electromagnetic compatibility; radar interference; radar performance degradation; RF interference; spectrum sharing technology; terminal Doppler weather radar; unlicensed national information infrastructure 17. AVAILABILITY STATEMENT
UNLIMITED.
FOR OFFICIAL DISTRIBUTION.
18. Security Class. (This report)
Unclassified
20. Number of pages
46
19. Security Class. (This page)
Unclassified
21. Price:
NTIA FORMAL PUBLICATION SERIES
NTIA MONOGRAPH (MG) A scholarly, professionally oriented publication dealing with state-of-the-art research or an authoritative treatment of a broad area. Expected to have long-lasting value.
NTIA SPECIAL PUBLICATION (SP) Conference proceedings, bibliographies, selected speeches, course and instructional materials, directories, and major studies mandated by Congress.
NTIA REPORT (TR) Important contributions to existing knowledge of less breadth than a monograph, such as results of completed projects and major activities. Subsets of this series include:
NTIA RESTRICTED REPORT (RR) Contributions that are limited in distribution because of national security classification or Departmental constraints.
NTIA CONTRACTOR REPORT (CR) Information generated under an NTIA contract or grant, written by the contractor, and considered an important contribution to existing knowledge.
JOINT NTIA/OTHER-AGENCY REPORT (JR) This report receives both local NTIA and other agency review. Both agencies’ logos and report series numbering appear on the cover.
NTIA SOFTWARE & DATA PRODUCTS (SD) Software such as programs, test data, and sound/video files. This series can be used to transfer technology to U.S. industry.
NTIA HANDBOOK (HB) Information pertaining to technical procedures, reference and data guides, and formal user's manuals that are expected to be pertinent for a long time.
NTIA TECHNICAL MEMORANDUM (TM) Technical information typically of less breadth than an NTIA Report. The series includes data, preliminary project results, and information for a specific, limited audience.
For information about NTIA publications, contact the NTIA/ITS Technical Publications Office at 325 Broadway, Boulder, CO, 80305 Tel. (303) 497-3572 or e-mail [email protected].
This report is for sale by the National Technical Information Service, 5285 Port Royal Road, Springfield, VA 22161,Tel. (800) 553-6847.
Related Documents