An Analysis of the Technical and Economic Potential for Mid-Scale Distributed Wind December 2007 – October 31, 2008 R. Kwartin, A. Wolfrum, K. Granfield, A. Kagel, and A. Appleton ICF International Fairfax, Virginia Subcontract Report NREL/SR-500-44280 December 2008

Welcome message from author
This document is posted to help you gain knowledge. Please leave a comment to let me know what you think about it! Share it to your friends and learn new things together.
Transcript

An Analysis of the Technical and Economic Potential for Mid-Scale Distributed Wind December 2007 – October 31, 2008 R. Kwartin, A. Wolfrum, K. Granfield, A. Kagel, and A. Appleton ICF International Fairfax, Virginia
Subcontract Report NREL/SR-500-44280 December 2008

An Analysis of the Technical and Economic Potential for Mid-Scale Distributed Wind December 2007 – October 31, 2008 R. Kwartin, A. Wolfrum, K. Granfield, A. Kagel, and A. Appleton ICF International Fairfax, Virginia
NREL Technical Monitor: T. Forsyth Prepared under Subcontract No. AAM-8-89001-01
Subcontract Report NREL/SR-500-44280 December 2008
National Renewable Energy Laboratory1617 Cole Boulevard, Golden, Colorado 80401-3393 303-275-3000 • www.nrel.gov
NREL is a national laboratory of the U.S. Department of Energy Office of Energy Efficiency and Renewable Energy Operated by the Alliance for Sustainable Energy, LLC
Contract No. DE-AC36-08-GO28308

NOTICE
This report was prepared as an account of work sponsored by an agency of the United States government. Neither the United States government nor any agency thereof, nor any of their employees, makes any warranty, express or implied, or assumes any legal liability or responsibility for the accuracy, completeness, or usefulness of any information, apparatus, product, or process disclosed, or represents that its use would not infringe privately owned rights. Reference herein to any specific commercial product, process, or service by trade name, trademark, manufacturer, or otherwise does not necessarily constitute or imply its endorsement, recommendation, or favoring by the United States government or any agency thereof. The views and opinions of authors expressed herein do not necessarily state or reflect those of the United States government or any agency thereof.
Available electronically at http://www.osti.gov/bridge
Available for a processing fee to U.S. Department of Energy and its contractors, in paper, from:
U.S. Department of Energy Office of Scientific and Technical Information P.O. Box 62 Oak Ridge, TN 37831-0062 phone: 865.576.8401 fax: 865.576.5728 email: mailto:[email protected]
Available for sale to the public, in paper, from: U.S. Department of Commerce National Technical Information Service 5285 Port Royal Road Springfield, VA 22161 phone: 800.553.6847 fax: 703.605.6900 email: [email protected] online ordering: http://www.ntis.gov/ordering.htm
This publication received minimal editorial review at NREL
Printed on paper containing at least 50% wastepaper, including 20% postconsumer waste

Acknowledgments
The authors wish to thank Dennis Lin of the U.S. Department of Energy Wind and Hydropower Technologies Program, and Trudy Forsyth and Jim Green, both of the National Renewable Energy Laboratory, for their invaluable support, review, and encouragement throughout the development of this analysis. The authors also thank our subcontractors: Heather Rhoads-Weaver and Alice Orrell, both with eFormative Options, LLC; and Tom Michelman, with Boreal Renewable Energy. In addition, the team wishes to thank the following individuals for volunteering their time and expertise to provide information for this analysis.
• Gregory Bakeman, a former employee of McKenzie Bay / WindStor Power Company
• Jon Bonk-Vasco of the California Center for Sustainable Energy
• Al Dickout of Americas Wind Energy
• Steve Drouilhet of Sustainable Automation
• Aaron Godwin of The Renaissance Group
• Joseph Graham of Blue Sky Wind
• Bill Haas of the Illinois Department of Commerce and Economic Opportunity
• Jeff Haase of the Minnesota Department of Commerce’s State Energy Office
• Paul Helgeson of the Public Service Commission of Wisconsin
• Paul Johnson of Minnesota Power
• Dale Jones of Enertech
• Dan Juhl of Danman & Associates
• Larry Miles of The Wind Turbine Company
• Robert Munsterman, Superintendent of Schools for Laq qui Parle Valley High School
• Bob Ordon of Wind Turbine Warehouse
• Randy Parry of Miner County Community Revitalization of South Dakota
• John Pearce, Iowa Utilities Board
• Brent Petrie of the Alaska Electric Village Co-Op
• Tony Rogers of Rosebud Tribal Utility Commission
• Kevin Schulte of Sustainable Energy Development
• Dave Tooze of the City of Portland
• Tony Usibelli of the Washington State Energy Office
• Tom Wind, of Wind Utility Consulting
iii

In addition to the authors, many other ICF employees participated in this analysis. Claire Cowan and Matt Stanberry led the interview process. Steve Heinrich and Sharon Korchowsky led the GIS phase of the analysis under the general direction of Kevin Wright. David Hobson and Nick Yohannes managed the Oracle databases and analytics. Aleksandra Simic developed a SAS automation of the financial analysis. Philip Groth developed the automation for analyzing the application of capped incentives.
iv

List of Acronyms
C-BED Community-Based Economic Development CBECS EIA Commercial Buildings Electricity
Consumption Survey CEPD Commercial Energy Profile Database CIP commercial, industrial, and public facilities CREBs Clean Renewable Energy Bonds CW community wind D&B Dun & Bradstreet D-U-N-S Data Universal Numbering System DSCR debt service coverage ratio EIA Energy Information Administration of the
U.S. Department of Energy FAA Federal Aviation Administration FERC Federal Energy Regulatory Commission FRCC Florida Reliability Coordinating Council GIS geographic information system GL Germanischer Lloyd HSIP Homeland Security Infrastructure Protection HVAC heating, ventilating, and air conditioning IEC International Electrotechnical Commission IEEE Institute for Electrical and Electronics Engineers IOU investor-owned utility ISO independent system operator MACRS Modified Accelerated Cost-Recovery System MAIN Mid-America Interconnected Network MCPP Mid-Continent Area Power Pool MECS EIA Manufacturing Electricity Consumption Survey MIPD Major Industrial Plant Database NAICS North American Industry Classification System NEPOOL New England Power Pool NERC North American Electric Reliability Corporation Non IOU non-investor owned utility NPV net present value O&M operations and maintenance PTC Production Tax Credit R&D research and development RDF Renewable Development Fund REC renewable energy certificate REPI Renewable Energy Production Incentive RFP request for proposal RPS Renewable Portfolio Standard RTO regional transmission organizations SBA Small Business Administration SCADA supervisory control and data acquisition
v

SIC Standard Industrial Classification SPP Southwest Power Pool UL Underwriters Laboratories USDA United States Department of Agriculture WECC Western Electricity Coordinating Council WPC wind power class
vi

Executive Summary
This report examines the status, restrainers, drivers, and estimated development potential of mid-scale (10 kW to 5000 kW) distributed wind projects. This segment of the wind market has not enjoyed the same growth that central-station wind has experienced. The purpose of this report is to analyze why, and to assess the market potential for this technology under current market and policy conditions.
As discussed in section 2, one of the most significant barriers to the development of distributed wind is a general scarcity of turbine choices and turbine inventory available for purchase. Most turbine manufacturers have scaled back their involvement in the mid-scale market segments in favor of larger turbines suitable for large, central-station wind farms. Those distributed-scale turbines that are available are often relatively expensive (on a $/kW basis), hard to order in single units or small lots, and suffer from long delivery delays.
Section 3 discusses various other factors—both positive and negative—that affect the viability of distributed wind. In addition to the product scarcity described in section 2, distributed wind is challenged by relatively poor productivity (compared with more modern large turbines), siting issues, burdensome interconnection rules, aesthetic concerns, and fragmented state rules regarding net metering. Several other factors favor distributed wind: areas of high and rising retail electricity prices, increasingly favorable public policies, and greater community interest in the environmental and economic benefits of renewable energy.
As examined in section 4, the study evaluated the economic potential for distributed wind in the contiguous United States, excluding Alaska and Hawaii. The analysis began with a GIS screening process to eliminate areas that are technically impractical for distributed wind. Sites were eliminated in areas where:
• Elevation was too high;
• Slope was too steep;
• Population density was too great;
• Wind Power Class was less than 2; and
• Areas legally excluded from wind-power development, such as national parks. After screening out ineligible sites, more than 3.6 million surviving sites were evaluated to determine whether distributed wind would be financially feasible. Certain customer types were excluded from the study, such as agricultural, construction companies, and military facilities, because they lacked data necessary for the analysis. The financial model considered:
• Wind resources;
• Wholesale and retail power prices;
• Renewable Energy Credit (REC) prices;
• Customer type (community wind, commercial, industrial, or public facility);
vii

• Project size;
• Turbine technical and financial characteristics;
• Onsite and offsite energy use; and
• Incentives. The results varied significantly by customer class. Overall, the study showed that 67,100 out of the 3,611,655 sites/areas that were analyzed for economic viability yielded a positive net present value under current market conditions and policies and including all applicable state and federal incentives.
To assess the potential of new technology, two virtual wind turbines—the NREL 250 and NREL 500—were included in the analysis. These virtual turbines were compared to existing 250 kW and 500 kW turbines. Overall, the study showed that 204,677 sites analyzed had positive net present values with the virtual turbines compared with 10,407 economically successful projects with existing 250 kW and 500 kW turbines. These numbers do not include the application of capped state and federal incentives.
The following crucial changes could expand distributed wind development into the future.
• Improvements in technology;
• Reductions in cost;
• Greater productivity at lower wind speeds; and
• Greater policy support.
viii

Table of Contents
List of Figures ............................................................................................................. xii List of Tables .............................................................................................................. xiii 1 Introduction .............................................................................................................. 1 2 Status of the Mid-Scale Turbine Market ................................................................. 1
2.1 New Turbine Availability ....................................................................................................1 2.2 Remanufacturing Potential...................................................................................................3 2.3 General Factors Regarding Wind Turbine Value ................................................................3
2.3.1 Turbine Availability ....................................................................................................3 2.3.2 Turbine Costs ..............................................................................................................4 2.3.3 Installation Costs .........................................................................................................4 2.3.4 Warranty .....................................................................................................................4 2.3.5 Availability of Technicians .........................................................................................4 2.3.6 Availability of Spare Parts ..........................................................................................4 2.3.7 Reliability ....................................................................................................................4 2.3.8 Noise ...........................................................................................................................5 2.3.9 Certification ................................................................................................................5 2.3.10 Extreme Weather Survivability .................................................................................5 2.3.11 Avian .........................................................................................................................5 2.3.12 Aesthetics ..................................................................................................................5
3 Barriers to and Drivers of Mid-Scale Turbine Distributed Wind Projects ........... 5 3.1 Barriers to Mid-Scale Turbine Distributed Wind Projects ..................................................6
3.1.1 Challenging Project Financials ...................................................................................6 3.1.1.1 Investment Cost ............................................................................................. 6
3.1.1.1.1 Turbine Costs ........................................................................................ 8 3.1.1.1.2 Limited Turbine Selection .................................................................... 8 3.1.1.1.3 Component Cost.................................................................................... 9 3.1.1.1.4 Transportation Costs ............................................................................. 9 3.1.1.1.5 Currency Exchange Rates ..................................................................... 9 3.1.1.1.6 Installation Costs ................................................................................. 10
3.1.1.2 Net Revenue ................................................................................................. 10 3.1.1.2.1 Gross Revenue .................................................................................... 10 3.1.1.2.2 Gross Expenses ................................................................................... 14
3.1.2 Turbine Shortages .....................................................................................................15 3.1.3 Lack of Regulatory Support ......................................................................................15 3.1.4 Utility-Based Issues ..................................................................................................17 3.1.5 Siting .........................................................................................................................19 3.1.6 Technical Turbine Issues ..........................................................................................20 3.1.7 Concerns Regarding Visual Impacts and Noise ........................................................21 3.1.8 Lack of Public Awareness ........................................................................................22 3.1.9 Environmental (Avian) Concerns .............................................................................22 3.1.10 Project Complexity and Timing ..............................................................................22 3.1.11 Other Barriers..........................................................................................................23
ix

3.2 Drivers for Mid-Scale Turbine Distributed Wind Projects ................................................23 3.2.1 Policies that Enhance Financial Returns ...................................................................23 3.2.2 Local Economic Development ..................................................................................26 3.2.3 Educational Value .....................................................................................................27 3.2.4 Environmental Benefits ............................................................................................27
4 Market Potential Estimation for Mid-Scale Wind ................................................. 27 4.1 Summary of Methodology .................................................................................................28 4.2 Financial Modeling ............................................................................................................28
4.2.1 Wind Power Class .....................................................................................................29 4.2.2 Wholesale Power Price .............................................................................................29 4.2.3 Customer Type ..........................................................................................................30 4.2.4 Retail Electric Rate ...................................................................................................30 4.2.5 Net Metering .............................................................................................................32 4.2.6 Project Size ...............................................................................................................32
4.2.6.1 Supply Side .................................................................................................. 32 4.2.6.2 Demand Side ................................................................................................ 32
4.2.7 Onsite Energy Use ....................................................................................................34 4.2.8 Project Financing ......................................................................................................35
4.2.8.1 Discount Rate ............................................................................................... 35 4.2.8.2 Project Ownership and Capital Structure ..................................................... 35
4.2.8.2.1 Tax Depreciation Schedule ................................................................. 35 4.2.8.2.2 Renewable Energy Certificate Value .................................................. 35 4.2.8.2.3 Federal Government Incentives .......................................................... 36 4.2.8.2.4 State Government Incentives .............................................................. 36
4.2.8.3 Summary of the Financial Analysis ............................................................. 38 4.3 Preparation of Real-World Data for Comparison to the Financial Model .........................38
4.3.1 Preparing the Data by Customer Type ......................................................................38 4.3.1.1 Commercial, Industrial, and Public Facilities .............................................. 38 4.3.1.2 Community Wind......................................................................................... 39
4.3.2 Geographic Information System Analysis ................................................................39 4.3.2.1 Elevation ...................................................................................................... 39 4.3.2.2 Slope ............................................................................................................ 39 4.3.2.3 Site Size ....................................................................................................... 40
4.3.2.3.1 Developing a Site-Size Proxy ............................................................. 40 4.3.2.3.2 Screening for Site Size ........................................................................ 40
4.3.2.4 Wind Resource ............................................................................................. 41 4.3.2.5 Excluded Lands ............................................................................................ 42 4.3.2.6 Assigning Electric Power Company and Wholesale Power Region ............ 43
4.3.3 Analyzing Surviving Sites ........................................................................................44 4.3.3.1 Using Annual Electricity Consumption Data to Analyze Turbines for Commercial, Industrial, and Public Facility Customers ............................................. 44 4.3.3.2 Analyzing Turbines for Community Wind .................................................. 45
4.3.4 Assigning Additional Characteristics to Surviving Sites ..........................................46 4.3.4.1 Retail Electric Rates and Wholesale Power Prices ...................................... 46 4.3.4.2 Presence and Level of Net Metering ............................................................ 46
x

4.3.5 Comparison of Real-World Data to Financial Model ...............................................48 4.3.5.1 Federal Incentives ........................................................................................ 48
4.3.5.1.1 Clean Renewable Energy Bonds ......................................................... 48 4.3.5.1.2 Renewable Energy Production Incentive ............................................ 48 4.3.5.1.3 U.S. Department of Agriculture 9006 Grants ..................................... 49
4.3.5.2 State Incentives ............................................................................................ 49 4.4 Results and Analysis ..........................................................................................................50
4.4.1 Discussion .................................................................................................................54 4.4.1.1 Commercial, Industrial, and Public Facilities Analysis Details .................. 54 4.4.1.2 Commercial, Industrial, and Public Facilities Results ................................. 55
4.4.2 Community Wind......................................................................................................56 4.4.3 Model Limitations .....................................................................................................56
4.4.3.1 Applying Utility-Level Factors Statewide ................................................... 56 4.4.3.2 Sensitivity Analysis ..................................................................................... 56 4.4.3.3 Debt Service Coverage Ratio ....................................................................... 57
4.4.4. Data Limitations and Areas of Uncertainty .............................................................57 4.4.5 Technology Implications ..........................................................................................57
4.5 New Technology Opportunities .........................................................................................57 4.5.1 Assumptions ..............................................................................................................58 4.5.2 Discussion .................................................................................................................60
4.6 Conclusions and Implications ............................................................................................62 5 References ............................................................................................................. 63 Appendix A. State and Utility Net-Metering Rules and Programs ........................... 69 Appendix B. State Incentives Tables and Assumptions .......................................... 79
Incentives Omitted ...................................................................................................................87 General Assumptions ...............................................................................................................87 Application Rules for Incentives .............................................................................................87 Simplifying Assumptions.........................................................................................................88
Appendix C. Kilowatt Potential Tables by State ....................................................... 89 Appendix D. Economically Successful Projects Incorporating Uncapped
Incentives ............................................................................................................... 92
xi

List of Figures
Figure 1. Installed wind project costs over time (NREL 2007) ...................................................... 7 Figure 2. Reported U.S. wind turbine transaction prices over time (NREL 2007)......................... 7 Figure 3. Size distribution of number of turbines over time (NREL 2007) .................................... 9 Figure 4. United States average retail price of electricity (¢/kWh) to ultimate customers for
commercial and industrial sectors, 1993–2006 (EIA 2007a) .................................................... 11 Figure 5. Average retail price of electricity (¢/kWh) to ultimate customers for commercial and
industrial sectors in Rhode Island, 1990–2005 (EIA 2006c) .................................................... 12 Figure 6. Average retail price of electricity (¢/kWh) to ultimate customers for commercial and
industrial sectors in Texas, 1990–2005 (EIA 2006c) ................................................................ 12 Figure 7. EIA wholesale generation price forecast, by power pool, nominal dollars (EIA 2007b)
................................................................................................................................................... 30 Figure 8. United States population density (ICF International 2008) ........................................... 41 Figure 9. United States wind resource by wind power class (ICF International 2008) ................ 42 Figure 10. Excluded and analyzed lands (ICF International 2008) .............................................. 43 Figure 11. Simplified assignment of states to wholesale power regions (ICF International 2008)
................................................................................................................................................... 44 Figure 12. Commercial, industrial, and public facility winners (ICF International 2008) ........... 51 Figure 13. Western community wind winners (ICF International 2008) ...................................... 52 Figure 14. Eastern community wind winners (ICF International 2008) ....................................... 53 Figure 15. NREL turbine winners (ICF International 2008) ........................................................ 61 Figure 16. NREL turbine winners compared to current commercial, industrial, and public facility
winners (ICF International 2008) .............................................................................................. 62
xii

xiii
List of Tables
Table 1. Available New Mid-Scale (100 kW to 500 kW) Wind Turbines ..................................... 2 Table 2. Remanufacturers of Mid-Scale Wind Turbines ................................................................ 3 Table 3. Net Annual Electricity Production (kWh) in the First Year of Operation by Project Size
and by WPC .............................................................................................................................. 33 Table 4. Installed Costs in Relation to Turbine and Project Sizes ................................................ 33 Table 5. Annual Ongoing Expenses by Customer Type ............................................................... 33 Table 6. National and State-Specific REC Adder Values............................................................. 36 Table 7. Project Financing Assumptions by Customer Type ....................................................... 37 Table 8. Elevation Exclusions by State......................................................................................... 39 Table 9. Distribution of Land Area in the Contiguous United States by WPC ............................ 41 Table 10. Maximum Capacity Allowed to Net Meter by State and Customer Type .................... 46 Table 11. Sequential Attrition Prior to Comparison to the Financial Analysis ............................ 48 Table 12. Winners by Customer Type and Analysis Performed .................................................. 51 Table 13. Total Uncapped Winning Turbines by Turbine Size .................................................... 54 Table 14. Total Capped Winning Turbines by Turbine Size ........................................................ 54 Table 15. NREL 250 Compared ................................................................................................... 58 Table 16. NREL 500 Compared ................................................................................................... 58 Table 17. Net Annual Electricity Production (kWh) in the First Year of Operation by WPC and
by Project Size for NREL Turbines .......................................................................................... 58 Table 18. Installed NREL Turbine Costs in Relation to Turbine and Project Sizes ..................... 59 Table 19. Annual NREL Turbine Ongoing Expenses .................................................................. 59 Table 20. NREL Turbine Cost Comparison ................................................................................. 59 Table 21. NREL Turbine Annual kWh—First Year Comparison ................................................ 60 Table 22. NREL Turbine Capacity Factor Comparison ............................................................... 60 Table 23. Change in Capacity Factors .......................................................................................... 60 Table 24. Total Winners by NREL Turbine ................................................................................. 60 Table A-1. Utility Net-Metering Rules and Programs by State .................................................... 69 Table B-1. Capacity Incentives by State and Customer Type ...................................................... 79 Table B-2. Cost Incentives by State and Customer Type ............................................................. 81 Table B-3. Production Incentives by State and Customer Type ................................................... 83 Table B-4. Property Tax Incentives by State and Customer Type ............................................... 84 Table B-5. Sales Tax Incentives by State and Customer Type ..................................................... 86 Table C-1. Total Kilowatts per State, Community Wind Customer Class* ................................. 89 Table C-2. Total Kilowatts per State, CIP Customer Class .......................................................... 90 Table C-3. Total Kilowatts per State, NREL Turbines ................................................................. 91 Table D-1. Economically Successful Commercial, Industrial, and Public Facility Projects
Incorporating Uncapped Incentives .......................................................................................... 92 Table D-2. Economically Successful Commercial, Industrial, and Public Facility Projects
Incorporating Capped Incentives .............................................................................................. 94 Table D-3. Economically Successful Community Wind Projects Incorporating Capped and
Uncapped Incentives ................................................................................................................. 95 Table D-4. Economically Successful Projects Incorporating Uncapped Incentives—NREL
Turbines in Commercial, Industrial, and Public Facility .......................................................... 96

1 Introduction
Wind technology has expanded significantly in recent years. Policy makers and the public recognize wind energy as a clean, zero-carbon emitting energy source that drives local economic development. Wind energy is indigenous, diversified, and available for development across much of the United States. Rising concerns about climate change have engendered policies supportive of renewable energy generally—and wind specifically—over the past decade.
Distributed wind energy, however, has not enjoyed the same rapid growth as large, central-station wind energy. This partially is due to the fundamental technical and economic challenges confronting distributed energy resources of any kind, such as poor scale economies and siting difficulties. These challenges are exacerbated by the explosive growth of the large wind market—as large wind has grown, manufacturer and policy maker attention increasingly has shifted towards the central-station paradigm, leaving distributed wind as a comparative backwater.
This report examines the present state of the distributed wind market and the forces that shape distributed wind’s prospects. Uniquely, the report estimates the technical and market potential for distributed wind in the contiguous United States. This analysis indicates that there is a large potential market for distributed wind—a market that today depends on public policy support, and one that can grow with greater support and improvements in technology. The harnessing of this potential market, and the benefits that it would bring, depend on the concerted efforts of manufacturers, policy makers, and site hosts who see the value in developing this clean, domestic and distributed resource.
2 Status of the Mid-Scale Turbine Market
This section examines the commercial availability of new and remanufactured turbines in the mid-scale market segment (100 kW to 1,500 kW nameplate capacity for the purposes of this report). Accompanying the analysis is a discussion of the various factors affecting the value of wind turbines, such as price, warranty, and technician availability. The information presented in this section was collected through a literature review and from telephone interviews with several wind turbine manufacturers, remanufacturers, and developers.
2.1 New Turbine Availability In the distributed wind energy industry, it is widely noted that one of the largest impediments to the industry’s growth is a lack of available turbines in the 100 kW to 1,500 kW range. Table 1 presents a list of the current commercially available mid-scale wind turbine models. It is important to note that the table is a refined list that contains only models available for distributed wind energy applications. Information on other turbine models can be found, but research indicates that many of these models no longer are available (such as Suzlon’s S33, 600 kW, and 950 kW models), are not suitable for the United States (for example Gamesa’s G52-850 and G58-850 only operate at 50 Hz), or are sold in such a way that they are simply unavailable for distributed wind applications (for Fuhrländer to even consider producing its FL 100 and FL 250 turbines, for example, it requires minimum orders of 10 turbines) (Schulte 2007, Graham 2007). Other models (e.g., McKenzie Bay’s WindStor, The Wind Turbine Company’s 750 kW turbine) were eliminated based on evidence that they are not yet commercially available and it is unclear
1

when they will be available (Bakeman 2007, Miles 2007). In estimating the market potential for small-scale and mid-scale wind (section 4), the project team chose among currently commercially available turbines.
As shown by Table 1, there is a market gap in the 100 kW to 500 kW segment. More models are available in the 600 kW to 1,500 kW segment, however all but two have lead times of between 12 and 16 months. It is worth noting that the majority of wind turbines in this segment are manufactured overseas, utilizing multinational component suppliers. This fact has significant implications for turbine price in U.S. distributed wind applications, due to shipping costs, dollar weakness, and import duty costs.
Table 1. Available New Mid-Scale (100 kW to 500 kW) Wind Turbines*
Nominal, Nameplate Output (kW) Model Manufacturer HQ Country
100 Northwind 100a and 100b Distributed Energy Systems USA 225 200-250 Norwin A/S Denmark 250 GEV MP Vergnet France 250 WES30 Wind Energy Solutions Netherlands 600 E 48 Enertech USA 600 FL 600 Fuhrländer Germany 600 PS 47 Vestas RRB1
India 750 AWE 52-750 Americas Wind Energy Canada 750 EcoRX 750 Four Seasons Windpower USA 750 599-750 Norwin A/S Denmark 900 AWE 52-900 Americas Wind Energy Canada 900 AWE 54-900 Americas Wind Energy Canada
1,000 1000 kW Mitsubishi Japan 1,000 N1000 Nordic Windpower USA 1,200 62/64 Vensys Germany 1,250 FL 1250 Fuhrländer Germany 1,250 1.25 MW Suzlon India 1,500 70/77 Vensys Germany 1,500 FL MD 70/77 Fuhrländer Germany 1,500 FL 1500 Fuhrländer Germany 1,500 1.5 MW family GE USA 1,500 1.5 MW Suzlon India
* This is not a comprehensive list of commercially available wind turbines. The two manufacturers that were willing to offer information on the volume of shipments in the past year reported shipping roughly half a dozen units of a particular model (Dickout 2007, Jones 2007).
1 Vestas RRB is in the process of setting up a U.S. distributor.
2

2.2 Remanufacturing Potential The remanufacturing process for a wind turbine typically involves replacing controllers with newer and more modern systems. The best remanufacturers also complete a thorough inspection of the turbine and replace any worn hardware.
Table 2 presents a list of companies that remanufacture and sell turbines in the 100 kW to 1,500 kW segment, and the rated output of the models currently in their inventories. Representatives from all of the companies noted that a variable and limited supply of turbines is available for remanufacturing. Thus, these companies have difficulty predicting their future inventories.
Table 2. Remanufacturers of Mid-Scale Wind Turbines*
Remanufacturer Rated Output of
Current Models (kW) HQ Country Enertech 150 USA Halus Power Systems 90–500 USA Windbrokers2
— Netherlands Wind Turbine Warehouse 150,500 USA
* This is not a comprehensive list of commercially available wind turbines.
Distributed wind project developers have widely varying opinions regarding remanufactured turbines. Some developers do not see these machines as a viable option for the distributed wind industry, due to questions regarding remanufacturing workmanship and machine dependability. Others acknowledge some of these same limitations and yet view remanufactured machines as the most promising option on the market, due to the associated price reductions which improve project economics. These developers also point to the fact that the long lead times associated with the manufacture and purchase of a new wind turbine are avoided when using remanufactured machines.
2.3 General Factors Regarding Wind Turbine Value This section discusses several factors that impact the value of mid-scale wind turbines. Details regarding many of these issues and their impacts on mid-scale distributed wind turbine projects also are provided in section 3. The discussion here focuses only on how these factors impact the value of a particular turbine. It is important to note that no particular turbine can fulfill the needs of the entire market. The factors that are perceived as most valuable vary depending upon the situation and location of the project.
2.3.1 Turbine Availability • Availability of turbines in the 100 kW to 1,500 kW segment is extremely limited. If
developers cannot obtain the properly sized turbine, then a project cannot move forward.
• Lead time required varies for different turbine models. A number of factors impact lead times, including a manufacturer’s target turbine market (larger manufacturers tend to focus their efforts on utility-scale models where greater worldwide demand exists; this
2 Windbrokers’ remanufactured turbines are not suitable for installation in the United States (50 Hz).
3

pushes back smaller turbine development), availability of hardware (e.g., there are shortages of bearings and gearboxes, so orders for these items take time to fill), and availability of raw materials (such as metals) for hardware development.
• Certification of new and additional manufacturing capacity can be difficult to obtain. There are some instances where European manufacturers (e.g., Fuhrländer) have prequalified tower manufacturers in the United States, but this is the exception.
2.3.2 Turbine Costs When all other factors (e.g., performance) are held constant, a lower turbine cost increases the value of a particular turbine by improving project economics (see section 4.4.1.1). Several developers noted that the price of wind turbines currently on the market presents a significant challenge for distributed wind applications in the United States (Drouilhet 2007, Godwin 2007, Graham 2007). Several factors have pushed the cost of mid-scale wind turbines higher.
2.3.3 Installation Costs Larger towers generally require larger transport vehicles and cranes, which can increase transportation and installation costs. New tower technologies—such as self-erecting designs—have the potential to decrease installation costs. Installation costs include those associated with transportation, construction, and interconnection.
2.3.4 Warranty • A turbine that has a warranty is inherently more valuable than one without a warranty (if
all other factors are equal).
• Many lenders require projects to use warrantied turbines.
• Many mid-scale wind turbine manufacturers are small companies, and are unable to support a warranty. If the manufacturer cannot provide a warranty, then the only available warranties are from the individual parts manufacturers.
2.3.5 Availability of Technicians Developers tend to prefer manufacturers that provide technicians to assist with the installation and maintenance of machines. Many of these manufacturers are small companies, however, and therefore are unable to provide service technicians. In such cases developers must train customers in operations and maintenance (O&M), which can be time consuming and difficult (Schulte 2007).
2.3.6 Availability of Spare Parts The availability and cost of spare parts affects the value of a particular turbine. It is advantageous to be able to obtain spare parts from several suppliers, as opposed to the original manufacturer only.
2.3.7 Reliability • As turbine reliability increases, O&M costs fall, time in service rises, and project
economics improve.
• Some turbine components—such as gearboxes—are more prone to wear and tear than others. When corners are cut in the design of these components, upfront costs could decrease, but O&M costs rise, lowering return on investment for the owner (Juhl 2007).
4

Turbines with poorer-quality components are considered less valuable if all other factors are equal.
2.3.8 Noise • Wind turbines produce two types of noise: one from the equipment inside the nacelle,
such as the gearbox, and one from the aerodynamic noise of the rotating blades.
• Turbines that generate more noise tend to raise additional public opposition, so developers try to find low-noise models.
2.3.9 Certification One developer noted that certification is an attractive feature of a wind turbine (Schulte 2007). A number of organizations provide wind turbine certifications including: Underwriters Laboratories (UL), a product-safety testing and certification organization in the United States; Germanischer Lloyd (GL) Wind Energy, an internationally operating certification body for wind turbines; International Electrotechnical Commission (IEC), an international standards development group for electrical equipment; and the Danish Energy Authority, the energy office of the Danish government.3
2.3.10 Extreme Weather Survivability Some wind turbines are designed for remote arctic areas or tropical islands. The turbines are designed to survive in extreme weather conditions, therefore developers and owners could face trade-offs such as lower efficiency and greater cost.
2.3.11 Avian Turbines and towers that have a lesser impact on wildlife are less likely to raise public opposition (e.g., tubular steel is preferable to lattice).
2.3.12 Aesthetics Mid-scale turbines have aesthetic impacts and, per Federal Aviation Administration (FAA) regulations, also could require lighting if their tip heights are above 200 feet. Although all models have visual impacts, there is some indication that the public is more accepting of those impacts if the machine uses a three-blade design rather than a two-blade design. Different communities raise differing levels of opposition to proposed installations based on aesthetics. Project developers, however, note that it is always important to engage community concerns regarding aesthetics (e.g., impact on historic properties and viewsheds) as part of siting activities.
3 Barriers to and Drivers of Mid-Scale Turbine Distributed Wind Projects
Simplifying somewhat, distributed wind can be understood as the offspring of wind technology and distributed generation. As such, it faces all of the challenges of its two parent technologies and shares only some of the respective advantages. This section examines the barriers to and 3 For more information on UL certification, visit http://www.ul.com/. For more information on GL certification, visit http://www.gl-group.com/industrial/glwind/3780.htm. For more information on the IEC certification, visit http://www.iec.ch/. For more information on the Danish Certification Scheme that is managed by the Danish Energy Authority, visit http://www.wt-certification.dk/index.htm.
5

drivers for mid-scale distributed wind projects (100 kW to 5,000 kW nameplate capacity, for the purposes of this section); some of these are common to all wind technologies, others are common to all distributed generation technologies, and others are unique to distributed wind.
The information in this section is derived from a literature review and interviews of 26 individuals involved in the supply chain of the distributed wind market, including state and local government regulators, manufacturers, remanufacturers, project developers, and customers. The customers interviewed represented several groups, including farms, schools and universities, and federal government facilities.
3.1 Barriers to Mid-Scale Turbine Distributed Wind Projects Although there are numerous barriers to the growth of distributed wind projects using mid-scale turbines, three restrainers overshadow the rest: Challenging project financials, turbine shortages, and a lack of regulatory support for these projects. In individual circumstances and even in certain states, other barriers present significant roadblocks to a project’s success, but the deciding factors for the majority of projects boil down to these three issues.
This section provides descriptions of the three dominant barriers as well as the other factors restraining growth of this market. It is important to note that many of the restrainers are strongly interrelated, therefore solutions that are devised to address one barrier actually could address multiple barriers (for example, project financials are inexorably linked to the regulatory environment, so strengthening the regulatory support for mid-class turbine distributed wind projects likely would improve the economics of projects).
3.1.1 Challenging Project Financials The primary difficulty facing mid-scale distributed wind projects is unfavorable project economics (Schulte 2007, Drouilhet 2007, Graham 2007, Usibelli 2007, Haas 2007, Parry 2007, Juhl 2007). Challenges arise from both the investment cost and net revenue aspects of a typical project pro forma.
3.1.1.1 Investment Cost The total installed cost of a project refers to all costs associated with the procurement and installation of a turbine; as the total installed cost rises, the project payback period lengthens (assuming all other factors remain unchanged).
Wind projects (not just distributed wind projects) enjoyed 20 years of declining installed costs on a $/kW basis during the 1980s and 1990s (see Figure 1). This long-term decline appears to have been driven by greater turbine efficiencies of scale, improved manufacturing processes reflecting greater industry maturity; increased turbine shipment volumes overall, which reduce the marginal costs of manufacturing and distribution; and increased project size, which reduces the marginal costs of materials and construction effort for an individual project.
6

Figure 1. Installed wind project costs over time (NREL 2007)
This 20-year trend bottomed out and reversed during the present decade. Total installed costs began to increase, and rose by about 18% on a $/kW basis for projects completed in 2006 as compared with those completed in 2005. Turbine prices specifically could have increased as much as 60% on a $/kW basis since 2001 (see Figure 2). In executing the market potential study, the project team assumed installed turbine costs as low as $18,500 (2 kW capacity), and as much as $9.9 million (5000 kW capacity). See Table 4 for more details.
Figure 2. Reported U.S. wind turbine transaction prices over time (NREL 2007)
Distributed wind projects comprise a small fraction of all wind projects, so it can be difficult to draw distinct conclusions about this subset of the wind market. It appears that although distributed wind projects enjoyed some of the price reductions of the broader wind market during the 1980s and 1990s, they could be seeing a proportionately greater price rise in the post-2000 period. To understand the reasons for this situation, it is useful to itemize the factors driving the increase in installed costs and to understand their differential impacts on utility- and distributed-scale wind projects.
7

3.1.1.1.1 Turbine Costs The rise in turbine costs appears to be driven by several factors. The start-and-stop nature of the Production Tax Credit (PTC) in the United States has had the effect of driving a frenzy of wind development activity on a two-year cycle. This has had the perverse effect of driving demand for turbines up to the limit of supply during each cycle, while simultaneously slowing the entry of new manufacturers into a boom-and-bust market. Although some new manufacturers and manu-facturing capacity has entered the market, it probably is less than it would be if the PTC were authorized for a longer time horizon. For qualified customers modeled in the market potential estimation described in section 4, the analysis assumed that the PTC would offer a $0.02/kWh tax benefit for the first ten years to recipients that generate renewable energy and sell it to a third party. The PTC improved project economics. See 4.3.5.1, Federal Incentives, for details.
Another reason for high turbine costs is the rising cost of raw materials such as copper, which recently has risen sharply. American steel likewise has jumped in price, such that it now costs 200% to 300% more than steel produced in Asia. The cost increase in domestic steel has been so great that manufacturers of utility-scale turbines actually are importing towers from China, despite the shipping costs (Schulte 2007).
Importantly, the wind turbine market is an international market. Worldwide market demand is high, the supply chain is overburdened, and suppliers at different points in the supply chain are reaping extensive economic rent from the supply-demand imbalance.
3.1.1.1.2 Limited Turbine Selection Although these three factors—boom and bust of the PTC, rising costs of raw materials, and international competition—affect the price for all turbines, other factors have a disproportionate effect on the price of smaller turbines. The limited selection of turbine models in the mid-scale range and the comparatively limited production of those models that are available (discussed in section 3.1) are primary drivers of mid-scale turbine costs. Over the past two decades, as the use of larger turbines has become more economically favorable than the use of mid-scale turbines, fewer mid-scale models have been brought to market (DOE 2006). In the late 1990s, 99% of all turbines sold were in the 0 kW to 1,000 kW range; by 2006, only 11% fell into this range (see Figure 3). Some manufacturers simply have exited the mid-scale market entirely. Fewer manufacturers participate in the distributed market segment, and those that do participate offer a limited number of models, therefore this market niche lacks the economies of scale that drive down the costs of utility-scale turbines and induces competitive pricing pressure (DOE 2006). The small supply of mid-scale turbines has contributed to high- and variable-turbine costs, project delays due to long lead times, and a lack of turbine choices to match the needs of different projects (DOE 2006).
8
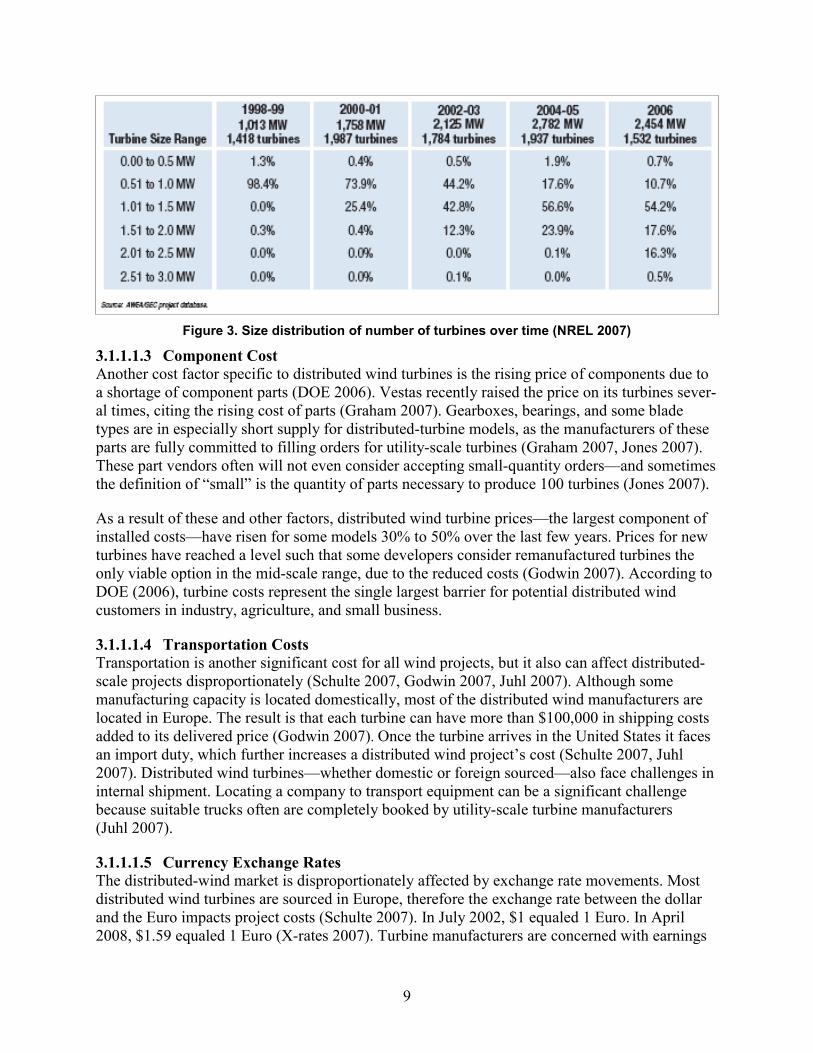
Figure 3. Size distribution of number of turbines over time (NREL 2007)
3.1.1.1.3 Component Cost Another cost factor specific to distributed wind turbines is the rising price of components due to a shortage of component parts (DOE 2006). Vestas recently raised the price on its turbines sever-al times, citing the rising cost of parts (Graham 2007). Gearboxes, bearings, and some blade types are in especially short supply for distributed-turbine models, as the manufacturers of these parts are fully committed to filling orders for utility-scale turbines (Graham 2007, Jones 2007). These part vendors often will not even consider accepting small-quantity orders—and sometimes the definition of “small” is the quantity of parts necessary to produce 100 turbines (Jones 2007).
As a result of these and other factors, distributed wind turbine prices—the largest component of installed costs—have risen for some models 30% to 50% over the last few years. Prices for new turbines have reached a level such that some developers consider remanufactured turbines the only viable option in the mid-scale range, due to the reduced costs (Godwin 2007). According to DOE (2006), turbine costs represent the single largest barrier for potential distributed wind customers in industry, agriculture, and small business.
3.1.1.1.4 Transportation Costs Transportation is another significant cost for all wind projects, but it also can affect distributed-scale projects disproportionately (Schulte 2007, Godwin 2007, Juhl 2007). Although some manufacturing capacity is located domestically, most of the distributed wind manufacturers are located in Europe. The result is that each turbine can have more than $100,000 in shipping costs added to its delivered price (Godwin 2007). Once the turbine arrives in the United States it faces an import duty, which further increases a distributed wind project’s cost (Schulte 2007, Juhl 2007). Distributed wind turbines—whether domestic or foreign sourced—also face challenges in internal shipment. Locating a company to transport equipment can be a significant challenge because suitable trucks often are completely booked by utility-scale turbine manufacturers (Juhl 2007).
3.1.1.1.5 Currency Exchange Rates The distributed-wind market is disproportionately affected by exchange rate movements. Most distributed wind turbines are sourced in Europe, therefore the exchange rate between the dollar and the Euro impacts project costs (Schulte 2007). In July 2002, $1 equaled 1 Euro. In April 2008, $1.59 equaled 1 Euro (X-rates 2007). Turbine manufacturers are concerned with earnings
9
in their domestic currency (in this case, the Euro), therefore U.S. buyers have had to spend 59% more to purchase a European-sourced turbine with a constant Euro price.
3.1.1.1.6 Installation Costs Installation costs are another component of total installed costs. These include the costs of cranes, which varies by region and project. Mid-size turbine distributed wind projects generally are single-turbine efforts, therefore crane costs can be a significant budget item and are proportionately more expensive than for utility-scale projects (Godwin 2007). In parts of the country that are distant from major cities crane access is limited, leading to much higher costs and project delays of more than a year (DOE 2006, Godwin 2007). The problem is accentuated when large developers and manufactures of utility-scale turbines book all the cranes owned by crane companies (Godwin 2007). For projects sited on remote island locations, crane costs are prohibitively expensive so developers must turn to self-erecting turbine models of which there are few (Drouilhet 2007). At the same time, crane availability and cost is not a major issue in parts of the Northeast that are close to a number of major cities (Schulte 2007).
The cost of foundations also has risen in recent years with the surging price of cement (Godwin 2007), which increased 11% between September 30, 2005 and September 30, 2006 (Brown 2007). In certain extreme cases, such as mid-scale turbine distributed wind projects in Alaska, the entire construction process for the foundation becomes a significant expense because of the difficulty associated with building in permafrost (Petrie 2007). In other instances, specialized foundation design significantly increases costs including, for example, those associated with siting wind turbines on closed municipal landfills or on land underlain by peat.
3.1.1.2 Net Revenue Net revenue refers to the financial benefit that customers investing in distributed wind projects stand to gain as a result of their investment, and can be calculated as the difference between gross project revenue over time minus gross project expenses. To determine the number of winners in each customer class of the market potential estimation, the project team considered net revenue over time, expressed as net present value (NPV). See section 4 for further details.
3.1.1.2.1 Gross Revenue Distributed wind projects create the following benefit streams.
• Displacement of electricity that otherwise would be purchased from the electric utility.
• Sale of excess electricity to the grid.
• Sale of renewable energy certificates (RECs), also known in some regions as “green tags.”
• Tax credits such as the federal PTC and accelerated depreciation.
• Other state and federal incentives, such as tax credits, grants, and low-interest loans.
These benefit streams arise from varying mixtures of ordinary market operations and specific governmental policies. Each of these five categories of benefits was included in the market-potential estimation analysis. See section 4.2.8.
This section focuses on those benefit streams—displacement of electricity deliveries and sale of excess generation—having valuation that can be forecast within the present commercial and
10

policy frameworks. The other benefit streams listed above arise because of more recent (and in some cases more temporary) policy action by governmental entities. These benefit streams are dependent on continuing governmental policy decisions; therefore, they are discussed in greater detail in the section entitled, “Regulatory Support.”
3.1.1.2.1.1 Displacement of Utility-Supplied Electricity Displacing utility deliveries requires no new policy support. In general, no new policy action is required to enable a utility customer to use less utility-delivered electricity (whether through more efficient operation or through distributed generation), and the kW and kWh not used are “priced” according to an established utility tariff. In the market-potential estimation analysis, the percentage of energy used onsite—which varied from 100% to 0%—was one of many factors that helped determine the feasibility of a wind energy project.
In many regions of the country, displacing purchased electricity with distributed wind generation (or distributed generation of any kind) has been an increasingly favorable opportunity in recent years. Increases in the price of utility fuels (especially natural gas) have driven commensurate increases in the final price of electricity charged to customers. As shown in Figure 4, retail electricity prices have risen steadily since 1999 with the exception of a small decrease between 2001 and 2002. In some states (see Figure 5, Figure 6), electricity prices have risen even faster than the national averages. Thus, in recent years, each kWh produced by a distributed wind turbine has become increasingly valuable.
4.00
5.00
6.00
7.00
8.00
9.00
10.00
1993 1995 1997 1999 2001 2003 2005
¢/kW
h CommercialIndustrial
Figure 4. United States average retail price of electricity (¢/kWh) to ultimate customers for commercial and industrial sectors, 1993–2006 (EIA 2007a)
11

6.00
7.00
8.00
9.00
10.00
11.00
12.00
1990 1992 1994 1996 1998 2000 2002 2004
¢/kW
h CommercialIndustrial
Figure 5. Average retail price of electricity (¢/kWh) to ultimate customers for commercial and industrial sectors in Rhode Island, 1990–2005 (EIA 2006c)
3.00
4.00
5.00
6.00
7.00
8.00
9.00
1990 1992 1994 1996 1998 2000 2002 2004
¢/kW
h CommercialIndustrial
Figure 6. Average retail price of electricity (¢/kWh) to ultimate customers for commercial and industrial sectors in Texas, 1990–2005 (EIA 2006c)
Although this has been a favorable development for distributed wind, this revenue stream likely has not been exploited to its full potential. The reasons are traceable to wind technology itself, and the limited choices of turbines available for distributed wind projects.
The ability of a distributed wind project to maximize the value of purchased-electricity displacement is dependent on several variables. The most important variable is the site’s wind resource: the greater the wind resource, the more electricity a given turbine can generate, and the more purchased electricity can be displaced. This naturally leads project developers to seek out sites with strong and steady winds which offer the greatest potential revenue generation. Site selection, in turn, affects turbine selection: a turbine’s capacity factor4 is dependent on the wind
4 The capacity factor describes the percentage of a turbine’s maximum theoretical output that actually can be harvested under the site’s wind regime.
12

regime at a specific site. Other things being equal, a turbine with a higher capacity factor is preferable to one with a lower capacity factor at a given site.
Turbines are designed for specific wind regimes. One turbine, for example, might be designed to maximize the productivity of a low wind-speed regime, while another of the same nameplate capacity might be designed to deliver the highest capacity factor under a stronger wind regime. Both of these designs are useful and help fill the needs of a diverse customer base. As manufacturers have gradually abandoned the distributed wind market, however, the selection of distributed wind turbines has dwindled both in terms of optimization for different wind regimes and variety in nameplate capacities. This has forced project developers to choose turbines that could be sub-optimal for the development site which, in turn, reduces productivity and financial benefits (Godwin 2007, Schulte 2007).
Additionally, even those turbines available in the market have not benefited from the same level of research and development (R&D) investment that utility-scale wind turbines have enjoyed in the past decade (Graham 2007). Comprehensive data are scarce, but it appears that improved technology has allowed utility-scale turbines to increase their capacity factors in recent years, and that distributed wind turbines have not seen similar improvements.5 One significant advance that has not occurred for distributed wind turbines is availability on taller towers. This feature would improve performance because, as turbine hub height increases, wind speeds are increased and turbulence is reduced (Rhoads-Weaver and Forsyth 2006).
R&D funding shortages might have limited advances in mechanical durability. Mechanical problems not only result in repair expenses (discussed below), they also reduce the turbine’s productivity and thus its ability to generate financial benefits. Distributed wind projects are particularly vulnerable to the impacts of mechanical breakdowns given the shortage of skilled technicians, spare parts, and available cranes (DOE 2006).
3.1.1.2.1.2 Sale of Excess Electricity Generation Existing laws and regulation permit a distributed wind project to sell its surplus electricity generation: If the project is located in an area with competitive wholesale electricity markets, the project can sell its generation to the market directly. Where no such market exists, the project still is entitled to sell its excess generation to the local utility at the utility’s avoided cost.
Although sale of excess generation using either of these methods offers a revenue stream for the project, the unit price paid rarely will equal the unit price avoided by displacement of electricity deliveries.6 Because of this differential, many states are creating policy framework to permit net metering. In its purest form, net metering allows distributed generators to sell excess generation to the utility at the same retail rates that the utility charges the customer for its deliveries. The rules vary considerably across those states that permit net metering. Appendix A summarizes the
5 Other factors such as larger rotors and taller towers, also have driven improvements in utility-scale capacity factors, but capacity factors appear to have improved even if these two variables are constant. 6 Electricity prices tend to peak in the summer months, which are also the months when wind speeds and thus excess generation often are least.
13

relevant policies, and the implications of various net metering rules are discussed in greater detail in section 3.2.1. Table 10 also provides information about net metering limits.
3.1.1.2.2 Gross Expenses Distributed wind projects must pay the following expenses.
• Operation and maintenance costs
• Standby and backup payments to the utility (for some projects)
• Interest on project debt
• Project management fees (if a third party is hired to manage the project)
• Insurance
• Property taxes
• Financial advisory and legal fees
• REC transaction commissions
• Warranty fees
• Permitting fees (a one-time cost)
Expenses proved to be a significant factor in determining the feasibility of wind project sites included in the market-potential estimation described in section 4 (see Table 5 for a description of installed costs). Distributed wind expense categories are similar to those found in utility-scale wind projects; distributed wind projects have expense structures that are relatively similar to those of utility-scale projects7. There are differences in a few categories, however. The scarcity of distributed wind installations throughout the United States, along with the long distances between installations, reduces the ability of the industry to support local wind technicians. Manufacturers frequently do not offer service technicians for distributed generation systems, therefore customers are forced to perform some basic maintenance themselves (Schulte 2007). According to DOE (2006), the lack of an operations and maintenance infrastructure represents the second greatest barrier to distributed wind for farmers and small businesses.
Interest costs can be greater for distributed wind projects than for utility-scale projects. At the project-owner level, a large wind developer is likely to have a stronger credit rating and access to broader financial markets than an individual business or farm that is considering the installation of a distributed wind project. At the project level, a lender is more likely to have confidence in a utility-scale developer that can point to a history of successful projects, revenue from a wholesale power agreement, and collateral in the form of a large installation of wind turbines in a desirable location. By contrast, a distributed wind developer and owner likely has a shorter or track record with wind projects (or none at all), a more uncertain revenue stream, and less-valuable collateral in the form a single turbine located on the owner’s property.
7 Utility-scale projects usually also pay a land-rental fee. Note that distributed wind projects do not pay fuel bills, as do virtually all other distributed generation projects.
14

3.1.2 Turbine Shortages As noted in section 2, Table 1, there are slightly more than 20 commercially available distributed wind turbines in the United States when both new and remanufactured machines are considered. This narrow selection has several negative consequences for distributed wind development. First, although new turbines are available in several different capacity ratings gaps exist, most notably between 100 kW and 500 kW (see section 3.1). The range also is difficult for remanufacturers to fill due to a shortage of turbines available for refurbishing (Ordon 2007). Due to the unavailability of turbines in the 100 kW to 1,500 kW range it might not be possible to obtain a turbine that has optimal capacity for the selected site. The market-potential estimation analysis assumed that a site would select the project size that would maximize its net financial benefit. See section 4.2.6 for information about how project size was determined.
Using a smaller-than-optimal turbine results in a greater installed cost (in $/kW) and less kWh production per dollar invested, due to the reduced economies of scale of a smaller machine. The installed cost per kilowatt of the smallest project considered in the market analysis (10 kW) was $6,000; the installed cost of the largest project (5,000 kW) was slightly less than $2,000. Likewise, the largest projects produced roughly 700 times more kilowatt hours per year than the smallest projects, when considering kilowatt hours over the same wind power class. See Table 3 and Table 4 for more information.
Using a larger-than-optimal turbine also presents problems. Although a larger turbine should offer greater scale economies, there could be regulatory limitations on the amount of electricity that the project can feed back into the grid, and the unit value of such “exports” might be substantially less than the value of displaced kilowatt hours behind the customer’s meter. Larger turbines also could be more challenging to permit, build, and maintain (DOE 2006).
In addition to limited choices, the general shortage of distributed-scale turbines forces distributed wind project developers to confront regularly changing turbine prices and long lead times for delivery—both of which increase the risk that a project will be an economic failure or possibly never launch at all (Godwin 2007, Schulte 2007). Finally, many manufacturers that offer models in the mid-scale range require substantial orders before agreeing to produce the turbines (e.g., Suzlon has rejected orders of more than 30 of its 1.5 MW machines as too small a quantity). The result is that these models essentially are unavailable for small distributed wind projects utilizing one to two turbines (Juhl 2007).
3.1.3 Lack of Regulatory Support A variety of policies at the federal, state, and regional levels are designed to support renewable energy generally or wind energy specifically. Only rarely are these policies precisely targeted to support distributed wind, with the result that the policies could provide little or no incentive for distributed wind or, in extreme cases, actually could operate as a barrier to distributed wind. In other cases the support provided by a specific policy might be less substantial than it appears. This section describes the cases in which policies either provide less support than needed, provide no support at all, or act as a barrier to distributed wind. Supportive policies are discussed in the drivers section (below). For information about how federal incentives were applied in the market potential estimation analysis, see section 4.3.5.
15

In terms of federal policy, a critical incentive for renewable energy generation is the Production Tax Credit, which offers an inflation-adjusted credit of approximately $0.02 per kWh for wind-generated electricity sold to third parties. Two key issues have prevented the PTC from fully stimulating the mid-scale distributed wind market. One issue is that to benefit from the PTC a distributed wind project must have a significant tax liability. This is problematic, given that many of the schools, universities, and community organizations that would consider the purchase of mid-scale turbine distributed wind projects are non-profit organizations that pay no taxes (Godwin 2007, Drouilhet 2007, DOE 2006). Although a number of new business models have been developed to enable project owners that don’t have significant tax liability to take advantage of tax credits or their equivalents, employing these techniques adds further complexity to the difficult task of developing a mid-scale turbine distributed wind project (We Energies 2007).
The fluctuating status of the federal PTC has served as a barrier to entry into and expansion within the wind turbine manufacturing market, contributing to the current scarcity of mid-scale turbine manufacturers and available turbines on the market (DOE 2006). The on-and-off nature of the PTC has caused a ripple effect throughout the supply chain. The uncertainty this causes contributes to a shortage in turbine components and a lack of wind-industry experts in the maintenance, business, engineering, and legal sectors (DOE 2006).
Another limitation of the federal PTC is that it is only available for power sold to an unrelated third party. If a for-profit business could utilize only 75% of the electricity produced by a wind turbine, for example, then the business would sell the remaining 25% back to the utility, and could claim the PTC only on the 25% of production sold back to the utility. The business cannot claim the Production Tax Credit on electricity used in its own facilities.
A second issue is the Modified Accelerated Cost-Recovery System (MACRS). This is an important federal incentive for wind power; it allows businesses to depreciate renewable energy technology property for tax purposes on an accelerated, five-year schedule (DSIRE 2007). However MACRS, like the PTC, requires that the customer have a great tax liability, which renders it inaccessible to many distributed wind customers.
Another federal policy is the U.S. Department of Agriculture’s Section 9006 program, which can provide farmers and ranchers with grants and loan guarantees, and potentially provide direct loans for renewable energy projects. Although the program has provided substantial funding to wind projects of 100 kW and greater in capacity, using 9006 funds could require an offsetting reduction in the benefits of the PTC due to IRS rules (Bolinger 2006). Further, the grant program is restricted to projects located in rural areas.
The federal Renewable Energy Production Incentive (REPI) provides a $0.015 per kWh inflation-adjusted production credit to those entities that have no tax liability (DSIRE 2007). The impact of this incentive has been limited because funding is dependent on annual congressional appropriations (Bird et al. 2003). Funding is uncertain and limitation can lead to partially funded projects. Thus, project developers cannot be sure that this benefit stream actually will be available for one or more years of the project’s lifetime.
16

3.1.4 Utility-Based Issues A number of barriers to distributed wind could be found at the interface between the distributed wind project and the local electric utility. Inadequate net metering policies—discussed in detail in section 3.2.1 (Policies that Enhance Financial Returns)—comprise one group of barriers. Another challenging aspect of the interaction between projects and utilities is interconnection of turbines to the electric grid. The highly fragmented nature of the U.S. electric industry has resulted in widely varying interconnection standards and size limitations, or even a complete lack of such standards. In some cases, interconnection requirements are forbiddingly complex and expensive, effectively preventing the development of distributed generation of any type (IREC 2004, NREL 2000).
Over time, however, many utilities have adopted harmonized interconnection standards (as shown in Appendix A), and simplified interconnection procedures for smaller generators. The advances mostly are due to several national policies. In 2003, the Institute for Electrical and Electronics Engineers (IEEE) created federal interconnection specifications for distributed generation (IEEE Standard 1547-2003) (IREC 2004). The Underwriters Laboratories concurrently developed UL Standard 1741, which is a testing procedure for the inverters, converters, and controllers used in distributed generation that enables UL to test and list technology that meets these standards (IREC 2004). In 2005, the Federal Energy Regulatory Commission (FERC) released standard interconnection rules that apply to all generators 20 MW and smaller, along with simplified rules for generation sources that are less than 2 MW (Federal Energy Regulatory Commission 2005). As these improvements in rules and standards have been implemented and utilities have developed more streamlined procedures, the interconnection process has become less burdensome for project developers and customers (Drouilhet 2007, Usibelli 2007, Graham 2007). It is worth noting, however, that some areas still lack standards and that existing standards still vary, which can inhibit the development of certain projects (DOE 2006).
Technical problems have declined, and many of the current interconnection issues are procedural and legal in nature (IREC 2004). On the procedural side, when standardized interconnection agreement rules in a state do not specify time periods for each step in interconnection process, significant time delays can occur—especially when customers struggle to find utility representa-tives that are familiar with interconnection and net metering (IREC 2004). The legal issues typically pertain to insurance requirements that utilities place on small generators. More and more utilities now require liability insurance as part of interconnection agreements, to cover any accidents associated with a turbine system (Rhoads-Weaver and Forsyth 2006). This does not tend to hurt large businesses that already carry significant liability insurance, however the cost can be significant for smaller entities (IREC 2004). In a few cases utilities have required indemnification against damages, and also that they be listed as an additionally insured party on liability policies (IREC 2004). Although the indemnification and additionally insured listing do not seem to be widespread practices, when they occur they can increase costs for small generators.
Some areas of the country have independent system operators (ISOs) or regional transmission organizations (RTOs). The Federal Energy Regulatory Commission requires ISOs and RTOs to analyze the impact of each new generator on the transmission system. Projects are addressed on a first-applied, first-analyzed basis which can cause two problems. One is that serious developers can find themselves in the queue behind placeholder projects (i.e., projects that are not fully planned), which can lead to project delays. The second issue is that projects in a queue are
17

additive in their transmission requirements. A project further back in the queue therefore can appear to be the one that causes the need for an expensive transmission system upgrade and that project can be billed accordingly. In parts of the country where there are no ISOs and RTOs, similar problems can arise when utilities issue requests for proposal (RFP) for distributed generation. The FERC requires that feasibility and impact studies be conducted in the order that proposals are submitted to utilities—regardless of each developer’s interest level or qualifica-tions (Juhl 2007). Consequently, when a utility releases an RFP for new renewable resources, numerous developers—including those who are uncommitted or unqualified—submit project proposals. This can move the more serious developers to the back of the queue (Juhl 2007). In some cases, a utility will withdraw its RFP because receipt of a sound proposal is taking too long (Juhl 2007).
One general advantage of mid-scale turbines as compared to utility-scale turbines is that their limited power production has less impact on the grid, thus reducing the need for expensive studies (DOE 2006). It is important to note, however, that 100 kW to 1,500 kW is a wide range, and those turbines in the more powerful end of the range often are treated differently. In San Diego, California, for example, proposed installations of turbines under 1 MW have access to streamlined interconnection requirements; larger machines are subject to more stringent interconnection requirements that can be cost prohibitive (Bonk-Vasco 2007). Additionally, there is continued uncertainty regarding the ultimate cost of the interconnection study, depending on locale; costs vary by state and generally by utility.
A number of distributed wind interconnection issues center on the fact that much of the country’s wind resource is located in rural areas with low population density and less-robust grids. There exist fewer opportunities for interconnection at these locations, and extension of transmission lines is prohibitively expensive for installations of small quantities of turbines (DOE 2006). Rural distributed wind installations also often need additional intermittency effects research, due to the weak nature of the grids in such locations (Parry 2007).
Although distributed wind turbines can benefit utilities by shoring up weak portions of the grid, the lack of a national grid code for voltage support prevents mid-scale turbine distributed wind projects from maximizing the value they could provide (DOE 2006). In some instances only single-phase service exists, which precludes 100+ kW turbine installations unless costly distribution line upgrades are performed. Another difficulty is that many of the sites for distributed wind—including some non-rural locations—do not have access to competitive electricity markets, so they are dependent on the policies of a single utility, including the interconnection and net metering rules (DOE 2006). Finally, certain remote locations present special challenges (e.g., some distributed wind turbine sites in Alaska have to integrate into diesel generation grids, which require additional controls) (Petrie 2007).
Utilities also present other hurdles, aside from interconnection issues. A number of utilities, especially rural electric co-ops (Parry 2007), traditionally have been skeptical of renewable energy and unsupportive of distributed generation (DOE 2006, NREL 2000). The particular hostility of rural electric co-ops toward distributed generation tends to stem from the view that net metering is a subsidy for distributed generators that is funded by other rate payers (Rhoads-Weaver and Forsyth 2006). Some of the reluctance of other utilities is due to a lack of understanding that mid-scale distributed wind projects can support the transmission system,
18

lessening the need for transmission system upgrades and relieving transmission congestion (ECWI 2004, DOE 2006). The result is that some utilities do not include the benefits of distributed wind projects in their economic analyses (ECWI 2004)8. Additional reluctance is due to the fact that certain installations of mid-sized distributed wind turbines (e.g., schools, businesses) can impact revenues for small utilities (DOE 2006). The lack of support for distributed wind is manifest in the adoption of unfavorable net metering and interconnection policies (e.g., demand charges, stand-by charges) (Drouilhet 2007) and a lack of utility-sponsored programs and marketing for distributed wind, which contributes to low public awareness as discussed in section 3.1.8 below (DOE 2006).
3.1.5 Siting Siting a project, which involves dealing with zoning and permitting laws at a local level, is a second-tier barrier to mid-scale turbine distributed wind projects. In general, the permitting process increases dollar and time expenditures necessary for project completion rather than functioning as a project-ending blockade (Rhoads-Weaver and Forsyth 2006).
A number of common siting issues typically revolve around wind turbine height. Zoning ordinances generally forbid the construction of structures more than 35 feet tall, and wind turbines rarely are identified as permitted uses of property (Green and Sagrillo 2005) or defined as allowed as an accessory use. Setback requirements from property boundaries in certain localities also can limit allowable turbine heights (CEC 2003). Anywhere in the country, turbines more than 200 feet tall are required by the Federal Aviation Administration to have aircraft warning lights, which can add to project cost (CEC 2003) and increase aesthetics-based public opposition to projects. Additional FAA siting requirements apply to the construction of turbines near airport facilities (CEC 2003) and local air-traffic controllers can impose restrictions, as has occurred around the Boston Logan Airport control tower.
The degree of difficulty in dealing with these issues varies significantly across—and even within states. Siting generally is a straightforward process in Iowa (Pearce 2007), for example, but county boards in parts of Illinois tend to refuse to approve projects (Haas 2007). Distributed wind projects located in rural areas usually face fewer siting issues (DOE 2006). It frequently is the case that siting difficulties are associated with public opposition based on concerns regarding noise, aesthetics, and avian well-being. As discussed in section 3.1.7 (Concerns Regarding Visual Impacts and Noise) this public opposition often is based on lack of knowledge regarding wind power characteristics. As a result, the effort to overcome siting barriers frequently is an educational endeavor (CEC 2003). Although siting issues can be significant in individual cases, the developers interviewed indicate that siting generally is a manageable issue rather than the most critical barrier to a project.
It should be noted that the existing federal and state financial incentives do not flow back to communities for privately sited distributed generation projects. Wind turbines also are exempt from local property-tax requirements in some states, and therefore do not provide communities with financial benefits through taxes. Some sentiment exists within the general public that the
8 It is noteworthy that some utilities (e.g., Bonneville Power Administration) are starting to account for these benefits in their calculations (ECWI 2004).
19

community should receive some financial benefit if it must bear the aesthetic and other impacts from a purely private distributed generation project.
3.1.6 Technical Turbine Issues In some cases, technical issues can be an impediment to a successful project, but these issues generally are considered a secondary barrier for the mid-scale turbine distributed wind market. Existing machines typically are based on designs that have been tested over many years and are well built (DOE 2006, Drouilhet 2007, Graham 2007). These models would benefit from further investment from manufactures to take advantage of recent technological advances made in the design of utility-scale turbines (Graham 2007). Following is a list of existing technical issues.
• Lightning strikes—The height of turbines puts them at risk of lightning strikes, and although improvements in design have decreased the risk that a strike will damage a turbine, damage still does occur. (DOE 2006)
• Wind intermittency—Demand charges can be a significant portion of school or large-business electric bills. The intermittent nature of wind, however, reduces the likelihood that a wind turbine’s output will be coincident with the customer’s peak demand. Only reductions in the peak demand can reduce demand charges. The use of energy storage equipment to achieve coincidence is cost-prohibitive. (DOE 2006)
• Gearbox reliability—The primary point of mechanical failure in a turbine is the gearbox, which drives both maintenance costs and the reduction of time in operation over the course of a year. (Juhl 2007)
• Electronics and software power—A lack of tested and certified remote-monitored controllers for turbine complicates the interconnection process and decreases the ability of mid-scale turbines to support weak portions of the grid (DOE 2006). Many of the existing controllers also have proprietary communication protocols, which make them difficult to integrate into the grid’s supervisory control and data acquisition (SCADA) systems. (Drouilhet 2007)
• Self-erecting towers availability—There is a very limited number of self-erecting tower models available on the market. Two advantages of these systems are that they can be installed without a crane (which is ideal for remote applications), and they can be taken down quickly (which is ideal for island applications where hurricanes are a threat). (Drouilhet 2007)
• Tower height—One developer mentioned that, for the turbines currently on the market that have nameplate capacities of less than 600 kW, the towers all are too short. This developer finds that, as a general rule, tower heights of less than 150 feet are a poor investment. Interestingly, the developer also noted that modeling has demonstrated that, despite increased costs such as the need for larger cranes, increasing tower height for a given turbine always generates a greater rate of return. (Godwin 2007)
• Lack of warranty—Another issue faced by developers and customers in the mid-scale turbine market is determining what entity is financing the warranty on a given turbine. Frequently, the manufacturers and remanufactures of the turbines on the market are not able to finance the warranty, so it often is the case that each part is covered by the warranty of its particular manufacturer. Determining the configuration of warranties for a
20
turbine adds to the complexity of a project and its maintenance issues. (Schulte 2007; Godwin 2007)
• Lack of performance ratings—For customers and developers, the lack of consumer-friendly performance ratings and standards reduces confidence in turbine reliability. (Rhoads-Weaver and Forsyth 2006)
• Distribution system—Certain power-quality issues can arise due the interconnection of many distributed wind systems to weak distribution systems. These power-quality issues include the production of electricity outside acceptable ranges of voltage and frequency, voltage flicker, power factor falling below one, DC injection, and harmonics. Most of the developers interviewed did not indicate that these issues present a major barrier to projects. (IREC 2004)
• Technical issues specific to remanufactured turbines (DOE 2006) o Remanufactured machines are made from older turbines therefore many are not
optimized for Class-3 wind sites, which reduces the return on investment. They also can lack many of the technical advances that have been made during the last two decades (Graham 2007).
o According to some developers, there is a general lack of information about the work necessary to remanufacture a turbine—even those from the best remanufacturers (Godwin 2007). The lack of standards and standard reporting requirements creates significant uncertainty regarding the performance history of the machine and any improvements that the remanufacturer has engineered (Godwin 2007). Partly as a result of these concerns, the opinions of developers and customers vary widely with regard to the ability of remanufactured turbines to meet the needs of the mid-scale turbine distributed wind market. Some think that the uncertainty about turbine history and remanufacturing procedures eliminates these turbines from consideration (Graham 2007). Others think that the price discount relative to the new turbines currently on the market makes remanufactured turbines the most viable turbine option available (Godwin 2007). Additionally, the fact that the machines operated in a previous location is for some an indication of proven performance (Parry 2007).
• Technical issues for extreme applications—When turbines are used in island applications, salt and heat often corrode turbine hardware, including guy wires (if used), fasteners, and other small metal parts (Drouilhet 2007). Corrosion of the tower itself will not affect tower performance for many years, but the discoloration can generate complaints related to aesthetics (Drouilhet 2007). In arctic conditions, geotechnical challenges associated with building the foundation in permafrost add to project costs substantially, and extreme temperatures can lead to parts failure (Petrie 2007).
3.1.7 Concerns Regarding Visual Impacts and Noise In certain cases, when a distributed wind turbine project is proposed neighbors raise concerns over the potential for visual and noise impacts. Generally, as concern regarding a project arises so do the siting barriers for that project. Although circumstances vary within and across states, these concerns generally are considered to be manageable issues rather than significant barriers to a project (Godwin 2007, Schulte 2007, Drouilhet 2007, Graham 2007, Tooze 2007).
21

A Wisconsin state official noted that the State of Wisconsin has undertaken some statutory initiatives to reduce local opposition to wind energy projects (Helgeson 2007). Oftentimes, community members who are less knowledgeable about—and have less experience with—wind turbines raise concerns, but their opposition typically fades as their knowledge of the industry increases. When projects first were being developed in Alaska, for example, some local residents raised concerns about noise. Once the turbines were installed all opposition dissipated (Petrie 2007). In general, mid-scale turbine distributed wind projects have some advantage over utility-scale projects in that a single turbine presents fewer aesthetic concerns, especially when that turbine is locally owned (Haas 2007), and that many distributed wind projects are sited in rural areas with lower population densities (DOE 2006). One interesting note raised by a single developer is that there appears to be more public opposition (and therefore zoning issues) with two-bladed turbines based on a lack of public familiarity with such designs (Graham 2007). The developer indicated that, as a result, these machines are more popular for less densely populated areas such as farms and ranches (Graham 2007).
3.1.8 Lack of Public Awareness There is a lack of basic knowledge among the general public regarding the characteristics of wind power and the viability of mid-scale turbine distributed wind projects. Although this issue is not raised as a primary barrier to the mid-scale turbine distributed wind market, low levels of awareness feed into issues regarding visual, noise, and avian impacts that drive siting issues (CEC 2003). The lack of awareness also to a certain degree tempers demand, because in many areas the residents do not realize that they could displace their electric bills through wind installations (Schulte 2007).
3.1.9 Environmental (Avian) Concerns Sometime community members are concerned about the potential for avian death and injury due to the installation of wind turbines. In Alaska, fish and wildlife agencies require an in-depth, year-long bird study for every 100-kW turbine installed, which increases project costs significantly (Petrie 2007). Although situations such as the one in Alaska arise occasionally, avian concerns in the lower 48 states frequently are considered issues to be managed rather than significant barriers to a project (Godwin 2007, Schulte 2007).
3.1.10 Project Complexity and Timing The Department of Energy notes that the overall complexity involved in undertaking a mid-scale distributed wind turbine project given the current market conditions is a barrier to growth. Developers are presented with a number of real challenges: Limited availability of turbines; long lead times for turbine acquisition; extreme variability in turbine price; lack of available financing; need for new business model structures to secure financial incentives; and difficulty in accurately projecting project economics due to variability within and across states in turbine price, incentives, and regulations.
In particular, the timing requirements of certain steps in the project planning process can be challenging given the current shortage of available turbines. Once a project is set up to receive the PTC, for example, a number of financing, permitting, and construction steps, including the arrangement of a set delivery date for the turbine, must be completed within the short window of time during which the PTC is available. The difficulty in arranging all of these steps is accentuated for distributed wind projects as compared to utility-scale projects, because the
22

limited scale of the projects reduces the developer’s leverage with the other parties involved. The challenge of pulling together all of the complex project pieces and dealing with these timing issues requires significant leadership, which can be exhausted prior to project completion because of the lengthy nature of these efforts. (DOE 2006)
3.1.11 Other Barriers Other factors are restraining the growth of the mid-scale turbine distributed wind market. One barrier is growing competition from other distributed generation technologies, particularly given the difficulties faced by the mid-scale turbine distributed wind industry (DOE 2006). A second barrier is the lack of quick and easy methods for determining the characteristics of a given wind regime for distributed generation sites (Rhoads-Weaver and Forsyth 2006, DOE 2006). Although wind maps generally are available, most investors often still desire onsite measurement of wind resources. This requires a meteorological tower for a single location—another expense that can-not be spread over multiple turbines. Even with onsite data collection it is necessary to compute the annual output, capacity factors, project costs, and overall project financial benefits.
3.2 Drivers for Mid-Scale Turbine Distributed Wind Projects Mid-scale turbines are in demand as long as project economics are positive (Godwin 2007). Other principal drivers include local economic stimulation, educational opportunities for students, and promotion of environmental objectives. This section provides descriptions of the drivers for the growth of this market.
3.2.1 Policies that Enhance Financial Returns A consistent theme of the interviews conducted is that the principal driver for mid-scale turbine distributed wind projects is a positive economic return for the investor. When project economics are positive, the market responds with rapid growth (Pearce 2007, Schulte 2007). In essence, the barriers to market growth that are discussed in section 3.1 become only secondary concerns when the economics are favorable (Tooze 2007).
As noted in section 3.1.1.2.1, Gross Revenue, some of the benefits streams arising from a distributed wind project depend, at least in part, on supportive policies at the federal and state levels. Some industry participants view these policies as the most important driver of growth in the mid-scale turbine distributed wind market (Drouilhet 2007, Pearce 2007).
At the federal level, the main incentive policies include the PTC, MACRS, the Section 9006 program, and the new Clean Renewable Energy Bonds (CREBs) program. All of these incentives were included in the market potential estimation and are detailed in section 4. The PTC is a tax credit worth approximately $0.02 per kWh (inflation adjusted) for the first 10 years of a project’s lifetime for electricity sold to third parties. The MACRS is an accelerated depreciation option that allows for a five-year depreciation of a commercial or industrial distributed wind project, which improves its life-cycle economics. Section 9006 is a grant and loan program for renewable energy projects developed by rural farmers and ranchers. The CREBs program provides low-interest loans for the renewable energy projects of organizations without tax liability and is especially supportive of distributed generation projects because it funds small projects first.
The PTC and MACRS favor project owners with significant tax liabilities, and thus significant appetites for tax credits. They were not designed with distributed wind projects in mind, however
23

new business models such as flip ownership structures allow community wind investors to access the PTC by joining with a tax-paying equity investor (Bolinger and Wiser 2004). Under the flip model, a distributed wind project is built with majority ownership by a corporate entity seeking tax credits and minority ownership by the project host. After the PTC period lapses, the corporation either sells its share to the project host or reverts to a minority-ownership share. The flip structure permits the project to harvest all of the tax credits available.
At the state level, although support still is fairly limited there is a wider variety of policies than found at the federal level. A number of these state policies are included in the list below. The market potential analysis discussed in section 4 considered a variety of cost- , capacity- , and production-based incentives available on a state-specific basis throughout the country. Please see Appendix B for detailed information on state incentives. According to the market analysis, the impact of state incentives varied significantly by customer type. See section 4.4, Results and Analysis, for more information.
Favorable net metering rules have the potential to be one of the most important policies support mid-scale distributed wind (DOE 2006). A project’s economics improve if surplus electricity is being sold to the utility at $0.10 per kWh rather than to a wholesale market at $0.05 per kWh (see Figure 7, EIA wholesale generation price forecast by power pool). As shown in Appendix A and Table 10, however, net metering provisions differ significantly between states. A critically important point to consider for mid-scale wind turbine installations is that only 11 states allow net metering for systems greater than 100 kW and, of these, only three states (Maryland, New Jersey, and Colorado) have project caps that reach 2 MW (DSIRE 2007). The result is that net metering provisions in most states do not support mid-scale turbines. Many programs also adopt policies that limit the incentives provided by net metering, such as the use of monthly accounting rather than the more customer-friendly annualized accounting and reimbursing customers at the “avoided cost” rate for power provided to the grid rather than the retail rate (IREC 2004, DSIRE 2007). Finally, the lack of consistency in net metering across states—or even within states—complicates valuation for developers, because sites with similar characteristics can have vastly different values (DOE 2006).
A number of other state-level policies help drive the development of distributed wind.
• Renewable Portfolio Standards (RPSs) are established in many states. These standards require electricity providers (typically utilities) to provide an increasing percentage of their electricity deliveries from renewable resources. An RPS creates market demand for renewably generated electricity.
• Production incentives such as the Washington Renewable Energy Production Incentives, which provides up to $2,000 per year for distributed renewable generation, encourage renewable generation (DSIRE 2007).
• Tax-based incentives also are used by states to support wind projects. These policies can come in the form of production tax credits (e.g., Iowa’s Renewable Energy Tax Credit), sales-tax exemptions for renewable equipment (e.g., Washington’s Sales and Use Tax Exemption), or property-tax exemptions (e.g., Indiana’s Renewable Energy Property Tax Exemption) (DSIRE 2007).
24

• The establishment of a development fund for clean energy, such as Minnesota’s Renewable Development Fund (RDF), can provide capital support for mid-scale turbine distributed wind projects (DSIRE 2007).
• State initiatives such as the 800 MW goal set by the governor of Minnesota for Community-Based Economic Development (C-BED) projects can help drive wind projects (DOE 2006); although, in the case of this initiative, the program primarily has supported utility-scale turbine installations (Haase 2007).
• The creation of state- or utility-run grant and loan programs can provide an additional source of funding for projects (for example, Massachusetts, via the Massachusetts Technology Collaborative, provides grants to distributed wind projects through the Large Onsite Renewables Initiative) (DSIRE 2007).
• The establishment of statewide standard interconnection procedures, such as those used in California (DSIRE 2007), can remove a barrier to distributed wind.
• Mandatory utility purchases of green power (e.g., Iowa’s Mandatory Utility Green Power Option) are a method for stimulating demand for wind installations (DSIRE 2007).
The market for renewable energy certificates can provide an additional revenue stream for distributed wind projects (Rodgers 2007, Schulte 2007). Although the definition of a REC varies by jurisdiction, it can be understood to represent the positive environmental attributes (or absence of negative environmental attributes) arising from the generation of each MWh of renewable electricity. RECs can be separated from the electric commodity and, in many cases, it is the RECs—rather than delivered renewable electricity—which electricity suppliers use to satisfy state RPS requirements (Holt and Wiser 2007). Additionally, many electricity customers who want to “green up” their electricity supply purchase RECs in an amount equivalent to 5%, 10%, or even 100% of their electricity requirements. These so-called voluntary purchases of RECs raise the market price for RECs which, in turn, means greater revenue for renewably generated electricity projects. The REC market offers some benefits to distributed wind generators: The host/owner can choose to sell the RECs from their project and earn an additional revenue stream. Distributed wind projects likely will have higher unit transaction costs in the REC market, however, than would be the case for larger REC market participants.9 The market potential analysis incorporated unique REC prices based on the latest statewide information available. RECs played a role in determining the feasibility of wind projects. See section 4.2.8.2.2 (Renewable Energy Certificate Value) for more details.
A number of commercial, utility and governmental programs stimulate voluntary demand for renewably generated electricity and unbundled RECs. The Environmental Protection Agency’s Green Power Partnership, for example, has recruited nearly 1,000 partners that collectively purchase nearly 15 billion kWh of renewably generated electricity each year (EPA 2007). More than 600 utilities now offer renewable electricity tariffs, whereby customers can choose to
9 The benefits of RECs could be enhanced if certain clarifications were made at the state level, including the exact environmental attributes included in a REC, and whether RECs sold through voluntary programs can be included under RPSs (Holt and Wiser 2007). Standardization across the states in the approach to these issues also would improve the benefits (Holt and Wiser 2007).
25

purchase renewable electricity for all or a portion of their electricity consumption. These programs sold more than 2.5 billion kWh of electricity in 2005 (Bird and Swezey 2006). Independent marketers of RECs and green electricity (the latter only in competitive electricity markets) also have stimulated demand for renewable electricity, and sold an estimated 6 billion kWh in 2005 (Bird and Swezey 2006).10
All of these programs help support renewable energy generally and sometimes even distributed wind specifically, but they are not widely adopted across the states and, in some cases, they fail to support mid-scale turbine distributed wind projects. The Minnesota C-BED initiative has not generated additional interest in mid-scale turbines, for example, but rather it has garnered additional interest in utility-scale machines that provide better returns and allow utilities to make larger gains with fewer projects (Johnson 2007, Haase 2007, DOE 2006).
In states that have no RPS, it is in theory possible to generate greenhouse-gas emissions reductions credits for either domestic or international trading purposes as an additional revenue source. Although the project team has found no distributed generation project that has attempted to register greenhouse gas credits, quantification of the displaced emissions benefit can be monitored and verified to a great degree, and therefore in some instances a potential market for these credits can be generated. Regulatory policy still is evolving in many regions (such as California and the ten eastern states of the Regional Greenhouse Gas Initiative) in this area, therefore this revenue stream currently is uncertain.
3.2.2 Local Economic Development The second most important driver of mid-scale distributed wind projects is the desire by individuals, groups, and the government to stimulate local economic development. Distributed wind projects create local jobs during construction, and locally owned projects create new revenue streams in the community.
In Iowa, Illinois, Wisconsin, and Minnesota, a primary driver of distributed wind and in particular community-owned11 distributed wind projects has been the desire to increase rural income (Bolinger and Wiser 2004). Washington State also has seen significant distributed wind activity driven by economic development considerations (Usibelli 2007). The Northwest Sustainable Energy for Economic Development, for example, promotes distributed wind applications as a means for economic development in the state’s rural communities (Usibelli 2007). In Bellingham, another group, A World Institute for a Sustainable Humanity, has installed small-scale projects in low-income communities with the goal of generating a revenue stream (Usibelli 2007). Although financial returns for the investor and environmental benefits have been the primary drivers of mid-scale distributed wind projects in the state, economic development also has been an important driver (Usibelli 2007).
10 These numbers are not additive. Some of the utility sales and much of the REC marketer sales are to corporations and institutions in the EPA’s Green Power Partnership. 11 “Community wind” can refer to wind projects owned by a municipal government (http://www.masstech.org/renewableenergy/Community_Wind/index.htm (accessed October 20, 2008)) or it can refer to distributed wind projects owned by a consortia of local investors with significant local benefits (http://www.windustry.org/communitywind (accessed October 20, 2008)).
26

In South Dakota, a group called the Miner County Community Revitalization supported distributed wind projects to promote local economic development by creating local jobs that provide good wages and encouraging affordable housing (Parry 2007). Energy costs, the existence of the PTC, and environmental concerns also were motivators, but the primary driver was local economic development (Parry 2007).
3.2.3 Educational Value Another driver for mid-scale turbine distributed wind projects is the desire to use a project to educate students, demonstrate the viability of wind projects to surrounding communities, and study the performance of a particular machine. For Laq qui Parle Valley High School in Madison, Minnesota, financial factors dominated its decision to take on a distributed wind project, but the desire to educate students and benefit the environment also played a role (Munsterman 2007). Similarly, some projects are designed to demonstrate distributed wind technology, such as the single turbine installed by the Rosebud Tribal Utility Commission in the late 1990s. This project was undertaken with the goals of demonstrating to other tribes the viability of wind energy and contributing to efforts to address climate change (Rodgers 2007). In certain cases, projects also can be initiated to test the performance of a technology, such as the use of European 50 Hz turbines in the 60 Hz North American environment (Johnson 2007).
3.2.4 Environmental Benefits The desire to take action against global warming and other environmental concerns through the creation of clean, renewable energy projects is another driver of the mid-scale turbine distributed wind market. Although this desire typically serves as a secondary motivation (Usibelli 2007), in certain cases, such as the Rosebud Tribal Utility Commission project noted above, it is considered one of the primary drivers (Rogers 2007). Also, in Massachusetts a local developer of a condominium complex on a redeveloped brownfield site is combining the green architectural design of the condos with a distributed generation wind turbine and marketing the complex to those individuals who desire a sustainable lifestyle. These environmental issues become more and more intertwined with economic considerations based on the expectation that there will be a market for carbon credits that will further improve wind economics (Pearce 2007). Whether wind and other renewables do in fact benefit from carbon emission regulation depends on the policies and regulations adopted.
4 Market Potential Estimation for Mid-Scale Wind
The purpose of this analysis is to estimate the technical and economic market potential for mid-scale distributed wind turbine installations in the lower 48 states and the District of Columbia (referred to as the contiguous United States herein). The analysis assumed that distributed wind turbines that were technically and financially feasible under current market and policy conditions would be installed, and those that were not feasible would not be pursued. It is important to note, however, that even when wind turbines are uneconomic some customers will install distributed turbines to demonstrate their energy security, environmental and social benefits, and the owner’s commitment to these goals.
The analysis evaluated turbine packages between 10 kW and 5,000 kW, using prices, market conditions, laws, regulations, and availability of turbine models as of June 2008. Additionally, two “virtual” wind turbines were included in this study. These virtual turbines incorporate the
27

technology improvements anticipated through further R&D, and through technology transfer from larger, more modern turbines. These two turbines are referred to here as the NREL 250 and the NREL 500. A full discussion of these turbines is provided in section 4.5.
4.1 Summary of Methodology To assess the technical and economic potential for distributed wind, the project team employed the following two-step analysis.
1. Evaluate the parameters that affect the economic consequences of installing mid-scale distributed wind projects. The project team ran a standard pro forma financial analysis model to calculate the net present value of installing a distributed wind project under a variety of project conditions. The analysis examined input assumptions including customer type, retail electric rate, available wind resource, and size of the turbine installation. In total the different input assumptions formed 7,777,770 combinations, each a unique scenario for which the model calculated a corresponding NPV. Some of the scenarios yielded a net financial benefit, others a net financial loss. See section 4.2 for a presentation of the financial analysis.
2. Analyze millions of existing sites to identify those which would benefit financially from the installation of a mid-scale distributed wind project. This analysis had four principal steps.
A. First, a GIS-based analysis screened 21,900,000 organizations and 2,840,000 raster cells (areas of one square mile) covering the entire contiguous United States. The analysis employed simple screening criteria to eliminate those which could not conceivably benefit from the installation of distributed wind. See section 4.3.2.
B. Second, the project team reviewed the technical and financial characteristics of each site that survived Step 2A, and matched each site with the appropriate scenario created in Step 1. See section 4.3.3.
C. Third, the analysis totaled the sites having characteristics that matched one of the scenarios with a net financial benefit, to estimate the market potential for mid-scale distributed wind installations. See section 4.3.5.
D. Fourth, the project team conducted an automated analysis of the results of Step 2B to account for budget-capped state and federal government incentives, such as grants and feed-in tariffs, which only are available to some of the qualifying applicants. The capped incentive analysis produced additional sites with a positive NPV, increasing the tally of “winning” sites. See section 4.3.5.
4.2 Financial Modeling The economic viability of a distributed wind project is determined by numerous factors, including wind resource, the turbine, the site energy consumption, electricity prices, and incentive levels. In a country as large and diverse as the United States, these factors can be found in millions of combinations. A site in New York might have poor wind resources, high electric rates, and significant state incentives, for example, whereas a site in Wyoming might have excellent wind resources and lower electric rates and fewer state incentives. To ensure that every
28

possible combination of factors was available for consideration, the project team developed a methodology (described below) to identify a reasonable range of values for each factor. For some factors, such as wind resource, only a handful of possible values exist. For others, such as retail electricity price, dozens of possible values were found. Nearly 8 million different combinations of factors exist—each of which yielded its own NPV.
It is important to note, however, that many of these combinations, whether yielding a positive or negative NPV, do not exist in reality. The financial analysis developed an NPV for a project located in Alabama in wind power class (WPC) 7, for example, even though WPC 7 cannot be found anywhere in Alabama. By providing outputs for all scenarios, the project team ensured that no scenario that could exist at a particular site was omitted.
ICF International, Inc. analyzed the 8 million scenarios using a wind project analysis model recently developed and released by the non-profit group Windustry. The project team modified the model based on the particular needs of the study and used it for the financial analysis.12 Windustry’s model uses several input assumptions, described below, to calculate NPV over a 20-year horizon.
4.2.1 Wind Power Class A site’s wind power class is related to its typical wind speed, measured at 10 meters and at 50 meters above the site. WPC ranges from 1 to 7, with WPC 1 offering the least wind power and WPC 7 the most. A higher WPC increases the potential electricity production from a specific wind turbine. Table 3 presents the study’s assumptions about the relationship between WPC and turbine production. The project team eliminated areas in WPC 1 from the analysis, therefore WPC accounted for six variants in the model.13
4.2.2 Wholesale Power Price When distributed wind projects export power to the grid (as opposed to displacing site load), the utility usually pays using wholesale market rates. The Energy Information Administration of the U.S. Department of Energy (EIA) disaggregates the contiguous United States into 13 wholesale electric power pools, each with its own prices. The boundaries of these power pools typically follow utility rather than state boundaries. To simplify the analysis, however, the project team assigned each state to the power pool which contained the largest fraction of the state’s territory. See Figure 11.
The EIA projects electricity generation costs in each power pool over a 20-year horizon. The project team inflated these constant-dollar values to produce future nominal dollar values. Figure 7 (below) depicts EIA’s projections of future wholesale generation prices (NERC 2007, EIA
12 Windustry Wind Project Calculator (http://www.windustry.org/calculator/default.htm). Windustry’s model is based in Microsoft Excel. To manage the millions of records that the model analyzed, the project team used Microsoft Excel 2007; SAS software, version 9.1, SAS Institute Inc., 20022003; and Oracle Database 10g, Release 2, Standard Edition 2005. 13 Before conducting the study, the project team ran a preliminary analysis of the model. The results of this analysis revealed that there are very few scenarios for which project economics are favorable in WPC 1.
29

2007b). Note that the difference between the lowest and highest priced power pools is typically $0.04 to $0.05 per kWh in any given year.
0.00
2.00
4.00
6.00
8.00
10.00
12.00
14.00
2009 2010 2011 2012 2013 2014 2015 2016 2017 2018 2019 2020 2021 2022 2023 2024 2025 2026 2027 2028
Year
Cen
ts/k
Wh
ECAR ERCOT MAAC MAIN MCAPP NYISO NEPOOL FRCC SERC SPP NWPP RMPA CAISO
Figure 7. EIA wholesale generation price forecast, by power pool, nominal dollars (EIA 2007b)
4.2.3 Customer Type The financial analysis estimated the potential for distributed wind for four different customer types: commercial, industrial, public facilities, and community wind.14 The project team excluded certain customer types from the study, such as agricultural and military facilities, because they lacked data necessary for the analysis. Customer type affected all of the input assumptions (below). Table 7 outlines the impact of customer type on these input assumptions.
4.2.4 Retail Electric Rate A distributed wind turbine’s greatest economic benefit to commercial, industrial, and public facilities customers is the displacement of electricity purchased from the electric power company at the retail electric rate. (Community wind is unaffected by retail electric rates because these installations do not displace onsite consumption.) A distributed wind turbine creates a greater economic benefit when it displaces high-cost power than when it displaces lower-cost power.
14 The study defined public facilities as public administration institutions (such as government offices and agencies), and non-governmental organizations (NGOs) (such as faith-based organizations, and civil and social non-profit groups).
30

In the contiguous United States, most retail electric rates range from $0.04/kWh to $0.40/kWh on an “all-in” basis (i.e., including all charges by the utility to the customer).15 The analysis ran 37 variants at $0.01 increments within this range. While retail rates vary by season and time of day, this level of detail was beyond the scope of the study and thus not included in the analysis. These retail electric rates were modified to account for the fact that distributed wind installations do not displace all of the components of a customer’s electric bill. These components typically include the following.
• A monthly charge that a customer is required to pay to remain connected to the electric utility.
• A peak demand charge based on the customer’s peak level of demand (measured in kilowatts) during the billing period. Although it is possible that a distributed wind turbine can reduce a customer’s peak demand if the turbine is generating power during the customer’s peak demand period, it is difficult to predict this coincidence in advance, or to guarantee that it will occur every month during the 20-year analysis period.
• An energy charge which compensates the utility for the amount of energy the customer consumes (measured in kilowatt hours) over a specified time period. A distributed wind turbine can reduce the energy charge: each kilowatt hour of electricity production by the turbine can eliminate a kilowatt hour of energy purchased from the utility.
• A social benefit charge that many utilities also collect to contribute to the utility’s or the state’s energy efficiency, renewable energy, and fuel poverty programs. These charges typically are assessed based on the customer’s energy consumption and can be reduced in the same manner as the energy charge.
The analysis assumed that installing an onsite wind project would affect only the energy charge and social benefit charge components of the electric bill, both of which are measured in kWh. The project team then applied this decision to the “all-in” electric rates obtained from EIA to determine what fraction of these all-in rates were avoidable through the installation of distributed wind. The team estimated that these components would constitute 60% of a commercial customer and public facility’s all-in retail electric rate, and 80% of an industrial customer’s rate. These estimates are based on the typical load factor characteristics of commercial and industrial operations.16 Commercial facilities typically have a lesser load factor than that of industrial facilities, and thus a larger fraction of their overall bill is driven by the peak demand charge. 15 Given the diversity of billing structures used by more than 3,000 U.S. utilities, this analysis used a simplified electric rate which relied on data reported by utilities on the Energy Information Administration (EIA) Form 861. Using Form 861, utilities report gross revenues and megawatt hours sold by customer class. Dividing revenues by megawatt hours yields an “all-in” rate in cents per kilowatt hour for that customer type, capturing both energy-based revenue and demand-based revenue. Form 861 is available from EIA (http://www.eia.doe.gov/cneaf/electricity/forms/eia861/eia861.pdf). Data collected from the nation’s utilities using Form 861 are compiled in U.S. Department of Energy, Electric Sales and Revenue 2005 (http://www.eia.doe.gov/cneaf/electricity/esr/esr_sum.html). 16 Load factor is the ratio of actual kWh used in a measurement period divided by the potential kWh used if the customer maintained its peak demand throughout the measurement period. A low load factor causes more of the bill to be related to kW-based charges; a high load factor causes more of the bill to be related to kWh-based charges.
31

4.2.5 Net Metering As discussed in section 3, properly designed net metering rules enhance the financial returns from distributed wind power. Net metering rules vary by state and customer type. In many states, net metering only applies to investor-owned utilities (IOUs). For simplicity’s sake, the analysis assumed that if net metering was available to a state’s IOUs, then it also was available to the state’s municipal and co-op utilities. The analysis considered every combination of state and customer type to represent net metering rules as of June 2008. It also was assumed that community wind projects would export all energy produced onsite, therefore net metering is not a relevant consideration for this customer type.
4.2.6 Project Size The financial analysis examined the installation of nine possible distributed wind power project sizes, ranging between 10 kW and 5,000 kW. In addition to these nine, two “virtual” turbines—the NREL 250 and NREL 500—also were analyzed. The sizing of the projects and the assign-ment of each site to a project size relied on assumptions about turbine availability (the supply side) and about how customers would select available turbines to install (the demand side).
4.2.6.1 Supply Side The analysis assumed that seven turbine models were available, with nameplate capacity ratings of 10 kW, 50 kW, 100 kW, 250 kW, 500 kW, 750 kW, and 1,000 kW. The analysis examined how the turbines between 10 kW and 1,000 kW could be deployed in the non-residential market. The two NREL virtual turbines also were considered, and two multi-turbine configurations were developed for the non-residential market: 2 x 1,000 kW turbines and 5 x 1,000 kW turbines. Table 4 lists the turbine models used for this study, their capacity, and their placement within the mid-scale wind markets.
4.2.6.2 Demand Side The analysis calculated the economics for each turbine available to a site based on the factors described below.
• Net annual production. A turbine’s electricity production varies by WPC. The analysis created scenarios for every combination of project size and WPC.17 Table 3 presents net annual electricity production for each combination of project size and wind power class.
• Project costs. The analysis assumed installed project costs and annual ongoing costs as shown in Table 4 and Table 5, respectively.18 Table 4 illustrates the economies of scale of distributed wind; project cost per installed kilowatt decreases as the project sizincreases.
e
• Community wind. The analysis assumed that community wind projects export 100% of the energy produced onsite to the grid. This assumption distinguishes community wind from the other customer types in the model. Due to economies of scale and an onsite
17 Each project size uses only one type of turbine model, therefore the analysis could accurately calculate a project’s net annual production using a turbine model’s nameplate capacity rating. See Table 4 for the relationship between turbine models and project sizes. 18 The project team gathered these data from market research and via conversations with industry experts.
32

consumption of 0%, net financial benefit increases with project size. The analysis there-fore assigned the largest project size in the model (5,000 kW) to all community wind sites.
• Commercial, industrial, and public facilities. These customer types had access to eight different turbine packages and two NREL virtual turbines. The project team considered all appropriate turbines sizes for each customer. Two opposing factors are important considerations. First, as shown in Table 4, capacity costs ($/kW) generally decline with increasing project size. Conversely, for any given customer, as project size increases an increasing fraction of the turbine’s output is exported offsite and valued at wholesale rates, which generally are less favorable than retail rates.
Table 3. Net Annual Electricity Production (kWh) in the First Year of Operation by
Project Size and by WPC
NREL WPC Project size
10 kW 50 kW 100 kW 250 kW 500 kW 750 kW 1,000 kW 2,000 kW 5,000 kW 2 10,021 104,528 155,387 384,076 728,579 1,099,432 1,374,759 2,749,518 6,873,795
3 13,038 133,198 198,548 493,223 955,680 1,425,200 1,811,915 3,623,830 9,059,575
4 15,370 155,250 232,487 580,166 1,135,119 1,684,812 2,159,847 4,319,694 10,799,235
5 17,405 174,556 262,742 658,003 1,294,107 1,916,307 2,469,839 4,939,678 12,349,195
6 19,782 198,212 300,437 756,259 1,491,512 2,205,694 2,855,960 5,711,920 14,279,800
7 24,759 253,771 398,549 1,015,119 1,987,834 2,941,286 3,826,780 7,653,561 19,133,902
Table 4. Installed Costs in Relation to Turbine and Project Sizes
Project Size (kW) Number of Turbines
in Project Example Turbine Installed Cost per Turbine
Installed Cost of Project
Installed Cost per kW
10 1 BWC 10 $60,000 $60,000 $6,00050 1 EW15 $250,000 $250,000 $5,000
100 1 Northern Power NW 100/21 $450,000 $450,000 $4,500
250 1 Fuhrländer FL 250 $800,000 $800,000 $3,200
500 1 Vestas V39 $1,400,000 $1,400,000 $2,800
750 1 Norwin 46-ASR-750 $1,900,000 $1,900,000 $2,533
1,000 1 Nordic 1000L $2,300,000 $2,300,000 $2,3002,000 2 Nordic 1000L $2,300,000 $4,200,000 $2,1005,000 5 Nordic 1000L $2,300,000 $9,900,000 $1,980
Table 5. Annual Ongoing Expenses by Customer Type
Unit Commercial, Industrial, and
Public Facilities Community
Wind Operations & maintenance $/kWh $0.0100/kWh $0.0100/kWh
Operations & maintenance contingency fund $/kWh $0.0030/kWh $0.0030/kWh
Insurance $/kW $8.00/kW $8.00/kW
33

Unit Commercial, Industrial, and
Public Facilities Community
Wind Property tax $/kW $6.00/kW $6.00/kW
Administrative/financial/legal management $/kW $1.00/kW $1.00/kW
Production tax expense $/kWh $0.00 $0.00
Warranty expense $/kW $13.00/kW $13.00/kW
Decommissioning fund pre-warranty expiration $/kW $0.00 $0.00
Decommissioning fund post-warranty expiration $/kW $1.00/kW $1.00/kW
Other expenses $/kW $2.00/kW $2.00/kW
4.2.7 Onsite Energy Use The electricity produced by a distributed wind turbine can be used onsite to displace deliveries from the electric utility or, if the turbine’s production exceeds the site’s consumption, the excess can be exported offsite to the grid. The unit prices ($/kWh) of displaced and exported electricity can differ by a substantial amount, thus it is important to evaluate the partition of the turbine’s electricity production between these two destinations to correctly value the turbine’s output. The onsite ratio—the percentage of turbine production that is used to displace utility deliveries—is a function of customer type, customer electricity consumption (both total load and seasonal and diurnal consumption patterns), turbine size (make and model), and the wind resource (winds speed distribution and seasonal and diurnal variation).
• Community wind (CW). Community wind projects were assumed to export all of their production to the grid; thus they had no onsite consumption.
• Commercial, industrial, and public facilities (CIP). o Scenarios with net metering. To create cases representative of all possible on-
site ratios that might be encountered in the real world, the analysis started with a stepped series of values for onsite electricity consumption for commercial, industrial, and public facilities. These values were used as the numerators of the onsite ratios. For the denominators the analysis used the production of each of the nine eligible turbine packages operating at a 25% capacity factor. The ratio of electricity consumption to electricity production was computed for each combination of production and consumption. In this analysis, all ratios greater than one were adjusted to 100% and all ratios less than one were rounded to the nearest tenth of a percent (e.g., 77% was rounded to 80%). This resulted in 11 possible onsite ratios for the CIP sector (0% to 100%).
o Scenarios with no net metering. If a site does not have net metering rules, it is necessary to estimate the extent to which the turbine’s production will be coincident with the site’s consumption. Only coincident generation is valued at retail rates; any generation produced beyond onsite consumption within the metering interval is exported to the grid at wholesale rates. The analysis assigned a coincidence factor of 35% to each turbine. The project team estimated this factor based on a review of several real-world project pro formas and on conversations with industry experts. While an assigned coincidence factor was
34
necessary for the analysis, the project team understands that the coincidence factor depends on the relative size of the turbine energy production and the site load. The greater the production compared to the load, the smaller the coincidence factor. Conversely, the smaller the production compared to the load, the greater the coincidence factor.
4.2.8 Project Financing Table 7 presents the input assumptions that the project team developed around project financing. This section highlights key assumptions.
4.2.8.1 Discount Rate The discount rate is a powerful—and often contentious—element in project financial analysis. It is used to discount future cash flows, both costs and benefits, to their present-day equivalents. There are several different approaches to defining and choosing discount rates for a particular financial analysis. For this study, the approach taken was that the discount rate should reflect the investor’s alternative investment opportunities (or borrowings) at a comparable level of risk. The analysis developed different discount rates for different customer classes, described below.
• Public facilities: 4.90%. This rate is equivalent to the interest rate on 20-year, AAA-rated tax-exempt insured municipal bonds in June 2008 (Bloomberg 2008).
• Commercial and industrial customers: 7%. This rate is two percentage points greater than the U.S. prime lending rate in June 2008.
• Community wind: 8.25%. This rate is 3.25% more than the U.S. prime lending rate in June 2008, and is intended to address the larger investment scale and more complex ownership structure of these projects.
Greater or lesser discount rates would produce fewer or more winning projects, respectively.
4.2.8.2 Project Ownership and Capital Structure The analysis assumed that the owner of the property also would own the distributed wind installation. All projects were assumed to be equity funded and to have no debt.
4.2.8.2.1 Tax Depreciation Schedule The U.S. income tax code provides for the Modified Accelerated Cost-Recovery System to be used to accelerate asset depreciation. The analysis assumed that MACRS is available to all tax-paying commercial and industrial customers. Public facilities, as tax-exempt entities, do not benefit from MACRS.
4.2.8.2.2 Renewable Energy Certificate Value As discussed in section 2, renewable energy certificates offer an additional revenue source for wind projects. The value of RECs varies across states as a result of many factors, including each state’s particular Renewable Portfolio Standard (RPS) program and the level of demand from the voluntary market. States having policies that restrict REC eligibility in the state’s RPS typically have greater REC prices than found in states that have less restrictive RPSs or no RPS at all. States were assigned REC prices based on REC broker quotes. For states that did not have a state-specific broker quote, the analysis assumed a default value of $0.0057/kWh—the price of a national Green-e Energy certified REC (Spectron 2008, ICAP 2008).
35

Table 6. National and State-Specific REC Adder Values
Value Area REC Value ($/kWh) Default (All states except those listed below) $0.0057 Connecticut, Maine, New Hampshire, Vermont19
$0.042 Massachusetts, Rhode Island20 $0.045 Maryland $0.00175 New Jersey $0.022 New York $0.015 Pennsylvania $0.004 Texas $0.00563 Western Electricity Coordinating Council (WECC)21
$0.00715 4.2.8.2.3 Federal Government Incentives The federal government offers incentives for the development and operation of renewable energy facilities. The project team divided these incentives into two categories: incentives with programmatic caps, budget caps, or restrictions (such as budget-limited grant programs), and incentives without any caps (such as the federal Production Tax Credit). The project team did not include capped incentives in the main financial analysis because that would have led to an overestimate of the number of economically successful sites. Instead, the project team integrated these capped incentives into the results through a subsequent “capped” analysis, discussed in section 4.3.5. The main financial or “uncapped” analysis did include the PTC, the only uncapped federal incentive.
The analysis assumed that the PTC would offer a $0.02 per kWh tax benefit for the first 10 years that recipients generate renewable energy and sell it to a third party. The project team escalated the PTC at a 3% inflation rate. The PTC is available to all tax payers producing mid-scale wind power—commercial and industrial facilities, and community wind.
4.2.8.2.4 State Government Incentives The project team created a standardized listing of state incentives offered for the installation and operation of distributed wind (DSIRE 2008). The team conducted follow-up research using online resources and through conversations with government officials and stakeholders. As with federal government incentives (see section 4.3.5.1), the project team omitted capped incentives from the main financial analysis and integrated them into the model through a subsequent capped analysis (discussed in section 4.3.5.1).
The project team included uncapped, unrestricted state incentives in the main financial analysis. State sales- and property-tax exemptions also were included according to state rules. If an 19 All onsite wind projects in ISO-NE are eligible to qualify for the Connecticut REC market. Thus Maine, New Hampshire, and Vermont have Connecticut values. 20 It is assumed Rhode Island RECs have the same value as Massachusetts RECs, because the states have virtually the same eligibility rules. 21 Western Electricity Coordinating Council includes Arizona, California, Colorado, Idaho, Montana, Nebraska, Nevada, New Mexico, Oregon, South Dakota, Utah, Washington, and Wyoming.
36

incentive applied to the majority of a state (for example, to the customers of a specific utility that provides service to most of the state), then the project team applied the incentive statewide. The analysis included policies in effect as of late June 2008. Each incentive was applied according to its rules, such as whether the incentive was cost based or production based, how many years the site could qualify for the incentive, and the monetary value of the incentive.22 Appendix B provides a complete list of state incentives included in the financial analysis.
Table 7. Project Financing Assumptions by Customer Type
Commercial/ Industrial
Public Facility
Community Wind
Discount rate 7.00% 4.90% 8.25% Capital Structure 100% equity 100% equity 100% equity Annual escalation rate 4% 4% 4% Line extension cost No No 5% of project cost REC value See Table 6 See Table 6 See Table 6 Federal income taxes included Yes No Yes Federal tax rate 35% No 35% Production tax credit utilized Yes No Yes MACRS utilized Yes No Yes State incentives Varies by state Varies by state Varies by state Retail electric rate Varies by utility Varies by utility N/A Energy charge as percentage of retail electric rate
60% commercial, 80% industrial 60% N/A
Net metering Varies by state Varies by state N/A
Turbine assignment methodology
10 kW, 50 kW, 100 kW, 250 kW, 500 kW, 750 kW, 1,000 kW turbines tested for all sites;
NREL 250 and NREL 500 also
tested
10 kW, 50 kW, 100 kW, 250 kW, 500 kW, 750 kW, 1,000 kW turbines tested for all sites;
NREL 250 and NREL 500 also
tested
5,000 kW tested for all sites
Onsite ratio
Consumption divided by turbine production
rounded to the nearest 10%; varies
by individual site
Consumption divided by turbine
production rounded to the nearest 10%.;
varies by individual site
N/A
22 All capacity-based incentives had a budget cap and therefore were excluded from the capped analysis.
37

4.2.8.3 Summary of the Financial Analysis To summarize, the project team ran the “uncapped” financial analysis against every possible combination of the following variants.
• Six WPC
• Five customer types (the residential segment is not described separately in this report, however it was analyzed so that its results could be used in section 4.3.5)
• Thirty-seven retail electric rates
• Forty-nine states (the choice of state, with the District of Columbia included, also determined values such as wholesale power prices, the nature and magnitude of state incentives, REC prices, and net metering rules)
• Thirteen project sizes (including two turbine sizes specific to residential customers)
• Eleven onsite ratios These variants created a total of 7,777,770 scenarios, and either a positive or a negative NPV was calculated for each. As noted, many of these combinations—whether yielding a positive or negative NPV—do not exist in reality.
4.3 Preparation of Real-World Data for Comparison to the Financial Model The second step in estimating market potential involved taking real-world data on U.S. organizations and communities, and preparing it so the model could match each site to one of the scenarios generated by the financial analysis. The data preparation process involved four major steps: (1) preparing the data by customer type; (2) conducting a GIS-based analysis to eliminate sites based on established parameters for available wind resource, population density, elevation and slope; (3) assigning the “surviving” sites to turbine project sizes; and (4) assigning characteristics pertaining to the financial model to surviving sites, such as retail electric rate.
4.3.1 Preparing the Data by Customer Type 4.3.1.1 Commercial, Industrial, and Public Facilities To collect the necessary data for commercial, industrial, and public facilities, the study used the Homeland Security Infrastructure Protection (HSIP) Gold database, a collection of dozens of public and commercial databases licensed for federal government use by the National Geospatial Intelligence Agency. The U.S. Department of Energy provided a copy of the HSIP Gold database to the project team under the terms of the database license. One of the databases within HSIP Gold is the Dun & Bradstreet (D&B) file of U.S. organizations, believed to be the most extensive available databases of U.S. organizations (D&B 2006). Certainly there are organizations that are not listed in the D&B database, but most organizations with significant participation in commercial or regulatory transactions eventually obtain a Data Universal Numbering System (D-U-N-S) identifier from D&B and are included in the database. This database includes organizational characteristics (e.g., name, 4-digit Standard Industrial Classification (SIC) code, 6-digit North American Industry Classification System (NAICS) code, employee count) and the geospatial location (latitude and longitude) of 22,600,000 organizations in the United States. Of the 22,600,000 organizations, 21,900,000 qualified as commercial, industrial, or public facilities for this study. Using the latitude and longitude data, the project team mapped commercial, industrial, and public facilities as points on a map of the contiguous United States.
38

4.3.1.2 Community Wind No database of community wind sites exists, therefore the project team instead used an area-based approach to identify suitable locations for distributed wind for this customer type. The project team assembled a map of the contiguous United States in raster format, creating a grid of 2,840,000 cells representing one square mile each. Each raster cell was evaluated as a suitable site for a community wind project.
The project team identified each raster cell by its centroid (center point) and assigned the centroid’s characteristics (e.g., state, wind power class, electric utility) to the entire raster cell. In reality, however, some geospatial characteristics (e.g., WPC, electric utility) might vary across a one-square-mile raster cell.
4.3.2 Geographic Information System Analysis For the second step in the data preparation process, the project team conducted a geographic information system (GIS) analysis to identify and eliminate sites and raster cells where the elevation was so high that installation of a wind turbine would be unlikely; the slope of the terrain was greater than 10% making the area too steep for installation of a wind turbine; the population density suggested that there would not be a suitable amount of available open space for the installation of one or more wind turbines; regulations prohibit the installation of wind turbines; and the available wind resource is not great enough to provide favorable project economics.
4.3.2.1 Elevation The GIS analysis identified areas in 11 western states areas at elevations higher than the elevations listed in the table below. The analysis assumed that these areas would likely be too difficult to access or otherwise unsuitable for wind turbine installation.
Table 8. Elevation Exclusions by State
State Elevation Cap (ft)WA 7,000 OR 8,000 ID 8,000 MT 8,000 WY 9,000 CA 9,000 NV 9,000 UT 9,000 CO 10,000 AZ 9,000 NM 9,000
4.3.2.2 Slope The GIS analysis next screened for those areas of the country with a slope of 10% or greater and eliminated them. A 10% slope is the approximate grade of the steepest mountain roads. The project team assumed that these sites likely would be too difficult to reach and too costly for wind turbine installation.
39
4.3.2.3 Site Size The GIS analysis then screened for site size and eliminated those sites that would not be suitable for distributed wind.
4.3.2.3.1 Developing a Site-Size Proxy Ideally, the study would geo-locate business sites to their actual land parcel to determine whether sufficient area was available to install one or more wind turbines, given issues such as zoning, safety regulations, and aesthetic concerns. Such data are not available on a national scale; in-stead, the analysis used Census Block Group–level population density data as a proxy for site size.23
The study assumed that Block Groups with a population density greater than 500 people per square mile would be too built-up and too densely populated to allow for the installation of distributed wind turbines. To develop this assumption, the project team produced maps at the U.S. Census Block level for a few selected areas (covering dozens of Blocks) familiar to it, and examined the maps in light of local knowledge. Even Blocks—the smallest level of U.S. Census disaggregation—can have significant heterogeneity. The team occasionally found potentially suitable distributed wind sites in Blocks with a population density greater than 250 people per square mile. Although a cutoff of 250 people per square mile appeared appropriate at the Block level, the project team selected a more generous cutoff of 500 people per square mile for the Block-Group level, to acknowledge the potential for greater heterogeneity in a larger geographical unit.
4.3.2.3.2 Screening for Site Size To conduct the site size screening, the analysis used U.S. Census Bureau population density data at the Block-Group level to create a population density polygon file and converted the file into a raster format (Geolytics 2000). The analysis layered the surviving sites (point files and raster cells) from the wind resource screening on top of the population density raster file to eliminate sites located in areas with a population density greater than 500 people per square mile. The remaining sites or raster cells were deemed “survivors” and moved on to the next step in the screening process.
Figure 8 delineates U.S. population density by 500 people per square mile, the cutoff for all customer types. Figure 9 shows that the majority of the country’s land area has a population density less than this cutoff; eliminated areas correspond to large urban areas.
23 Census Blocks are the most granular level of geography in the U.S. Census’ publicly available datasets. For a city, a city block might be a Census Block. For rural areas, a Census Block can cover many square miles. Multiple U.S. Census Blocks are contained within a Census Block-Group. Block-Groups generally contain between 600 and 3,000 people, with an optimum size of 1,500 people.
40

Figure 8. United States population density (ICF International 2008)
4.3.2.4 Wind Resource The screening process also eliminated sites located in areas designated WPC 1. This screening step had important implications; as Table 9 illustrates, approximately half of the land area in the contiguous United States has wind resources in WPC 1. Figure 9 provides a map of U.S. wind resource.
Table 9. Distribution of Land Area in the Contiguous United States by WPC
Wind Power Class Percentage 1 46.6% 2 22.8% 3 18.2% 4 8.7% 5 2.6% 6 0.8% 7 0.3%
41

Figure 9. United States wind resource by wind power class (ICF International 2008)
To screen commercial, industrial, and public facilities, the project team layered the D&B point files on top of a wind resource polygon file to assign sites to the WPC at their specific location (NREL 2008). To screen raster cells for the analysis of community wind, the project team converted the polygon file into a raster format and layered the community wind raster cells on top to assign each raster cell to the WPC present at its centroid. The screening process eliminated sites with a WPC of 1 from further consideration. Sites with WPC of 2 or more continued to the next step in the screening process with their assigned WPC.
The WPC elimination process should be viewed with some caution. State-level wind maps, even those certified by NREL, still are relatively coarse in scale, rely on various models to interpolate wind resources between monitoring locations, and can use inconsistent methods from state to state. It is important to note the sharp WPC boundaries between New York and Pennsylvania and between Illinois and Missouri and to consider their implications for the quality and consistency of state-level wind maps.
4.3.2.5 Excluded Lands The analysis eliminated lakes and rivers from the screening process, as well as certain lands based on their legal status. Regulations, either explicitly or indirectly, prohibit the installation of wind turbines on national and state park grounds, and on fish and wildlife refuges (Tele Atlas, ESRI). Figure 10 identifies the excluded lands eliminated from the screening process and those lands included in the analysis.
42

Figure 10. Excluded and analyzed lands (ICF International 2008)
4.3.2.6 Assigning Electric Power Company and Wholesale Power Region As the final step, the GIS analysis assigned each surviving site and raster cell to its associated electric power company and state. The analysis used this information in the data preparation process to match the appropriate retail and wholesale electric rates to each surviving site (see section 4.3.4.1) as well as the correct REC price and state incentive policies (see sections 4.2.8.2.2, 4.2.8.2.4, 4.3.5.2).
The analysis used the Platts geospatial data layers for Electric Investor Owned Utility (IOU) Service Territories and Electric Non-Investor-Owned Utility (Non IOU) Service Territories to create a polygon file of Platts Electric Service Territories (Platts 2008). The project team layered the point files and raster cells for the surviving sites on top of the polygon file to assign the correct electric power company to each site.
Next, data from the North American Electric Reliability Corporation (NERC) and the Energy Information Administration was used to assign the correct wholesale power region to each state ((NERC 2007, EIA 2007b). The analysis matched states in multiple wholesale regions with the region occupying the largest portion of the state. Figure 11 shows the assignment of wholesale power regions by state.
43
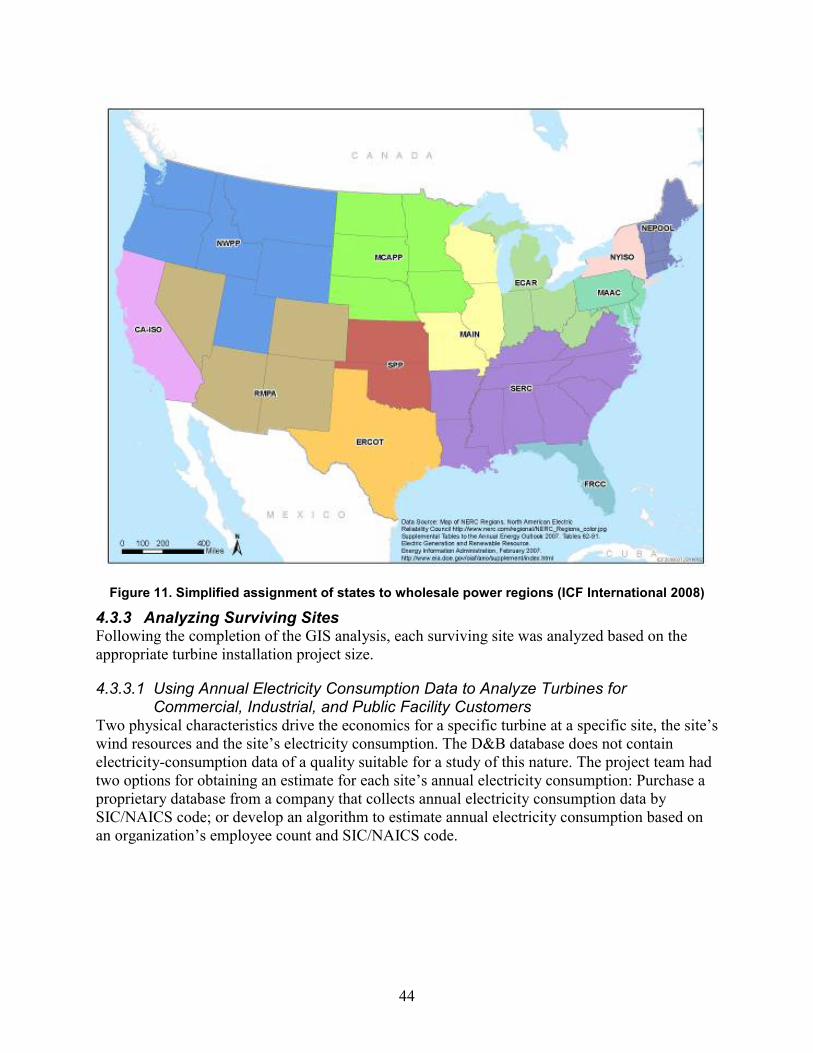
Figure 11. Simplified assignment of states to wholesale power regions (ICF International 2008)
4.3.3 Analyzing Surviving Sites Following the completion of the GIS analysis, each surviving site was analyzed based on the appropriate turbine installation project size.
4.3.3.1 Using Annual Electricity Consumption Data to Analyze Turbines for Commercial, Industrial, and Public Facility Customers
Two physical characteristics drive the economics for a specific turbine at a specific site, the site’s wind resources and the site’s electricity consumption. The D&B database does not contain electricity-consumption data of a quality suitable for a study of this nature. The project team had two options for obtaining an estimate for each site’s annual electricity consumption: Purchase a proprietary database from a company that collects annual electricity consumption data by SIC/NAICS code; or develop an algorithm to estimate annual electricity consumption based on an organization’s employee count and SIC/NAICS code.
44

IHS’ Commercial Energy Profile Database (CEPD) and Major Industrial Plant Database (MIPD) provide annual electricity consumption data for commercial and industrial organizations, respectively, by 4-digit SIC code.24 The cost of this data, however, exceeded the project budget, so the project team instead developed an algorithm. To run the algorithm, the project team had to find suitable data to develop annual kilowatt-hour consumption per employee figures for each NAICS code. For the industrial sector, the 2002 Census of Manufacturing and 2002 Census of Mining provided data for total annual electricity consumption and total number of employees by 6-digit NAICS code (Census 2002). The EIA Manufacturing Electricity Consumption Survey (MECS) supplied data on the percentage of electricity consumption attributable to HVAC (heating, ventilating, and air conditioning) by 3-digit NAICS code (EIA 2006a).
For the commercial sector and public facilities, the project team reviewed the EIA Commercial Buildings Electricity Consumption Survey (CBECS), but the data structure in CBECS proved to be too broad for the purposes of this study (EIA 2006b). Additionally, the data set does not include information for retail establishments. The team instead used the D&B Sales & Marketing Solutions 2003 MarketPlace database, which includes total annual electricity consumption and number of employees by 4-digit SIC code for most relevant industries. The team ensured that the MarketPlace data were consistent with other industry estimates by cross-checking sources, including a small subset of the IHS CEPD data previously purchased by the project team, and EIA’s CBECS data. Data was not available for a modest number of NAICS codes, so the team used its best professional judgment to assign appropriate kilowatt hour per employee data based on data drawn from similar NAICS codes. The EIA Annual Energy Outlook supplied data on the percentage of electricity consumption attributable to HVAC by 3-digit NAICS code (EIA 2008).
No electricity consumption data were available for the construction industry. Construction organizations typically do not consume large amounts of electricity at organization locations, so it was assumed that they had no electricity consumption.
The analysis calculated electricity consumption for all surviving sites as follows.
• It matched each site with the appropriate kilowatt hour per employee consumption factor, variable by NAICS code.
• It modified the kilowatt hour per employee consumption factor based on the percentage of electricity consumption attributable to HVAC (which is variable by state).
• It multiplied the modified kilowatt hour per employee figure by the number of employees at the site to estimate the site’s annual electricity consumption.
• It then considered all turbines available to that customer type as described in section 4.2.6.
4.3.3.2 Analyzing Turbines for Community Wind The study assigned all community wind sites the largest turbine package of 5,000 kW. As explained in section 4.2.6.2, this decision was based on financial factors. Unlike the other
24 IHS provides information related to energy, product lifecycle, security, and environment. http://www.ihs.com.
45

customer types analyzed, community wind does not have a retail energy charge to displace. All the electricity produced is exported to the grid at the wholesale power rate. Thus, for community wind, a project’s net financial benefit is optimized by following the economies of scale. Installing the largest project size available—5,000 kW—maximizes profits (from kilowatt hours generated) relative to project costs (measured as dollars per kilowatt). The economies of scale of distributed wind are illustrated in Table 4.
4.3.4 Assigning Additional Characteristics to Surviving Sites The final step in the data preparation process was to assign additional utility, state, and regional characteristics to the surviving sites, so that they could be compared to the financial model scenarios. The characteristics included retail and wholesale electric prices, the value of renewable energy certificate sales, the presence and level of net metering, state sales and property tax exemptions, and some state and federal government incentives.
4.3.4.1 Retail Electric Rates and Wholesale Power Prices The GIS analysis assigned each surviving site to its electric power company and wholesale power region as described in section 4.3.2.6. Using this information, each site was assigned a wholesale power price and a retail electric rate by customer type (excluding community wind). The analysis eliminated those sites for which a retail electric rate was unavailable.
4.3.4.2 Presence and Level of Net Metering Table 10 presents the net metering data assigned to surviving sites based on the site’s state, project size, and customer type. Each surviving site was assigned to a level of net metering (0 kW if the site was not eligible) based on the data in Table 10.25
Table 10. Maximum Capacity Allowed to Net Meter by State and Customer Type
State Commercial/
Industrial Public Facility
AL AZ AR 300 kW 300 kW CA 1,000 kW CO 2,000 kW CT 2,000 kW 2,000 kWDC 100 kWDE 2,000 kW 2,000 kWFL 2,000 kW 2,000 kWGA 100 kW ID 100 kW IL 40 kW 40 kWIN N/A 10 kW
25 See Appendix A for more comprehensive information about U.S. net metering by state. Please note that Appendix A was updated in May 2007; Table 10 was updated in late June 2008, and it contains the most current information.
46
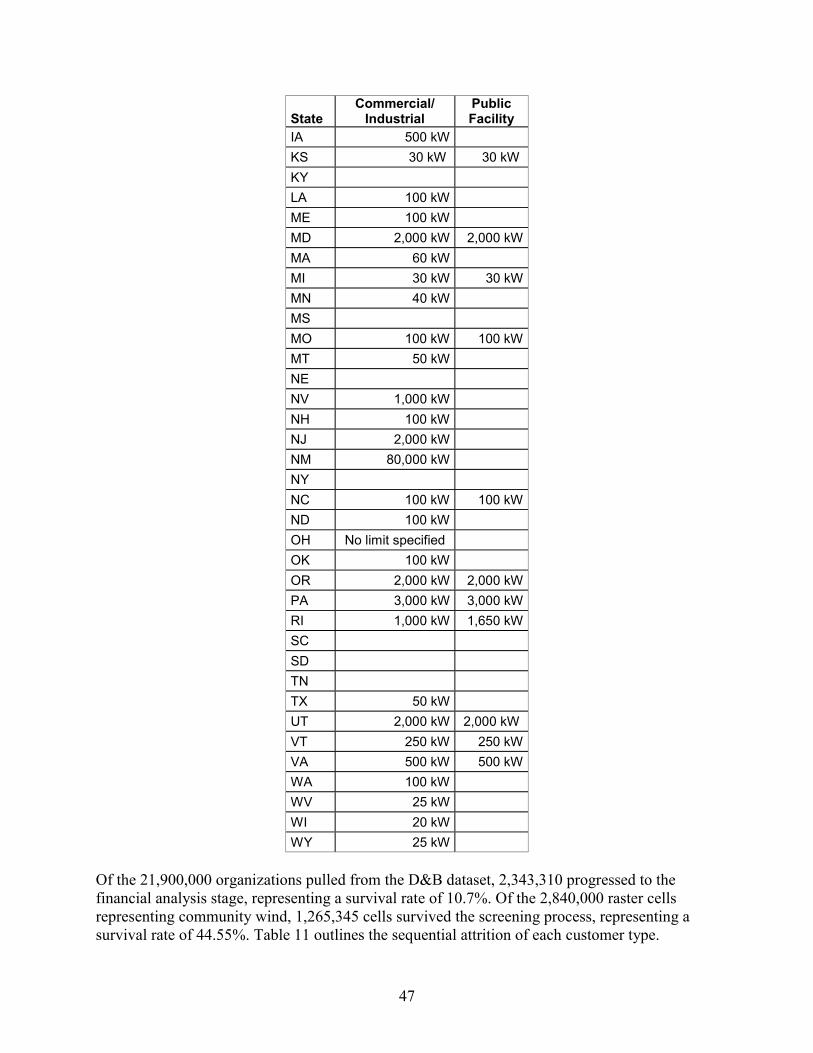
State Commercial/
Industrial Public Facility
IA 500 kW KS 30 kW 30 kW KY LA 100 kW ME 100 kW MD 2,000 kW 2,000 kWMA 60 kWMI 30 kW 30 kWMN 40 kWMS MO 100 kW 100 kWMT 50 kWNE NV 1,000 kWNH 100 kW NJ 2,000 kW NM 80,000 kW NY NC 100 kW 100 kWND 100 kWOH No limit specified OK 100 kWOR 2,000 kW 2,000 kWPA 3,000 kW 3,000 kWRI 1,000 kW 1,650 kWSC SD TN TX 50 kW UT 2,000 kW 2,000 kW VT 250 kW 250 kWVA 500 kW 500 kWWA 100 kW WV 25 kW WI 20 kW WY 25 kW
Of the 21,900,000 organizations pulled from the D&B dataset, 2,343,310 progressed to the financial analysis stage, representing a survival rate of 10.7%. Of the 2,840,000 raster cells representing community wind, 1,265,345 cells survived the screening process, representing a survival rate of 44.55%. Table 11 outlines the sequential attrition of each customer type.
47

Table 11. Sequential Attrition Prior to Comparison to the Financial Analysis
Customer Type
Sequential Attrition of Sites or Raster Cells Due to:
Geospa-tial Unit
Sites/ Cells Screened
Eleva-tion
Slope (> 10%)
Population Density WPC < 2
Excluded
LandsData
Errors
Total Elimin-
ated Sites (Mil-
lions)
Total Surviving
Sites Survival
Rate
Commercial, Industrial, and Public Facility
Point 21,900,000 650,047 92,329 12,516,638 5,303,439 N/A 995,361 19.56 2,343,310 10.70%
Community Wind
Raster cell 2,840,000 371,205 33,024 76,439 1,050,220 40,932 N/A 1.57 1,268,345 44.55%
4.3.5 Comparison of Real-World Data to Financial Model The analysis matched each one of the surviving sites or raster cells to the appropriate financial model scenario and retrieved the NPV for each. Sites with a positive NPV became “winners” of the study. After completing the model, the project team calculated budget-capped and restrictive incentives and incorporated them into the results.
4.3.5.1 Federal Incentives The team collected information about these incentives from DSIRE and conducted follow-up research using online resources and via conversations with government officials and stakeholders (IRS 2007, DSIRE 2008, Department of Agriculture 2007). The team included the following incentives in the capped analysis.
4.3.5.1.1 Clean Renewable Energy Bonds Clean Renewable Energy Bonds (CREBs) provide qualifying public facilities with interest-free financing. CREBs has a budget of $400,000,000 each year for all types of renewable technology. The project team calculated the annual CREBs budget for wind at $83,600,000, based on wind’s share of the overall number of projects (not the megawatt share) that have been awarded each year since the program’s inception. To calculate the impact of interest-free CREBs on distributed wind projects, the project team chose a “model” public facility project of 50 kW, located in an area with WPC 4, and with retail electric rates of $0.08/kWh. This project size was chosen by reviewing the public facilities that survived the population density and WPC elimination process and reviewing their characteristics to determine the most common project size. These projects have an installed cost of $250,000 (see Table 4). The present value of the interest of a $250,000 bond was calculated to be $47,152 over a 20-year period. This is the financial benefit of using a CREB instead of an ordinary interest-bearing bond to finance a distributed wind project. To determine the number of public facility projects that could be supported, the total $86,300,000 budget was divided by $250,000, which equals 334 projects. The interest value of $47,152 then was added to the NPV of the 334 public facilities closest to achieving a positive NPV. Many other projects would have been successful if the CREBs budget had been greater.
4.3.5.1.2 Renewable Energy Production Incentive The U.S. Department of Energy manages the Renewable Energy Production Incentive, designed to provide incentives to the generation and distribution of renewable energy by new projects at public facilities. The project team assumed a production incentive of $0.02 per kWh (escalated for inflation from 1993 dollars) for the first 10 years of a project’s operation. In 2007, Congress
48

appropriated $4,900,000 to REPI. Using the same assumption, that wind projects would get half of the incentive budget, the REPI budget was assumed to be $2,450,000, available to all public facilities. The NPV of the REPI production incentive per project then was added to the NPVs of projects closest to feasibility. The incentive was applied to each project until the $2,450,000 budget was reached. The REPI incentive was applied to 247 projects.
Although the REPI program is subject to annual congressional appropriations funding and projects can be partially funded if there is a shortfall in the budget, the project team assumed that production incentive payments would be paid in full and that full appropriations funding would be provided. Further, the REPI amount allocated to a project was calculated based on turbine size. Therefore eight average annual kWh figures, corresponding to the eight turbines available, were used to assess the incentive amount. To maximize the number of projects funded, the project team gave priority to those that achieved feasibility using the least amount of incentive money, thus maximizing the impact of the REPI budget.
4.3.5.1.3 U.S. Department of Agriculture 9006 Grants The U.S. Department of Agriculture (USDA) Section 9006 grant program supports farmers, ranchers, and rural small businesses (USDA 2007). The USDA follows the Small Business Administration’s (SBA) definition of a small business, which is based on business size or number of employees and then matched to a NAICS code. Of the customer types considered in the study, the project team assumed that commercial and industrial customers that had fewer than 1,000 employees would be eligible for the grant program. The number of employees chosen was based on a review of the SBA’s Table of Small Business Size Standards Matched to NAICS code. In fiscal years 2003 to 2007, Congress funded the USDA’s Section 9006 competitive grant program at $23,000,000 per year. In fiscal year 2008, the program received $15,800,000 for competitive grants. (For this analysis, the project team assumed that in future years the grant program will be funded at the historically greater amount of $23,000,000, and that wind projects will receive half of the grants.) Grants ranged from $2,500 to $500,000 and could not exceed 25% of total eligible project costs. To maximize the number of projects receiving funds, the projects that achieved feasibility using the least amount of grant funding were given priority. (USDA 2007)
4.3.5.2 State Incentives The project team collected information about budget-capped or otherwise restricted state incentives from DSIRE and conducted follow-up research online and via conversations with government officials and stakeholders. Incentives were cost- , project- , and capacity-based. As with other incentives in the model, if an incentive applied to a majority of the state area (such as to the customers of a specific utility that covered the majority of the state), the analysis applied the incentive statewide.
The project team followed state rules as of June 2008 for each incentive. The team considered the state’s current and historical budget for the incentive. If an incentive’s budget was ambiguous, then the team contacted staff at the program office for clarification. The analysis assumed that wind power would receive 50% of the program’s budget, unless specified otherwise. Funds were allocated across customer types based on the rules and history of each program. Program funds then were apportioned within each customer type to maximize the number of new winners. Priority was given to sites where the hurdle to achieving a positive NPV
49

could be overcome most easily, but only enough funds necessary to achieve a positive NPV were allocated.
For each site considered, the team determined eligibility for the state’s various incentives. Taking availability of program funds into consideration, the analysis then examined the site’s characteristics to select the package of incentives that would optimize net financial benefit while consuming the fewest incentive dollars. This method avoided “double-dipping” in terms of a program’s budget and the number of incentives that one site could receive, and maximized the incentive budget. All customer types except community wind, for example, are eligible for California’s “feed-in” tariff, a production incentive. The tariff stipulates that sites only can participate if they do not receive other forms of state funding. For each site considered, the capped analysis compared the positive impact of the feed-in tariff on NPV to the positive impact of other incentives and assigned priority to the project that used the fewest incentive dollars. For many sites, the analysis determined that the “feed-in” tariff was the best incentive package to optimize NPV. Appendix B contains a complete list of included state-government incentives.
4.4 Results and Analysis The study found that, out of the 3,611,655 sites that were analyzed for economic viability, 59,708 yielded a positive NPV under current market conditions and policies (excluding incentives with budget caps). The “capped” analysis, which addressed capped federal and state incentives, produced another 2,792 winners in addition to the 59,708 winners from the uncapped analysis, yielding a total of 62,490 winners overall. The project team also considered the impact of state and federal incentives with budget caps at current levels for 10 years into the future; another 4,601 commercial, industrial and public facility customers would have eligible projects along with 9 for community wind. This would yield a total of 67,100 distributed wind projects across the 4 customer categories over 10 years. These numbers were obtained by running the automated capped incentive analysis 9 more times with current state and federal incentive budgets. Each successive year of capped funding produced fewer winners because those projects closest to profitability were funded first and, in subsequent years, the same budget amounts had to be spread across fewer projects—each requiring greater incentives to reach NPV break-even. Table 12 totals and compares winners by customer type and analysis performed. Figure 12 through Figure 14 illustrate the geographic distribution of winners by combinations of customer type and analysis performed. See Appendix C for tables that describe the kW potential of each state by customer class.
50

Table 12. Winners by Customer Type and Analysis Performed
Commercial, Industrial, and Public Facility
Community Wind
Sites/raster cells screened 21,901,124 2,840,165 Sites/raster cells that survived preliminary screening (see Table 11)
2,343,310 1,265,176
Financially successful sites/cells (“winners” of the “uncapped” analysis)
56,529 3,169
Additional financially successful sites/cells with 1 year of capped state/federal incentives (“winners” of the “capped” analysis)
2,791 1
Additional financially successful sites/cells assuming that today’s incentives remain static over 9 more years
4,601 9
Total “winners” 63,921 3,179
Figure 12. Commercial, industrial, and public facility winners (ICF International 2008)
51

Figure 13. Western community wind winners (ICF International 2008)
52

Figure 14. Eastern community wind winners (ICF International 2008)
53

4.4.1 Discussion The project team analyzed the “winning” results for each customer class and the factors that had the greatest impact in determining whether surviving sites generated a positive NPV. The project team totaled the amount of “winning” kilowatts per state by customer class. These calculations, provided in Appendix C, demonstrate enormous potential for distributed wind. These results are unlikely to be attained in reality, however, because several of the assumptions used are likely to be more favorable than the real-world circumstances experienced. The discount rates used are on the low end of the range seen in reality, and the escalation rate for electricity prices reflects the significant electricity price inflation of recent years, which might not continue unabated although carbon costs remain a significant uncertainty. Furthermore, a number of constraints that would operate in the real world and would reduce the number of winners were not included in this analysis. For community wind, the analysis was not constrained with respect to connectivity to the electric grid and, in reality, many sites could not support the injection of 5 MW of generation. For all customer segments, population density was used as a rough proxy for parcel availability. It should be noted, however, that the vast majority of winning megawatts were in the 1,000 kW, 2,000 kW, and 5,000 kW project sizes. Projects of this range need parcels of from 35 acres to more than 120 acres, which are likely to be scarcer than the analysis indicates.
4.4.1.1 Commercial, Industrial, and Public Facilities Analysis Details As noted above, each of the 2,343,310 CIP sites evaluated for financial viability was tested for each of the 8 different turbines available to the CIP group. Overall, in both the capped and uncapped analysis, there were 63,921 financially successful sites with at least 1 of the 8 turbines tested. Of these, some were successful with only 1 turbine while others were successful with 2 or more turbines. In all, 110,476 projects at 56,529 unique sites in the uncapped analysis were financially successful (see Table 13); this suggests that the typical site has the choice more than one turbine, any of which would be a “winner”. An additional 7,392 successful sites in the capped analysis and a total of 7,412 successful projects (see Table 14) suggest that capped “winners” only win with 1 specific turbine.
Table 13. Total Uncapped Winning Turbines by Turbine Size
10 kW 50 kW 100 kW 250 kW 500 kW 750 kW 1,000 kW 2,000 kW12 6,583 195 2,403 8,004 15,390 27,031 50,858
Table 14. Total Capped Winning Turbines by Turbine Size
10 kW 50 kW 250 kW 2,726 3,350 1,156
The project team deemed it unlikely that a commercial, industrial, or public facility would install more than one distributed wind turbine on a property; space availability would be one obvious consideration. Additionally, the fraction of electricity production used onsite would be reduced if two or more turbines were operating at a single site—which could make all turbines unprofitable.
To complete the analysis, for those sites which had more than one winning turbine the project team had to choose which turbine to “count.” For the uncapped analysis, the team selected the turbine with the highest NPV because it produced the greatest economic value. Thus the 56,529
54

sites moved into the counting process with only 1 winning turbine apiece, and that turbine was the one that produced the greatest NPV for that site. For the capped analysis, the team selected the project that used the least incentive dollars to become financially feasible. Thus the 7,392 sites counted for the capped analysis were those that “won” with the fewest incentive dollars, effectively maximizing the state or federal budget to be applied to other projects.
4.4.1.2 Commercial, Industrial, and Public Facilities Results As shown in Appendix D, Table D-1, 47,256 (84%) of the 56,529 uncapped winners were located in Massachusetts, New York, and Vermont. These states are characterized by high retail electric rates and high REC values. For locations with lower electric rates, some combination of large project size and strong wind resource is necessary for success. The 2 x 1,000 kW turbine package had the most winners with 50,419 (89%) successful uncapped sites. The economy of scale for these large projects is the main factor that caused these projects to win. It is doubtful that, in the real world, all 50,000 projects would be built, because a site size of more than 50 acres is standard for an installation of this size.
As shown in Appendix D, Table D-2, an additional 7,392 CIP sites became financially feasible for distributed wind with the application of capped state and federal incentives, and 94% are in California and Tennessee. California’s incentives alone created 5,730 of these new winners, either via the new feed-in tariff announced in early 2008, the Emerging Renewables Program, or the Self-Generation Incentive Program (CPUC 2008). Note that the project team followed all state rules, therefore the California feed-in tariff incentive was not combined with the other available incentives. The Tennessee winners occurred because the team maximized winners based on lowest incentive cost across states. The Tennessee Valley Authority provides a generous uncapped incentive which brought many Tennessee projects close to a positive NPV. These projects therefore were first in line to receive federal USDA incentives during the capped analysis. Delaware had an additional 246 winners as a result of its Green Energy Program incentives; the program provides a grant of up to 50% of a project’s cost with a limit of $100,000. Georgia offers a Clean Energy Tax Credit for commercial and industrial customers only, providing a 35% tax credit over 5 years up to a maximum of $500,000. This tax credit brought 65 projects to success. North Carolina had an additional 122 winners as a result of its Green Business Fund which offers grants in amounts up to $100,000. Pennsylvania had 15 additional winners due to its Energy Harvest Grant Program, which offers a grant of 50% of a project’s cost up to a limit of $500,000. This Pennsylvania grant program is open to public facilities only.
Although there are other significant incentive programs that CIP projects are eligible for, such as in Oregon and New York, these state incentive budgets were exhausted by the project team’s parallel analysis of residential turbines. A discussion of the residential customer type is not included in this document; however, the residential analysis had a significant impact on allocation of statewide project incentives for the CIP customer type. Residential turbine costs are less than those for commercial, industrial, public facility, and community wind, therefore a lesser incentive dollar amount typically is required to bring residential turbines to financial feasibility. The implications of this incentive allocation method are that—in states with overlapping incentives for CIP and residential—the residential customer type receives the majority of available incentive dollars.
55

4.4.2 Community Wind Community wind projects were assumed to export all of their power, therefore their economic success is dependent on only a few factors: The prices offered by the wholesale power market; REC prices; and wind resources. As shown in Table 11 and Appendix D, Table D-3, there exist 3,179 raster cells that successfully could support the installation of a community wind farm.26 Four of the 13 wholesale power pools produced no winners: Florida Reliability Coordinating Council (FRCC), Mid-America Interconnected Network (MAIN), Mid-Continent Area Power Pool (MCPP), and Southwest Power Pool (SPP). These power pools are characterized by low prices (MAIN, MCPP, SPP), poor wind resources (FRCC), or low REC values (all four). It is worth noting, however, that the lowest-priced power pool (NWPP) had winners and the highest-priced power pool (FRCC) did not. Figure 7 shows that, in any given year, the difference between the lowest- and highest-priced power pools typically is $0.04 to $0.05 per kWh.
Wind resources and REC values were the other important influences on the success of community wind. The New England Power Pool (NEPOOL) is characterized by the highest REC prices in the country, which enabled community wind to be successful with wind resources as low as WPC 2. In every other region the minimum WPC necessary for success was 5 and, in many cases, it was 6 or 7.
4.4.3 Model Limitations As with any modeling project, the model experienced some limitations which, if possible, should be addressed and resolved for future studies. Many of these limitations stemmed from the tight budget and schedule under which the project operated.
4.4.3.1 Applying Utility-Level Factors Statewide To maintain a controllable amount of data, the model applied utility- and regional-level factors such as net metering rules, utility-specific incentives, and wholesale power prices statewide. This simplification obscured some of the heterogeneity in the data, but was unavoidable at the level of resources with which the project operated.
4.4.3.2 Sensitivity Analysis The project did not have sufficient time or resources to conduct sensitivity analyses. Although 7,777,770 scenarios represent a considerable range of possible situations, several other sensitivities should be explored. As with any long-term financial analysis, for example, the selection of discount, interest, and inflation rates is critical. Developers and owners could be interviewed in detail about these factors and the models could be run again, using greater or lesser rates, if warranted. There also exists a number of emerging policy instruments that could favor renewable energy generally, such as a national RPS, a carbon cap-and-trade program, or a carbon tax. The impact of such policies on project economics should be evaluated.
26 Unlike commercial, industrial, and public facilities sites, community wind was relatively unaffected by capped state and federal incentives. Of the 3,179 successful community wind sites, only 10 were winners as a result of these incentives.
56

4.4.3.3 Debt Service Coverage Ratio The model should—but does not—constrain positive NPV to only those scenarios with a minimum debt service coverage ratio (DSCR). Adding a DSCR constraint would make the model more realistic.
4.4.4 Data Limitations and Areas of Uncertainty In addition to the limitations of the model, the accuracy of the study’s results was adversely affected by the limitations of the publicly available data which the study employed. Nearly 1,000,000 (995,361) of the 21,900,000 sites screened in the GIS analysis were eliminated from consideration due to data errors. The project team sampled this data set and found that 86% of the records had no NAICS code and 75% of the records included no employees. These independent factors prevented the sites in question from being assigned an energy consumption per employee factor. Without this information the analysis could not calculate electricity consumption and thus had to exclude the sites from further consideration.
Based on these factors, the project team determined that there was a very slim chance that these sites would be feasible candidates for distributed wind. The lack of a NAICS code precluded the team from calculating site electricity consumption or from obtaining the site’s retail electric rate. The lack of an employee count also prevented calculation of a site electricity load and further suggested that any load would be small. The project team concluded that although these entries could be associated with real organizations they might not have a physical location or energy consumption and, as such, would not be candidates for this study.
4.4.5 Technology Implications The GIS analysis and preparation of real-world data eliminated the majority of all the CIP sites and raster cells considered before the process ever tested them for financial viability. Although the economics of the remaining sites and raster cells that survived these screens could be improved through policy measures, consideration also should be given to whether technological improvements and other changes could make distributed wind generation possible for some sites that were eliminated in the screening process. The analysis incorporated two NREL “virtual” turbines as an initial effort in this direction as described in the next section.
4.5 New Technology Opportunities Utility-scale wind turbines steadily have improved in productivity in recent years and continued improvements are anticipated. Gains were achieved through increasing rotor diameters and by increasing tower heights, all for turbines of a given rated power. Aerodynamic efficiencies also have been improved through optimized design with the maximum power coefficients (Cp, max) now approaching or exceeding 0.5. Significant potential exists to reduce miscellaneous losses through developments such as reduced blade soiling, improved turbine controls, and reduced downtime due to improved turbine reliability. Application of these technology improvements to mid-scale wind turbines has the potential to increase economic viability and to create larger markets for distributed wind.
To assess this potential, two virtual wind turbines—the NREL 250 and NREL 500 (250 kW and 500 kW, respectively)—were included in this study. These turbines were assumed to utilize technology improvements realized to date in the utility-scale market as well as improvements resulting from R&D. A wind turbine design, cost, and scaling model developed by NREL was
57
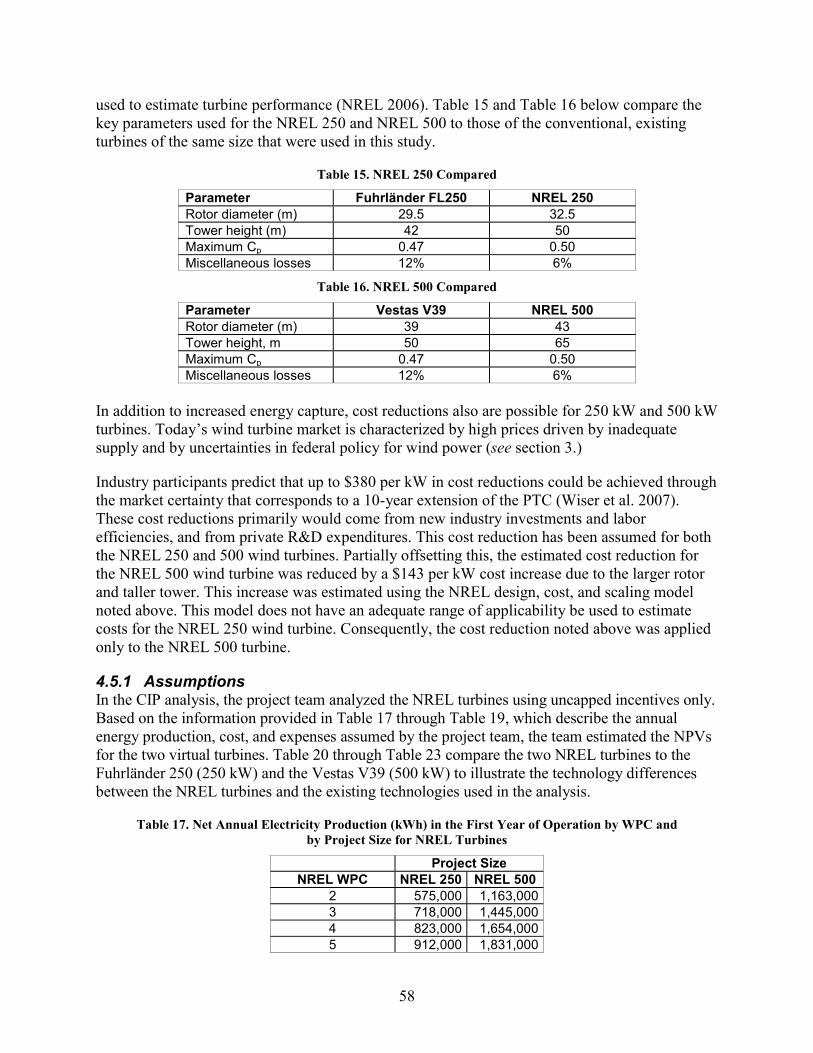
used to estimate turbine performance (NREL 2006). Table 15 and Table 16 below compare the key parameters used for the NREL 250 and NREL 500 to those of the conventional, existing turbines of the same size that were used in this study.
Table 15. NREL 250 Compared
Parameter Fuhrländer FL250 NREL 250 Rotor diameter (m) 29.5 32.5 Tower height (m) 42 50 Maximum Cp 0.47 0.50 Miscellaneous losses 12% 6%
Table 16. NREL 500 Compared
Parameter Vestas V39 NREL 500 Rotor diameter (m) 39 43 Tower height, m 50 65 Maximum Cp 0.47 0.50 Miscellaneous losses 12% 6%
In addition to increased energy capture, cost reductions also are possible for 250 kW and 500 kW turbines. Today’s wind turbine market is characterized by high prices driven by inadequate supply and by uncertainties in federal policy for wind power (see section 3.)
Industry participants predict that up to $380 per kW in cost reductions could be achieved through the market certainty that corresponds to a 10-year extension of the PTC (Wiser et al. 2007). These cost reductions primarily would come from new industry investments and labor efficiencies, and from private R&D expenditures. This cost reduction has been assumed for both the NREL 250 and 500 wind turbines. Partially offsetting this, the estimated cost reduction for the NREL 500 wind turbine was reduced by a $143 per kW cost increase due to the larger rotor and taller tower. This increase was estimated using the NREL design, cost, and scaling model noted above. This model does not have an adequate range of applicability be used to estimate costs for the NREL 250 wind turbine. Consequently, the cost reduction noted above was applied only to the NREL 500 turbine.
4.5.1 Assumptions In the CIP analysis, the project team analyzed the NREL turbines using uncapped incentives only. Based on the information provided in Table 17 through Table 19, which describe the annual energy production, cost, and expenses assumed by the project team, the team estimated the NPVs for the two virtual turbines. Table 20 through Table 23 compare the two NREL turbines to the Fuhrländer 250 (250 kW) and the Vestas V39 (500 kW) to illustrate the technology differences between the NREL turbines and the existing technologies used in the analysis.
Table 17. Net Annual Electricity Production (kWh) in the First Year of Operation by WPC and by Project Size for NREL Turbines
Project SizeNREL WPC NREL 250 NREL 500
2 575,000 1,163,0003 718,000 1,445,0004 823,000 1,654,0005 912,000 1,831,000
58

Project SizeNREL WPC NREL 250 NREL 500
6 1,018,000 2,039,0007 1,156,000 2,292,000
Table 18. Installed NREL Turbine Costs in Relation to Turbine and Project Sizes
Project Size (kW)
Number of Turbines in Project
Example Turbine
Installed Cost per Turbine
Installed Cost of Project
Installed Cost per Kilowatt
250 1 NREL 250 $705,000 $800,000 $2,820500 1 NREL 500 $1,285,000 $1,400,000 $2,570
Table 19. Annual NREL Turbine Ongoing Expenses
Unit Commercial, Industrial, and Public Facilities
Operations and maintenance $/kWh $0.010/kWh
Operations and maintenance contingency fund $/kWh $0.003/kWh
Insurance $/kW $8.00/kW
Property tax $/kW $6.00/kW
Administrative/financial/legal management $/kW $1.00/kW
Production tax expense $/kWh $0.00
Warranty expense $/kW $13.00/kW
Decommissioning fund pre-warranty expiration $/kW $0.00
Decommissioning fund post-warranty expiration $/kW $1.00/kW
Other expenses $/kW $2.00/kW
Table 20. NREL Turbine Cost Comparison
Turbine Installed Cost Installed Cost
per kW Fuhrländer FL-250 $800,000 $3,200 NREL 250 $705,000 $2,820 Cost reduction $95,000 $380 Percent reduction 12% 12% Vestas V39 $1,400,000 $2,800 NREL 500 $1,285,000 $2,570 Cost reduction $115,000 $230 Percent reduction 8% 8%
59

Table 21. NREL Turbine Annual kWh—First Year Comparison
Annual kWh—First Year
NREL Class Fuhrländer FL-250 NREL 250 Vestas V39 NREL 500 2 384,076 575,000 728,579 1,163,000 3 493,223 718,000 955,680 1,445,000 4 580,166 823,000 1,135,119 1,654,000 5 658,003 912,000 1,294,107 1,831,000 6 756,259 1,018,000 1,491,512 2,039,000 7 1,015,119 1,156,000 1,987,834 2,309,000
Table 22. NREL Turbine Capacity Factor Comparison
Capacity Factor
NREL Class Fuhrländer FL-250 NREL 250 Vestas V39 NREL 500 2 17.5% 26.3% 16.6% 26.5% 3 22.5% 32.8% 21.8% 33% 4 26.5% 37.6% 25.9% 37.8% 5 30.0% 41.7% 29.5% 41.8% 6 34.5% 46.5% 34.1% 46.6% 7 46.4% 52.8% 45.4% 52.7%
Table 23. Change in Capacity Factors
NREL Class 250 kW % Increase 500 kW % Increase 2 50% 59% 3 46% 51% 4 42% 46% 5 39% 41% 6 35% 37% 7 14% 16%
4.5.2 Discussion Similar to the main CIP analysis, it is possible for a site to have more than one NREL “winning” turbine. The NREL 250 and NREL 500, for example, both could have positive NPVs at one unique site. In total, there were 204,677 unique sites in 34 states where at least one NREL turbine was economically successful. (For more details see Appendix D, Table D-4, and Figure 16.) This compares with 2,403 and 8,004 uncapped winners with the existing 250 kW and 500 kW turbines, respectively. Table 24 lists the number of NREL turbines that were successful overall. Figure 16 demonstrates the additional successful NREL turbines when compared to uncapped CIP winners.
Table 24. Total Winners by NREL Turbine
NREL 250 NREL 500 68,931 204,663
60

Six states (Connecticut, Massachusetts, Maine, New York, Rhode Island, Texas) account for 91.5% of the NREL turbine winners. New York had the most winners overall with 112,414, which represents 55% of the total. All of these states (with the exception of Texas) have some of the greatest REC rates in the country.
Analysis shows that the NREL turbines are dramatically more successful than existing turbines of the same size classes. For both the 250 kW and 500 kW classes, the number of winners increased by a factor of 25 or more. The combination of lower first cost and higher productivity (especially at lower wind speeds) provides substantial economic benefits. For example, at WPC 3 the NREL 250 produces almost 225,000 additional kWh of energy each year as compared to the Fuhrländer 250. At $0.10 per kWh (whether retail or wholesale), this additional production is worth $22,500 per year or a NPV of $238,000 over 20 years at a 7% discount rate. This is comparable to one third of the installed cost of the NREL 250 turbine. This incremental revenue dramatically improves the lifecycle economics of the NREL turbines.
Figure 15. NREL turbine winners (ICF International 2008)
61

Figure 16. NREL turbine winners compared to current commercial, industrial, and public facility winners (ICF International 2008)
4.6 Conclusions and Implications Wind technology offers clean, renewable electricity with additional benefits in the form of local employment and economic development. In an era of rising concern about energy security, global warming, and energy costs, wind technology is receiving significant interest from the public and from policy makers, and the private sector has seen fit to invest billions of dollars in recent years to build large, central-station wind farms.
Distributed wind technology, however, has not benefited from the boom in wind projects and (as discussed elsewhere in this report) even might have suffered for it. Distributed wind offers some incremental advantages over central-station wind (e.g., production close to the point of consumption; avoidance of high retail electric rates; no requirement to consider transmission interconnection), but it also suffers from some distinct comparative disadvantages (e.g., greater capital costs per rated kW; reduced conversion efficiency; no economy of scale in installation and maintenance).
Currently, successful distributed wind projects require some combination of good wind resources, sufficient retail and wholesale electric prices, increased REC prices, and supportive
62

incentive policies. The review of “capped” state and federal incentives demonstrated that these programs—which either buy down the first cost of distributed wind or augment the revenue flow—have significant potential to increase the penetration of distributed wind beyond its current level, particularly in the commercial, industrial, and public facility segments.27 Several developments are needed for distributed wind to achieve greater penetration.
• Improvements in the technology. The distributed wind turbines of 2008, techno-logically speaking, are the same turbines that were used for central-station projects in the early 1990s. Increasing the productivity of mid-scale wind turbines would increase the attractiveness of the technology. Analysis of the NREL virtual turbines further underscores this point.
• Reduction in cost. The capital cost of distributed wind turbines (on a $/kW basis) can be several multiples of the capital cost of utility-scale turbines. Any reduction in capital cost would improve project economics.
• Greater policy support. All energy technologies in the United States enjoy policy support in some fashion, including production credits, tax benefits for exploration, insurance backstopping, and favorable royalty rules. Renewable energy technologies have benefited in recent years from the introduction of the PTC, state RPSs, the rise of voluntary REC markets, and various other more limited incentives that are capped by budget. Rising concern about global warming is likely to be the most important stimulus for future renewable energy incentives. These incentives could take the form of a carbon tax, a carbon cap-and-trade program, a national RPS, or other policy approaches. Although most of the policy interventions under discussion favor renewable energy (and wind) generally, it is not clear to what extent distributed wind specifically would benefit compared with central-station wind. Policy makers need to consider the incremental virtues of distributed resources—local ownership, local benefits, reduced demand on the electrical grid—to target additional support to distributed wind.
5 References
Bakeman, G. (May 14, 2007). Personal communication between Kerry Granfield, ICF International, and Gregory Bakeman, former employee of McKenzie Bay/WindStor Power Company.
Bird, L.; Swezey, B. (2006). Green Power Marketing in the United States: A Status Report (Ninth Edition). NREL/TP-640-40904. Golden, CO: National Renewable Energy Laboratory. November 2006. http://www.eere.energy.gov/greenpower/resources/pdfs/40904.pdf. Accessed October 21, 2008.
27 See section 4.3.5 for more information about capped incentives. The state incentive allocation method directed incentive money to residential customers first, leaving smaller budget available for CIP customers.
63

Bird, L.; Parsons, B.; Gagliano, T.; Brown, M.; Wiser, R.; Bolinger, M. (2003). Policies and Market Factors Driving Wind Power Development in the United States. NREL/RP-620-34599. National Renewable Energy Laboratory. July 2003. http://eetd.lbl.gov/ea/EMP/ reports/53554.pdf. Accessed October 21, 2008.
Bloomberg Market Rate data, June 2008. http://www.bloomberg.com/markets/rates/index.html. Accessed June 25, 2008.
Bolinger, M. (July 2006). Avoiding the Haircut: Potential Ways to Enhance the Value of the USDA’s Section 9006 Program. LBNL-61076. Ernest Orlando Lawrence Berkeley National Laboratory. Environmental Energy Technologies Division. http://eetd.lbl.gov/ea/EMS/ reports/61076.pdf. Accessed October 21, 2008.
Bolinger, M.; Wiser, R. (2004). A Comparative Analysis of Business Structures Suitable for Farmer-Owned Wind Power Projects in the United States. Ernest Orlando Lawrence Berkeley National Laboratory. http://eetd.lbl.gov/ea/EMP/reports/56703.pdf. Accessed October 21, 2008.
Bonk-Vasco, J. (May 22, 2007). Personal communication between Claire Cowan, ICF International, and Jon Bonk-Vasco, California Center for Sustainable Energy.
Brown, D. (January 1, 2007). 2007 Forecast: Supply Costs: Asphalt, Concrete Prices Stabilize; Still Outpace Inflation. Public Works Magazine. http://www.pwmag.com/industry-news.asp?sectionID=768&articleID=438455. Accessed October 21, 2008.
California Energy Commission (CEC) (September 2003). Permitting Small Wind Turbines: A Handbook: Learning from the California Experience. Prepared by the American Wind Energy Association for the California Energy Commission’s Renewable Energy Program. http://apps1.eere.energy.gov/state_energy_program/state_publications_results.cfm?publishertype=1&state=CA. Accessed October 21, 2008.
California Public Utilities Commission (CPUC). Feed-In Tariffs Available for the Purchase of Eligible Small Renewable Generation. http://www.cpuc.ca.gov/PUC/energy/electric/ RenewableEnergy/feedintariffs.htm. Accessed October 21, 2008.
Database of State Incentives for Renewable Energy (DSIRE) (2007). http://www.dsireusa.org. Accessed May 2007.
Dickout, A. (May 22, 2007). Personal communication between Kerry Granfield, ICF International, and Al Dickout, Americas Wind Energy.
Drouilhet, S. (May 16, 2007). Personal communication between Matt Stanberry, ICF International, and Steve Drouilhet, Sustainable Automation.
DSIRE (Database of State Incentives for Renewables and Efficiency). Federal Incentives for Renewable Energy: Renewable Electricity Production Tax Credit. http://www.dsireusa.org/ library/includes/incentive2.cfm?Incentive_Code=US13F&State=Federal%C2%A4tpageid=1. Accessed October 21, 2008.
64

Dun & Bradstreet (October 27, 2006). http://www.dnb.com/us/.
Energy Center of Wisconsin. 2004. A Study of Wind Energy Development in Wisconsin: A Collaborative Report. Prepared by Seventh Generation Energy Systems, Inc., Northwest SEED, Wind Utility Consulting, MRG & Associates, and Energy Center of Wisconsin, for the State of Wisconsin, Department of Administration, Division of Energy. http://www.ecw.org/ productdetail.php?productid=508. Accessed October 21, 2008.
Energy Information Administration (EIA) (2006a). Manufacturing Energy Consumption Survey. http://www.eia.doe.gov/emeu/mecs/contents.html. Accessed October 21, 2008.
Energy Information Administration (EIA) (2006b). Commercial Buildings Electricity Consumption Survey. http://www.eia.doe.gov/emeu/cbecs/contents.html. Accessed October 21, 2008.
Energy Information Administration (EIA) (2006c). Electric Power Annual 2005—State Data Tables. DOE/EIA-0348(2005). http://www.eia.doe.gov/cneaf/electricity/epa/ average_price_state.xls. Accessed October 21, 2008.
Energy Information Administration (EIA) (2007a). Electric Power Monthly: June 2007: With Data for March 2007. DOE/EIA-0226 (2007/06). Energy Information Administration. http://www.eia.doe.gov/cneaf/electricity/epm/epmxlfile5_3.xls. Accessed October 21, 2008.
Energy Information Administration (EIA) (2007b). Supplemental Tables to the Annual Energy Outlook (AEO) 2007: Electric Generation and Renewable Resource, Tables 62-91. http://www.eia.doe.gov/oiaf/aeo/supplement/index.html. Accessed October 21, 2008.
Energy Information Administration (EIA) (2008). Annual Energy Outlook 2008. http://www.eia.doe.gov/oiaf/aeo/index.html. Accessed October 21, 2008.
Federal Energy Regulatory Commission (FERC) (May 12, 2005). Commission Issues Standard Rule for Small Generator Interconnection. Press release. http://www.ferc.gov/news/news-releases/2005/2005-2/05-12-05.asp. Accessed October 21, 2008.
Geolytics Census 2000 Package. Geolytics. http://geolytics.com/USCensus,Census-2000-Package,Products.asp. Accessed October 21, 2008.
Godwin, A. (May 17, 2007). Personal communication between Matt Stanberry, ICF International, and Aaron Godwin, The Renaissance Group.
Graham, J. (May 16, 2007). Personal communication between Matt Stanberry, ICF International, and Joseph Graham, Blue Sky Wind.
Green, L.; Sagrillo, M. (2005). Zoning for Distributed Wind Power—Breaking Down Barriers: Preprint. NREL/CP-500-38167. Prepared for WindPower 2005 Conference. Golden, CO: National Renewable Energy Laboratory.
65

Haas, B. (May 2007). Personal communication between Claire Cowan, ICF International, and Bill Haas, Illinois Department of Commerce and Economic Opportunity.
Haase, J. (May 24, 2007). Personal communication between Claire Cowan, ICF International, and Jeff Haase, Minnesota Department of Commerce’s State Energy Office.
Helgeson, P. (May 22, 2007). Personal communication between Claire Cowan, ICF International, and Paul Helgeson, Public Service Commission of Wisconsin.
Holt, E.; Wiser, R. (April 2007). The Treatment of Renewable Energy Certificates, Emissions Allowances, and Green Power Programs in State Renewables Portfolio Standards. LBNL-62574. Ernest Orlando Lawrence Berkeley National Laboratory. Environmental Energy Technologies Division. http://eetd.lbl.gov/ea/EMS/reports/62574.pdf. Accessed October 21, 2008.
ICAP United States (June 20, 2008). http://icapenergy.com/US/. Accessed October 21, 2008.
Interstate Renewable Energy Council (2004). “Connecting to the Grid: A Guide to Distributed Generation Interconnection Issues.” Fourth Edition. Larsen Consulting Solutions, Inc. and E3Energy, LLC for the Interstate Renewable Energy Council.
Internal Revenue Service (IRS) (2007). Internal Revenue Bulletin: Clean Renewable Energy Bonds. http://www.irs.gov/irb/2007-14_IRB/ar17.html. Accessed October 21, 2008.
Johnson, P. (May 23, 2007). Personal communication between Claire Cowan, ICF International, and Paul Johnson, Minnesota Power.
Jones, D. (May 23, 2007). Personal communication between Kerry Granfield, ICF International, and Dale Jones, Enertech.
Juhl, D. (May 24, 2007). Personal communication between Matt Stanberry, ICF International, and Dan Juhl, Danman & Associates.
Miles, L. (May 23, 2007). Personal communication between Kerry Granfield, ICF International, and Larry Miles, The Wind Turbine Company.
Munsterman, R. (May 2007). Personal communication between Claire Cowan, ICF International, and Robert Munsterman, Superintendent of Schools Laq qui Parle Valley High School.
North American Electric Reliability Corporation (NERC) (2007). Regions. http://www.nerc.com/fileUploads/File/AboutNERC/maps/NERC_Regions_color.jpg. Accessed January 17, 2008
NREL (2000). Making Connections: Case Studies of Interconnection Barriers and their Impact on Distribute Power Projects. NREL/SR-200-28053. Golden, CO: National Renewable Energy Laboratory.
66

NREL (2006). Wind Turbine Design Cost and Scaling Model. Technical Report. NREL/TP-500-40566. Golden, CO: National Renewable Energy Laboratory. http://www.nrel.gov/docs/fy07osti/ 40566.pdf. Accessed October 21, 2008.
NREL (2007). Annual Report on U.S. Wind Power Installation, Cost, and Performance: Trends 2006. Golden, CO: National Renewable Energy Laboratory. http://www.nrel.gov/docs/fy07osti/ 41435.pdf. Accessed October 21, 2008.
NREL (2008). Dynamic Maps, GIS Data and Analysis Tools. http://www.nrel.gov/gis/ wind.html. Accessed October 21, 2008.
Ordon, B. (May 2007). Personal communication between Kerry Granfield, ICF International, and Bob Ordon, Wind Turbine Warehouse.
Parry, R. (May 22, 2007). Personal communication between Claire Cowan, ICF International, and Randy Parry, Miner County Community Revitalization of South Dakota.
Pearce, J. (May 2007). Personal communication between Claire Cowan, ICF International, and John Pearce, Iowa Utilities Board.
Petrie, B. (May 2007). Personal communication between Claire Cowan, ICF International, and Brent Petrie, Alaska Electric Village Co-op.
Platts GIS Data (2008). http://www.platts.com/Analytic%20Solutions/Custom/gis/index.xml. Accessed January 16, 2008.
Rhoads-Weaver, H.; Forsyth, T. (2006). Overcoming Technical and Market Barriers for Distributed Wind Applications: Reaching the Mainstream: Preprint. NREL/CP-500-39858. Prepared for Solar 2006 Conference. Golden, CO: National Renewable Energy Laboratory. http://www.nrel.gov/docs/fy06osti/39858.pdf. Accessed October 21, 2008.
Rodgers, T. (May 22, 2007). Personal communication between Claire Cowan, ICF International, and Tony Rogers, Rosebud Tribal Utility Commission.
Schulte, K. (May 17, 2007). Personal communication between Matt Stanberry, ICF International, and Kevin Schulte, Sustainable Energy Development.
Spectron as of June 20, 2008. http://www.spectrongroup.com/.
Tele Atlas. http://www.teleatlas.com Accessed January 16, 2008.
Tooze, D. (May 2007). Personal communication between Claire Cowan, ICF International, and Dave Tooze, City of Portland.
United States Census Bureau (2002). Economic Census Industry Reporting Manufacturing, and Economic Census Industry Series Reports. http://www.census.gov/econ/census02/guide/ INDRPT31.HTM. Accessed October 21, 2008.
67

68
United States Department of Agriculture (USDA) (2007). Section 9006: Renewable Energy and Energy Efficiency Program. http://www.rurdev.usda.gov/rbs/farmbill/. Accessed March 4, 2008.
United States Environmental Protection Agency (EPA) (2007). Partner List. Green Power Partnership Web Site. http://www.epa.gov/greenpower/partners/gpp_partners.htm. Accessed October 22, 2008.
Usibelli, T. (May 2007). Personal communication between Claire Cowan, ICF International, and Tony Usibelli, Washington State Energy Office.
We Energies (March 2007). New Business Models for Customer-Owned Renewable Energy Generation. http://we-energies.com/business_new/altenergy/existbusrpt.pdf. Accessed October 21, 2008.
Wiser, R.; Bolinger, M.; Barbose, G. (2007). Using the Federal Production Tax Credit to Build a Durable Market for Wind Power in the United States. http://eetd.lbl.gov/ea/ems/reports/ 63583.pdf. Accessed October 21, 2008.
X-rates (2007). American dollars to one Euro. http://www.X-rates.com. Accessed October 21, 2008.

Appendix A. State and Utility Net-Metering Rules and Programs28 Table A-1. Utility Net-Metering Rules and Programs by State
State Program
System Size Limit
Customer Classes Eligible
Eligible Technolo-
gies
Limit on Total Capa-
city
Treatment of Net Excess Generation
(NEG)
Intercon-nect Stan-
dards for Net
Metering Utilities Involved
AR Arkansas 25 kW for residen-
tial systems; 300 kW for com-mercial systems
Commer-cial,
industrial, residential
Solar, wind, biomass,
hydro, geothermal,
fuel cells, micro-
turbines
None Credited at retail rate to customer’s next
bill; granted to utility at end of 12-month
billing cycle
Yes All utilities
AZ Salt River Project
10 kW Residential Photo-voltaics
None Purchased monthly by utility at average
monthly market price minus a price adjustment of $0.00017/kWh
Utility guidelines
Salt River Project
AZ Tucson Electric Power
10 kW Commer-cial,
residential
Photo-voltaics,
wind
500 kW peak
aggregate
Credited at retail rate to customer’s next
bill; granted to utility after each January
billing cycle
Utility guidelines
Tucson Electric Power
CA California 1 MW; 10 MW for as
many as 3 biogas digesters
Commer-cial,
industrial, residential
Photo-voltaics,
landfill gas, wind, fuel
cells (renewable
fuels), anaerobic digestion
2.5% of a utility’s peak
demand; statewide
limit of 50 MW for
biogas digesters
Credited at retail rate to customer’s next
bill; granted to utility at end of 12-month
billing cycle
Yes All utilities for PV and wind; IOUs also must offer net
metering for fuel cells
and biomass
CO Colorado 2 MW Commer-cial,
industrial, residential
Solar, landfill gas,
wind, biomass, anaerobic digestion,
small hydro, fuel cells
(renewable fuels)
None Credited at retail rate to customer’s next bill; at end of each
calendar year, customer reimbursed
for NEG at utility’s average hourly
incremental cost for the prior 12-month
period
Yes Colorado utilities serving
40,000 or more
customers (municipal and co-ops can opt out
if the majority of customers
agrees)
28 This table was updated in May 2007. For more updated information about system limit size by state, please see Table 10. The project team used the more updated system limits listed in Table 10 to inform the market analysis.
69

State Program
System Size Limit
Customer Classes Eligible
Eligible Technolo-
gies
Limit on Total Capa-
city
Treatment of Net Excess Generation
(NEG)
Intercon-nect Stan-
dards for Net
Metering Utilities Involved
CO Delta Montrose Electric
Associa-tion
Cus-tomer’s
maximum measured demand
for previous
12 months
Commer-cial,
residential
Photo-voltaics,
wind, biomass,
hydro
1 MW No credit is offered to the customer for
NEG
Yes Delta-Montrose Electric
Association
CO Empire Electric Associ-
ation
10 kW Commer-cial,
residential, nonprofit, schools,
agricultural, institutional
Photo-voltaics,
wind
50 customers
Utility pays customer at a rate equal to the
average cost of power from the
utility’s wholesale supplier for that year, excluding wholesale power sold to loads
billed under the utility’s SCS tariffs
Yes Empire Electric
Association
CO Fort Collins Utilities
10 kW Residential Photo-voltaics,
wind
25 customers
Credited to customer’s next bill; granted to utility at end of 12-month
billing cycle
Yes Fort Collins Utilities
CO Gunnison County Electric
10 kW Commer-cial,
residential
Photo-voltaics,
wind
50 customers
Purchased by utility at wholesale rate
Yes Gunnison County Electric
CO Holy Cross
Energy
25 kW Commer-cial,
industrial, residential
Photo-voltaics,
wind, biomass,
hydro, geothermal
None Credited to customer’s next bill at retail rate; pur-
chased by utility at avoided-cost rate at end of calendar year
Yes Holy Cross Energy
CO La Plata Electric
Associa-tion
25 kW Commer-cial,
residential
Photo-voltaics,
wind
1% of utility’s
aggregate customer
peak demand
Credited to customer’s next bill at avoided-cost rate; utility pays customer for any unused NEG at beginning of each
calendar year
Yes La Plata Electric
Association
CT Connecti-cut
100 kW for renew-
able technolo-
gies; 50 kW for
fossil technolo-
gies
Commer-cial,
residential
Solar, landfill gas,
wind, biomass, fuel cells, municipal
solid waste, small hydro, tidal energy,
wave energy, ocean
thermal
None Purchased monthly by utility at spot-
market energy rate
Yes Investor-owned utilities
70

State Program
System Size Limit
Customer Classes Eligible
Eligible Technolo-
gies
Limit on Total Capa-
city
Treatment of Net Excess Generation
(NEG)
Intercon-nect Stan-
dards for Net
Metering Utilities Involved
DE Delaware 25 kW Commer-cial,
residential
Photo-voltaics,
wind, biomass,
hydro
None Varies by utility Yes All utilities (applies to municipal
utilities only if they opt to
compete outside their
municipal limits)
DC District of Columbia
100 kW Commer-cial,
industrial, residential
Solar, wind, biomass,
hydro, geothermal,
fuel cells, chp,
anaerobic digestion,
tidal energy, micro-
turbines
None Credited to customer’s next bill
at retail rate
Yes All utilities
FL Florida Keys
Electric Coopera-
tive
10 kW Residential Photo-voltaics
None Credited at retail rate and carried over to customers next bill; purchased by utility at end of 12-month
period
Yes Florida Keys
Electric Cooperative
FL JEA 10 kW Residential Photo-voltaics,
wind
None Credited to customer’s next bill
at retail rate
Utility guidelines
JEA
FL Lakeland Electric
10 kW for residen-
tial, 500 kW
for commer-
cial
Commer-cial,
residential
Photo-voltaics
None Credited to customer’s next bill
at retail rate; indefinite carryover
Yes Lakeland Electric
FL New Smyrna Beach Utilities
10 kW Residential Photo-voltaics
None Credited to customer’s next bill
at retail rate
Utility guidelines
New Smyrna Beach Utilities
GA Georgia 10 kW for residen-
tial, 100 kW
for commer-
cial
Commer-cial,
industrial, residential
Photo-voltaics,
wind, fuel cells
0.2% of a utility’s
annual peak demand
Credited to customer’s next bill
at retail rate; granted to utility at end of 12-month billing cycle
Yes All utilities
HI Hawaii 50 kW (increase
under consider-
ation)
Commer-cial,
residential, government
Photo-voltaics,
wind, biomass,
hydro
0.5% of a utility’s
annual peak demand
Credited to customer’s next bill
at retail rate; granted to utility at end of 12-month billing cycle
Yes All utilities
71

State Program
System Size Limit
Customer Classes Eligible
Eligible Technolo-
gies
Limit on Total Capa-
city
Treatment of Net Excess Generation
(NEG)
Intercon-nect Stan-
dards for Net
Metering Utilities Involved
IA Iowa 500 kW Commer-cial,
industrial, residential
Photo-voltaics,
wind, biomass,
hydro, municipal
solid waste
None Credited at retail rate to customer’s next
bill
No Investor-owned utilities
ID Idaho Power
25 kW for residen-tial and small
commer-cial;
100 kW for large commer-cial and agricul-
tural
Commer-cial,
residential, agricultural
Solar, wind, biomass,
hydro, fuel cells
2.9 MW (0.1% of utility’s
2,000 peak demand in
Idaho)
Credited to customer’s next bill
at retail rate for residential and small
commercial customers; credited
at 85% of utility’s avoided-cost rate for
large commercial and agricultural
customers
Utility guidelines
Idaho Power
ID Rocky Mountain
Power
25 kW for residen-tial and small
commer-cial;
100 kW for all
other cus-tomers
Commer-cial,
residential, nonprofit, schools, govern-ment,
agricultural, institutional
Solar, wind, biomass,
hydro, fuel cells
714 kW (0.1% of
utility’s 2002 retail peak demand in
Idaho)
Credited to customer’s next bill
at retail rate for residential and small
commercial customers; credited
at 85% of utility’s avoided-cost rate for
large commercial and agricultural
customers
Utility guidelines
Rocky Mountain
Power
IL ComEd Wind and
PV Genera-
tion Program
40 kW All retail customers
Photo-voltaics,
wind
0.1% of utility’s
annual peak demand
Purchased monthly by utility at avoided-cost rate; customer
also receives an annual production incentive at a rate
equal to the difference between
the average avoided cost and the average
retail rate. This production incentive is capped at the total amount of power the customer purchased from ComEd over the
year
Yes Common-wealth Edison
IN Indiana 10 kW Residential, schools
Photo-voltaics,
wind, small hydro
0.1% of a utility’s most recent peak
summer load
Credited at retail rate to customer’s next
bill
Yes Investor-owned utilities
72

State Program
System Size Limit
Customer Classes Eligible
Eligible Technolo-
gies
Limit on Total Capa-
city
Treatment of Net Excess Generation
(NEG)
Intercon-nect Stan-
dards for Net
Metering Utilities Involved
KY Kentucky 15 kW Commer-cial,
residential, nonprofit, schools, govern-ment,
agricultural, institutional
Photo-voltaics
0.1% of a utility’s
single-hour peak load during the previous
year
Credited at retail rate to customer’s next
bill indefinitely
Yes Investor-owned utilities,
coopera-tives
LA City of New
Orleans
25 kW for residen-
tial; 100 kW
for commer-
cial
Commer-cial,
residential
Photo-voltaics,
wind, biomass,
geothermal, hydro, fuel
cells (renewable
fuels), micro-
turbines
None Credited at retail rate to customer’s next
bill indefinitely
Yes Entergy New
Orleans and any other
jurisdictional utilities
LA Louisiana 25 kW for residen-
tial; 100 kW
for commer-cial and agricul-
tural
Commer-cial,
residential, agricultural
Photo-voltaics,
wind, biomass,
geothermal, hydro, fuel
cells (renewable
fuels), micro-
turbines
None Credited at retail rate to customer’s next
bill indefinitely
Yes All utilities
MA Massa-chusetts
60 kW Commer-cial,
industrial, residential
Solar, wind, biomass,
hydro, geothermal,
fuel cells, municipal
solid waste, chp
None Credited at average monthly market rate to customer’s next
bill
Yes Investor-owned utilities
MD Maryland 2 MW Commer-cial,
residential, schools,
government
Photo-voltaics,
wind, biomass, anaerobic digestion
1,500 MW Credited at retail rate to customer’s next
bill; granted to utility at end of 12-month
period
Yes All utilities
ME Maine 100 kW Commer-cial,
industrial, residential
Solar, wind, biomass,
hydro, geothermal,
fuel cells, municipal
solid waste, chp, tidal energy
None Credited to customer’s next bill
at retail rate; granted to utility at end of 12-month billing cycle
No All utilities
73

State Program
System Size Limit
Customer Classes Eligible
Eligible Technolo-
gies
Limit on Total Capa-
city
Treatment of Net Excess Generation
(NEG)
Intercon-nect Stan-
dards for Net
Metering Utilities Involved
MI Michigan 30 kW Commer-cial,
industrial, residential, nonprofit, schools, govern-ment,
agricultural, institutional
Solar, landfill gas,
wind, biomass,
hydro, geothermal, municipal
solid waste
0.1% of a utility’s peak
load or 100 kW
(whichever is greater)
Credited at retail rate to customer’s next
bill; granted to utility at end of 12-month
billing cycle
Yes Various (voluntary participa-
tion)
MN Minne-sota
40 kW Commer-cial,
industrial, residential
Photo-voltaics,
wind, biomass,
hydro, municipal
solid waste, chp
None Customer receives a check for NEG at the end of each month, calculated at utility’s average retail rate
Yes All utilities
MT Montana 50 kW Commer-cial,
industrial, residential
Photo-voltaics,
wind, hydro
None Credited at retail rate to customer’s next
bill; granted to utility at end of 12-month
billing cycle
Yes Investor-owned utilities
MT Montana Electric
Coopera-tives
10 kW Commer-cial,
residential
Photo-voltaics,
wind, geothermal,
fuel cells, small hydro
None Granted to the utility Yes Most of MECA’s 26 members
NC North Carolina
20 kW for residen-
tial; 100 kW for non-residen-
tial
Commer-cial,
industrial, residential
Photo-voltaics,
landfill gas, wind,
biomass, anaerobic digestion,
small hydro
0.2% of each utility’s
North Carolina
retail peak load for the
previous year
Credited at retail rate to customer’s next bill at retail rate; granted to utility
(annually) at beginning of each summer season
Yes Investor-owned utilities
ND North Dakota
100 kW Commer-cial,
industrial, residential
Solar, wind, biomass,
hydro, geothermal, municipal
solid waste, chp
None Purchased by utility at avoided-cost rate
No Investor-owned utilities
NH New Hamp-shire
25 kW Commer-cial,
industrial, residential
Photo-voltaics,
wind, hydro
0.05% of a utility’s peak
demand
Credited at retail rate to customer’s next
bill
Yes All utilities
74

State Program
System Size Limit
Customer Classes Eligible
Eligible Technolo-
gies
Limit on Total Capa-
city
Treatment of Net Excess Generation
(NEG)
Intercon-nect Stan-
dards for Net
Metering Utilities Involved
NJ New Jersey
2 MW Commer-cial,
residential
Solar, landfill gas,
wind, biomass,
hydro, geothermal, anaerobic digestion,
tidal energy, wave
energy, fuel cells
(renewable fuels)
None Credited at retail rate to customer’s next bill; purchased by
utility at avoided-cost rate at end of 12-
month billing cycle
Yes Electric distribution companies (does not apply to
municipal utilities or
electric co-ops)
NM New Mexico
80 MW Commer-cial,
industrial, residential
Solar, landfill gas,
wind, biomass,
hydro, geothermal,
fuel cells, municipal
solid waste, combined heat and power, micro-
turbines
None Credited to customer’s next bill at utility’s avoided-
cost rate or purchased monthly by utility at avoided-
cost rate
Yes (revisions
in progress)
Investor-owned
utilities and co-ops
NV Nevada 150 kW Commer-cial,
industrial, residential
Solar, wind, biomass,
hydro, geothermal
1% of utility’s peak
capacity
Carried over to customer’s next bill
indefinitely as a kWh credit for systems < 30 kW; carried
over indefinitely as a dollar value or kWh credit for systems
>30 kW
Yes Investor-owned utilities
NY New York 10 kW for solar;
25 kW for residen-tial wind; 125 kW for farm-based wind;
400 kW for farm-based biogas
Residential, agricultural
Photo-voltaics,
wind, biomass
0.1% of IOU’s 1996 demand for solar; 0.2%
of IOU’s 2003
demand for wind; 0.4%
of IOU’s 1996
demand or farm-based
biogas
Credited at retail rate to customer’s next
bill, except NEG from wind systems over
10 kW, which is credited to
customer’s next bill at the utility’s
avoided-cost rate; all NEG purchased by
utility at avoided-cost rate at end of 12-
month billing cycle
Yes All utilities
75

State Program
System Size Limit
Customer Classes Eligible
Eligible Technolo-
gies
Limit on Total Capa-
city
Treatment of Net Excess Generation
(NEG)
Intercon-nect Stan-
dards for Net
Metering Utilities Involved
OH Ohio No limit specified (system must be sized to match
some or all of cus-tomer’s load)
Commer-cial,
industrial, residential
Solar, landfill gas,
wind, biomass,
hydro, fuel cells, micro-
turbines
1% of a utility’s peak
demand
Credited at utility’s unbundled
generation rate to customer’s next bill;
customer can request refund of
NEG credits accumulated over a
12-month period
Yes All electric distribution utilities and competitive retail elec-tric service providers
OH Yellow Springs Utilities
25 kW Commer-cial,
residential
Photo-voltaics,
wind
None Not addressed Utility guidelines
Yellow Springs Utilities
OK Okla-homa
100 kW or 25,000 kWh per
year (which-ever is less)
Commer-cial,
industrial, residential
Solar, wind, biomass,
hydro, geo-thermal,
municipal solid waste, combined heat and
power
None Granted to utility monthly or credited to customer’s next
bill (varies by utility)
No Investor-owned
utilities, co-ops
OR Oregon 25 kW Commer-cial,
industrial, residential
Solar, landfill gas,
wind, biomass,
hydro, fuel cells,
anaerobic digestion
A limit of 0.5% of a
utility’s historic
single-hour peak load can be set
Purchased at utility’s avoided cost or
credited to customer’s next bill at retail rate; at the end of an annual
period, any unused NEG credit is granted to the electric utility
Yes All utilities
OR Ashland Electric
None Commer-cial,
residential
Photo-voltaics,
wind
None Purchased by utility monthly at retail rate (1,000 kWh/month
maximum)
Utility guidelines
Ashland Electric
PA Pennsyl-vania
50 kW for residen-
tial systems; 1 MW for nonresi-dential
systems; 2 MW for systems connect-
ed to micro-
grids or available for emer-gencies
Commer-cial,
industrial, residential, nonprofit, schools, govern-ment,
agricultural, institutional
Solar, landfill gas,
wind, biomass,
hydro, fuel cells,
municipal solid waste, chp, waste coal, coal-
mine methane, anaerobic digestion,
other distributed generation
None Customer compensated
monthly at utility’s avoided-cost rate
Yes Investor-owned utilities
76

State Program
System Size Limit
Customer Classes Eligible
Eligible Technolo-
gies
Limit on Total Capa-
city
Treatment of Net Excess Generation
(NEG)
Intercon-nect Stan-
dards for Net
Metering Utilities Involved
RI Rhode Island
25 kW Commer-cial,
industrial, residential
Solar, wind, biomass,
hydro, geo-thermal, fuel cells, muni-cipal solid waste, chp
1 MW (Narragan-
sett Electric)
Credited at retail rate to customer’s next
bill; granted to utility at end of 12-month
billing cycle
No (informal
utility guide-lines)
Narragan-sett Electric
(National Grid)
TX Texas 50 kW for renew-ables;
10 kW for qualifying facilities
Commer-cial,
industrial, residential
Solar, land-fill gas, wind,
biomass, hydro,
geothermal, tidal energy,
wave energy, ocean
thermal
None Customer compensated
monthly at utility’s avoided-cost rate
Yes Integrated investor-owned
utilities (El Paso
Electric Company,
Entergy Texas, South-
western Electric Power
Company, Xcel
Energy) TX Austin
Energy 20 kW Commer-
cial, residential
Solar, landfill gas,
wind, biomass,
hydro, geo-thermal,
municipal solid waste, anaerobic digestion
Tariff re-evaluated after 1% of utility’s load is served by distributed renewables
Credited at retail rate to customer’s next bill; after 12-month
billing cycle, customer is
compensated for any remaining NEG
credits at the avoided-cost rate
Yes Austin Energy
UT Utah 25 kW Commer-cial,
industrial, residential
Solar, wind, hydro, fuel
cells
0.1% of a utility’s peak demand in
2001
Credited to customer’s next bill at utility’s avoided-
cost rate; granted to utility at end of calendar year
Yes Investor-owned
utilities, co-ops
UT City of St. George
10 kW Commer-cial,
residential
Photo-voltaics,
wind
None Credited to customer’s next bill at utility’s avoided-cost rate; indefinite
carryover
Yes City of St. George
UT Murray City
Power
10 kW Commer-cial,
residential
Photo-voltaics,
wind, small hydro
None Credited to customer’s next bill at utility’s retail rate;
granted to utility each April
Yes Murray City Power
77

Limit on Total Capa-
city
Treatment of Net Excess Generation
(NEG)
Intercon-nect Stan-
dards for Net
Metering Utilities Involved State Program
System Size Limit
Customer Classes Eligible
Eligible Technolo-
gies VA Virginia 10 kW
residen-tial;
500 kW nonresi-dential
Commer-cial,
residential, nonprofit, schools, govern-ment,
institutional
Solar, wind, biomass,
hydro, geothermal, municipal
solid waste, tidal energy,
wave energy
1% of each utility’s
adjusted Virginia
peak-load forecast for the previous
year
Credited at retail rate to customer’s next
bill; either granted to utility annually or
credited to following month
Yes Investor-owned
utilities, co-ops
VT Vermont 15 kW for commer-
cial, residen-tial, all others; 150 kW
for agricul-
tural
Commer-cial,
residential, nonprofit, schools, govern-ment,
agricultural, institutional
Solar, land-fill gas, wind,
biomass, hydro,
anaerobic digestion, fuel cells
(renewable fuels)
1% of 1996 peak
demand or peak
demand during most
recent calendar
year (whichever is greater)
Credited at retail rate to customer’s next
bill; granted to utility at end of 12-month
billing cycle
Yes All utilities
WA Washing-ton
100 kW Commer-cial,
industrial, residential
Solar, wind, hydro, fuel cells, chp
0.25% of a utility’s 1996
peak demand
Credited at retail rate to customer’s next
bill; granted to utility at end of 12-month
billing cycle
Yes All utilities
WA Grays Harbor PUD
25 kW Commer-cial,
industrial, residential
Solar, wind, hydro-
electric, fuel cells
0.1% of 1996 peak
load
Rolled over as a kWh credit on a monthly
basis, and purchased by utility at 50% of
retail rate at the end of each calendar
year
Yes Grays Harbor PUD
WI Wiscon-sin
20 kW; up to 100 kW for wind energy
systems in We
Energies territory
Commer-cial,
industrial, residential
Solar, wind, biomass,
hydro, geothermal, municipal
solid waste, chp, other distributed generation
None Purchased by utility at retail rate
(renewables) or avoided-cost rate (non-renewables);
NEG credit is carried over to the
customer’s next bill until it exceeds $25, at which point the utility must issue a
check for the amount payable to the
customer
Yes Investor-owned utilities,
municipal utilities
WY Wyoming 25 kW Commer-cial,
industrial, residential
Photo-voltaics,
wind, biomass,
hydro
None Credited at retail rate to customer’s next bill; purchased by
utility at avoided-cost rate at end of 12-
month billing cycle
Yes Investor-owned
utilities, co-ops
Source: DSIRE 2007.
78

Appendix B. State Incentives Tables and Assumptions Table B-1. Capacity Incentives by State and Customer Type
State & Cus-tomer Type29
Capacity Incentive Name
Eligible Turbine Size30
$/kW per Project M
ax %
Cos
t R
educ
tion
per
Proj
ect
Max
Cos
t R
educ
tion
per
Proj
ect
Max
kW
Elig
ible
fo
r Inc
entiv
e pe
r Pr
ojec
t
Relation-ship
Between Project Limits
Incentive Annual Budget
State Owns
the RECs
CA-C/I Self-Generation Incentive Program
100 kW–2,000 kW $1,500/kW 1,000
kW kW only $41,500,000
CA-C/I Emerging Renewables Program
10 kW–50 kW
$1,750/kW–$2,250/kW 30 kW kW only $5,300,000
CA-CW Self-Generation Incentive Program 5,000 kW $1,500/kW 1,000
kW kW only $41,500,000
CA-P Self-Generation Incentive Program
10 kW–2,000 kW $1,500/kW 1,000
kW kW only $41,500,000
CA-R Emerging Renewables Program
2 kW–10 kW
$2,250/kW–$2,500/kW 7.5 kW–
30 kW kW only $5,300,000
CT-C/I CCEF—On-Site Renewable DG Program
10 kW–2,000 kW $3,600/kW $4,000,000
$/kW or $, whichever
is less $6,624,000
CT-CW CCEF—On-Site Renewable DG Program 5,000 kW $3,600/kW $4,000,000
$/kW or $, whichever
is less $6,624,000
CT-P CCEF—On-Site Renewable DG Program
10 kW–2,000 kW $3,600/kW $4,000,000
$/kW or $, whichever
is less $6,624,000
CT-R DPUC—Capital Grants
for Customer-Side Distributed Resources
2 kW–10 kW $450/kW 65,000
kW kW only
IN-C/I Alternative Power & Energy Grant Program
10 kW–2,000 kW $2,500/kW $25,000 10 kW
kW or $, whichever
is less $150,000
IN-CW Alternative Power & Energy Grant Program 5,000 kW $2,500/kW $25,000 10 kW
kW or $, whichever
is less $150,000
IN-P Alternative Power & Energy Grant Program
10 kW–2,000 kW $2,500/kW $25,000 10 kW
kW or $, whichever
is less $150,000
29 Commercial/industrial, C/I; community wind, CW; public facility, P; residential, R. 30 For the residential customer class, the project team analyzed turbines with a minimum size of 2 kW. For this reason, all eligible residential turbine sizes are listed in state tables as 2 kW or greater. In some cases these residential incentives might apply to turbines smaller than 2 kW.
79

State & Cus-tomer Type29
Capacity Incentive Name
Eligible Turbine Size30
$/kW per Project M
ax %
Cos
t R
educ
tion
per
Proj
ect
Max
Cos
t R
educ
tion
per
Proj
ect
Max
kW
Elig
ible
fo
r Inc
entiv
e pe
r Pr
ojec
t
Relation-ship
Between Project Limits
Incentive Annual Budget
State Owns
the RECs
MA-R Small Renewables Initiative (SRI) Rebates
2 kW–10 kW $2,250/kW $50,000
$/kW or $, whichever
is less $1,800,000
MT-C/I NorthWestern Energy—USB Renewable Energy
Fund
10 kW–2,000 kW $2,000/kW $10,000
$/kW or $, whichever
is less $300,000
MT-CW NorthWestern Energy—USB Renewable Energy
Fund 5,000 kW $2,000/kW $10,000
$/kW or $, whichever
is less $300,000
MT-R NorthWestern Energy—USB Renewable Energy
Fund
2 kW–10 kW $2,000/kW $10,000
$/kW or $, whichever
is less $300,000
OH-C/I
ODOD—Advanced Energy Program
Grants—Distributed Energy and Renewable
Energy
10 kW–2,000 kW $2,500/kW 50% $150,000
% or $, whichever
is less $90,000
OH-CW
ODOD—Advanced Energy Program
Grants—Distributed Energy and Renewable
Energy
5,000 kW $2,500/kW 50% $150,000 % or $,
whichever is less
$90,000
OH-P
ODOD—Advanced Energy Program
Grants—Distributed Energy and Renewable
Energy
10 kW–2,000 kW $2,500/kW 50% $150,000
% or $, whichever
is less $90,000
OR-C/I Energy Trust—Small Wind Incentive Program
10 kW–50 kW $4,000/kW $60,000
$/kW or $, whichever
is less $1,400,000 Yes
OR-P Energy Trust—Small Wind Incentive Program
10 kW–50 kW $4,000/kW $60,000
$/kW or $, whichever
is less $1,400,000 Yes
OR-R Energy Trust—Small Wind Incentive Program
2 kW–10 kW $4,500/kW $35,000
$/kW or $, whichever
is less $1,400,000 Yes
VT-C/I Solar & Small Wind Incentive Program
10 kW–2,000 kW $2,500/kW $12,500 $ only $375,000
VT-CW Solar & Small Wind Incentive Program 5,000 kW $4,500/kW 50% $20,000
% or $, whichever
is less $375,000
VT-P Solar & Small Wind Incentive Program
10 kW–2,000 kW $4,500/kW 50% $20,000
% or $, whichever
is less $375,000
VT-R Solar & Small Wind Incentive Program
2 kW–10 kW $2,500/kW $12,500 $ only $375,000
80

Table B-2. Cost Incentives by State and Customer Type
State & Cus-tomer type Cost Incentive Name Eligible Turbine Size
Max % Cost
Reduction per
Project
Max Cost Reduction per Project
Relation-ship
Between Project Limits
Incentive Annual Budget
If Tax Credit,
Can It be Carried
Forward? (Years)
AZ-C/I Non-Residential Solar & Wind Tax Credit 10 kW–2,000 kW 10% $50,000
% or $, whichever
is less $500,000 5
AZ-CW Non-Residential Solar & Wind Tax Credit 5,000 kW 10% $50,000
% or $, whichever
is less $500,000 5
AZ-P Non-Residential Solar & Wind Tax Credit 10 kW–2,000 kW 10% $50,000
% or $, whichever
is less $500,000 5
AZ-R Residential Solar and Wind Energy Systems Tax Credit 2 kW–10 kW 25% $1,000
% or $, whichever
is less 5
CT-C/I CCEF—Project 150 Initiative 1,000 kW–2,000 kW $50,000$ only, but
min not max
12,500 kW
CT-CW CCEF—Project 150 Initiative 5,000 kW $50,000$ only, but
min not max
12,500 kW
DC-C/I Renewable Energy
Demonstration Project (REDP)
10 kW–100 kW 50% $163,000% or $,
whichever is less
$225,000
DC-PF Renewable Energy
Demonstration Project (REDP)
10 kW–100 kW 50% $163,000% or $,
whichever is less
$225,000
DC-R Renewable Energy
Demonstration Project (REDP)
2 kW–10 kW 50% $163,000% or $,
whichever is less
$225,000
DE-C/I Green Energy Program Incentives 10 kW–2,000 kW 50% $100,000
% or $, whichever
is less $741,000
DE-CW Green Energy Program Incentives 5,000 kW 50% $100,000
% or $, whichever
is less $741,000
DE-PF Green Energy Program Incentives 10 kW–2,000 kW 50% $100,000
% or $, whichever
is less $741,000
DE-R Green Energy Program Incentives 2 kW–10 kW 50% $22,500
% or $, whichever
is less $494,000
GA-C/I Clean Energy Tax Credit 10 kW–2,000 kW 35% $500,000% or $,
whichever is less
$1,250,000 5
GA-CW Clean Energy Tax Credit 5,000 kW 35% $500,000% or $,
whichever is less
$1,250,000 5
GA-R Clean Energy Tax Credit 2 kW–10 kW 35% $10,500% or $,
whichever is less
$1,250,000 5
ID-R Residential Alternative Energy Tax Deduction 2 kW–10 kW $10,736–
$15,211 $ only 5
IL-C/I Wind Energy Production Development Program 500 kW–2,000 kW $25,000 $ only $562,500
IL-CW Illinois Clean Energy
Community Foundation Grants
5,000 kW 25% % only $2,000,000
IL-CW Wind Energy Production Development Program 5,000 kW $25,000 $ only $562,500
IL-P Illinois Clean Energy
Community Foundation Grants
10 kW–2,000 kW 25% % only $2,000,000
IL-P Wind Energy Production Development Program 500 kW–2,000 kW $25,000 $ only $562,500
KY-C/I Tax Credit for Renewable Energy Facilities 1,000 kW–2,000 kW 50% % only 25
81

State & Cus-tomer type Cost Incentive Name Eligible Turbine Size
Max % Cost
Reduction per
Project
Max Cost Reduction per Project
Relation-ship
Between Project Limits
Incentive Annual Budget
If Tax Credit,
Can It be Carried
Forward? (Years)
KY-C/I Renewable Energy Tax Credit 10 kW–750 kW 30% $1,000% or $,
whichever is less
1
KY-CW Tax Credit for Renewable Energy Facilities 5,000 kW 50% % only 25
KY-R Renewable Energy Tax Credit 2 kW–10 kW 30% $500% or $,
whichever is less
1
LA-R
Tax Credit for Solar and Wind Energy Systems on Residential Property
(Corporate)
2 kW–10 kW 50% $12,500% or $,
whichever is less
0
MA-C/I MTC—Large Onsite
Renewables Initiative (LORI) Grants
50 kW–2,000 kW 75% $400,000% or $,
whichever is less
$3750,000
MA-P MTC—Large Onsite
Renewables Initiative (LORI) Grants
50 kW–2,000 kW 75% $400,000% or $,
whichever is less
$3,750,000
MA-R Residential Renewable Energy Income Tax Credit 2 kW–10 kW 15% $1,000
% or $, whichever
is less 3
ME-C/I Solar and Wind Energy Rebate Program 10 kW–100 kW 35% $10,500
% or $, whichever
is less $250,000
ME-CW Voluntary Renewable Resources Grant 5,000 kW 50% $50,000
% or $, whichever
is less $150,000
ME-P Voluntary Renewable Resources Grant 10 kW–2,000 kW 50% $50,000
% or $, whichever
is less $150,000
ME-R Solar and Wind Energy Rebate Program 2 kW–10 kW 30% $2,500
% or $, whichever
is less $250,000
MI-P Community Energy Project Grant 10 kW–2,000 kW $6,000 $ only $45,000
MT-R Residential Alternative Energy System Tax Credit 2 kW–10 kW 100% $500
% or $, whichever
is less 4
NC-C/I North Carolina Green Business Fund 10 kW–2,000 kW $100,000 $ only $475,000
NC-CW Renewable Energy Tax Credit 5,000 kW 35% $2,500,000% or $,
whichever is less
4
NC-CW North Carolina Green Business Fund 10 kW–2,000 kW $100,000 $ only $475,000
NC-P North Carolina Green Business Fund 10 kW–2,000 kW $100,000 $ only $475,000
NC-R Renewable Energy Tax Credit 2 kW–10 kW 35% $10,500% or $,
whichever is less
5
ND-C/I Renewable Energy Tax Credit 10 kW–2,000 kW 15% % only 5
ND-C/I Renewable Energy Tax Credit 10 kW–2,000 kW 15% % only 5
ND-CW Renewable Energy Tax Credit 5,000 kW 15% % only 5
ND-R Renewable Energy Tax Credit 2 kW–10 kW 15% % only 5
NH-C/I New Hampshire Electric Co-Op—Solar and Wind Energy
Rebate Program 10 kW–100 kW 25% $5,000
% or $, whichever
is less
NH-P New Hampshire Electric Co-Op—Solar and Wind Energy
Rebate Program 10 kW–100 kW 25% $5,000
% or $, whichever
is less
NH-R New Hampshire Electric Co-Op—Solar and Wind Energy
Rebate Program 2 kW–10 kW 25% $5,000
% or $, whichever
is less
NY-C/I NYSERDA—On-Site Small Wind Incentive Program 10 kW–250 kW $24,000–
$118,000 $ only $1,500,000
82

State & Cus-tomer type Cost Incentive Name Eligible Turbine Size
Max % Cost
Reduction per
Project
Max Cost Reduction per Project
Relation-ship
Between Project Limits
Incentive Annual Budget
If Tax Credit,
Can It be Carried
Forward? (Years)
NY-P NYSERDA—On-Site Small Wind Incentive Program 10 kW–250 kW $28,800–
$141,600 $ only $1,500,000
NY-R NYSERDA—On-Site Small Wind Incentive Program 2 kW–10 kW $7,200–
$24,000 $ only $1,500,000
OR-C/I Business Energy Tax Credit 10 kW–2,000 kW 50% $10,000,000% or $,
whichever is less
8
OR-CW Business Energy Tax Credit 5,000 kW 50% $10,000,000% or $,
whichever is less
8
OR-P Business Energy Tax Credit 10 kW–2,000 kW 50% $10,000,000% or $,
whichever is less
8
PA-P Pennsylvania Energy Harvest Grant Program 10 kW–2,000 kW 50% $500,000
% or $, whichever
is less $2,500,000
RI-R Residential Renewable Energy Tax Credit 2 kW–10 kW 25% $3,750
% or $, whichever
is less no
TN-R TVA—Green Power Switch Generation Partners Program 2 kW–10 kW $500 $ only 75 kW
TX-C/I Solar and Wind Energy Device Franchise Tax
Deduction 10 kW–2,000 kW 100% % only Indefinite
TX-CW Solar and Wind Energy Device Franchise Tax
Deduction 5,000 kW 100% % only Indefinite
UT-C/I Renewable Energy Systems Tax Credit 10 kW–500 kW 10% $50,000
% or $, whichever
is less 0
UT-R Renewable Energy Systems Tax Credit 2 kW–10 kW 25% $2,000
% or $, whichever
is less 4
VT-C/I Clean Energy Development Fund (CEDF) Grant Program 10 kW–2,000 kW 50% $60,000–
$250,000
% or $, whichever
is less $1,741,200
VT-CW Clean Energy Development Fund (CEDF) Grant Program 5,000 kW 50% $250,000
% or $, whichever
is less $1,741,200
VT-P Clean Energy Development Fund (CEDF) Grant Program 10 kW–2,000 kW 50% $250,000
% or $, whichever
is less $1,741,200
VT-R Clean Energy Development Fund (CEDF) Grant Program 2 kW–10 kW 50% $60,000
% or $, whichever
is less $1,741,200
Table B-3. Production Incentives by State and Customer Type
State & Cus-tomer Type Production Incentive Name
Eligible Turbine
Size $/kWh per
Project
Max Years
Eligible
Max Money per
Project Each Year
Incentive Annual Budget
State Owns
the RECs
If Tax Credit,
Can It be Carried
Forward? (Years)
CA-C/I Feed-in Tariff 10 kW–2,000 kW $0.1000/kWh 20 114,224 kW Yes
CA-CW Feed-in Tariff 5,000 kW $0.1000/kWh 20 114,224 kW Yes
CA-P Feed-in Tariff 10 kW–2,000 kW $0.1000/kWh 20 114,224 kW Yes
CA-R Feed-in Tariff 2 kW–10 kW $0.1000/kWh 20 114,224 kW Yes
CT-C/I CCEF—Project 150 Initiative 1,000 kW–2,000 kW $0.0550/kWh 15 1,250 kW Yes
CT-CW CCEF—Project 150 Initiative 5,000 kW $0.0550/kWh 15 1,250 kW Yes
83

State & Cus-tomer Type Production Incentive Name
Eligible Turbine
Size $/kWh per
Project
Max Years
Eligible
Max Money per
Project Each Year
Incentive Annual Budget
State Owns
the RECs
If Tax Credit,
Can It be Carried
Forward? (Years)
FL-CW Renewable Energy Production Tax Credit 5,000 kW $0.01/kWh 3 $2,500,000 5
IA-C/I Renewable Energy
Production Tax Credits (Corporate)
2,000 kW $0.0100/kWh 10 225,000 kW
IA-CW Renewable Energy
Production Tax Credits (Corporate)
5,000 kW $0.0100/kWh 10 225,000 kW
IA-P Renewable Energy
Production Tax Credits (Corporate)
2,000 kW $0.0100/kWh 10 225,000 kW
MD-C/I Clean Energy Production Tax Credit (Corporate)
10 kW–2,000 kW $0.0085/kWh 5 $2,500,000 $12,500,000 10
MD-CW Clean Energy Production Tax Credit (Corporate) 5,000 kW $0.0085/kWh 5 $2,500,000 $12,500,000 10
MD-R Clean Energy Production Tax Credit (Corporate)
2 kW–10 kW $0.0085/kWh 5 $2,500,000 $12,500,000 10
NJ-C/I New Jersey Clean Energy Rebate Program
10 kW–500 kW $0.50-3.20/kWh 1 $32,102–
$361,489 $25,000,000
NJ-P New Jersey Clean Energy Rebate Program
10 kW–500 kW $0.50-3.20/kWh 1 $32,102–
$361,489 $25,000,000
NJ-R New Jersey Clean Energy Rebate Program
2 kW–10 kW $3.2000/kWh 1 $16,639–
$32,102 $25,000,000
NM-C/I Renewable Energy Production Tax Credit
1,000 kW–2,000 kW $0.0100/kWh 10 $4,000,000 $10,000,000
NM-CW Renewable Energy Production Tax Credit 5,000 kW $0.0100/kWh 10 $4,000,000 $10,000,000
OK-C/I Zero-Emission Facilities Production Tax Credit
1,000 kW–2,000 kW $0.0050/kWh 10 10
OK-CW Zero-Emission Facilities Production Tax Credit 5,000 kW $0.0050/kWh 10 10
OK-P Zero-Emission Facilities Production Tax Credit
1,000 kW–2,000 kW $0.0050/kWh 10 10
OR-R Residential Energy Tax Credit 2 kW–10 kW $2.0000/kWh 1 $6,000 No 5
TN-R TVA—Green Power Switch Generation Partners Program
2 kW–10 kW $0.1500/kWh 10 Yes
UT-C/I Renewable Energy Systems Tax Credit
750 kW–2,000 kW $0.0035/kWh 4 0
UT-CW Renewable Energy Systems Tax Credit 5,000 kW $0.0035/kWh 4 0
WA-C/I Washington Renewable Energy Production Incentive
10 kW–2,000 kW $0.1200/kWh 6 $2,000 No
WA-CW Washington Renewable Energy Production Incentive 5,000 kW $0.1200/kWh 6 $2,000 No
WA-P Washington Renewable Energy Production Incentive
10 kW–2,000 kW $0.1200/kWh 6 $2,000 No
WA-R Washington Renewable Energy Production Incentive
2 kW–10 kW $0.1200/kWh 6 $2,000 No
Table B-4. Property Tax Incentives by State and Customer Type
State & Customer
Type Property Tax Incentive Name Eligible Turbine Size
% Reduc
tion
Number of Years Exempt
Max Cost Reduc-tion Per Project
CT-C/I Property Tax Exemption for Renewable Energy Systems 10 kW–2,000 kW Indefinite
CT-CW Property Tax Exemption for Renewable Energy Systems 5,000 kW Indefinite
CT-R Property Tax Exemption for Renewable Energy Systems 2 kW–10 kW Indefinite
IA-C/I Property Tax Exemption for Renewable Energy Systems 10 kW–2,000 kW 100% 5
IA-CW Property Tax Exemption for Renewable Energy Systems 5,000 kW 100% 5
IA-R Property Tax Exemption for Renewable Energy Systems 2 kW–10 kW 100% 5
84
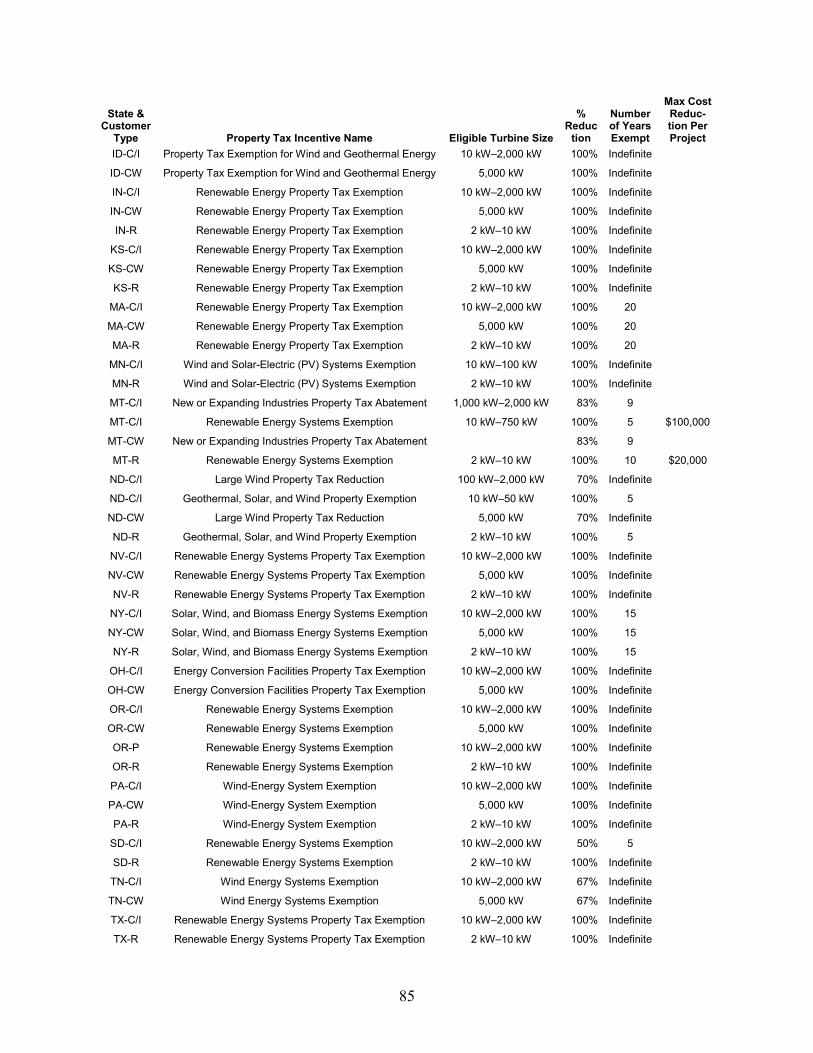
State & Customer
Type Property Tax Incentive Name Eligible Turbine Size
% Reduc
tion
Number of Years Exempt
Max Cost Reduc-tion Per Project
ID-C/I Property Tax Exemption for Wind and Geothermal Energy 10 kW–2,000 kW 100% Indefinite
ID-CW Property Tax Exemption for Wind and Geothermal Energy 5,000 kW 100% Indefinite
IN-C/I Renewable Energy Property Tax Exemption 10 kW–2,000 kW 100% Indefinite
IN-CW Renewable Energy Property Tax Exemption 5,000 kW 100% Indefinite
IN-R Renewable Energy Property Tax Exemption 2 kW–10 kW 100% Indefinite
KS-C/I Renewable Energy Property Tax Exemption 10 kW–2,000 kW 100% Indefinite
KS-CW Renewable Energy Property Tax Exemption 5,000 kW 100% Indefinite
KS-R Renewable Energy Property Tax Exemption 2 kW–10 kW 100% Indefinite
MA-C/I Renewable Energy Property Tax Exemption 10 kW–2,000 kW 100% 20
MA-CW Renewable Energy Property Tax Exemption 5,000 kW 100% 20
MA-R Renewable Energy Property Tax Exemption 2 kW–10 kW 100% 20
MN-C/I Wind and Solar-Electric (PV) Systems Exemption 10 kW–100 kW 100% Indefinite
MN-R Wind and Solar-Electric (PV) Systems Exemption 2 kW–10 kW 100% Indefinite
MT-C/I New or Expanding Industries Property Tax Abatement 1,000 kW–2,000 kW 83% 9
MT-C/I Renewable Energy Systems Exemption 10 kW–750 kW 100% 5 $100,000
MT-CW New or Expanding Industries Property Tax Abatement 83% 9
MT-R Renewable Energy Systems Exemption 2 kW–10 kW 100% 10 $20,000
ND-C/I Large Wind Property Tax Reduction 100 kW–2,000 kW 70% Indefinite
ND-C/I Geothermal, Solar, and Wind Property Exemption 10 kW–50 kW 100% 5
ND-CW Large Wind Property Tax Reduction 5,000 kW 70% Indefinite
ND-R Geothermal, Solar, and Wind Property Exemption 2 kW–10 kW 100% 5
NV-C/I Renewable Energy Systems Property Tax Exemption 10 kW–2,000 kW 100% Indefinite
NV-CW Renewable Energy Systems Property Tax Exemption 5,000 kW 100% Indefinite
NV-R Renewable Energy Systems Property Tax Exemption 2 kW–10 kW 100% Indefinite
NY-C/I Solar, Wind, and Biomass Energy Systems Exemption 10 kW–2,000 kW 100% 15
NY-CW Solar, Wind, and Biomass Energy Systems Exemption 5,000 kW 100% 15
NY-R Solar, Wind, and Biomass Energy Systems Exemption 2 kW–10 kW 100% 15
OH-C/I Energy Conversion Facilities Property Tax Exemption 10 kW–2,000 kW 100% Indefinite
OH-CW Energy Conversion Facilities Property Tax Exemption 5,000 kW 100% Indefinite
OR-C/I Renewable Energy Systems Exemption 10 kW–2,000 kW 100% Indefinite
OR-CW Renewable Energy Systems Exemption 5,000 kW 100% Indefinite
OR-P Renewable Energy Systems Exemption 10 kW–2,000 kW 100% Indefinite
OR-R Renewable Energy Systems Exemption 2 kW–10 kW 100% Indefinite
PA-C/I Wind-Energy System Exemption 10 kW–2,000 kW 100% Indefinite
PA-CW Wind-Energy System Exemption 5,000 kW 100% Indefinite
PA-R Wind-Energy System Exemption 2 kW–10 kW 100% Indefinite
SD-C/I Renewable Energy Systems Exemption 10 kW–2,000 kW 50% 5
SD-R Renewable Energy Systems Exemption 2 kW–10 kW 100% Indefinite
TN-C/I Wind Energy Systems Exemption 10 kW–2,000 kW 67% Indefinite
TN-CW Wind Energy Systems Exemption 5,000 kW 67% Indefinite
TX-C/I Renewable Energy Systems Property Tax Exemption 10 kW–2,000 kW 100% Indefinite
TX-R Renewable Energy Systems Property Tax Exemption 2 kW–10 kW 100% Indefinite
85

86
State & Customer
Type Property Tax Incentive Name Eligible Turbine Size
% Reduc
tion
Number of Years Exempt
Max Cost Reduc-tion Per Project
WI-C/I Solar and Wind Energy Equipment Exemption 10 kW–2,000 kW 100% Indefinite
WI-CW Solar and Wind Energy Equipment Exemption 5,000 kW 100% Indefinite
WI-R Solar and Wind Energy Equipment Exemption 2 kW–10 kW 100% Indefinite
Table B-5. Sales Tax Incentives by State and Customer Type
State & Cus-
tomer Type Sales Tax Exemption Eligible Turbine Size
Scope of Exemption (Equipment,
Installation, Both) AZ-C/I Solar and Wind Equipment Sales Tax Exemption 10 kW–2,000 kW Both
AZ-CW Solar and Wind Equipment Sales Tax Exemption 5,000 kW Both
AZ-R Solar and Wind Equipment Sales Tax Exemption 2 kW–10 kW Both
IA-C/I Wind and Solar Wind and Solar Energy Equipment Exemption 10 kW–2,000 kW Both
IA-CW Wind and Solar Wind and Solar Energy Equipment Exemption 5,000 kW Both
IA-R Wind and Solar Wind and Solar Energy Equipment Exemption 2 kW–10 kW Both
ID-C/I Renewable Energy Equipment Sales Tax Refund 50 kW–2,000 kW Both
ID-CW Renewable Energy Equipment Sales Tax Refund 5,000 kW Both
KY-C/I Tax Credit for Renewable Energy Facilities 1,000 kW–2,000 kW Both
KY-CW Tax Credit for Renewable Energy Facilities 5,000 kW Both
MA-R Renewable Energy Equipment Sales Tax Exemption 2 kW–10 kW Equipment
MN-C/I Wind Sales Tax Exemption 10 kW–2,000 kW Both
MN-CW Wind Sales Tax Exemption 5,000 kW Both
MN-R Wind Sales Tax Exemption 2 kW–10 kW Both
NJ-C/I Solar and Wind Energy Systems Exemption 10 kW–2,000 kW Equipment
NJ-CW Solar and Wind Energy Systems Exemption 5,000 kW Equipment
NJ-R Solar and Wind Energy Systems Exemption 2 kW–10 kW Equipment
OH-C/I Energy Conversion Facilities Sales Tax Exemption 10 kW–2,000 kW Equipment
OH-CW Energy Conversion Facilities Sales Tax Exemption 5,000 kW Equipment
RI-C/I Renewable Energy Sales Tax Exemption 10 kW–2,000 kW Equipment
RI-CW Renewable Energy Sales Tax Exemption 5,000 kW Equipment
RI-R Renewable Energy Sales Tax Exemption 2 kW–10 kW Equipment
UT-C/I Renewable Energy Sales Tax Exemption 50 kW–2,000 kW Equipment
UT-CW Renewable Energy Sales Tax Exemption 5,000 kW Equipment
VT-C/I Sales Tax Exemption 10 kW–250 kW Equipment
VT-R Sales Tax Exemption 2 kW–10 kW Equipment
WA-C/I Sales and Use Tax Exemption 10 kW–2,000 kW Equipment
WA-CW Sales and Use Tax Exemption 5,000 kW Equipment
WA-R Sales and Use Tax Exemption 2 kW–10 kW Equipment
WY-C/I Renewable Energy Sales Tax Exemption 10 kW–2,000 kW Equipment
WY-CW Renewable Energy Sales Tax Exemption 5,000 kW Equipment
WY-P Renewable Energy Sales Tax Exemption 10 kW–2,000 kW Equipment
WY-R Renewable Energy Sales Tax Exemption 2 kW–10 kW Equipment

Incentives Omitted • All pilot incentives purely for demonstration projects (e.g., R&D). These included the
Tennessee Bonneville Environmental Foundation and Pennsylvania Energy Development Authority Grants.
• The local option property-tax exemptions in Vermont and Colorado did not have evidence of widespread use.
• The Montana Alternative Energy Corporate Tax Credit, because it only came out of income tax from projects and was difficult to include in the modeling.
• The Minnesota Production Tax Credit and the South Dakota capacity incentive, because they actually are a production taxes.
• The Connecticut Capital Grants for Customer-Side Distributed Resources, because the grant program is funded through federally mandated congestion charges which are based on periods of peak demand. The cap was difficult to determine and no historical data could be found. Including this incentive as an uncapped incentive would have given all Connecticut projects unrealistic NPVs.
General Assumptions • In cases where wind had been added as an eligible technology to a solar incentive
program, but specific wind incentives limits had not been set, the project team assumed that wind projects would get the same level of incentive as solar PV or solar thermal, depending on the incentive program rules.
• The project team considered commercial, industrial, and public facility projects ineligible for Florida’s Renewable Energy Production Tax Credit, because the credit only applied to kWh sold.
• For the Energy Trust of Oregon Small Wind Incentive, the project team assumed that the Trust kept all the RECs for the entire span of the project.
• Pennsylvania Harvest grants have varied grant awards. The project team used the new $500,000 maximum award and assumed a maximum reduction of 50% of total project costs based on historical awards.
• The project team assumed reauthorization of all incentives as they currently stand, unless the project team received information which strongly suggested otherwise.
Application Rules for Incentives • For Kentucky commercial, industrial, and community wind projects, the cost and sales
incentives combined cannot exceed 50% of capital costs.
• In California, only one incentive can be used per project and no federal incentives can be combined with the state incentive. Further, non–tax credit incentives received from sources other than the Emerging Renewables Program, such as utility-based incentives, reduce the amount of the Emerging Renewables Program rebate by no less than 5% to prevent total incentives from exceeding total system costs.
• For Iowa commercial, industrial, and community wind projects, the production tax credit cannot be combined with the sales- and property-tax incentives.
87

Simplifying Assumptions The project team reassigned the Washington Renewable Energy Production Incentive as a one-time cash grant for all customer sectors and turbine packages. The project team calculated that all scenarios would exceed the cap each year, and thus calculated the NPV of a one-time grant.
88

89
Appendix C. Kilowatt Potential Tables by State Table C-1. Total Kilowatts per State, Community Wind Customer Class*
State Total (Capped and Uncapped)
AZ 45,000CA 1,510,000CO 350,000CT 50,000MA 575,000MD 10,000ME 1,195,000NC 50,000NH 2,695,000NM 480,000NV 165,000NY 2,860,000OR 35,000PA 30,000RI 40,000VA 15,000VT 5,755,000WV 35,000
Grand Total 15,895,000
*All sites use 5,000 kW turbines.
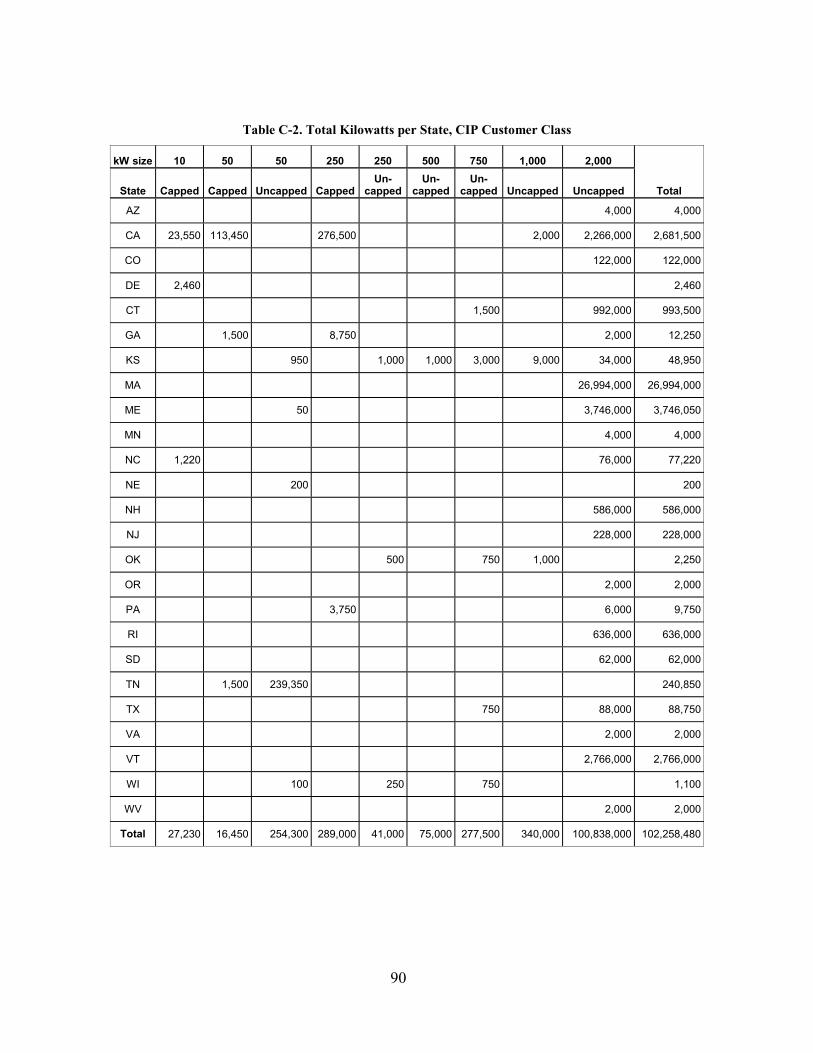
Table C-2. Total Kilowatts per State, CIP Customer Class
kW size 10 50 50 250 250 500 750 1,000 2,000
Total State Capped Capped Uncapped CappedUn-
cappedUn-
cappedUn-
capped Uncapped Uncapped
AZ 4,000 4,000
CA 23,550 113,450 276,500 2,000 2,266,000 2,681,500
CO 122,000 122,000
DE 2,460 2,460
CT 1,500 992,000 993,500
GA 1,500 8,750 2,000 12,250
KS 950 1,000 1,000 3,000 9,000 34,000 48,950
MA 26,994,000 26,994,000
ME 50 3,746,000 3,746,050
MN 4,000 4,000
NC 1,220 76,000 77,220
NE 200 200
NH 586,000 586,000
NJ 228,000 228,000
OK 500 750 1,000 2,250
OR 2,000 2,000
PA 3,750 6,000 9,750
RI 636,000 636,000
SD 62,000 62,000
TN 1,500 239,350 240,850
TX 750 88,000 88,750
VA 2,000 2,000
VT 2,766,000 2,766,000
WI 100 250 750 1,100
WV 2,000 2,000
Total 27,230 16,450 254,300 289,000 41,000 75,000 277,500 340,000 100,838,000 102,258,480
90

Table C-3. Total Kilowatts per State, NREL Turbines
State Turbine Size (kW)
Total 250 500AZ 2,500 2,500
CA 1,928,500 1,928,500
CO 206,500 206,500
CT 4,792,500 4,792,500
DE 49,000 49,000
GA 4,000 4,000
IA 7,000 7,000
IL 1,500 1,500
KS 5,500 48,500 54,000
MA 19,275,000 19,275,000
MD 250 14,000 14,250
ME 5,123,500 5,123,500
MI 14,500 14,500
MN 4,500 4,500
NC 1,112,000 1,112,000
NE 1,500 1,500
NH 1,597,500 1,597,500
NJ 514,000 514,000
NM 49,000 49,000
NV 2,000 2,000
NY 146,750 55,913,500 56,060,250
OH 1,000 1,000
OK 2,500 8,500 11,000
OR 218,000 218,000
PA 9,000 9,000
RI 3,572,500 3,572,500
SD 500 500
TN 616,000 616,000
TX 4,742,000 4,742,000
VA 4,000 4,000
VT 2,191,000 2,191,000
WI 250 3,500 3,750
WV 500 500
WY 500 500 Grand Total 155,250 102,028,000 102,183,250
91

Appendix D. Economically Successful Projects Incorporating Uncapped Incentives
Table D-1. Economically Successful Commercial, Industrial, and Public Facility Projects Incorporating Uncapped Incentives
92

93
93

Table D-1 Notes 1. Retail rate expressed in cents per kilowatt hour (¢/kWh). To condense the presentation, rates are grouped in $0.05
intervals. For example, the column headed by 0.2 represents retail electric rates from $0.16 to $0.20 per kWh. 2. Turbine size is expressed in kilowatts (kW). 3. Wind Power Class (WPC). Analysis considered turbine sizes 10 kW, 50 kW, 100 kW, 250 kW, 500 kW, 750 kW, 1,000 kW, and 2,000 kW.
Table D-2. Economically Successful Commercial, Industrial, and Public Facility Projects Incorporating Capped Incentives
Retail Rate1 and Tur-bine Size2
0.075
0.075 Total
0.1 0.1 Total
0.125 0.125 Total
0.15 0.15 Total
0.175 0.175 Total
Grand Total
10 50 250 10 50 250 10 50 250 10 50 250 10 50 State and WPC3 CA 3 2 5 76 108 184 2,311 2,170 996 5,477 44 20 64 5,730
2 1 1 41 41 42
3 3 2 5 76 108 184 2,311 2,170 995 5,476 3 20 23 5,688
DE 222 222 24 24 246
2 222 222 24 24 246
GA 30 35 65 65
4 30 35 65 65
NC 25 25 97 97 122
2 24 24 96 96 120
3 1 1 1 1 2
PA 1 1 14 14 15
3 1 1 14 14 15
TN 224 224 990 990 1,214
3 221 221 990 990 1,211
4 3 3 3Grand Total 25 224 1 250 97 1,023 51 1,171 222 76 108 406 2,335 2,170 996 5,501 44 20 64 7,392
Table D-2 Notes 1. Retail rate expressed in cents per kilowatt hour (¢/kWh). To condense the presentation, rates are grouped in $0.05
intervals. For example, the column headed by 0.2 represents retail electric rates from $0.16 to $0.20 per kWh. 2. Turbine size is expressed in kilowatts (kW). 3. Wind Power Class (WPC). Analysis considered turbine sizes 10 kW, 50 kW, 100 kW, 250 kW, 500 kW, 750 kW, 1,000 kW, and 2,000 kW.
94

Table D-3. Economically Successful Community Wind Projects Incorporating Capped and Uncapped Incentives
REC1 Rate2 0.004 0.0057 0.00715 0.015 0.042 0.045
Grand Total Wholesale Power Pool3 and WPC4
CA-ISO 302 302 6 240 240 7 62 62
ECAR 7 7 7 7 7
MAAC 6 6 6 6 6
NEPOOL 2 1,939 123 2,064 2 4 4 3 254 254 4 557 81 638 5 356 22 378 6 2 352 13 367 7 416 7 423
NWPP 7 7 7 7 7
NYISO 572 572 5 568 568 6 2 2 7 2 2
RMPA 208 208 6 171 171 7 37 37
SERC 13 13 6 5 5 7 8 8
Grand Total 6 22 517 572 1,939 123 3,179 Table D-3 Notes 1. Renewable Energy Credit (REC). 2. REC rate expressed in cents per kilowatt hour (¢/kWh). 3. Wholesale abbreviations are:
• CA ISO—California Independent Systems Operator; • ECAR—East Central Area Reliability Council; • ERCOT—Electric Reliability Council of Texas; • MAAC—Mid-Atlantic Area Council; • NEPOOL—New England Power Pool; • NWPP—Northwest Power Pool; • NYISO—New York Independent System Operator; • RMPA—Rocky Mountain Power Area; • SERC—Southeast Reliability Council; and • WPC—Wind Power Class.
Analysis considered one turbine package only, 5 x 1,000 kW. Only 10 winners were added due to capped incentives, therefore both capped and uncapped are included in a single
table. Total includes all successful projects over a 10-year horizon.
95

Table D-4. Economically Successful Projects Incorporating Uncapped Incentives—NREL Turbines in Commercial, Industrial, and Public Facility
Retail Rate1 and Tur-bine Size2
0.10 0.15 0.20 0.25 0.30 0.40
Grand Total 500 Both4 Total 250 500 Both Total 250 500 Both Total 250 500 Both Total 500 Both Total 250 Both Total
State and
WPC3
AZ 3 2 5 – – – – – – – – – – – – – – – – – – 5
4 3 – 3 – – – – – – – – – – – – – – – – – – 3
6 – 2 2 – – – – – – – – – – – – – – – – – – 2
CA 47 7 54 – 2,472 1,326 3,798 – 4 1 5 – – – – – – – – – – 3,857
2 – – – – – – – – 1 – 1 – – – – – – – – – – 1
3 32 – 32 – 768 25 793 – 3 1 4 – – – – – – – – – – 829
4 14 1 15 – 1,704 244 1,948 – – – – – – – – – – – – – – 1,963
5 1 6 7 – – 607 607 – – – – – – – – – – – – – – 614
6 – – – – – 406 406 – – – – – – – – – – – – – – 406
7 – – – – – 44 44 – – – – – – – – – – – – – – 44
CO 253 60 313 – 98 2 100 – – – – – – – – – – – – – – 413
2 – – – – – 1 1 – – – – – – – – – – – – – – 1
3 1 – 1 – 1 – 1 – – – – – – – – – – – – – – 2
4 252 1 253 – 97 – 97 – – – – – – – – – – – – – – 350
5 – 13 13 – – 1 1 – – – – – – – – – – – – – – 14
6 – 43 43 – – – – – – – – – – – – – – – – – – 43
7 – 3 3 – – – – – – – – – – – – – – – – – – 3
CT 383 55 438 – 8,205 852 9,057 – 74 16 90 – – – – – – – – – – 9,585
2 383 54 437 – 8,205 364 8,569 – 74 16 90 – – – – – – – – – – 9,096
3 – 1 1 – – 488 488 – – – – – – – – – – – – – – 489
DE 98 – 98 – – – – – – – – – – – – – – – – – – 98
3 98 – 98 – – – – – – – – – – – – – – – – – – 98
GA 6 2 8 – – – – – – – – – – – – – – – – – – 8
4 6 2 8 – – – – – – – – – – – – – – – – – – 8
IA 14 – 14 – – – – – – – – – – – – – – – – – – 14
3 12 – 12 – – – – – – – – – – – – – – – – – – 12
4 2 – 2 – – – – – – – – – – – – – – – – – – 2
IL – – – – 3 – 3 – – – – – – – – – – – – – – 3
3 – – – – 3 – 3 – – – – – – – – – – – – – – 3
KS 6 – 6 – 19 18 37 4 – 45 49 2 – 7 9 – 1 1 3 14 17 119
3 3 – 3 – 3 4 7 1 – 19 20 – – – – – 1 1 2 12 14 45
4 3 – 3 – 16 14 30 3 – 26 29 2 – 7 9 – – – 1 2 3 74
MA 21 724 745 – 22,069 15,095 37,164 – 568 73 641 – – – – – – – – – – 38,550
2 18 2 20 – 22,069 2,451 24,520 – 568 64 632 – – – – – – – – – – 25,172
3 3 309 312 – – 9,770 9,770 – – 8 8 – – – – – – – – – – 10,090
4 – 376 376 – – 2,373 2,373 – – – – – – – – – – – – – – 2,749
5 – 36 36 – – 352 352 – – – – – – – – – – – – – – 388
6 – 1 1 – – 149 149 – – – – – – – – – – – – – – 150
7 – – – – – – – – – 1 1 – – – – – – – – – – 1
MD 25 – 25 – – – – 1 2 1 4 – – – – – – – – – – 29
2 – – – – – – – 1 2 1 4 – – – – – – – – – – 4
96

Retail Rate1 and Tur-bine Size2
0.10 0.15 0.20 0.25 0.30 0.40
Grand Total 500 Both4 Total 250 500 Both Total 250 500 Both Total 250 500 Both Total 500 Both Total 250 Both Total
State and
WPC3
3 12 – 12 – – – – – – – – – – – – – – – – – – 12
4 13 – 13 – – – – – – – – – – – – – – – – – – 13
ME 3,195 1,215 4,410 – 4,689 1,021 5,710 – – – – – 35 63 98 4 19 23 – 6 6 10,247
2 3,193 184 3,377 – 4,689 257 4,946 – – – – – 35 7 42 4 1 5 – – – 8,370
3 2 826 828 – – 145 145 – – – – – – 42 42 – 15 15 – – – 1,030
4 – 205 205 – – 619 619 – – – – – – 14 14 – 3 3 – 6 6 847
MI 27 – 27 – 2 – 2 – – – – – – – – – – – – – – 29
2 – – – – 2 – 2 – – – – – – – – – – – – – – 2
5 27 – 27 – – – – – – – – – – – – – – – – – – 27
MN 1 1 2 – 1 6 7 – – – – – – – – – – – – – – 9
2 – – – – 1 – 1 – – – – – – – – – – – – – – 1
3 – – – – – 2 2 – – – – – – – – – – – – – – 2
4 1 1 2 – – 4 4 – – – – – – – – – – – – – – 6
NC 1,976 185 2,161 – 62 1 63 – – – – – – – – – – – – – – 2,224
3 1,976 – 1,976 – 62 1 63 – – – – – – – – – – – – – – 2,039
4 – 148 148 – – – – – – – – – – – – – – – – – – 148
5 – 29 29 – – – – – – – – – – – – – – – – – – 29
6 – 7 7 – – – – – – – – – – – – – – – – – – 7
7 – 1 1 – – – – – – – – – – – – – – – – – – 1
NE – – – – – 3 3 – – – – – – – – – – – – – – 3
4 – – – – – 3 3 – – – – – – – – – – – – – – 3
NH 467 132 599 – 2,084 512 2,596 – – – – – – – – – – – – – – 3,195
2 467 20 487 – 2,084 348 2,432 – – – – – – – – – – – – – – 2,919
3 – 66 66 – – 109 109 – – – – – – – – – – – – – – 175
4 – 21 21 – – 22 22 – – – – – – – – – – – – – – 43
5 – 13 13 – – 10 10 – – – – – – – – – – – – – – 23
6 – 9 9 – – 9 9 – – – – – – – – – – – – – – 18
7 – 3 3 – – 14 14 – – – – – – – – – – – – – – 17
NJ – – – – 64 964 1,028 – – – – – – – – – – – – – – 1,028
2 – – – – 64 – 64 – – – – – – – – – – – – – – 64
3 – – – – – 881 881 – – – – – – – – – – – – – – 881
4 – – – – – 83 83 – – – – – – – – – – – – – – 83
NM 18 2 20 – 67 11 78 – – – – – – – – – – – – – – 98
3 – – – – 2 1 3 – – – – – – – – – – – – – – 3
4 17 – 17 – 65 – 65 – – – – – – – – – – – – – – 82
5 1 1 2 – – 10 10 – – – – – – – – – – – – – – 12
6 – 1 1 – – – – – – – – – – – – – – – – – – 1
NV 4 – 4 – – – – – – – – – – – – – – – – – – 4
4 4 – 4 – – – – – – – – – – – – – – – – – – 4
NY 5,017 1,186 6,203 – 32,098 20,083 52,181 – 31,639 22,391 54,030 – – – – – – – – – – 112,414
2 – – – – 735 – 735 – 738 5,684 6,422 – – – – – – – – – – 7,157
3 4,848 93 4,941 – 31,363 2,538 33,901 – 30,901 5,609 36,510 – – – – – – – – – – 75,352
4 169 1,023 1,192 – – 11,329 11,329 – – 11,098 11,098 – – – – – – – – – – 23,619
97

Retail Rate1 and Tur-bine Size2
0.10 0.15 0.20 0.25 0.30 0.40
Grand Total 500 Both4 Total 250 500 Both Total 250 500 Both Total 250 500 Both Total 500 Both Total 250 Both Total
State and
WPC3
5 – 70 70 – – 6,215 6,215 – – – – – – – – – – – – – – 6,285
6 – – – – – 1 1 – – – – – – – – – – – – – – 1
OH – – – – 1 1 2 – – – – – – – – – – – – – – 2
2 – – – – – 1 1 – – – – – – – – – – – – – – 1
4 – – – – 1 – 1 – – – – – – – – – – – – – – 1
OK 9 – 9 2 2 4 8 2 – 8 10 – – – – – – – – – – 27
3 1 – 1 2 1 4 7 2 – 8 10 – – – – – – – – – – 18
4 8 – 8 – 1 – 1 – – – – – – – – – – – – – – 9
OR 336 100 436 – – – – – – – – – – – – – – – – – – 436
2 3 – 3 – – – – – – – – – – – – – – – – – – 3
3 33 21 54 – – – – – – – – – – – – – – – – – – 54
4 300 12 312 – – – – – – – – – – – – – – – – – – 312
5 – 67 67 – – – – – – – – – – – – – – – – – – 67
PA 15 3 18 – – – – – – – – – – – – – – – – – – 18
4 15 – 15 – – – – – – – – – – – – – – – – – – 15
5 – 3 3 – – – – – – – – – – – – – – – – – – 3
RI 1 – 1 – 6,078 933 7,011 – – – – – – – – – – – – 133 133 7,145
2 1 – 1 – 6,078 759 6,837 – – – – – – – – – – – – – – 6,838
3 – – – – – 169 169 – – – – – – – – – – – – – – 169
4 – – – – – 3 3 – – – – – – – – – – – – 123 123 126
5 – – – – – 2 2 – – – – – – – – – – – – 10 10 12
SD – – – – – 1 1 – – – – – – – – – – – – – – 1
3 – – – – – 1 1 – – – – – – – – – – – – – – 1
TN 1,232 – 1,232 – – – – – – – – – – – – – – – – – – 1,232
6 1,232 – 1,232 – – – – – – – – – – – – – – – – – – 1,232
TX 8,576 29 8,605 – 824 43 867 – 8 4 12 – – – – – – – – – – 9,484
2 – – – – 2 – 2 – – – – – – – – – – – – – – 2
3 2 – 2 – 34 35 69 – – – – – – – – – – – – – – 71
4 7,977 5 7,982 – 786 8 794 – 3 – 3 – – – – – – – – – – 8,779
5 597 24 621 – 2 – 2 – 5 2 7 – – – – – – – – – – 630
6 – – – – – – – – – 2 2 – – – – – – – – – – 2
VA 7 – 7 – 1 – 1 – – – – – – – – – – – – – – 8
6 7 – 7 – 1 – 1 – – – – – – – – – – – – – – 8
VT 738 203 941 – 2,053 1,073 3,126 – 45 270 315 – – – – – – – – – – 4,382
2 735 35 770 – 2,053 128 2,181 – 45 3 48 – – – – – – – – – – 2,999
3 3 106 109 – – 381 381 – – 69 69 – – – – – – – – – – 559
4 – 18 18 – – 287 287 – – 63 63 – – – – – – – – – – 368
5 – 25 25 – – 155 155 – – 17 17 – – – – – – – – – – 197
6 – 13 13 – – 100 100 – – 85 85 – – – – – – – – – – 198
7 – 6 6 – – 22 22 – – 33 33 – – – – – – – – – – 61
WI – – – – – 4 4 – – – – – – – – – 4 4 – – – 8
2 – – – – – – – – – – – – – – – – 4 4 – – – 4
3 – – – – – 4 4 – – – – – – – – – – – – – – 4
98

99
Retail Rate1 and Tur-bine Size2
0.10 0.15 0.20 0.25 0.30 0.40
Grand Total 500 Both4 Total 250 500 Both Total 250 500 Both Total 250 500 Both Total 500 Both Total 250 Both Total
State and
WPC3
WV – 1 1 – – – – – – – – – – – – – – – – – – 1
6 – 1 1 – – – – – – – – – – – – – – – – – – 1
WY – 1 1 – – – – – – – – – – – – – – – – – – 1
6 – 1 1 – – – – – – – – – – – – – – – – – – 1
Grand Total 22,475 3,908 26,383 2 80,892 41,953 122,847 7 32,340 22,809 55,156 2 35 70 107 4 24 28 3 153 156 204,677
Table D-4 Notes 1. Retail rate expressed in cents per kilowatt hour (¢/kWh). To condense the presentation, rates are grouped in $0.05
intervals. For example, the column headed by 0.20 represents retail electric rates from $0.16 to $0.20 per kWh. 2. Turbine size expressed in kilowatts (kW). 3. Wind Power Class (WPC). 4. “Both” means a site would be successful using both the 250 kW turbine and the 500 kW turbine. If a site is listed
as “both” within a certain retail rate, it is not also counted in the corresponding 500 kW or 250 kW column. Analysis considered NREL turbine sizes 250 kW and 500 kW.

F1146-E(10/2008)
REPORT DOCUMENTATION PAGE Form Approved OMB No. 0704-0188
The public reporting burden for this collection of information is estimated to average 1 hour per response, including the time for reviewing instructions, searching existing data sources, gathering and maintaining the data needed, and completing and reviewing the collection of information. Send comments regarding this burden estimate or any other aspect of this collection of information, including suggestions for reducing the burden, to Department of Defense, Executive Services and Communications Directorate (0704-0188). Respondents should be aware that notwithstanding any other provision of law, no person shall be subject to any penalty for failing to comply with a collection of information if it does not display a currently valid OMB control number. PLEASE DO NOT RETURN YOUR FORM TO THE ABOVE ORGANIZATION.1. REPORT DATE (DD-MM-YYYY)
December 2008 2. REPORT TYPE
Subcontract Report 3. DATES COVERED (From - To)
12/07 - 10/31/08 4. TITLE AND SUBTITLE
An Analysis of the Technical and Economic Potential for Mid-Scale Distributed Wind
5a. CONTRACT NUMBER DE-AC36-08-GO28308
5b. GRANT NUMBER
5c. PROGRAM ELEMENT NUMBER
6. AUTHOR(S) R. Kwartin, A. Wolfrum, K. Granfield, A. Kagel, A. Appleton
5d. PROJECT NUMBER NREL/SR-500-44280
5e. TASK NUMBER WER9.4510
5f. WORK UNIT NUMBER
7. PERFORMING ORGANIZATION NAME(S) AND ADDRESS(ES)ICF International, 9300 Lee Highway, Fairfax, VA 22031
8. PERFORMING ORGANIZATIONREPORT NUMBER AAM-8-89001-01
9. SPONSORING/MONITORING AGENCY NAME(S) AND ADDRESS(ES)National Renewable Energy Laboratory 1617 Cole Blvd. Golden, CO 80401-3393
10. SPONSOR/MONITOR'S ACRONYM(S)NREL
11. SPONSORING/MONITORINGAGENCY REPORT NUMBER NREL/SR-500-44280
12. DISTRIBUTION AVAILABILITY STATEMENT National Technical Information Service U.S. Department of Commerce 5285 Port Royal Road Springfield, VA 22161
13. SUPPLEMENTARY NOTES NREL Technical Monitor: Trudy Forsyth
14. ABSTRACT (Maximum 200 Words) This report examines the status, restrainers, drivers, and estimated development potential of mid-scale (10 kilowatt to 5000 kilowatt) distributed wind energy projects.
15. SUBJECT TERMS wind turbine; wind energy; distributed wind energy; small wind turbines; economic analysis
16. SECURITY CLASSIFICATION OF: 17. LIMITATION OF ABSTRACT
UL
18. NUMBER OF PAGES
19a. NAME OF RESPONSIBLE PERSON a. REPORT
Unclassified b. ABSTRACT Unclassified
c. THIS PAGE Unclassified 19b. TELEPHONE NUMBER (Include area code)
Standard Form 298 (Rev. 8/98) Prescribed by ANSI Std. Z39.18
Related Documents