Novel methods for the visible spectrophotometric determination of diltiazem HCl and levamisole HCl in pure, tablet dosage forms and biological fluids Full Paper INTRODUCTION Diltiazem hydrochloride (DT-HCl) (Figure 1), [1] chemically, it is (2S,3S)-5-(2-Dimethylaminoethyl)- 2,3,4,5-tetrahydro-2-(4-methoxyphenyl)-4-oxo-1,5- Ali M.Hassan 1 , Ahmed F.El-Asmy 2 , Yasser B.Abd El-Raheem 3 * 1 Inorganic and Analytical Chemistry, Faculty of Science, Al-Azhar University, Cairo, (EGYPT) 2 Inorganic and Analytical Chemistry, Faculty of Science, Al-Mansoura University, (EGYPT) 3 Forensic Science, Medico-Legal Organization, Ministry of Justice, Cairo, (EGYPT) E-mail : [email protected]; [email protected] Received: 12 th May, 2011 ; Accepted: 12 th June, 2011 KEYWORDS Visible spectrophotometry; Diltiazem HCl; Levamisole HCl; Bromocresol purple; Chlorophenol red; Tablets; Biological samples. ABSTRACT Two rapid, simple, precise and sensitive extractive spectrophotometric meth- ods (A and B) have been developed for the determination of diltiazem hy- drochloride (DT-HCl) and levamisole hydrochloride (LM-HCl) in pure, tab- let dosage forms and biological fluids. Both methods (A and B) involves the formation of intense yellow ion-association complex between drug(s) and either of bromocresol purple (BCP) or chlorophenol red (CPR) reagents followed by extraction with methylene chloride. The ion-associates exhibit absorption maxima at 399 and 402 nm for DT-HCl and at 405 and 406 nm for LM-HCl with BCP and CPR, respectively. The calibration curves resulting from the measurements of absorbanceconcentration relations (at the opti- mum reaction conditions) of the extracted ion-association complexes are linear over the concentration range 2.2627.06 and 2.2648.48 g/mL for DT-HCl and 1.2016.86 and 2.4132.51 g/mL for LM-HCl with BCP and CPR, respectively. The molar absorptivities and Sandell s sensitivities of the reaction products were calculated. In methods A and B the slope, inter- cept, correlation coefficient, relative standard deviation (RSD), detection and quantitation limits were also calculated (n=5) for DT-HCl and LM-HCl. No interference was observed from common excipients present in pharma- ceutical formulations. The results are well compared to those obtained by the reference methods using t- and F-tests. Therefore, the present methods are suitable for the drugs determination, as they are sensitive and precise to a high extent. 2011 Trade Science Inc. - INDIA Trade Science Inc. ACAIJ, 10(11) 2011 [740-753] An Indian Journal Volume 10 Issue 11 Analytical CHEMISTRY Analytical CHEMISTRY ISSN : 0974-7419 benzothiazepin-3-yl acetate hydrochloride [2] . Medically, it is a benzothiazepine calcium-channel blocker. It is a peripheral and coronary vasodilator property. DT-HCl inhibits cardiac conduction, particularly at the sino-atrial and atrioventricular nodes [2, 3] . Pharmacokinetics, It is

Welcome message from author
This document is posted to help you gain knowledge. Please leave a comment to let me know what you think about it! Share it to your friends and learn new things together.
Transcript
Novel methods for the visible spectrophotometric determination ofdiltiazem HCl and levamisole HCl in pure, tablet dosage forms and
biological fluids
Full Paper
INTRODUCTION
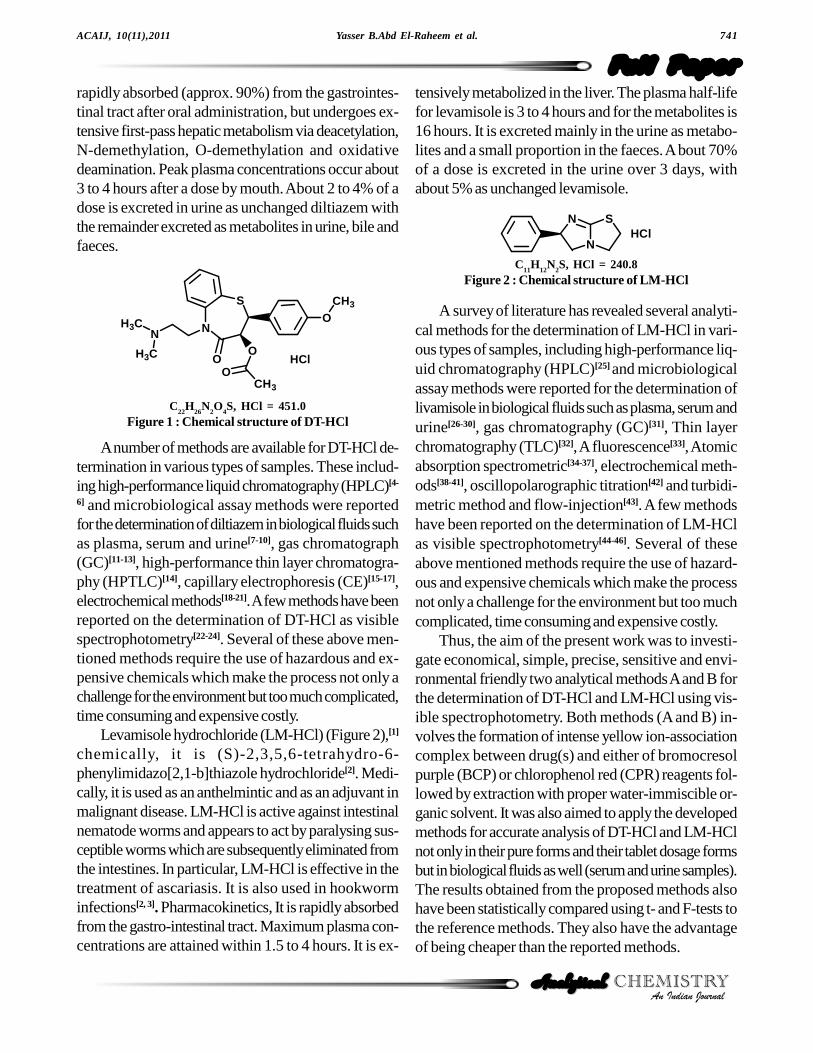
Diltiazem hydrochloride (DT-HCl) (Figure 1),[1]
chemically, it is (2S,3S)-5-(2-Dimethylaminoethyl)-2,3,4,5-tetrahydro-2-(4-methoxyphenyl)-4-oxo-1,5-
Ali M.Hassan1, Ahmed F.El-Asmy2, Yasser B.Abd El-Raheem3*1Inorganic and Analytical Chemistry, Faculty of Science, Al-Azhar University, Cairo, (EGYPT)
2Inorganic and Analytical Chemistry, Faculty of Science, Al-Mansoura University, (EGYPT)3Forensic Science, Medico-Legal Organization, Ministry of Justice, Cairo, (EGYPT)
E-mail : [email protected]; [email protected]: 12th May, 2011 ; Accepted: 12th June, 2011
KEYWORDS
Visible spectrophotometry;Diltiazem HCl;
Levamisole HCl;Bromocresol purple;Chlorophenol red;
Tablets;Biological samples.
ABSTRACT
Two rapid, simple, precise and sensitive extractive spectrophotometric meth-ods (A and B) have been developed for the determination of diltiazem hy-drochloride (DT-HCl) and levamisole hydrochloride (LM-HCl) in pure, tab-let dosage forms and biological fluids. Both methods (A and B) involves theformation of intense yellow ion-association complex between drug(s) andeither of bromocresol purple (BCP) or chlorophenol red (CPR) reagentsfollowed by extraction with methylene chloride. The ion-associates exhibitabsorption maxima at 399 and 402 nm for DT-HCl and at 405 and 406 nm forLM-HCl with BCP and CPR, respectively. The calibration curves resultingfrom the measurements of absorbance�concentration relations (at the opti-
mum reaction conditions) of the extracted ion-association complexes arelinear over the concentration range 2.26�27.06 and 2.26�48.48 ìg/mL for
DT-HCl and 1.20�16.86 and 2.41�32.51 ìg/mL for LM-HCl with BCP and
CPR, respectively. The molar absorptivities and Sandell�s sensitivities of
the reaction products were calculated. In methods A and B the slope, inter-cept, correlation coefficient, relative standard deviation (RSD), detectionand quantitation limits were also calculated (n=5) for DT-HCl and LM-HCl.No interference was observed from common excipients present in pharma-ceutical formulations. The results are well compared to those obtained bythe reference methods using t- and F-tests. Therefore, the present methodsare suitable for the drugs determination, as they are sensitive and precise toa high extent. 2011 Trade Science Inc. - INDIA
Trade Science Inc.
ACAIJ, 10(11) 2011 [740-753]
An Indian Journal
Volume 10 Issue 11
Analytical CHEMISTRYAnalytical CHEMISTRYISSN : 0974-7419
benzothiazepin-3-yl acetate hydrochloride[2]. Medically,it is a benzothiazepine calcium-channel blocker. It is aperipheral and coronary vasodilator property. DT-HClinhibits cardiac conduction, particularly at the sino-atrialand atrioventricular nodes[2, 3]. Pharmacokinetics, It is
id3040625 pdfMachine by Broadgun Software - a great PDF writer! - a great PDF creator! - http://www.pdfmachine.com http://www.broadgun.com
Yasser B.Abd El-Raheem et al. 741
Full PaperACAIJ, 10(11),2011
An Indian JournalAnalytical CHEMISTRYAnalytical CHEMISTRY
rapidly absorbed (approx. 90%) from the gastrointes-tinal tract after oral administration, but undergoes ex-tensive first-pass hepatic metabolism via deacetylation,N-demethylation, O-demethylation and oxidativedeamination. Peak plasma concentrations occur about3 to 4 hours after a dose by mouth. About 2 to 4% of adose is excreted in urine as unchanged diltiazem withthe remainder excreted as metabolites in urine, bile andfaeces.
tensively metabolized in the liver. The plasma half-lifefor levamisole is 3 to 4 hours and for the metabolites is16 hours. It is excreted mainly in the urine as metabo-lites and a small proportion in the faeces. A bout 70%of a dose is excreted in the urine over 3 days, withabout 5% as unchanged levamisole.
C22
H26
N2O
4S, HCl = 451.0
Figure 1 : Chemical structure of DT-HCl
A number of methods are available for DT-HCl de-termination in various types of samples. These includ-ing high-performance liquid chromatography (HPLC)[4-
6] and microbiological assay methods were reportedfor the determination of diltiazem in biological fluids suchas plasma, serum and urine[7-10], gas chromatograph(GC)[11-13], high-performance thin layer chromatogra-phy (HPTLC)[14], capillary electrophoresis (CE)[15-17],electrochemical methods[18-21]. A few methods have beenreported on the determination of DT-HCl as visiblespectrophotometry[22-24]. Several of these above men-tioned methods require the use of hazardous and ex-pensive chemicals which make the process not only achallenge for the environment but too much complicated,time consuming and expensive costly.
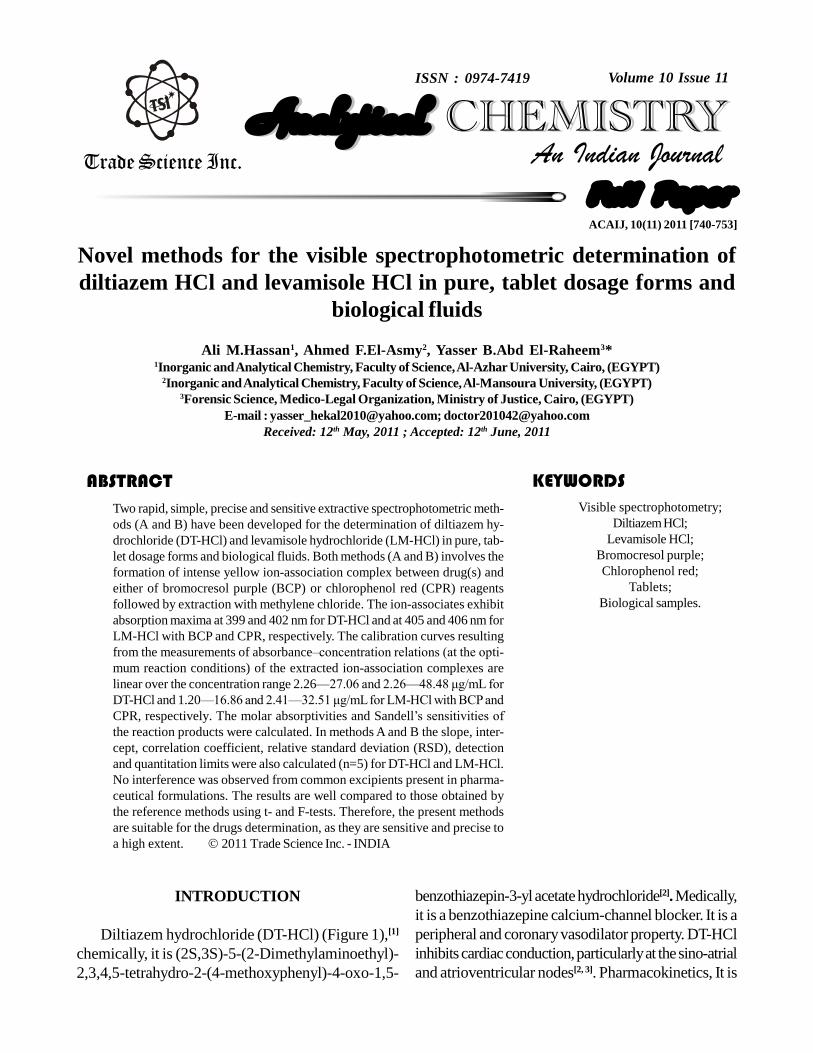
Levamisole hydrochloride (LM-HCl) (Figure 2),[1]
chemically, it is (S)-2,3,5,6-tetrahydro-6-phenylimidazo[2,1-b]thiazole hydrochloride[2]. Medi-cally, it is used as an anthelmintic and as an adjuvant inmalignant disease. LM-HCl is active against intestinalnematode worms and appears to act by paralysing sus-ceptible worms which are subsequently eliminated fromthe intestines. In particular, LM-HCl is effective in thetreatment of ascariasis. It is also used in hookworminfections[2, 3]. Pharmacokinetics, It is rapidly absorbedfrom the gastro-intestinal tract. Maximum plasma con-centrations are attained within 1.5 to 4 hours. It is ex-
A survey of literature has revealed several analyti-cal methods for the determination of LM-HCl in vari-ous types of samples, including high-performance liq-uid chromatography (HPLC)[25] and microbiologicalassay methods were reported for the determination oflivamisole in biological fluids such as plasma, serum andurine[26-30], gas chromatography (GC)[31], Thin layerchromatography (TLC)[32], A fluorescence[33], Atomicabsorption spectrometric[34-37], electrochemical meth-ods[38-41], oscillopolarographic titration[42] and turbidi-metric method and flow-injection[43]. A few methodshave been reported on the determination of LM-HClas visible spectrophotometry[44-46]. Several of theseabove mentioned methods require the use of hazard-ous and expensive chemicals which make the processnot only a challenge for the environment but too muchcomplicated, time consuming and expensive costly.
Thus, the aim of the present work was to investi-gate economical, simple, precise, sensitive and envi-ronmental friendly two analytical methods A and B forthe determination of DT-HCl and LM-HCl using vis-ible spectrophotometry. Both methods (A and B) in-volves the formation of intense yellow ion-associationcomplex between drug(s) and either of bromocresolpurple (BCP) or chlorophenol red (CPR) reagents fol-lowed by extraction with proper water-immiscible or-ganic solvent. It was also aimed to apply the developedmethods for accurate analysis of DT-HCl and LM-HClnot only in their pure forms and their tablet dosage formsbut in biological fluids as well (serum and urine samples).The results obtained from the proposed methods alsohave been statistically compared using t- and F-tests tothe reference methods. They also have the advantageof being cheaper than the reported methods.
C11
H12
N2S, HCl = 240.8
Figure 2 : Chemical structure of LM-HCl
N
N
SHCl
HCl
S
NN
H3C
H3C
OO
OCH3
OCH3
.742 Novel methods for the visible spectrophotometric determination
Full Paper
ACAIJ, 10(11),2011
An Indian JournalAnalytical CHEMISTRYAnalytical CHEMISTRY
EXPERIMENTAL
Materials and Reagents
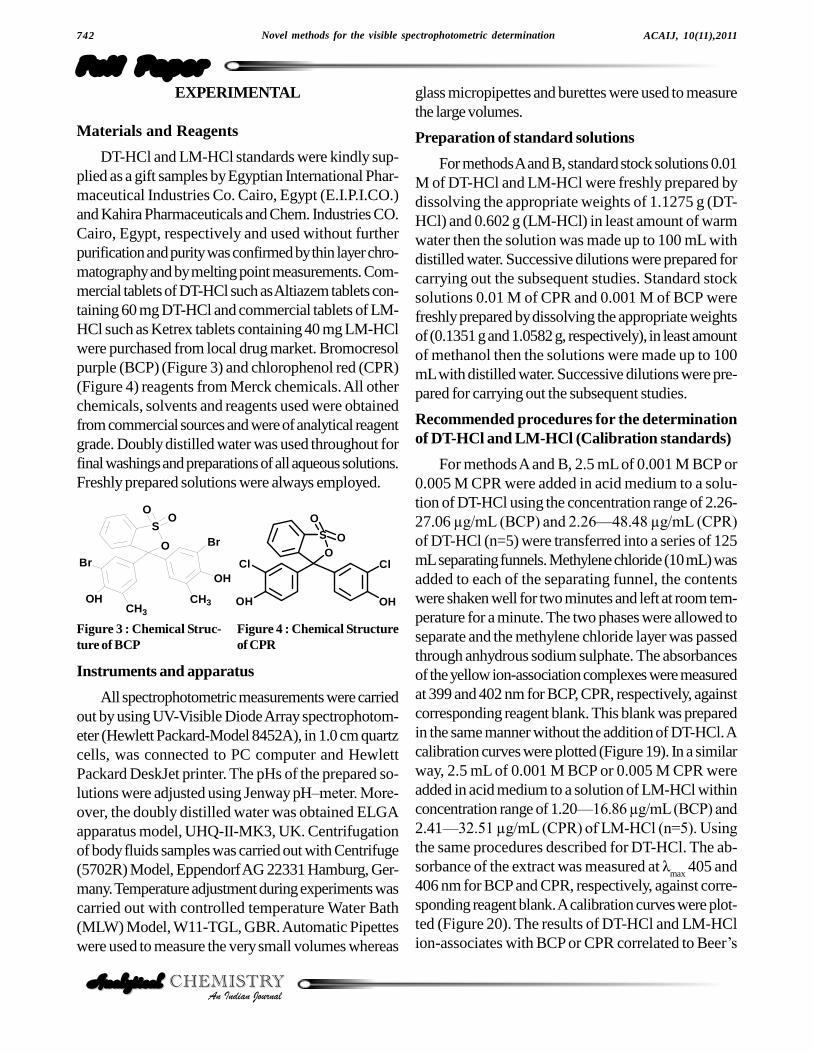
DT-HCl and LM-HCl standards were kindly sup-plied as a gift samples by Egyptian International Phar-maceutical Industries Co. Cairo, Egypt (E.I.P.I.CO.)and Kahira Pharmaceuticals and Chem. Industries CO.Cairo, Egypt, respectively and used without furtherpurification and purity was confirmed by thin layer chro-matography and by melting point measurements. Com-mercial tablets of DT-HCl such as Altiazem tablets con-taining 60 mg DT-HCl and commercial tablets of LM-HCl such as Ketrex tablets containing 40 mg LM-HClwere purchased from local drug market. Bromocresolpurple (BCP) (Figure 3) and chlorophenol red (CPR)(Figure 4) reagents from Merck chemicals. All otherchemicals, solvents and reagents used were obtainedfrom commercial sources and were of analytical reagentgrade. Doubly distilled water was used throughout forfinal washings and preparations of all aqueous solutions.Freshly prepared solutions were always employed.
glass micropipettes and burettes were used to measurethe large volumes.
Preparation of standard solutions
For methods A and B, standard stock solutions 0.01M of DT-HCl and LM-HCl were freshly prepared bydissolving the appropriate weights of 1.1275 g (DT-HCl) and 0.602 g (LM-HCl) in least amount of warmwater then the solution was made up to 100 mL withdistilled water. Successive dilutions were prepared forcarrying out the subsequent studies. Standard stocksolutions 0.01 M of CPR and 0.001 M of BCP werefreshly prepared by dissolving the appropriate weightsof (0.1351 g and 1.0582 g, respectively), in least amountof methanol then the solutions were made up to 100mL with distilled water. Successive dilutions were pre-pared for carrying out the subsequent studies.
Recommended procedures for the determinationof DT-HCl and LM-HCl (Calibration standards)
For methods A and B, 2.5 mL of 0.001 M BCP or0.005 M CPR were added in acid medium to a solu-tion of DT-HCl using the concentration range of 2.26-27.06 µg/mL (BCP) and 2.26�48.48 µg/mL (CPR)
of DT-HCl (n=5) were transferred into a series of 125mL separating funnels. Methylene chloride (10 mL) wasadded to each of the separating funnel, the contentswere shaken well for two minutes and left at room tem-perature for a minute. The two phases were allowed toseparate and the methylene chloride layer was passedthrough anhydrous sodium sulphate. The absorbancesof the yellow ion-association complexes were measuredat 399 and 402 nm for BCP, CPR, respectively, againstcorresponding reagent blank. This blank was preparedin the same manner without the addition of DT-HCl. Acalibration curves were plotted (Figure 19). In a similarway, 2.5 mL of 0.001 M BCP or 0.005 M CPR wereadded in acid medium to a solution of LM-HCl withinconcentration range of 1.20�16.86 µg/mL (BCP) and
2.41�32.51 µg/mL (CPR) of LM-HCl (n=5). Using
the same procedures described for DT-HCl. The ab-sorbance of the extract was measured at ë
max 405 and
406 nm for BCP and CPR, respectively, against corre-sponding reagent blank. A calibration curves were plot-ted (Figure 20). The results of DT-HCl and LM-HClion-associates with BCP or CPR correlated to Beer�s
Br
OHBr
OH
S
O
OO
CH3CH3
Cl
OH
O
SO
O
Cl
OH
Figure 3 : Chemical Struc-ture of BCP
Figure 4 : Chemical Structureof CPR
Instruments and apparatus
All spectrophotometric measurements were carriedout by using UV-Visible Diode Array spectrophotom-eter (Hewlett Packard-Model 8452A), in 1.0 cm quartzcells, was connected to PC computer and HewlettPackard DeskJet printer. The pHs of the prepared so-lutions were adjusted using Jenway pH�meter. More-
over, the doubly distilled water was obtained ELGAapparatus model, UHQ-II-MK3, UK. Centrifugationof body fluids samples was carried out with Centrifuge(5702R) Model, Eppendorf AG 22331 Hamburg, Ger-many. Temperature adjustment during experiments wascarried out with controlled temperature Water Bath(MLW) Model, W11-TGL, GBR. Automatic Pipetteswere used to measure the very small volumes whereas
Yasser B.Abd El-Raheem et al. 743
Full PaperACAIJ, 10(11),2011
An Indian JournalAnalytical CHEMISTRYAnalytical CHEMISTRY
law are presented in TABLE 2.
Sample analysis
Determination of DT-HCl and LM-HCl in tablets
For methods A and B, ten tablets of altiazem andkatrex were accurately weighed separately and finelypowdered and mixed. A portion of the powder equiva-lent to the average weight of one tablet was transferredinto a 100 mL volumetric flask and 30 mL of distilledwater was added. The content of the flask was soni-cated for 15 min. and filtered through whatman No.41filter paper to separate out the insoluble excipients. Theresidues were washed thoroughly with distilled water.Then take aliquot of the filtrate made up to 100 mLvolume with distilled water in volumetric flask. Appro-priate solutions were prepared by taking suitable aliquotsof the clear supernatant and diluting them with distilledwater to give final concentrations. Then the absorbanceof these solutions was measured against reagent blankat ë
max. The amount of DT-HCl or LM-HCl per tablet
was calculated using the calibration curve method. Astandard addition method was also used to confirm theaccuracy and recoveries.
Determination of DT-HCl and LM-HCl in serumsamples
In methods A and B, drug-free serum samples wereobtained from Bahteem Hospital from throw four vol-unteers and stored in 4°C. Each individual was in-
structed not to use any medication before one day ofserum withdrawing. Because untreated serum samplescan lead to turbid solutions when these are added anamount of DT-HCl or LM-HCl stock solution, adeproteinization process with appropriate amount oftrichloroacetic acid was employed. The precipitatedproteins were separated by centrifugation for 10 min at4000 rpm. The clear supernatant layer was transferredinto a 50 mL volumetric flask, and the protein-free se-rum was directly analyzed without any pretreatment.According to the experimental procedures describedearlier (section 2.4), the samples were processed forvisible spectrophotometric determination of DT-HCl orLM-HCl by standard addition method. The results weresummarized in TABLE 7.
Determination of DT-HCl and LM-HCl in urinesamples
For methods A and B, collection of urine samplesfrom four volunteers was conducted in the same way asdescribed elsewhere[47]. Each individual was instructednot to use any medication before two weeks of urinecollection. The urine samples were then collected in thor-oughly washed and clean plastic bottles in the morningtime from full bladder without any dose of DT-HCl orLM-HCl. It may be necessary to adjust the pH or cen-trifuge the urine for 10 min to remove the suspendedmatter before determination. According to the experi-mental procedures described earlier (section 2.4), thesamples were processed for visible spectrophotometricdetermination of DT-HCl or LM-HCl by standard addi-tion method. The results were presented in TABLE 7.
RESULTS AND DISCUSSION
Both methods (A and B) involves the formation ofintense yellow ion-association complex between drug(s)and either of BCP or CPR reagents followed by ex-traction with methylene chloride. Many drugs are easyto be determined by spectrophotometry based oncolour. Optimum reaction conditions for quantitativedetermination ion-association complexes of DT-HCl andLM-HCl with BCP and CPR reagents were establishedvia a number of following preliminary experiments.
Selection of suitable wavelength
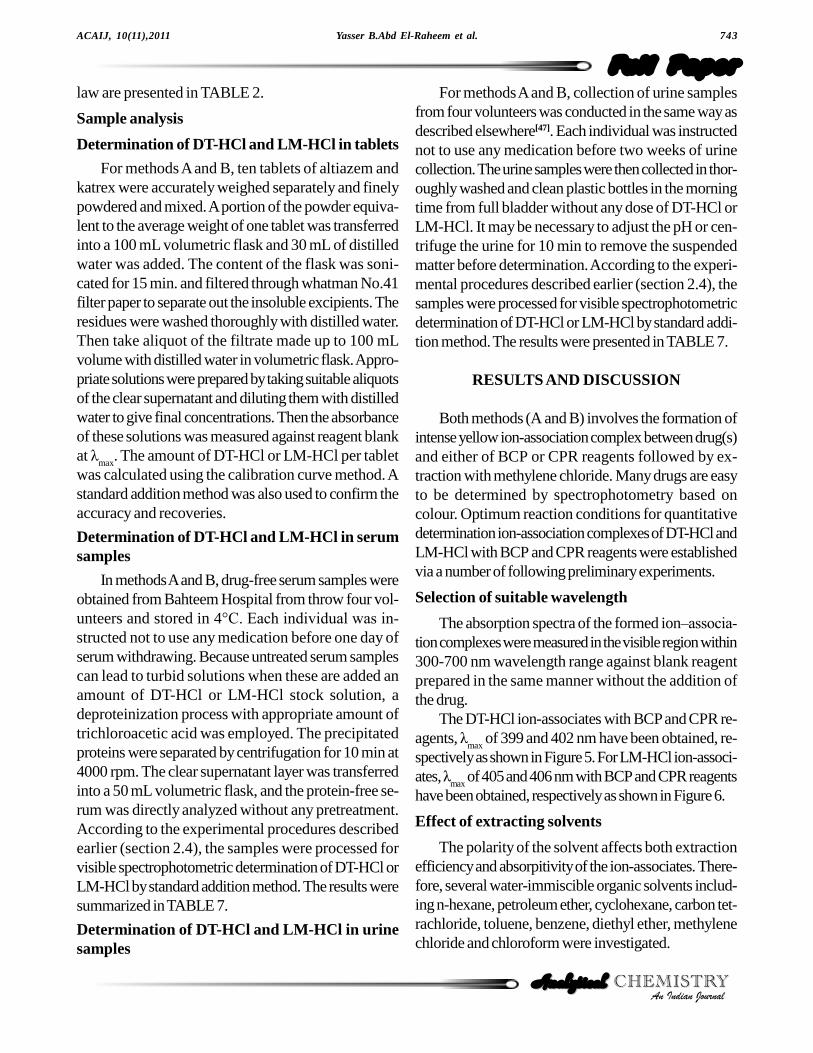
The absorption spectra of the formed ion�associa-
tion complexes were measured in the visible region within300-700 nm wavelength range against blank reagentprepared in the same manner without the addition ofthe drug.
The DT-HCl ion-associates with BCP and CPR re-agents, ë
max of 399 and 402 nm have been obtained, re-
spectively as shown in Figure 5. For LM-HCl ion-associ-ates, ë
max of 405 and 406 nm with BCP and CPR reagents
have been obtained, respectively as shown in Figure 6.
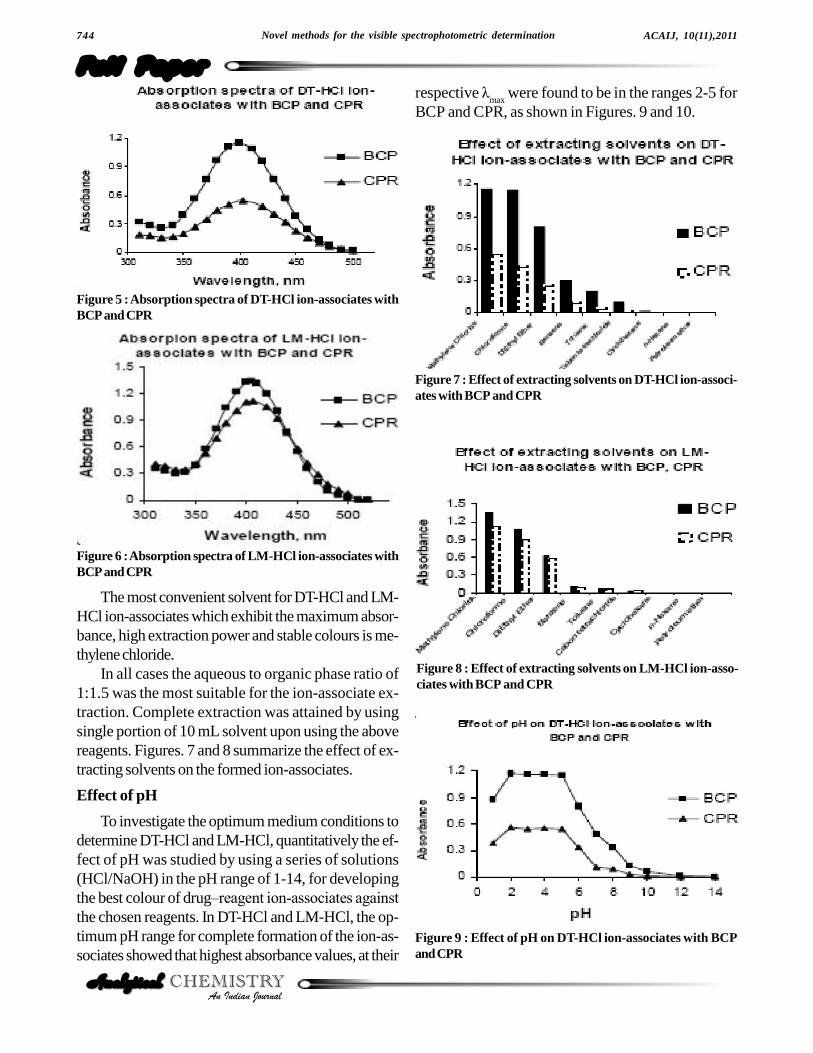
Effect of extracting solvents
The polarity of the solvent affects both extractionefficiency and absorpitivity of the ion-associates. There-fore, several water-immiscible organic solvents includ-ing n-hexane, petroleum ether, cyclohexane, carbon tet-rachloride, toluene, benzene, diethyl ether, methylenechloride and chloroform were investigated.
.744 Novel methods for the visible spectrophotometric determination
Full Paper
ACAIJ, 10(11),2011
An Indian JournalAnalytical CHEMISTRYAnalytical CHEMISTRY
The most convenient solvent for DT-HCl and LM-HCl ion-associates which exhibit the maximum absor-bance, high extraction power and stable colours is me-thylene chloride.
In all cases the aqueous to organic phase ratio of1:1.5 was the most suitable for the ion-associate ex-traction. Complete extraction was attained by usingsingle portion of 10 mL solvent upon using the abovereagents. Figures. 7 and 8 summarize the effect of ex-tracting solvents on the formed ion-associates.
Effect of pH
To investigate the optimum medium conditions todetermine DT-HCl and LM-HCl, quantitatively the ef-fect of pH was studied by using a series of solutions(HCl/NaOH) in the pH range of 1-14, for developingthe best colour of drug�reagent ion-associates against
the chosen reagents. In DT-HCl and LM-HCl, the op-timum pH range for complete formation of the ion-as-sociates showed that highest absorbance values, at their
respective ëmax
were found to be in the ranges 2-5 forBCP and CPR, as shown in Figures. 9 and 10.
Figure 5 : Absorption spectra of DT-HCl ion-associates withBCP and CPR
Figure 6 : Absorption spectra of LM-HCl ion-associates withBCP and CPR
Figure 7 : Effect of extracting solvents on DT-HCl ion-associ-ates with BCP and CPR
Figure 8 : Effect of extracting solvents on LM-HCl ion-asso-ciates with BCP and CPR
Figure 9 : Effect of pH on DT-HCl ion-associates with BCPand CPR
Yasser B.Abd El-Raheem et al. 745
Full PaperACAIJ, 10(11),2011
An Indian JournalAnalytical CHEMISTRYAnalytical CHEMISTRY
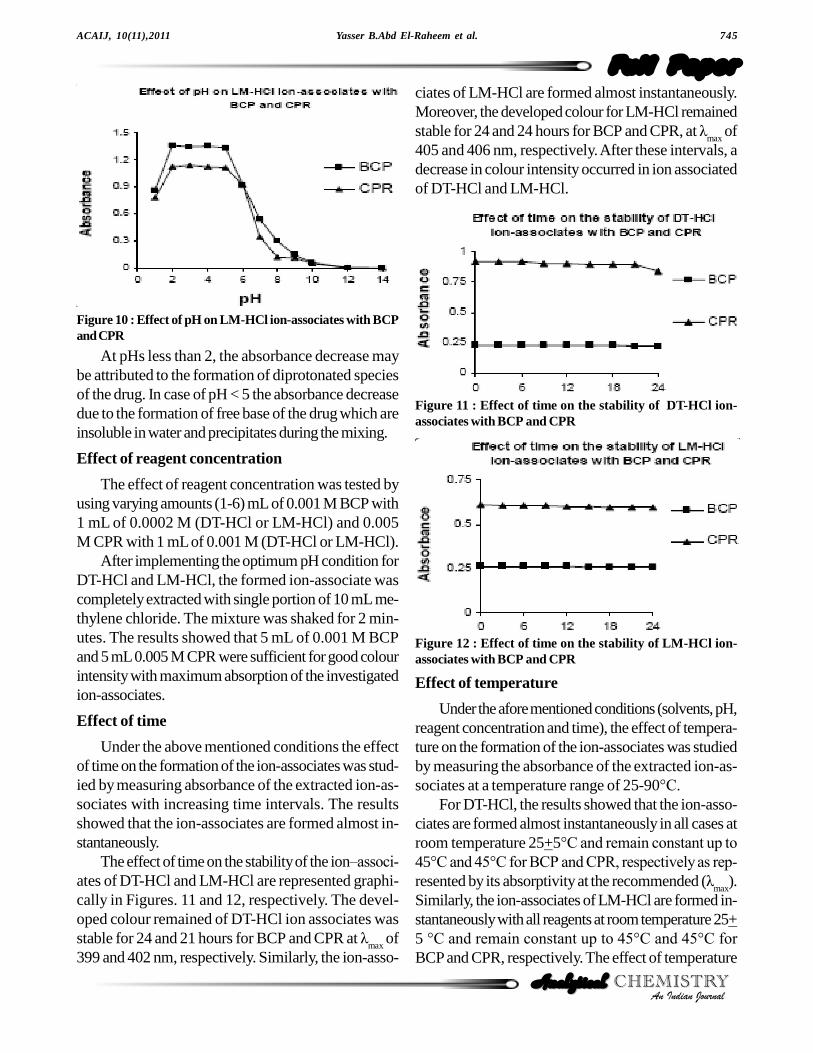
At pHs less than 2, the absorbance decrease maybe attributed to the formation of diprotonated speciesof the drug. In case of pH < 5 the absorbance decreasedue to the formation of free base of the drug which areinsoluble in water and precipitates during the mixing.
Effect of reagent concentration
The effect of reagent concentration was tested byusing varying amounts (1-6) mL of 0.001 M BCP with1 mL of 0.0002 M (DT-HCl or LM-HCl) and 0.005M CPR with 1 mL of 0.001 M (DT-HCl or LM-HCl).
After implementing the optimum pH condition forDT-HCl and LM-HCl, the formed ion-associate wascompletely extracted with single portion of 10 mL me-thylene chloride. The mixture was shaked for 2 min-utes. The results showed that 5 mL of 0.001 M BCPand 5 mL 0.005 M CPR were sufficient for good colourintensity with maximum absorption of the investigatedion-associates.
Effect of time
Under the above mentioned conditions the effectof time on the formation of the ion-associates was stud-ied by measuring absorbance of the extracted ion-as-sociates with increasing time intervals. The resultsshowed that the ion-associates are formed almost in-stantaneously.
The effect of time on the stability of the ion�associ-
ates of DT-HCl and LM-HCl are represented graphi-cally in Figures. 11 and 12, respectively. The devel-oped colour remained of DT-HCl ion associates wasstable for 24 and 21 hours for BCP and CPR at ë
max of
399 and 402 nm, respectively. Similarly, the ion-asso-
ciates of LM-HCl are formed almost instantaneously.Moreover, the developed colour for LM-HCl remainedstable for 24 and 24 hours for BCP and CPR, at ë
max of
405 and 406 nm, respectively. After these intervals, adecrease in colour intensity occurred in ion associatedof DT-HCl and LM-HCl.
Figure 10 : Effect of pH on LM-HCl ion-associates with BCPand CPR
Figure 11 : Effect of time on the stability of DT-HCl ion-associates with BCP and CPR
Figure 12 : Effect of time on the stability of LM-HCl ion-associates with BCP and CPR
Effect of temperature
Under the afore mentioned conditions (solvents, pH,reagent concentration and time), the effect of tempera-ture on the formation of the ion-associates was studiedby measuring the absorbance of the extracted ion-as-sociates at a temperature range of 25-90°C.
For DT-HCl, the results showed that the ion-asso-ciates are formed almost instantaneously in all cases atroom temperature 25+5°C and remain constant up to
45°C and 45°C for BCP and CPR, respectively as rep-
resented by its absorptivity at the recommended (ëmax
).Similarly, the ion-associates of LM-HCl are formed in-stantaneously with all reagents at room temperature 25+5 °C and remain constant up to 45°C and 45°C for
BCP and CPR, respectively. The effect of temperature
.746 Novel methods for the visible spectrophotometric determination
Full Paper
ACAIJ, 10(11),2011
An Indian JournalAnalytical CHEMISTRYAnalytical CHEMISTRY
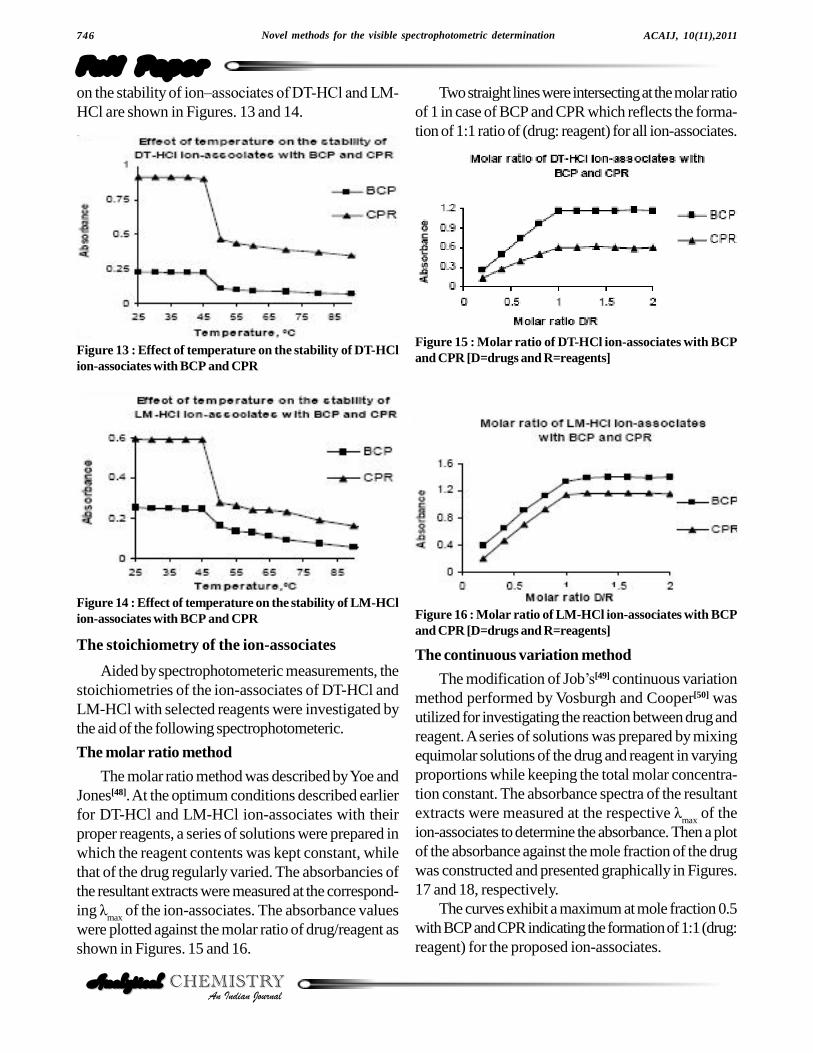
on the stability of ion�associates of DT-HCl and LM-
HCl are shown in Figures. 13 and 14.Two straight lines were intersecting at the molar ratio
of 1 in case of BCP and CPR which reflects the forma-tion of 1:1 ratio of (drug: reagent) for all ion-associates.
Figure 13 : Effect of temperature on the stability of DT-HClion-associates with BCP and CPR
Figure 14 : Effect of temperature on the stability of LM-HClion-associates with BCP and CPR
The stoichiometry of the ion-associates
Aided by spectrophotometeric measurements, thestoichiometries of the ion-associates of DT-HCl andLM-HCl with selected reagents were investigated bythe aid of the following spectrophotometeric.
The molar ratio method
The molar ratio method was described by Yoe andJones[48]. At the optimum conditions described earlierfor DT-HCl and LM-HCl ion-associates with theirproper reagents, a series of solutions were prepared inwhich the reagent contents was kept constant, whilethat of the drug regularly varied. The absorbancies ofthe resultant extracts were measured at the correspond-ing ë
max of the ion-associates. The absorbance values
were plotted against the molar ratio of drug/reagent asshown in Figures. 15 and 16.
Figure 15 : Molar ratio of DT-HCl ion-associates with BCPand CPR [D=drugs and R=reagents]
Figure 16 : Molar ratio of LM-HCl ion-associates with BCPand CPR [D=drugs and R=reagents]
The continuous variation method
The modification of Job�s[49] continuous variationmethod performed by Vosburgh and Cooper[50] wasutilized for investigating the reaction between drug andreagent. A series of solutions was prepared by mixingequimolar solutions of the drug and reagent in varyingproportions while keeping the total molar concentra-tion constant. The absorbance spectra of the resultantextracts were measured at the respective ë
max of the
ion-associates to determine the absorbance. Then a plotof the absorbance against the mole fraction of the drugwas constructed and presented graphically in Figures.17 and 18, respectively.
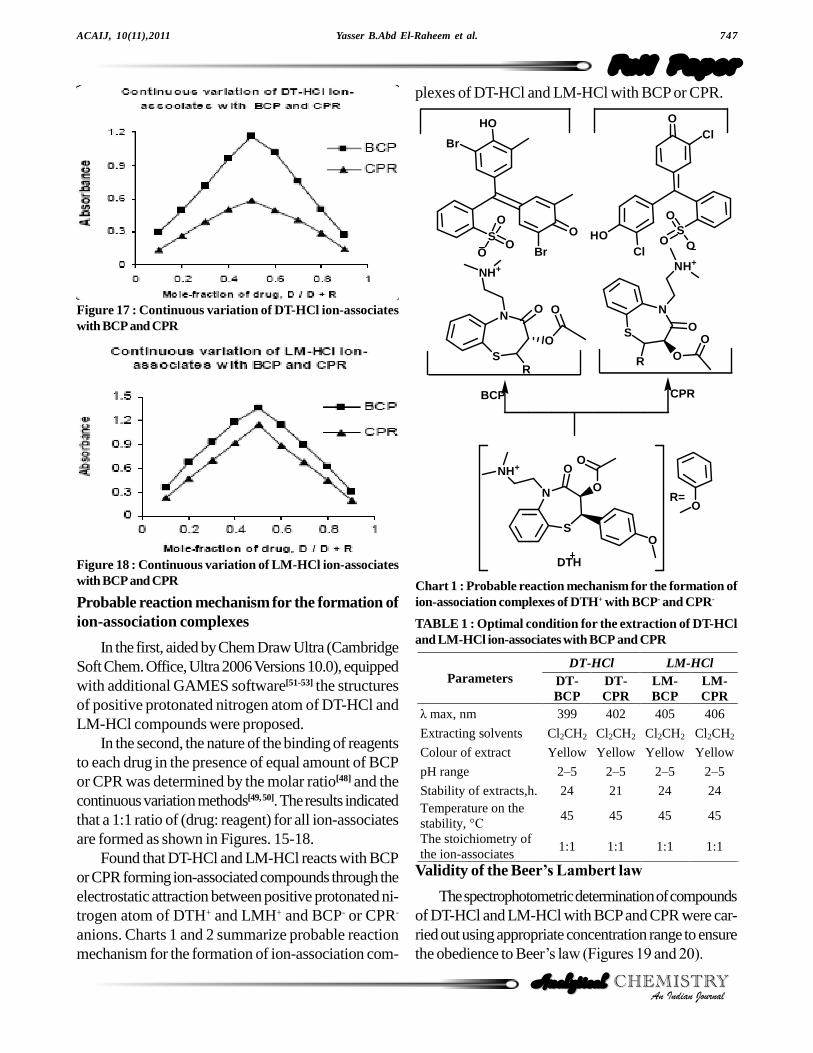
The curves exhibit a maximum at mole fraction 0.5with BCP and CPR indicating the formation of 1:1 (drug:reagent) for the proposed ion-associates.
Yasser B.Abd El-Raheem et al. 747
Full PaperACAIJ, 10(11),2011
An Indian JournalAnalytical CHEMISTRYAnalytical CHEMISTRY
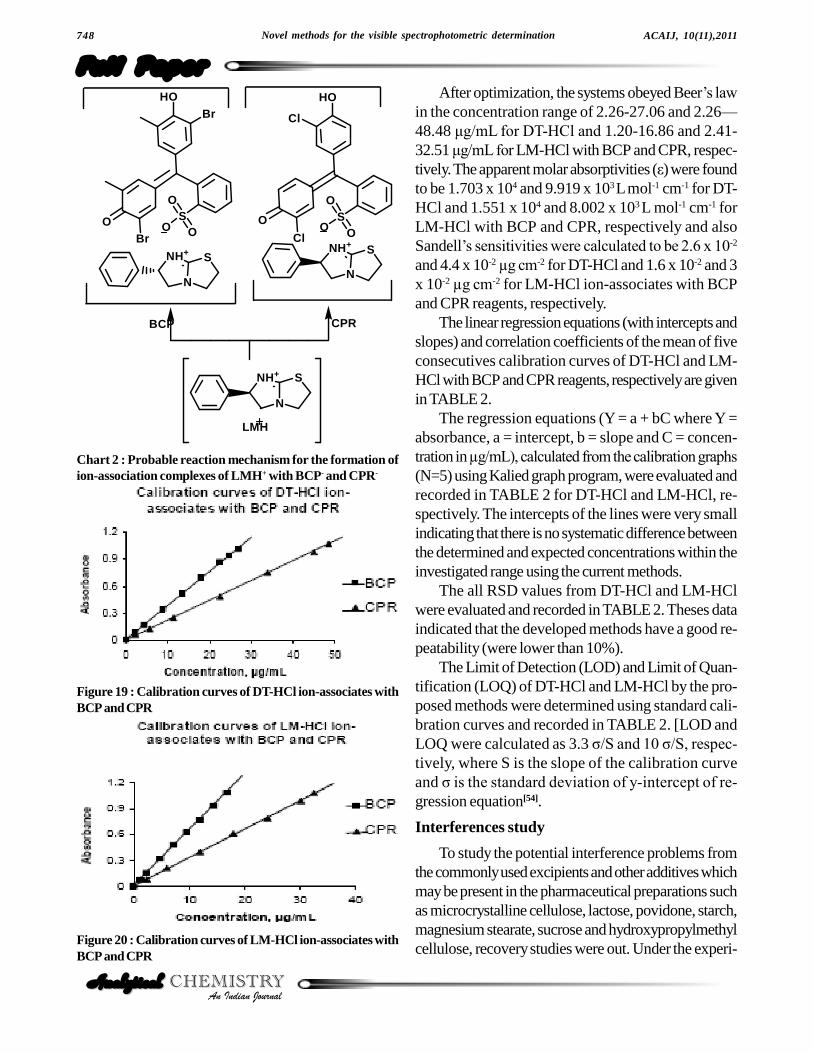
Probable reaction mechanism for the formation ofion-association complexes
In the first, aided by Chem Draw Ultra (CambridgeSoft Chem. Office, Ultra 2006 Versions 10.0), equippedwith additional GAMES software[51-53] the structuresof positive protonated nitrogen atom of DT-HCl andLM-HCl compounds were proposed.
In the second, the nature of the binding of reagentsto each drug in the presence of equal amount of BCPor CPR was determined by the molar ratio[48] and thecontinuous variation methods[49, 50]. The results indicatedthat a 1:1 ratio of (drug: reagent) for all ion-associatesare formed as shown in Figures. 15-18.
Found that DT-HCl and LM-HCl reacts with BCPor CPR forming ion-associated compounds through theelectrostatic attraction between positive protonated ni-trogen atom of DTH+ and LMH+ and BCP- or CPR-
anions. Charts 1 and 2 summarize probable reactionmechanism for the formation of ion-association com-
plexes of DT-HCl and LM-HCl with BCP or CPR.
Figure 17 : Continuous variation of DT-HCl ion-associateswith BCP and CPR
Figure 18 : Continuous variation of LM-HCl ion-associateswith BCP and CPR
S
N
NH+
O
R
O
O
Br
HO
SO
O
O
O
Br
S
N
NH+ O
O
O
O
OR=
DTH
S
N
NH+
O
R OO
ClHO S
O
O O
ClO
BCP CPR
Chart 1 : Probable reaction mechanism for the formation ofion-association complexes of DTH+ with BCP- and CPR-
TABLE 1 : Optimal condition for the extraction of DT-HCland LM-HCl ion-associates with BCP and CPR
LM-HCl DT-HCl LM-CPR
LM-BCP
DT-CPR
DT-BCP
Parameters
406 405 402 399 ë max, nm
Cl2CH2 Cl2CH2Cl2CH2 Cl2CH2Extracting solvents
Yellow Yellow Yellow Yellow Colour of extract
2�5 2�5 2�5 2�5 pH range
24 24 21 24 Stability of extracts,h.
45 45 45 45 Temperature on the stability, °C
1:1 1:1 1:1 1:1 The stoichiometry of the ion-associates
Validity of the Beer�s Lambert law
The spectrophotometric determination of compoundsof DT-HCl and LM-HCl with BCP and CPR were car-ried out using appropriate concentration range to ensurethe obedience to Beer�s law (Figures 19 and 20).
.748 Novel methods for the visible spectrophotometric determination
Full Paper
ACAIJ, 10(11),2011
An Indian JournalAnalytical CHEMISTRYAnalytical CHEMISTRY
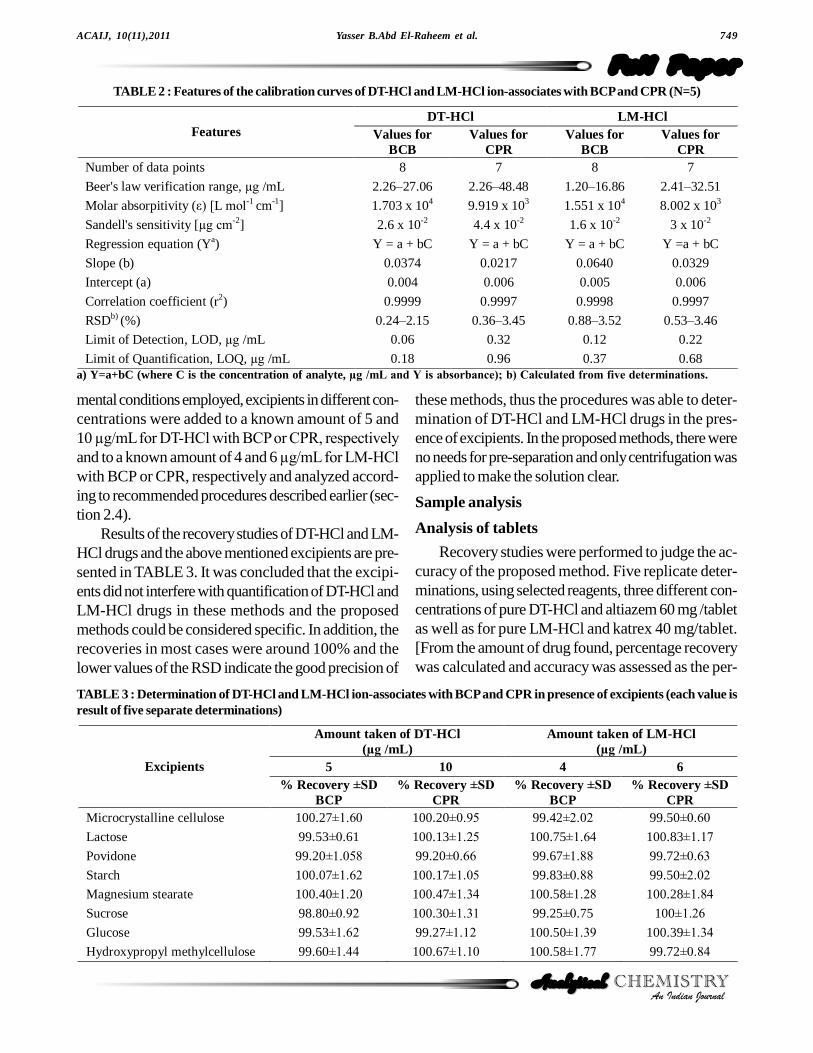
After optimization, the systems obeyed Beer�s law
in the concentration range of 2.26-27.06 and 2.26�48.48 ìg/mL for DT-HCl and 1.20-16.86 and 2.41-32.51 ìg/mL for LM-HCl with BCP and CPR, respec-tively. The apparent molar absorptivities (å) were foundto be 1.703 x 10⁴ and 9.919 x 10³ L mol-1 cm-1 for DT-HCl and 1.551 x 10⁴ and 8.002 x 10³ L mol-1 cm-1 forLM-HCl with BCP and CPR, respectively and alsoSandell�s sensitivities were calculated to be 2.6 x 10⁻²
and 4.4 x 10⁻² µg cm-2 for DT-HCl and 1.6 x 10⁻² and 3x 10⁻² µg cm-2 for LM-HCl ion-associates with BCPand CPR reagents, respectively.
The linear regression equations (with intercepts andslopes) and correlation coefficients of the mean of fiveconsecutives calibration curves of DT-HCl and LM-HCl with BCP and CPR reagents, respectively are givenin TABLE 2.
The regression equations (Y = a + bC where Y =absorbance, a = intercept, b = slope and C = concen-tration in µg/mL), calculated from the calibration graphs
(N=5) using Kalied graph program, were evaluated andrecorded in TABLE 2 for DT-HCl and LM-HCl, re-spectively. The intercepts of the lines were very smallindicating that there is no systematic difference betweenthe determined and expected concentrations within theinvestigated range using the current methods.
The all RSD values from DT-HCl and LM-HClwere evaluated and recorded in TABLE 2. Theses dataindicated that the developed methods have a good re-peatability (were lower than 10%).
The Limit of Detection (LOD) and Limit of Quan-tification (LOQ) of DT-HCl and LM-HCl by the pro-posed methods were determined using standard cali-bration curves and recorded in TABLE 2. [LOD andLOQ were calculated as 3.3 ó/S and 10 ó/S, respec-
tively, where S is the slope of the calibration curveand ó is the standard deviation of y-intercept of re-
gression equation[54].
Interferences study
To study the potential interference problems fromthe commonly used excipients and other additives whichmay be present in the pharmaceutical preparations suchas microcrystalline cellulose, lactose, povidone, starch,magnesium stearate, sucrose and hydroxypropylmethylcellulose, recovery studies were out. Under the experi-
NH+
N
S
BrHO
SO
O OO
Br
CPRBCP
NH+
N
S
LMH
NH+
N
S
Cl
HO
SO O
O
Cl
O
Chart 2 : Probable reaction mechanism for the formation ofion-association complexes of LMH+ with BCP- and CPR-
Figure 19 : Calibration curves of DT-HCl ion-associates withBCP and CPR
Figure 20 : Calibration curves of LM-HCl ion-associates withBCP and CPR
Yasser B.Abd El-Raheem et al. 749
Full PaperACAIJ, 10(11),2011
An Indian JournalAnalytical CHEMISTRYAnalytical CHEMISTRY
mental conditions employed, excipients in different con-centrations were added to a known amount of 5 and10 µg/mL for DT-HCl with BCP or CPR, respectively
and to a known amount of 4 and 6 µg/mL for LM-HCl
with BCP or CPR, respectively and analyzed accord-ing to recommended procedures described earlier (sec-tion 2.4).
Results of the recovery studies of DT-HCl and LM-HCl drugs and the above mentioned excipients are pre-sented in TABLE 3. It was concluded that the excipi-ents did not interfere with quantification of DT-HCl andLM-HCl drugs in these methods and the proposedmethods could be considered specific. In addition, therecoveries in most cases were around 100% and thelower values of the RSD indicate the good precision of
these methods, thus the procedures was able to deter-mination of DT-HCl and LM-HCl drugs in the pres-ence of excipients. In the proposed methods, there wereno needs for pre-separation and only centrifugation wasapplied to make the solution clear.
Sample analysis
Analysis of tablets
Recovery studies were performed to judge the ac-curacy of the proposed method. Five replicate deter-minations, using selected reagents, three different con-centrations of pure DT-HCl and altiazem 60 mg /tabletas well as for pure LM-HCl and katrex 40 mg/tablet.[From the amount of drug found, percentage recoverywas calculated and accuracy was assessed as the per-
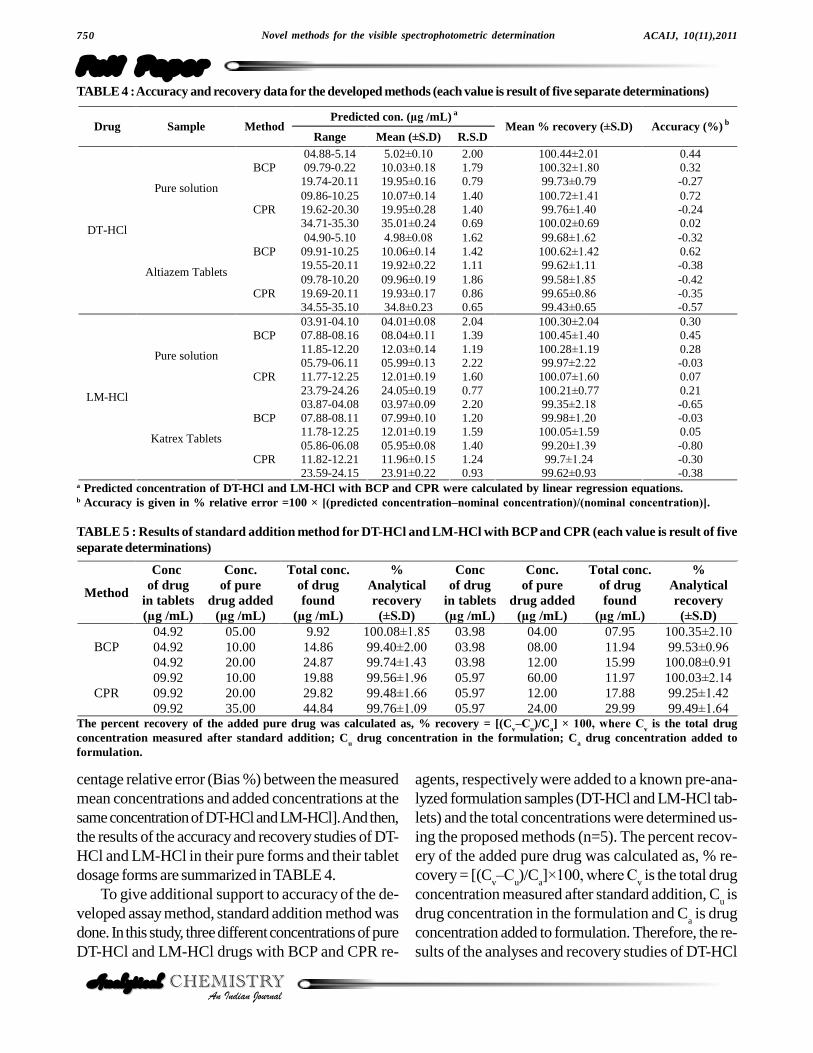
TABLE 2 : Features of the calibration curves of DT-HCl and LM-HCl ion-associates with BCP and CPR (N=5)
LM-HCl DT-HCl Values for
CPR Values for
BCB Values for
CPR Values for
BCB Features
7 8 7 8 Number of data points
2.41�32.51 1.20�16.86 2.26�48.48 2.26�27.06 Beer's law verification range, µg /mL
8.002 x 10³ 1.551 x 10⁴ 9.919 x 10³ 1.703 x 10⁴ Molar absorpitivity (å) [L mol-1 cm-1]
3 x 10⁻² 1.6 x 10⁻² 4.4 x 10⁻² 2.6 x 10⁻² Sandell's sensitivity [µg cm-2]
Y =a + bC Y = a + bC Y = a + bC Y = a + bC Regression equation (Ya)
0.0329 0.0640 0.0217 0.0374 Slope (b)
0.006 0.005 0.006 0.004 Intercept (a)
0.9997 0.9998 0.9997 0.9999 Correlation coefficient (r2)
0.53�3.46 0.88�3.52 0.36�3.45 0.24�2.15 RSDb) (%)
0.22 0.12 0.32 0.06 Limit of Detection, LOD, µg /mL
0.68 0.37 0.96 0.18 Limit of Quantification, LOQ, µg /mL a) Y=a+bC (where C is the concentration of analyte, µg /mL and Y is absorbance); b) Calculated from five determinations.
TABLE 3 : Determination of DT-HCl and LM-HCl ion-associates with BCP and CPR in presence of excipients (each value isresult of five separate determinations)
Amount taken of DT-HCl (µg /mL)
Amount taken of LM-HCl (µg /mL)
5 10 4 6 Excipients % Recovery ±SD
BCP % Recovery ±SD
CPR % Recovery ±SD
BCP % Recovery ±SD
CPR Microcrystalline cellulose 100.27±1.60 100.20±0.95 99.42±2.02 99.50±0.60
Lactose 99.53±0.61 100.13±1.25 100.75±1.64 100.83±1.17
Povidone 99.20±1.058 99.20±0.66 99.67±1.88 99.72±0.63
Starch 100.07±1.62 100.17±1.05 99.83±0.88 99.50±2.02
Magnesium stearate 100.40±1.20 100.47±1.34 100.58±1.28 100.28±1.84
Sucrose 98.80±0.92 100.30±1.31 99.25±0.75 100±1.26
Glucose 99.53±1.62 99.27±1.12 100.50±1.39 100.39±1.34
Hydroxypropyl methylcellulose 99.60±1.44 100.67±1.10 100.58±1.77 99.72±0.84
.750 Novel methods for the visible spectrophotometric determination
Full Paper
ACAIJ, 10(11),2011
An Indian JournalAnalytical CHEMISTRYAnalytical CHEMISTRY
centage relative error (Bias %) between the measuredmean concentrations and added concentrations at thesame concentration of DT-HCl and LM-HCl]. And then,the results of the accuracy and recovery studies of DT-HCl and LM-HCl in their pure forms and their tabletdosage forms are summarized in TABLE 4.
To give additional support to accuracy of the de-veloped assay method, standard addition method wasdone. In this study, three different concentrations of pureDT-HCl and LM-HCl drugs with BCP and CPR re-
agents, respectively were added to a known pre-ana-lyzed formulation samples (DT-HCl and LM-HCl tab-lets) and the total concentrations were determined us-ing the proposed methods (n=5). The percent recov-ery of the added pure drug was calculated as, % re-covery = [(C
v�C
u)/C
a]×100, where C
v is the total drug
concentration measured after standard addition, Cu is
drug concentration in the formulation and Ca is drug
concentration added to formulation. Therefore, the re-sults of the analyses and recovery studies of DT-HCl
TABLE 4 : Accuracy and recovery data for the developed methods (each value is result of five separate determinations)
Predicted con. (µg /mL) a
Accuracy (%) b Mean % recovery (±S.D) R.S.D Mean (±S.D) Range
Method Sample Drug
0.44 0.32 -0.27
100.44±2.01 100.32±1.80 99.73±0.79
2.00 1.79 0.79
5.02±0.10 10.03±0.18 19.95±0.16
04.88-5.14 09.79-0.22
19.74-20.11 BCP
0.72 -0.24 0.02
100.72±1.41 99.76±1.40
100.02±0.69
1.40 1.40 0.69
10.07±0.14 19.95±0.28 35.01±0.24
09.86-10.25 19.62-20.30 34.71-35.30
CPR
Pure solution
-0.32 0.62 -0.38
99.68±1.62 100.62±1.42 99.62±1.11
1.62 1.42 1.11
4.98±0.08 10.06±0.14 19.92±0.22
04.90-5.10 09.91-10.25 19.55-20.11
BCP
-0.42 -0.35 -0.57
99.58±1.85 99.65±0.86 99.43±0.65
1.86 0.86 0.65
09.96±0.19 19.93±0.17 34.8±0.23
09.78-10.20 19.69-20.11 34.55-35.10
CPR
Altiazem Tablets
DT-HCl
0.30 0.45 0.28
100.30±2.04 100.45±1.40 100.28±1.19
2.04 1.39 1.19
04.01±0.08 08.04±0.11 12.03±0.14
03.91-04.10 07.88-08.16 11.85-12.20
BCP
-0.03 0.07 0.21
99.97±2.22 100.07±1.60 100.21±0.77
2.22 1.60 0.77
05.99±0.13 12.01±0.19 24.05±0.19
05.79-06.11 11.77-12.25 23.79-24.26
CPR
Pure solution
-0.65 -0.03 0.05
99.35±2.18 99.98±1.20
100.05±1.59
2.20 1.20 1.59
03.97±0.09 07.99±0.10 12.01±0.19
03.87-04.08 07.88-08.11 11.78-12.25
BCP
-0.80 -0.30 -0.38
99.20±1.39 99.7±1.24
99.62±0.93
1.40 1.24 0.93
05.95±0.08 11.96±0.15 23.91±0.22
05.86-06.08 11.82-12.21 23.59-24.15
CPR
Katrex Tablets
LM-HCl
a Predicted concentration of DT-HCl and LM-HCl with BCP and CPR were calculated by linear regression equations.b Accuracy is given in % relative error =100 × [(predicted concentration�nominal concentration)/(nominal concentration)].
TABLE 5 : Results of standard addition method for DT-HCl and LM-HCl with BCP and CPR (each value is result of fiveseparate determinations)
% Analytical recovery (±S.D)
Total conc. of drug found
(µg /mL)
Conc. of pure
drug added (µg /mL)
Conc of drug
in tablets (µg /mL)
% Analytical recovery (±S.D)
Total conc. of drug found
(µg /mL)
Conc. of pure
drug added (µg /mL)
Conc of drug
in tablets (µg /mL)
Method
100.35±2.10 99.53±0.96
100.08±0.91
07.95 11.94 15.99
04.00 08.00 12.00
03.98 03.98 03.98
100.08±1.85 99.40±2.00 99.74±1.43
9.92 14.86 24.87
05.00 10.00 20.00
04.92 04.92 04.92
BCP
100.03±2.14 99.25±1.42 99.49±1.64
11.97 17.88 29.99
60.00 12.00 24.00
05.97 05.97 05.97
99.56±1.96 99.48±1.66 99.76±1.09
19.88 29.82 44.84
10.00 20.00 35.00
09.92 09.92 09.92
CPR
The percent recovery of the added pure drug was calculated as, % recovery = [(Cv�C
u)/C
a] × 100, where C
v is the total drug
concentration measured after standard addition; Cu drug concentration in the formulation; C
a drug concentration added to
formulation.
Yasser B.Abd El-Raheem et al. 751
Full PaperACAIJ, 10(11),2011
An Indian JournalAnalytical CHEMISTRYAnalytical CHEMISTRY
and LM-HCl with BCP and CPR reagents are summa-rized in TABLE 5.
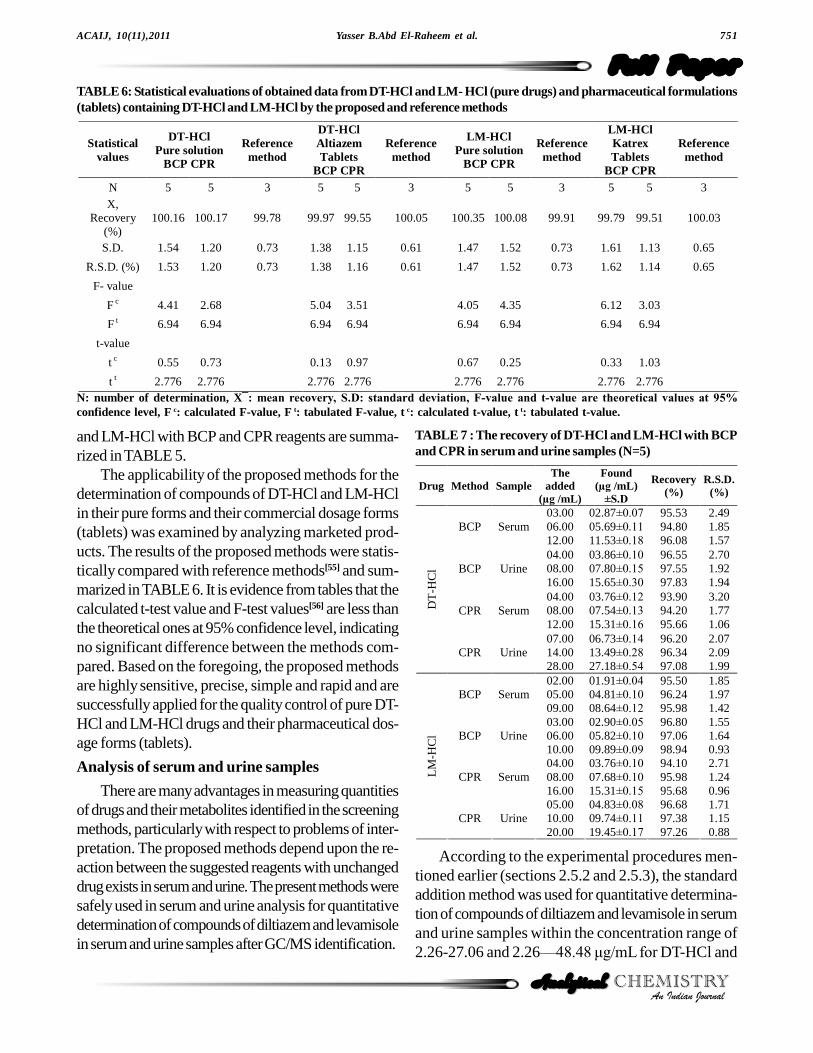
The applicability of the proposed methods for thedetermination of compounds of DT-HCl and LM-HClin their pure forms and their commercial dosage forms(tablets) was examined by analyzing marketed prod-ucts. The results of the proposed methods were statis-tically compared with reference methods[55] and sum-marized in TABLE 6. It is evidence from tables that thecalculated t-test value and F-test values[56] are less thanthe theoretical ones at 95% confidence level, indicatingno significant difference between the methods com-pared. Based on the foregoing, the proposed methodsare highly sensitive, precise, simple and rapid and aresuccessfully applied for the quality control of pure DT-HCl and LM-HCl drugs and their pharmaceutical dos-age forms (tablets).
Analysis of serum and urine samples
There are many advantages in measuring quantitiesof drugs and their metabolites identified in the screeningmethods, particularly with respect to problems of inter-pretation. The proposed methods depend upon the re-action between the suggested reagents with unchangeddrug exists in serum and urine. The present methods weresafely used in serum and urine analysis for quantitativedetermination of compounds of diltiazem and levamisolein serum and urine samples after GC/MS identification.
TABLE 6: Statistical evaluations of obtained data from DT-HCl and LM- HCl (pure drugs) and pharmaceutical formulations(tablets) containing DT-HCl and LM-HCl by the proposed and reference methods
Reference method
LM-HCl Katrex Tablets
BCP CPR
Reference method
LM-HCl Pure solution
BCP CPR
Reference method
DT-HCl Altiazem Tablets
BCP CPR
Reference method
DT-HCl Pure solution
BCP CPR
Statistical values
3 5 5 3 5 5 3 5 5 3 5 5 N
100.03 99.51 99.79 99.91 100.08 100.35 100.05 99.55 99.97 99.78 100.17 100.16 X,
Recovery (%)
0.65 1.13 1.61 0.73 1.52 1.47 0.61 1.15 1.38 0.73 1.20 1.54 S.D.
0.65 1.14 1.62 0.73 1.52 1.47 0.61 1.16 1.38 0.73 1.20 1.53 R.S.D. (%)
F- value
3.03 6.12 4.35 4.05 3.51 5.04 2.68 4.41 F c
6.94 6.94 6.94 6.94 6.94 6.94 6.94 6.94 F t
t-value
1.03 0.33 0.25 0.67 0.97 0.13 0.73 0.55 t c
2.776 2.776 2.776 2.776 2.776 2.776 2.776 2.776 t t N: number of determination, X¯: mean recovery, S.D: standard deviation, F-value and t-value are theoretical values at 95%
confidence level, F c: calculated F-value, F t: tabulated F-value, t c: calculated t-value, t t: tabulated t-value.
TABLE 7 : The recovery of DT-HCl and LM-HCl with BCPand CPR in serum and urine samples (N=5)
Drug Method Sample The
added (µg /mL)
Found (µg /mL)
±S.D
Recovery (%)
R.S.D. (%)
BCP Serum 03.00 06.00 12.00
02.87±0.07 05.69±0.11 11.53±0.18
95.53 94.80 96.08
2.49 1.85 1.57
BCP Urine 04.00 08.00 16.00
03.86±0.10 07.80±0.15 15.65±0.30
96.55 97.55 97.83
2.70 1.92 1.94
CPR Serum 04.00 08.00 12.00
03.76±0.12 07.54±0.13 15.31±0.16
93.90 94.20 95.66
3.20 1.77 1.06
DT
-HC
l
CPR Urine 07.00 14.00 28.00
06.73±0.14 13.49±0.28 27.18±0.54
96.20 96.34 97.08
2.07 2.09 1.99
BCP Serum 02.00 05.00 09.00
01.91±0.04 04.81±0.10 08.64±0.12
95.50 96.24 95.98
1.85 1.97 1.42
BCP Urine 03.00 06.00 10.00
02.90±0.05 05.82±0.10 09.89±0.09
96.80 97.06 98.94
1.55 1.64 0.93
CPR Serum 04.00 08.00 16.00
03.76±0.10 07.68±0.10 15.31±0.15
94.10 95.98 95.68
2.71 1.24 0.96
LM
-HC
l
CPR Urine 05.00 10.00 20.00
04.83±0.08 09.74±0.11 19.45±0.17
96.68 97.38 97.26
1.71 1.15 0.88
According to the experimental procedures men-tioned earlier (sections 2.5.2 and 2.5.3), the standardaddition method was used for quantitative determina-tion of compounds of diltiazem and levamisole in serumand urine samples within the concentration range of2.26-27.06 and 2.26�48.48 ìg/mL for DT-HCl and
.752 Novel methods for the visible spectrophotometric determination
Full Paper
ACAIJ, 10(11),2011
An Indian JournalAnalytical CHEMISTRYAnalytical CHEMISTRY
1.20-16.86 and 2.41-32.51 ìg/mL for LM-HCl withBCP and CPR, respectively.
The results of analysis and recovery studies are givenin TABLE 7, in which recoveries in most cases werearound 100% and the lower values of the RSD indicatethe good precision of the method values.
CONCLUSION
The proposed methods A and B are simple, rapid,precise and sensitive compared to the reported meth-ods. The utility of the proposed methods for the deter-mination of compounds of DT-HCl and LM-HCl in theirpure forms, tablet dosage forms and biological fluids(serum and urine samples) have been well demonstrated.The assay methods did not involve any stringent ex-perimental conditions, and were also free from interfer-ence by common excipients. The mean values obtainedand the calculated standard deviations are comparedwith those obtained by the reference methods, by ap-plying the t- and F-tests. The results presented hereinfor DT-HCl and LM-HCl express excellent agreementand considered significant with those obtained usingreference methods
Hence, the proposed methods could be used forroutine quality control. Thus, it clear that the presentmethods are of high accuracy, precision, speed and se-lectivity, beside being of low cost and easily applied forthe determination of the drugs under investigation in pureform, tablet dosage form and biological fluids dependon simpler spectrophotometric measurements in visibleregion using chemical reagents which are available.
REFERENCES
[1] The Merck Index, an Encyclopedia of Chemicals,Drugs and Biologicals Merck, N.J. Rahway, USA,13th edition (2001).
[2] K.Parfitt; ed. Martindale, �The Extra Pharmaco-
poeia�, the Pharmaceutical Press, London, 36 th
edition (2009).[3] A.C.Moffat; 3th edition �Clarks Isolation and Iden-
tification of Drugs�, Pharmaceutical Press, London
(2004).[4] M.A.Garcia, C.Solans, J.J.Aramayona, L.J.Fraile,
M.A.Bregante, J.R.Castillo, Talanta, 47, 1245-1254(1998).
[5] Y.Shah, S.Khanna, V.S.Dighe, K.C.Jindal, IndianDrugs, 27, 363-364 (1990).
[6] P.M.Lacroix, N.Beaulieu, T.D.Cyr, E.G.Lovering,J.Pharm.Sci., 78, 243-246 (1989).
[7] A.Bakkali, A.Barranco, R.M.A.Salces, E.Corta,L.A.Berrueta, B.Gallo, F.Vicente, J.I.Marquez,Chromatographia, 49, 202-207 (1999).
[8] P.K.Kunicki, D.Sitkiewicz; J.Liq.Chromatogr.Relat.Technol., 19, 1169-1181 (1996).
[9] G.Carignan, K.Carrier, S.Laganiere, M.Lessard,J.Chromatogr; Biomed.Appl., 672, 261-269 (1995).
[10] R.S.Chaudhary, S.S.Gangwal, M.K.Avachat,Y.N.Shah, K.C.Jindal; J.Chromatogr.Biomed.Appl.,125(2 (J. Chromatogr., 614)), 261-266 (1993).
[11] R.T.Sane, S.M.Purandare, V.G.Nayak, M.D.Joshi,V.R.Bhate, V.R.Nerurkar, Indian Drugs, 26, 623-625 (1989).
[12] T.A.Kolbah, F.Plavsic; J.Pharm.Biomed.Anal., 8,915-918 (1990).
[13] J.P.Clozel, G.Caille, Y.Taeymans, P.Theroux, P.Biron,J.G.Besner, J.Pharm.Sci., 73, 207-209 (1984).
[14] P.V.Devarajan, V.V.Dhavse;J.Chromatogr.Biomed.Appl., 706, 362-366 (1998).
[15] Y.Kuwahara, H.Nishi; Yakugaku Zasshi, 118, 456-463 (1998).
[16] C.Coors, H.G.Schulz, F.Stache; J.Chromatogr., 717,235-243 (1995).
[17] H.Soini, M.L.Riekkola, M.V.Novotny; J.Chromatogr.,680, 623-634 (1994).
[18] Z.Z.Leng, X.Y.Hu, X.M.Jiang, R.J.Yu; FenxiHuaxue, 23, 332-335 (1995).
[19] Z.Leng, X.Hu, P.Feng, W.Bai; Fenxi Yiqi, 3, 15-18(1993).
[20] J.Wang, P.A.M.Farias, J.S.Mahmoud; Analyst(London), 111, 837-839 (1986).
[21] L.Cunningham, H.Freiser; Anal.Chim.Acta, 157,157-162 (1984).
[22] N.Rahman, S.N.H.Azmi; J.Microchem., 65, 39-43(2000).
[23] R.Bindu, A.K.Chandrasekharan; Indian Drugs, 31,168-169 (1994).
[24] B.V.Kamath, K.Shivram, A.C.Shah; J.Pharm.Biomed.Anal., 11, 407-409 (1993).
[25] S.S.Zarapkar, U.P.Halkar, S.H.Rane; Indian Drugs,36, 517-520 (1999).
[26] H.El-Kholy, B.W.Kemppainen; J.Chromatogr., 796,371-377 (2003).
[27] M.Cherlet, S.De-Baere, S.Croubels, P.De-Backer; J.Chromatogr.Biomed.Appl., 742, 283-293 (2000).
Yasser B.Abd El-Raheem et al. 753
Full PaperACAIJ, 10(11),2011
An Indian JournalAnalytical CHEMISTRYAnalytical CHEMISTRY
[28] A.Cannavan, W.J.Blanchflower, D.G.Kennedy;Analyst (London), 120, 331-333 (1995).
[29] J.J.Garcia, M.J.Diez, M.Sierra, M.T.Teran; J.Liq.Chromatogr., 13, 743-749 (1990).
[30] E.Kouassi, G.Caille, L.Lery, L.Lariviere, M.Vezina;Biopharm.Drug Dispos., 7, 71-89 (1986).
[31] F.J.Schenck, L.V.Podhorniak, R.Wagner; FoodAddit.Contam., 15, 411-414 (1998).
[32] J.Wang, Q.Pan, X.Su, X.Zhao, Yaowu Fenxi Zazhi,10, 12-15 (1990).
[33] F.C.Gong, D.X.Wu, Z.Cao, X.C.He, BiosensorsBioelectronics, 22, 423-428 (2006).
[34] M.A.El-Ries, S.Khalil, J.Pharm.Biomed.Anal., 25,3-7 (2001).
[35] S.Khalil, N.Borham, J.Pharm.Biomed.Anal., 22,235-240 (2000).
[36] S.Khalil, M.M.El-Rabiehi, J.Pharm.Biomed.Anal.,22, 7-12 (2000).
[37] S.L.Ortiz, J.G.Mateo, J.M.Calatayud, J.Microchem.,48, 112-117 (1993).
[38] S.Sadeghi, F.Fathi, J.Abbasifar; Sensors ActuatorsChem., 22, 158-164 (2007).
[39] S.C.Dhanesar; Am.Lab.(Shelton, Conn.), 30, 48-50 (1998).
[40] Z.Leng, X.Hu; Yaowu Fenxi Zazhi, 10, 212-216(1990).
[41] G.Shen, D.Liao; Yaowu Fenxi Zazhi, 4, 200-204(1984).
[42] X.Li, D.Pan; Yaoxue Tongbao, 23, 737-739 (1988).[43] J.M.Calatayud, C.Falco; Talanta, 33, 685-687
(1986).[44] A.M.El-Didamony; Spectrochimica Acta., 69, 770-
775 (2008).[45] W.Z.Liu, H.Chen; Fenxi Huaxue, 21, 921-923 (1993).[46] L.Liang, Z.Tao; Yaowu Fenxi Zazhi, 12, 238-239
(1992).[47] P.Jelena, K.R.Katarina, D.Zorica, J.Milica,
I.Svetlana; Biophys.Drug Dispos., 24, 309 (2003).[48] J.H.Yoe, A.L.Jones; Ind.Eng.Chem.Anal., Ed., 16,
14 (1944).[49] (a) P.Job; Camp.Rend.(Paris), 180, 928 (1925);
(b)Ann. Chim. (Paris), 9, 133 (1928); (c)Ann.Chim. (Paris), 6, 97 (1936).
[50] W.C.Vosburgh, G.P.Cooper; J.Am.Chem.Soc., 63,437 (1941).
[51] D.M.Schnur, Y.H.Yuh, D.R.Dalton; J. Org. Chem.,54, 3779 (1989).
[52] B.L.Podlogar, D.J.Raber; 54, 5032 (1989).[53] N.L.Allinger; J.Comput.Chem., 14, 755 (1993).[54] Validation of Analytical Procedure Methodology
ICH Harmonized Tripartite Guidelines, 1 (1996).[55] British Pharmacopoeia, HerMajasty�s, Stationary
Office, London (2005).[56] S.Dowdy, S.Weardern;� Statistics for Research�,
N.Y. Wiley (1983).
Related Documents