Note: This copy is for your personal non-commercial use only. To order presentation-ready copies for distribution to your colleagues or clients, contact us at www.rsna.org/rsnarights. GASTROINTESTINAL IMAGING 589 Oncologic Applications of Dual- Energy CT in the Abdomen 1 Dual-energy computed tomographic (DECT) technology offers enhanced capabilities that may benefit oncologic imaging in the ab- domen. By using two different energies, dual-energy CT allows ma- terial decomposition on the basis of energy-dependent attenuation profiles of specific materials. Although image acquisition with dual- energy CT is similar to that with single-energy CT, comprehensive postprocessing is able to generate not only images that are similar to single-energy CT (SECT) images, but a variety of other images, such as virtual unenhanced (VUE), virtual monochromatic (VMC), and material-specific iodine images. An increase in the conspicuity of iodine on low-energy VMC images and material-specific iodine images may aid detection and characterization of tumors. Use of VMC images of a desired energy level (40–140 keV) improves lesion-to-background contrast and the quality of vascular imaging for preoperative planning. Material-specific iodine images enable differentiation of hypoattenuating tumors from hypo- or hyperat- tenuating cysts and facilitate detection of isoattenuating tumors, such as pancreatic masses and peritoneal disease, thereby defining tumor targets for imaging-guided therapy. Moreover, quantitative iodine mapping may serve as a surrogate biomarker for monitoring effects of the treatment. Dual-energy CT is an innovative imaging technique that enhances the capabilities of CT in evaluating oncol- ogy patients. © RSNA, 2014 • radiographics.rsna.org Mukta D. Agrawal, MBBS, MD Daniella F. Pinho, MD Naveen M. Kulkarni, MD Peter F. Hahn, MD, PhD Alexander R. Guimaraes, MD, PhD Dushyant V. Sahani, MD Abbreviations: CNR = contrast-to-noise ra- tio, TUE = true unenhanced, VMC = virtual monochromatic, VUE = virtual unenhanced, Z = atomic number RadioGraphics 2014; 34:589–612 Published online 10.1148/rg.343135041 Content Codes: 1 From the Department of Abdominal and In- terventional Radiology, Massachusetts General Hospital, 55 Fruit St, White Building, Room 270, Boston, MA 02114-2696. Recipient of a Certificate of Merit award for an education exhibit at the 2011 RSNA Annual Meeting. Received April 1, 2013; revision requested May 10 and received June 5; final version accepted July 3. For this journal-based SA-CME activity, the authors A.R.G. and D.V.S. have disclosed financial relationships; the other authors, editor, and reviewers have no relevant relationships to disclose. Address correspondence to D.V.S. (e-mail: [email protected]). Introduction Computed tomography (CT) is integral to oncologic imaging be- cause of its availability, rapid acquisition time, and superior image quality. At conventional single-energy CT, images are acquired with a polychromatic x-ray beam with a peak energy (which is manually selected) of 80–140 kVp. The generated images rely on changes in tissue attenuation or differences in lesion-to-background contrast to enable detection and characterization of abdominal conditions. Often, intravenously administered iodinated contrast material is necessary for a diagnostic oncologic CT examination, and accurate timing of image acquisition to the arrival of contrast material in the area of interest is a prerequisite for tumor imaging and mapping of surrounding vascular structures (1). Therefore, single-energy CT re- quires acquisition of multiphase images for various indications in on- cology patients (1). Moreover, single-energy CT is more susceptible to beam hardening artifacts. After completing this journal-based SA- CME activity, participants will be able to: ■ Discuss the principles of dual-energy CT and the acquisition techniques, post- processing, and interpretation of dual- energy CT images. ■ Describe the use of postprocessed vir- tual monochromatic and material-specif- ic images in depicting and characterizing abdominal lesions. ■ Discuss the role of dual-energy CT in facilitating oncology treatment planning and monitoring response to treatment. See www.rsna.org/education/search/RG. SA-CME LEARNING OBJECTIVES

Welcome message from author
This document is posted to help you gain knowledge. Please leave a comment to let me know what you think about it! Share it to your friends and learn new things together.
Transcript
Note: This copy is for your personal non-commercial use only. To order presentation-ready copies for distribution to your colleagues or clients, contact us at www.rsna.org/rsnarights. G
AST
RO
INT
ESTIN
AL IM
AG
ING
589
Oncologic Applications of Dual-Energy CT in the Abdomen1
Dual-energy computed tomographic (DECT) technology offers enhanced capabilities that may benefit oncologic imaging in the ab-domen. By using two different energies, dual-energy CT allows ma-terial decomposition on the basis of energy-dependent attenuation profiles of specific materials. Although image acquisition with dual-energy CT is similar to that with single-energy CT, comprehensive postprocessing is able to generate not only images that are similar to single-energy CT (SECT) images, but a variety of other images, such as virtual unenhanced (VUE), virtual monochromatic (VMC), and material-specific iodine images. An increase in the conspicuity of iodine on low-energy VMC images and material-specific iodine images may aid detection and characterization of tumors. Use of VMC images of a desired energy level (40–140 keV) improves lesion-to-background contrast and the quality of vascular imaging for preoperative planning. Material-specific iodine images enable differentiation of hypoattenuating tumors from hypo- or hyperat-tenuating cysts and facilitate detection of isoattenuating tumors, such as pancreatic masses and peritoneal disease, thereby defining tumor targets for imaging-guided therapy. Moreover, quantitative iodine mapping may serve as a surrogate biomarker for monitoring effects of the treatment. Dual-energy CT is an innovative imaging technique that enhances the capabilities of CT in evaluating oncol-ogy patients.
©RSNA, 2014 • radiographics.rsna.org
Mukta D. Agrawal, MBBS, MD Daniella F. Pinho, MD Naveen M. Kulkarni, MD Peter F. Hahn, MD, PhD Alexander R. Guimaraes, MD, PhD Dushyant V. Sahani, MD
Abbreviations: CNR = contrast-to-noise ra-tio, TUE = true unenhanced, VMC = virtual monochromatic, VUE = virtual unenhanced, Z = atomic number
RadioGraphics 2014; 34:589–612
Published online 10.1148/rg.343135041
Content Codes: 1From the Department of Abdominal and In-terventional Radiology, Massachusetts General Hospital, 55 Fruit St, White Building, Room 270, Boston, MA 02114-2696. Recipient of a Certificate of Merit award for an education exhibit at the 2011 RSNA Annual Meeting. Received April 1, 2013; revision requested May 10 and received June 5; final version accepted July 3. For this journal-based SA-CME activity, the authors A.R.G. and D.V.S. have disclosed financial relationships; the other authors, editor, and reviewers have no relevant relationships to disclose. Address correspondence to D.V.S. (e-mail: [email protected]).
IntroductionComputed tomography (CT) is integral to oncologic imaging be-cause of its availability, rapid acquisition time, and superior image quality. At conventional single-energy CT, images are acquired with a polychromatic x-ray beam with a peak energy (which is manually selected) of 80–140 kVp. The generated images rely on changes in tissue attenuation or differences in lesion-to-background contrast to enable detection and characterization of abdominal conditions. Often, intravenously administered iodinated contrast material is necessary for a diagnostic oncologic CT examination, and accurate timing of image acquisition to the arrival of contrast material in the area of interest is a prerequisite for tumor imaging and mapping of surrounding vascular structures (1). Therefore, single-energy CT re-quires acquisition of multiphase images for various indications in on-cology patients (1). Moreover, single-energy CT is more susceptible to beam hardening artifacts.
After completing this journal-based SA-CME activity, participants will be able to: ■ Discuss the principles of dual-energy
CT and the acquisition techniques, post-processing, and interpretation of dual-energy CT images.
■ Describe the use of postprocessed vir-tual monochromatic and material-specif-ic images in depicting and characterizing abdominal lesions.
■ Discuss the role of dual-energy CT in facilitating oncology treatment planning and monitoring response to treatment.
See www.rsna.org/education/search/RG.
SA-CME LEARNING OBJECTIVES
590 May-June 2014 radiographics.rsna.org
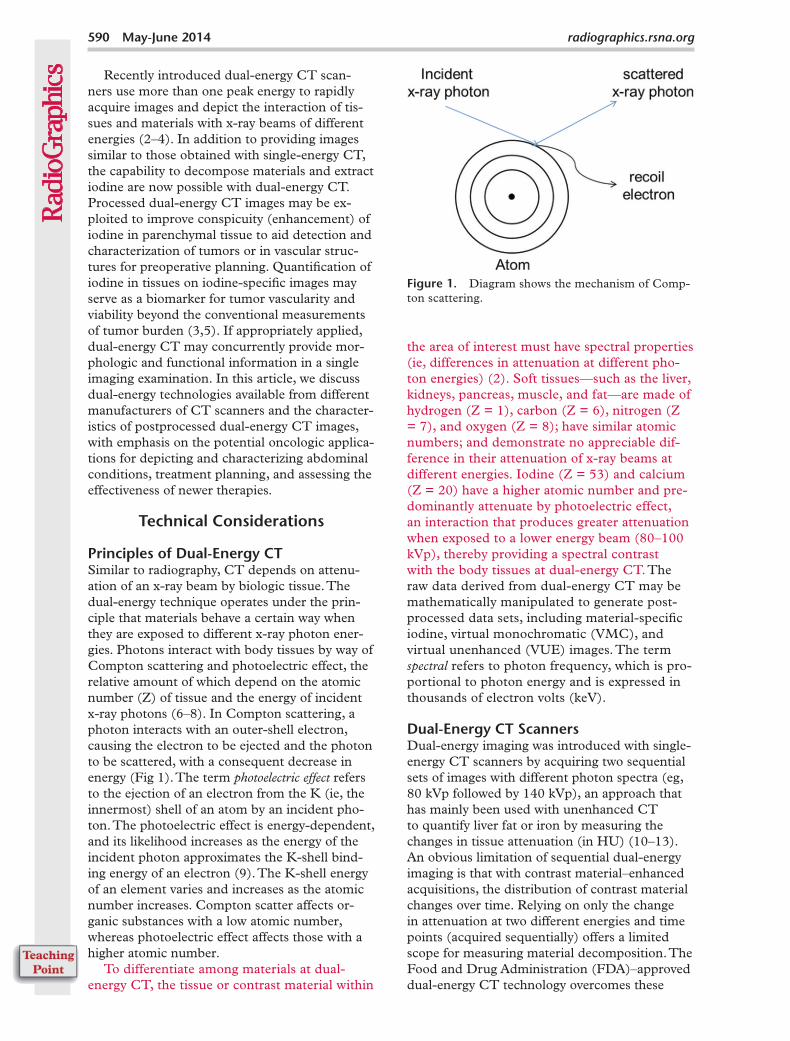
Figure 1. Diagram shows the mechanism of Comp-ton scattering.
the area of interest must have spectral properties (ie, differences in attenuation at different pho-ton energies) (2). Soft tissues—such as the liver, kidneys, pancreas, muscle, and fat—are made of hydrogen (Z = 1), carbon (Z = 6), nitrogen (Z = 7), and oxygen (Z = 8); have similar atomic numbers; and demonstrate no appreciable dif-ference in their attenuation of x-ray beams at different energies. Iodine (Z = 53) and calcium (Z = 20) have a higher atomic number and pre-dominantly attenuate by photoelectric effect, an interaction that produces greater attenuation when exposed to a lower energy beam (80–100 kVp), thereby providing a spectral contrast with the body tissues at dual-energy CT. The raw data derived from dual-energy CT may be mathematically manipulated to generate post-processed data sets, including material-specific iodine, virtual monochromatic (VMC), and virtual unenhanced (VUE) images. The term spectral refers to photon frequency, which is pro-portional to photon energy and is expressed in thousands of electron volts (keV).
Dual-Energy CT ScannersDual-energy imaging was introduced with single-energy CT scanners by acquiring two sequential sets of images with different photon spectra (eg, 80 kVp followed by 140 kVp), an approach that has mainly been used with unenhanced CT to quantify liver fat or iron by measuring the changes in tissue attenuation (in HU) (10–13). An obvious limitation of sequential dual-energy imaging is that with contrast material–enhanced acquisitions, the distribution of contrast material changes over time. Relying on only the change in attenuation at two different energies and time points (acquired sequentially) offers a limited scope for measuring material decomposition. The Food and Drug Administration (FDA)–approved dual-energy CT technology overcomes these
Recently introduced dual-energy CT scan-ners use more than one peak energy to rapidly acquire images and depict the interaction of tis-sues and materials with x-ray beams of different energies (2–4). In addition to providing images similar to those obtained with single-energy CT, the capability to decompose materials and extract iodine are now possible with dual-energy CT. Processed dual-energy CT images may be ex-ploited to improve conspicuity (enhancement) of iodine in parenchymal tissue to aid detection and characterization of tumors or in vascular struc-tures for preoperative planning. Quantification of iodine in tissues on iodine-specific images may serve as a biomarker for tumor vascularity and viability beyond the conventional measurements of tumor burden (3,5). If appropriately applied, dual-energy CT may concurrently provide mor-phologic and functional information in a single imaging examination. In this article, we discuss dual-energy technologies available from different manufacturers of CT scanners and the character-istics of postprocessed dual-energy CT images, with emphasis on the potential oncologic applica-tions for depicting and characterizing abdominal conditions, treatment planning, and assessing the effectiveness of newer therapies.
Technical Considerations
Principles of Dual-Energy CT Similar to radiography, CT depends on attenu-ation of an x-ray beam by biologic tissue. The dual-energy technique operates under the prin-ciple that materials behave a certain way when they are exposed to different x-ray photon ener-gies. Photons interact with body tissues by way of Compton scattering and photoelectric effect, the relative amount of which depend on the atomic number (Z) of tissue and the energy of incident x-ray photons (6–8). In Compton scattering, a photon interacts with an outer-shell electron, causing the electron to be ejected and the photon to be scattered, with a consequent decrease in energy (Fig 1). The term photoelectric effect refers to the ejection of an electron from the K (ie, the innermost) shell of an atom by an incident pho-ton. The photoelectric effect is energy-dependent, and its likelihood increases as the energy of the incident photon approximates the K-shell bind-ing energy of an electron (9). The K-shell energy of an element varies and increases as the atomic number increases. Compton scatter affects or-ganic substances with a low atomic number, whereas photoelectric effect affects those with a higher atomic number.
To differentiate among materials at dual-energy CT, the tissue or contrast material within
RG • Volume 34 Number 3 Agrawal et al 591
diagnostic quality images. However, the field of view (FOV) of the high-energy tube is limited to 26–33 cm, a significant limitation (2).
The single-source dual-energy system (Dis-covery 750HD; GE Healthcare, Milwaukee, Wis) uses a single x-ray tube, which has the capability to alternate between energies (low and high) in less than 0.5 msec and within the same gantry rota-tion. It relies on a detector that is able to rapidly register information from exposure at both ener-gies. Because dual-energy data sets are rapidly acquired, image misregistration is not a concern. Recent improvements in the software technology allow use of the partial iterative technique (known as adaptive statistical iterative reconstruction [ASIR]) to minimize radiation dose. However, the recently approved advanced iterative technique (also known as model-based iterative reconstruc-tion [MBIR]) is not yet compatible with dual-energy acquisitions. Currently, the automatic tube current modulation is not supported in single-source systems, which may lead to a slight increase in radiation dose (4).
Two other single-source dual-energy CT scan-ners are in the development phase. One (Bril-liance CT; Philips Healthcare, Eindhoven, The Netherlands) relies on energy separation at the level of the detector by using a sandwich detector that separates the high and low energy photons from a single x-ray source (4). The other (Aquil-ion One; Toshiba, Tochigi, Japan) uses two x-ray beams to perform ultra-fast (tube rotation, 0.27 msec) sequential imaging (16).
limitations by simultaneously acquiring images at two different energies, thereby providing the high temporal resolution necessary for contrast-enhanced imaging. Postprocessing algorithms permit materials to be separated (2–4,8).
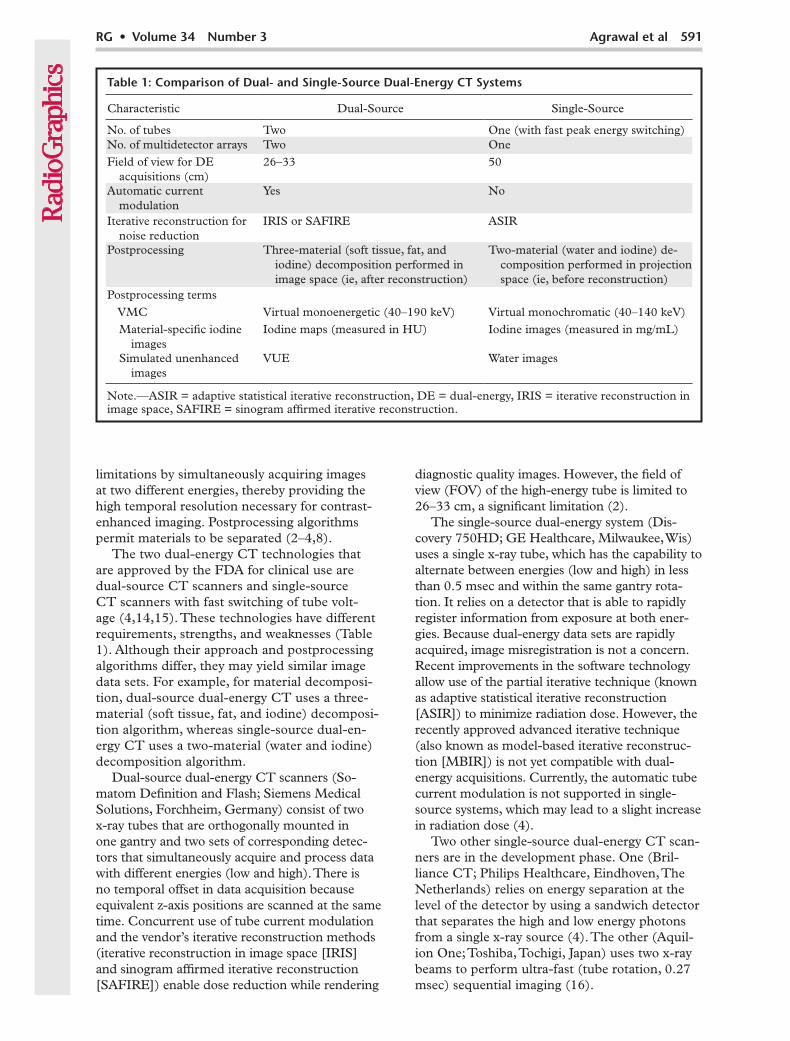
The two dual-energy CT technologies that are approved by the FDA for clinical use are dual-source CT scanners and single-source CT scanners with fast switching of tube volt-age (4,14,15). These technologies have different requirements, strengths, and weaknesses (Table 1). Although their approach and postprocessing algorithms differ, they may yield similar image data sets. For example, for material decomposi-tion, dual-source dual-energy CT uses a three-material (soft tissue, fat, and iodine) decomposi-tion algorithm, whereas single-source dual-en-ergy CT uses a two-material (water and iodine) decomposition algorithm.
Dual-source dual-energy CT scanners (So-matom Definition and Flash; Siemens Medical Solutions, Forchheim, Germany) consist of two x-ray tubes that are orthogonally mounted in one gantry and two sets of corresponding detec-tors that simultaneously acquire and process data with different energies (low and high). There is no temporal offset in data acquisition because equivalent z-axis positions are scanned at the same time. Concurrent use of tube current modulation and the vendor’s iterative reconstruction methods (iterative reconstruction in image space [IRIS] and sinogram affirmed iterative reconstruction [SAFIRE]) enable dose reduction while rendering
Table 1: Comparison of Dual- and Single-Source Dual-Energy CT Systems
Characteristic Dual-Source Single-Source
No. of tubes Two One (with fast peak energy switching)No. of multidetector arrays Two OneField of view for DE
acquisitions (cm)26–33 50
Automatic current modulation
Yes No
Iterative reconstruction for noise reduction
IRIS or SAFIRE ASIR
Postprocessing Three-material (soft tissue, fat, and iodine) decomposition performed in image space (ie, after reconstruction)
Two-material (water and iodine) de-composition performed in projection space (ie, before reconstruction)
Postprocessing terms VMC Virtual monoenergetic (40–190 keV) Virtual monochromatic (40–140 keV) Material-specific iodine
images Iodine maps (measured in HU) Iodine images (measured in mg/mL)
Simulated unenhanced images
VUE Water images
Note.—ASIR = adaptive statistical iterative reconstruction, DE = dual-energy, IRIS = iterative reconstruction in image space, SAFIRE = sinogram affirmed iterative reconstruction.
592 May-June 2014 radiographics.rsna.org
Dual-Energy CT AcquisitionDual-energy CT is relatively straightforward and may be performed by adapting the protocols used for single-energy CT; however, dual-energy CT images undergo extensive postprocessing (Table 2). Because of the FOV limitations of the high-energy tube in dual-source dual-energy CT, patients must be carefully positioned and centered to include the region of interest within the reconstruction FOV for the high-energy tube. Either 80 or 100 kVp may be selected for the lower energy tube on the basis of the pa-tient’s body weight to overcome the noise con-cerns with low-energy imaging. In average-sized patients (those who weigh less than 90 kg), we use 80 kVp, with 100 kVp reserved for heavier patients. With the single-source dual-energy CT system, the dual-energy combination of 140 and 80 kVp cannot be altered. To minimize the image noise in heavier patients (those who weigh more than 90 kg), the tube rotation time is increased to 0.6–0.8 sec from the default time of 0.5 sec. In our practice, we prefer not to per-form dual-energy CT with either dual-energy system to image tumors in patients who weigh more than 90 kg.
In the dual-source system, each dual-energy acquisition generates three image data sets: high-energy (140 kVp); low-energy (80 or 100 kVp); and mixed or blended, which are custom-izable but typically comprise 60% of the high-energy data and 40% of the low-energy data (2). In the single-source dual-energy CT system, four different sets of images are typically gener-
ated. These images include a 140 kVp series that resembles a conventional CT series, also known as the quality series; a VMC series obtained with any single photon energy level between 40 and 140 keV; and a material-specific base pair series with low (ie, water) and high (ie, iodine) attenu-ating material (17). Vendors use different terms for processed images in these systems (Table 1). To keep this article practical and easier to follow, we used the following terms: iodine-extracted, VUE, and VMC images. Both dual-energy CT scanners are able to acquire images with isotropic voxels, enabling standard multi-planar reconstructions and three-dimensional postprocessing of images.
Dual-Energy CT Image Reconstruction
Iodine-Extracted ImagesIodine images show the distribution and amount of iodine in the tissues. Dual-source dual-energy CT uses a three-material decomposition algo-rithm in the image space (after the images are reconstructed) and relies on the known x-ray absorption properties of three materials (iodine, soft tissue, and fat) at low and high energies (15,18). The estimated amount of each material is calculated on the basis of its attenuation profile at different energy levels, a process that generates iodine-specific maps that quantify tissue iodine content (in HU). The contributed iodine may also be removed with a similar computation to yield simulated unenhanced images.
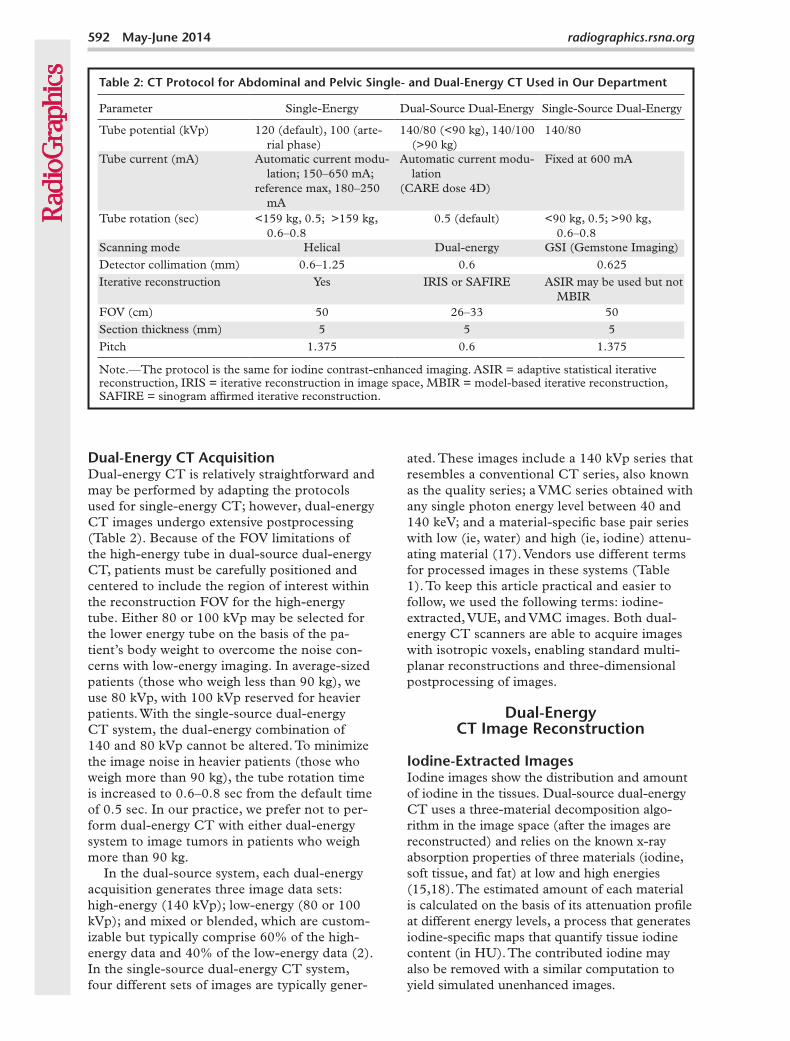
Table 2: CT Protocol for Abdominal and Pelvic Single- and Dual-Energy CT Used in Our Department
Parameter Single-Energy Dual-Source Dual-Energy Single-Source Dual-Energy
Tube potential (kVp) 120 (default), 100 (arte-rial phase)
140/80 (<90 kg), 140/100 (>90 kg)
140/80
Tube current (mA) Automatic current modu-lation; 150–650 mA;
reference max, 180–250 mA
Automatic current modu-lation
(CARE dose 4D)
Fixed at 600 mA
Tube rotation (sec) <159 kg, 0.5; >159 kg, 0.6–0.8
0.5 (default) <90 kg, 0.5; >90 kg, 0.6–0.8
Scanning mode Helical Dual-energy GSI (Gemstone Imaging)Detector collimation (mm) 0.6–1.25 0.6 0.625 Iterative reconstruction Yes IRIS or SAFIRE ASIR may be used but not
MBIRFOV (cm) 50 26–33 50 Section thickness (mm) 5 5 5 Pitch 1.375 0.6 1.375
Note.—The protocol is the same for iodine contrast-enhanced imaging. ASIR = adaptive statistical iterative reconstruction, IRIS = iterative reconstruction in image space, MBIR = model-based iterative reconstruction, SAFIRE = sinogram affirmed iterative reconstruction.
RG • Volume 34 Number 3 Agrawal et al 593
Single-source dual-energy CT uses a two-material decomposition algorithm in the projec-tion space (before images are reconstructed from high- and low-energy sinograms). The attenua-tion measurements of two selected base materials (ie, water and iodine) at high and low energies are mathematically transformed to calculate the amounts that would be needed to produce those attenuation levels. Usually, low- (ie, water) and high-attenuation (ie, iodine) materials are selected, and iodine- and water-specific images (similar to true unenhanced images) are gener-ated. Projection-space decomposition enables greater flexibility in material decomposition and permits data to undergo preprocessing correction to minimize beam-hardening artifacts (19).
In conventional contrast-enhanced CT ac-quisitions, attenuation measurements take into account both the inherent tissue attenuation and uptake of contrast media (iodine) by the tissue. Compared with single-energy CT, dual-energy CT offers more information. Dual-energy CT al-lows material decomposition and provides iodine images that map the iodine content of the tissue and, thus, provide a more reliable measurement of tissue enhancement. Iodine-only images may serve as a surrogate marker for tissue contrast media uptake and are independent of inherent tissue attenuation, which contributes to CT at-tenuation measurements. Another advantage is that iodine images eliminate the need for true unenhanced images to assess tissue enhancement. However, imaging in different phases of enhance-ment (eg, arterial and portal venous) is still nec-essary for lesion characterization.
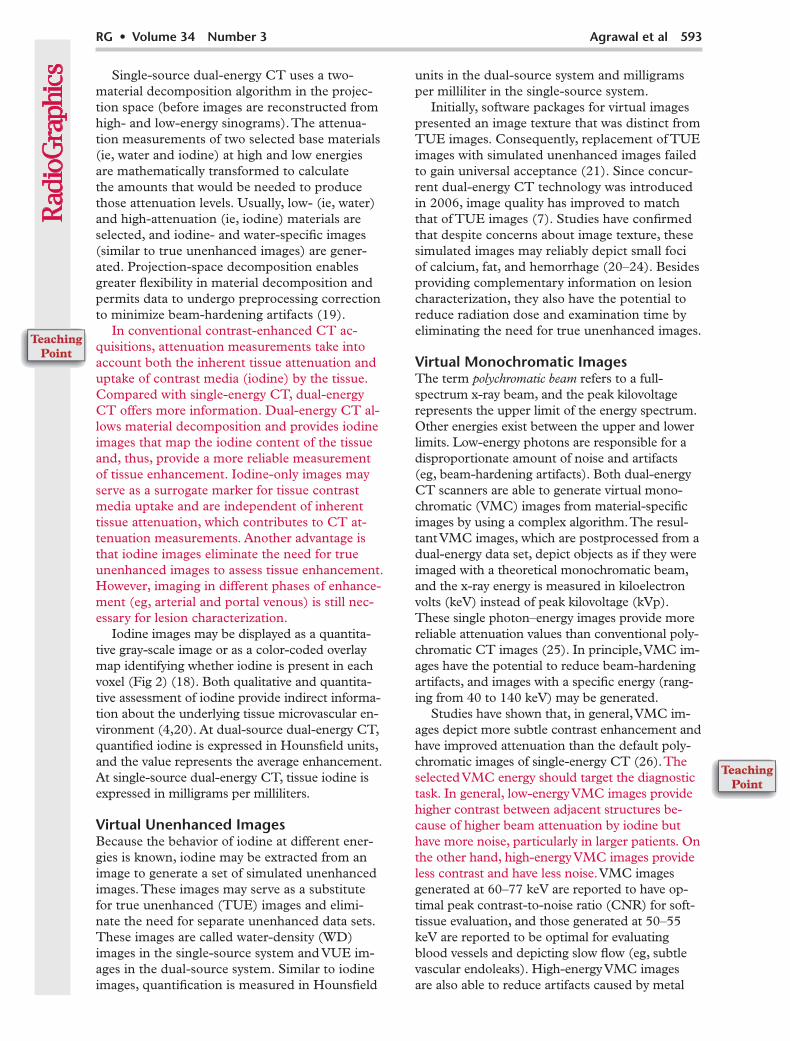
Iodine images may be displayed as a quantita-tive gray-scale image or as a color-coded overlay map identifying whether iodine is present in each voxel (Fig 2) (18). Both qualitative and quantita-tive assessment of iodine provide indirect informa-tion about the underlying tissue microvascular en-vironment (4,20). At dual-source dual-energy CT, quantified iodine is expressed in Hounsfield units, and the value represents the average enhancement. At single-source dual-energy CT, tissue iodine is expressed in milligrams per milliliters.
Virtual Unenhanced ImagesBecause the behavior of iodine at different ener-gies is known, iodine may be extracted from an image to generate a set of simulated unenhanced images. These images may serve as a substitute for true unenhanced (TUE) images and elimi-nate the need for separate unenhanced data sets. These images are called water-density (WD) images in the single-source system and VUE im-ages in the dual-source system. Similar to iodine images, quantification is measured in Hounsfield
units in the dual-source system and milligrams per milliliter in the single-source system.
Initially, software packages for virtual images presented an image texture that was distinct from TUE images. Consequently, replacement of TUE images with simulated unenhanced images failed to gain universal acceptance (21). Since concur-rent dual-energy CT technology was introduced in 2006, image quality has improved to match that of TUE images (7). Studies have confirmed that despite concerns about image texture, these simulated images may reliably depict small foci of calcium, fat, and hemorrhage (20–24). Besides providing complementary information on lesion characterization, they also have the potential to reduce radiation dose and examination time by eliminating the need for true unenhanced images.
Virtual Monochromatic ImagesThe term polychromatic beam refers to a full-spectrum x-ray beam, and the peak kilovoltage represents the upper limit of the energy spectrum. Other energies exist between the upper and lower limits. Low-energy photons are responsible for a disproportionate amount of noise and artifacts (eg, beam-hardening artifacts). Both dual-energy CT scanners are able to generate virtual mono-chromatic (VMC) images from material-specific images by using a complex algorithm. The resul-tant VMC images, which are postprocessed from a dual-energy data set, depict objects as if they were imaged with a theoretical monochromatic beam, and the x-ray energy is measured in kiloelectron volts (keV) instead of peak kilovoltage (kVp). These single photon–energy images provide more reliable attenuation values than conventional poly-chromatic CT images (25). In principle, VMC im-ages have the potential to reduce beam-hardening artifacts, and images with a specific energy (rang-ing from 40 to 140 keV) may be generated.
Studies have shown that, in general, VMC im-ages depict more subtle contrast enhancement and have improved attenuation than the default poly-chromatic images of single-energy CT (26). The selected VMC energy should target the diagnostic task. In general, low-energy VMC images provide higher contrast between adjacent structures be-cause of higher beam attenuation by iodine but have more noise, particularly in larger patients. On the other hand, high-energy VMC images provide less contrast and have less noise. VMC images generated at 60–77 keV are reported to have op-timal peak contrast-to-noise ratio (CNR) for soft-tissue evaluation, and those generated at 50–55 keV are reported to be optimal for evaluating blood vessels and depicting slow flow (eg, subtle vascular endoleaks). High-energy VMC images are also able to reduce artifacts caused by metal
594 May-June 2014 radiographics.rsna.org
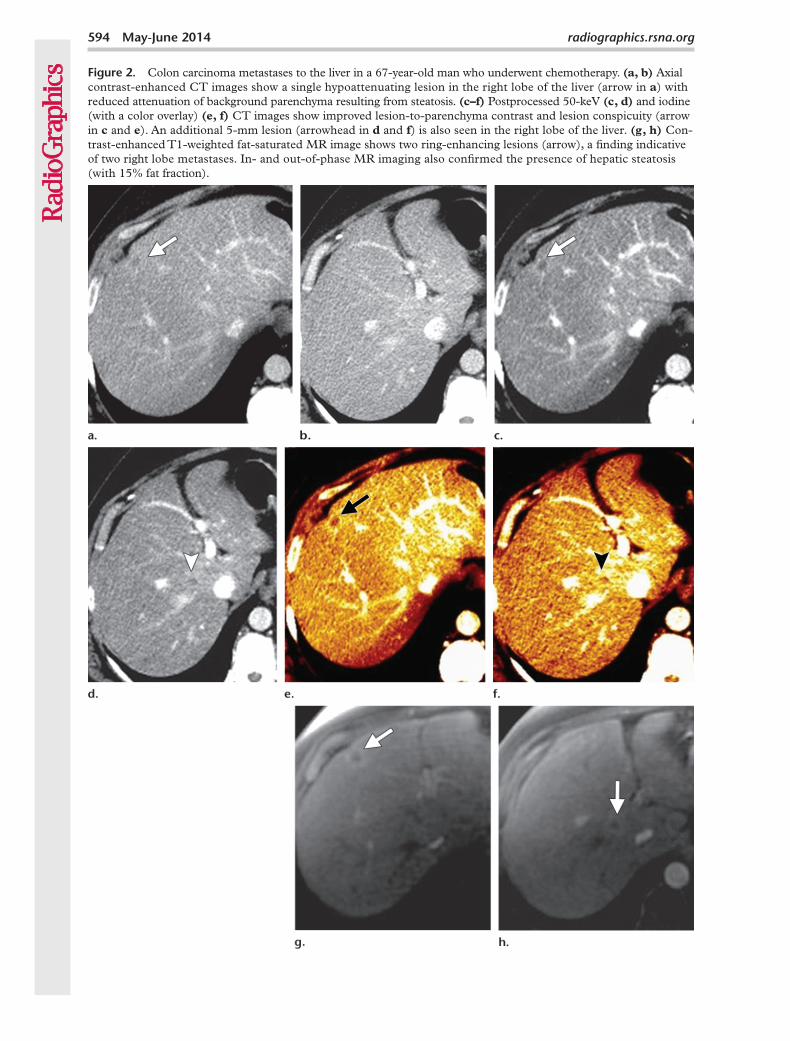
Figure 2. Colon carcinoma metastases to the liver in a 67-year-old man who underwent chemotherapy. (a, b) Axial contrast-enhanced CT images show a single hypoattenuating lesion in the right lobe of the liver (arrow in a) with reduced attenuation of background parenchyma resulting from steatosis. (c–f) Postprocessed 50-keV (c, d) and iodine (with a color overlay) (e, f) CT images show improved lesion-to-parenchyma contrast and lesion conspicuity (arrow in c and e). An additional 5-mm lesion (arrowhead in d and f) is also seen in the right lobe of the liver. (g, h) Con-trast-enhanced T1-weighted fat-saturated MR image shows two ring-enhancing lesions (arrow), a finding indicative of two right lobe metastases. In- and out-of-phase MR imaging also confirmed the presence of hepatic steatosis (with 15% fat fraction).
RG • Volume 34 Number 3 Agrawal et al 595
implants; optimal monochromatic energies range from 95 to 150 keV, depending on the size and composition of the implant (25).
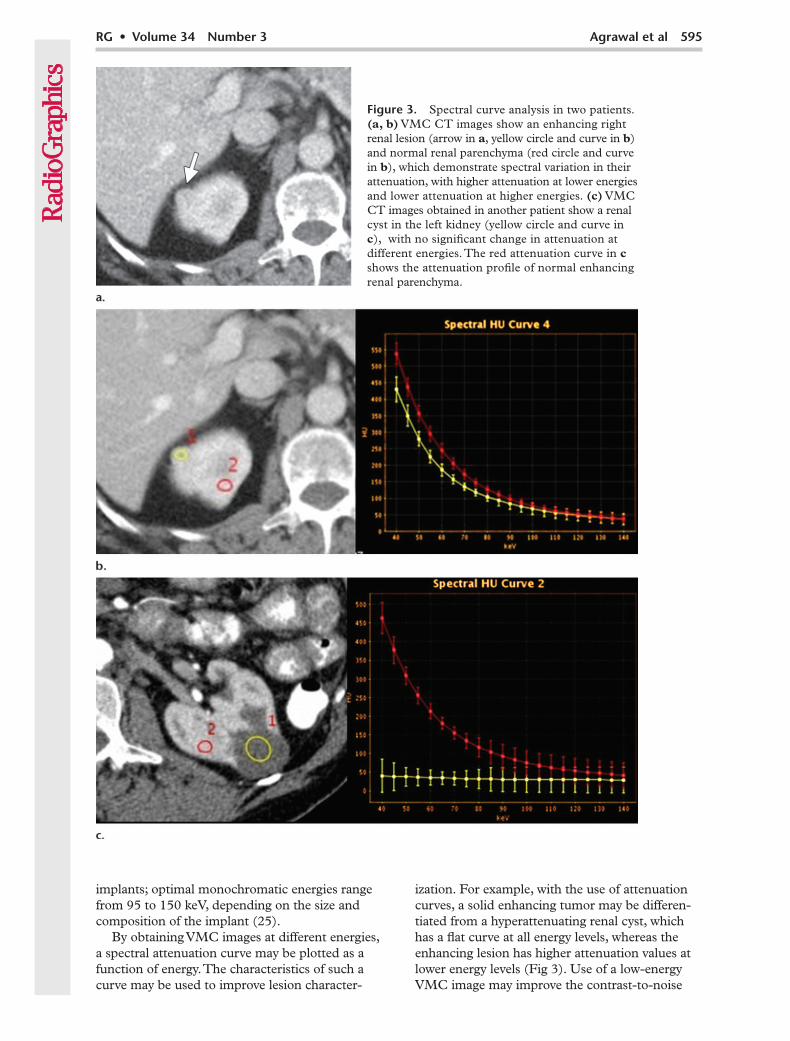
By obtaining VMC images at different energies, a spectral attenuation curve may be plotted as a function of energy. The characteristics of such a curve may be used to improve lesion character-
ization. For example, with the use of attenuation curves, a solid enhancing tumor may be differen-tiated from a hyperattenuating renal cyst, which has a flat curve at all energy levels, whereas the enhancing lesion has higher attenuation values at lower energy levels (Fig 3). Use of a low-energy VMC image may improve the contrast-to-noise
Figure 3. Spectral curve analysis in two patients. (a, b) VMC CT images show an enhancing right renal lesion (arrow in a, yellow circle and curve in b) and normal renal parenchyma (red circle and curve in b), which demonstrate spectral variation in their attenuation, with higher attenuation at lower energies and lower attenuation at higher energies. (c) VMC CT images obtained in another patient show a renal cyst in the left kidney (yellow circle and curve in c), with no significant change in attenuation at different energies. The red attenuation curve in c shows the attenuation profile of normal enhancing renal parenchyma.
596 May-June 2014 radiographics.rsna.org
ratio (CNR) between a lesion and background pa-renchyma, even with a reduced amount of contrast material, which may reduce the risk for contrast material–induced nephropathy in patients with compromised kidneys who undergo serial CT examinations for surveillance and treatment moni-toring (27).
Oncologic Applications
Depiction of LesionsIn the past, low single-energy CT (80–100 kVp) was used to improve conspicuity of hypervascular lesions and increase their detection rate (28–31). Use of a lower energy level results in higher x-ray absorption of iodine from energies close to its k-edge (33.2 keV). As a result, hypervascular le-sions are more conspicuous (Table 3). One of the main concerns of low (80–100 kVp) single-en-ergy CT acquisitions, despite their better contrast resolution, is the increased noise compared with high (120 kVp) single-energy CT (31).
The low-energy (80 or 100 kVp) images from a dual-energy CT examination may be used to improve CNR, whereas the blended image may be the equivalent of a conventional single-energy CT image. Low-energy VMC images (around
60–77 keV) have similar applications as the low (80–100 kVp) dual-energy images, and, because VMC images have fewer beam hardening arti-facts, their image quality is better for evaluating lesions in solid organs (32,33). The use of low-energy images in oncologic CT may improve le-sion detection by improving the contrast between a hypervascular lesion, a hypovascular lesion, and normally enhancing parenchyma (Fig 4).
Iodine-specific maps have the potential to increase the depiction and characterization of hypoattenuating malignancies by increasing the contrast between a hypoattenuating lesion and normally enhancing parenchyma on the basis of differences in tissue iodine content (Fig 5). Iodine-specific maps depict and quantify iodine in each voxel; thus, a small amount of enhancement in a lesion may be detected. Another potential applica-tion of iodine-specific maps is improved depiction of nodules with varying enhancement patterns in patients with a cirrhotic liver (Fig 6).
For depiction of hepatocellular carcinoma, tumor-to-liver contrast and lesion conspicuity on CT images is of primary importance. As was mentioned earlier, in the past, a low tube voltage (80–100 kVp) CT acquisition was used to improve conspicuity of hypervascular lesions (28–30).
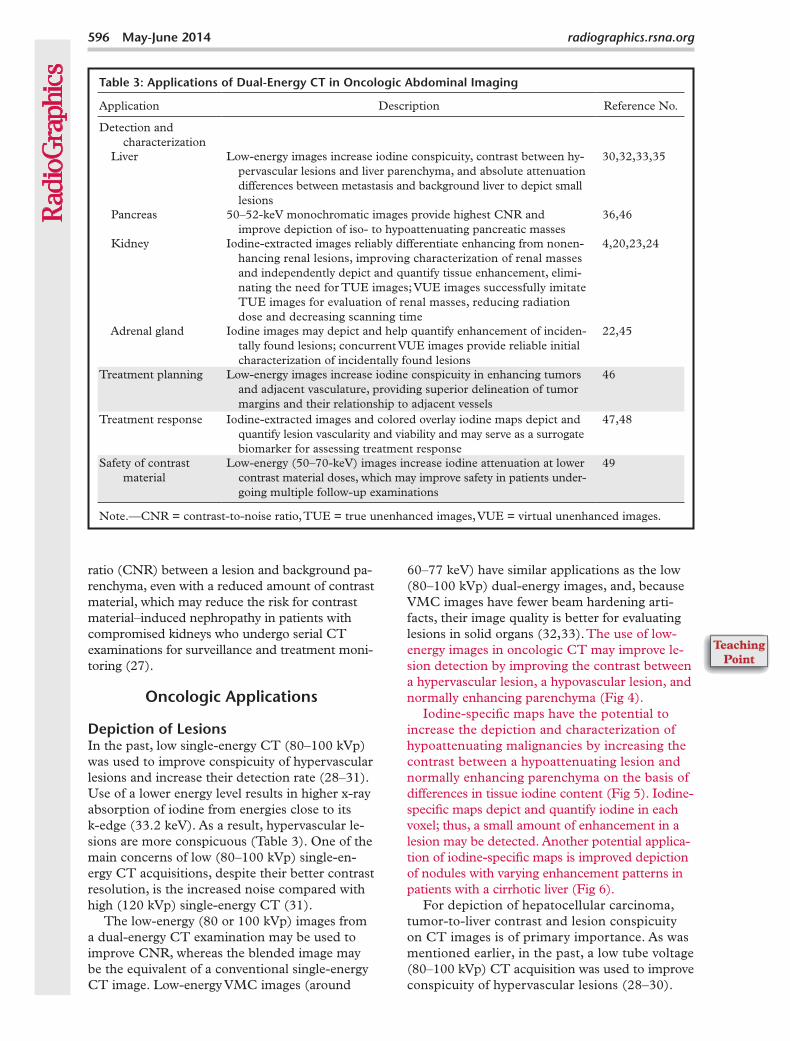
Table 3: Applications of Dual-Energy CT in Oncologic Abdominal Imaging
Application Description Reference No.
Detection and characterization
Liver Low-energy images increase iodine conspicuity, contrast between hy-pervascular lesions and liver parenchyma, and absolute attenuation differences between metastasis and background liver to depict small lesions
30,32,33,35
Pancreas 50–52-keV monochromatic images provide highest CNR and improve depiction of iso- to hypoattenuating pancreatic masses
36,46
Kidney Iodine-extracted images reliably differentiate enhancing from nonen-hancing renal lesions, improving characterization of renal masses and independently depict and quantify tissue enhancement, elimi-nating the need for TUE images; VUE images successfully imitate TUE images for evaluation of renal masses, reducing radiation dose and decreasing scanning time
4,20,23,24
Adrenal gland Iodine images may depict and help quantify enhancement of inciden-tally found lesions; concurrent VUE images provide reliable initial characterization of incidentally found lesions
22,45
Treatment planning Low-energy images increase iodine conspicuity in enhancing tumors and adjacent vasculature, providing superior delineation of tumor margins and their relationship to adjacent vessels
46
Treatment response Iodine-extracted images and colored overlay iodine maps depict and quantify lesion vascularity and viability and may serve as a surrogate biomarker for assessing treatment response
47,48
Safety of contrast material
Low-energy (50–70-keV) images increase iodine attenuation at lower contrast material doses, which may improve safety in patients under-going multiple follow-up examinations
49
Note.—CNR = contrast-to-noise ratio, TUE = true unenhanced images, VUE = virtual unenhanced images.
RG • Volume 34 Number 3 Agrawal et al 597
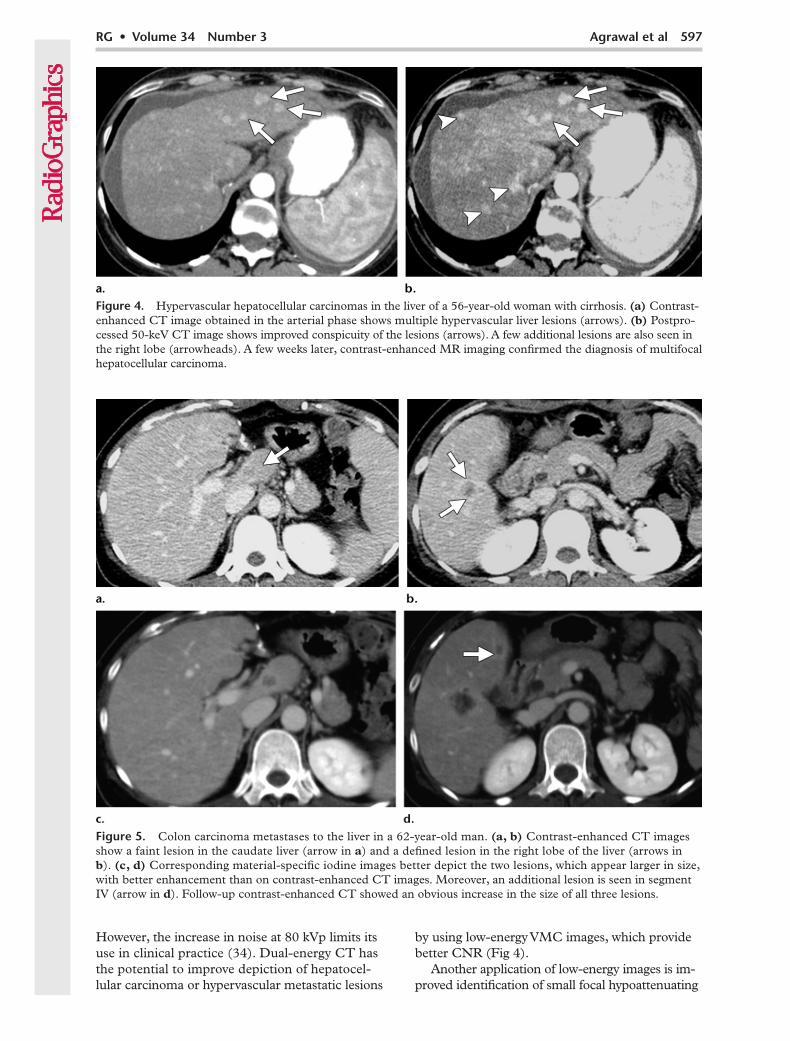
Figure 5. Colon carcinoma metastases to the liver in a 62-year-old man. (a, b) Contrast-enhanced CT images show a faint lesion in the caudate liver (arrow in a) and a defined lesion in the right lobe of the liver (arrows in b). (c, d) Corresponding material-specific iodine images better depict the two lesions, which appear larger in size, with better enhancement than on contrast-enhanced CT images. Moreover, an additional lesion is seen in segment IV (arrow in d). Follow-up contrast-enhanced CT showed an obvious increase in the size of all three lesions.
Figure 4. Hypervascular hepatocellular carcinomas in the liver of a 56-year-old woman with cirrhosis. (a) Contrast-enhanced CT image obtained in the arterial phase shows multiple hypervascular liver lesions (arrows). (b) Postpro-cessed 50-keV CT image shows improved conspicuity of the lesions (arrows). A few additional lesions are also seen in the right lobe (arrowheads). A few weeks later, contrast-enhanced MR imaging confirmed the diagnosis of multifocal hepatocellular carcinoma.
However, the increase in noise at 80 kVp limits its use in clinical practice (34). Dual-energy CT has the potential to improve depiction of hepatocel-lular carcinoma or hypervascular metastatic lesions
by using low-energy VMC images, which provide better CNR (Fig 4).
Another application of low-energy images is im-proved identification of small focal hypoattenuating
598 May-June 2014 radiographics.rsna.org
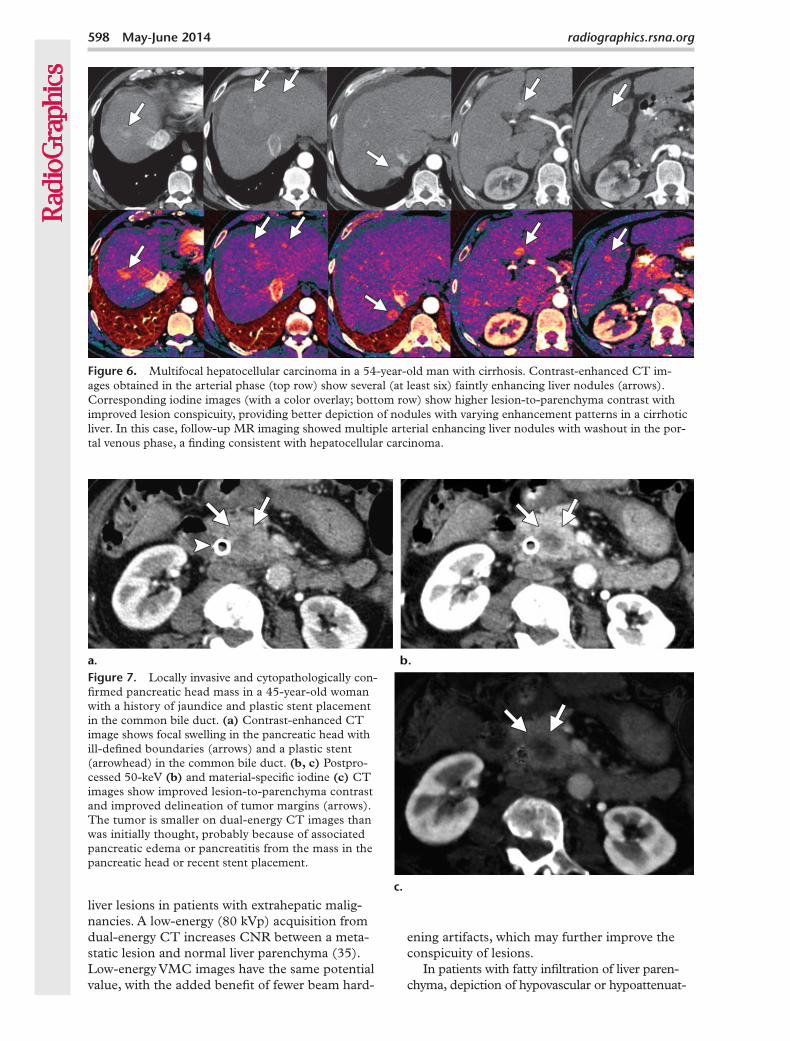
Figure 6. Multifocal hepatocellular carcinoma in a 54-year-old man with cirrhosis. Contrast-enhanced CT im-ages obtained in the arterial phase (top row) show several (at least six) faintly enhancing liver nodules (arrows). Corresponding iodine images (with a color overlay; bottom row) show higher lesion-to-parenchyma contrast with improved lesion conspicuity, providing better depiction of nodules with varying enhancement patterns in a cirrhotic liver. In this case, follow-up MR imaging showed multiple arterial enhancing liver nodules with washout in the por-tal venous phase, a finding consistent with hepatocellular carcinoma.
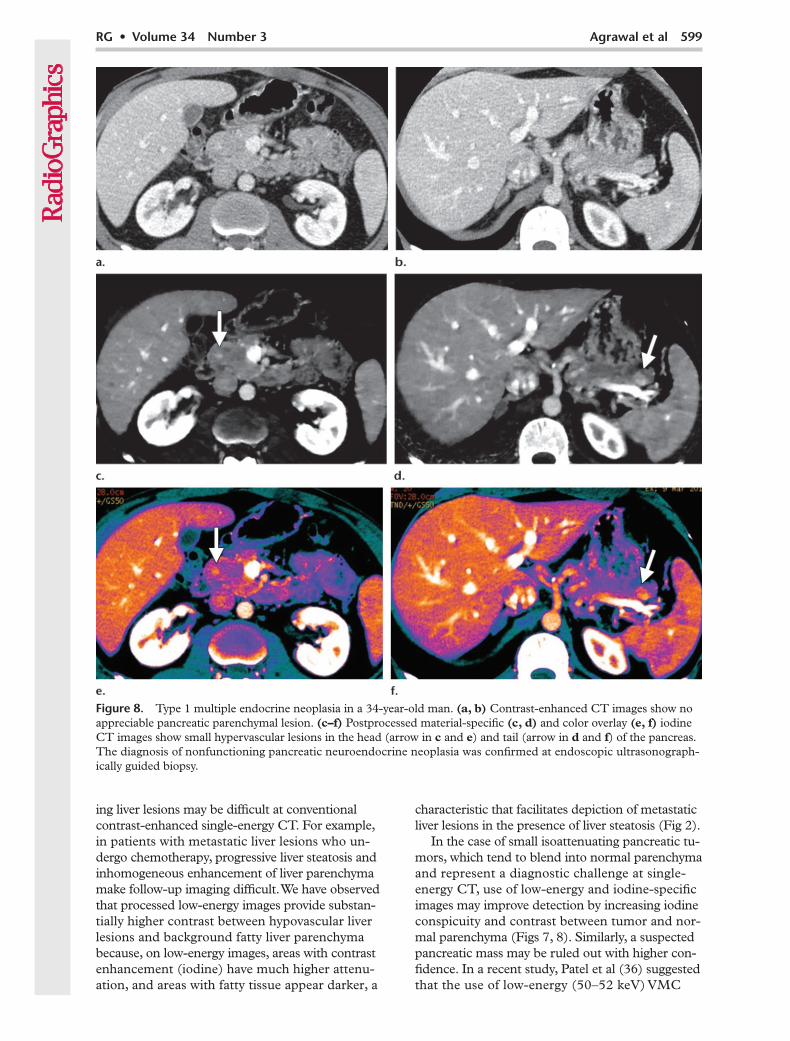
Figure 7. Locally invasive and cytopathologically con-firmed pancreatic head mass in a 45-year-old woman with a history of jaundice and plastic stent placement in the common bile duct. (a) Contrast-enhanced CT image shows focal swelling in the pancreatic head with ill-defined boundaries (arrows) and a plastic stent (arrowhead) in the common bile duct. (b, c) Postpro-cessed 50-keV (b) and material-specific iodine (c) CT images show improved lesion-to-parenchyma contrast and improved delineation of tumor margins (arrows). The tumor is smaller on dual-energy CT images than was initially thought, probably because of associated pancreatic edema or pancreatitis from the mass in the pancreatic head or recent stent placement.
liver lesions in patients with extrahepatic malig-nancies. A low-energy (80 kVp) acquisition from dual-energy CT increases CNR between a meta-static lesion and normal liver parenchyma (35). Low-energy VMC images have the same potential value, with the added benefit of fewer beam hard-
ening artifacts, which may further improve the conspicuity of lesions.
In patients with fatty infiltration of liver paren-chyma, depiction of hypovascular or hypoattenuat-
RG • Volume 34 Number 3 Agrawal et al 599
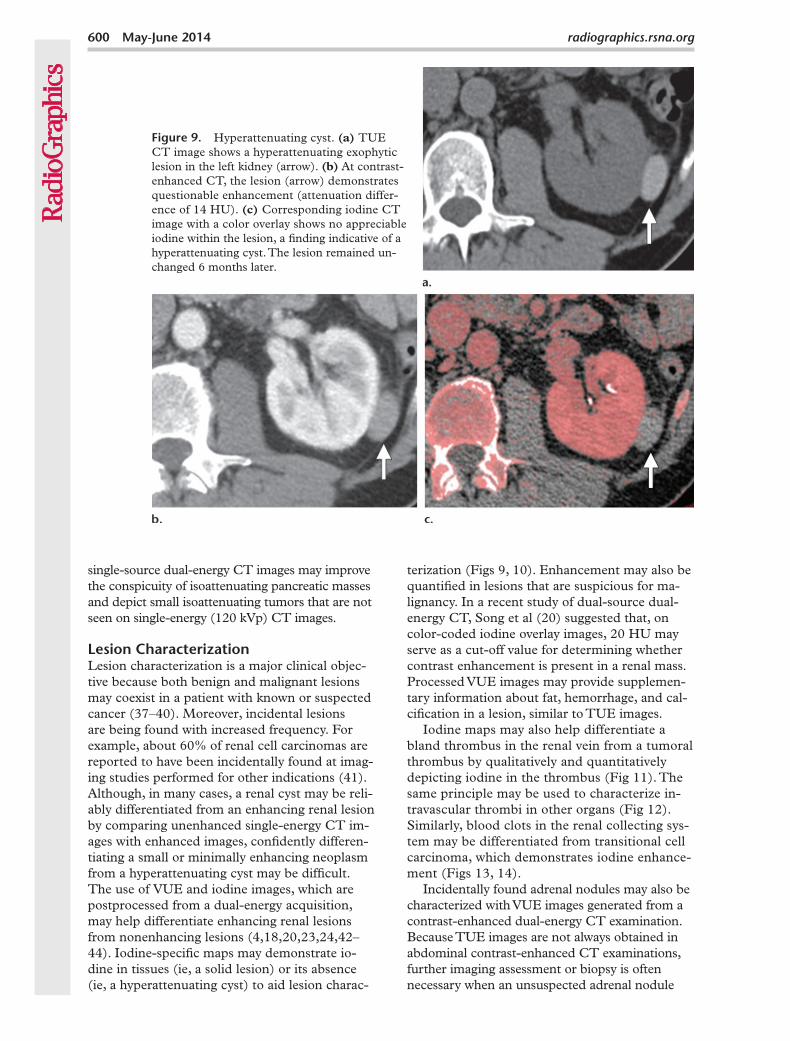
Figure 8. Type 1 multiple endocrine neoplasia in a 34-year-old man. (a, b) Contrast-enhanced CT images show no appreciable pancreatic parenchymal lesion. (c–f) Postprocessed material-specific (c, d) and color overlay (e, f) iodine CT images show small hypervascular lesions in the head (arrow in c and e) and tail (arrow in d and f) of the pancreas. The diagnosis of nonfunctioning pancreatic neuroendocrine neoplasia was confirmed at endoscopic ultrasonograph-ically guided biopsy.
ing liver lesions may be difficult at conventional contrast-enhanced single-energy CT. For example, in patients with metastatic liver lesions who un-dergo chemotherapy, progressive liver steatosis and inhomogeneous enhancement of liver parenchyma make follow-up imaging difficult. We have observed that processed low-energy images provide substan-tially higher contrast between hypovascular liver lesions and background fatty liver parenchyma because, on low-energy images, areas with contrast enhancement (iodine) have much higher attenu-ation, and areas with fatty tissue appear darker, a
characteristic that facilitates depiction of metastatic liver lesions in the presence of liver steatosis (Fig 2).
In the case of small isoattenuating pancreatic tu-mors, which tend to blend into normal parenchyma and represent a diagnostic challenge at single-energy CT, use of low-energy and iodine-specific images may improve detection by increasing iodine conspicuity and contrast between tumor and nor-mal parenchyma (Figs 7, 8). Similarly, a suspected pancreatic mass may be ruled out with higher con-fidence. In a recent study, Patel et al (36) suggested that the use of low-energy (50–52 keV) VMC
600 May-June 2014 radiographics.rsna.org
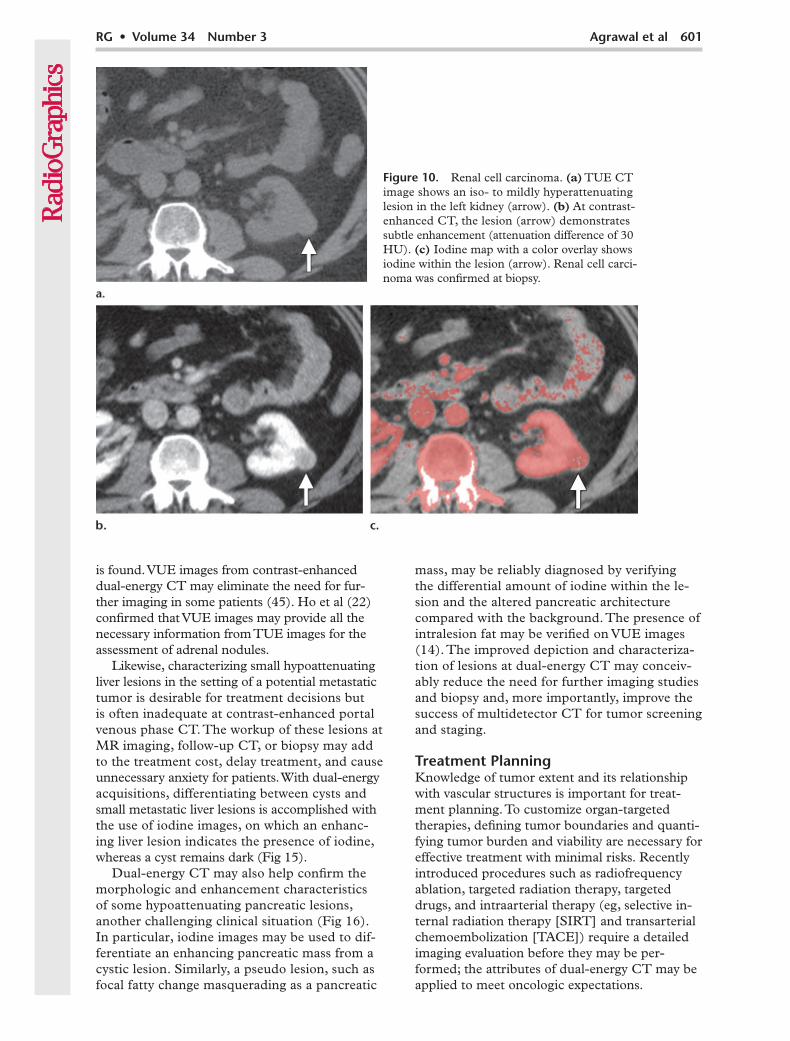
Figure 9. Hyperattenuating cyst. (a) TUE CT image shows a hyperattenuating exophytic lesion in the left kidney (arrow). (b) At contrast-enhanced CT, the lesion (arrow) demonstrates questionable enhancement (attenuation differ-ence of 14 HU). (c) Corresponding iodine CT image with a color overlay shows no appreciable iodine within the lesion, a finding indicative of a hyperattenuating cyst. The lesion remained un-changed 6 months later.
single-source dual-energy CT images may improve the conspicuity of isoattenuating pancreatic masses and depict small isoattenuating tumors that are not seen on single-energy (120 kVp) CT images.
Lesion CharacterizationLesion characterization is a major clinical objec-tive because both benign and malignant lesions may coexist in a patient with known or suspected cancer (37–40). Moreover, incidental lesions are being found with increased frequency. For example, about 60% of renal cell carcinomas are reported to have been incidentally found at imag-ing studies performed for other indications (41). Although, in many cases, a renal cyst may be reli-ably differentiated from an enhancing renal lesion by comparing unenhanced single-energy CT im-ages with enhanced images, confidently differen-tiating a small or minimally enhancing neoplasm from a hyperattenuating cyst may be difficult. The use of VUE and iodine images, which are postprocessed from a dual-energy acquisition, may help differentiate enhancing renal lesions from nonenhancing lesions (4,18,20,23,24,42–44). Iodine-specific maps may demonstrate io-dine in tissues (ie, a solid lesion) or its absence (ie, a hyperattenuating cyst) to aid lesion charac-
terization (Figs 9, 10). Enhancement may also be quantified in lesions that are suspicious for ma-lignancy. In a recent study of dual-source dual-energy CT, Song et al (20) suggested that, on color-coded iodine overlay images, 20 HU may serve as a cut-off value for determining whether contrast enhancement is present in a renal mass. Processed VUE images may provide supplemen-tary information about fat, hemorrhage, and cal-cification in a lesion, similar to TUE images.
Iodine maps may also help differentiate a bland thrombus in the renal vein from a tumoral thrombus by qualitatively and quantitatively depicting iodine in the thrombus (Fig 11). The same principle may be used to characterize in-travascular thrombi in other organs (Fig 12). Similarly, blood clots in the renal collecting sys-tem may be differentiated from transitional cell carcinoma, which demonstrates iodine enhance-ment (Figs 13, 14).
Incidentally found adrenal nodules may also be characterized with VUE images generated from a contrast-enhanced dual-energy CT examination. Because TUE images are not always obtained in abdominal contrast-enhanced CT examinations, further imaging assessment or biopsy is often necessary when an unsuspected adrenal nodule
RG • Volume 34 Number 3 Agrawal et al 601
Figure 10. Renal cell carcinoma. (a) TUE CT image shows an iso- to mildly hyperattenuating lesion in the left kidney (arrow). (b) At contrast-enhanced CT, the lesion (arrow) demonstrates subtle enhancement (attenuation difference of 30 HU). (c) Iodine map with a color overlay shows iodine within the lesion (arrow). Renal cell carci-noma was confirmed at biopsy.
is found. VUE images from contrast-enhanced dual-energy CT may eliminate the need for fur-ther imaging in some patients (45). Ho et al (22) confirmed that VUE images may provide all the necessary information from TUE images for the assessment of adrenal nodules.
Likewise, characterizing small hypoattenuating liver lesions in the setting of a potential metastatic tumor is desirable for treatment decisions but is often inadequate at contrast-enhanced portal venous phase CT. The workup of these lesions at MR imaging, follow-up CT, or biopsy may add to the treatment cost, delay treatment, and cause unnecessary anxiety for patients. With dual-energy acquisitions, differentiating between cysts and small metastatic liver lesions is accomplished with the use of iodine images, on which an enhanc-ing liver lesion indicates the presence of iodine, whereas a cyst remains dark (Fig 15).
Dual-energy CT may also help confirm the morphologic and enhancement characteristics of some hypoattenuating pancreatic lesions, another challenging clinical situation (Fig 16). In particular, iodine images may be used to dif-ferentiate an enhancing pancreatic mass from a cystic lesion. Similarly, a pseudo lesion, such as focal fatty change masquerading as a pancreatic
mass, may be reliably diagnosed by verifying the differential amount of iodine within the le-sion and the altered pancreatic architecture compared with the background. The presence of intralesion fat may be verified on VUE images (14). The improved depiction and characteriza-tion of lesions at dual-energy CT may conceiv-ably reduce the need for further imaging studies and biopsy and, more importantly, improve the success of multidetector CT for tumor screening and staging.
Treatment PlanningKnowledge of tumor extent and its relationship with vascular structures is important for treat-ment planning. To customize organ-targeted therapies, defining tumor boundaries and quanti-fying tumor burden and viability are necessary for effective treatment with minimal risks. Recently introduced procedures such as radiofrequency ablation, targeted radiation therapy, targeted drugs, and intraarterial therapy (eg, selective in-ternal radiation therapy [SIRT] and transarterial chemoembolization [TACE]) require a detailed imaging evaluation before they may be per-formed; the attributes of dual-energy CT may be applied to meet oncologic expectations.
602 May-June 2014 radiographics.rsna.org
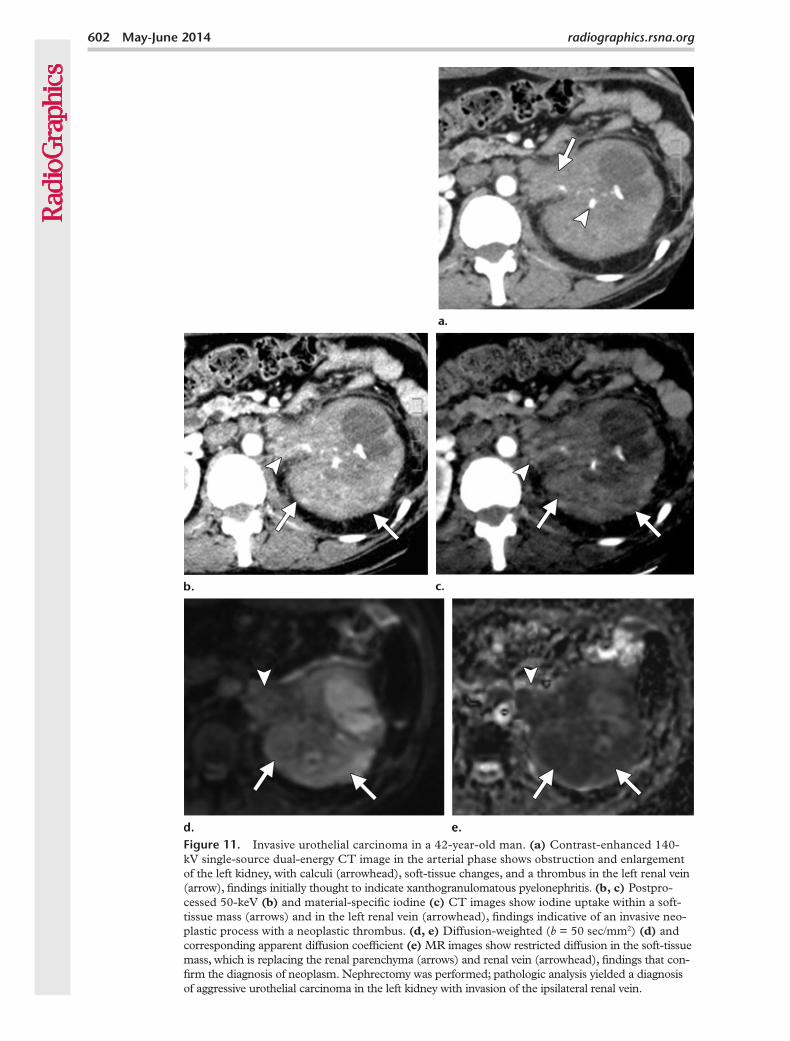
Figure 11. Invasive urothelial carcinoma in a 42-year-old man. (a) Contrast-enhanced 140-kV single-source dual-energy CT image in the arterial phase shows obstruction and enlargement of the left kidney, with calculi (arrowhead), soft-tissue changes, and a thrombus in the left renal vein (arrow), findings initially thought to indicate xanthogranulomatous pyelonephritis. (b, c) Postpro-cessed 50-keV (b) and material-specific iodine (c) CT images show iodine uptake within a soft-tissue mass (arrows) and in the left renal vein (arrowhead), findings indicative of an invasive neo-plastic process with a neoplastic thrombus. (d, e) Diffusion-weighted (b = 50 sec/mm2) (d) and corresponding apparent diffusion coefficient (e) MR images show restricted diffusion in the soft-tissue mass, which is replacing the renal parenchyma (arrows) and renal vein (arrowhead), findings that con-firm the diagnosis of neoplasm. Nephrectomy was performed; pathologic analysis yielded a diagnosis of aggressive urothelial carcinoma in the left kidney with invasion of the ipsilateral renal vein.
RG • Volume 34 Number 3 Agrawal et al 603
The value of low-energy and iodine-specific images to improve iodine conspicuity and the contrast between enhancing lesions and normal parenchyma was previously discussed. Low-en-ergy and iodine-specific images have the potential to define the exact tumor boundaries by increas-ing the contrast between two adjacent tissues (Fig 17). The same principle may be applied in patients with multiple lesions to determine the number and size of malignant lesions, both of which may be important for treatment planning (eg, in patients with hepatocellular carcinoma, especially those who are eligible for liver trans-plantation) (Fig 4).
Similarly, low-energy images may improve io-dine conspicuity in vascular structures and better depict the relationship between blood vessels and tumor (46). Thus, dual-energy CT may be better for tumor staging and treatment planning, espe-cially imaging-guided therapies. Because images may be isotropically acquired, maximum intensity projection images may be reconstructed from the same dual-energy acquisition, providing a vascu-lar guide for surgeons. As was previously men-tioned, iodine-specific maps improve the contrast
between enhancing and nonenhancing areas. We have found that iodine maps are particularly use-ful in tumor staging: They improve depiction of local tumor invasion, adjacent organ involvement, and distant metastases (Fig 18).
Treatment MonitoringObjective assessment of patients’ response to treatment is important to monitor the effects of anticancer drugs and to establish a reliable pa-rameter with which to compare results of imaging studies both in the same patient and in different clinical trials. The imaging biomarker must be quantitative, reproducible, readily available, vali-dated, and easy to apply in a clinical setting to assess treatment response.
Early and accurate assessment of patients’ response to treatment is critical in treating pa-tients with cancer, and imaging is an integral part. The established and currently used imaging criteria for response assessment, including the response evaluation criteria in solid tumors (RE-CIST) and World Health Organization (WHO) response criteria, operate on the basis of serial measurement of tumor size. However, it is now
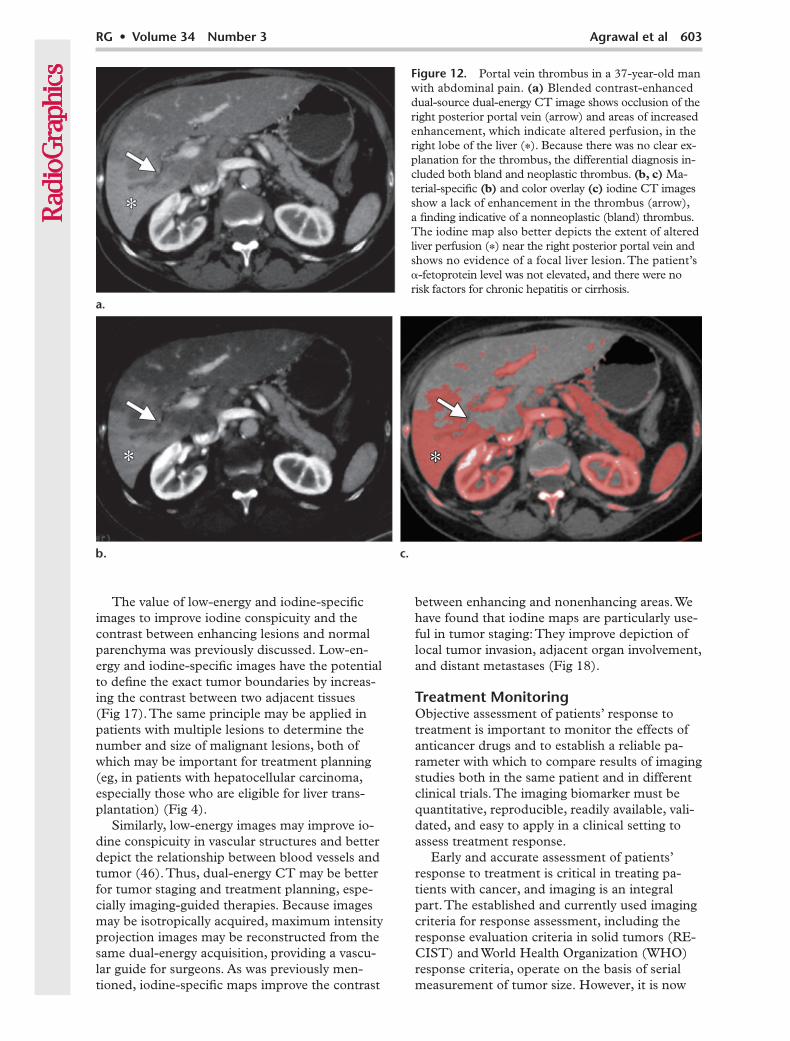
Figure 12. Portal vein thrombus in a 37-year-old man with abdominal pain. (a) Blended contrast-enhanced dual-source dual-energy CT image shows occlusion of the right posterior portal vein (arrow) and areas of increased enhancement, which indicate altered perfusion, in the right lobe of the liver (*). Because there was no clear ex-planation for the thrombus, the differential diagnosis in- cluded both bland and neoplastic thrombus. (b, c) Ma-terial-specific (b) and color overlay (c) iodine CT images show a lack of enhancement in the thrombus (arrow), a finding indicative of a nonneoplastic (bland) thrombus. The iodine map also better depicts the extent of altered liver perfusion (*) near the right posterior portal vein and shows no evidence of a focal liver lesion. The patient’s -fetoprotein level was not elevated, and there were no risk factors for chronic hepatitis or cirrhosis.
604 May-June 2014 radiographics.rsna.org
RG • Volume 34 Number 3 Agrawal et al 605
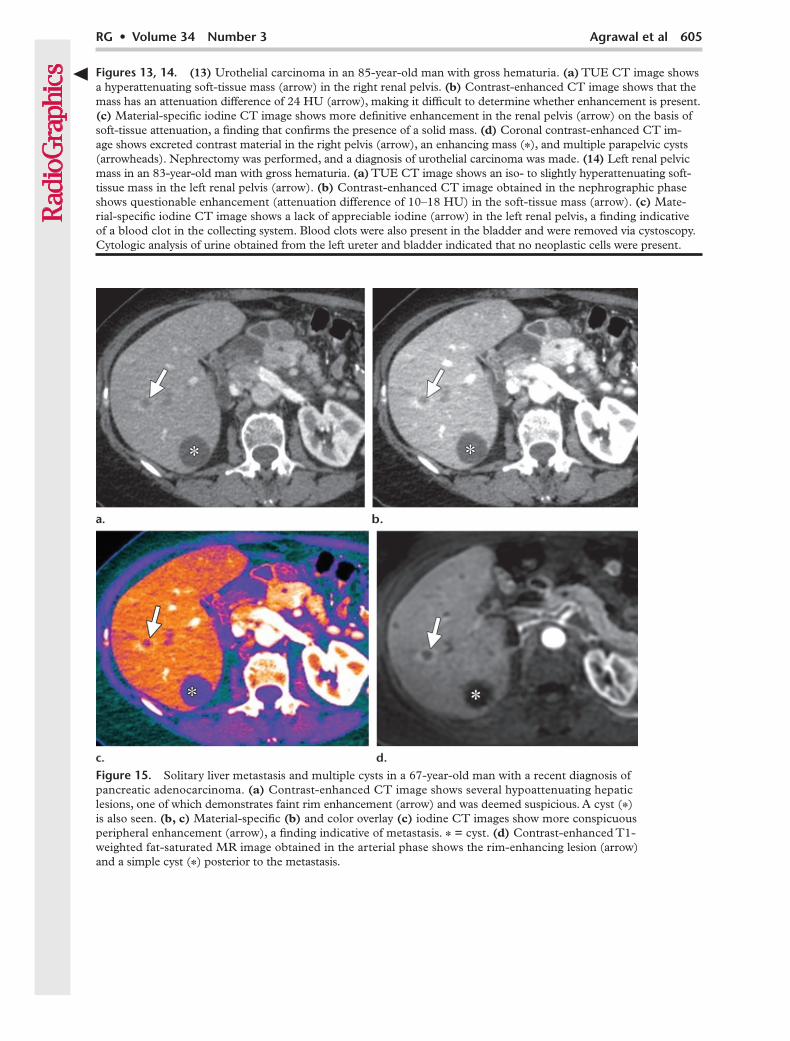
Figure 15. Solitary liver metastasis and multiple cysts in a 67-year-old man with a recent diagnosis of pancreatic adenocarcinoma. (a) Contrast-enhanced CT image shows several hypoattenuating hepatic lesions, one of which demonstrates faint rim enhancement (arrow) and was deemed suspicious. A cyst (*) is also seen. (b, c) Material-specific (b) and color overlay (c) iodine CT images show more conspicuous peripheral enhancement (arrow), a finding indicative of metastasis. * = cyst. (d) Contrast-enhanced T1-weighted fat-saturated MR image obtained in the arterial phase shows the rim-enhancing lesion (arrow) and a simple cyst (*) posterior to the metastasis.
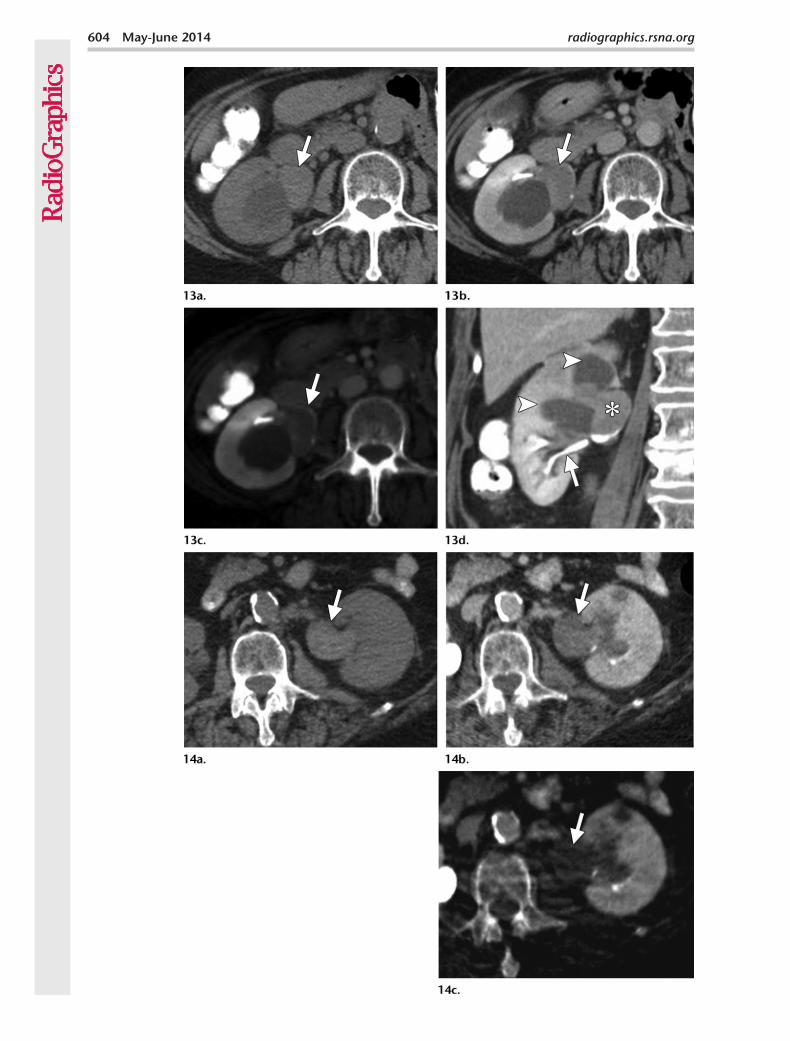
Figures 13, 14. (13) Urothelial carcinoma in an 85-year-old man with gross hematuria. (a) TUE CT image shows a hyperattenuating soft-tissue mass (arrow) in the right renal pelvis. (b) Contrast-enhanced CT image shows that the mass has an attenuation difference of 24 HU (arrow), making it difficult to determine whether enhancement is present. (c) Material-specific iodine CT image shows more definitive enhancement in the renal pelvis (arrow) on the basis of soft-tissue attenuation, a finding that confirms the presence of a solid mass. (d) Coronal contrast-enhanced CT im-age shows excreted contrast material in the right pelvis (arrow), an enhancing mass (*), and multiple parapelvic cysts (arrowheads). Nephrectomy was performed, and a diagnosis of urothelial carcinoma was made. (14) Left renal pelvic mass in an 83-year-old man with gross hematuria. (a) TUE CT image shows an iso- to slightly hyperattenuating soft-tissue mass in the left renal pelvis (arrow). (b) Contrast-enhanced CT image obtained in the nephrographic phase shows questionable enhancement (attenuation difference of 10–18 HU) in the soft-tissue mass (arrow). (c) Mate-rial-specific iodine CT image shows a lack of appreciable iodine (arrow) in the left renal pelvis, a finding indicative of a blood clot in the collecting system. Blood clots were also present in the bladder and were removed via cystoscopy. Cytologic analysis of urine obtained from the left ureter and bladder indicated that no neoplastic cells were present.
606 May-June 2014 radiographics.rsna.org
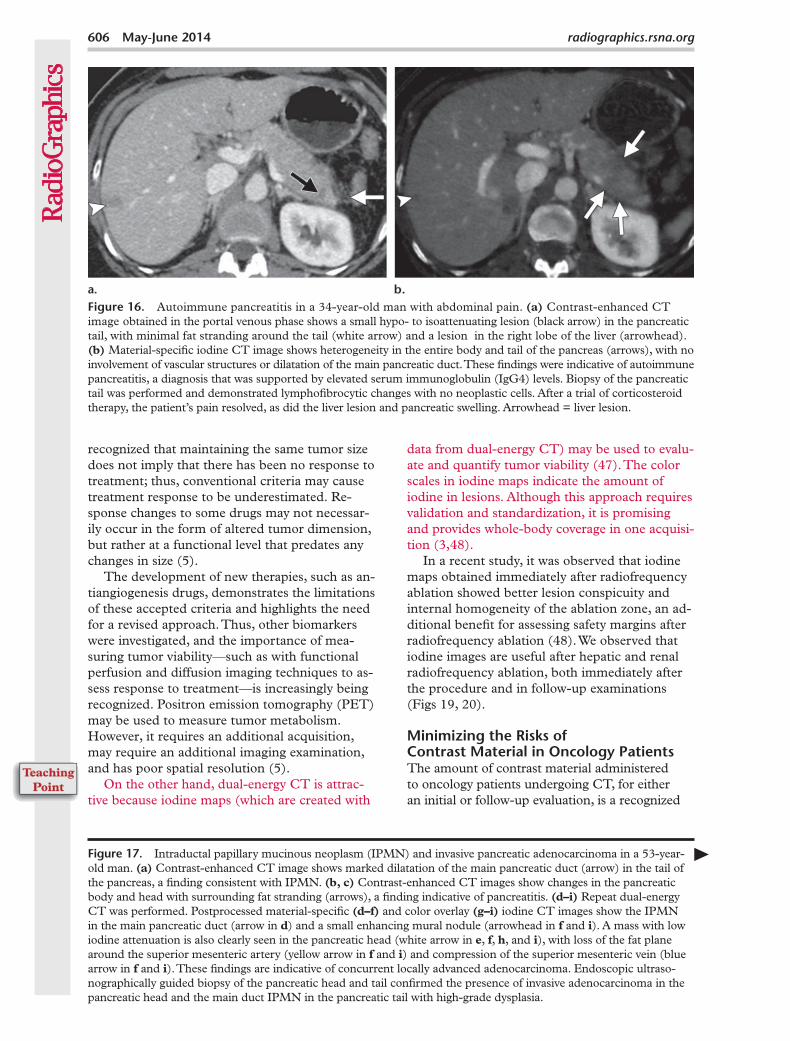
Figure 16. Autoimmune pancreatitis in a 34-year-old man with abdominal pain. (a) Contrast-enhanced CT image obtained in the portal venous phase shows a small hypo- to isoattenuating lesion (black arrow) in the pancreatic tail, with minimal fat stranding around the tail (white arrow) and a lesion in the right lobe of the liver (arrowhead). (b) Material-specific iodine CT image shows heterogeneity in the entire body and tail of the pancreas (arrows), with no involvement of vascular structures or dilatation of the main pancreatic duct. These findings were indicative of autoimmune pancreatitis, a diagnosis that was supported by elevated serum immunoglobulin (IgG4) levels. Biopsy of the pancreatic tail was performed and demonstrated lymphofibrocytic changes with no neoplastic cells. After a trial of corticosteroid therapy, the patient’s pain resolved, as did the liver lesion and pancreatic swelling. Arrowhead = liver lesion.
recognized that maintaining the same tumor size does not imply that there has been no response to treatment; thus, conventional criteria may cause treatment response to be underestimated. Re-sponse changes to some drugs may not necessar-ily occur in the form of altered tumor dimension, but rather at a functional level that predates any changes in size (5).
The development of new therapies, such as an-tiangiogenesis drugs, demonstrates the limitations of these accepted criteria and highlights the need for a revised approach. Thus, other biomarkers were investigated, and the importance of mea-suring tumor viability—such as with functional perfusion and diffusion imaging techniques to as-sess response to treatment—is increasingly being recognized. Positron emission tomography (PET) may be used to measure tumor metabolism. However, it requires an additional acquisition, may require an additional imaging examination, and has poor spatial resolution (5).
On the other hand, dual-energy CT is attrac-tive because iodine maps (which are created with
data from dual-energy CT) may be used to evalu-ate and quantify tumor viability (47). The color scales in iodine maps indicate the amount of iodine in lesions. Although this approach requires validation and standardization, it is promising and provides whole-body coverage in one acquisi-tion (3,48).
In a recent study, it was observed that iodine maps obtained immediately after radiofrequency ablation showed better lesion conspicuity and internal homogeneity of the ablation zone, an ad-ditional benefit for assessing safety margins after radiofrequency ablation (48). We observed that iodine images are useful after hepatic and renal radiofrequency ablation, both immediately after the procedure and in follow-up examinations (Figs 19, 20).
Minimizing the Risks of Contrast Material in Oncology PatientsThe amount of contrast material administered to oncology patients undergoing CT, for either an initial or follow-up evaluation, is a recognized
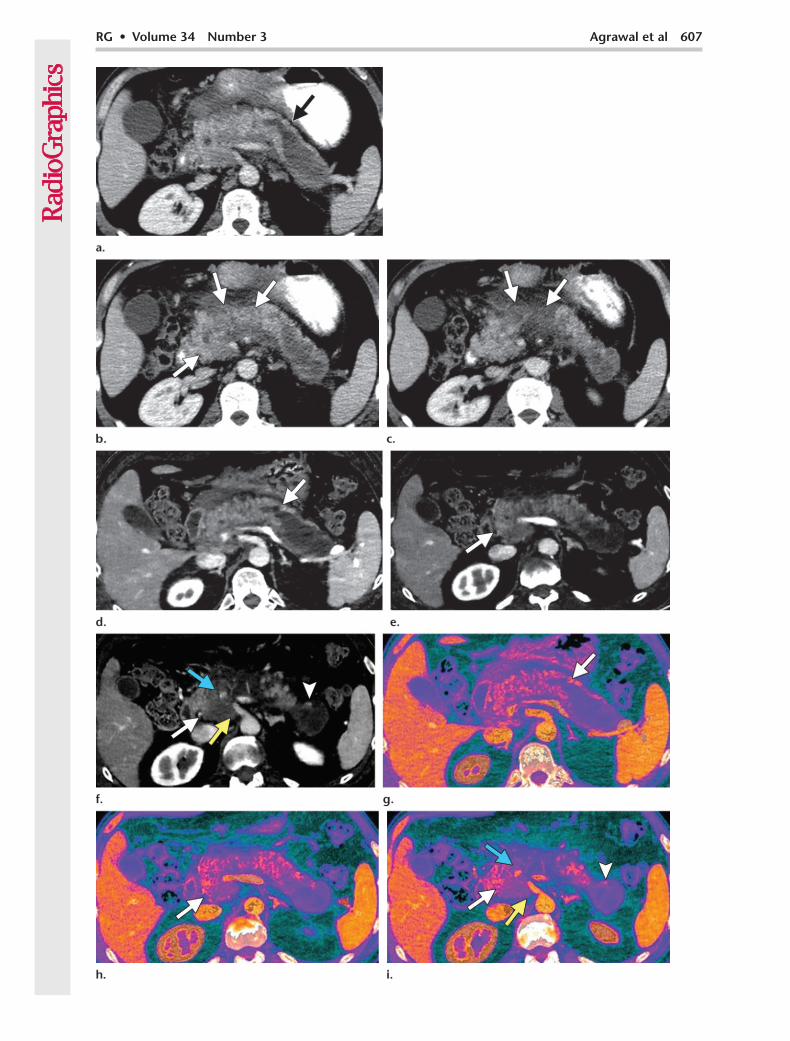
Figure 17. Intraductal papillary mucinous neoplasm (IPMN) and invasive pancreatic adenocarcinoma in a 53-year-old man. (a) Contrast-enhanced CT image shows marked dilatation of the main pancreatic duct (arrow) in the tail of the pancreas, a finding consistent with IPMN. (b, c) Contrast-enhanced CT images show changes in the pancreatic body and head with surrounding fat stranding (arrows), a finding indicative of pancreatitis. (d–i) Repeat dual-energy CT was performed. Postprocessed material-specific (d–f) and color overlay (g–i) iodine CT images show the IPMN in the main pancreatic duct (arrow in d) and a small enhancing mural nodule (arrowhead in f and i). A mass with low iodine attenuation is also clearly seen in the pancreatic head (white arrow in e, f, h, and i), with loss of the fat plane around the superior mesenteric artery (yellow arrow in f and i) and compression of the superior mesenteric vein (blue arrow in f and i). These findings are indicative of concurrent locally advanced adenocarcinoma. Endoscopic ultraso-nographically guided biopsy of the pancreatic head and tail confirmed the presence of invasive adenocarcinoma in the pancreatic head and the main duct IPMN in the pancreatic tail with high-grade dysplasia.
RG • Volume 34 Number 3 Agrawal et al 607
608 May-June 2014 radiographics.rsna.org
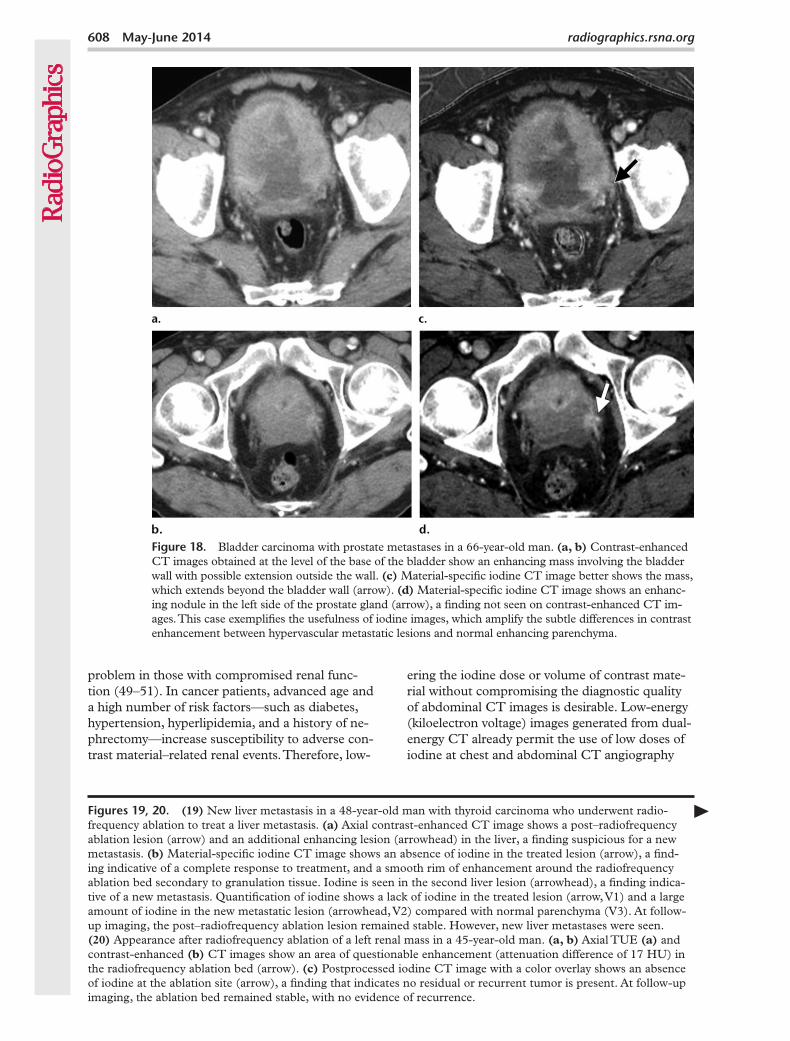
Figure 18. Bladder carcinoma with prostate metastases in a 66-year-old man. (a, b) Contrast-enhanced CT images obtained at the level of the base of the bladder show an enhancing mass involving the bladder wall with possible extension outside the wall. (c) Material-specific iodine CT image better shows the mass, which extends beyond the bladder wall (arrow). (d) Material-specific iodine CT image shows an enhanc-ing nodule in the left side of the prostate gland (arrow), a finding not seen on contrast-enhanced CT im-ages. This case exemplifies the usefulness of iodine images, which amplify the subtle differences in contrast enhancement between hypervascular metastatic lesions and normal enhancing parenchyma.
problem in those with compromised renal func-tion (49–51). In cancer patients, advanced age and a high number of risk factors—such as diabetes, hypertension, hyperlipidemia, and a history of ne-phrectomy—increase susceptibility to adverse con-trast material–related renal events. Therefore, low-
ering the iodine dose or volume of contrast mate-rial without compromising the diagnostic quality of abdominal CT images is desirable. Low-energy (kiloelectron voltage) images generated from dual-energy CT already permit the use of low doses of iodine at chest and abdominal CT angiography
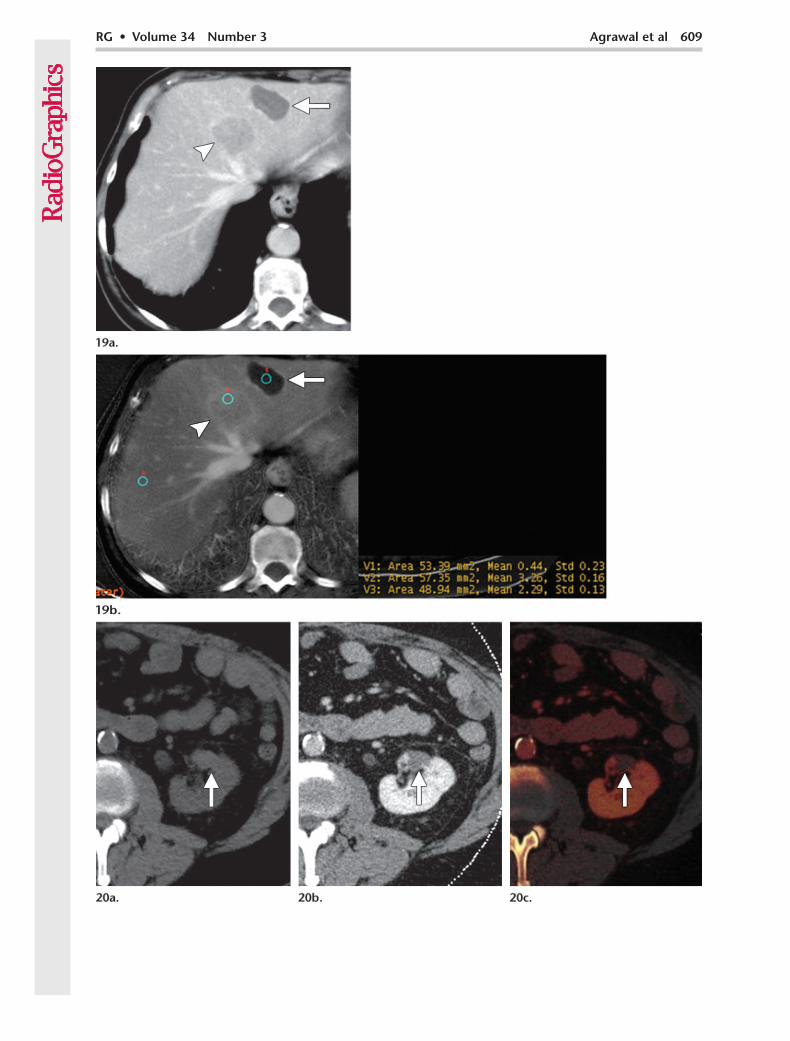
Figures 19, 20. (19) New liver metastasis in a 48-year-old man with thyroid carcinoma who underwent radio-frequency ablation to treat a liver metastasis. (a) Axial contrast-enhanced CT image shows a post–radiofrequency ablation lesion (arrow) and an additional enhancing lesion (arrowhead) in the liver, a finding suspicious for a new metastasis. (b) Material-specific iodine CT image shows an absence of iodine in the treated lesion (arrow), a find-ing indicative of a complete response to treatment, and a smooth rim of enhancement around the radiofrequency ablation bed secondary to granulation tissue. Iodine is seen in the second liver lesion (arrowhead), a finding indica-tive of a new metastasis. Quantification of iodine shows a lack of iodine in the treated lesion (arrow, V1) and a large amount of iodine in the new metastatic lesion (arrowhead, V2) compared with normal parenchyma (V3). At follow-up imaging, the post–radiofrequency ablation lesion remained stable. However, new liver metastases were seen. (20) Appearance after radiofrequency ablation of a left renal mass in a 45-year-old man. (a, b) Axial TUE (a) and contrast-enhanced (b) CT images show an area of questionable enhancement (attenuation difference of 17 HU) in the radiofrequency ablation bed (arrow). (c) Postprocessed iodine CT image with a color overlay shows an absence of iodine at the ablation site (arrow), a finding that indicates no residual or recurrent tumor is present. At follow-up imaging, the ablation bed remained stable, with no evidence of recurrence.
RG • Volume 34 Number 3 Agrawal et al 609
610 May-June 2014 radiographics.rsna.org
(15,52). A similar approach may be used in high-risk patients for cancer imaging. We address this problem by following a low-dose–contrast material protocol, in which we administer 50–70 mL of 370 mgI/mL contrast material, on a case-by-case basis for those undergoing dual-energy CT.
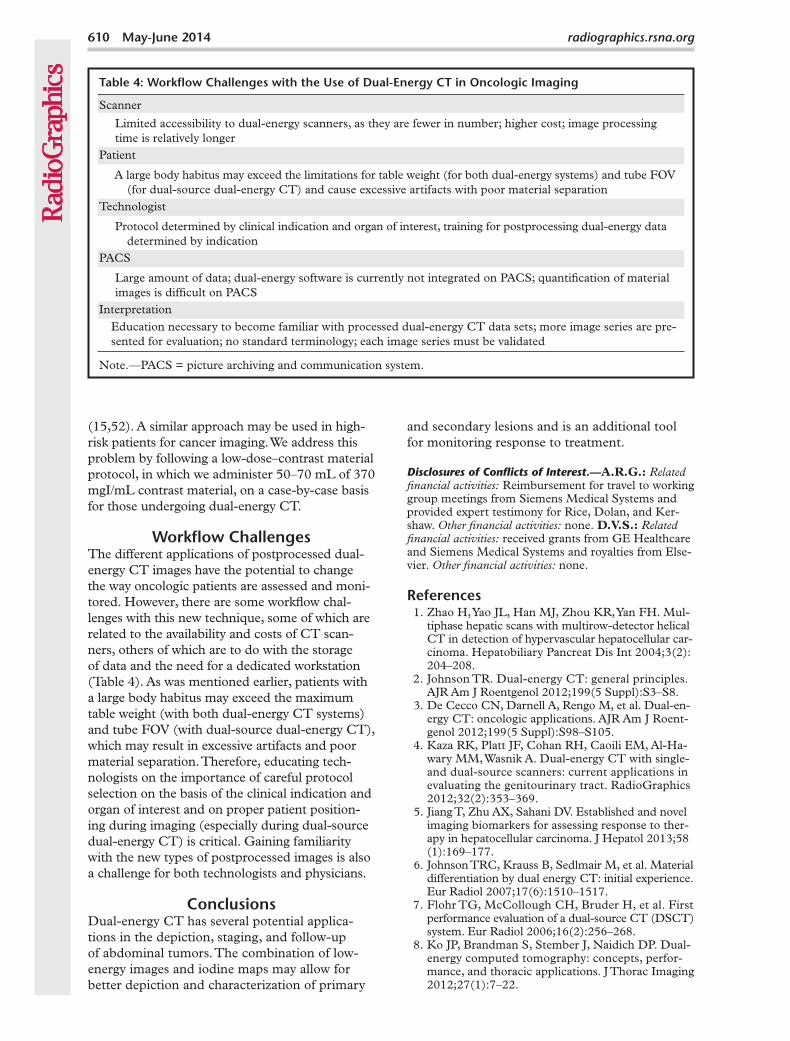
Workflow ChallengesThe different applications of postprocessed dual-energy CT images have the potential to change the way oncologic patients are assessed and moni-tored. However, there are some workflow chal-lenges with this new technique, some of which are related to the availability and costs of CT scan-ners, others of which are to do with the storage of data and the need for a dedicated workstation (Table 4). As was mentioned earlier, patients with a large body habitus may exceed the maximum table weight (with both dual-energy CT systems) and tube FOV (with dual-source dual-energy CT), which may result in excessive artifacts and poor material separation. Therefore, educating tech-nologists on the importance of careful protocol selection on the basis of the clinical indication and organ of interest and on proper patient position-ing during imaging (especially during dual-source dual-energy CT) is critical. Gaining familiarity with the new types of postprocessed images is also a challenge for both technologists and physicians.
ConclusionsDual-energy CT has several potential applica-tions in the depiction, staging, and follow-up of abdominal tumors. The combination of low-energy images and iodine maps may allow for better depiction and characterization of primary
and secondary lesions and is an additional tool for monitoring response to treatment.
Disclosures of Conflicts of Interest.—A.R.G.: Related financial activities: Reimbursement for travel to working group meetings from Siemens Medical Systems and provided expert testimony for Rice, Dolan, and Ker-shaw. Other financial activities: none. D.V.S.: Related financial activities: received grants from GE Healthcare and Siemens Medical Systems and royalties from Else-vier. Other financial activities: none.
References 1. Zhao H, Yao JL, Han MJ, Zhou KR, Yan FH. Mul-
tiphase hepatic scans with multirow-detector helical CT in detection of hypervascular hepatocellular car-cinoma. Hepatobiliary Pancreat Dis Int 2004;3(2): 204–208.
2. Johnson TR. Dual-energy CT: general principles. AJR Am J Roentgenol 2012;199(5 Suppl):S3–S8.
3. De Cecco CN, Darnell A, Rengo M, et al. Dual-en-ergy CT: oncologic applications. AJR Am J Roent-genol 2012;199(5 Suppl):S98–S105.
4. Kaza RK, Platt JF, Cohan RH, Caoili EM, Al-Ha-wary MM, Wasnik A. Dual-energy CT with single- and dual-source scanners: current applications in evaluating the genitourinary tract. RadioGraphics 2012;32(2):353–369.
5. Jiang T, Zhu AX, Sahani DV. Established and novel imaging biomarkers for assessing response to ther-apy in hepatocellular carcinoma. J Hepatol 2013;58 (1):169–177.
6. Johnson TRC, Krauss B, Sedlmair M, et al. Material differentiation by dual energy CT: initial experience. Eur Radiol 2007;17(6):1510–1517.
7. Flohr TG, McCollough CH, Bruder H, et al. First performance evaluation of a dual-source CT (DSCT) system. Eur Radiol 2006;16(2):256–268.
8. Ko JP, Brandman S, Stember J, Naidich DP. Dual-energy computed tomography: concepts, perfor-mance, and thoracic applications. J Thorac Imaging 2012;27(1):7–22.
Table 4: Workflow Challenges with the Use of Dual-Energy CT in Oncologic Imaging
Scanner
Limited accessibility to dual-energy scanners, as they are fewer in number; higher cost; image processing time is relatively longer
Patient
A large body habitus may exceed the limitations for table weight (for both dual-energy systems) and tube FOV (for dual-source dual-energy CT) and cause excessive artifacts with poor material separation
Technologist
Protocol determined by clinical indication and organ of interest, training for postprocessing dual-energy data determined by indication
PACS
Large amount of data; dual-energy software is currently not integrated on PACS; quantification of material images is difficult on PACS
Interpretation Education necessary to become familiar with processed dual-energy CT data sets; more image series are pre-
sented for evaluation; no standard terminology; each image series must be validated
Note.—PACS = picture archiving and communication system.
RG • Volume 34 Number 3 Agrawal et al 611
9. Curry TS III, Dowdey JE, Murry RC Jr. Chris-tensen’s physics of diagnostic radiology. 4th ed. Phil-adelphia, Pa: Lippincott Williams & Wilkins, 1990.
10. Raptopoulos V, Karellas A, Bernstein J, Reale FR, Constantinou C, Zawacki JK. Value of dual-energy CT in differentiating focal fatty infiltration of the liver from low-density masses. AJR Am J Roentgenol 1991;157(4):721–725.
11. Wang B, Gao Z, Zou Q, Li L. Quantitative diagnosis of fatty liver with dual-energy CT: an experimental study in rabbits. Acta Radiol 2003;44(1):92–97.
12. Goldberg HI, Cann CE, Moss AA, Ohto M, Brito A, Federle M. Noninvasive quantitation of liver iron in dogs with hemochromatosis using dual-energy CT scanning. Invest Radiol 1982;17(4):375–380.
13. Mendler MH, Bouillet P, Le Sidaner A, et al. Dual-energy CT in the diagnosis and quantification of fatty liver: limited clinical value in comparison to ultrasound scan and single-energy CT, with special reference to iron overload. J Hepatol 1998;28(5): 785–794.
14. Silva AC, Morse BG, Hara AK, Paden RG, Hongo N, Pavlicek W. Dual-energy (spectral) CT: applica-tions in abdominal imaging. RadioGraphics 2011;31 (4):1031–1046; discussion 1047–1050.
15. McCollough CH, Schmidt B, Liu X, Yu L, Leng S. Dual-Energy Algorithms and Postprocessing Tech-niques. In: Johnson T, Fink C, Schönberg SO, Reiser MF, eds. Dual Energy CT in Clinical Practice [Internet]. Berlin, Germany: Springer, 2011; 43–51. http://link.springer.com/chapter/10.1007/174_2010 _36. Accessed January 10, 2013.
16. Okada M, Kim T, Murakami T. Hepatocellular nodules in liver cirrhosis: state of the art CT evalu-ation (perfusion CT/volume helical shuttle scan/dual-energy CT, etc.). Abdom Imaging 2011;36(3): 273–281.
17. Megibow AJ, Sahani D. Best practice: implementa-tion and use of abdominal dual-energy CT in rou-tine patient care. AJR Am J Roentgenol 2012;199(5 Suppl):S71–S77.
18. Brown CL, Hartman RP, Dzyubak OP, et al. Dual-energy CT iodine overlay technique for characterization of renal masses as cyst or solid: a phantom feasibility study. Eur Radiol 2009;19(5): 1289–1295.
19. Zou Y, Silver MD. Analysis of fast kV-switching in dual energy CT using a pre-reconstruction decom-position technique. In: Hsieh J, Samei E, eds. Pro-ceedings of SPIE: medical imaging 2008—physics of medical imaging, vol 6913. Bellingham, Wash: SPIE–The International Society for Optical Engi-neering, 2008; 691313–691313–12. http://spie.org /x648.html?product_id=772826. Accessed January 10, 2013.
20. Song KD, Kim CK, Park BK, Kim B. Utility of iodine overlay technique and virtual unenhanced images for the characterization of renal masses by dual-energy CT. AJR Am J Roentgenol 2011;197(6): W1076-82.
21. Mahgerefteh S, Blachar A, Fraifeld S, Sosna J. Dual-energy derived virtual nonenhanced computed to-mography imaging: current status and applications. Semin Ultrasound CT MR 2010;31(4):321–327.
22. Ho LM, Marin D, Neville AM, et al. Characteriza-tion of adrenal nodules with dual-energy CT: can virtual unenhanced attenuation values replace true unenhanced attenuation values? AJR Am J Roent-genol 2012;198(4):840–845.
23. Graser A, Johnson TRC, Hecht EM, et al. Dual-energy CT in patients suspected of having renal masses: can virtual nonenhanced images replace true nonenhanced images? Radiology 2009;252(2): 433–440.
24. Graser A, Becker CR, Staehler M, et al. Single-phase dual-energy CT allows for characterization of renal masses as benign or malignant. Invest Radiol 2010;45(7):399–405.
25. Yu L, Leng S, McCollough CH. Dual-energy CT-based monochromatic imaging. AJR Am J Roent-genol 2012;199(5 Suppl):S9–S15.
26. Yu L, Christner JA, Leng S, Wang J, Fletcher JG, McCollough CH. Virtual monochromatic imag-ing in dual-source dual-energy CT: radiation dose and image quality. Med Phys 2011;38(12): 6371–6379.
27. Pinho DF, Kulkarni NM, Krishnaraj A, Kalva SP, Sahani DV. Initial experience with single-source dual-energy CT abdominal angiography and com-parison with single-energy CT angiography: image quality, enhancement, diagnosis and radiation dose. Eur Radiol 2013;23(2):351–359.
28. Nakayama Y, Awai K, Funama Y, et al. Abdominal CT with low tube voltage: preliminary observa-tions about radiation dose, contrast enhancement, image quality, and noise. Radiology 2005;237(3): 945–951.
29. Kalva SP, Sahani DV, Hahn PF, Saini S. Using the K-edge to improve contrast conspicuity and to lower radiation dose with a 16-MDCT: a phantom and human study. J Comput Assist Tomogr 2006;30(3): 391–397.
30. Marin D, Nelson RC, Samei E, et al. Hypervascu-lar liver tumors: low tube voltage, high tube current multidetector CT during late hepatic arterial phase for detection—initial clinical experience. Radiology 2009;251(3):771–779.
31. Yeh BM, Shepherd JA, Wang ZJ, Teh HS, Hartman RP, Prevrhal S. Dual-energy and low-kVp CT in the abdomen. AJR Am J Roentgenol 2009;193(1): 47–54.
32. Altenbernd J, Heusner TA, Ringelstein A, Ladd SC, Forsting M, Antoch G. Dual-energy-CT of hyper-vascular liver lesions in patients with HCC: investi-gation of image quality and sensitivity. Eur Radiol 2011;21(4):738–743.
33. Matsumoto K, Jinzaki M, Tanami Y, Ueno A, Ya-mada M, Kuribayashi S. Virtual monochromatic spectral imaging with fast kilovoltage switching: improved image quality as compared with that ob-tained with conventional 120-kVp CT. Radiology 2011;259(1):257–262.
34. Schindera ST, Nelson RC, Mukundan S Jr, et al. Hypervascular liver tumors: low tube voltage, high tube current multi-detector row CT for enhanced detection—phantom study. Radiology 2008;246(1): 125–132.
35. Robinson E, Babb J, Chandarana H, Macari M. Dual source dual energy MDCT: comparison of 80 kVp and weighted average 120 kVp data for conspi-cuity of hypo-vascular liver metastases. Invest Radiol 2010;45(7):413–418.
36. Patel BN, Thomas JV, Lockhart ME, Berland LL, Morgan DE. Single-source dual-energy spectral multidetector CT of pancreatic adenocarcinoma: optimization of energy level viewing significantly increases lesion contrast. Clin Radiol 2013;68(2): 148–154.
612 May-June 2014 radiographics.rsna.org
37. Sohaib SA, Riddell AM. Incidental pelvic lesions in the oncology patient. Cancer Imaging 2011;11(Spec No A):S95–S102.
38. Sohaib A. Incidental solid cystic renal lesion. Cancer Imaging 2012;12(2):385–386.
39. Hansen N, Weadock W, Morani A, Carlos R. Liver lesions discovered incidentally on ultrasound: evalu-ation of reader ability to characterize lesions on MRI without intravenous contrast. Acad Radiol 2012;19 (9):1087–1093.
40. Gore RM, Thakrar KH, Wenzke DR, Newmark GM, Mehta UK, Berlin JW. That liver lesion on MDCT in the oncology patient: is it important? Cancer Imaging 2012;12(2):373–384.
41. Cairns P. Renal cell carcinoma. Cancer Biomark 2010;9(1-6):461–473.
42. Chandarana H, Megibow AJ, Cohen BA, et al. Iodine quantification with dual-energy CT: phantom study and preliminary experience with renal masses. AJR Am J Roentgenol 2011;196(6):W693–W700.
43. Leschka S, Stolzmann P, Baumüller S, et al. Perfor-mance of dual-energy CT with tin filter technology for the discrimination of renal cysts and enhancing masses. Acad Radiol 2010;17(4):526–534.
44. Neville AM, Gupta RT, Miller CM, Merkle EM, Paulson EK, Boll DT. Detection of renal lesion enhancement with dual-energy multidetector CT. Radiology 2011;259(1):173–183.
45. Gnannt R, Fischer M, Goetti R, Karlo C, Leschka S, Alkadhi H. Dual-energy CT for characterization of the incidental adrenal mass: preliminary observa-tions. AJR Am J Roentgenol 2012;198(1):138–144.
46. Marin D, Nelson RC, Barnhart H, et al. Detection of pancreatic tumors, image quality, and radiation dose during the pancreatic parenchymal phase: effect of a low-tube-voltage, high-tube-current CT technique—preliminary results. Radiology 2010;256 (2):450–459.
47. Apfaltrer P, Meyer M, Meier C, et al. Contrast-enhanced dual-energy CT of gastrointestinal stro-mal tumors: is iodine-related attenuation a potential indicator of tumor response? Invest Radiol 2012;47 (1):65–70.
48. Lee SH, Lee JM, Kim KW, et al. Dual-energy computed tomography to assess tumor response to hepatic radiofrequency ablation: potential diagnos-tic value of virtual noncontrast images and iodine maps. Invest Radiol 2011;46(2):77–84.
49. Thomsen HS, Morcos SK. Contrast media and the kidney: European Society of Urogenital Radiol-ogy (ESUR) guidelines. Br J Radiol 2003;76(908): 513–518.
50. Gleeson TG, Bulugahapitiya S. Contrast-induced nephropathy. AJR Am J Roentgenol 2004;183(6): 1673–1689.
51. Ng CS, Shaw AD, Bell CS, Samuels JA. Effect of IV contrast medium on renal function in oncologic pa-tients undergoing CT in ICU. AJR Am J Roentgenol 2010;195(2):414–422.
52. Delesalle M-A, Pontana F, Duhamel A, et al. Spec-tral optimization of chest CT angiography with reduced iodine load: experience in 80 patients eval-uated with dual-source, dual-energy CT. Radiology 2013;267(1):256–266.
This journal-based SA-CME activity has been approved for AMA PRA Category 1 CreditTM. See www.rsna.org/education/search/RG.
Teaching Points May-June Issue 2014
Oncologic Applications of Dual-Energy CT in the AbdomenMukta D. Agrawal, MBBS, MD • Daniella F. Pinho, MD • Naveen M. Kulkarni, MD • Peter F. Hahn, MD, PhD • Alexander R. Guimaraes, MD, PhD • Dushyant V. Sahani, MD
RadioGraphics 2014; 34:589–612 • Published online 10.1148/rg.343135041 • Content Codes:
Page 590To differentiate among materials at dual-energy CT, the tissue or contrast material within the area of interest must have spectral properties (ie, differences in attenuation at different photon energies) (2). Soft tissues—such as the liver, kidneys, pancreas, muscle, and fat—are made of hydrogen (Z = 1), carbon (Z = 6), nitrogen (Z = 7), and oxygen (Z = 8); have similar atomic numbers; and demonstrate no appreciable difference in their attenuation of x-ray beams at different energies. Iodine (Z = 53) and calcium (Z = 20) have a higher atomic number and predominantly attenuate by photoelectric effect, an interaction that produces greater attenuation when exposed to a lower energy beam (80–100 kVp), thereby providing a spectral contrast with the body tissues at dual-energy CT.
Page 593In conventional contrast-enhanced CT acquisitions, attenuation measurements take into account both the inherent tissue attenuation and uptake of contrast media (iodine) by the tissue. Compared with sin-gle-energy CT, dual-energy CT offers more information. Dual-energy CT allows material decomposition and provides iodine images that map the iodine content of the tissue and, thus, provide a more reliable measurement of tissue enhancement. Iodine-only images may serve as a surrogate marker for tissue con-trast media uptake and are independent of inherent tissue attenuation, which contributes to CT attenu-ation measurements. Another advantage is that iodine images eliminate the need for true unenhanced images to assess tissue enhancement. However, imaging in different phases of enhancement (eg, arterial and portal venous) is still necessary for lesion characterization.
Page 593The selected VMC energy should target the diagnostic task. In general, low-energy VMC images provide higher contrast between adjacent structures because of higher beam attenuation by iodine but have more noise, particularly in larger patients. On the other hand, high-energy VMC images provide less contrast and have less noise.
Page 596The use of low-energy images in oncologic CT may improve lesion detection by improving the contrast between a hypervascular lesion, a hypovascular lesion, and normally enhancing parenchyma (Fig 4).
Iodine-specific maps have the potential to increase the depiction and characterization of hypoat-tenuating malignancies by increasing the contrast between a hypoattenuating lesion and normally enhancing parenchyma on the basis of differences in tissue iodine content (Fig 5). Iodine-specific maps depict and quantify iodine in each voxel; thus, a small amount of enhancement in a lesion may be detected. Another potential application of iodine-specific maps is improved depiction of nodules with varying en-hancement patterns in patients with a cirrhotic liver (Fig 6).
Page 606On the other hand, dual-energy CT is attractive because iodine maps (which are created with data from dual-energy CT) may be used to evaluate and quantify tumor viability (47). The color scales in iodine maps indicate the amount of iodine in lesions. Although this approach requires validation and standard-ization, it is promising and provides whole-body coverage in one acquisition (3,48).
Related Documents