USAARL Report No. 2016-15 Normobaric Hypoxia as a Cognitive Stress Test for Mild Traumatic Brain Injury: Oculometrics, Pulse Oximetry, and the Self- Report of Symptom Severity By Leonard Temme 1 , David Still 1 , Dennis Reeves 2 , Joseph Bleiberg 3 , Daniel Levinson 4 , James Kelly 2,5 1 U.S. Army Aeromedical Research Laboratory 2 National Intrepid Center of Excellence 3 Bethesda Neuropsychology 4 Alliant International University, CSFS 5 University of Colorado School of Medicine United States Army Aeromedical Research Laboratory Visual Protection and Performance Division April 2016 Approved for public release; distribution unlimited.

Welcome message from author
This document is posted to help you gain knowledge. Please leave a comment to let me know what you think about it! Share it to your friends and learn new things together.
Transcript

USAARL Report No. 2016-15
Normobaric Hypoxia as a Cognitive Stress Test for Mild Traumatic Brain Injury: Oculometrics, Pulse Oximetry, and the Self-Report of Symptom Severity
By Leonard Temme1, David Still1, Dennis Reeves2, Joseph Bleiberg3, Daniel Levinson4, James Kelly2,5
1U.S. Army Aeromedical Research Laboratory 2National Intrepid Center of Excellence 3Bethesda Neuropsychology 4Alliant International University, CSFS 5University of Colorado School of Medicine
United States Army Aeromedical Research Laboratory
Visual Protection and Performance Division
April 2016
Approved for public release; distribution unlimited.

Notice
Qualified Requesters
Qualified requesters may obtain copies from the Defense Technical Information Center (DTIC), Cameron Station, Alexandria, Virginia 22314. Orders will be expedited if placed through the librarian or other person designated to request documents from DTIC.
Change of Address
Organizations receiving reports from the U.S. Army Aeromedical Research Laboratory on automatic mailing lists should confirm correct address when corresponding about laboratory reports.
Disposition
Destroy this document when it is no longer needed. Do not return it to the originator.
Disclaimer
The views, opinions, and/or findings contained in this report are those of the author(s) and should not be construed as an official Department of the Army position, policy, or decision, unless so designated by other official documentation. Citation of trade names in this report does not constitute an official Department of the Army endorsement or approval of the use of such commercial items.
Human Use
Human subjects participated in these studies after giving their free and informed voluntary consent. Investigators adhered to AR 70-25 and USAMRMC Reg 70-25 on Use of Volunteers in Research.

Standard Form 298 (Rev. 8/98)
REPORT DOCUMENTATION PAGE
Prescribed by ANSI Std. Z39.18
Form Approved OMB No. 0704-0188
The public reporting burden for this collection of information is estimated to average 1 hour per response, including the time for reviewing instructions, searching existing data sources, gathering and maintaining the data needed, and completing and reviewing the collection of information. Send comments regarding this burden estimate or any other aspect of this collection of information, including suggestions for reducing the burden, to Department of Defense, Washington Headquarters Services, Directorate for Information Operations and Reports (0704-0188), 1215 Jefferson Davis Highway, Suite 1204, Arlington, VA 22202-4302. Respondents should be aware that notwithstanding any other provision of law, no person shall be subject to any penalty for failing to comply with a collection of information if it does not display a currently valid OMB control number. PLEASE DO NOT RETURN YOUR FORM TO THE ABOVE ADDRESS. 1. REPORT DATE (DD-MM-YYYY) 2. REPORT TYPE 3. DATES COVERED (From - To)
4. TITLE AND SUBTITLE 5a. CONTRACT NUMBER
5b. GRANT NUMBER
5c. PROGRAM ELEMENT NUMBER
5d. PROJECT NUMBER
5e. TASK NUMBER
5f. WORK UNIT NUMBER
6. AUTHOR(S)
7. PERFORMING ORGANIZATION NAME(S) AND ADDRESS(ES) 8. PERFORMING ORGANIZATIONREPORT NUMBER
9. SPONSORING/MONITORING AGENCY NAME(S) AND ADDRESS(ES) 10. SPONSOR/MONITOR'S ACRONYM(S)
11. SPONSOR/MONITOR'S REPORTNUMBER(S)
12. DISTRIBUTION/AVAILABILITY STATEMENT
13. SUPPLEMENTARY NOTES
14. ABSTRACT
15. SUBJECT TERMS
16. SECURITY CLASSIFICATION OF:a. REPORT b. ABSTRACT c. THIS PAGE
17. LIMITATION OFABSTRACT
18. NUMBEROFPAGES
19a. NAME OF RESPONSIBLE PERSON
19b. TELEPHONE NUMBER (Include area code)
20-06-2011 Final 2008-2012
Normobaric Hypoxia as a Cognitivia Stress Test for Mild Traumatic BrainInjury: Oculometrics, Pulse Oximetry, and the Self-Report of SymptomSeverity
W81XWH-08-2-0052
Temme, LeonardStill, DavidReeves, DennisBleiberg, JosephLevinson, DanielKelly, James
U.S. Army Aeromedical Research LaboratoryP.O. Box 620577Fort Rucker, AL 36362
USAARL 2016-15
Department of DefenseTraumatic Brain InjuryInvestigator-Initiated Research Award
DoD
Approved for public release; distribution is unlimited.
The present report describes research assessing the effects mild hypoxia has on individuals with a medical history of mild traumaticbrain injury (mTBI). The research tests the hypothesis that individuals who have a history of mTBI but who are asymptomatic mayhave latent deficits that become apparent in the presence of relatively minor physiological stressors routinely encountered bymilitary personnel or by civilians during normal daily activities. The research used a minor, altitude-referenced hypoxic challenge asa prototypical physiological stressor. The present report describes the methodology used to generate the hypoxic challenge as wellas the experimental design and procedures. Two groups of 36 subjects were studied; one group with a history of mTBI and onegroup with no such history. The report describes the characteristics of the study volunteers who were matched on the basis of suchvariables as age, gender, body mass index, and smoking behavior. The response parameters included oculometric, pulse rate, pulseoximetry, a self-report inventory of subjective symptoms, and neurocognitive assessments.
normobaric hypoxia, mild traumatic brain injury, mTBI, neurocognitive stress, pulse oximetry, oculometry
UNCLAS UNCLAS UNCLAS SAR 132
Loraine St. Onge, PhD
334-255-6906
ii
REPORT DOCUMENTATION PAGE (SF298) (Continuation Sheet)
14. ABSTRACT (CONTINUED).The present report provides an extensive tabulation of the oculometric, pulse rate, pulse oximetry and inventory of subjective symptoms data as well as statistical summaries of these data and initial analyses. These initial analyses suggest that the oculometric instrumentation used in this study was insufficiently sensitive to expected differences whereas the pulse rate, pulse oximetry, and symptom severity data warrant further detailed analysis. A separate report addresses the neurocognitive assessments.

iii
Acknowledgements
The authors would like to acknowledge Drs. Roger Cady and Kathy Farmer-Cady for their support throughout this project. Next is appreciation for dedicated support by Ms. Rebecca Browning (ClinVest) who served as an exemplary research technician and to Dr. Kent Dexter (ClinVest) for providing medical monitoring and oversight supervision. Special acknowledgement goes to Mr. Greg Dunn (Banyan/ClinVest) for project management. We also acknowledge with sincere gratitude Dr. Loraine Parish St. Onge and Ms. Diana Hemphill (USAARL) for invaluable assistance in production of the proposal. We also are sincerely thankful for the tireless edits and diligent attention to proper formatting provided by Ms. Jessica Cumbee. Finally, Ms. Terri Nakamura (TRUE Research Foundation) served as an exemplary contract organizational representative.
This work is supported by a Department of Defense, Traumatic Brain Injury,
Investigator-Initiated Research Award contract W81XWH-08-2-0052.

iv
This page is intentionally blank.

v
Table of Contents Page
Introduction ......................................................................................................................................1 Background ......................................................................................................................................1
Mild Traumatic Brain Injury Overview .....................................................................................1 Hypoxia and Mild Traumatic Brain Injury ................................................................................5 Hypoxia Exposure in Civilian and Military Aviation ................................................................6
Civilian exposure to hypoxia in aviation. ............................................................................6 Military exposure to hypoxia in aviation. ............................................................................7
Methods............................................................................................................................................9 Human Subject Volunteers ........................................................................................................9 Experimental Design ...............................................................................................................12 Apparatus .................................................................................................................................13
Reduced Oxygen Breathing Device. ..................................................................................13 Functional Impairment Tester. ...........................................................................................14
Dependent Variables and Response Measurements ................................................................14 Reduced Oxygen Breathing Device. ..................................................................................14 Functional Impairment Tester. ...........................................................................................14 Subjective reports of hypoxic symptoms. ..........................................................................15
Procedures ................................................................................................................................16 Results ............................................................................................................................................18
Duration of Normobaric Hypoxic Exposures ..........................................................................18 Reduced Oxygen Breathing Device Measurements ................................................................19
Pulse oximetry: Percent blood oxygen ..............................................................................19 Correlations ................................................................................................21
Pulse rate ............................................................................................................................22 Correlations ................................................................................................23
Oculometrics, Functional Impairment Tester Measurements ..................................................25 Environmental Stress Questionnaire: Acute Mountain Sickness-Cognitive .....................28
Discussion ......................................................................................................................................30 Conclusion .....................................................................................................................................37 References ......................................................................................................................................38 Appendix A. Mild Traumatic Brain Injury Group Description. ....................................................41 Appendix B. Control Group Description. ......................................................................................42
Appendix C. Percent Hemoglobin Oxygen Concentration and Pulse Rate for Each Mild Traumatic Brain Injury Subject at Each Altitude Condition. ..................................................43 Appendix D. Percent Oxygen Percent Hemoglobin Oxygen Concentration and Pulse Rate for Each Control Subject at Each Altitude Condition. ..................................................................44
Appendix E. Oculometrics Recorded in the Mild Traumatic Brain Injury Subjects. ....................45 Appendix F. Oculometrics Recorded in the Control Subjects. ......................................................47
Appendix G. Correlation Matrix Among All Variables for the Mild Traumatic Brain Injury Subjects. ...................................................................................................................................49
Appendix H. Correlation Matrix Among All Variables for the Control Subjects. ........................91
vi
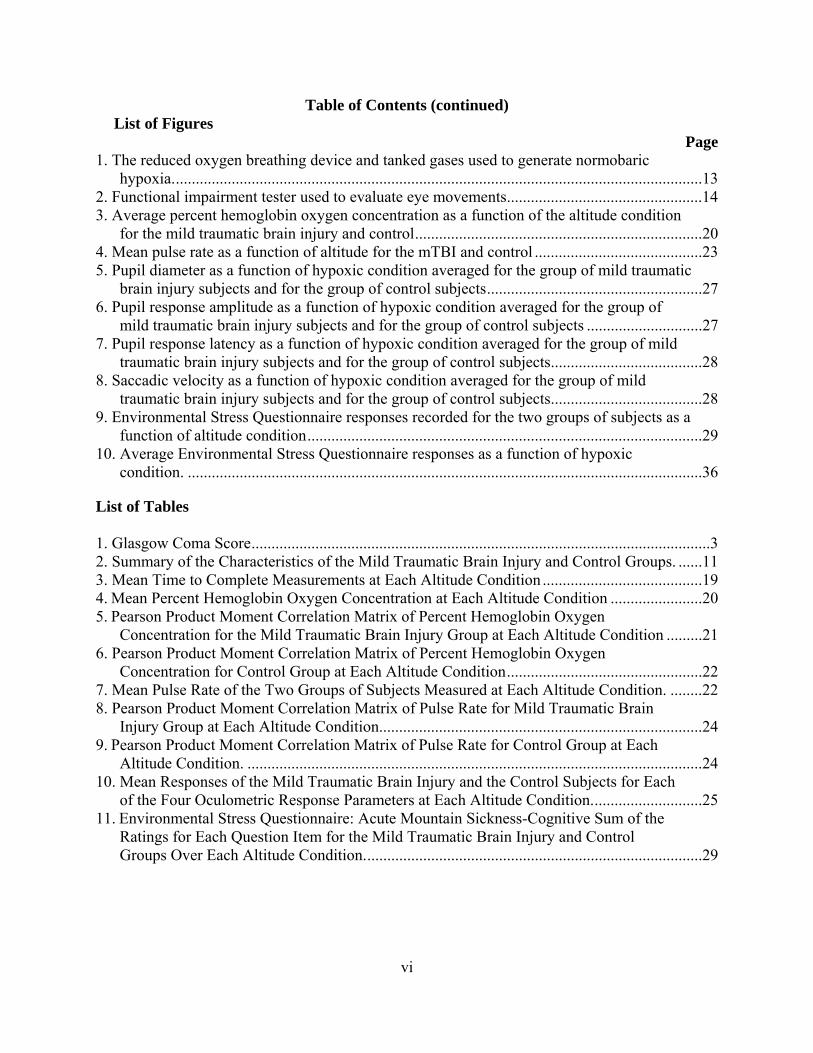
Table of Contents (continued) List of Figures
Page 1. The reduced oxygen breathing device and tanked gases used to generate normobaric
hypoxia. ....................................................................................................................................13 2. Functional impairment tester used to evaluate eye movements .................................................14 3. Average percent hemoglobin oxygen concentration as a function of the altitude condition
for the mild traumatic brain injury and control ........................................................................20 4. Mean pulse rate as a function of altitude for the mTBI and control ..........................................23 5. Pupil diameter as a function of hypoxic condition averaged for the group of mild traumatic
brain injury subjects and for the group of control subjects ......................................................27 6. Pupil response amplitude as a function of hypoxic condition averaged for the group of
mild traumatic brain injury subjects and for the group of control subjects .............................27 7. Pupil response latency as a function of hypoxic condition averaged for the group of mild
traumatic brain injury subjects and for the group of control subjects ......................................28 8. Saccadic velocity as a function of hypoxic condition averaged for the group of mild
traumatic brain injury subjects and for the group of control subjects ......................................28 9. Environmental Stress Questionnaire responses recorded for the two groups of subjects as a
function of altitude condition ...................................................................................................29 10. Average Environmental Stress Questionnaire responses as a function of hypoxic
condition. .................................................................................................................................36
List of Tables
1. Glasgow Coma Score ...................................................................................................................3 2. Summary of the Characteristics of the Mild Traumatic Brain Injury and Control Groups. ......11 3. Mean Time to Complete Measurements at Each Altitude Condition ........................................19 4. Mean Percent Hemoglobin Oxygen Concentration at Each Altitude Condition .......................20 5. Pearson Product Moment Correlation Matrix of Percent Hemoglobin Oxygen
Concentration for the Mild Traumatic Brain Injury Group at Each Altitude Condition .........21 6. Pearson Product Moment Correlation Matrix of Percent Hemoglobin Oxygen
Concentration for Control Group at Each Altitude Condition .................................................22 7. Mean Pulse Rate of the Two Groups of Subjects Measured at Each Altitude Condition. ........22 8. Pearson Product Moment Correlation Matrix of Pulse Rate for Mild Traumatic Brain
Injury Group at Each Altitude Condition .................................................................................24 9. Pearson Product Moment Correlation Matrix of Pulse Rate for Control Group at Each
Altitude Condition. ..................................................................................................................24 10. Mean Responses of the Mild Traumatic Brain Injury and the Control Subjects for Each
of the Four Oculometric Response Parameters at Each Altitude Condition. ...........................25 11. Environmental Stress Questionnaire: Acute Mountain Sickness-Cognitive Sum of the
Ratings for Each Question Item for the Mild Traumatic Brain Injury and Control Groups Over Each Altitude Condition. ....................................................................................29
1
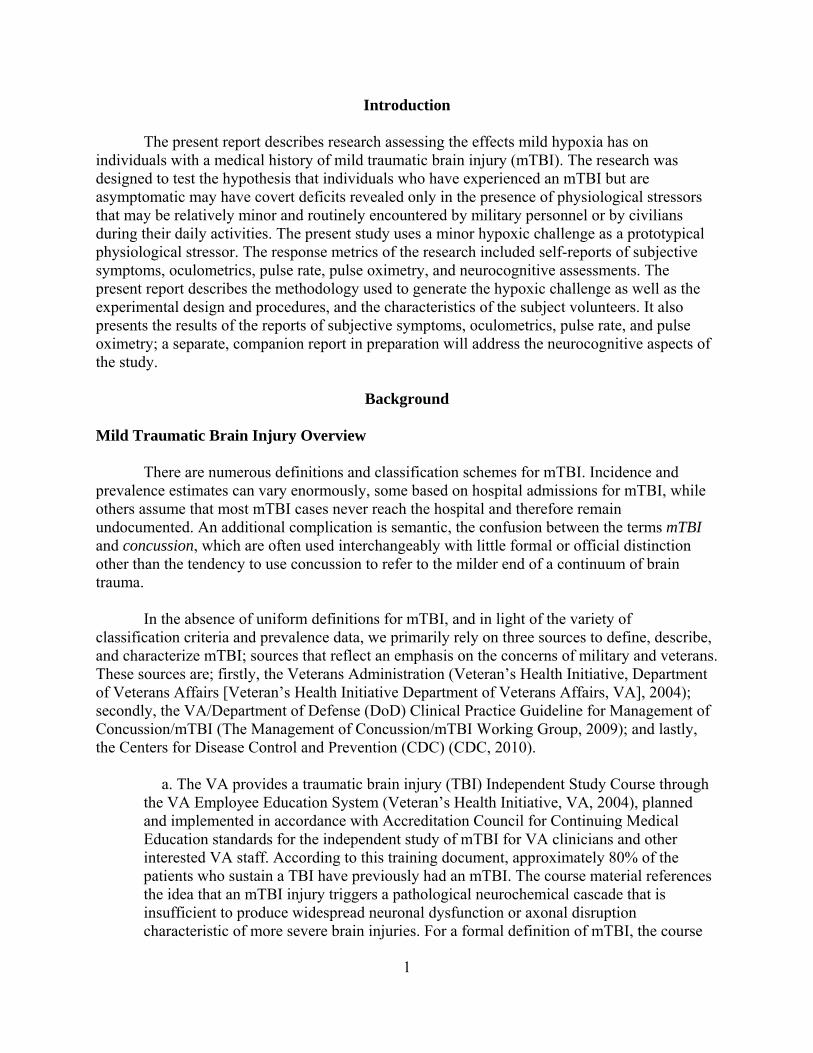
Introduction
The present report describes research assessing the effects mild hypoxia has on individuals with a medical history of mild traumatic brain injury (mTBI). The research was designed to test the hypothesis that individuals who have experienced an mTBI but are asymptomatic may have covert deficits revealed only in the presence of physiological stressors that may be relatively minor and routinely encountered by military personnel or by civilians during their daily activities. The present study uses a minor hypoxic challenge as a prototypical physiological stressor. The response metrics of the research included self-reports of subjective symptoms, oculometrics, pulse rate, pulse oximetry, and neurocognitive assessments. The present report describes the methodology used to generate the hypoxic challenge as well as the experimental design and procedures, and the characteristics of the subject volunteers. It also presents the results of the reports of subjective symptoms, oculometrics, pulse rate, and pulse oximetry; a separate, companion report in preparation will address the neurocognitive aspects of the study.
Background
Mild Traumatic Brain Injury Overview
There are numerous definitions and classification schemes for mTBI. Incidence and prevalence estimates can vary enormously, some based on hospital admissions for mTBI, while others assume that most mTBI cases never reach the hospital and therefore remain undocumented. An additional complication is semantic, the confusion between the terms mTBI and concussion, which are often used interchangeably with little formal or official distinction other than the tendency to use concussion to refer to the milder end of a continuum of brain trauma.
In the absence of uniform definitions for mTBI, and in light of the variety of
classification criteria and prevalence data, we primarily rely on three sources to define, describe, and characterize mTBI; sources that reflect an emphasis on the concerns of military and veterans. These sources are; firstly, the Veterans Administration (Veteran’s Health Initiative, Department of Veterans Affairs [Veteran’s Health Initiative Department of Veterans Affairs, VA], 2004); secondly, the VA/Department of Defense (DoD) Clinical Practice Guideline for Management of Concussion/mTBI (The Management of Concussion/mTBI Working Group, 2009); and lastly, the Centers for Disease Control and Prevention (CDC) (CDC, 2010).
a. The VA provides a traumatic brain injury (TBI) Independent Study Course through
the VA Employee Education System (Veteran’s Health Initiative, VA, 2004), planned and implemented in accordance with Accreditation Council for Continuing Medical Education standards for the independent study of mTBI for VA clinicians and other interested VA staff. According to this training document, approximately 80% of the patients who sustain a TBI have previously had an mTBI. The course material references the idea that an mTBI injury triggers a pathological neurochemical cascade that is insufficient to produce widespread neuronal dysfunction or axonal disruption characteristic of more severe brain injuries. For a formal definition of mTBI, the course
2
refers to the definition provided by the American Congress of Rehabilitation Medicine, summarizing it as:
1. Traumatically induced physiologic disruption of brain function as indicated by at least
one of the following:
A. Any period of loss of consciousness B. Any loss of memory for events immediately before or after the accident C. Any alteration in mental state at the time of the accident
D. Focal neurologic deficits that may or may not be transient
2. Severity of the injury does not exceed:
A. Loss of consciousness of 30 minutes (min) B. GCS* score of 13 to 15 after 30 min C. Post-traumatic amnesia of 24 hours (hr)
*The GCS referred to in this definition is the Glasgow Coma Score (Kraus & Chu, 2005), which is a 15-point scale based on the ranges of the patient’s best eye opening, motor, and verbal responses. See Table 1 for more information about the GCS.

3
Table 1. Glasgow Coma Score
Responses ScoreMotor
Obeys commands 6Localizing responses to pain 5Generalized withdrawal to pain 4Flexor posturing to pain 3Extensor posturing to pain 2No motor response to pain 1
VerbalOriented 5Confused conversation 4Inappropriate speech 3Incomprehensible speech 2No Speech 1
EyeSpontaneous eye opening 4Eye opening to speech 3Eye opening to pain 2No eye opening 1
Total (sum of motor, verbal, and eye scores)
______
The definition provided by the VA training subsumes the spectrum of mild injuries
typically referred to as concussion, explicitly extends into the mild range of TBI, and makes no reference to neuroimaging.
b. The VA/DoD Clinical Practice Guideline (The Management of Concussion/mTBI
Working Group, 2009) recommends a flow-chart decision tree in which the initial determination is made that the individual presents with a head trauma resulting in alteration or loss of consciousness. Explicitly listed possible causes of the head trauma are blast or explosion, head striking or being struck by an object, and head undergoing acceleration or deceleration as may occur in a motor accident or during a fall. Following this determination and the proper referrals for emergency evaluation and treatment, the determination for concussion/mTBI is made based on the reported history. The specific criteria for concussion/mTBI include:
Loss or a decreased level of consciousness for less than 30 min; Loss of memory for events immediately up to a one day after the injury;
4
Alteration of consciousness/mental state for 0 to 24 hr after the injury; Normal structural imaging; and Glasgow Coma Scale score of 13 to 15 (best value determined within the first 24 hr, if
available).
The VA/DoD Clinical Practice Guideline summarizes the post concussive/mTBI related symptoms that develop within 30 days of trauma as falling into the three following categories.
Physical symptoms that include: headache, dizziness, balance disorders, nausea,
fatigue, sleep disturbance, fuzzy or blurred vision, sensitivity to light, hearing difficulties/loss, sensitivity to noise, seizure, transient neurological abnormalities, and numbness tingling.
Cognitive symptoms that include effects on: attention, concentration, memory, speed of processing, judgment, and executive control.
Behavior/emotional symptoms that include: depression, anxiety, agitation, irritability, impulsivity, and aggression.
c. It is noteworthy that the CDC (2010) provides a listing of symptoms of
concussion/mTBI that are essentially identical with the symptoms presented in the VA/DoD Clinical Practice Guideline. This CDC listing includes:
Physical symptoms that include: headache, nausea or vomiting, balance problems,
dizziness, fuzzy or blurry vision, feeling tired, having no energy, or sensitivity to light or noise;
Symptoms effecting thinking and remembering, which include: difficulty thinking clearly, feeling slowed down, difficulty concentrating, or difficulty remembering;
Mood and emotion related symptoms, which include: irritability, sadness, more emotional, nervousness, or anxiety; and
Sleep disturbances, including sleeping more or less than usual and trouble falling to sleep.
To this, the CDC adds that the disturbance of brain function is typically associated with normal structural neuroimaging findings. The CDC estimates that about 1.7 million people sustain a TBI annually, with 275,000 resulting in hospitalization, 1,365,000 emergency room visits, and “about 75% of the TBIs that occur each year are concussions or some other form of mild TBI” (CDC, 2010).

5
Visual symptoms figure prominently in the CDC and VA/DoD discussion of TBI symptoms. The effects of TBI on the visual system is an active area of scientific research, in part due to the well-established connections among visual functions and capabilities (i.e., psychophysics), visual neurophysiology, and the known neuroanatomy of the visual system, which create the possibility that the visual system can provide a sensitive basis for the selective assessment of neurotrauma in any of the many regions of the brain known to be essential for specific functions that together comprise normal vision. One area of current research on the disruptive effects that mTBI has on vision involve eye movements, which include aspects of the coordination of the motion of the two eyes, which are essential for binocular vision. Another area of research addresses the behavior of the eyes’ pupils, which are under the control of the autonomic nervous system, and has long been used as a sensitive diagnostic sign of the status of the sympathetic and parasympathetic systems. Assessments of eye movements and pupillometry are frequently referred collectively as oculometrics, which has been developed as a tool to assess the fitness for duty of personnel.
Hypoxia and Mild Traumatic Brain Injury
The present research was motivated in part by a serendipitous observation made during previous research assessing the effects of hypoxia on simulated flight performance (Temme, Still, & Acromite, 2009; Temme, Still, & Acromite, 2010). In that study, 35 Navy, Marine, or Air Force instructor pilots executed a highly demanding flight task in a research grade, desk-top flight simulator while each of the aviator subjects breathed an oxygen partial pressure approximately equivalent to 18,000 feet (ft) (10.5% O2) for 18 min. Consequently, these subjects were hypoxic in that their blood oxygen concentration was less than the blood oxygen concentration at sea level. While breathing 18,000 ft-equivalent air, the precision of the flight performance deteriorated; however, more germane to the present study is the observation that one pilot was a unique outlier. Specifically, his performance was so variable he lost control of the aircraft, although at sea level he was completely competent and his flight performance was indistinguishable from that of his peers. A subsequent interview with the pilot revealed that he was something of a hero among the group of aviators because he had the unique distinction among his squadron peers of having ejected at high speeds from a jet during a mishap; but during the ejection he lost consciousness. This event occurred more than a year prior to the study. The pilot was completely asymptomatic and returned to flight status long before his participation in this study. This anecdotal case suggested that mTBI effects may persist in individuals who are asymptomatic at sea level. This idea suggests further that at least some of these individuals who are asymptomatic at sea level may evidence reversible mTBI deficits when challenged by hypoxia.
There is an early experiment supporting this hypothesis (Ewing, McCarthy, Gronwall, &
Wrightson, 1980). A group of 10 university students who experienced minor head injury 1 to 3 years prior to the study were exposed for 30 min to 3,800 meter (m) (about 12,500 ft) altitude in a low pressure chamber. Ten age and gender matched control subjects with no history of head injury were also exposed to the identical altitude stress. None of the subjects in the experimental group were symptomatic at sea level; however, at altitude, there were clear deficits in short term memory and judgment as reflected by a more lax response bias (likelihood of selecting the same wrong option over other options) in a signal detection task. This detection task permitted the

6
differentiation of response bias from sensitivity (accuracy of responses), which was not affected by the altitude stress. In other words, those with a minor head injury were equally as accurate as the healthy controls; however, when the experimental group made a mistake it was a consistent selection of the same wrong option while the control group’s errors were randomly distributed among options. Some effects were apparent within 10 min of altitude exposure. These effects were reversible, disappearing when the subjects were returned to sea level. This early report seems to provide solid support for the ideas underlying this study: individuals with a history of mTBI may be particularly susceptible to the effects of mild or moderate hypoxia and possibly other physiological stressors. It should be noted that civilians as well as military personnel may be exposed to these provocative levels of hypoxia over the course of their normal daily activities.
Hypoxia Exposure in Civilian and Military Aviation
Civilian exposure to hypoxia in aviation.
Hypoxia is a physiological stressor encountered in daily life far more frequently than is commonly realized. Contrary to popular assumptions, United States commercial airline carriers do not pressurize passenger cabins to sea level. Instead, the FAA requires the cabin pressure to be no higher than 8,000 ft above sea level. The National Research Council commissioned two studies involving aspects of commercial flight addressing issues which could adversely impact passenger and crew health and safety (National Research Council, 1986; National Research Council, 2002). Both of these studies concluded that current standards of cabin pressure provide adequate oxygenation for healthy persons, but raised questions for individuals with cardiac, pulmonary, or hematological diseases; the studies did not consider mTBI.
A recent study showed that mean arterial oxygen saturation fell from 97.0% blood
oxygen at preflight to 88.6% at altitude during 22 regularly scheduled commercial flights (Cottrell, Lebovitz, Fennel, & Kohn, 1995). These measurements were made in 42 aircrew, not passengers; presumably, the mean arterial oxygen saturation in the passengers would be, if anything, lower since they represent a sample of less homogeneously healthy individuals.
A recent meta-analysis of the available literature developed a set of regression models to
predict arterial oxygen in commercial aircraft cabins (Muhm, 2004). The model demonstrated that sea level arterial partial pressure of oxygen (PaO2) decreases with age in individuals with normal pulmonary function. More germane to present concerns is the observation that PaO2 at sea level predicted PaO2 at altitude. This meta-analysis report concluded that “a substantial proportion of passengers may experience moderately severe hypoxia at a cabin altitude of 8,000 ft” (p. 911). The study pointed out:
…the levels of hypoxia that this study predicts will be manifest between 6,000 and
8,000 ft may be symptomatic. Acute mountain sickness, manifest by headache, nausea, loss of appetite, fatigue, and sleep disturbance – symptoms not uncommon among passengers during or shortly after flight – has been reported within 48 h of arrival at altitudes as low as 6,300 ft (p. 911).

7
These ideas were evaluated in a recent study of over 500 volunteers participating in an altitude chamber flight lasting 20 hr. During the study, arterial oxygen saturation and acute mountain sickness symptoms were measured at several altitudes using a between-subjects experimental design (Muhm, Rock, McMullin, Jones, Eilers, & McMullen, 2007). At 8,000 ft, mean oxygen saturation decreased about 4.4% from baseline (with a 95% confidence interval [CI] of about 1.0), a change that may not seem meaningful; however, from the published Box and Whisker plots, it is clear that during the 20 hr flight, several of the subjects had oxygen saturations between 80% and 85% during the 20 hr flight. The participation of one (elderly) individual at 8,000 ft was terminated after 5 hr when her oxygen saturation decreased to 78%.
The above studies assessed presumably normal civilian volunteers encountering the
atmospheric equivalents to the cabins of commercial airline carriers. Other general aviation environments are more extreme. The Federal Aviation Administration (FAA) permits civilian private pilots to fly at a range of substantially higher altitudes without supplemental oxygen. According to the Federal Aviation Regulations 91.211:
No person may operate a civilian aircraft of U.S. registry –
1. At cabin pressure altitudes above 12,500 ft Mean Sea Level (MSL) up to and including
14,000 ft unless the required aircrew is provided with and uses supplemental oxygen for that part of the flight at those altitudes that is of more than 30 min of duration;
2. At cabin pressure altitudes above 14,000 ft (MSL) unless the required minimum flight crew
is provided with and uses supplemental oxygen during the entire flight time at these altitudes; and
3. At cabin pressure altitudes above 15,000 ft (MSL) unless each occupant of the aircraft is
provided with supplemental oxygen (Department of Transportation, 2000).
According to these FAA regulations, private civilian pilots and their passengers can have unlimited exposure to 12,500 ft MSL with apparently no anticipated impact on health and no anticipated performance decrement that would jeopardize the pilot’s ability to control the aircraft. Furthermore, exposing the required minimum flight crew to 14,000 ft MSL for less than 30 min would not impact health or jeopardize flight control. Civilian passengers who are not considered part of the minimum flight crew can have unlimited exposure up to 15,000 ft MSL. None of these regulations consider the possible impact of altitude-related hypoxic exposure on those with a history of mTBI.
Military exposure to hypoxia in aviation.
Military standards of altitude exposure differ among the Services. The crews of U.S. Army rotary-wing aircraft on operations around the world may be repeatedly exposed to altitude (up to 18,000 ft) and, although these personnel receive periodic hypoxia training, hypoxic events and mishaps do occur (Ramiccio, 1998). The current flight regulation, AR 95-1 (Department of the Army, 2014), lists in section 8-7 the following requirements for flight at altitude:
8
Approved oxygen systems will be used as follows: a. Unpressurized Aircraft. Oxygen will be used by aircraft crews and occupants for flights as
shown below: 1. Aircraft crews.
a. On flights above 10,000 ft pressure altitude for more than one hr. b. On flights above 12,000 ft pressure altitude for more than 30 min.
2. Aircraft crews and all other occupants.
a. On flights above 14,000 ft pressure altitude for any period of time.
b. For flights above 18,000 ft pressure altitude, oxygen prebreathing will be accomplished by aircrew members. Prebreathing may utilize either 100% gaseous aviator’s oxygen from a high pressure source, or an onboard oxygen generating system (OBOGS) that supplies at least 90% oxygen in the inspired gas. Prebreathing will be for not less than 30 minutes at ground level and will continue while en route to altitude. In those extraordinary cases where mission requirements dictate rapid ascent, commanders may authorize shorter prebreathing times on a case-by-case basis, with the realization that such practice increases the risk for developing altitude decompression illness. Return to normal oxygen (pressure demand regulator, gaseous oxygen-equipped aircraft) is authorized on descent below 18,000 ft pressure altitude, provided continued flight will not exceed this altitude (Department of the Army, 2014).
The Navy has different regulations, which are contained in OPNAVINST 3710.7T:
In unpressurized aircraft, the pilot at the controls shall use supplemental oxygen
continuously when cabin altitude exceeds 10,000 ft. When oxygen is not available to other occupants, flight between 10,000 and 13,000 ft shall not exceed 3 hr duration, and flight above 13,000 is prohibited (Department of the Navy, 2004).
Specific unpressurized military aircrafts can provide occupant exposures to the altitudes
that exceed those named in standards above. The operational environment posed by the Chinook, a nonpressurized Army helicopter with an operating ceiling of up to about 18,500 ft is relevant. Forces may be exposed to hypoxic conditions and the type of supplemental oxygen available depends on the unit and the operations. It may be noted that Army forces transported by the Chinook may have little if any prior experience or formal training concerning the symptoms of hypoxia. The V-22 Osprey, which provides the U.S. Marine Corps and Air Force with the ability to conduct assault support and long-range, high-speed missions requiring vertical take-off and landing capabilities, may pose even more severe challenges since the aircraft’s service ceiling is 26,000 ft; and like the Chinook, the cabin is not pressurized. This means that personnel in the cabin are exposed to severe environmental conditions, including the potential for altitude hypoxia (Department of Defense, 2001).

9
While the Army and Navy regulations and guidance described above provide limits for
safe operations of the aircraft, it remains to be seen how these will be implemented when tactical and operational realities of theatre come into play where air speed, fuel, and range considerations may force higher altitude operations. Apparently neither the military nor civilian altitude standards considered the impact of hypoxia on individuals with a history of mTBI, the basic question of the present research.
Methods
Human Subject Volunteers
Two groups of subjects participated in the present study. One group, the experimental group, consisted of individuals with a history of mTBI. The second group, the control group, consisted of individuals with no such history. Each group contained 36 subjects equaling a total of 72 subjects participated in the present study.
The study was performed at Clinvest Research, Springfield, MO, U.S.A., following
review and approval by the Chesapeake Institutional Review Board, the U.S. Army Aeromedical Research Laboratory Human Use Committee, and the U.S. Army Medical Research and Materiel Command Human Subjects Research Review Board. The study was conducted in accordance with all Federal laws, regulations, and standards of practice as well as those of the Department of Defense and U.S. Army. The study was determined to pose a greater than minimal risk to the subjects and included several risk mitigation techniques. One such technique was to present the normobaric hypoxic stress conditions in an ascending sequence of severity so that each subject was observed at a lower stress condition before being exposed to a greater stress.
For inclusion into the mTBI group, subjects met the following criteria, which follow
closely the criteria of American Congress of Rehabilitation Medicine (McAllister, 2005): 1. a duration of a loss of consciousness of no more than 10 min at the time of the TBI; 2. a duration of post traumatic amnesia of no more than 24 hr; 3. a Glasgow Coma Scale of from 13 to 15 (Kraus & Chu, 2005); and 4. a clinical history consistent with the diagnosis of mTBI.
All volunteers were paid for travel expenses to and from the study site, up to $50 per visit. In addition, an honorarium of $100 was provided for the completion of the data collection session.
The two groups were explicitly matched on the basis of age, gender, and smoking behavior (0
to 9 cigarettes a day and greater than 10 cigarettes a day). Each member of the matched pair of mTBI and control subjects was tested within a week of each other to minimize possible inadvertent differences due to drift in instrumentation or methodology. Appendix A tabulates the

10
age, gender, pulse rate, systolic and diastolic blood pressures, weight, height, and body mass index for each member of the mTBI group. Appendix B tabulates the same information for each member of the control group. Table 2 provides the mean and standard deviation for these parameters (with the exception of gender) for each group. It is noted that each group contained 9 women and 27 men. An analysis of variance showed that the mTBI and control groups did not differ statistically along the dimensions of age, pulse rate, systolic and diastolic blood pressures, respiration rate, weight, height, and body mass index. The probabilities for these comparisons ranged between .817 to .180.

11
Table 2. Summary of the Characteristics of the Mild Traumatic Brain Injury and Control Groups.
Parameter Group M SD NmTBI 25.25 5.416 36
Control 24.89 4.944 36Total 25.07 5.152 72mTBI 70.81 11.573 36
Control 72.72 14.232 36Total 71.76 12.915 72mTBI 120.14 14.79 36
Control 120.94 14.617 36Total 120.54 14.606 72mTBI 73.89 9.789 36
Control 73.36 7.783 36Total 73.62 8.784 72mTBI 14.17 4.178 36
Control 16.92 11.453 36Total 15.54 8.671 72mTBI 200.06 64.885 36
Control 210.99 85.63 36Total 205.52 75.633 72mTBI 69.5 4.3144 36
Control 69.944 3.5572 36Total 69.722 3.9324 72mTBI 28.325 7.8695 36
Control 29.736 11.4912 36
Total 29.031 9.8044 72
Respiration(breaths/sec)
Weight(lbs)
Height(inches)
Body Mass Index
(BMI, m/kg2)
Age(years)
Pulse(beats/minute)
Systolic(mmHg)
Diastolic(mmHg)
Appendix A includes three additional fields containing information pertinent only to the
mTBI group: number of months since the trauma, if there was a loss of consciousness (LOC), and if there was post-traumatic amnesia. On average, the concussion occurred 37.8 (SD = 33.1) months before participating in the present study, 19 resulted in a LOC, of which; 4 experienced a post-traumatic amnesia.

12
Experimental Design
The present study was designed to support a between-groups comparison to evaluate the formal null hypothesis that there are no statistically significant differences between these individuals with a history of mTBI and those without such a history along the dimensions defined by the dependent variables. In addition to this between-group comparison, there is a within-group comparison in that the measurements were taken from under five conditions defined by the kind of air the subjects breathed during testing. Specifically, each subject breathed an air and nitrogen (N) mix designed to simulate the partial pressure of oxygen in the air that is encountered at five defined altitudes. The five altitude conditions were presented to every subject in the following sequence: (1) MSL (21% O2), (2) 8,000 ft above MSL (15.5% O2 + 84.5% N), (3) 12,000 ft above MSL (14% + 86%), (4) 14,000 ft above MSL (13% + 87%), and (5) MSL. Thus, the experimental design included a within-subject comparison, altitude, of which there were five levels.
Every subject was exposed to a MSL condition twice; once at the beginning and once at
the end of the data collection. The MSL condition at the end was to ensure that there were no lingering effects of the hypoxic exposure on the subjects. The exact same altitude sequence was used for all subjects. Consequently, the design we used unavoidably confounded order effects with altitude effects. We chose this strategy for two reasons. First, subject safety; we did not know how individuals with a history of mTBI would respond to this hypoxic stressor. Although some consider the level of hypoxia posed even by a 14,000 ft above MSL altitude to be relatively minor for the normal general population, we thought it prudent to introduce the hypoxic challenge gradually. Secondly, we are more interested in whether any simulated altitude would produce evidence of lingering mTBI effects, rather than the specific impacts of specific altitudes. If such effects did show, then subsequent experimentation could target this second question. Thus, the confounding of order effects was of secondary importance for the purposes of the present study.
This study is a mixed-model experimental design in that it incorporates one between-
group factor (experimental vs. control group) and one within-group factor (five levels of altitude). The response dimensions along which these comparisons were made are described below. To statistically evaluate group, altitude, and group by altitude differences two-way analyses of variance, with planned contract follow-up tests, were performed for each dependent variable. Alpha for all tests was held constant at .05. To demonstrate the magnitude of the group difference, effect sizes were determined and reported as r values with the interpretation ranges of .00 to .05 no effect, .10 to .23 small effect, .24 to .33 moderate effect, and greater than .34 large effect. Additionally, correlations among variables were determined (Cohen, 2013). Correlations of interest are presented in the results section and the correlation matrixes for all variables are provided in appendices G and H.

13
Apparatus
The present study required three pieces of equipment, the Reduced Oxygen Breathing Device (ROBD), the Functional Impairment Tester (FIT), and a hand-held personal digital assistant (PDA). The ROBD was used to induce hypoxia in the volunteers, the FIT recorded oculometrics, and the PDA was used to administer the neurocognitive testing. Of these, only the ROBD and the FIT are discussed here; the PDA is described in a companion report that is in preparation and that will address neurocognitive testing.
Reduced Oxygen Breathing Device.
The ROBD (Environics, Tollande, CT), a commercial, off-the-shelf device, is a portable, computerized, gas-blending instrument that produces normobaric hypoxia, hypoxia without changes in atmospheric pressure. Figure 1 shows the ROBD in the bottom right and the tanked gasses on the left. It uses thermal mass flow controllers (MFC) to mix breathable air and medical nitrogen to produce the equivalent atmospheric oxygen partial pressures for altitudes up to 34,000 ft. The MFCs are calibrated on a primary flow standard traceable to the National Institutes of Standards and Technology. The system is equipped with an emergency dump switch that, if needed, will instantaneously supply to subjects 100% oxygen (Temme et al., 2009; Temme et al., 2010; Sausen, Bower, Stiney, Feigl, Wartman, & Clark, 2003; Sausen et al., 2001).
Several features are built into the ROBD to prevent over pressurization of the mask and
to prevent partial pressures of oxygen below those being requested for a particular altitude. Additionally, built-in self-tests verify all system component functionality before the operation of the system can begin. If any self-test fails, the system does not operate. The ROBD also includes a built-in pulse oximeter sensor that can be attached to the subject’s index finder or to the earlobe during device use.
Figure 1. The reduced oxygen breathing device and tanked gases used to generate normobaric hypoxia.
The ROBD was developed by the Naval Aerospace Medical Research Laboratory
(NAMRL) and is now marketed commercially (Environics, Tollande, CT) for aviation training and for research purposes. The ROBD enables individuals to be safely made hypoxic, without

14
risk of barotrauma and decompression sickness under controlled conditions in such a way that these individuals can engage in the vision and performance-based testing procedures.
Functional Impairment Tester.
The FIT (PMI, Inc, Rockville, MD)is a commercial, off-the-shelf device designed to assess fitness for duty in an objective, quick, and efficient fashion using oculometrics as a sign of neurological changes caused by drugs, alcohol, sleepiness, or other neurological deficits that express themselves in the reflexive ocular motor responses of the eye (Rothberg, Cornsweet, & Rafal, 1995; LeDuc, Greig, & Dumond, 2005a; LeDuc, Greig, & Dumond, 2005b; Cymerman et al., 2003; Cymerman, Muza, Friedlander, Fulco, & Rock, 2005). Figure 2 is an image of the FIT testing apparatus.
Figure 2. Functional impairment tester used to evaluate eye movements.
Dependent Variables and Response Measurements
The present report limits its discussion to the data derived from the ROBD, FIT, and the subject’s subjective reports of the hypoxic symptoms. The companion report in preparation addresses the impact of hypoxia on the cognitive functions.
Reduced Oxygen Breathing Device.
The ROBD includes a pulse oximeter, which provides a display readout of the volunteer’s pulse rate in beats per minute and percent hemoglobin oxygen concentration (SpO2). These values were recorded by hand every minute during altitude exposures.
Functional Impairment Tester.
The FIT software automatically records pupil diameter in the dark, the latency of the pupil’s response to a flash of light, the amplitude of that response, which is the difference between the diameter in the dark and the diameter in the light, and the saccadic velocity of the eye moving between a pair of alternately flashing lights. These four measurements are made one after the other, without any break and represent a complete trial requiring about 1 min to complete. The FIT makes these measurements using image analysis algorithms of reflections from the eye’s optical surfaces. Completing these four measurements requires careful

15
cooperation of the volunteer so that sometimes the trial is aborted or incomplete in that not all four measurements were successfully made. The FIT database contained every trial, even the trials that were incomplete. Consequently, the FIT dataset includes a measure of the number of completed and incomplete trials as well as the specific oculometrics.
Subjective reports of hypoxic symptoms.
The subjective reports were measured using a paper and pencil questionnaire that assessed the level of agreement of the following statements:
1. I felt light headed. 2. I had a headache. 3. I felt dizzy. 4. I felt faint. 5. My vision was dim. 6. My coordination was off. 7. I felt weak. 8. I felt sick to my stomach (nauseous). 9. I lost my appetite. 10. I felt sick. 11. I felt hung-over.
For each of these brief simple declarative statements, the volunteer reported the extent to which the statement was accurate using the 6-point Likert rating scale with the options: 0 (not at all), 1 (slight), 2 (somewhat), 3 (moderate), 4 (quite a bit), 5 (extreme).
These response items were drawn from the literature reporting a standardized
questionnaire developed to assess the symptoms associated with Environmental Stress Questionnaire (ESQ) (Muhm et al., 2007; Sampson, Cymerman, Burse, Maher, & Rock, 2005). This standardized questionnaire originally contained 68 items. The responses to this 68-item questionnaire were factor analyzed producing the following set of nine factors.
Acute mountain sickness – cerebral (AMS – C): symptoms appear to reflect altered
cerebral or cerebellar functioning in conjunction with malaise.
16
Acute mountain sickness – respiratory (AMS – R): symptoms apparently indicate shortness of breath, and other mask issues.
Ear, nose, and throat discomfort. Cold stress reflects the symptoms of cold feet, cold hands. A relatively generalized distress that includes mood as well. Alertness reflecting positive affective arousal states rather than factor 9, fatigue. Exertion stress, which was evident in those volunteers who were exercising during
these studies. Muscular discomfort, a factor which reflects residual muscle fatigue from exercise. Fatigue, symptoms loading here are tired, sleepy, weak, faint, etc.
The 11 items that were used in the questionnaire for the present study were the items that
comprised the AMS – C and the items reflecting cerebral and cerebellar issues. Of course, since the items used in the present study are isolated from the full questionnaire, we do not consider the responses to the 11 items recorded in the present study as a measure of the AMS – C factor that would be measured with the complete 68 item questionnaire.
In summary, the database we report includes the two measures from the ROBD (pulse
rate and SpO2), the four measures from the FIT (pupil diameter, pupil response latency, pupil response amplitude, saccadic velocity), including the number of incomplete FIT trials, the 11 subjective ESQ AMS – C responses, as well as the individual volunteer’s physical parameters tabulated in Appendices A and B and summarized in Table 2.
Procedures
Subject recruitment flyers were placed in several locations throughout the local community where people with a history of head injury would likely see them. These locations included academic athletic departments, bicycle shops, fitness and health centers as well as such clubs and organizations as roller derby teams, rodeo clubs, rugby teams, ice hockey teams, and rock climbing groups. The posted announcements provided contact phone numbers.
During initial phone screening, the study and the inclusion criteria for participation were
described. Specific additional exclusion criteria included pregnancy; history of drug or alcohol abuse; depression; bipolar disorder; schizophrenia; problems with the heart, kidney, or liver; asthma; strokes; mini-stroke; poor leg circulation; any ongoing medical problems; current or past neurological problems such as seizures, epilepsy or dementia; post-traumatic headache; current concentration and/or memory problems because of the head injury; LOC greater than 10 min at time of injury; and post-traumatic amnesia greater than 24 hr at time of injury.

17
For prospective mTBI subjects, appointments were arranged as soon as convenient following the phone screening. For prospective control subjects, names, demographics and contact information were filed so that these prospective subjects could be matched appropriately with mTBI subjects on the basis of age, gender, and smoking behavior.
After an appointment was scheduled, prospective subjects were told how much they
would be compensated for their participation in the study; they were also asked to bring documentation of their injury for the study records, if appropriate. Also, if the prospective subjects wore contact lenses, the individual was told to wear glasses on the day of testing. The individual was told to abstain from any alcohol 12 hr before testing. A copy of the informed consent document (ICD) was mailed or e-mailed to the individual so the prospective subjects could review it at their convenience beforehand.
When the prospective subject arrived for testing, a hardcopy of the previously mailed
ICD was provided. The consenting individual went through the ICD with the prospective subject. The consenting individual described the study in detail and answered any questions the prospective subject had in order to ensure that the individual understood all aspects of the experimental procedures and was fully informed and completely comfortable with all procedures. The prospective subject read the ICD, initialed the bottom of each page, and signed the document at the end. All procedures were documented with an ICD checklist. All subjects were given a copy of the ICD for their own records.
After the ICD was signed, a study intake form was completed, which documented such
information as sitting blood pressure, heart rate, respiration, height, and weight. The inclusion/exclusion criteria were again reviewed to ensure consistency with the study. Female subjects provided a urine sample to test for pregnancy. The study physician reviewed this information and examined the subject to ensure compliance with all inclusion/exclusion criteria and that the individual was medically qualified to participate in the study. The physician also asked questions of the subject to ensure that the subject understood all procedures and to determine whether the subject had any history of altitude sickness or wheezing. Once the study physician was sure that the subject was healthy and qualified to participate, the physician signed the intake forms.
The subject was then introduced to the testing facility, including the test apparatus. The
technician described the FIT and completed five trials with it to ensure the subject understood how it worked. If it took more than 10 attempts for the subject to complete five trials, the technician realigned the subject in the FIT and repeated the measurements.
The first three of these five FIT warm-up trials were completed without the subject being
connected to the ROBD. For the last two FIT warm-up trials, the technician fitted the subject’s finger with the pulse oximeter. The technician also fitted the ROBD mask (Gentex HyperMed Oxygen Mask) on the subject’s face to introduce the individual to the task of making the FIT measurements with the mask. It may be noted there were four different sizes of masks from which the correct size mask was selected based on the size of the subject’s face.
18
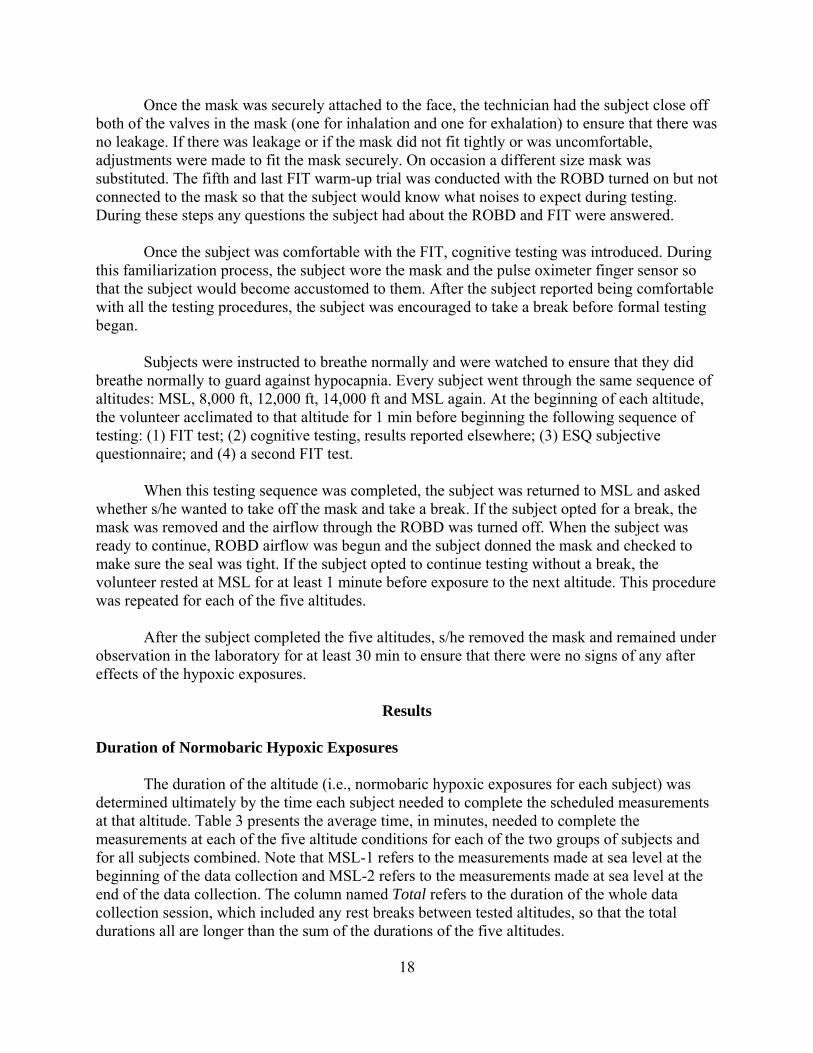
Once the mask was securely attached to the face, the technician had the subject close off both of the valves in the mask (one for inhalation and one for exhalation) to ensure that there was no leakage. If there was leakage or if the mask did not fit tightly or was uncomfortable, adjustments were made to fit the mask securely. On occasion a different size mask was substituted. The fifth and last FIT warm-up trial was conducted with the ROBD turned on but not connected to the mask so that the subject would know what noises to expect during testing. During these steps any questions the subject had about the ROBD and FIT were answered.
Once the subject was comfortable with the FIT, cognitive testing was introduced. During
this familiarization process, the subject wore the mask and the pulse oximeter finger sensor so that the subject would become accustomed to them. After the subject reported being comfortable with all the testing procedures, the subject was encouraged to take a break before formal testing began.
Subjects were instructed to breathe normally and were watched to ensure that they did
breathe normally to guard against hypocapnia. Every subject went through the same sequence of altitudes: MSL, 8,000 ft, 12,000 ft, 14,000 ft and MSL again. At the beginning of each altitude, the volunteer acclimated to that altitude for 1 min before beginning the following sequence of testing: (1) FIT test; (2) cognitive testing, results reported elsewhere; (3) ESQ subjective questionnaire; and (4) a second FIT test.
When this testing sequence was completed, the subject was returned to MSL and asked
whether s/he wanted to take off the mask and take a break. If the subject opted for a break, the mask was removed and the airflow through the ROBD was turned off. When the subject was ready to continue, ROBD airflow was begun and the subject donned the mask and checked to make sure the seal was tight. If the subject opted to continue testing without a break, the volunteer rested at MSL for at least 1 minute before exposure to the next altitude. This procedure was repeated for each of the five altitudes.
After the subject completed the five altitudes, s/he removed the mask and remained under
observation in the laboratory for at least 30 min to ensure that there were no signs of any after effects of the hypoxic exposures.
Results
Duration of Normobaric Hypoxic Exposures
The duration of the altitude (i.e., normobaric hypoxic exposures for each subject) was determined ultimately by the time each subject needed to complete the scheduled measurements at that altitude. Table 3 presents the average time, in minutes, needed to complete the measurements at each of the five altitude conditions for each of the two groups of subjects and for all subjects combined. Note that MSL-1 refers to the measurements made at sea level at the beginning of the data collection and MSL-2 refers to the measurements made at sea level at the end of the data collection. The column named Total refers to the duration of the whole data collection session, which included any rest breaks between tested altitudes, so that the total durations all are longer than the sum of the durations of the five altitudes.

19
Table 3. Mean Time (min) to Complete Measurements at Each Altitude Condition
MSL-1 8,000 ft 12,000 14,000 MSL-2mTBI 14.11 13.7 14.2 13.9 13.9 84.7
Control 13.86 14.5 14.2 13.4 13.6 83.1Mean 14.9 14.1 14.2 13.7 13.8 83.9
AltitudeGroup Total
Note. The times in the Total column refer to the total duration of the data collection session, including rests and breaks between altitudes.
A mixed model analysis of variance (ANOVA) showed no significant differences among
these durations. Thus, times needed to complete the measurements for each of the five altitude conditions were not significantly different nor were there significant differences between the two groups of subjects, and none of the interaction terms were significant. Consequently, the exposure times for the two groups were not statistically different.
Reduced Oxygen Breathing Device Measurements
The ROBD produced two measures, SpO2 and pulse rate. Appendix C tabulates these measurements for each of the mTBI subjects at each of the five altitudes and Appendix D tabulates these measurements for each of the control subjects at each of the five altitudes.
Pulse oximetry: Percent blood oxygen
The SpO2 for each altitude is presented in Table 4 separately for the mTBI and the control subjects. An ANOVA showed that the two groups of subjects differed significantly in their SpO2, F(1,70) = 13.247, p < .001. With an r = .399, the effect size is conventionally considered to be moderate.
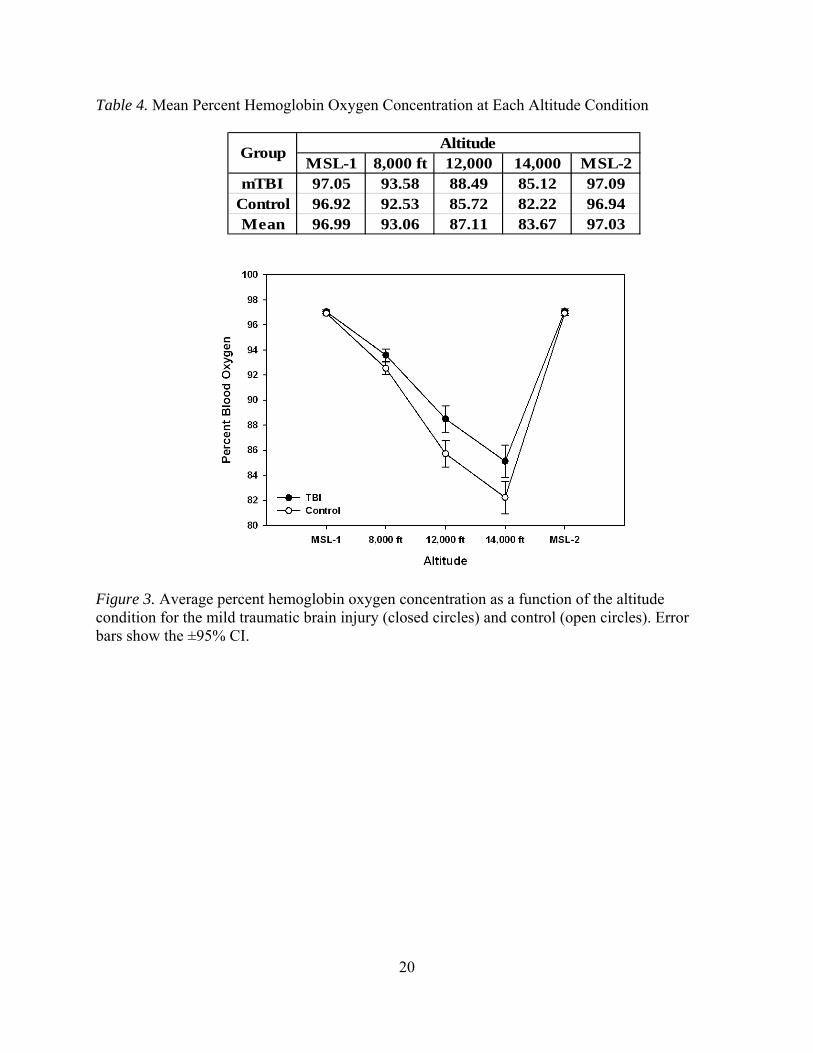
As expected, there was a main effect of altitude on SpO2, F(1.639,114.762) = 702.133, p
< .001, which, with an r = .9271, is quite large. More importantly, there was a significant interaction between group and altitude. Specifically, since Mauchly’s test indicated that the main effect of altitude violated the assumption of sphericity (χ2 = 299.616, p < .001), the degrees of freedom (df) for the interaction ANOVA were corrected using Greenhouse-Geisser estimates (ε = .410) to produce F(1.639,114.762) = 9.087, p < .001, with an r = .709, a value generally taken to indicate a large effect. Contrasts were performed to examine further this interaction. Contrasts showed there were no statistical differences between the mTBI and control subjects at MSL-1 and MSL-2; however, with respect to the MSL-2 condition, the SpO2 response of the mTBI subjects differed from the SpO2 response of the control subjects at 8,000 ft (p < .004), r = .333; 12,000 ft (p < .001), r = .403; and 14,000 ft (p < .003), r = .341. The respective r values show these differences to be of moderate statistical size. These comparisons are illustrated in Figure 3, which includes the 95% CI around the average SpO2 for the mTBI and control groups.
20
Table 4. Mean Percent Hemoglobin Oxygen Concentration at Each Altitude Condition
MSL-1 8,000 ft 12,000 14,000 MSL-2mTBI 97.05 93.58 88.49 85.12 97.09
Control 96.92 92.53 85.72 82.22 96.94Mean 96.99 93.06 87.11 83.67 97.03
AltitudeGroup
Figure 3. Average percent hemoglobin oxygen concentration as a function of the altitude condition for the mild traumatic brain injury (closed circles) and control (open circles). Error bars show the ±95% CI.
21
Correlations
Since each individual was exposed to five different altitude conditions; it is possible to question the extent to which the SpO2 at one altitude predicts the SpO2 at the other altitudes. To address this question, the Pearson product moment correlations of the SpO2 measurements made at each of the five altitudes were correlated with each other. With five altitudes, there are ten possible altitude pairs and therefore ten correlations. This correlation matrix was calculated for the mTBI subjects and is presented in Table 5, while the matrix calculated for the control subjects is presented in Table 6.
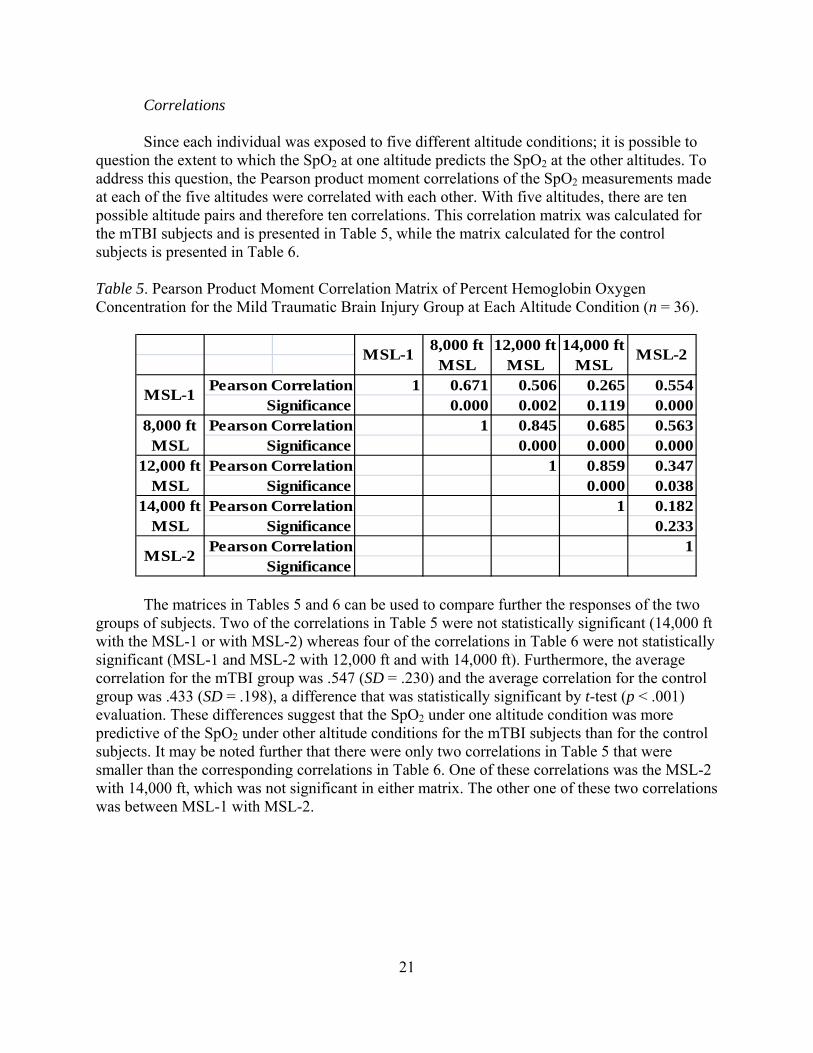
Table 5. Pearson Product Moment Correlation Matrix of Percent Hemoglobin Oxygen Concentration for the Mild Traumatic Brain Injury Group at Each Altitude Condition (n = 36).
1 0.671 0.506 0.265 0.5540.000 0.002 0.119 0.000
1 0.845 0.685 0.5630.000 0.000 0.000
1 0.859 0.3470.000 0.038
1 0.1820.233
1
MSL-1
8,000 ft MSL
12,000 ft MSL
14,000 ft MSL
MSL-2MSL-1
SignificancePearson Correlation
Pearson CorrelationSignificance
Pearson CorrelationSignificance
8,000 ft MSL
12,000 ft MSL
14,000 ft MSL
MSL-2
Pearson CorrelationSignificance
Pearson CorrelationSignificance
The matrices in Tables 5 and 6 can be used to compare further the responses of the two groups of subjects. Two of the correlations in Table 5 were not statistically significant (14,000 ft with the MSL-1 or with MSL-2) whereas four of the correlations in Table 6 were not statistically significant (MSL-1 and MSL-2 with 12,000 ft and with 14,000 ft). Furthermore, the average correlation for the mTBI group was .547 (SD = .230) and the average correlation for the control group was .433 (SD = .198), a difference that was statistically significant by t-test (p < .001) evaluation. These differences suggest that the SpO2 under one altitude condition was more predictive of the SpO2 under other altitude conditions for the mTBI subjects than for the control subjects. It may be noted further that there were only two correlations in Table 5 that were smaller than the corresponding correlations in Table 6. One of these correlations was the MSL-2 with 14,000 ft, which was not significant in either matrix. The other one of these two correlations was between MSL-1 with MSL-2.
22
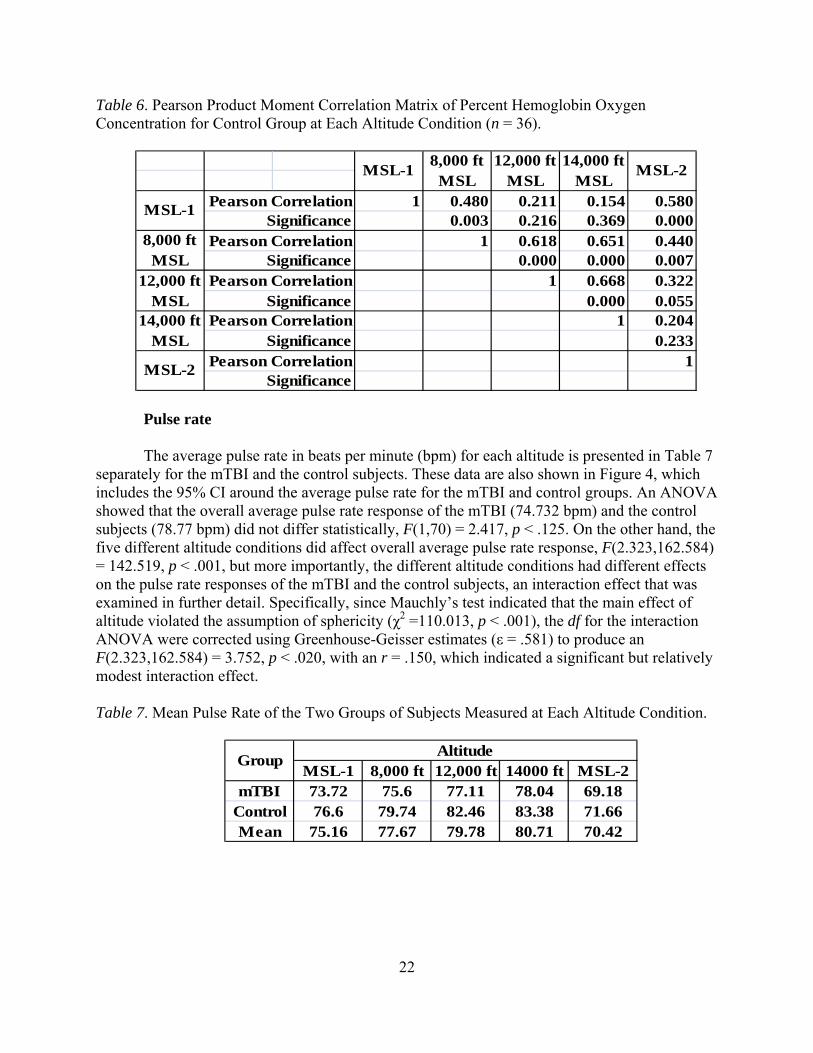
Table 6. Pearson Product Moment Correlation Matrix of Percent Hemoglobin Oxygen Concentration for Control Group at Each Altitude Condition (n = 36).
1 0.480 0.211 0.154 0.5800.003 0.216 0.369 0.000
1 0.618 0.651 0.4400.000 0.000 0.007
1 0.668 0.3220.000 0.055
1 0.2040.233
1MSL-2
Pearson CorrelationSignificance
12,000 ft MSL
Pearson CorrelationSignificance
14,000 ft MSL
Pearson CorrelationSignificance
12,000 ft MSL
14,000 ft MSL
MSL-2
8,000 ft MSL
Pearson CorrelationSignificance
MSL-1Pearson Correlation
Significance
MSL-18,000 ft
MSL
Pulse rate
The average pulse rate in beats per minute (bpm) for each altitude is presented in Table 7 separately for the mTBI and the control subjects. These data are also shown in Figure 4, which includes the 95% CI around the average pulse rate for the mTBI and control groups. An ANOVA showed that the overall average pulse rate response of the mTBI (74.732 bpm) and the control subjects (78.77 bpm) did not differ statistically, F(1,70) = 2.417, p < .125. On the other hand, the five different altitude conditions did affect overall average pulse rate response, F(2.323,162.584) = 142.519, p < .001, but more importantly, the different altitude conditions had different effects on the pulse rate responses of the mTBI and the control subjects, an interaction effect that was examined in further detail. Specifically, since Mauchly’s test indicated that the main effect of altitude violated the assumption of sphericity (χ2 =110.013, p < .001), the df for the interaction ANOVA were corrected using Greenhouse-Geisser estimates (ε = .581) to produce an F(2.323,162.584) = 3.752, p < .020, with an r = .150, which indicated a significant but relatively modest interaction effect.
Table 7. Mean Pulse Rate of the Two Groups of Subjects Measured at Each Altitude Condition.
MSL-1 8,000 ft 12,000 ft 14000 ft MSL-2mTBI 73.72 75.6 77.11 78.04 69.18
Control 76.6 79.74 82.46 83.38 71.66Mean 75.16 77.67 79.78 80.71 70.42
AltitudeGroup

23
Figure 4. Mean pulse rate as a function of altitude for the mTBI (closed circles) and control (open circles). Error bars show the ±95% CI.
To examine further this interaction, contrasts were calculated comparing the pulse rate of
the mTBI and control groups at different altitude, see Table 7. These contrasts showed that while there were statistically significant differences in pulse rate between the MSL-1 (75.16 bpm) and MSL-2 (70.42 bpm), F(1,70) = 124.945, p < .001, the difference between the mTBI and control subjects at MSL-1 (2.88 bpm) and MSL-2 (2.48 bpm) was not significant, F(1,70) = .209, p < .649. Similarly, the difference between the mTBI and control subjects at 8,000 ft (4.14 bpm) and MSL-2 (2.48 bpm) was not significant, F(1,70) = 2.974, p < .089. The situation was different at the 12,000 ft and 14,000 ft altitudes. The difference in pulse rate between the mTBI and control subjects at the 12,000 ft (5.35 bpm) and at MSL-2 (2.48 bpm) was significant, F(1,70) = 5.381, p < .023, r = .267 as was the difference between the groups at 14,000 ft, (5.43 bpm), F(1,70) = 6.102, p < .016, r = .283. Effect sizes were in the moderate range.
Correlations
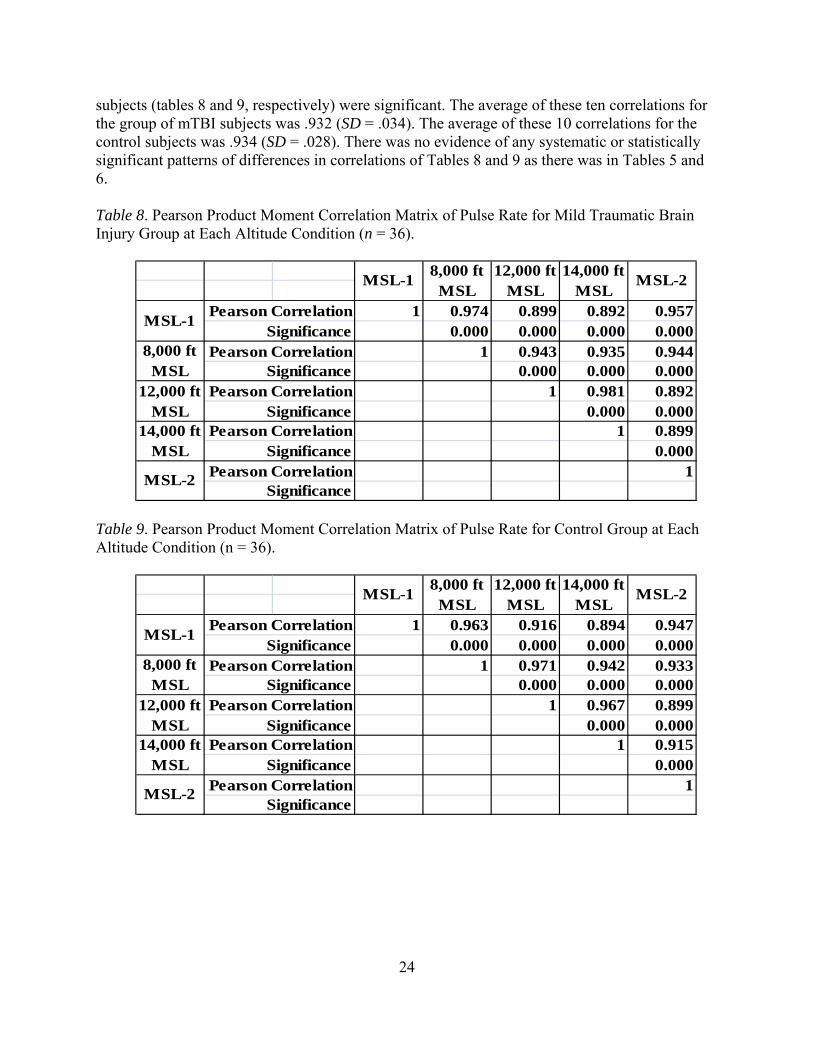
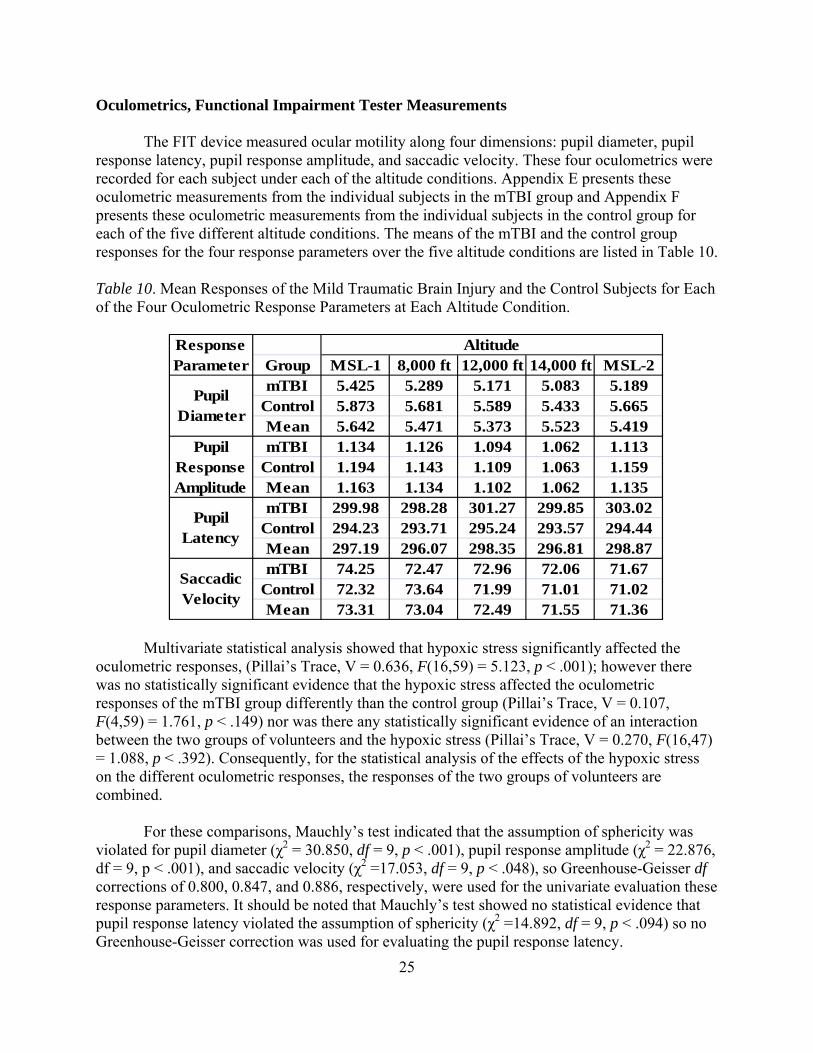
Since each individual was exposed to five different altitude conditions; it is possible to question the extent to which pulse rate at one altitude predicts the pulse rate at the other altitudes. To address this question, the Pearson product moment correlations of the pulse rate measurements made at each of the five altitudes were correlated with each other. With five altitudes, there are 10 possible altitude pairs and therefore 10 correlations. This correlation matrix was calculated for the mTBI group; and is presented in Table 8 while the matrix calculated for the control subjects is presented in Table 9.
Together, the matrix in Tables 8 and 9 can be used to compare further the responses of
the two groups of subjects. All ten correlations calculated for both the mTBI and the control
24
subjects (tables 8 and 9, respectively) were significant. The average of these ten correlations for the group of mTBI subjects was .932 (SD = .034). The average of these 10 correlations for the control subjects was .934 (SD = .028). There was no evidence of any systematic or statistically significant patterns of differences in correlations of Tables 8 and 9 as there was in Tables 5 and 6.
Table 8. Pearson Product Moment Correlation Matrix of Pulse Rate for Mild Traumatic Brain Injury Group at Each Altitude Condition (n = 36).
1 0.974 0.899 0.892 0.9570.000 0.000 0.000 0.000
1 0.943 0.935 0.9440.000 0.000 0.000
1 0.981 0.8920.000 0.000
1 0.8990.000
1MSL-2
Pearson CorrelationSignificance
12,000 ft MSL
Pearson CorrelationSignificance
14,000 ft MSL
Pearson CorrelationSignificance
12,000 ft MSL
14,000 ft MSL
MSL-2
8,000 ft MSL
Pearson CorrelationSignificance
MSL-1Pearson Correlation
Significance
MSL-18,000 ft
MSL
Table 9. Pearson Product Moment Correlation Matrix of Pulse Rate for Control Group at Each Altitude Condition (n = 36).
1 0.963 0.916 0.894 0.9470.000 0.000 0.000 0.000
1 0.971 0.942 0.9330.000 0.000 0.000
1 0.967 0.8990.000 0.000
1 0.9150.000
1MSL-2
Pearson CorrelationSignificance
12,000 ft MSL
Pearson CorrelationSignificance
14,000 ft MSL
Pearson CorrelationSignificance
12,000 ft MSL
14,000 ft MSL
MSL-2
8,000 ft MSL
Pearson CorrelationSignificance
MSL-1Pearson Correlation
Significance
MSL-18,000 ft
MSL
25
Oculometrics, Functional Impairment Tester Measurements
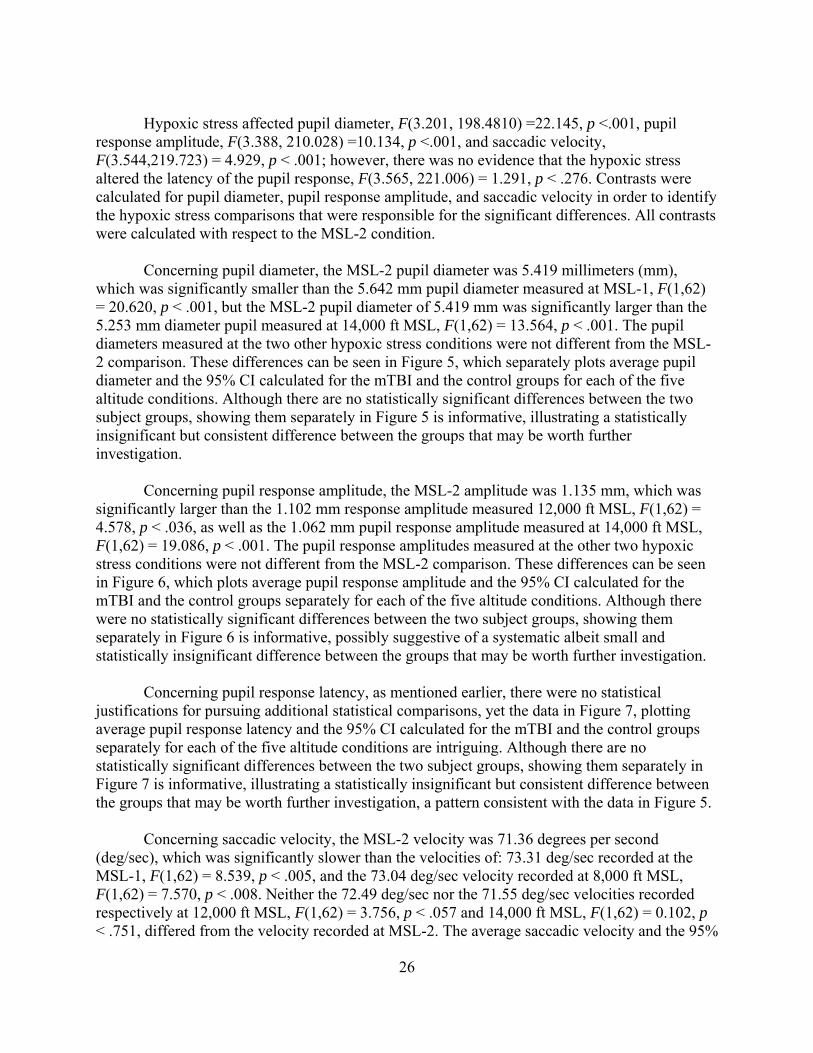
The FIT device measured ocular motility along four dimensions: pupil diameter, pupil response latency, pupil response amplitude, and saccadic velocity. These four oculometrics were recorded for each subject under each of the altitude conditions. Appendix E presents these oculometric measurements from the individual subjects in the mTBI group and Appendix F presents these oculometric measurements from the individual subjects in the control group for each of the five different altitude conditions. The means of the mTBI and the control group responses for the four response parameters over the five altitude conditions are listed in Table 10.
Table 10. Mean Responses of the Mild Traumatic Brain Injury and the Control Subjects for Each of the Four Oculometric Response Parameters at Each Altitude Condition.
Group MSL-1 8,000 ft 12,000 ft 14,000 ft MSL-2mTBI 5.425 5.289 5.171 5.083 5.189
Control 5.873 5.681 5.589 5.433 5.665Mean 5.642 5.471 5.373 5.523 5.419mTBI 1.134 1.126 1.094 1.062 1.113
Control 1.194 1.143 1.109 1.063 1.159Mean 1.163 1.134 1.102 1.062 1.135mTBI 299.98 298.28 301.27 299.85 303.02
Control 294.23 293.71 295.24 293.57 294.44Mean 297.19 296.07 298.35 296.81 298.87mTBI 74.25 72.47 72.96 72.06 71.67
Control 72.32 73.64 71.99 71.01 71.02Mean 73.31 73.04 72.49 71.55 71.36
Altitude
Saccadic Velocity
ResponseParameter
PupilDiameter
PupilResponseAmplitude
PupilLatency
Multivariate statistical analysis showed that hypoxic stress significantly affected the oculometric responses, (Pillai’s Trace, V = 0.636, F(16,59) = 5.123, p < .001); however there was no statistically significant evidence that the hypoxic stress affected the oculometric responses of the mTBI group differently than the control group (Pillai’s Trace, V = 0.107, F(4,59) = 1.761, p < .149) nor was there any statistically significant evidence of an interaction between the two groups of volunteers and the hypoxic stress (Pillai’s Trace, V = 0.270, F(16,47) = 1.088, p < .392). Consequently, for the statistical analysis of the effects of the hypoxic stress on the different oculometric responses, the responses of the two groups of volunteers are combined.
For these comparisons, Mauchly’s test indicated that the assumption of sphericity was
violated for pupil diameter (χ2 = 30.850, df = 9, p < .001), pupil response amplitude (χ2 = 22.876, df = 9, p < .001), and saccadic velocity (χ2 =17.053, df = 9, p < .048), so Greenhouse-Geisser df corrections of 0.800, 0.847, and 0.886, respectively, were used for the univariate evaluation these response parameters. It should be noted that Mauchly’s test showed no statistical evidence that pupil response latency violated the assumption of sphericity (χ2 =14.892, df = 9, p < .094) so no Greenhouse-Geisser correction was used for evaluating the pupil response latency.
26
Hypoxic stress affected pupil diameter, F(3.201, 198.4810) =22.145, p <.001, pupil
response amplitude, F(3.388, 210.028) =10.134, p <.001, and saccadic velocity, F(3.544,219.723) = 4.929, p < .001; however, there was no evidence that the hypoxic stress altered the latency of the pupil response, F(3.565, 221.006) = 1.291, p < .276. Contrasts were calculated for pupil diameter, pupil response amplitude, and saccadic velocity in order to identify the hypoxic stress comparisons that were responsible for the significant differences. All contrasts were calculated with respect to the MSL-2 condition.
Concerning pupil diameter, the MSL-2 pupil diameter was 5.419 millimeters (mm),
which was significantly smaller than the 5.642 mm pupil diameter measured at MSL-1, F(1,62) = 20.620, p < .001, but the MSL-2 pupil diameter of 5.419 mm was significantly larger than the 5.253 mm diameter pupil measured at 14,000 ft MSL, F(1,62) = 13.564, p < .001. The pupil diameters measured at the two other hypoxic stress conditions were not different from the MSL-2 comparison. These differences can be seen in Figure 5, which separately plots average pupil diameter and the 95% CI calculated for the mTBI and the control groups for each of the five altitude conditions. Although there are no statistically significant differences between the two subject groups, showing them separately in Figure 5 is informative, illustrating a statistically insignificant but consistent difference between the groups that may be worth further investigation.
Concerning pupil response amplitude, the MSL-2 amplitude was 1.135 mm, which was
significantly larger than the 1.102 mm response amplitude measured 12,000 ft MSL, F(1,62) = 4.578, p < .036, as well as the 1.062 mm pupil response amplitude measured at 14,000 ft MSL, F(1,62) = 19.086, p < .001. The pupil response amplitudes measured at the other two hypoxic stress conditions were not different from the MSL-2 comparison. These differences can be seen in Figure 6, which plots average pupil response amplitude and the 95% CI calculated for the mTBI and the control groups separately for each of the five altitude conditions. Although there were no statistically significant differences between the two subject groups, showing them separately in Figure 6 is informative, possibly suggestive of a systematic albeit small and statistically insignificant difference between the groups that may be worth further investigation.
Concerning pupil response latency, as mentioned earlier, there were no statistical
justifications for pursuing additional statistical comparisons, yet the data in Figure 7, plotting average pupil response latency and the 95% CI calculated for the mTBI and the control groups separately for each of the five altitude conditions are intriguing. Although there are no statistically significant differences between the two subject groups, showing them separately in Figure 7 is informative, illustrating a statistically insignificant but consistent difference between the groups that may be worth further investigation, a pattern consistent with the data in Figure 5.
Concerning saccadic velocity, the MSL-2 velocity was 71.36 degrees per second
(deg/sec), which was significantly slower than the velocities of: 73.31 deg/sec recorded at the MSL-1, F(1,62) = 8.539, p < .005, and the 73.04 deg/sec velocity recorded at 8,000 ft MSL, F(1,62) = 7.570, p < .008. Neither the 72.49 deg/sec nor the 71.55 deg/sec velocities recorded respectively at 12,000 ft MSL, F(1,62) = 3.756, p < .057 and 14,000 ft MSL, F(1,62) = 0.102, p < .751, differed from the velocity recorded at MSL-2. The average saccadic velocity and the 95%

27
CI calculated for the mTBI and the control groups are plotted separately in Figure 8, which plots average pupil response amplitude, and the 95% CI calculated for the mTBI and the control groups separately for each of the five altitude conditions. Although there are no statistically significant differences between the two subject groups, the graph is informative; by itself, it shows little evidence for any consistent pattern of differences between the subject groups.
Figure 5. Pupil diameter as a function of hypoxic condition averaged for the group of mild traumatic brain injury subjects (closed circles) and for the group of control subjects (open circles). The error bars show the ±95% CI.
Figure 6. Pupil response amplitude as a function of hypoxic condition averaged for the group of mild traumatic brain injury subjects (closed circles) and for the group of control subjects (open circles). The error bars show the ±95% CI.

28
Figure 7. Pupil response latency as a function of hypoxic condition averaged for the group of mild traumatic brain injury subjects (closed circles) and for the group of control subjects (open circles). The error bars show the ±95% CI.
Figure 8. Saccadic velocity as a function of hypoxic condition averaged for the group of mild traumatic brain injury subjects (closed circles) and for the group of control subjects (open circles). The error bars show the ±95% CI.
Environmental Stress Questionnaire: Acute Mountain Sickness-Cognitive
The results of the Environmental Stress Questionnaire: Acute Mountain Sickness-Cognitive (ESQ AMS-C) self-report are presented in Table 11, which tabulates the sum of the rating for each question for each of the five altitudes separately for the two groups of subjects. The sum of ratings was established by adding all Likert scale response values together; for

29
example, if one subject reported a 3 (somewhat), another a 2 (moderate), and the rest reported 0 (not at all), the sum value would be 5. Scores per item could range from 0 to 180 (36 subjects by 5 extreme). These ESQ AMS-C data are displayed in Figure 9, which shows for the mTBI and the control groups the sum of the ESQ AMS-C responses as a function of altitude.
Table 11. Environmental Stress Questionnaire: Acute Mountain Sickness-Cognitive Sum of the Ratings for Each Question Item for the Mild Traumatic Brain Injury and Control Groups Over Each Altitude Condition.
mTBI Control mTBI Control mTBI Control mTBI Control mTBI Control mTBI ControlI felt light headed 5 5 10 11 19 18 32 29 6 15 72 78I had a headache 2 2 6 7 10 13 16 13 12 13 46 48I felt dizzy 2 0 6 3 9 9 18 19 1 7 36 38I felt faint 1 2 7 5 10 13 18 17 4 5 40 42My vision was dim 4 3 9 6 14 7 22 10 3 5 52 31My coordination was off 9 8 20 10 29 14 42 23 12 8 112 63I felt weak 2 4 5 4 12 7 22 10 3 4 44 29I felt sick to my stomach (nauseous) 0 0 4 0 6 2 6 2 1 1 17 5I lost my appetite 0 0 1 0 1 0 1 0 0 0 3 0I felt sick 0 0 1 0 2 2 4 2 0 1 7 5I felt hung-over. 0 0 1 0 1 1 5 3 0 1 7 5
Total 25 24 70 46 113 86 186 128 42 60 436 344
MSL-2 TotalESQ Question
MSL-1 8,000 ft 12,000 ft 14,000 ft
Figure 9. Environmental Stress Questionnaire responses recorded for the two groups of subjects (mild traumatic brain injury and control) separately as a function of altitude condition. Note that the ordinate is the sum over the 11 ESQ items for the specific group for the altitude indicated on the abscissa.
These effects were evaluated using a three-factor, mixed model ANOVA with one between-subject variable and two within-subject repeated measure variables. The one between subject variable was the group to which the subject belonged, either the mTBI or control group. One within-subject repeated measures variable was altitude, of which there were five levels (MSL-1, 8,000 ft, 12,000 ft, 14,000 ft, and MSL-2). The other within-subject repeated measures variable was ESQ question, of which there were 11 levels, where each level was one of the ESQ

30
questions. As mentioned, the response was the subject’s Likert scale self-report of the magnitude of the symptom.
Mauchly’s test indicated that both within-subject variables violated the assumption of sphericity (altitude, χ2 (9) = 129.65, p < .001, ε = .579; and ESQ, χ2 (54) = 503.989, p < .001, ε = .579). The results showed that the responses were significantly affected by altitude, V = .439, F(4,65) = 12.702, p < 001; ESQ, V = .604, F(10,59) = 8.988, p < 001; and the interaction of altitude with ESQ, V = .712, F(38,31) = 2.016, p < 024. The between-subject variable, group, was not significant, F(1,68) = .592, p < .444, nor was the interaction of group with altitude, ESQ, or the altitude by ESQ interaction.
Tests of within-subject contrasts compared the altitudes with respect to MSL-2 and showed that MSL-1, F(1,68) = 7.002, p < .01, r = .306; 12,000 ft, F(1,68) = 13.325, p < .001, r = .405; and 14,000 ft, F(1,68) = 37.398, p < .001, r = .596, each differed from the MSL-2 reference. The significant difference between MSL-1 and MSL-2 indicates that lingering hypoxic sensations were experienced immediately after the conclusion of the three hypoxic stress conditions. The time necessary for these sensations to fully dissipate is worth exploring in future investigations.
While the statistical interactions of altitude with the ESQ question item are extremely complex and lengthy to describe, the last column of Table 11 suggests some generalities that illustrate the significant finds that did emerge. Specifically, the subjective report of the effect of hypoxia on coordination was most severe followed by feeling light-headed, headache, feeling faint, dizziness, a dimness of vision, and weakness. There were negligible reports of feeling sick to the stomach (nervous), a loss of appetite, sick, or hung-over.
Overall correlation among variables
All variables were entered into a single correlation matrix for the mTBI group (Appendix G) and for the control group (Appendix H). These two exploratory analyses were conducted toidentify meaningful relationships between variables. It was anticipated that inter-variable correlations would reveal consistent trends between demographic variables and dependent variables and that these trends would be maintained across the levels of the independent variable. However, meaningful relationships did not emerge beyond those reported throughout this results section. These matrixes do contain relationships that would be expected for all human subjects. For example, systolic and diastolic blood pressures were correlated with BMI and pulse rate for both groups; but none of these variables were consistently associated with FIT or ESQ measures in either group.
Discussion
The specific research goal of the present study was to evaluate the possibility that mTBI may have lingering effects that are not evident unless the individual is confronted with stressful situations or challenges that could have a greater than normal effect on the individual with mTBI. More specifically, individuals with a history of mTBI who appear asymptomatic under normal environmental conditions may have lingering or hidden deficits or other consequences of mTBI

31
that only become apparent when confronting environmental or physiological stressors that may be relatively minor and routinely encountered by military personnel or by civilians during their daily activities. This possibility would suggest that mTBI could have covert or occult (not accompanied by readily discernable signs or symptoms) affects that may not be evident unless the individual is compromised in some further way. This notion was formalized for experimental evaluation by formulating the null hypothesis that no statistically significant differences in selected measures would be found between a sample of individuals with a history of mTBI, who appeared asymptomatic under sea level conditions, and a sample of individuals without such a history, the mTBI and the control groups, when the two groups were stressed by normobaric hypoxia. Normobaric hypoxia is a prototypical physiological stress for this type of research paradigm. While the volunteers were exposed to three moderate levels of the hypoxia stress conditions, four general response categories were measured:
a. Pulse oximetry, which included percent blood oxygen saturation, (SpO2) and pulse rate
(bpm);
b. Oculometric (FIT measures), which included measurements of the size of the eye’s pupil at rest, the pupil’s response latency, the pupil’s response amplitude, and the eye’s saccadic velocity;
c. The subjective, self-reported (ESQ AMS-C) severity of symptoms associated with
normobaric hypoxic stressor as rated along 11 response dimensions; and
d. Neurocognitive assessment, to be discussed in a separate report.
The experiment incorporated a design that exposed the mTBI and control volunteers to three different levels of the normobaric hypoxic stress using the ROBD that manipulated the concentration of oxygen in the air breathed by the research volunteers and two control conditions in which oxygen concentration was not manipulated. Five oxygen concentrations (and corresponding PO2 values) are most easily indexed to altitude in that the magnitude of the hypoxic stress was defined as the PO2 typically encountered at defined altitudes (Gradwell, 2006). The specific altitude equivalents were: (1) Sea level at the start of the study, which imposed no increment in stress whatsoever for any of the volunteers and is referred to as MSL-1; (2) 8,000 ft MSL, which may be considered to impose a very imposed a low stress, (3) 12,000 ft MSL, which may be considered to impose a moderate stress; (4) 14,000 ft MSL, which may be considered to impose a moderately high stress; and (5) Sea level at the completion of the study, which is referred to as MSL-2 and is a condition used to ensure that the volunteer did not display any lingering effects from the preceding hypoxic exposures. Thus, there were five altitude conditions in the study and all subjects experienced all altitudes so that the study was designed to compare the responses of the two groups of subjects (mTBI vs. controls) across the five altitude conditions. This experimental design is typically referred to as a mixed design since it incorporates between-group (mTBI vs. controls) as well as within-group comparisons (across the hypoxic/altitude conditions) (Field, 2009).
The mTBI and controls were matched for gender, age, resting pulse rate, systolic and
diastolic blood pressures, resting respiration rate, weight, and height to reduce the likelihood that

32
these variables or factors associated with them might predispose one or the other group to the effects of normobaric hypoxia, thereby confusing the experimental results. Height and weight were used to estimate BMI. A simple between-subject multiple analysis of variance (MANOVA) showed that the mTBI and control groups did not differ significantly along any of these dimensions. Each control subject was tested within a week of the mTBI subject to which the control subject was paired, ensuring that any systematic but inadvertent drifts in instrumentation and/or experimental procedures would have essentially simultaneous and therefore equivalent impact on both the mTBI and control groups.
The present report documents the results of this study, excluding discussion of the
neurocognitive results, which are presented in a companion report. The present report provides summary statistics and comparisons of the two study groups, while providing a first order analysis of the major findings derived from all subjects of the two groups.
As expected, the hypoxic stress had significant effects on arterial oxygen saturation
recorded with the pulse oximeter such that the greater the hypoxia (i.e., the higher the altitude or equivalently, the lower the partial pressure of oxygen) the less the arterial oxygen saturation. Thus the physiological stress, hypoxia, had a strong effect on SpO2. More surprising, however, was the unanticipated discovery of a difference in SpO2 between the mTBI and the control subjects. Specifically, while the SpO2 of the mTBI and control groups was indistinguishable at MSL-1 and at MSL-2, at altitudes of 8,000, 12,000, and 14,000 ft MSL not only was the SpO2 of the mTBI group significantly higher than the SpO2 of the control group, but the greater the hypoxia, the greater the difference in SpO2. These completely unanticipated differential effects of the altitude on the SpO2 of the mTBI group and the control group were of a moderate statistical size.
The effects of decreasing PO2 (increasing altitude) were reflected systematically in the
pulse rate that was recorded simultaneously with SpO2. Hypoxia affected pulse rate in that the greater the hypoxia (i.e., the lower the PO2 or equivalently, the higher the altitude), the higher the pulse rate. It should be noted that the pulse rate recorded at MSL-1 was statistically significantly greater than the pulse rate recorded at MSL-2 whereas there was no such statistically significant difference in SpO2 between these two conditions. This would seem to indicate that at the conclusion of the hypoxic condition, the pulse rate was lower than at the start of the study and may simply reflect the relief the subjects experienced that the stressful situation had come to an end. A comprehensive literature review did not identify descriptive information of this depressed pulse rate response to breathing sea level oxygenated (normal air) immediately following short duration exposures to hypoxia.
The pulse rate showed an unanticipated finding that was consistent with the unanticipated
finding of the SpO2 data, the pulse rate of the mTBI group was statistically significantly less than the pulse rate for the control group at the two greatest hypoxic stress levels. In summary, there was strong evidence that the hypoxic stress affected both the pulse rate and the SpO2
of the control (normal) subjects more than both the pulse rate and SpO2 of the mTBI subjects, a very surprising and counterintuitive finding.
33
There was another difference that should be noted between the mTBI and control subjects’ SpO2 and pulse rate response to hypoxic stress. Specifically, this was the difference between the mTBI and the control subjects’ pattern of correlations over altitude among SpO2 and among pulse rate. In effect the difference was reflected in the size of the correlation coefficient calculated among the different hypoxic stress levels for the mTBI subjects and for the control subjects separately for SpO2 and for pulse rate. The pattern was clear, those subjects who had a high pulse rate for one stress level had a high pulse rate for another stress level. Conversely, those with a low pulse rate for one stress level had a low pulse rate for another stress level so that the correlation coefficients provide a measure of the relative consistency of the response across subjects. The same was true for the SpO2 response: those with a high SpO2 for one hypoxic stress tended to have a high SpO2 under another hypoxic stress and so forth. A statistically significant difference was apparent between the mTBI and control subjects in the pattern of correlations such that the correlations are statistically significantly stronger for the mTBI subjects than for the control subjects. In other words, there was more consistency among the mTBI subjects than there was among the control subjects.
None of these differences between the two groups was expected, and to a great extent
they seem counterintuitive. One possible explanation is that they simply reflect a random error (i.e., a false positive); an explanation that seems unlikely in light of the size the effect, the probability levels involved, and the care that was exercised in matching the two groups of volunteers along a number of apparently relevant physical parameters. Another possible explanation concerns the nature of the two groups of volunteers. It is possible that the mTBI volunteers tended to be more physically active than are the control volunteers. In fact it may be argued that the extent of physical activity was a risk factor for mTBI in that these individuals regularly engaged in physically demanding activities more frequently than did the control volunteers. This could mean that the mTBI group would have been more physically fit that the control group, which could account for the fact that as a group, the mTBI volunteers had lower heart rates and higher SpO2 when confronted with the hypoxic stress conditions; a difference completely consistent with being more physically fit. This would mean that the effort to control for such predisposing factors by matching along the dimensions of smoking history, age, gender, weight, and height was insufficient to overcome the other effects of physical conditions for the analyses reported here.
Another possibility is that the difference between the two groups does reflect a systematic
difference resulting from the trauma history. For example, it is known that exercise is associated with the contraction of the spleen and the release of substantial quantities of red blood cells into the circulation resulting in an increased oxygen transport capacity. It has recently been demonstrated that the type of hypoxic stress used in the present study is similarly associated with the contraction of the spleen and the release of substantial quantities of red blood cells into the blood stream within minutes of exposure to hypoxia, a time course that is relevant to the present study (Lodin-Sundstrom & Schagatay, 2010). The stimulus mechanisms signaling this response in the human body have yet to be fully demonstrated, but current evidence suggests more of a hormonal basis than a strictly neural innovation. Regardless of the stimulus mechanisms controlling this response, it is possible that the trauma history might impact the release of red blood cells or similar mechanisms that control the vascular system.

34
One of the aspects of the difference between the mTBI and control volunteers was the implication that the higher SpO2 and lower heart rate of the mTBI group would seem to imply the group was healthier or the cardiovascular system more fit. On the other hand, since heart rate and SpO2 were recorded using a finger pulse oximeter, they reflect only the peripheral circulation and do not reflect any local differences in cerebral circulation. There are many local mechanisms that control the distribution of blood and oxygen throughout the body, with particular emphasis on ensuring that the supply of oxygen to the brain is stable. Thus, a peripheral pulse oximeter at the finger, which can easily be influenced by peripheral vasoconstriction, anemia, hypotension, etc., may not only be a poor indicator of the cerebral oxygenation, but a misleading one. It is possible that if the circulatory system was functioning accurately, ensuring that oxygen would be preferentially delivered to the brain, one would expect the peripheral oximetry measured at the finger to drop. The present results could be completely consistent with this idea, in that the greater SpO2 of the mTBI group might indicate a failure of the system to adjust correctly; a failure that could be due to any of a large number of mechanisms, ranging from local capillary control through pH regulation to changes in receptor dynamics. This idea is consistent with the intuitive expectation that the trauma would decrease rather than an increase a physiological capability.
The hypoxic stress had a statistically significant effect on the oculometric responses but
without any evidence of a difference between the mTBI and control volunteers, a finding that seems to contradict the underlying hypothesis of the presence of lingering, covert, or occult effects of mTBI in otherwise asymptomatic individuals. It should be emphasized that the oculometric battery chosen here is extremely rudimentary, and while it was quickly administered and available with commercial off-the-shelf instrumentation, with the expectation that essentially all the volunteers would be able to complete testing, there was no expectation the battery provides anything but a very rudimentary oculometric assessment. The negative results found here do not provide any guarantee that the oculo-motor system of these individuals was necessarily normal. For example, there was no assessment of smooth pursuit tracking of the eyes, conjugate eye movements, accommodation, or the interconnection among accommodation, convergence, and pupillary constriction. It may be that this study’s most important contribution concerning the use of hypoxic stress for the evaluation of oculometrics in mTBI is that the procedures were well tolerated by all the volunteers, and more sophisticated assessment of oculometrics is worth exploring before concluding that oculometric measures are not sensitive to mTBI and control differences when exposed to hypoxic stress.
Pupil diameter was altered by hypoxia. The magnitude of this effect was evaluated with
respect to the MSL-2 condition, which was the condition of breathing sea level oxygen at the completion of the study after being exposed to all four of the other conditions: the MSL-1 condition and the three hypoxic conditions simulating 8,000 ft, 12,000, and 14,000 ft MSL. It may be noted that the comparisons with MSL-2 were simply a statistical expediency; the comparison with MSL-1 led to the same conclusions, in several instances with greater significance. Pupillary diameter decreased with increased hypoxia, although the difference was statistically significant between MSL-2 and the 12,000 ft and the 14,000 ft MSL conditions it was not at the 8,000 ft condition. While the change in pupil diameter due to hypoxia was statistically significant, the magnitude of the effect was quite small, as can be seen from Table 10. The pupil diameter measured at MSL-2 was 5.419 mm, while the pupil diameter measured at

35
14,000 ft MSL was 5.523 mm, a difference of 0.104 mm, which was less than a 4% decrease in pupil area. While the pupil and pupil diameter are important factors affecting characteristics of the optical imagine forming on the retina, this small change in pupil area in all probability has essentially no impact on the retinal image; as far as the image on the retina is concerned, the effect is completely unimportant. On the other hand, the more important aspect of this finding may lie in the suggestion that the change in pupil diameter reflect a change in the balance between the sympathetic and parasympathetic systems due to hypoxia. It may be noted that the literature on the pupil’s response to hypoxia, reviewed in 1988 by Dyer (Dyer, 1988), contains conflicting reports showing that hypoxia can increase, decrease, or have no effect on pupil diameter, differences that may be due as much to with the specifics of the experimental procedures as to the fact that the pupil’s response to hypoxia seems to be so small.
Similarly, the results showed a systematic decrease in the amplitude of the pupil’s
response to a flash of light as a function of hypoxia. At 12,000 ft MSL the 1.102 mm response to light was about 94.3% of the area measured at MSL-2, and the area at 14,000 ft MSL was 87.6%. It may be noted that the latency of the pupil’s response was unaffected by hypoxia. Since the autonomic nervous system clearly can have large effects on the pupil’s diameter, response amplitude, and response latency, it is only to be expected that emotion, arousal, anxiety, etc. would impact these oculometrics. For example, the difference in the measurements made under MSL-1 and MSL-2 could well reflect the fact the MSL-1 condition incorporates any emotional component arising from the imminent hypoxic stress while the MSL-2 condition incorporates the emotional component associated with the completion of hypoxic stress conditions and the near completion of the study period.
There was some evidence that hypoxia systematically reduced saccadic velocity, since
the velocities measured for the 12,000 ft, 14,000 ft, and MSL-2 conditions were not different from each other but the MSL-2 velocity was significantly slower than the MSL-1 condition. The t-test comparison of the saccadic velocity at MSL-1 with 8,000 ft MSL was not statistically significant (t = .584, p < .561) but the MSL-1 was significantly faster than the velocity measured at 12,000 (t = 2.05, p < .044), 14,000 ft MSL (t = 3.233, p < .002), and at MSL-2 (t = 3.088, p < .003). While the MSL-2 condition might have incorporated hypoxia effects that may have accumulated over the successive altitude exposures, the finding of a decrease in saccadic velocity is consistent with the literature (Cymerman et al., 2005).
Analysis failed to show a significant difference between the groups of mTBI and control
volunteers in their responses to the ESQ AMS-C, the self-report questionnaire of physical symptoms associated with hypoxia. Although the differences between the mTBI and control groups were not statistically significant, the mTBI group had a greater symptom rating than did the control volunteers for 8,000, 12,000, and 14,000 ft MSL (Table 11 and Figure 9). This negative finding shows that the hypoxia was well tolerated by the subjects. The time course relationship between time since trauma, magnitude of trauma, and physical symptoms associated with hypoxia is currently unavailable in the literature, and future work should use sound scientific methods to provide descriptive responses.
The relation between symptom severity and hypoxic condition was explored further.
Since there were no statistically significant differences between the two groups of volunteers, the
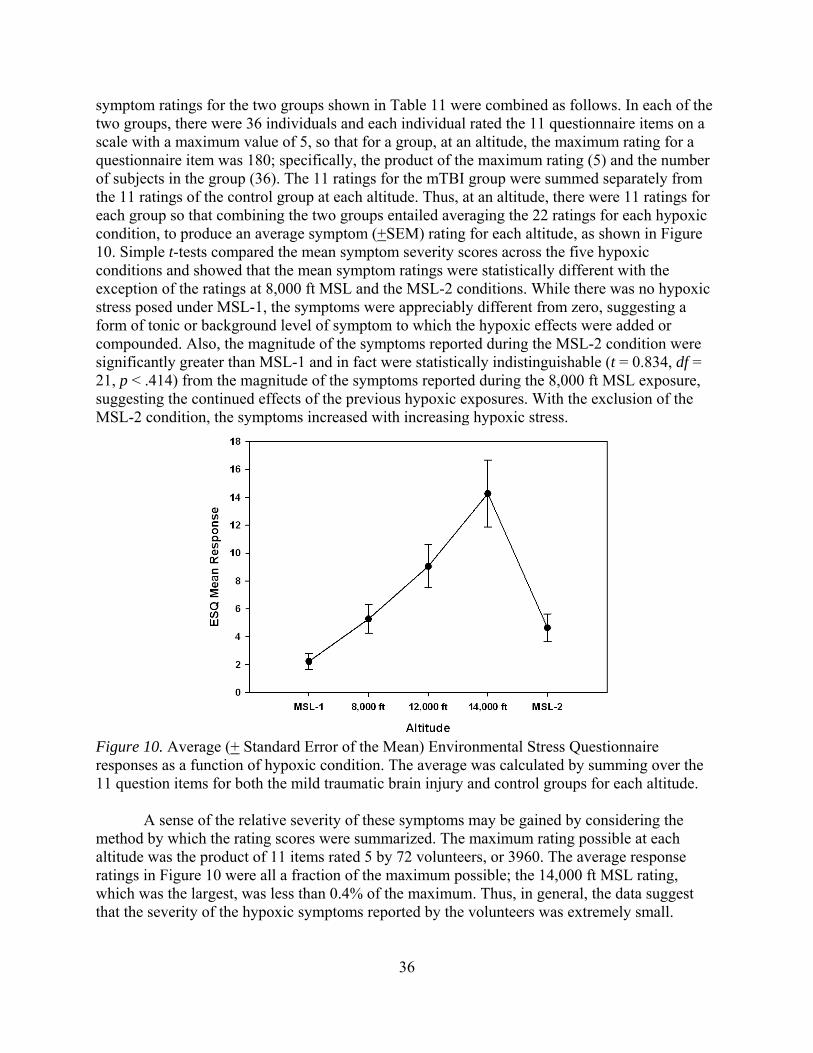
36
symptom ratings for the two groups shown in Table 11 were combined as follows. In each of the two groups, there were 36 individuals and each individual rated the 11 questionnaire items on a scale with a maximum value of 5, so that for a group, at an altitude, the maximum rating for a questionnaire item was 180; specifically, the product of the maximum rating (5) and the number of subjects in the group (36). The 11 ratings for the mTBI group were summed separately from the 11 ratings of the control group at each altitude. Thus, at an altitude, there were 11 ratings for each group so that combining the two groups entailed averaging the 22 ratings for each hypoxic condition, to produce an average symptom (+SEM) rating for each altitude, as shown in Figure 10. Simple t-tests compared the mean symptom severity scores across the five hypoxic conditions and showed that the mean symptom ratings were statistically different with the exception of the ratings at 8,000 ft MSL and the MSL-2 conditions. While there was no hypoxic stress posed under MSL-1, the symptoms were appreciably different from zero, suggesting a form of tonic or background level of symptom to which the hypoxic effects were added or compounded. Also, the magnitude of the symptoms reported during the MSL-2 condition were significantly greater than MSL-1 and in fact were statistically indistinguishable (t = 0.834, df = 21, p < .414) from the magnitude of the symptoms reported during the 8,000 ft MSL exposure, suggesting the continued effects of the previous hypoxic exposures. With the exclusion of the MSL-2 condition, the symptoms increased with increasing hypoxic stress.
Figure 10. Average (+ Standard Error of the Mean) Environmental Stress Questionnaire responses as a function of hypoxic condition. The average was calculated by summing over the 11 question items for both the mild traumatic brain injury and control groups for each altitude.
A sense of the relative severity of these symptoms may be gained by considering the method by which the rating scores were summarized. The maximum rating possible at each altitude was the product of 11 items rated 5 by 72 volunteers, or 3960. The average response ratings in Figure 10 were all a fraction of the maximum possible; the 14,000 ft MSL rating, which was the largest, was less than 0.4% of the maximum. Thus, in general, the data suggest that the severity of the hypoxic symptoms reported by the volunteers was extremely small.
37
On the other hand as mentioned in association with the symptom severity summarized in Table 11, the 11 ESQ AMS-C items do seem to show differences in response severity to hypoxia even though all the 11 items were selected to reflect the symptoms that defined the cerebral factor of Acute Mountain Sickness. In general, the 11 questionnaire items may be grouped into three general classes based on the relative ranking of the total symptom severity, granting that the magnitude of the symptoms were slight. Summing over all 72 volunteers over the five altitude conditions with a maximum severity of 5 produced a maximum possible symptom rating of 1800. The different symptoms can be compared to this maximum value. The slightest symptoms involved a loss of appetite (0.167 % of maximum), a feeling of hangover (0.667%), a feeling of sickness (0.667%), and feeling nauseous (1.222%). The slightly more severe symptoms involved feeling weak (4.056%), feeling dizzy (4.111%), feeling faint (4.556%), having dim vision (4.611%), having a headache (5.222%). The most severe symptoms involved feeling light headed (8.333%) and reporting that the coordination was off (9.722%). Thus it would seem that even though symptom severity was quite modest in general, there was evidence that the hypoxic stress had a spectrum of effects with the most severe affecting coordination and light headedness. It would be important to extend the analysis of the present dataset to examine the relationships among symptom severity, oculometrics, and pulse oximetry.
Conclusion
The present analysis is intended to provide a description and summary of the complete
dataset for the study described above. While it provides a description of the main trends of the complete dataset, it is not intended to be an exhaustive treatment of the data analysis; consequently, it does not take into account a number of other factors that can reasonably be expected to affect the results and that need to be examined before definitive conclusions are drawn from these data. For example, the most obvious such factor concerns the range in the length of time between the trauma and volunteer’s test participation, an interval that ranges from 1.7 to 119.7 months. In addition, attention should be paid to physical conditioning indices such as BMI, blood pressures, and more careful consideration of the magnitude of the hypoxic responses.
In summary, the results showed that SpO2 and pulse rate responses differed between
individuals with a history of mTBI who were asymptomatic at the time of the study and matched healthy controls when exposed to the normobaric hypoxic stress conditions equivalent to 8,000, 12,000, and 14,000 ft MSL. FIT measures and subject measures (ESQ AMS-C) showed responses to the within subjects variable of hypoxia level but did not show significant differences between the two groups. Overall, this set of findings did not fully support all a priori hypotheses and moreover the SpO2 and pulse rate responses were counter intuitive in that they were expected to be depressed in the mTBI group compared to controls but were found to be elevated above the control group values.

38
References
Centers for Disease Control and Prevention. (2010). Injury Prevention and Control: Traumatic Brain Injury. Retrieved from http://www.cdc.gov/ncipc/tbi/
Department of Defense, Panel to Review the V-22 Program. (2001). Report of the Panel to
Review the V-22 Program. Retrieved from http://www.fas.org/man/dod-101/sys/ac/v22-report.pdf
Department of the Army, Flight Regulations. Army Regulation 95-1. Washington, DC: U.S.
Department of the Army, March 11, 2014. Department of the Navy, Office of the Chief of Naval Operations, Natops General Flight and
Operating Instructions. OPNAV Instruction 3710.7T 8.2.4.1. Washington, DC: U.S. Department of the Navy, March 1, 2004.
Department of Transportation. (2000). Federal Aviation Regulations and Aeronautical
Information Manual. Department of Veterans Affairs and Department of Defense, The Management of
Concussion/mTBI Working Group. (2009). VA/DoD Clinical Practice Guideline for Management of Concussion / Mild Traumatic Brain Injury Version 1.0. Retrieved from http://www.healthquality.va.gov/management_of_concussion_mtbi.asp
Department of Veterans Affairs, Employee Education System. (2004). Veterans Health
Initiative: Traumatic Brain Injury, Independent Study Course. Retrieved from http://www.publichealth.va.gov/docs/vhi/traumatic_brain_injury.pdf
Cohen, J. (2013). Statistical power analysis for the behavioral sciences. Academic press. Cottrell, J. J., Lebovitz, B. L., Fennell, R. G., & Kohn G. M. (1995). Inflight arterial saturation:
Continuous monitoring by pulse oximetery. Aviation, Space, and Environmental Medicine, 66(2), 126-130.
Cymerman, A., Muza, S. R., Ditzer, D., Friedlander, A. L., Hagobian, T., Subudhi, A., Jacobs,
K, Stone, K., & Fulco, C. S. (2003). Oculomotor and pupillary reflexes during acute exposure to hypobaric hypoxia (Report No. T03-04). Aberdeen Proving Ground, MD: U.S. Army Research Institute of Environmental Medicine.
Cymerman, A., Muza, S. R., Friedlander, A. L., Fulco, C. S., & Rock, P. B. (2005). Saccadic
velocity and papillary reflexes during acclimatization to altitude (4300 m). Aviation, Space, and Environmental Medicine, 76, 627-634.
Dyer, F. N. (1988). Effects of low and high oxygen tensions and related respiratory conditions
on visual performance: A literature review (USAARL Technical Report No. 88-7). Fort Rucker, AL: U. S. Army Aeromedical Research Laboratory.
39
Ewing, R., McCarthy, D., Gronwall, D., & Wrightson, P. (1980). Persisting effect of minor head
injury observable during hypoxic stress. Journal of Clinical Neuropsychology, 2, 147-155.
Field, A. (2009). Discovering Statistics Using SPSS. Thousand Oaks, CA: SAGE Publications,
Ltd. Gradwell, D.P. (2006). Hypoxia and hyperventilation. In D. J. Rainford & D. P. Gradwell (Eds.),
Ernsting’s Aviation Medicine (pp. 41-56). London: Hodder Arnold. Kraus, J. F., & Chu, L. D. (2005). Epidemiology. In J. M. Silver, T. W. McAllister, & S. C.
Yudofsky (Eds.), Textbook of Traumatic Brain Injury (pp. 3-26). Arlington, VA: American Psychiatric Publishing, Inc.
LeDuc, P. A., Greig, J. L., & Dumond, S. L. (2005). Involuntary eye responses as measures of
fatigue in U.S. Army Apache aviators. Aviation, Space, and Environmental Medicine, 76(7, Suppl.), C86-91.
LeDuc, P. A., Greig, J. L., & Dumond, S. L. (2005). Self-reported and ocular measures of
fatigue in U. S. Army Apache aviators following flight. (USAARL Technical Report No. 2005-10). Fort Rucker, AL: U. S. Army Aeromedical Research Laboratory.
McAllister, T. W. (2005). Mild brain injury and the post-concussive syndrome. In J. M. Silver,
T. W. McAllister, and S. C. Yudofsky (Eds.), Textbook of Traumatic Brain Injury (pp. 279-308). Arlington, VA: American Psychiatric Publishing, Inc.
Muhm J. M. (2004). Predicted arterial oxygenation at commercial aircraft cabin altitudes
Aviation, Space, and Environmental Medicine, 75, 905-912. Muhm J. M., Rock, P. B., McMullin, D. L., Jones, S. P., Eilers, K. D., & McMullen, A. (2007).
Effects of aircraft-cabin altitude on passenger discomfort. New England Journal of Medicine, 357, 18-27.
National Research Council, Committee on Air Quality in Passenger Cabins of Commercial
Aircraft, Board on Environmental Studies and Toxicology, Division on Earth and Life Science. (1986). The airliner cabin environment and the heath of passengers and crew. Washington, DC: National Academy Press.
National Research Council, Committee on Air Quality in Passenger Cabins of Commercial
Aircraft, Board on Environmental Studies and Toxicology, Division on Earth and Life Science. (2002). The airliner cabin environment and the heath of passengers and crew. Washington, DC: National Academy Press.
Ramiccio, J. (1998). Hypoxic hypoxia in a Hawk? FlightFax, 26(9), 6-7.

40
Rothberg, M., Cornsweet, T., & Rafal, M. D. (1995). U.S. Patent Number 5422690. Washington, DC: U.S. Patent and Trademark Office.
Sampson, J. B., Cymerman, A., Burse, R. L., Maher, J. T., & Rock, P. B. (1983). Procedures for
the measurement of acute mountain sickness. Aviation, Space, and Environmental Medicine, 54, 1063-1073.
Sausen K. P., Bower, E. A., Stiney, M. E., Feigl, C., Wartman, R., & Clark, J. B. (2003). A
closed-loop reduced oxygen breathing device for inducing hypoxia in humans. Aviation, Space, and Environmental Medicine, 74(11), 1190-1197.
Sausen, K. P., Wallick, M. T., Slobodnik, B., Chimiak, J. M., Bower, E. A., Stiney, M. E., &
Clark, J. B. (2001). The reduced oxygen breathing paradigm for hypoxia training: physiological, cognitive, and subjective effects. Aviation, Space, and Environmental Medicine, 72, 539-545
Lodin-Sundstrom A. & Schagatay E. (2010). Spleen contraction during 20 min normobaric
hypoxia and 2 min apnea in humans. Aviation, Space, and Environmental Medicine, 81(6), 545-549.
Temme, L. A., Still, D. L., & Acromite, M. T. (2009). The effects of hypoxia on the flight
performance of active duty, instructor pilots in fixed wing flight simulator (abstract). Aviation, Space, and Environmental Medicine, 80(3), 314.
Temme, L. A., Still, D. L., & Acromite, M. T. (2010). Hypoxia and flight performance of
military instructor pilots in a flight simulator. Aviation, Space, and Environmental Medicine, 81(7), 654-659.

41
Appendix A. Mild Traumatic Brain Injury Group Description.
SubjectNumber Gender Age Pulse
BP Systolic
BP Diastolic Respiration
Weight (lbs) Height (in) BMI
Months Since
Trauma LOC Amnesia1101 M 24 43 111 63 12 190 70.5 27.3 23.6 1 01102 M 20 60 117 67 20 164 71.5 22.9 16.7 0 01103 F 21 75 108 74 12 124 61 22 18.0 0 01104 M 23 69 108 67 16 162 68 24 20.1 1 01105 F 20 83 122 81 16 145 68 21 19.1 1 01106 M 29 80 110 70 16 349 71 48.7 17.2 0 01107 F 26 79 120 80 10 116 63 21 25.0 0 01109 M 20 52 127 52 9 210 71 30 105.8 1 01111 M 20 54 111 56 8 176 74 22 33.8 0 01112 M 24 72 126 80 6 172 69 25 34.9 1 01113 M 26 64 127 87 11 238 73 31 76.6 1 01114 M 20 70 122 79 12 162 72 22 17.8 1 01116 M 19 56 86 49 12 142 70 20 23.9 1 01117 M 29 96 125 80 12 315 72 42 1.7 1 01118 M 38 79 149 84 20 267 72 36.2 15.0 1 11119 M 30 76 135 79 16 327 79 36.8 7.9 0 01120 M 32 86 145 90 16 279 76 34 63.8 1 11121 F 21 68 111 76 10 129 66 20 7.4 1 11122 M 33 71 125 86 24 193 67 30 13.2 0 01123 F 29 63 105 73 16 255 64 43.8 119.7 0 01124 F 21 80 100 69 12 140 64 24 17.3 0 01125 M 36 79 105 69 20 153 68 23 55.9 0 01126 M 18 76 130 76 20 165 70 23 14.5 0 01127 M 21 74 108 65 12 134 70 19 29.0 0 01129 F 20 72 106 73 12 204 68 31 76.4 1 01130 M 26 77 148 90 15 364 71 48 109.9 0 01132 F 24 62 105 64 12 154 66 25 51.2 1 01133 M 25 69 137 83 10 199 69 29 16.7 0 01134 M 26 73 124 79 15 233 69 34 66.6 1 01135 M 33 72 114 81 20 208 59 31 34.2 1 11136 M 35 59 107 65 12 146 68 22 106.2 1 01137 M 22 52 120 74 20 171 76 21 35.3 0 01138 M 27 86 144 70 12 194 71 27 8.0 0 01139 M 24 57 124 78 12 204 74 26 62.8 1 01140 F 18 78 119 71 20 159 65 26 7.1 0 01141 M 29 87 144 80 12 259 76 31 7.8 1 0
Note. BMI = Body Mass Index; BP = Blood Pressure LOC = Loss of Consciousness, 1 = Yes, 0 = No; Amnesia, 1 = Yes, 0 = No; Respiration in breaths per minute

42
Appendix B. Control Group Description.
SubjectNumber Gender Age Pulse
BP Systolic BP Diastolic Respiration
Weight (lbs) Height (in) BMI
1201 M 24 59 119 82 12 211 75 26.4
1202 M 21 71 130 75 16 211 76.5 26
1203 F 22 59 101 69 18 135.4 68 21
1204 M 24 76 108 64 14 142.4 64.5 24
1205 F 20 76 106 65 8 142 71.5 20
1206 M 28 61 116 80 14 164 72 22
1207 F 23 83 110 74 12 156 65.5 24
1209 M 20 69 137 81 12 202 72 27
1211 M 20 54 134 85 12 191 69 28
1212 M 20 93 103 65 20 203 73 26
1213 M 27 86 118 66 12 157 75 20
1215 M 19 63 108 66 10 127 70 18
1216 M 18 73 130 78 15 388 73 51.2
1217 M 30 95 138 93 20 455 67 71.3
1218 M 34 91 122 76 20 199 71 27.8
1219 M 32 73 132 78 16 194 70 28
1220 M 30 77 148 88 16 517 70 31
1221 F 21 95 104 71 20 129 66 21
1222 M 33 90 125 79 10 189 71 26
1223 F 28 84 101 69 20 250 63 44
1224 F 21 69 102 70 20 156 64 26.8
1225 M 34 74 143 86 8 239 63 60
1226 M 21 69 121 68 20 238 71 33
1227 M 20 69 115 60 80 212 77 25
1229 F 23 81 105 65 20 140 68 21
1231 M 23 52 114 63 12 186 68 28
1232 F 25 85 129 77 12 266 68 40
1233 M 27 70 126 71 14 143 71 20
1234 M 27 66 138 68 12 208 72 29
1235 M 32 65 110 76 12 150 71 21
1236 M 33 69 116 70 14 204 73 27
1237 M 20 45 128 71 16 174 70 25
1238 M 27 56 125 72 20 268 74 34
1239 M 23 51 121 70 16 200 70 29
1240 F 18 62 109 68 16 173 68 26
1241 M 28 107 162 82 20 276 67 43 Note. BP = Blood pressure mmHg; BMI = Body Mass Index; Respiration in breaths per minute
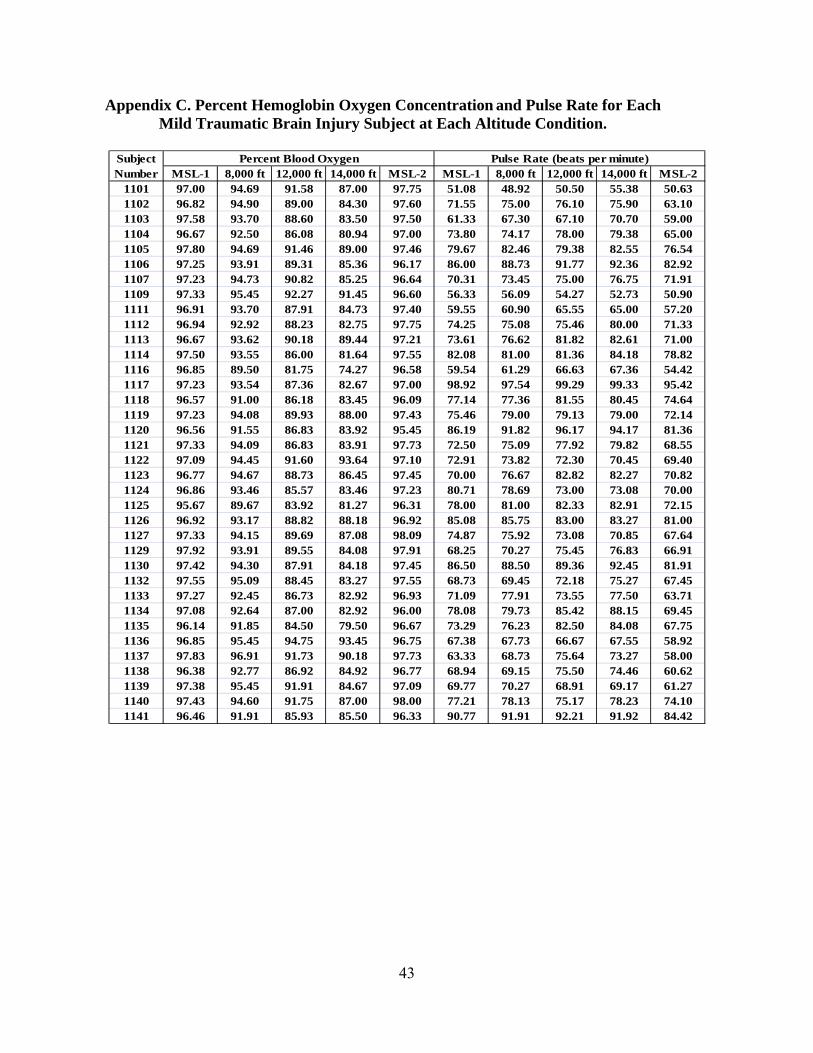
43
Appendix C. Percent Hemoglobin Oxygen Concentration and Pulse Rate for Each Mild Traumatic Brain Injury Subject at Each Altitude Condition.
MSL-1 8,000 ft 12,000 ft 14,000 ft MSL-2 MSL-1 8,000 ft 12,000 ft 14,000 ft MSL-21101 97.00 94.69 91.58 87.00 97.75 51.08 48.92 50.50 55.38 50.631102 96.82 94.90 89.00 84.30 97.60 71.55 75.00 76.10 75.90 63.101103 97.58 93.70 88.60 83.50 97.50 61.33 67.30 67.10 70.70 59.001104 96.67 92.50 86.08 80.94 97.00 73.80 74.17 78.00 79.38 65.001105 97.80 94.69 91.46 89.00 97.46 79.67 82.46 79.38 82.55 76.541106 97.25 93.91 89.31 85.36 96.17 86.00 88.73 91.77 92.36 82.921107 97.23 94.73 90.82 85.25 96.64 70.31 73.45 75.00 76.75 71.911109 97.33 95.45 92.27 91.45 96.60 56.33 56.09 54.27 52.73 50.901111 96.91 93.70 87.91 84.73 97.40 59.55 60.90 65.55 65.00 57.201112 96.94 92.92 88.23 82.75 97.75 74.25 75.08 75.46 80.00 71.331113 96.67 93.62 90.18 89.44 97.21 73.61 76.62 81.82 82.61 71.001114 97.50 93.55 86.00 81.64 97.55 82.08 81.00 81.36 84.18 78.821116 96.85 89.50 81.75 74.27 96.58 59.54 61.29 66.63 67.36 54.421117 97.23 93.54 87.36 82.67 97.00 98.92 97.54 99.29 99.33 95.421118 96.57 91.00 86.18 83.45 96.09 77.14 77.36 81.55 80.45 74.641119 97.23 94.08 89.93 88.00 97.43 75.46 79.00 79.13 79.00 72.141120 96.56 91.55 86.83 83.92 95.45 86.19 91.82 96.17 94.17 81.361121 97.33 94.09 86.83 83.91 97.73 72.50 75.09 77.92 79.82 68.551122 97.09 94.45 91.60 93.64 97.10 72.91 73.82 72.30 70.45 69.401123 96.77 94.67 88.73 86.45 97.45 70.00 76.67 82.82 82.27 70.821124 96.86 93.46 85.57 83.46 97.23 80.71 78.69 73.00 73.08 70.001125 95.67 89.67 83.92 81.27 96.31 78.00 81.00 82.33 82.91 72.151126 96.92 93.17 88.82 88.18 96.92 85.08 85.75 83.00 83.27 81.001127 97.33 94.15 89.69 87.08 98.09 74.87 75.92 73.08 70.85 67.641129 97.92 93.91 89.55 84.08 97.91 68.25 70.27 75.45 76.83 66.911130 97.42 94.30 87.91 84.18 97.45 86.50 88.50 89.36 92.45 81.911132 97.55 95.09 88.45 83.27 97.55 68.73 69.45 72.18 75.27 67.451133 97.27 92.45 86.73 82.92 96.93 71.09 77.91 73.55 77.50 63.711134 97.08 92.64 87.00 82.92 96.00 78.08 79.73 85.42 88.15 69.451135 96.14 91.85 84.50 79.50 96.67 73.29 76.23 82.50 84.08 67.751136 96.85 95.45 94.75 93.45 96.75 67.38 67.73 66.67 67.55 58.921137 97.83 96.91 91.73 90.18 97.73 63.33 68.73 75.64 73.27 58.001138 96.38 92.77 86.92 84.92 96.77 68.94 69.15 75.50 74.46 60.621139 97.38 95.45 91.91 84.67 97.09 69.77 70.27 68.91 69.17 61.271140 97.43 94.60 91.75 87.00 98.00 77.21 78.13 75.17 78.23 74.101141 96.46 91.91 85.93 85.50 96.33 90.77 91.91 92.21 91.92 84.42
Pulse Rate (beats per minute)SubjectNumber
Percent Blood Oxygen

44
Appendix D. Percent Oxygen Percent Hemoglobin Oxygen Concentration and Pulse Rate for Each Control Subject at Each Altitude Condition.
MSL-1 8,000 ft 12,000 ft 14,000 ft MSL-2 MSL-1 8,000 ft 12,000 ft 14,000 ft MSL-21202 97.00 94.00 88.83 87.00 97.00 74.77 75.18 74.42 72.62 67.751203 97.45 92.92 79.82 80.10 96.91 66.09 68.25 72.09 75.30 62.181204 97.09 93.31 84.09 81.45 97.10 69.27 73.00 76.91 77.00 61.001205 96.91 92.55 85.73 82.18 97.27 78.27 82.36 88.91 88.27 73.451206 97.20 92.93 88.38 84.80 97.15 72.67 69.20 72.56 71.40 63.151207 97.15 93.13 89.77 84.08 97.60 87.23 88.47 88.15 94.33 89.301209 97.75 93.45 87.82 82.45 97.73 86.92 88.27 90.45 100.91 84.731211 97.15 93.23 88.58 85.23 97.00 56.31 61.23 62.95 67.00 56.571212 96.92 92.73 86.70 82.50 96.90 92.83 93.36 95.60 93.80 88.401213 96.17 91.73 87.00 83.80 95.90 85.42 89.45 91.80 90.20 81.401215 96.50 93.55 91.45 87.36 96.82 67.42 71.09 68.73 73.09 65.001216 96.73 90.92 81.85 74.29 96.54 81.13 85.08 89.08 86.79 79.851217 96.75 90.18 82.25 83.00 96.36 98.00 104.36 109.17 108.18 97.821218 96.00 90.64 84.36 80.36 96.18 86.75 94.09 95.36 93.82 75.731219 96.75 94.82 91.45 89.91 97.00 69.17 74.00 73.36 71.82 65.451220 96.69 91.27 87.82 85.36 97.00 82.23 88.45 89.91 97.00 85.001221 97.00 92.91 85.45 79.09 97.09 94.31 98.27 101.82 105.91 93.091222 96.92 92.40 87.40 83.00 96.50 86.92 86.70 86.70 86.30 75.301223 96.62 91.75 85.00 76.58 96.46 80.62 88.75 96.36 100.17 78.081224 97.58 95.09 90.64 88.80 97.40 68.17 71.18 69.82 72.80 65.201225 97.33 92.36 82.58 81.00 96.73 87.75 90.27 92.83 94.27 83.001226 96.64 93.92 77.36 86.44 96.54 78.50 76.54 76.14 76.06 65.851227 96.92 92.69 86.93 85.46 97.83 66.77 70.08 76.14 71.92 63.671229 96.79 93.50 85.42 79.30 97.36 82.79 80.25 85.08 87.90 73.731231 96.09 90.82 80.18 72.27 97.09 67.73 72.73 79.55 82.09 62.911232 97.46 92.21 85.29 82.38 98.54 81.92 82.71 81.43 83.85 78.691233 97.00 91.45 84.00 79.91 97.36 80.42 82.36 81.64 76.55 66.091234 97.25 91.40 83.73 76.55 96.09 75.17 77.00 78.55 78.91 62.451235 96.77 93.83 88.42 86.82 96.75 63.69 62.33 64.58 64.64 57.831236 96.67 93.18 88.58 86.00 96.45 73.67 75.00 75.58 75.00 70.181237 97.17 93.18 86.18 80.00 96.80 52.50 58.00 68.82 70.40 44.901238 96.23 87.73 76.82 76.38 95.94 65.31 66.47 70.64 71.38 64.691239 97.08 93.45 87.30 82.70 97.20 60.75 65.00 73.60 71.30 58.301240 97.57 92.36 83.40 78.07 97.13 63.57 67.64 70.53 74.93 58.271241 97.08 93.54 87.85 82.73 97.07 106.25 113.08 116.85 116.67 103.21
SubjectNumber
Percent Blood Oxygen Pulse Rate (beats per minute)

45
Appendix E. Oculometrics Recorded in the Mild Traumatic Brain Injury Subjects.
MSL-1 8,000 ft 12,000 ft 14,000 ft MSL-2 MSL-1 8,000 ft 12,000 ft 14,000 ft MSL-21101 5.353 5.071 4.689 5.065 5.357 0.983 1.117 1.169 1.117 1.2481102 5.523 5.120 4.811 5.053 5.675 1.331 1.100 1.063 1.022 1.3391103 6.544 6.591 6.545 6.464 6.378 1.586 1.582 1.553 1.517 1.5311104 3.953 4.266 . 3.008 . 0.965 0.918 . 0.454 .1105 5.856 5.622 5.445 5.314 5.243 1.758 1.563 1.425 1.310 1.2401106 5.071 4.971 4.774 4.681 4.165 1.534 1.573 1.609 1.650 1.4611107 3.849 4.150 3.527 3.713 4.363 1.073 1.163 1.017 0.976 1.1871109 7.579 7.244 7.317 7.416 6.868 1.166 1.409 1.320 1.275 1.4651111 4.096 3.904 4.174 4.170 4.469 0.892 0.817 1.003 0.905 1.0321112 5.930 6.104 6.273 6.039 6.330 1.122 1.212 0.965 1.092 1.1551113 7.031 7.466 7.244 . . 0.984 0.731 1.120 . .1114 6.755 6.026 6.591 6.033 6.419 1.113 1.079 0.999 1.008 1.0161116 6.074 5.850 5.826 5.811 5.323 1.404 1.347 1.456 1.341 1.1921117 6.339 5.925 5.826 5.644 6.029 1.092 1.333 1.406 1.319 1.1431118 4.063 3.881 3.998 3.956 4.061 0.881 1.027 1.055 1.030 1.0631119 4.713 4.996 5.228 5.152 5.366 1.142 1.315 1.358 1.354 1.4621120 5.559 5.502 5.354 5.399 5.473 0.556 0.532 0.551 0.702 0.6591121 4.452 4.724 4.376 4.064 4.123 1.026 1.109 0.900 0.882 1.0131122 3.914 3.926 3.792 3.943 3.998 0.849 0.872 0.688 0.839 0.7891123 5.293 5.157 5.392 5.447 5.079 0.967 0.848 0.983 1.032 0.8601124 5.892 5.772 5.432 5.833 5.586 1.084 1.041 0.996 1.086 1.0941125 6.575 6.628 6.329 6.240 6.422 1.106 1.186 1.065 0.927 1.2411126 6.570 6.616 6.377 6.495 6.078 1.467 1.302 1.385 1.286 1.4021127 5.408 5.600 5.263 5.173 5.353 1.282 1.280 1.121 1.148 1.1161129 5.922 5.460 4.981 5.187 5.299 0.820 0.785 0.794 0.740 0.7631130 4.927 4.850 4.787 4.031 4.690 1.090 1.130 1.106 0.927 1.1141132 5.856 5.826 5.486 5.552 5.668 1.242 1.334 1.310 1.315 1.2431133 3.941 3.698 3.797 3.567 4.176 1.026 0.966 0.966 0.930 1.0661134 6.426 6.184 5.846 5.215 5.783 1.318 1.259 1.243 0.995 1.2971135 3.413 3.887 . 3.440 4.018 1.109 1.144 . 0.997 1.1141136 5.913 5.705 5.681 5.801 5.613 1.355 1.280 1.250 1.304 1.2931137 5.034 4.666 4.888 4.984 4.863 0.892 0.752 0.723 0.703 0.7931138 5.213 4.470 4.218 3.991 4.254 0.954 0.761 0.676 0.715 0.8111139 4.481 4.493 4.358 4.074 4.582 0.716 0.790 0.766 0.743 0.8061140 5.742 5.543 5.117 4.441 4.463 1.372 1.124 0.952 0.837 0.8981141 4.167 4.277 4.124 3.803 3.706 1.207 1.173 1.259 1.004 0.941
SubjectNumber
Pupil Diameter (mm) Pupil Response Amplitude (mm)
Note. Subjects 1104, 1113, and 1135 had conditions in which the FIT did not measure the pupil accurately. It is interesting to note that both the mTBI and control groups had the same number, five, conditions in which the FIT did not accurately capture data because this is indicative of a constant error rate.

46
Oculometrics Recorded in the Mild Traumatic Brain Injury Subjects, continued.
MSL-1 8,000 ft 12,000 ft 14,000 ft MSL-2 MSL-1 8,000 ft 12,000 ft 14,000 ft MSL-21101 318.352 305.356 309.082 309.271 320.719 71.528 68.320 68.938 70.196 68.3441102 311.362 322.875 306.062 326.848 307.708 74.824 73.893 72.878 71.247 68.8141103 285.071 284.074 292.156 290.750 290.316 75.998 73.308 72.642 75.259 75.5561104 283.831 294.391 . 328.580 . 68.029 62.621 63.974 52.951 .1105 263.482 270.980 277.094 289.877 304.468 66.822 62.372 64.995 62.778 64.5581106 286.685 280.061 283.140 282.082 286.440 76.268 66.104 67.813 61.813 59.3281107 268.763 277.407 268.164 269.976 278.179 66.608 63.553 64.102 65.634 65.9611109 301.252 294.592 309.531 295.544 304.580 83.126 82.355 79.461 85.994 83.8621111 265.997 263.959 260.532 271.407 271.730 83.648 81.172 81.368 82.724 81.2891112 277.045 282.777 285.062 267.559 275.637 72.631 70.387 70.660 73.829 69.7591113 296.118 307.131 295.451 . . 68.785 66.186 63.777 63.237 61.6801114 298.030 291.513 301.036 296.421 304.366 70.320 68.209 66.377 74.232 64.4711116 293.429 296.058 296.580 285.880 290.865 75.704 75.529 65.567 63.910 56.7831117 307.231 292.349 288.699 290.050 313.641 67.992 67.537 67.033 65.554 72.8391118 289.269 283.268 287.395 289.199 281.510 71.947 64.883 66.243 65.119 66.9081119 325.403 329.825 328.123 330.237 318.406 72.368 76.916 81.488 76.104 74.7981120 361.514 356.838 352.289 342.544 339.469 84.324 74.223 71.144 68.776 71.1951121 295.933 289.574 289.033 281.493 281.768 70.263 63.829 64.764 66.854 65.0211122 282.396 278.010 296.780 283.037 298.622 73.609 71.736 70.259 68.192 74.2941123 344.410 330.620 330.800 340.325 355.043 67.258 64.898 74.648 63.166 60.8351124 320.901 301.740 306.249 312.322 298.873 71.218 74.412 72.385 74.465 75.0351125 328.559 328.269 326.637 335.215 319.548 66.259 61.491 72.077 60.614 60.6901126 288.064 300.090 289.629 288.421 289.107 77.210 77.248 77.619 72.796 71.6441127 309.459 307.548 318.131 308.940 319.727 72.886 68.930 71.938 72.917 71.9891129 332.703 326.383 343.893 334.102 360.957 81.548 81.961 82.854 80.770 82.7941130 267.116 266.912 254.758 250.369 257.250 91.329 86.244 88.421 90.872 88.7611132 305.925 306.508 288.773 315.154 313.787 82.182 82.810 82.081 81.986 82.9071133 281.833 286.362 289.392 284.049 296.708 84.471 86.844 82.477 85.825 80.9281134 290.087 286.253 299.405 313.738 291.630 66.147 58.704 63.455 58.528 75.3481135 271.581 282.090 . 283.259 280.009 65.142 66.632 64.043 68.262 65.5351136 288.648 294.222 308.914 300.411 292.466 81.499 79.753 83.278 81.929 82.5641137 291.448 309.098 335.881 301.807 327.881 70.570 74.440 69.340 75.765 73.9191138 301.006 291.359 292.162 302.084 284.728 63.416 69.179 69.560 65.087 64.8921139 293.453 286.416 305.993 297.414 303.993 66.386 69.929 72.430 68.461 64.2951140 309.880 314.158 313.708 314.136 312.811 69.823 66.707 66.967 63.317 66.7921141 314.475 307.785 306.883 294.483 306.764 79.957 83.795 82.453 83.169 78.076
Saccadic Velocity (deg/sec)SubjectNumber
Pupil Response Latency (ms)
Note. Subjects 1104, 1113, and 1135 had conditions in which the FIT did not measure the pupil accurately. It is interesting to note that both the mTBI and control groups had the same number, five, conditions in which the FIT did not accurately capture data because this is indicative of a constant error rate.

47
Appendix F. Oculometrics Recorded in the Control Subjects.
MSL-1 8,000 ft 12,000 ft 14,000 ft MSL-2 MSL-1 8,000 ft 12,000 ft 14,000 ft MSL-21201 6.354 5.829 6.334 5.036 5.818 1.340 1.532 1.348 1.060 1.2871202 6.153 6.058 6.255 5.884 6.241 1.489 1.367 1.530 1.620 1.4991203 5.433 5.698 5.303 4.608 5.533 1.447 1.500 1.399 1.215 1.4361204 4.945 4.451 4.256 4.385 4.873 1.174 1.103 0.919 1.087 1.2531205 7.124 7.281 7.012 7.175 7.141 1.160 1.268 1.204 0.989 1.1441206 3.903 3.942 . 3.862 4.199 1.182 1.233 . 1.169 1.2841207 6.158 6.268 5.972 6.336 6.226 1.344 1.343 1.336 1.089 1.3181209 7.426 7.176 7.158 7.026 7.368 0.890 1.029 0.833 0.791 0.8551211 5.775 5.818 . 5.029 5.419 1.356 1.116 . 1.109 1.0831212 7.329 7.137 7.169 7.119 6.852 1.054 1.007 1.028 1.011 1.0211213 6.557 6.141 5.962 5.761 5.864 1.088 1.050 1.032 1.053 1.1001215 6.333 6.197 5.922 6.411 6.632 1.280 1.333 1.374 1.242 1.4231216 6.127 5.502 5.028 4.299 5.158 1.529 1.493 1.252 1.045 1.4661217 5.146 5.120 5.039 4.900 4.714 0.932 0.856 0.980 0.874 0.8771218 5.957 5.519 5.490 5.618 5.175 1.421 1.232 1.137 1.242 1.1161219 4.544 4.389 4.415 4.358 4.597 0.679 0.664 0.645 0.715 0.7601220 4.932 4.939 4.821 5.142 5.148 1.050 1.030 1.023 0.928 1.0891221 6.767 6.423 6.447 6.393 6.866 1.048 1.176 1.116 1.062 0.9471222 6.967 6.857 6.849 6.682 6.602 0.804 0.672 0.631 0.758 0.7831223 5.108 5.470 4.696 4.686 4.412 1.205 1.139 1.154 1.448 1.2031224 6.243 6.185 6.162 5.963 5.998 0.924 0.982 0.976 0.977 1.1671225 5.824 5.517 5.279 5.087 5.736 1.149 1.136 1.087 1.062 1.0991226 6.574 6.455 6.349 6.242 6.750 1.355 1.430 1.130 1.367 1.4811227 5.166 4.364 4.450 4.735 4.869 1.430 1.150 1.212 1.281 1.3761229 7.185 7.022 7.157 7.238 7.060 1.672 1.119 1.177 1.113 1.2361231 5.434 4.719 4.749 3.988 5.096 1.198 0.927 0.995 0.801 1.0981232 4.907 4.906 4.501 4.461 4.362 1.576 1.558 1.520 1.424 1.4861233 5.383 5.549 5.565 5.346 5.701 1.258 1.174 1.096 1.054 1.0921234 4.937 4.950 4.727 4.356 4.984 0.906 0.913 0.885 0.736 0.8801235 4.470 4.194 4.073 3.861 4.269 1.066 0.990 1.069 0.957 1.0431236 5.091 4.804 5.005 4.867 5.030 1.343 1.300 1.202 1.120 1.2151237 5.993 6.054 5.769 5.486 5.476 1.129 1.062 1.083 0.894 1.1891238 5.152 5.472 5.446 5.173 . 0.477 0.447 0.515 0.459 .1239 5.489 4.940 5.331 4.988 5.052 1.063 0.892 1.016 0.918 0.9931240 5.785 4.966 4.993 4.830 . 1.071 0.802 0.911 0.704 .1241 6.473 6.546 6.005 . 5.594 1.337 1.221 1.336 . 1.174
Pupil Diameter (mm) Pupil Response Amplitude (mm)SubjectNumber
Note. Subjects 1206, 1211, 1238, 1240, and 1241 had conditions in which the FIT did not measure the pupil accurately. It is interesting to note that both the mTBI and control groups had the same number, five, conditions in which the FIT did not accurately capture data because this is indicative of a constant error rate.

48
Oculometrics Recorded in the Control Subjects, continued.
Note. Subjects 1206, 1211, 1238, 1240, and 1241 had conditions in which the FIT did not measure the pupil accurately. It is interesting to note that both the mTBI and control groups had the same number, five, conditions in which the FIT did not accurately capture data because this is indicative of a constant error rate.
MSL-1 8,000 ft 12,000 ft 14,000 ft MSL-2 MSL-1 8,000 ft 12,000 ft 14,000 ft MSL-2
1201 310.497 299.175 322.447 318.533 318.257 71.587 75.896 72.481 72.951 73.775
1202 279.793 285.982 278.581 267.291 278.282 67.237 67.694 64.779 68.415 64.114
1203 313.519 308.852 318.342 291.713 312.004 64.620 69.545 66.909 60.604 58.897
1204 304.763 295.081 294.860 286.228 289.478 66.144 68.064 67.326 67.019 64.829
1205 317.948 310.626 312.466 324.519 313.779 76.260 78.394 80.417 71.895 77.744
1206 284.216 290.499 . 286.102 286.514 72.193 74.094 . 72.134 76.698
1207 298.708 283.337 296.139 300.915 299.858 77.535 81.658 74.857 70.834 75.964
1209 282.820 276.393 296.130 293.770 289.911 70.583 75.060 73.508 68.833 77.369
1211 291.381 314.275 . 298.973 313.165 87.196 82.632 83.210 77.086 87.040
1212 307.365 314.991 311.480 319.443 312.923 65.226 64.507 64.515 62.923 63.633
1213 309.528 309.733 310.641 298.715 295.751 69.495 72.851 72.108 70.752 70.408
1215 279.726 271.488 267.826 288.919 284.845 68.861 70.328 70.830 64.152 67.962
1216 294.102 268.532 280.904 279.924 274.835 76.839 78.354 79.036 68.370 76.721
1217 360.657 357.502 342.300 342.364 359.454 85.153 79.579 78.124 84.512 72.516
1218 285.903 304.678 306.616 307.262 296.139 68.665 71.160 68.417 70.795 66.983
1219 280.386 281.825 290.054 275.486 276.505 68.219 69.215 68.247 72.027 64.771
1220 270.514 264.621 267.224 278.269 269.078 82.651 86.573 85.918 80.268 88.419
1221 272.830 271.592 277.656 267.941 270.395 73.791 70.179 69.311 66.293 71.931
1222 348.633 348.162 335.839 324.868 342.548 59.999 65.244 67.365 67.309 64.131
1223 290.739 294.818 283.164 278.760 284.010 66.220 61.756 66.248 67.950 70.071
1224 310.615 295.353 305.238 297.515 294.217 88.747 94.852 92.264 91.660 90.464
1225 281.990 286.158 291.699 281.036 291.990 70.569 71.906 72.863 68.054 64.371
1226 288.980 295.483 310.776 309.122 300.842 81.736 70.521 74.013 69.805 69.532
1227 244.671 247.498 246.406 245.275 240.477 61.485 69.357 65.430 68.074 69.548
1229 293.458 310.769 305.149 301.047 306.201 78.295 82.976 80.532 79.519 76.498
1231 281.319 282.377 286.910 277.065 287.902 84.115 84.565 76.639 83.709 83.966
1232 258.334 261.335 251.344 254.905 249.161 72.817 70.609 69.973 69.083 68.441
1233 259.938 274.602 272.995 267.303 272.280 65.260 71.891 62.248 65.454 60.843
1234 294.206 303.489 295.408 290.038 300.241 75.272 79.137 76.146 73.032 66.946
1235 303.010 300.238 290.290 287.967 298.735 73.484 72.477 70.146 72.610 71.230
1236 311.227 304.568 321.250 332.550 333.002 70.918 72.522 68.075 67.528 69.791
1237 297.020 305.872 302.106 317.130 306.002 66.895 66.167 67.567 67.573 70.592
1238 378.888 367.296 373.135 364.819 . 65.474 65.536 64.607 63.705 62.916
1239 287.798 289.888 280.270 294.883 278.641 73.135 69.684 65.494 69.319 69.225
1240 313.113 318.085 305.015 315.400 . 64.024 70.968 65.341 71.565 65.913
1241 316.965 312.180 304.640 . 324.633 86.998 85.767 79.678 86.164 80.360
Saccadic Velocity (deg/sec)Subject Number
Pupil Response Latency (ms)

49
Appendix G. Correlation Matrix Among All Variables for the Mild Traumatic Brain Injury Subjects.
Sex Age Pulse BPsystolic BPDiastolic Respiration Weight Height_inches
Age
Pearson Correlation -.327 1 .300 .318 .401 .329 .453 .059
Sig. (2-tailed) .051 .075 .059 .015 .050 .006 .731
N 36 36 36 36 36 36 36 36
Pulse
Pearson Correlation .128 .300 1 .408 .542 .163 .312 -.056
Sig. (2-tailed) .457 .075 .014 .001 .343 .064 .745
N 36 36 36 36 36 36 36 36
BPsystolic
Pearson Correlation -.375 .318 .408 1 .658 .108 .539 .489
Sig. (2-tailed) .024 .059 .014 .000 .531 .001 .002
N 36 36 36 36 36 36 36 36
BPDiastolic
Pearson Correlation -.027 .401 .542 .658 1 .256 .417 .073
Sig. (2-tailed) .878 .015 .001 .000 .132 .011 .672
N 36 36 36 36 36 36 36 36
Respiration
Pearson Correlation -.117 .329 .163 .108 .256 1 .145 -.052
Sig. (2-tailed) .498 .050 .343 .531 .132 .399 .762
N 36 36 36 36 36 36 36 36
Weight
Pearson Correlation -.376 .453 .312 .539 .417 .145 1 .476
Sig. (2-tailed) .024 .006 .064 .001 .011 .399 .003
N 36 36 36 36 36 36 36 36
Height_inches
Pearson Correlation -.611 .059 -.056 .489 .073 -.052 .476 1
Sig. (2-tailed) .000 .731 .745 .002 .672 .762 .003
N 36 36 36 36 36 36 36 36

50
Correlation matrix among all variables for the mild traumatic brain injury subjects, continued.
BMI MonthsPost_Inj LOC Amnesia OX_PreSL OX_8k OX_12k OX_14k
Sex
Pearson Correlation -.175 .002 -.096 .000 .409 .276 .127 -.002
Sig. (2-tailed) .308 .989 .576 1.000 .013 .104 .459 .989
N 36 36 36 36 36 36 36 36
Age
Pearson Correlation .460 .164 .076 .381 -.575 -.327 -.097 .086
Sig. (2-tailed) .005 .339 .661 .022 .000 .052 .574 .620
N 36 36 36 36 36 36 36 36
Pulse
Pearson Correlation .316 -.344 -.123 .169 -.166 -.377 -.315 -.163
Sig. (2-tailed) .060 .040 .473 .325 .333 .023 .062 .342
N 36 36 36 36 36 36 36 36
BPsystolic
Pearson Correlation .394 -.049 .001 .233 -.085 -.047 .071 .237
Sig. (2-tailed) .018 .776 .994 .171 .622 .786 .681 .164
N 36 36 36 36 36 36 36 36
BPDiastolic
Pearson Correlation .389 -.047 .024 .325 .006 -.050 .004 .106
Sig. (2-tailed) .019 .784 .891 .053 .971 .773 .982 .537
N 36 36 36 36 36 36 36 36
Respiration
Pearson Correlation .170 -.140 -.299 .200 -.211 -.077 .003 .159
Sig. (2-tailed) .322 .417 .076 .242 .217 .655 .986 .355
N 36 36 36 36 36 36 36 36
Weight
Pearson Correlation .938 .208 .016 .114 -.071 -.075 -.045 .041
Sig. (2-tailed) .000 .222 .928 .507 .682 .662 .792 .815
N 36 36 36 36 36 36 36 36
Height_inches
Pearson Correlation .186 -.033 .092 -.104 .024 .017 .091 .185
Sig. (2-tailed) .277 .850 .595 .547 .888 .920 .599 .280
N 36 36 36 36 36 36 36 36
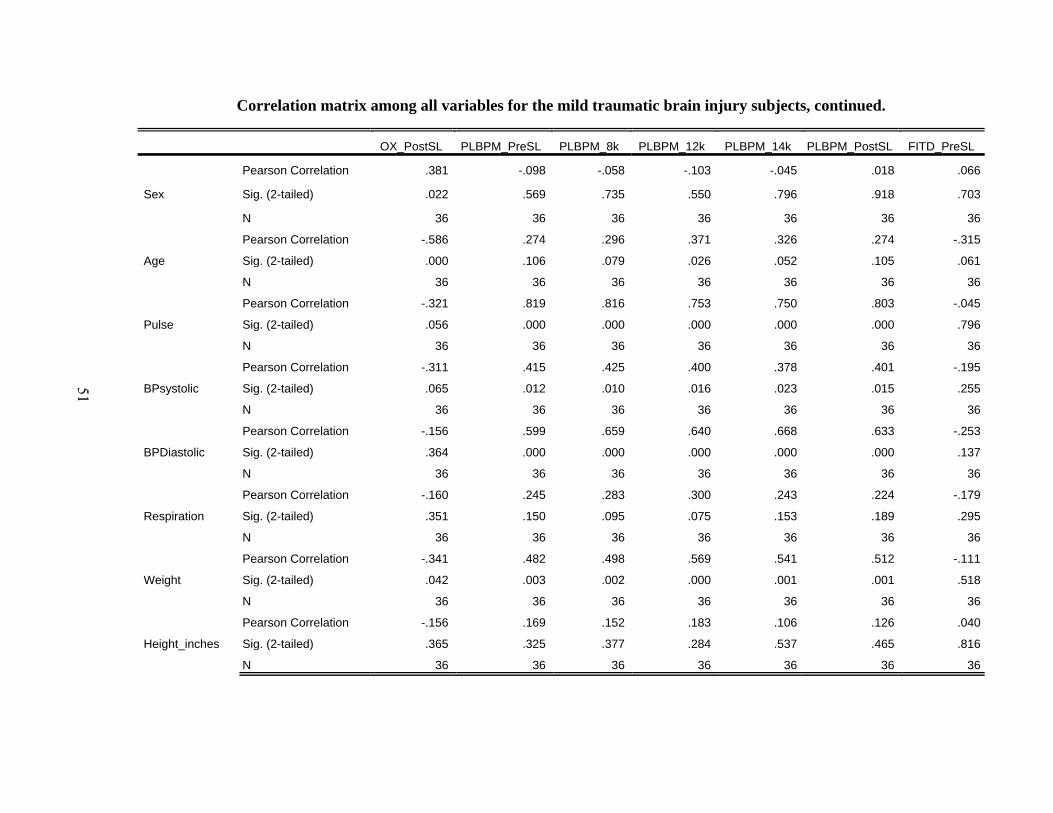
51
Correlation matrix among all variables for the mild traumatic brain injury subjects, continued.
OX_PostSL PLBPM_PreSL PLBPM_8k PLBPM_12k PLBPM_14k PLBPM_PostSL FITD_PreSL
Sex
Pearson Correlation .381 -.098 -.058 -.103 -.045 .018 .066
Sig. (2-tailed) .022 .569 .735 .550 .796 .918 .703
N 36 36 36 36 36 36 36
Age
Pearson Correlation -.586 .274 .296 .371 .326 .274 -.315
Sig. (2-tailed) .000 .106 .079 .026 .052 .105 .061
N 36 36 36 36 36 36 36
Pulse
Pearson Correlation -.321 .819 .816 .753 .750 .803 -.045
Sig. (2-tailed) .056 .000 .000 .000 .000 .000 .796
N 36 36 36 36 36 36 36
BPsystolic
Pearson Correlation -.311 .415 .425 .400 .378 .401 -.195
Sig. (2-tailed) .065 .012 .010 .016 .023 .015 .255
N 36 36 36 36 36 36 36
BPDiastolic
Pearson Correlation -.156 .599 .659 .640 .668 .633 -.253
Sig. (2-tailed) .364 .000 .000 .000 .000 .000 .137
N 36 36 36 36 36 36 36
Respiration
Pearson Correlation -.160 .245 .283 .300 .243 .224 -.179
Sig. (2-tailed) .351 .150 .095 .075 .153 .189 .295
N 36 36 36 36 36 36 36
Weight
Pearson Correlation -.341 .482 .498 .569 .541 .512 -.111
Sig. (2-tailed) .042 .003 .002 .000 .001 .001 .518
N 36 36 36 36 36 36 36
Height_inches
Pearson Correlation -.156 .169 .152 .183 .106 .126 .040
Sig. (2-tailed) .365 .325 .377 .284 .537 .465 .816
N 36 36 36 36 36 36 36
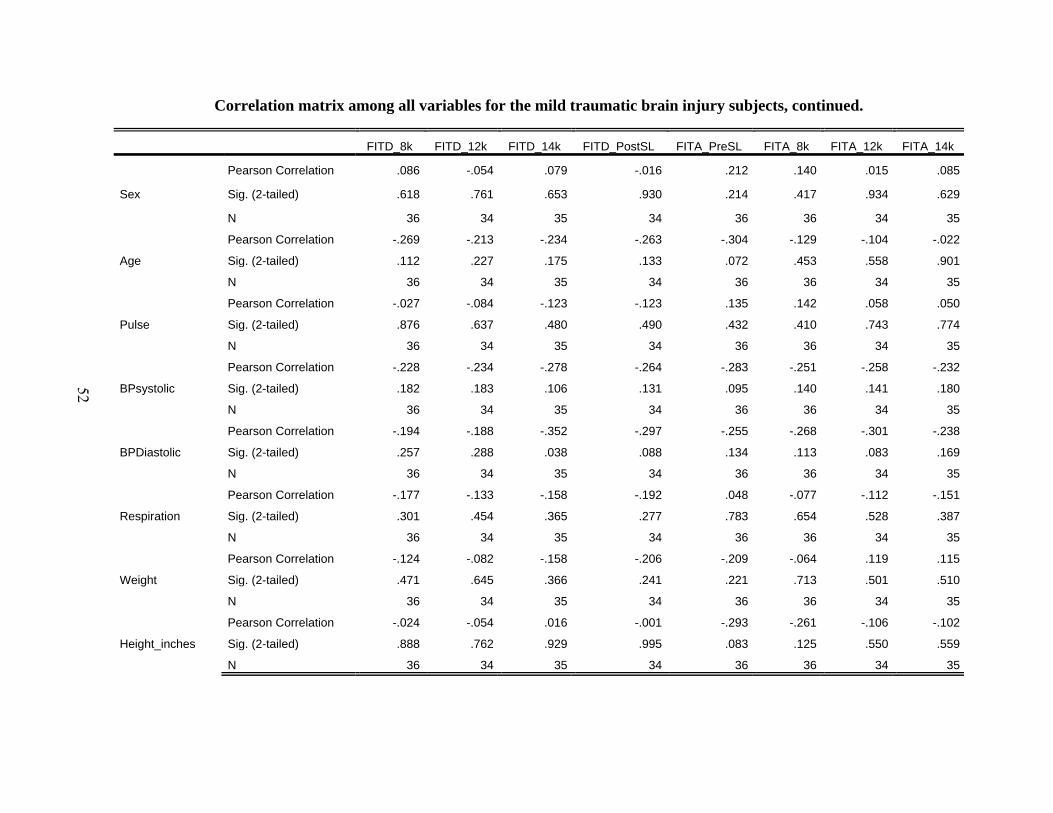
52
Correlation matrix among all variables for the mild traumatic brain injury subjects, continued.
FITD_8k FITD_12k FITD_14k FITD_PostSL FITA_PreSL FITA_8k FITA_12k FITA_14k
Sex
Pearson Correlation .086 -.054 .079 -.016 .212 .140 .015 .085
Sig. (2-tailed) .618 .761 .653 .930 .214 .417 .934 .629
N 36 34 35 34 36 36 34 35
Age
Pearson Correlation -.269 -.213 -.234 -.263 -.304 -.129 -.104 -.022
Sig. (2-tailed) .112 .227 .175 .133 .072 .453 .558 .901
N 36 34 35 34 36 36 34 35
Pulse
Pearson Correlation -.027 -.084 -.123 -.123 .135 .142 .058 .050
Sig. (2-tailed) .876 .637 .480 .490 .432 .410 .743 .774
N 36 34 35 34 36 36 34 35
BPsystolic
Pearson Correlation -.228 -.234 -.278 -.264 -.283 -.251 -.258 -.232
Sig. (2-tailed) .182 .183 .106 .131 .095 .140 .141 .180
N 36 34 35 34 36 36 34 35
BPDiastolic
Pearson Correlation -.194 -.188 -.352 -.297 -.255 -.268 -.301 -.238
Sig. (2-tailed) .257 .288 .038 .088 .134 .113 .083 .169
N 36 34 35 34 36 36 34 35
Respiration
Pearson Correlation -.177 -.133 -.158 -.192 .048 -.077 -.112 -.151
Sig. (2-tailed) .301 .454 .365 .277 .783 .654 .528 .387
N 36 34 35 34 36 36 34 35
Weight
Pearson Correlation -.124 -.082 -.158 -.206 -.209 -.064 .119 .115
Sig. (2-tailed) .471 .645 .366 .241 .221 .713 .501 .510
N 36 34 35 34 36 36 34 35
Height_inches
Pearson Correlation -.024 -.054 .016 -.001 -.293 -.261 -.106 -.102
Sig. (2-tailed) .888 .762 .929 .995 .083 .125 .550 .559
N 36 34 35 34 36 36 34 35

53
Correlation matrix among all variables for the mild traumatic brain injury subjects, continued.
FITA_PostSL FITL_PreSL FITL_8k FITL_12k FITL_14k FITL_PostSL FITV_PreSL FITV_8k
Sex
Pearson Correlation -.058 .115 .064 .000 .138 .225 -.108 -.111
Sig. (2-tailed) .743 .505 .712 .999 .428 .200 .531 .520
N 34 36 36 34 35 34 36 36
Age
Pearson Correlation -.101 .143 .102 .134 .088 -.017 -.095 -.173
Sig. (2-tailed) .569 .405 .555 .449 .615 .923 .581 .314
N 34 36 36 34 35 34 36 36
Pulse
Pearson Correlation -.085 .093 .024 -.088 -.021 -.077 -.152 -.206
Sig. (2-tailed) .632 .591 .888 .620 .903 .663 .378 .229
N 34 36 36 34 35 34 36 36
BPsystolic
Pearson Correlation -.214 -.061 -.060 -.132 -.214 -.208 .174 .177
Sig. (2-tailed) .224 .724 .730 .458 .216 .237 .310 .303
N 34 36 36 34 35 34 36 36
BPDiastolic
Pearson Correlation -.324 -.064 -.032 -.058 -.156 -.071 -.092 -.154
Sig. (2-tailed) .062 .713 .852 .746 .370 .688 .592 .371
N 34 36 36 34 35 34 36 36
Respiration
Pearson Correlation -.105 .101 .229 .280 .281 .174 -.216 -.259
Sig. (2-tailed) .556 .557 .180 .109 .103 .326 .206 .127
N 34 36 36 34 35 34 36 36
Weight
Pearson Correlation -.028 .178 .084 .008 -.030 .034 .241 .140
Sig. (2-tailed) .876 .298 .627 .965 .864 .849 .156 .415
N 34 36 36 34 35 34 36 36
Height_inches
Pearson Correlation -.138 .217 .241 .207 .099 .149 .239 .273
Sig. (2-tailed) .437 .203 .157 .240 .571 .400 .160 .108
N 34 36 36 34 35 34 36 36
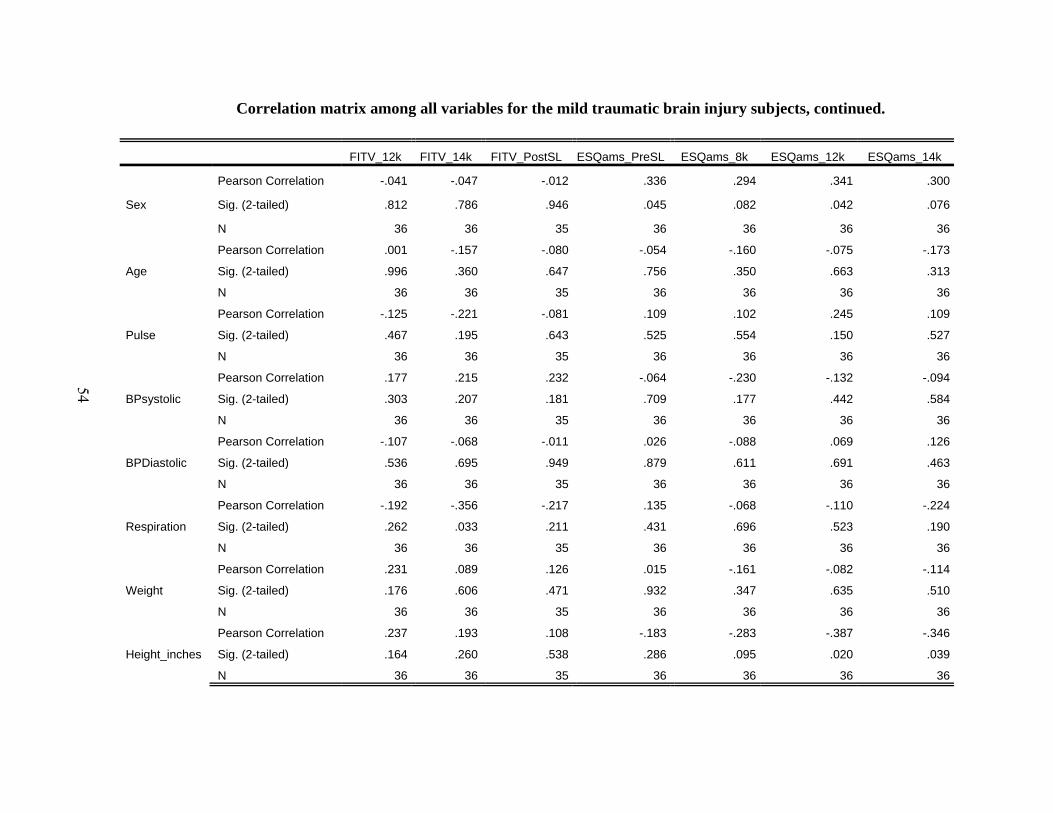
54
Correlation matrix among all variables for the mild traumatic brain injury subjects, continued.
FITV_12k FITV_14k FITV_PostSL ESQams_PreSL ESQams_8k ESQams_12k ESQams_14k
Sex
Pearson Correlation -.041 -.047 -.012 .336 .294 .341 .300
Sig. (2-tailed) .812 .786 .946 .045 .082 .042 .076
N 36 36 35 36 36 36 36
Age
Pearson Correlation .001 -.157 -.080 -.054 -.160 -.075 -.173
Sig. (2-tailed) .996 .360 .647 .756 .350 .663 .313
N 36 36 35 36 36 36 36
Pulse
Pearson Correlation -.125 -.221 -.081 .109 .102 .245 .109
Sig. (2-tailed) .467 .195 .643 .525 .554 .150 .527
N 36 36 35 36 36 36 36
BPsystolic
Pearson Correlation .177 .215 .232 -.064 -.230 -.132 -.094
Sig. (2-tailed) .303 .207 .181 .709 .177 .442 .584
N 36 36 35 36 36 36 36
BPDiastolic
Pearson Correlation -.107 -.068 -.011 .026 -.088 .069 .126
Sig. (2-tailed) .536 .695 .949 .879 .611 .691 .463
N 36 36 35 36 36 36 36
Respiration
Pearson Correlation -.192 -.356 -.217 .135 -.068 -.110 -.224
Sig. (2-tailed) .262 .033 .211 .431 .696 .523 .190
N 36 36 35 36 36 36 36
Weight
Pearson Correlation .231 .089 .126 .015 -.161 -.082 -.114
Sig. (2-tailed) .176 .606 .471 .932 .347 .635 .510
N 36 36 35 36 36 36 36
Height_inches
Pearson Correlation .237 .193 .108 -.183 -.283 -.387 -.346
Sig. (2-tailed) .164 .260 .538 .286 .095 .020 .039
N 36 36 35 36 36 36 36
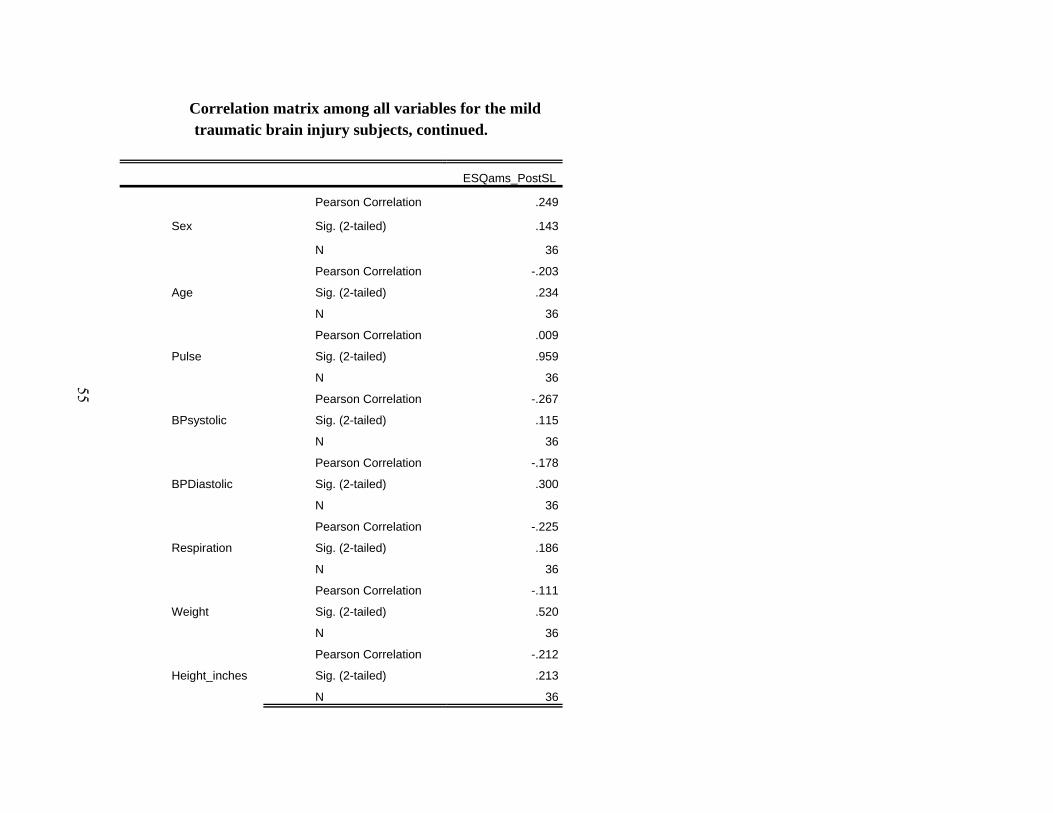
55
Correlation matrix among all variables for the mild traumatic brain injury subjects, continued.
ESQams_PostSL
Sex
Pearson Correlation .249
Sig. (2-tailed) .143
N 36
Age
Pearson Correlation -.203
Sig. (2-tailed) .234
N 36
Pulse
Pearson Correlation .009
Sig. (2-tailed) .959
N 36
BPsystolic
Pearson Correlation -.267
Sig. (2-tailed) .115
N 36
BPDiastolic
Pearson Correlation -.178
Sig. (2-tailed) .300
N 36
Respiration
Pearson Correlation -.225
Sig. (2-tailed) .186
N 36
Weight
Pearson Correlation -.111
Sig. (2-tailed) .520
N 36
Height_inches
Pearson Correlation -.212
Sig. (2-tailed) .213
N 36

56
Correlation matrix among all variables for the mild traumatic brain injury subjects, continued.
Sex Age Pulse BPsystolic BPDiastolic Respiration Weight Height_inches
BMI
Pearson Correlation -.175 .460 .316 .394 .389 .170 .938 .186
Sig. (2-tailed) .308 .005 .060 .018 .019 .322 .000 .277
N 36 36 36 36 36 36 36 36
MonthsPost_Inj
Pearson Correlation .002 .164 -.344 -.049 -.047 -.140 .208 -.033
Sig. (2-tailed) .989 .339 .040 .776 .784 .417 .222 .850
N 36 36 36 36 36 36 36 36
LOC
Pearson Correlation -.096 .076 -.123 .001 .024 -.299 .016 .092
Sig. (2-tailed) .576 .661 .473 .994 .891 .076 .928 .595
N 36 36 36 36 36 36 36 36
Amnesia
Pearson Correlation .000 .381 .169 .233 .325 .200 .114 -.104
Sig. (2-tailed) 1.000 .022 .325 .171 .053 .242 .507 .547
N 36 36 36 36 36 36 36 36
OX_PreSL
Pearson Correlation .409 -.575 -.166 -.085 .006 -.211 -.071 .024
Sig. (2-tailed) .013 .000 .333 .622 .971 .217 .682 .888
N 36 36 36 36 36 36 36 36
OX_8k
Pearson Correlation .276 -.327 -.377 -.047 -.050 -.077 -.075 .017
Sig. (2-tailed) .104 .052 .023 .786 .773 .655 .662 .920
N 36 36 36 36 36 36 36 36
OX_12k
Pearson Correlation .127 -.097 -.315 .071 .004 .003 -.045 .091
Sig. (2-tailed) .459 .574 .062 .681 .982 .986 .792 .599
N 36 36 36 36 36 36 36 36
OX_14k
Pearson Correlation -.002 .086 -.163 .237 .106 .159 .041 .185
Sig. (2-tailed) .989 .620 .342 .164 .537 .355 .815 .280
N 36 36 36 36 36 36 36 36
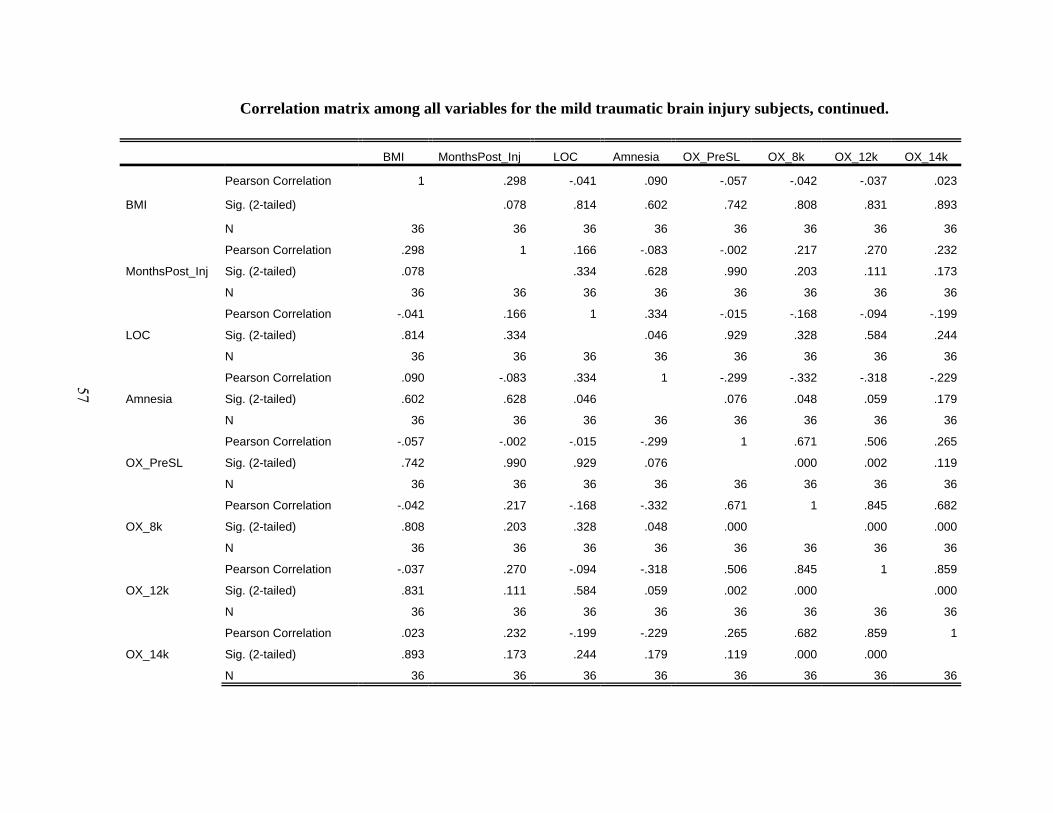
57
Correlation matrix among all variables for the mild traumatic brain injury subjects, continued.
BMI MonthsPost_Inj LOC Amnesia OX_PreSL OX_8k OX_12k OX_14k
BMI
Pearson Correlation 1 .298 -.041 .090 -.057 -.042 -.037 .023
Sig. (2-tailed) .078 .814 .602 .742 .808 .831 .893
N 36 36 36 36 36 36 36 36
MonthsPost_Inj
Pearson Correlation .298 1 .166 -.083 -.002 .217 .270 .232
Sig. (2-tailed) .078 .334 .628 .990 .203 .111 .173
N 36 36 36 36 36 36 36 36
LOC
Pearson Correlation -.041 .166 1 .334 -.015 -.168 -.094 -.199
Sig. (2-tailed) .814 .334 .046 .929 .328 .584 .244
N 36 36 36 36 36 36 36 36
Amnesia
Pearson Correlation .090 -.083 .334 1 -.299 -.332 -.318 -.229
Sig. (2-tailed) .602 .628 .046 .076 .048 .059 .179
N 36 36 36 36 36 36 36 36
OX_PreSL
Pearson Correlation -.057 -.002 -.015 -.299 1 .671 .506 .265
Sig. (2-tailed) .742 .990 .929 .076 .000 .002 .119
N 36 36 36 36 36 36 36 36
OX_8k
Pearson Correlation -.042 .217 -.168 -.332 .671 1 .845 .682
Sig. (2-tailed) .808 .203 .328 .048 .000 .000 .000
N 36 36 36 36 36 36 36 36
OX_12k
Pearson Correlation -.037 .270 -.094 -.318 .506 .845 1 .859
Sig. (2-tailed) .831 .111 .584 .059 .002 .000 .000
N 36 36 36 36 36 36 36 36
OX_14k
Pearson Correlation .023 .232 -.199 -.229 .265 .682 .859 1
Sig. (2-tailed) .893 .173 .244 .179 .119 .000 .000
N 36 36 36 36 36 36 36 36

58
Correlation matrix among all variables for the mild traumatic brain injury subjects, continued.
OX_PostSL PLBPM_PreSL PLBPM_8k PLBPM_12k PLBPM_14k PLBPM_PostSL FITD_PreSL
BMI
Pearson Correlation -.308 .441 .465 .536 .527 .499 -.089
Sig. (2-tailed) .068 .007 .004 .001 .001 .002 .604
N 36 36 36 36 36 36 36
MonthsPost_Inj
Pearson Correlation -.089 -.200 -.158 -.089 -.102 -.186 .303
Sig. (2-tailed) .605 .243 .356 .606 .554 .278 .072
N 36 36 36 36 36 36 36
LOC
Pearson Correlation -.199 .003 -.076 .003 .046 .002 .165
Sig. (2-tailed) .244 .986 .659 .986 .788 .989 .336
N 36 36 36 36 36 36 36
Amnesia
Pearson Correlation -.345 .129 .163 .263 .237 .142 -.346
Sig. (2-tailed) .039 .452 .341 .121 .164 .410 .039
N 36 36 36 36 36 36 36
OX_PreSL
Pearson Correlation .555 -.132 -.121 -.202 -.157 -.052 .143
Sig. (2-tailed) .000 .443 .481 .237 .361 .762 .406
N 36 36 36 36 36 36 36
OX_8k
Pearson Correlation .563 -.251 -.254 -.320 -.326 -.204 .039
Sig. (2-tailed) .000 .140 .135 .057 .053 .232 .821
N 36 36 36 36 36 36 36
OX_12k
Pearson Correlation .347 -.269 -.274 -.368 -.380 -.211 .094
Sig. (2-tailed) .038 .113 .106 .027 .022 .216 .588
N 36 36 36 36 36 36 36
OX_14k
Pearson Correlation .182 -.110 -.113 -.214 -.275 -.083 .088
Sig. (2-tailed) .288 .523 .513 .210 .104 .632 .609
N 36 36 36 36 36 36 36

59
Correlation matrix among all variables for the mild traumatic brain injury subjects, continued.
FITD_8k FITD_12k FITD_14k FITD_PostSL FITA_PreSL FITA_8k FITA_12k FITA_14k
BMI
Pearson Correlation -.104 -.075 -.137 -.201 -.153 -.015 .136 .151
Sig. (2-tailed) .547 .673 .433 .255 .372 .931 .443 .386
N 36 34 35 34 36 36 34 35
MonthsPost_Inj
Pearson Correlation .316 .332 .281 .266 -.199 -.185 -.097 -.066
Sig. (2-tailed) .060 .055 .101 .129 .244 .281 .583 .706
N 36 34 35 34 36 36 34 35
LOC
Pearson Correlation .180 .274 .070 .157 -.121 .012 .082 -.032
Sig. (2-tailed) .293 .117 .689 .376 .484 .943 .644 .856
N 36 34 35 34 36 36 34 35
Amnesia
Pearson Correlation -.287 -.212 -.270 -.319 -.328 -.220 -.313 -.197
Sig. (2-tailed) .090 .230 .116 .066 .050 .197 .071 .256
N 36 34 35 34 36 36 34 35
OX_PreSL
Pearson Correlation .073 -.025 .138 .096 .203 .211 .109 .181
Sig. (2-tailed) .674 .888 .429 .589 .235 .217 .539 .298
N 36 34 35 34 36 36 34 35
OX_8k
Pearson Correlation .000 -.077 .061 .025 .037 .004 -.082 .051
Sig. (2-tailed) .998 .667 .726 .889 .830 .984 .644 .769
N 36 34 35 34 36 36 34 35
OX_12k
Pearson Correlation .082 -.036 .106 .030 .063 .029 -.050 .100
Sig. (2-tailed) .634 .838 .546 .865 .715 .866 .780 .566
N 36 34 35 34 36 36 34 35
OX_14k
Pearson Correlation .089 -.011 .122 -.034 .015 -.049 -.099 .073
Sig. (2-tailed) .606 .951 .485 .846 .929 .776 .578 .676
N 36 34 35 34 36 36 34 35

60
Correlation matrix among all variables for the mild traumatic brain injury subjects, continued.
FITA_PostSL FITL_PreSL FITL_8k FITL_12k FITL_14k FITL_PostSL FITV_PreSL FITV_8k
BMI
Pearson Correlation -.016 .179 .044 -.023 -.013 .062 .184 .048
Sig. (2-tailed) .927 .296 .797 .898 .940 .726 .284 .783
N 34 36 36 34 35 34 36 36
MonthsPost_Inj
Pearson Correlation -.062 .174 .169 .208 .167 .222 .321 .211
Sig. (2-tailed) .727 .311 .324 .237 .338 .207 .056 .217
N 34 36 36 34 35 34 36 36
LOC
Pearson Correlation -.071 .021 -.019 .072 .030 .071 -.045 -.114
Sig. (2-tailed) .691 .903 .911 .686 .866 .690 .796 .507
N 34 36 36 34 35 34 36 36
Amnesia
Pearson Correlation -.249 .095 .089 .122 -.018 -.109 -.040 -.211
Sig. (2-tailed) .156 .580 .608 .492 .920 .538 .819 .216
N 34 36 36 34 35 34 36 36
OX_PreSL
Pearson Correlation .032 -.200 -.207 -.098 -.189 .140 .233 .235
Sig. (2-tailed) .856 .241 .225 .580 .276 .429 .171 .168
N 34 36 36 34 35 34 36 36
OX_8k
Pearson Correlation .011 -.121 -.098 -.007 -.055 .154 .067 .156
Sig. (2-tailed) .952 .483 .571 .970 .753 .385 .698 .363
N 34 36 36 34 35 34 36 36
OX_12k
Pearson Correlation .060 -.096 -.038 .081 -.013 .176 .079 .094
Sig. (2-tailed) .736 .578 .824 .648 .939 .319 .646 .587
N 34 36 36 34 35 34 36 36
OX_14k
Pearson Correlation .004 -.016 .024 .131 .009 .163 .113 .138
Sig. (2-tailed) .984 .926 .888 .459 .959 .358 .512 .422
N 34 36 36 34 35 34 36 36

61
Correlation matrix among all variables for the mild traumatic brain injury subjects, continued.
FITV_12k FITV_14k FITV_PostSL ESQams_PreSL ESQams_8k ESQams_12k ESQams_14k
BMI
Pearson Correlation .181 .011 .088 .135 -.069 .050 .044
Sig. (2-tailed) .289 .950 .613 .434 .688 .774 .798
N 36 36 35 36 36 36 36
MonthsPost_Inj
Pearson Correlation .390 .267 .292 .120 -.041 -.038 .118
Sig. (2-tailed) .019 .115 .088 .487 .814 .824 .495
N 36 36 35 36 36 36 36
LOC
Pearson Correlation -.228 -.101 -.036 -.225 -.175 -.226 -.216
Sig. (2-tailed) .182 .556 .839 .188 .307 .185 .206
N 36 36 35 36 36 36 36
Amnesia
Pearson Correlation -.288 -.160 -.184 .153 .118 .096 -.140
Sig. (2-tailed) .089 .351 .289 .374 .493 .578 .414
N 36 36 35 36 36 36 36
OX_PreSL
Pearson Correlation .153 .326 .340 -.187 -.199 -.162 -.022
Sig. (2-tailed) .374 .052 .046 .274 .245 .344 .900
N 36 36 35 36 36 36 36
OX_8k
Pearson Correlation .205 .307 .321 -.003 -.115 -.153 -.134
Sig. (2-tailed) .230 .069 .060 .988 .505 .373 .436
N 36 36 35 36 36 36 36
OX_12k
Pearson Correlation .190 .204 .260 -.171 -.315 -.330 -.206
Sig. (2-tailed) .266 .234 .132 .318 .061 .049 .229
N 36 36 35 36 36 36 36
OX_14k
Pearson Correlation .247 .232 .298 -.046 -.228 -.290 -.270
Sig. (2-tailed) .146 .173 .082 .789 .180 .086 .111
N 36 36 35 36 36 36 36

62
Correlation matrix among all variables for the mild traumatic brain injury subjects, continued.
ESQams_PostSL
BMI
Pearson Correlation .022
Sig. (2-tailed) .900
N 36
MonthsPost_Inj
Pearson Correlation .119
Sig. (2-tailed) .488
N 36
LOC
Pearson Correlation -.205
Sig. (2-tailed) .231
N 36
Amnesia
Pearson Correlation -.141
Sig. (2-tailed) .413
N 36
OX_PreSL
Pearson Correlation .089
Sig. (2-tailed) .608
N 36
OX_8k
Pearson Correlation -.202
Sig. (2-tailed) .237
N 36
OX_12k
Pearson Correlation -.294
Sig. (2-tailed) .082
N 36
OX_14k
Pearson Correlation -.304
Sig. (2-tailed) .072
N 36
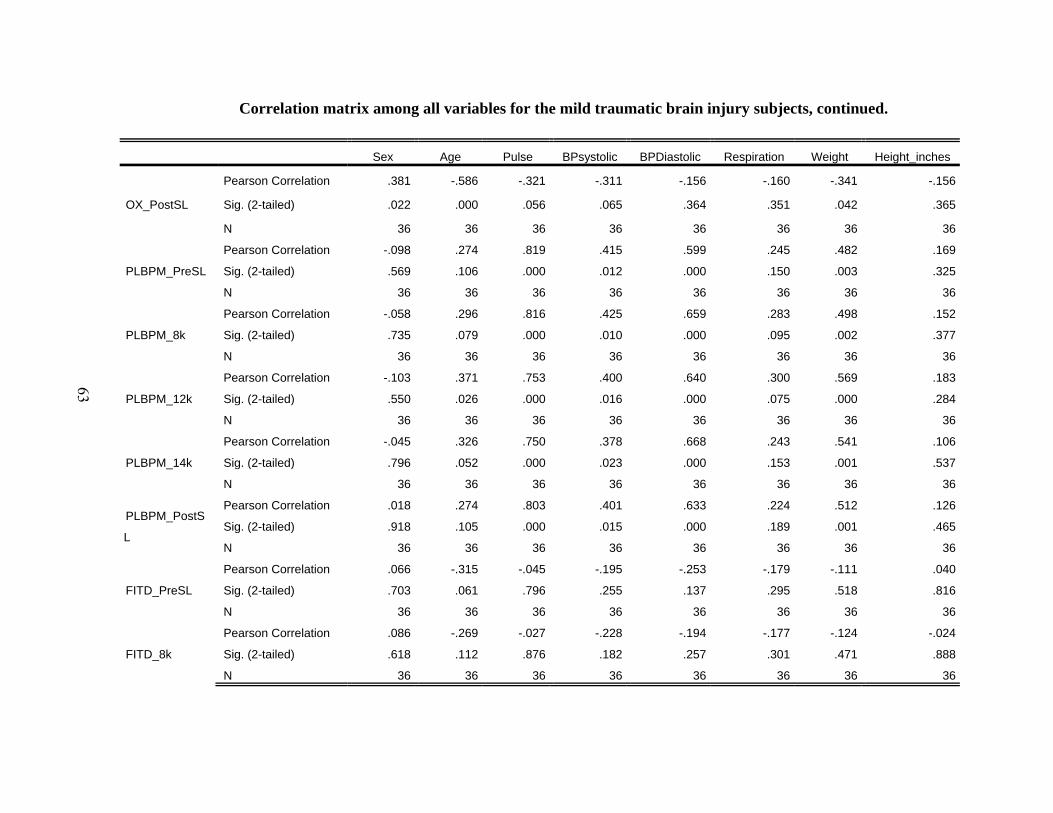
63
Correlation matrix among all variables for the mild traumatic brain injury subjects, continued.
Sex Age Pulse BPsystolic BPDiastolic Respiration Weight Height_inches
OX_PostSL
Pearson Correlation .381 -.586 -.321 -.311 -.156 -.160 -.341 -.156
Sig. (2-tailed) .022 .000 .056 .065 .364 .351 .042 .365
N 36 36 36 36 36 36 36 36
PLBPM_PreSL
Pearson Correlation -.098 .274 .819 .415 .599 .245 .482 .169
Sig. (2-tailed) .569 .106 .000 .012 .000 .150 .003 .325
N 36 36 36 36 36 36 36 36
PLBPM_8k
Pearson Correlation -.058 .296 .816 .425 .659 .283 .498 .152
Sig. (2-tailed) .735 .079 .000 .010 .000 .095 .002 .377
N 36 36 36 36 36 36 36 36
PLBPM_12k
Pearson Correlation -.103 .371 .753 .400 .640 .300 .569 .183
Sig. (2-tailed) .550 .026 .000 .016 .000 .075 .000 .284
N 36 36 36 36 36 36 36 36
PLBPM_14k
Pearson Correlation -.045 .326 .750 .378 .668 .243 .541 .106
Sig. (2-tailed) .796 .052 .000 .023 .000 .153 .001 .537
N 36 36 36 36 36 36 36 36
PLBPM_PostS
L
Pearson Correlation .018 .274 .803 .401 .633 .224 .512 .126
Sig. (2-tailed) .918 .105 .000 .015 .000 .189 .001 .465
N 36 36 36 36 36 36 36 36
FITD_PreSL
Pearson Correlation .066 -.315 -.045 -.195 -.253 -.179 -.111 .040
Sig. (2-tailed) .703 .061 .796 .255 .137 .295 .518 .816
N 36 36 36 36 36 36 36 36
FITD_8k
Pearson Correlation .086 -.269 -.027 -.228 -.194 -.177 -.124 -.024
Sig. (2-tailed) .618 .112 .876 .182 .257 .301 .471 .888
N 36 36 36 36 36 36 36 36

64
Correlation matrix among all variables for the mild traumatic brain injury subjects, continued.
BMI MonthsPost_Inj LOC Amnesia OX_PreSL OX_8k OX_12k OX_14k
OX_PostSL
Pearson Correlation -.308 -.089 -.199 -.345 .555 .563 .347 .182
Sig. (2-tailed) .068 .605 .244 .039 .000 .000 .038 .288
N 36 36 36 36 36 36 36 36
PLBPM_PreSL
Pearson Correlation .441 -.200 .003 .129 -.132 -.251 -.269 -.110
Sig. (2-tailed) .007 .243 .986 .452 .443 .140 .113 .523
N 36 36 36 36 36 36 36 36
PLBPM_8k
Pearson Correlation .465 -.158 -.076 .163 -.121 -.254 -.274 -.113
Sig. (2-tailed) .004 .356 .659 .341 .481 .135 .106 .513
N 36 36 36 36 36 36 36 36
PLBPM_12k
Pearson Correlation .536 -.089 .003 .263 -.202 -.320 -.368 -.214
Sig. (2-tailed) .001 .606 .986 .121 .237 .057 .027 .210
N 36 36 36 36 36 36 36 36
PLBPM_14k
Pearson Correlation .527 -.102 .046 .237 -.157 -.326 -.380 -.275
Sig. (2-tailed) .001 .554 .788 .164 .361 .053 .022 .104
N 36 36 36 36 36 36 36 36
PLBPM_PostSL
Pearson Correlation .499 -.186 .002 .142 -.052 -.204 -.211 -.083
Sig. (2-tailed) .002 .278 .989 .410 .762 .232 .216 .632
N 36 36 36 36 36 36 36 36
FITD_PreSL
Pearson Correlation -.089 .303 .165 -.346 .143 .039 .094 .088
Sig. (2-tailed) .604 .072 .336 .039 .406 .821 .588 .609
N 36 36 36 36 36 36 36 36
FITD_8k
Pearson Correlation -.104 .316 .180 -.287 .073 .000 .082 .089
Sig. (2-tailed) .547 .060 .293 .090 .674 .998 .634 .606
N 36 36 36 36 36 36 36 36
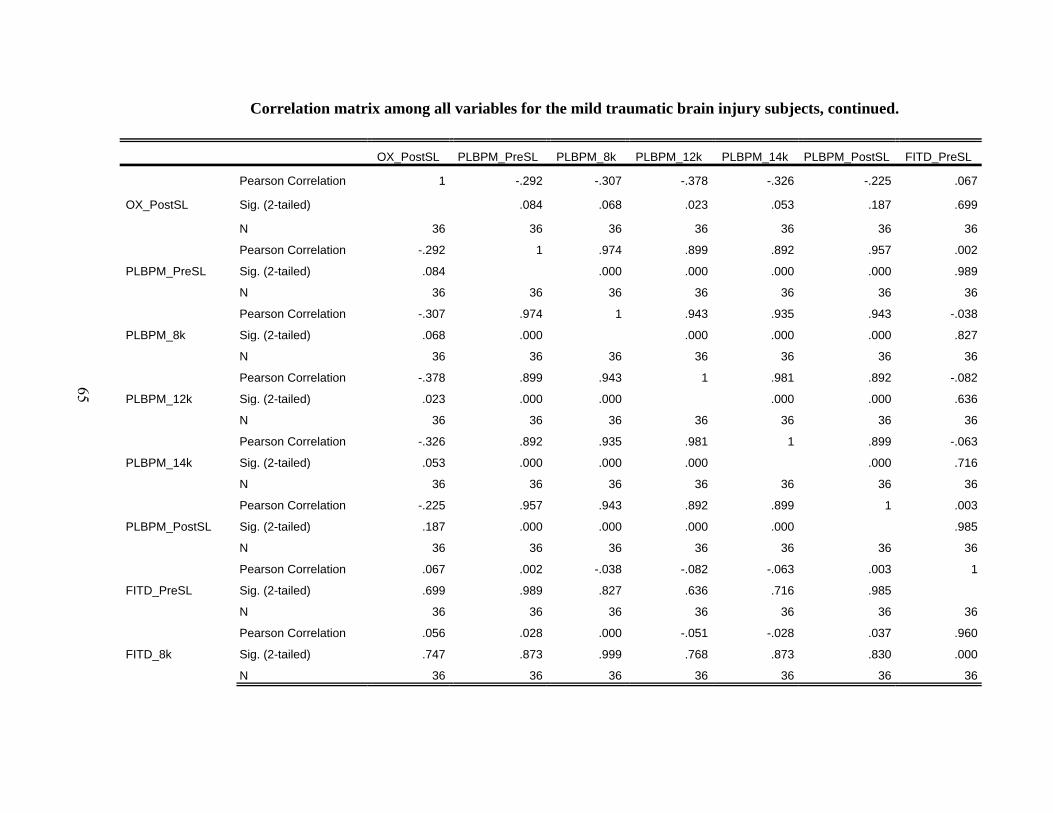
65
Correlation matrix among all variables for the mild traumatic brain injury subjects, continued.
OX_PostSL PLBPM_PreSL PLBPM_8k PLBPM_12k PLBPM_14k PLBPM_PostSL FITD_PreSL
OX_PostSL
Pearson Correlation 1 -.292 -.307 -.378 -.326 -.225 .067
Sig. (2-tailed) .084 .068 .023 .053 .187 .699
N 36 36 36 36 36 36 36
PLBPM_PreSL
Pearson Correlation -.292 1 .974 .899 .892 .957 .002
Sig. (2-tailed) .084 .000 .000 .000 .000 .989
N 36 36 36 36 36 36 36
PLBPM_8k
Pearson Correlation -.307 .974 1 .943 .935 .943 -.038
Sig. (2-tailed) .068 .000 .000 .000 .000 .827
N 36 36 36 36 36 36 36
PLBPM_12k
Pearson Correlation -.378 .899 .943 1 .981 .892 -.082
Sig. (2-tailed) .023 .000 .000 .000 .000 .636
N 36 36 36 36 36 36 36
PLBPM_14k
Pearson Correlation -.326 .892 .935 .981 1 .899 -.063
Sig. (2-tailed) .053 .000 .000 .000 .000 .716
N 36 36 36 36 36 36 36
PLBPM_PostSL
Pearson Correlation -.225 .957 .943 .892 .899 1 .003
Sig. (2-tailed) .187 .000 .000 .000 .000 .985
N 36 36 36 36 36 36 36
FITD_PreSL
Pearson Correlation .067 .002 -.038 -.082 -.063 .003 1
Sig. (2-tailed) .699 .989 .827 .636 .716 .985
N 36 36 36 36 36 36 36
FITD_8k
Pearson Correlation .056 .028 .000 -.051 -.028 .037 .960
Sig. (2-tailed) .747 .873 .999 .768 .873 .830 .000
N 36 36 36 36 36 36 36
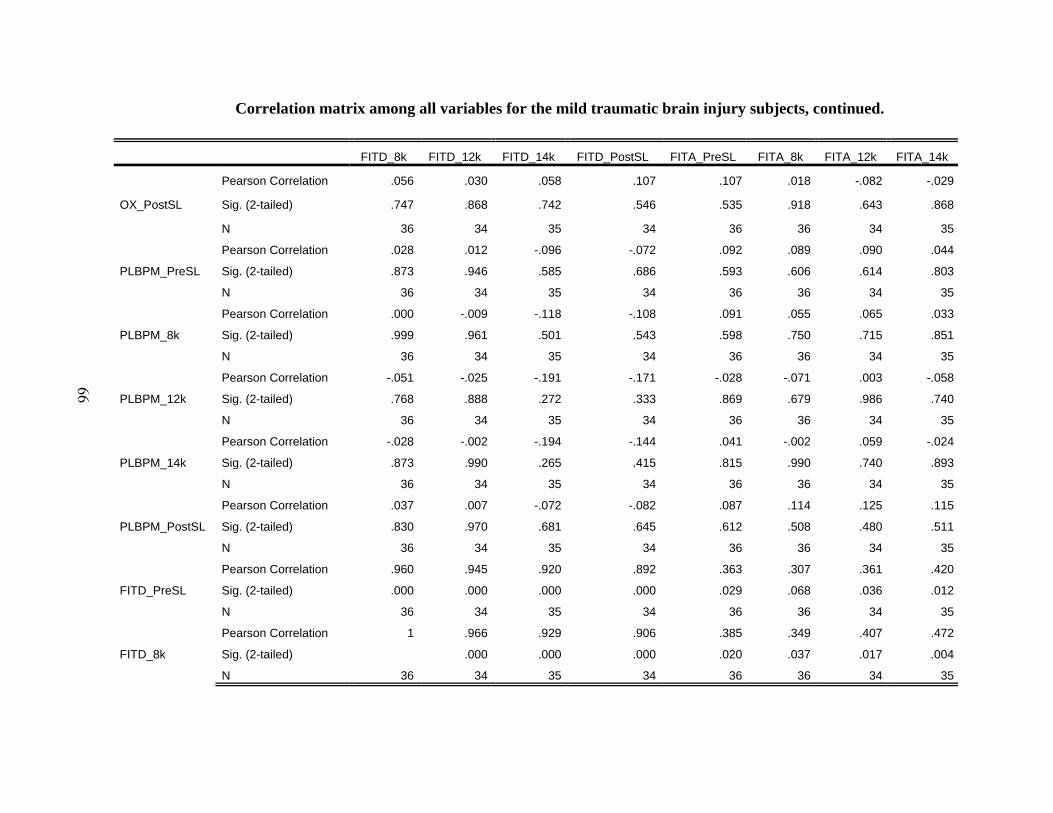
66
Correlation matrix among all variables for the mild traumatic brain injury subjects, continued.
FITD_8k FITD_12k FITD_14k FITD_PostSL FITA_PreSL FITA_8k FITA_12k FITA_14k
OX_PostSL
Pearson Correlation .056 .030 .058 .107 .107 .018 -.082 -.029
Sig. (2-tailed) .747 .868 .742 .546 .535 .918 .643 .868
N 36 34 35 34 36 36 34 35
PLBPM_PreSL
Pearson Correlation .028 .012 -.096 -.072 .092 .089 .090 .044
Sig. (2-tailed) .873 .946 .585 .686 .593 .606 .614 .803
N 36 34 35 34 36 36 34 35
PLBPM_8k
Pearson Correlation .000 -.009 -.118 -.108 .091 .055 .065 .033
Sig. (2-tailed) .999 .961 .501 .543 .598 .750 .715 .851
N 36 34 35 34 36 36 34 35
PLBPM_12k
Pearson Correlation -.051 -.025 -.191 -.171 -.028 -.071 .003 -.058
Sig. (2-tailed) .768 .888 .272 .333 .869 .679 .986 .740
N 36 34 35 34 36 36 34 35
PLBPM_14k
Pearson Correlation -.028 -.002 -.194 -.144 .041 -.002 .059 -.024
Sig. (2-tailed) .873 .990 .265 .415 .815 .990 .740 .893
N 36 34 35 34 36 36 34 35
PLBPM_PostSL
Pearson Correlation .037 .007 -.072 -.082 .087 .114 .125 .115
Sig. (2-tailed) .830 .970 .681 .645 .612 .508 .480 .511
N 36 34 35 34 36 36 34 35
FITD_PreSL
Pearson Correlation .960 .945 .920 .892 .363 .307 .361 .420
Sig. (2-tailed) .000 .000 .000 .000 .029 .068 .036 .012
N 36 34 35 34 36 36 34 35
FITD_8k
Pearson Correlation 1 .966 .929 .906 .385 .349 .407 .472
Sig. (2-tailed) .000 .000 .000 .020 .037 .017 .004
N 36 34 35 34 36 36 34 35

67
Correlation matrix among all variables for the mild traumatic brain injury subjects, continued.
FITA_PostSL FITL_PreSL FITL_8k FITL_12k FITL_14k FITL_PostSL FITV_PreSL FITV_8k
OX_PostSL
Pearson Correlation -.048 -.073 -.034 -.022 -.029 .169 -.037 .114
Sig. (2-tailed) .786 .672 .845 .900 .869 .339 .832 .506
N 34 36 36 34 35 34 36 36
PLBPM_PreSL
Pearson Correlation -.093 .104 .063 -.077 -.033 -.047 -.040 -.137
Sig. (2-tailed) .602 .546 .714 .665 .850 .793 .817 .427
N 34 36 36 34 35 34 36 36
PLBPM_8k
Pearson Correlation -.109 .124 .123 -.025 .002 .003 -.014 -.123
Sig. (2-tailed) .540 .469 .473 .888 .990 .986 .937 .474
N 34 36 36 34 35 34 36 36
PLBPM_12k
Pearson Correlation -.198 .154 .167 .020 .053 .040 -.076 -.202
Sig. (2-tailed) .263 .369 .332 .909 .760 .820 .658 .236
N 34 36 36 34 35 34 36 36
PLBPM_14k
Pearson Correlation -.138 .093 .107 -.055 .004 -.010 -.075 -.216
Sig. (2-tailed) .435 .588 .533 .757 .980 .956 .665 .206
N 34 36 36 34 35 34 36 36
PLBPM_PostSL
Pearson Correlation -.086 .105 .061 -.117 -.075 -.001 -.029 -.163
Sig. (2-tailed) .630 .542 .722 .512 .669 .993 .865 .343
N 34 36 36 34 35 34 36 36
FITD_PreSL
Pearson Correlation .378 .281 .267 .220 .248 .262 .039 -.008
Sig. (2-tailed) .028 .097 .115 .212 .150 .134 .820 .962
N 34 36 36 34 35 34 36 36
FITD_8k
Pearson Correlation .469 .252 .278 .196 .240 .220 .007 -.062
Sig. (2-tailed) .005 .138 .100 .266 .164 .212 .966 .718
N 34 36 36 34 35 34 36 36
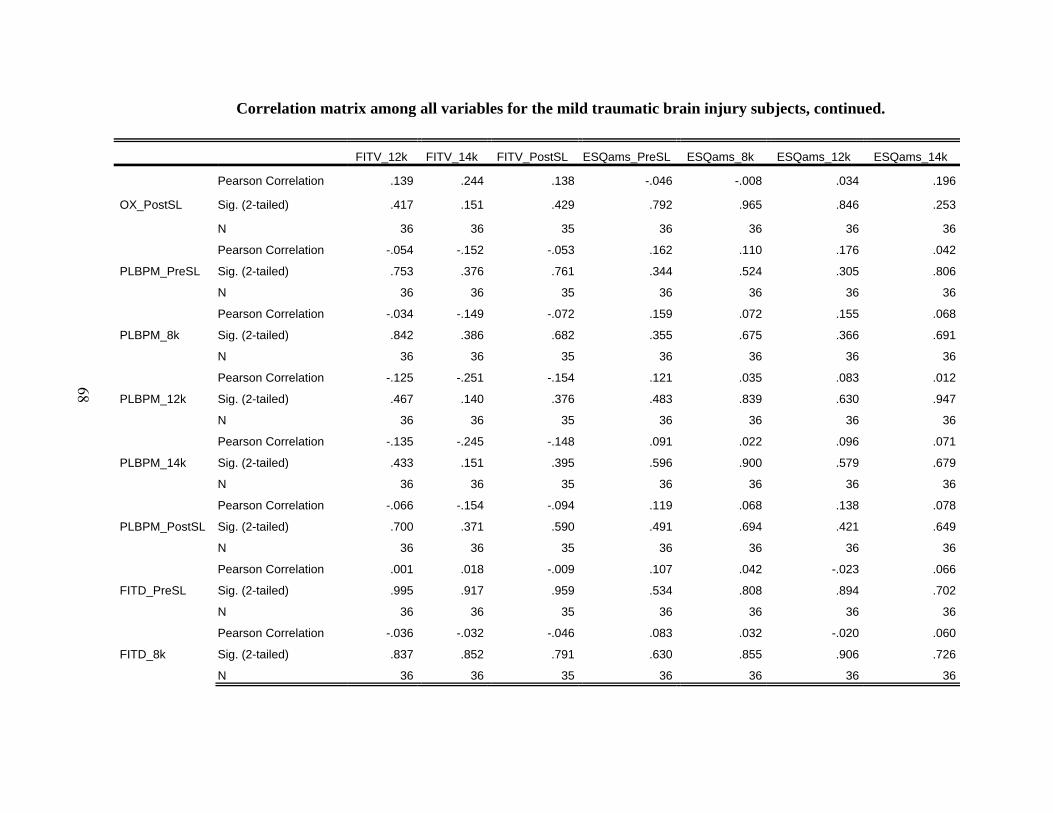
68
Correlation matrix among all variables for the mild traumatic brain injury subjects, continued.
FITV_12k FITV_14k FITV_PostSL ESQams_PreSL ESQams_8k ESQams_12k ESQams_14k
OX_PostSL
Pearson Correlation .139 .244 .138 -.046 -.008 .034 .196
Sig. (2-tailed) .417 .151 .429 .792 .965 .846 .253
N 36 36 35 36 36 36 36
PLBPM_PreSL
Pearson Correlation -.054 -.152 -.053 .162 .110 .176 .042
Sig. (2-tailed) .753 .376 .761 .344 .524 .305 .806
N 36 36 35 36 36 36 36
PLBPM_8k
Pearson Correlation -.034 -.149 -.072 .159 .072 .155 .068
Sig. (2-tailed) .842 .386 .682 .355 .675 .366 .691
N 36 36 35 36 36 36 36
PLBPM_12k
Pearson Correlation -.125 -.251 -.154 .121 .035 .083 .012
Sig. (2-tailed) .467 .140 .376 .483 .839 .630 .947
N 36 36 35 36 36 36 36
PLBPM_14k
Pearson Correlation -.135 -.245 -.148 .091 .022 .096 .071
Sig. (2-tailed) .433 .151 .395 .596 .900 .579 .679
N 36 36 35 36 36 36 36
PLBPM_PostSL
Pearson Correlation -.066 -.154 -.094 .119 .068 .138 .078
Sig. (2-tailed) .700 .371 .590 .491 .694 .421 .649
N 36 36 35 36 36 36 36
FITD_PreSL
Pearson Correlation .001 .018 -.009 .107 .042 -.023 .066
Sig. (2-tailed) .995 .917 .959 .534 .808 .894 .702
N 36 36 35 36 36 36 36
FITD_8k
Pearson Correlation -.036 -.032 -.046 .083 .032 -.020 .060
Sig. (2-tailed) .837 .852 .791 .630 .855 .906 .726
N 36 36 35 36 36 36 36

69
Correlation matrix among all variables for the mild traumatic brain injury subjects, continued.
ESQams_PostSL
OX_PostSL
Pearson Correlation .233
Sig. (2-tailed) .171
N 36
PLBPM_PreSL
Pearson Correlation -.133
Sig. (2-tailed) .441
N 36
PLBPM_8k
Pearson Correlation -.083
Sig. (2-tailed) .630
N 36
PLBPM_12k
Pearson Correlation -.077
Sig. (2-tailed) .655
N 36
PLBPM_14k
Pearson Correlation -.076
Sig. (2-tailed) .660
N 36
PLBPM_PostSL
Pearson Correlation -.135
Sig. (2-tailed) .433
N 36
FITD_PreSL
Pearson Correlation .056
Sig. (2-tailed) .747
N 36
FITD_8k
Pearson Correlation -.014
Sig. (2-tailed) .933
N 36

70
Correlation matrix among all variables for the mild traumatic brain injury subjects, continued.
Sex Age Pulse BPsystolic BPDiastolic Respiration Weight Height_inches
FITD_12k
Pearson Correlation -.054 -.213 -.084 -.234 -.188 -.133 -.082 -.054
Sig. (2-tailed) .761 .227 .637 .183 .288 .454 .645 .762
N 34 34 34 34 34 34 34 34
FITD_14k
Pearson Correlation .079 -.234 -.123 -.278 -.352 -.158 -.158 .016
Sig. (2-tailed) .653 .175 .480 .106 .038 .365 .366 .929
N 35 35 35 35 35 35 35 35
FITD_PostSL
Pearson Correlation -.016 -.263 -.123 -.264 -.297 -.192 -.206 -.001
Sig. (2-tailed) .930 .133 .490 .131 .088 .277 .241 .995
N 34 34 34 34 34 34 34 34
FITA_PreSL
Pearson Correlation .212 -.304 .135 -.283 -.255 .048 -.209 -.293
Sig. (2-tailed) .214 .072 .432 .095 .134 .783 .221 .083
N 36 36 36 36 36 36 36 36
FITA_8k
Pearson Correlation .140 -.129 .142 -.251 -.268 -.077 -.064 -.261
Sig. (2-tailed) .417 .453 .410 .140 .113 .654 .713 .125
N 36 36 36 36 36 36 36 36
FITA_12k
Pearson Correlation .015 -.104 .058 -.258 -.301 -.112 .119 -.106
Sig. (2-tailed) .934 .558 .743 .141 .083 .528 .501 .550
N 34 34 34 34 34 34 34 34
FITA_14k
Pearson Correlation .085 -.022 .050 -.232 -.238 -.151 .115 -.102
Sig. (2-tailed) .629 .901 .774 .180 .169 .387 .510 .559
N 35 35 35 35 35 35 35 35
FITA_PostSL
Pearson Correlation -.058 -.101 -.085 -.214 -.324 -.105 -.028 -.138
Sig. (2-tailed) .743 .569 .632 .224 .062 .556 .876 .437
N 34 34 34 34 34 34 34 34
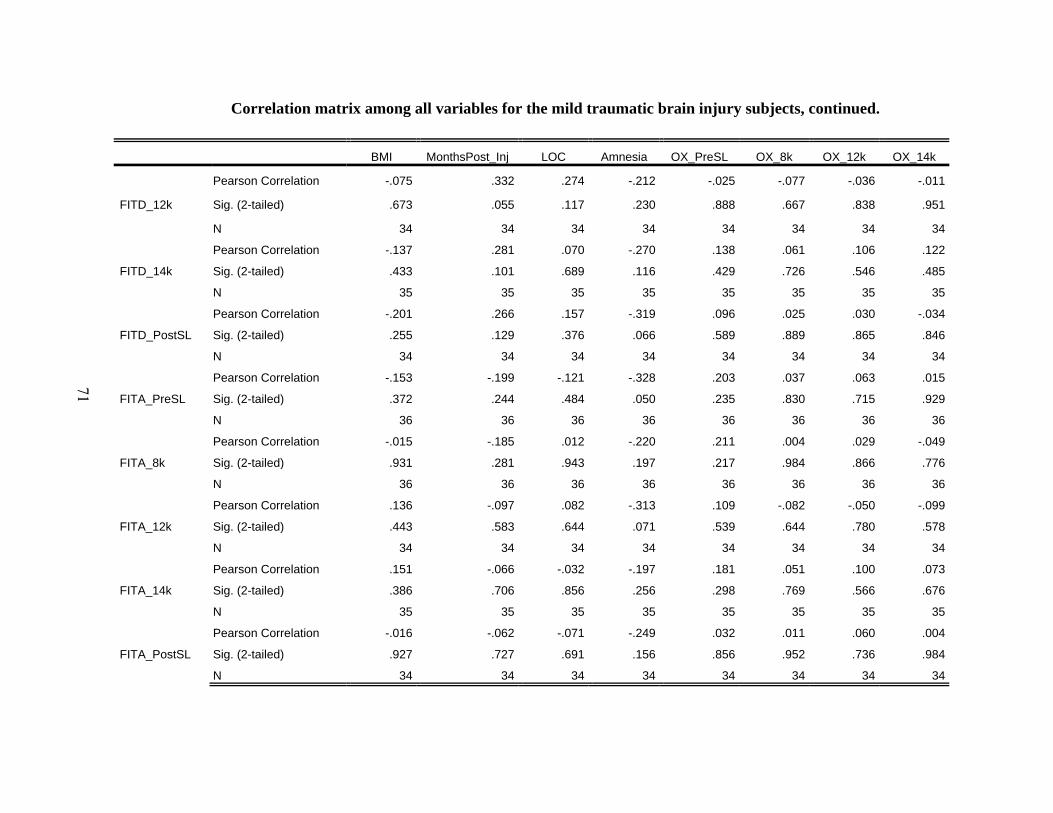
71
Correlation matrix among all variables for the mild traumatic brain injury subjects, continued.
BMI MonthsPost_Inj LOC Amnesia OX_PreSL OX_8k OX_12k OX_14k
FITD_12k
Pearson Correlation -.075 .332 .274 -.212 -.025 -.077 -.036 -.011
Sig. (2-tailed) .673 .055 .117 .230 .888 .667 .838 .951
N 34 34 34 34 34 34 34 34
FITD_14k
Pearson Correlation -.137 .281 .070 -.270 .138 .061 .106 .122
Sig. (2-tailed) .433 .101 .689 .116 .429 .726 .546 .485
N 35 35 35 35 35 35 35 35
FITD_PostSL
Pearson Correlation -.201 .266 .157 -.319 .096 .025 .030 -.034
Sig. (2-tailed) .255 .129 .376 .066 .589 .889 .865 .846
N 34 34 34 34 34 34 34 34
FITA_PreSL
Pearson Correlation -.153 -.199 -.121 -.328 .203 .037 .063 .015
Sig. (2-tailed) .372 .244 .484 .050 .235 .830 .715 .929
N 36 36 36 36 36 36 36 36
FITA_8k
Pearson Correlation -.015 -.185 .012 -.220 .211 .004 .029 -.049
Sig. (2-tailed) .931 .281 .943 .197 .217 .984 .866 .776
N 36 36 36 36 36 36 36 36
FITA_12k
Pearson Correlation .136 -.097 .082 -.313 .109 -.082 -.050 -.099
Sig. (2-tailed) .443 .583 .644 .071 .539 .644 .780 .578
N 34 34 34 34 34 34 34 34
FITA_14k
Pearson Correlation .151 -.066 -.032 -.197 .181 .051 .100 .073
Sig. (2-tailed) .386 .706 .856 .256 .298 .769 .566 .676
N 35 35 35 35 35 35 35 35
FITA_PostSL
Pearson Correlation -.016 -.062 -.071 -.249 .032 .011 .060 .004
Sig. (2-tailed) .927 .727 .691 .156 .856 .952 .736 .984
N 34 34 34 34 34 34 34 34

72
Correlation matrix among all variables for the mild traumatic brain injury subjects, continued.
OX_PostSL PLBPM_PreSL PLBPM_8k PLBPM_12k PLBPM_14k PLBPM_PostSL FITD_PreSL
FITD_12k
Pearson Correlation .030 .012 -.009 -.025 -.002 .007 .945
Sig. (2-tailed) .868 .946 .961 .888 .990 .970 .000
N 34 34 34 34 34 34 34
FITD_14k
Pearson Correlation .058 -.096 -.118 -.191 -.194 -.072 .920
Sig. (2-tailed) .742 .585 .501 .272 .265 .681 .000
N 35 35 35 35 35 35 35
FITD_PostSL
Pearson Correlation .107 -.072 -.108 -.171 -.144 -.082 .892
Sig. (2-tailed) .546 .686 .543 .333 .415 .645 .000
N 34 34 34 34 34 34 34
FITA_PreSL
Pearson Correlation .107 .092 .091 -.028 .041 .087 .363
Sig. (2-tailed) .535 .593 .598 .869 .815 .612 .029
N 36 36 36 36 36 36 36
FITA_8k
Pearson Correlation .018 .089 .055 -.071 -.002 .114 .307
Sig. (2-tailed) .918 .606 .750 .679 .990 .508 .068
N 36 36 36 36 36 36 36
FITA_12k
Pearson Correlation -.082 .090 .065 .003 .059 .125 .361
Sig. (2-tailed) .643 .614 .715 .986 .740 .480 .036
N 34 34 34 34 34 34 34
FITA_14k
Pearson Correlation -.029 .044 .033 -.058 -.024 .115 .420
Sig. (2-tailed) .868 .803 .851 .740 .893 .511 .012
N 35 35 35 35 35 35 35
FITA_PostSL
Pearson Correlation -.048 -.093 -.109 -.198 -.138 -.086 .378
Sig. (2-tailed) .786 .602 .540 .263 .435 .630 .028
N 34 34 34 34 34 34 34
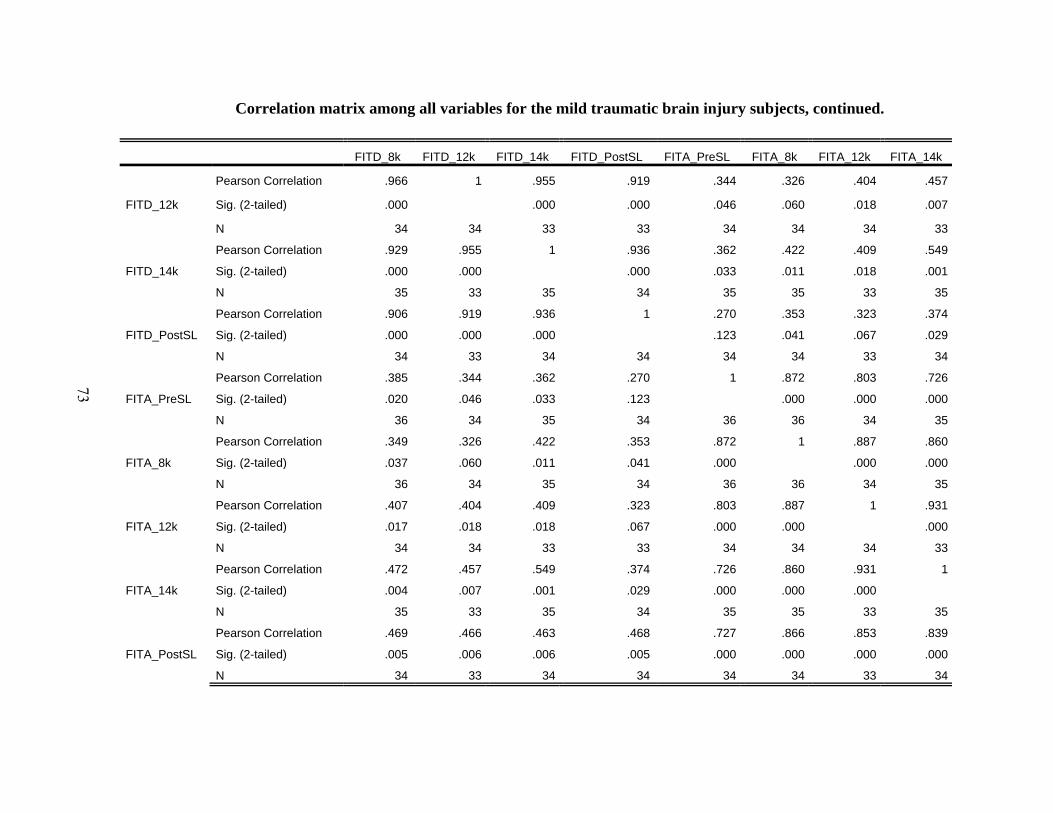
73
Correlation matrix among all variables for the mild traumatic brain injury subjects, continued.
FITD_8k FITD_12k FITD_14k FITD_PostSL FITA_PreSL FITA_8k FITA_12k FITA_14k
FITD_12k
Pearson Correlation .966 1 .955 .919 .344 .326 .404 .457
Sig. (2-tailed) .000 .000 .000 .046 .060 .018 .007
N 34 34 33 33 34 34 34 33
FITD_14k
Pearson Correlation .929 .955 1 .936 .362 .422 .409 .549
Sig. (2-tailed) .000 .000 .000 .033 .011 .018 .001
N 35 33 35 34 35 35 33 35
FITD_PostSL
Pearson Correlation .906 .919 .936 1 .270 .353 .323 .374
Sig. (2-tailed) .000 .000 .000 .123 .041 .067 .029
N 34 33 34 34 34 34 33 34
FITA_PreSL
Pearson Correlation .385 .344 .362 .270 1 .872 .803 .726
Sig. (2-tailed) .020 .046 .033 .123 .000 .000 .000
N 36 34 35 34 36 36 34 35
FITA_8k
Pearson Correlation .349 .326 .422 .353 .872 1 .887 .860
Sig. (2-tailed) .037 .060 .011 .041 .000 .000 .000
N 36 34 35 34 36 36 34 35
FITA_12k
Pearson Correlation .407 .404 .409 .323 .803 .887 1 .931
Sig. (2-tailed) .017 .018 .018 .067 .000 .000 .000
N 34 34 33 33 34 34 34 33
FITA_14k
Pearson Correlation .472 .457 .549 .374 .726 .860 .931 1
Sig. (2-tailed) .004 .007 .001 .029 .000 .000 .000
N 35 33 35 34 35 35 33 35
FITA_PostSL
Pearson Correlation .469 .466 .463 .468 .727 .866 .853 .839
Sig. (2-tailed) .005 .006 .006 .005 .000 .000 .000 .000
N 34 33 34 34 34 34 33 34

74
Correlation matrix among all variables for the mild traumatic brain injury subjects, continued.
FITA_PostSL FITL_PreSL FITL_8k FITL_12k FITL_14k FITL_PostSL FITV_PreSL FITV_8k
FITD_12k
Pearson Correlation .466 .158 .216 .191 .218 .159 -.035 -.081
Sig. (2-tailed) .006 .373 .221 .279 .224 .378 .846 .650
N 33 34 34 34 33 33 34 34
FITD_14k
Pearson Correlation .463 .317 .296 .298 .219 .288 .136 .114
Sig. (2-tailed) .006 .064 .085 .092 .207 .099 .437 .515
N 34 35 35 33 35 34 35 35
FITD_PostSL
Pearson Correlation .468 .249 .269 .232 .303 .237 .050 .013
Sig. (2-tailed) .005 .156 .124 .195 .081 .178 .778 .943
N 34 34 34 33 34 34 34 34
FITA_PreSL
Pearson Correlation .727 -.331 -.258 -.322 -.194 -.258 -.023 -.073
Sig. (2-tailed) .000 .048 .128 .063 .263 .140 .896 .674
N 34 36 36 34 35 34 36 36
FITA_8k
Pearson Correlation .866 -.308 -.321 -.355 -.290 -.310 .031 -.046
Sig. (2-tailed) .000 .067 .056 .040 .091 .075 .860 .789
N 34 36 36 34 35 34 36 36
FITA_12k
Pearson Correlation .853 -.256 -.249 -.346 -.203 -.235 .095 .021
Sig. (2-tailed) .000 .144 .155 .045 .257 .187 .594 .907
N 33 34 34 34 33 33 34 34
FITA_14k
Pearson Correlation .839 -.119 -.166 -.278 -.228 -.179 .150 .097
Sig. (2-tailed) .000 .497 .339 .117 .188 .310 .389 .579
N 34 35 35 33 35 34 35 35
FITA_PostSL
Pearson Correlation 1 -.281 -.224 -.334 -.165 -.339 .077 -.006
Sig. (2-tailed) .107 .202 .058 .352 .050 .664 .974
N 34 34 34 33 34 34 34 34

75
Correlation matrix among all variables for the mild traumatic brain injury subjects, continued.
FITV_12k FITV_14k FITV_PostSL ESQams_PreSL ESQams_8k ESQams_12k ESQams_14k
FITD_12k
Pearson Correlation -.083 -.048 -.061 .008 .060 -.027 .025
Sig. (2-tailed) .640 .786 .733 .966 .736 .879 .887
N 34 34 34 34 34 34 34
FITD_14k
Pearson Correlation .146 .167 .057 .173 .149 .079 .152
Sig. (2-tailed) .403 .336 .748 .319 .392 .652 .384
N 35 35 34 35 35 35 35
FITD_PostSL
Pearson Correlation .073 .081 .119 .088 .080 .030 .172
Sig. (2-tailed) .680 .648 .503 .622 .653 .864 .330
N 34 34 34 34 34 34 34
FITA_PreSL
Pearson Correlation -.052 -.053 -.086 -.140 -.107 -.080 -.103
Sig. (2-tailed) .764 .760 .622 .416 .533 .641 .549
N 36 36 35 36 36 36 36
FITA_8k
Pearson Correlation .002 .037 .012 -.243 -.191 -.106 -.148
Sig. (2-tailed) .990 .832 .946 .153 .265 .539 .389
N 36 36 35 36 36 36 36
FITA_12k
Pearson Correlation .046 .005 .000 -.220 -.197 -.173 -.236
Sig. (2-tailed) .798 .978 .999 .211 .265 .328 .179
N 34 34 34 34 34 34 34
FITA_14k
Pearson Correlation .106 .141 -.038 -.073 -.043 -.013 -.092
Sig. (2-tailed) .545 .420 .830 .676 .805 .939 .601
N 35 35 34 35 35 35 35
FITA_PostSL
Pearson Correlation .060 .056 .063 -.170 -.152 -.121 -.151
Sig. (2-tailed) .735 .751 .725 .337 .391 .496 .395
N 34 34 34 34 34 34 34
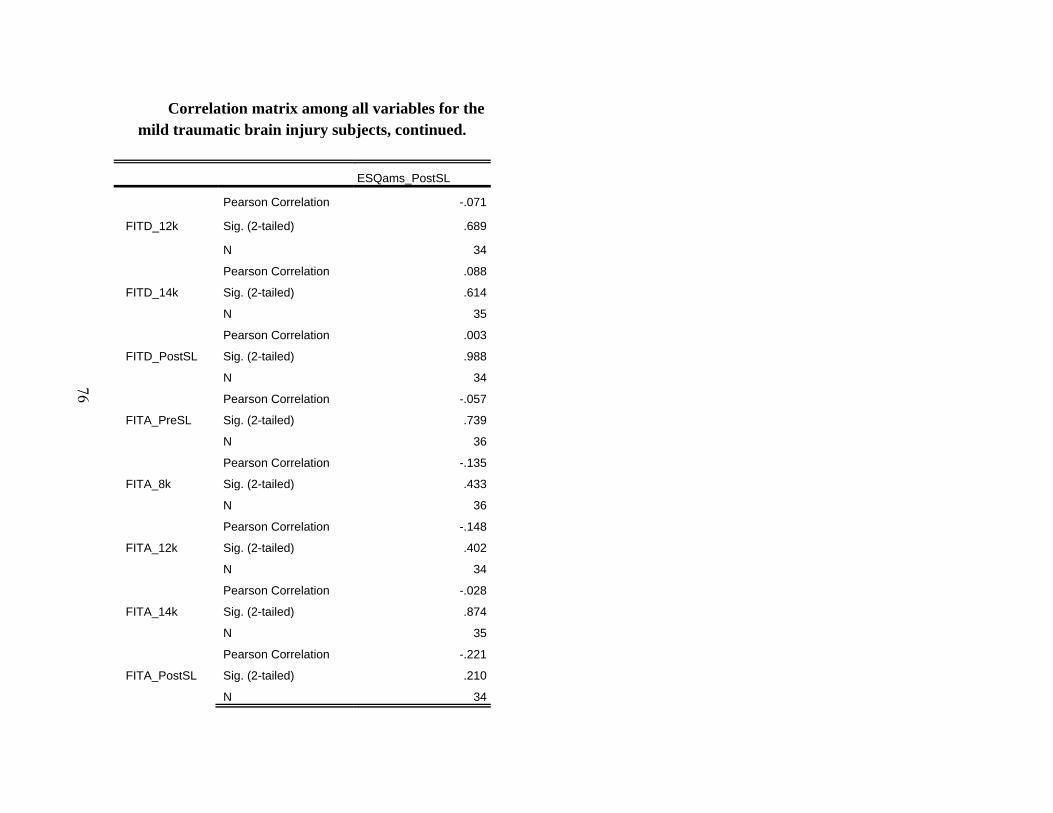
76
Correlation matrix among all variables for the mild traumatic brain injury subjects, continued.
ESQams_PostSL
FITD_12k
Pearson Correlation -.071
Sig. (2-tailed) .689
N 34
FITD_14k
Pearson Correlation .088
Sig. (2-tailed) .614
N 35
FITD_PostSL
Pearson Correlation .003
Sig. (2-tailed) .988
N 34
FITA_PreSL
Pearson Correlation -.057
Sig. (2-tailed) .739
N 36
FITA_8k
Pearson Correlation -.135
Sig. (2-tailed) .433
N 36
FITA_12k
Pearson Correlation -.148
Sig. (2-tailed) .402
N 34
FITA_14k
Pearson Correlation -.028
Sig. (2-tailed) .874
N 35
FITA_PostSL
Pearson Correlation -.221
Sig. (2-tailed) .210
N 34

77
Correlation matrix among all variables for the mild traumatic brain injury subjects, continued.
Sex Age Pulse BPsystolic BPDiastolic Respiration Weight Height_inches
FITL_PreSL
Pearson Correlation .115 .143 .093 -.061 -.064 .101 .178 .217
Sig. (2-tailed) .505 .405 .591 .724 .713 .557 .298 .203
N 36 36 36 36 36 36 36 36
FITL_8k
Pearson Correlation .064 .102 .024 -.060 -.032 .229 .084 .241
Sig. (2-tailed) .712 .555 .888 .730 .852 .180 .627 .157
N 36 36 36 36 36 36 36 36
FITL_12k
Pearson Correlation .000 .134 -.088 -.132 -.058 .280 .008 .207
Sig. (2-tailed) .999 .449 .620 .458 .746 .109 .965 .240
N 34 34 34 34 34 34 34 34
FITL_14k
Pearson Correlation .138 .088 -.021 -.214 -.156 .281 -.030 .099
Sig. (2-tailed) .428 .615 .903 .216 .370 .103 .864 .571
N 35 35 35 35 35 35 35 35
FITL_PostSL
Pearson Correlation .225 -.017 -.077 -.208 -.071 .174 .034 .149
Sig. (2-tailed) .200 .923 .663 .237 .688 .326 .849 .400
N 34 34 34 34 34 34 34 34
FITV_PreSL
Pearson Correlation -.108 -.095 -.152 .174 -.092 -.216 .241 .239
Sig. (2-tailed) .531 .581 .378 .310 .592 .206 .156 .160
N 36 36 36 36 36 36 36 36
FITV_8k
Pearson Correlation -.111 -.173 -.206 .177 -.154 -.259 .140 .273
Sig. (2-tailed) .520 .314 .229 .303 .371 .127 .415 .108
N 36 36 36 36 36 36 36 36
FITV_12k
Pearson Correlation -.041 .001 -.125 .177 -.107 -.192 .231 .237
Sig. (2-tailed) .812 .996 .467 .303 .536 .262 .176 .164
N 36 36 36 36 36 36 36 36

78
Correlation matrix among all variables for the mild traumatic brain injury subjects, continued.
BMI MonthsPost_Inj LOC Amnesia OX_PreSL OX_8k OX_12k OX_14k
FITL_PreSL
Pearson Correlation .179 .174 .021 .095 -.200 -.121 -.096 -.016
Sig. (2-tailed) .296 .311 .903 .580 .241 .483 .578 .926
N 36 36 36 36 36 36 36 36
FITL_8k
Pearson Correlation .044 .169 -.019 .089 -.207 -.098 -.038 .024
Sig. (2-tailed) .797 .324 .911 .608 .225 .571 .824 .888
N 36 36 36 36 36 36 36 36
FITL_12k
Pearson Correlation -.023 .208 .072 .122 -.098 -.007 .081 .131
Sig. (2-tailed) .898 .237 .686 .492 .580 .970 .648 .459
N 34 34 34 34 34 34 34 34
FITL_14k
Pearson Correlation -.013 .167 .030 -.018 -.189 -.055 -.013 .009
Sig. (2-tailed) .940 .338 .866 .920 .276 .753 .939 .959
N 35 35 35 35 35 35 35 35
FITL_PostSL
Pearson Correlation .062 .222 .071 -.109 .140 .154 .176 .163
Sig. (2-tailed) .726 .207 .690 .538 .429 .385 .319 .358
N 34 34 34 34 34 34 34 34
FITV_PreSL
Pearson Correlation .184 .321 -.045 -.040 .233 .067 .079 .113
Sig. (2-tailed) .284 .056 .796 .819 .171 .698 .646 .512
N 36 36 36 36 36 36 36 36
FITV_8k
Pearson Correlation .048 .211 -.114 -.211 .235 .156 .094 .138
Sig. (2-tailed) .783 .217 .507 .216 .168 .363 .587 .422
N 36 36 36 36 36 36 36 36
FITV_12k
Pearson Correlation .181 .390 -.228 -.288 .153 .205 .190 .247
Sig. (2-tailed) .289 .019 .182 .089 .374 .230 .266 .146
N 36 36 36 36 36 36 36 36

79
Correlation matrix among all variables for the mild traumatic brain injury subjects, continued.
OX_PostSL PLBPM_PreSL PLBPM_8k PLBPM_12k PLBPM_14k PLBPM_PostSL FITD_PreSL
FITL_PreSL
Pearson Correlation -.073 .104 .124 .154 .093 .105 .281
Sig. (2-tailed) .672 .546 .469 .369 .588 .542 .097
N 36 36 36 36 36 36 36
FITL_8k
Pearson Correlation -.034 .063 .123 .167 .107 .061 .267
Sig. (2-tailed) .845 .714 .473 .332 .533 .722 .115
N 36 36 36 36 36 36 36
FITL_12k
Pearson Correlation -.022 -.077 -.025 .020 -.055 -.117 .220
Sig. (2-tailed) .900 .665 .888 .909 .757 .512 .212
N 34 34 34 34 34 34 34
FITL_14k
Pearson Correlation -.029 -.033 .002 .053 .004 -.075 .248
Sig. (2-tailed) .869 .850 .990 .760 .980 .669 .150
N 35 35 35 35 35 35 35
FITL_PostSL
Pearson Correlation .169 -.047 .003 .040 -.010 -.001 .262
Sig. (2-tailed) .339 .793 .986 .820 .956 .993 .134
N 34 34 34 34 34 34 34
FITV_PreSL
Pearson Correlation -.037 -.040 -.014 -.076 -.075 -.029 .039
Sig. (2-tailed) .832 .817 .937 .658 .665 .865 .820
N 36 36 36 36 36 36 36
FITV_8k
Pearson Correlation .114 -.137 -.123 -.202 -.216 -.163 -.008
Sig. (2-tailed) .506 .427 .474 .236 .206 .343 .962
N 36 36 36 36 36 36 36
FITV_12k
Pearson Correlation .139 -.054 -.034 -.125 -.135 -.066 .001
Sig. (2-tailed) .417 .753 .842 .467 .433 .700 .995
N 36 36 36 36 36 36 36

80
Correlation matrix among all variables for the mild traumatic brain injury subjects, continued.
FITD_8k FITD_12k FITD_14k FITD_PostSL FITA_PreSL FITA_8k FITA_12k FITA_14k
FITL_PreSL
Pearson Correlation .252 .158 .317 .249 -.331 -.308 -.256 -.119
Sig. (2-tailed) .138 .373 .064 .156 .048 .067 .144 .497
N 36 34 35 34 36 36 34 35
FITL_8k
Pearson Correlation .278 .216 .296 .269 -.258 -.321 -.249 -.166
Sig. (2-tailed) .100 .221 .085 .124 .128 .056 .155 .339
N 36 34 35 34 36 36 34 35
FITL_12k
Pearson Correlation .196 .191 .298 .232 -.322 -.355 -.346 -.278
Sig. (2-tailed) .266 .279 .092 .195 .063 .040 .045 .117
N 34 34 33 33 34 34 34 33
FITL_14k
Pearson Correlation .240 .218 .219 .303 -.194 -.290 -.203 -.228
Sig. (2-tailed) .164 .224 .207 .081 .263 .091 .257 .188
N 35 33 35 34 35 35 33 35
FITL_PostSL
Pearson Correlation .220 .159 .288 .237 -.258 -.310 -.235 -.179
Sig. (2-tailed) .212 .378 .099 .178 .140 .075 .187 .310
N 34 33 34 34 34 34 33 34
FITV_PreSL
Pearson Correlation .007 -.035 .136 .050 -.023 .031 .095 .150
Sig. (2-tailed) .966 .846 .437 .778 .896 .860 .594 .389
N 36 34 35 34 36 36 34 35
FITV_8k
Pearson Correlation -.062 -.081 .114 .013 -.073 -.046 .021 .097
Sig. (2-tailed) .718 .650 .515 .943 .674 .789 .907 .579
N 36 34 35 34 36 36 34 35
FITV_12k
Pearson Correlation -.036 -.083 .146 .073 -.052 .002 .046 .106
Sig. (2-tailed) .837 .640 .403 .680 .764 .990 .798 .545
N 36 34 35 34 36 36 34 35

81
Correlation matrix among all variables for the mild traumatic brain injury subjects, continued.
FITA_PostSL FITL_PreSL FITL_8k FITL_12k FITL_14k FITL_PostSL FITV_PreSL FITV_8k
FITL_PreSL
Pearson Correlation -.281 1 .922 .843 .825 .809 .013 .027
Sig. (2-tailed) .107 .000 .000 .000 .000 .941 .875
N 34 36 36 34 35 34 36 36
FITL_8k
Pearson Correlation -.224 .922 1 .879 .865 .812 .013 .041
Sig. (2-tailed) .202 .000 .000 .000 .000 .938 .811
N 34 36 36 34 35 34 36 36
FITL_12k
Pearson Correlation -.334 .843 .879 1 .856 .867 -.097 -.017
Sig. (2-tailed) .058 .000 .000 .000 .000 .586 .923
N 33 34 34 34 33 33 34 34
FITL_14k
Pearson Correlation -.165 .825 .865 .856 1 .842 -.193 -.166
Sig. (2-tailed) .352 .000 .000 .000 .000 .268 .340
N 34 35 35 33 35 34 35 35
FITL_PostSL
Pearson Correlation -.339 .809 .812 .867 .842 1 -.070 -.008
Sig. (2-tailed) .050 .000 .000 .000 .000 .693 .966
N 34 34 34 33 34 34 34 34
FITV_PreSL
Pearson Correlation .077 .013 .013 -.097 -.193 -.070 1 .858
Sig. (2-tailed) .664 .941 .938 .586 .268 .693 .000
N 34 36 36 34 35 34 36 36
FITV_8k
Pearson Correlation -.006 .027 .041 -.017 -.166 -.008 .858 1
Sig. (2-tailed) .974 .875 .811 .923 .340 .966 .000
N 34 36 36 34 35 34 36 36
FITV_12k
Pearson Correlation .060 .140 .122 .042 -.002 .096 .779 .874
Sig. (2-tailed) .735 .417 .479 .815 .990 .591 .000 .000
N 34 36 36 34 35 34 36 36

82
Correlation matrix among all variables for the mild traumatic brain injury subjects, continued.
FITV_12k FITV_14k FITV_PostSL ESQams_PreSL ESQams_8k ESQams_12k ESQams_14k
FITL_PreSL
Pearson Correlation .140 -.064 -.086 .488 .202 .168 .174
Sig. (2-tailed) .417 .710 .621 .003 .237 .329 .309
N 36 36 35 36 36 36 36
FITL_8k
Pearson Correlation .122 -.083 -.104 .373 .095 .054 .130
Sig. (2-tailed) .479 .630 .551 .025 .583 .754 .451
N 36 36 35 36 36 36 36
FITL_12k
Pearson Correlation .042 -.095 -.074 .224 .040 -.004 .058
Sig. (2-tailed) .815 .592 .677 .203 .822 .982 .746
N 34 34 34 34 34 34 34
FITL_14k
Pearson Correlation -.002 -.287 -.119 .365 .107 -.003 .022
Sig. (2-tailed) .990 .094 .504 .031 .541 .988 .898
N 35 35 34 35 35 35 35
FITL_PostSL
Pearson Correlation .096 -.090 -.045 .213 -.027 -.069 .095
Sig. (2-tailed) .591 .614 .799 .227 .879 .698 .591
N 34 34 34 34 34 34 34
FITV_PreSL
Pearson Correlation .779 .788 .726 -.006 -.059 -.025 .051
Sig. (2-tailed) .000 .000 .000 .974 .731 .885 .767
N 36 36 35 36 36 36 36
FITV_8k
Pearson Correlation .874 .908 .766 -.014 .003 .046 .094
Sig. (2-tailed) .000 .000 .000 .935 .985 .788 .586
N 36 36 35 36 36 36 36
FITV_12k
Pearson Correlation 1 .851 .777 .039 -.045 .002 .123
Sig. (2-tailed) .000 .000 .822 .794 .989 .476
N 36 36 35 36 36 36 36
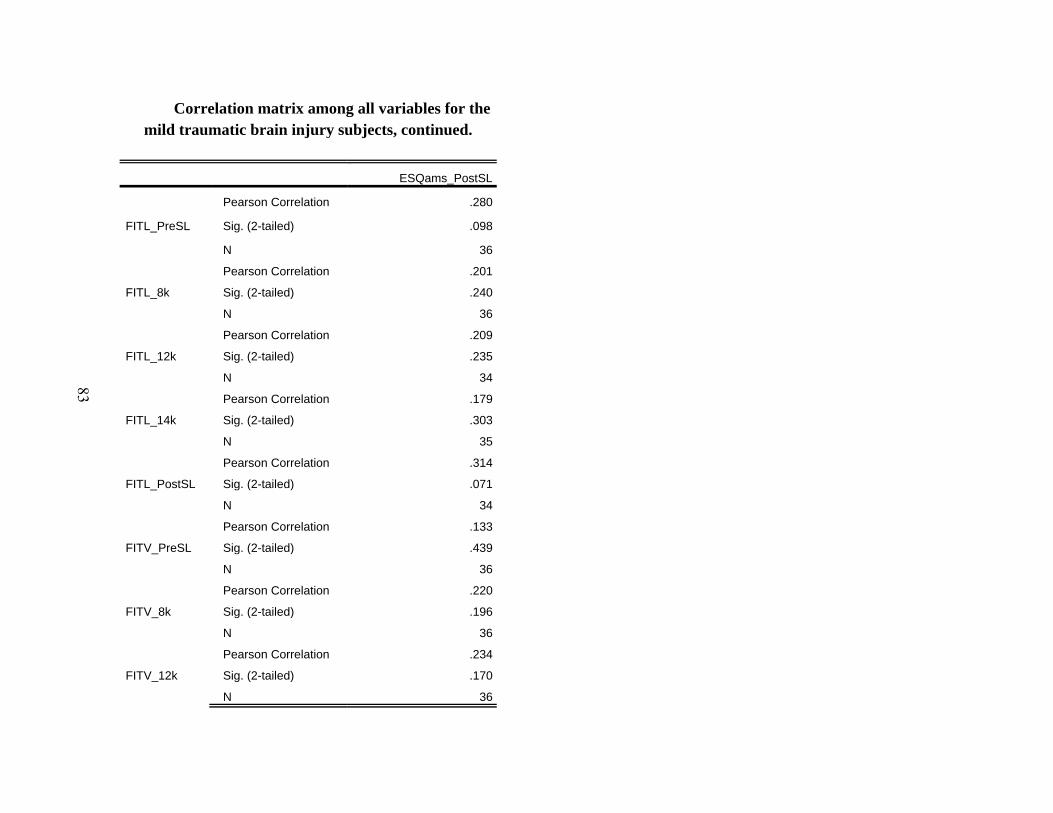
83
Correlation matrix among all variables for the mild traumatic brain injury subjects, continued.
ESQams_PostSL
FITL_PreSL
Pearson Correlation .280
Sig. (2-tailed) .098
N 36
FITL_8k
Pearson Correlation .201
Sig. (2-tailed) .240
N 36
FITL_12k
Pearson Correlation .209
Sig. (2-tailed) .235
N 34
FITL_14k
Pearson Correlation .179
Sig. (2-tailed) .303
N 35
FITL_PostSL
Pearson Correlation .314
Sig. (2-tailed) .071
N 34
FITV_PreSL
Pearson Correlation .133
Sig. (2-tailed) .439
N 36
FITV_8k
Pearson Correlation .220
Sig. (2-tailed) .196
N 36
FITV_12k
Pearson Correlation .234
Sig. (2-tailed) .170
N 36
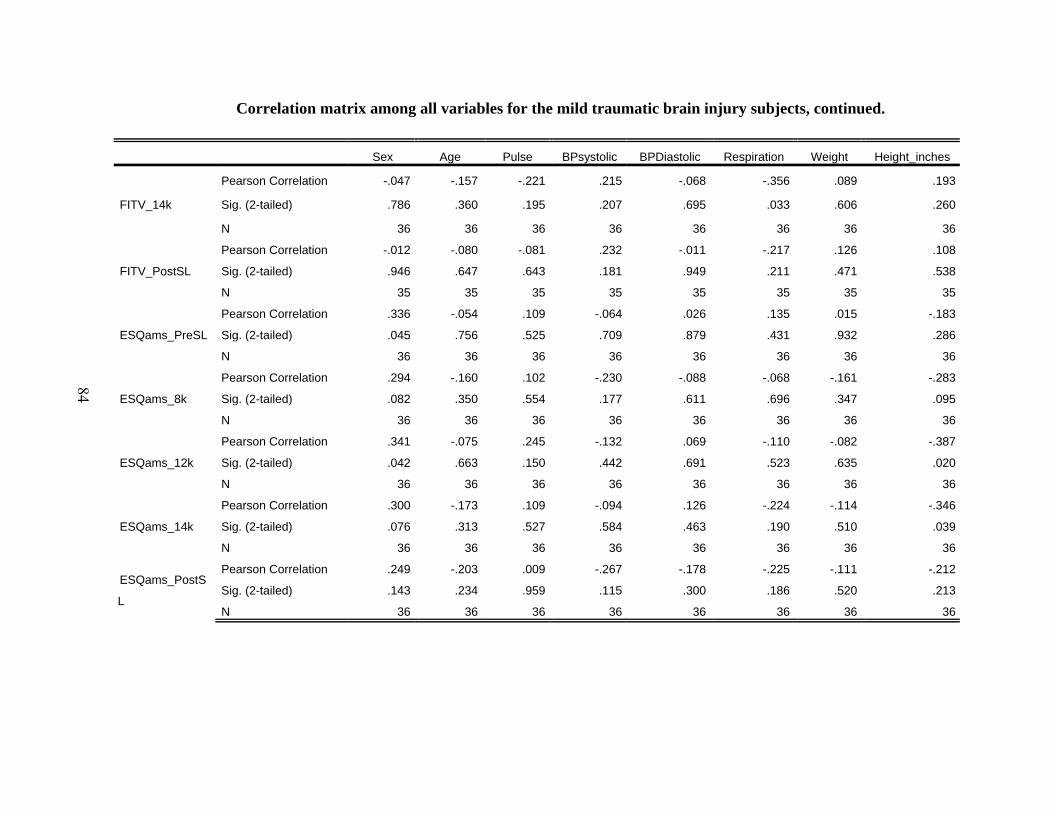
84
Correlation matrix among all variables for the mild traumatic brain injury subjects, continued.
Sex Age Pulse BPsystolic BPDiastolic Respiration Weight Height_inches
FITV_14k
Pearson Correlation -.047 -.157 -.221 .215 -.068 -.356 .089 .193
Sig. (2-tailed) .786 .360 .195 .207 .695 .033 .606 .260
N 36 36 36 36 36 36 36 36
FITV_PostSL
Pearson Correlation -.012 -.080 -.081 .232 -.011 -.217 .126 .108
Sig. (2-tailed) .946 .647 .643 .181 .949 .211 .471 .538
N 35 35 35 35 35 35 35 35
ESQams_PreSL
Pearson Correlation .336 -.054 .109 -.064 .026 .135 .015 -.183
Sig. (2-tailed) .045 .756 .525 .709 .879 .431 .932 .286
N 36 36 36 36 36 36 36 36
ESQams_8k
Pearson Correlation .294 -.160 .102 -.230 -.088 -.068 -.161 -.283
Sig. (2-tailed) .082 .350 .554 .177 .611 .696 .347 .095
N 36 36 36 36 36 36 36 36
ESQams_12k
Pearson Correlation .341 -.075 .245 -.132 .069 -.110 -.082 -.387
Sig. (2-tailed) .042 .663 .150 .442 .691 .523 .635 .020
N 36 36 36 36 36 36 36 36
ESQams_14k
Pearson Correlation .300 -.173 .109 -.094 .126 -.224 -.114 -.346
Sig. (2-tailed) .076 .313 .527 .584 .463 .190 .510 .039
N 36 36 36 36 36 36 36 36
ESQams_PostS
L
Pearson Correlation .249 -.203 .009 -.267 -.178 -.225 -.111 -.212
Sig. (2-tailed) .143 .234 .959 .115 .300 .186 .520 .213
N 36 36 36 36 36 36 36 36
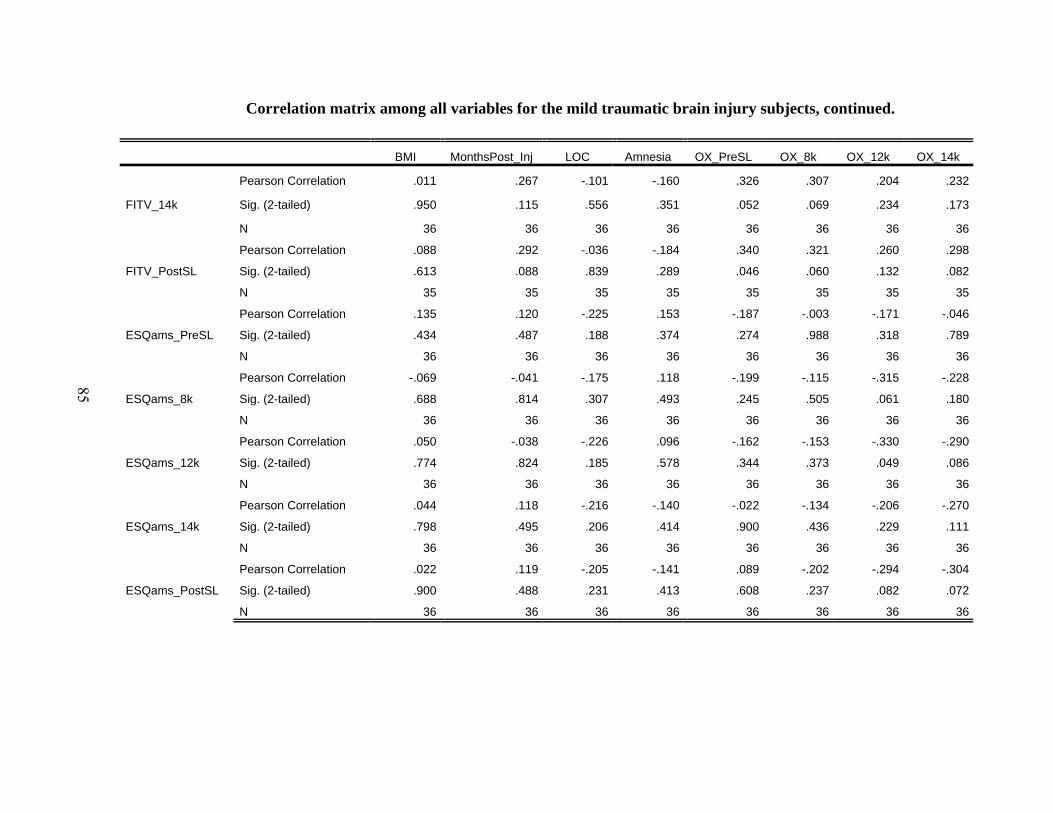
85
Correlation matrix among all variables for the mild traumatic brain injury subjects, continued.
BMI MonthsPost_Inj LOC Amnesia OX_PreSL OX_8k OX_12k OX_14k
FITV_14k
Pearson Correlation .011 .267 -.101 -.160 .326 .307 .204 .232
Sig. (2-tailed) .950 .115 .556 .351 .052 .069 .234 .173
N 36 36 36 36 36 36 36 36
FITV_PostSL
Pearson Correlation .088 .292 -.036 -.184 .340 .321 .260 .298
Sig. (2-tailed) .613 .088 .839 .289 .046 .060 .132 .082
N 35 35 35 35 35 35 35 35
ESQams_PreSL
Pearson Correlation .135 .120 -.225 .153 -.187 -.003 -.171 -.046
Sig. (2-tailed) .434 .487 .188 .374 .274 .988 .318 .789
N 36 36 36 36 36 36 36 36
ESQams_8k
Pearson Correlation -.069 -.041 -.175 .118 -.199 -.115 -.315 -.228
Sig. (2-tailed) .688 .814 .307 .493 .245 .505 .061 .180
N 36 36 36 36 36 36 36 36
ESQams_12k
Pearson Correlation .050 -.038 -.226 .096 -.162 -.153 -.330 -.290
Sig. (2-tailed) .774 .824 .185 .578 .344 .373 .049 .086
N 36 36 36 36 36 36 36 36
ESQams_14k
Pearson Correlation .044 .118 -.216 -.140 -.022 -.134 -.206 -.270
Sig. (2-tailed) .798 .495 .206 .414 .900 .436 .229 .111
N 36 36 36 36 36 36 36 36
ESQams_PostSL
Pearson Correlation .022 .119 -.205 -.141 .089 -.202 -.294 -.304
Sig. (2-tailed) .900 .488 .231 .413 .608 .237 .082 .072
N 36 36 36 36 36 36 36 36

86
Correlation matrix among all variables for the mild traumatic brain injury subjects, continued.
OX_PostSL PLBPM_PreSL PLBPM_8k PLBPM_12k PLBPM_14k PLBPM_PostSL FITD_PreSL
FITV_14k
Pearson Correlation .244 -.152 -.149 -.251 -.245 -.154 .018
Sig. (2-tailed) .151 .376 .386 .140 .151 .371 .917
N 36 36 36 36 36 36 36
FITV_PostSL
Pearson Correlation .138 -.053 -.072 -.154 -.148 -.094 -.009
Sig. (2-tailed) .429 .761 .682 .376 .395 .590 .959
N 35 35 35 35 35 35 35
ESQams_PreSL
Pearson Correlation -.046 .162 .159 .121 .091 .119 .107
Sig. (2-tailed) .792 .344 .355 .483 .596 .491 .534
N 36 36 36 36 36 36 36
ESQams_8k
Pearson Correlation -.008 .110 .072 .035 .022 .068 .042
Sig. (2-tailed) .965 .524 .675 .839 .900 .694 .808
N 36 36 36 36 36 36 36
ESQams_12k
Pearson Correlation .034 .176 .155 .083 .096 .138 -.023
Sig. (2-tailed) .846 .305 .366 .630 .579 .421 .894
N 36 36 36 36 36 36 36
ESQams_14k
Pearson Correlation .196 .042 .068 .012 .071 .078 .066
Sig. (2-tailed) .253 .806 .691 .947 .679 .649 .702
N 36 36 36 36 36 36 36
ESQams_PostSL
Pearson Correlation .233 -.133 -.083 -.077 -.076 -.135 .056
Sig. (2-tailed) .171 .441 .630 .655 .660 .433 .747
N 36 36 36 36 36 36 36

87
Correlation matrix among all variables for the mild traumatic brain injury subjects, continued.
FITD_8k FITD_12k FITD_14k FITD_PostSL FITA_PreSL FITA_8k FITA_12k FITA_14k
FITV_14k
Pearson Correlation -.032 -.048 .167 .081 -.053 .037 .005 .141
Sig. (2-tailed) .852 .786 .336 .648 .760 .832 .978 .420
N 36 34 35 34 36 36 34 35
FITV_PostSL
Pearson Correlation -.046 -.061 .057 .119 -.086 .012 .000 -.038
Sig. (2-tailed) .791 .733 .748 .503 .622 .946 .999 .830
N 35 34 34 34 35 35 34 34
ESQams_PreSL
Pearson Correlation .083 .008 .173 .088 -.140 -.243 -.220 -.073
Sig. (2-tailed) .630 .966 .319 .622 .416 .153 .211 .676
N 36 34 35 34 36 36 34 35
ESQams_8k
Pearson Correlation .032 .060 .149 .080 -.107 -.191 -.197 -.043
Sig. (2-tailed) .855 .736 .392 .653 .533 .265 .265 .805
N 36 34 35 34 36 36 34 35
ESQams_12k
Pearson Correlation -.020 -.027 .079 .030 -.080 -.106 -.173 -.013
Sig. (2-tailed) .906 .879 .652 .864 .641 .539 .328 .939
N 36 34 35 34 36 36 34 35
ESQams_14k
Pearson Correlation .060 .025 .152 .172 -.103 -.148 -.236 -.092
Sig. (2-tailed) .726 .887 .384 .330 .549 .389 .179 .601
N 36 34 35 34 36 36 34 35
ESQams_PostSL
Pearson Correlation -.014 -.071 .088 .003 -.057 -.135 -.148 -.028
Sig. (2-tailed) .933 .689 .614 .988 .739 .433 .402 .874
N 36 34 35 34 36 36 34 35

88
Correlation matrix among all variables for the mild traumatic brain injury subjects, continued.
FITA_PostSL FITL_PreSL FITL_8k FITL_12k FITL_14k FITL_PostSL FITV_PreSL FITV_8k
FITV_14k
Pearson Correlation .056 -.064 -.083 -.095 -.287 -.090 .788 .908
Sig. (2-tailed) .751 .710 .630 .592 .094 .614 .000 .000
N 34 36 36 34 35 34 36 36
FITV_PostSL
Pearson Correlation .063 -.086 -.104 -.074 -.119 -.045 .726 .766
Sig. (2-tailed) .725 .621 .551 .677 .504 .799 .000 .000
N 34 35 35 34 34 34 35 35
ESQams_PreSL
Pearson Correlation -.170 .488 .373 .224 .365 .213 -.006 -.014
Sig. (2-tailed) .337 .003 .025 .203 .031 .227 .974 .935
N 34 36 36 34 35 34 36 36
ESQams_8k
Pearson Correlation -.152 .202 .095 .040 .107 -.027 -.059 .003
Sig. (2-tailed) .391 .237 .583 .822 .541 .879 .731 .985
N 34 36 36 34 35 34 36 36
ESQams_12k
Pearson Correlation -.121 .168 .054 -.004 -.003 -.069 -.025 .046
Sig. (2-tailed) .496 .329 .754 .982 .988 .698 .885 .788
N 34 36 36 34 35 34 36 36
ESQams_14k
Pearson Correlation -.151 .174 .130 .058 .022 .095 .051 .094
Sig. (2-tailed) .395 .309 .451 .746 .898 .591 .767 .586
N 34 36 36 34 35 34 36 36
ESQams_PostSL
Pearson Correlation -.221 .280 .201 .209 .179 .314 .133 .220
Sig. (2-tailed) .210 .098 .240 .235 .303 .071 .439 .196
N 34 36 36 34 35 34 36 36

89
Correlation matrix among all variables for the mild traumatic brain injury subjects, continued.
FITV_12k FITV_14k FITV_PostSL ESQams_PreSL ESQams_8k ESQams_12k ESQams_14k
FITV_14k
Pearson Correlation .851 1 .852 -.058 .005 .077 .120
Sig. (2-tailed) .000 .000 .735 .977 .653 .487
N 36 36 35 36 36 36 36
FITV_PostSL
Pearson Correlation .777 .852 1 -.037 -.052 -.007 .021
Sig. (2-tailed) .000 .000 .833 .768 .968 .905
N 35 35 35 35 35 35 35
ESQams_PreSL
Pearson Correlation .039 -.058 -.037 1 .788 .740 .490
Sig. (2-tailed) .822 .735 .833 .000 .000 .002
N 36 36 35 36 36 36 36
ESQams_8k
Pearson Correlation -.045 .005 -.052 .788 1 .880 .567
Sig. (2-tailed) .794 .977 .768 .000 .000 .000
N 36 36 35 36 36 36 36
ESQams_12k
Pearson Correlation .002 .077 -.007 .740 .880 1 .759
Sig. (2-tailed) .989 .653 .968 .000 .000 .000
N 36 36 35 36 36 36 36
ESQams_14k
Pearson Correlation .123 .120 .021 .490 .567 .759 1
Sig. (2-tailed) .476 .487 .905 .002 .000 .000
N 36 36 35 36 36 36 36
ESQams_PostSL
Pearson Correlation .234 .143 -.015 .256 .222 .385 .601
Sig. (2-tailed) .170 .406 .933 .133 .193 .020 .000
N 36 36 35 36 36 36 36
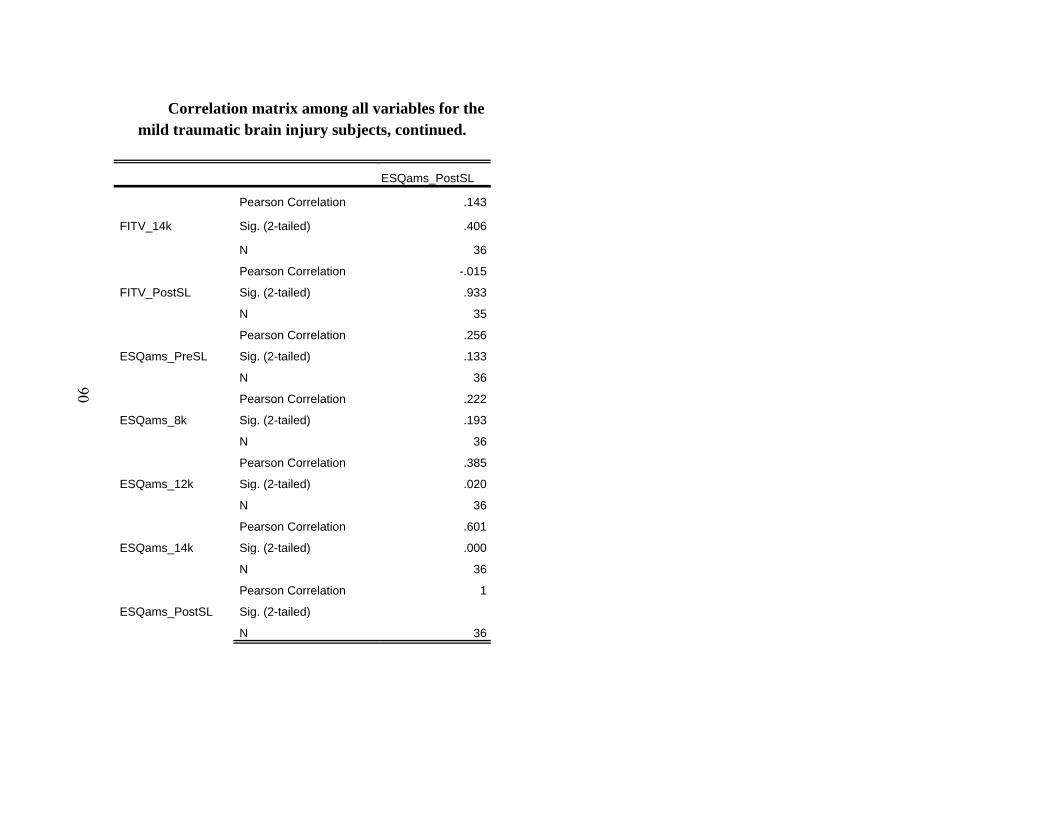
90
Correlation matrix among all variables for the mild traumatic brain injury subjects, continued.
ESQams_PostSL
FITV_14k
Pearson Correlation .143
Sig. (2-tailed) .406
N 36
FITV_PostSL
Pearson Correlation -.015
Sig. (2-tailed) .933
N 35
ESQams_PreSL
Pearson Correlation .256
Sig. (2-tailed) .133
N 36
ESQams_8k
Pearson Correlation .222
Sig. (2-tailed) .193
N 36
ESQams_12k
Pearson Correlation .385
Sig. (2-tailed) .020
N 36
ESQams_14k
Pearson Correlation .601
Sig. (2-tailed) .000
N 36
ESQams_PostSL
Pearson Correlation 1
Sig. (2-tailed)
N 36

91
Appendix H. Correlation Matrix Among All Variables for the Control Subjects.
Sex Age Pulse BPsystolic BPDiastolic Respiration Weight Height_inches
Age
Pearson Correlation -.303 1 .313 .347 .436 -.005 .164 -.108
Sig. (2-tailed) .073 .063 .038 .008 .977 .340 .532
N 36 36 36 36 36 36 36 36
Pulse
Pearson Correlation .181 .313 1 .140 .194 .276 .262 -.223
Sig. (2-tailed) .292 .063 .414 .257 .103 .123 .192
N 36 36 36 36 36 36 36 36
BPsystolic
Pearson Correlation -.541 .347 .140 1 .690 -.078 .528 .107
Sig. (2-tailed) .001 .038 .414 .000 .652 .001 .536
N 36 36 36 36 36 36 36 36
BPDiastolic
Pearson Correlation -.270 .436 .194 .690 1 .027 .529 -.125
Sig. (2-tailed) .112 .008 .257 .000 .876 .001 .467
N 36 36 36 36 36 36 36 36
Respiration
Pearson Correlation .193 -.005 .276 -.078 .027 1 .234 -.232
Sig. (2-tailed) .258 .977 .103 .652 .876 .170 .173
N 36 36 36 36 36 36 36 36
Weight
Pearson Correlation -.266 .164 .262 .528 .529 .234 1 .035
Sig. (2-tailed) .117 .340 .123 .001 .001 .170 .841
N 36 36 36 36 36 36 36 36
Height_inches
Pearson Correlation -.503 -.108 -.223 .107 -.125 -.232 .035 1
Sig. (2-tailed) .002 .532 .192 .536 .467 .173 .841
N 36 36 36 36 36 36 36 36

92
Correlation matrix among all variables for the control subjects, continued.
BMI OX_PreSL OX_8k OX_12k OX_14k OX_PostSL PLBPM_PreSL PLBPM_8k
Sex
Pearson Correlation -.135 .352 .170 -.017 -.153 .403 .073 .053
Sig. (2-tailed) .433 .035 .321 .922 .374 .015 .672 .757
N 36 36 36 36 36 36 36 36
Age
Pearson Correlation .288 -.314 -.223 .047 .131 -.391 .290 .287
Sig. (2-tailed) .089 .062 .191 .786 .445 .018 .087 .090
N 36 36 36 36 36 36 36 36
Pulse
Pearson Correlation .303 -.109 -.032 .112 .066 -.022 .907 .889
Sig. (2-tailed) .073 .528 .854 .516 .701 .899 .000 .000
N 36 36 36 36 36 36 36 36
BPsystolic
Pearson Correlation .514 .070 -.185 -.001 .052 -.092 .294 .333
Sig. (2-tailed) .001 .687 .281 .994 .763 .593 .082 .047
N 36 36 36 36 36 36 36 36
BPDiastolic
Pearson Correlation .579 .160 -.137 .135 .203 -.063 .301 .353
Sig. (2-tailed) .000 .350 .425 .433 .236 .717 .074 .034
N 36 36 36 36 36 36 36 36
Respiration
Pearson Correlation .175 -.135 -.070 -.264 -.121 -.244 .233 .238
Sig. (2-tailed) .307 .433 .685 .120 .481 .152 .171 .163
N 36 36 36 36 36 36 36 36
Weight
Pearson Correlation .893 -.129 -.463 -.344 -.198 -.232 .353 .404
Sig. (2-tailed) .000 .453 .004 .040 .248 .172 .035 .014
N 36 36 36 36 36 36 36 36
Height_inches
Pearson Correlation -.320 -.289 -.173 .058 .154 -.176 -.186 -.207
Sig. (2-tailed) .057 .087 .313 .738 .371 .305 .279 .225
N 36 36 36 36 36 36 36 36

93
Correlation matrix among all variables for the control subjects, continued.
PLBPM_12k PLBPM_14k PLBPM_PostSL FITD_PreSL FITD_8k FITD_12k FITD_14k
Sex
Pearson Correlation .063 .167 .135 .182 .253 .152 .236
Sig. (2-tailed) .714 .330 .433 .288 .137 .390 .172
N 36 36 36 36 36 34 35
Age
Pearson Correlation .244 .181 .214 -.430 -.357 -.338 -.302
Sig. (2-tailed) .151 .292 .211 .009 .032 .050 .078
N 36 36 36 36 36 34 35
Pulse
Pearson Correlation .835 .795 .865 .310 .336 .233 .382
Sig. (2-tailed) .000 .000 .000 .066 .045 .184 .023
N 36 36 36 36 36 34 35
BPsystolic
Pearson Correlation .310 .293 .295 -.114 -.072 -.126 -.201
Sig. (2-tailed) .065 .083 .081 .507 .677 .478 .248
N 36 36 36 36 36 34 35
BPDiastolic
Pearson Correlation .305 .331 .361 -.155 -.076 -.050 -.166
Sig. (2-tailed) .070 .049 .031 .367 .660 .777 .342
N 36 36 36 36 36 34 35
Respiration
Pearson Correlation .262 .262 .229 .063 .144 .130 .103
Sig. (2-tailed) .123 .123 .179 .713 .403 .465 .555
N 36 36 36 36 36 34 35
Weight
Pearson Correlation .435 .372 .413 -.137 -.133 -.226 -.267
Sig. (2-tailed) .008 .026 .012 .425 .440 .199 .121
N 36 36 36 36 36 34 35
Height_inches
Pearson Correlation -.228 -.341 -.240 .065 -.009 .154 .051
Sig. (2-tailed) .182 .042 .158 .705 .960 .385 .770
N 36 36 36 36 36 34 35

94
Correlation matrix among all variables for the control subjects, continued.
FITD_PostSL FITA_PreSL FITA_8k FITA_12k FITA_14k FITA_PostSL FITL_PreSL
Sex
Pearson Correlation .211 .213 .214 .280 .187 .227 -.017
Sig. (2-tailed) .230 .213 .210 .109 .281 .197 .920
N 34 36 36 34 35 34 36
Age
Pearson Correlation -.454 -.270 -.280 -.294 -.137 -.429 .187
Sig. (2-tailed) .007 .111 .098 .091 .432 .011 .276
N 34 36 36 34 35 34 36
Pulse
Pearson Correlation .178 .072 .078 .111 .215 -.182 .098
Sig. (2-tailed) .313 .678 .651 .531 .215 .302 .569
N 34 36 36 34 35 34 36
BPsystolic
Pearson Correlation -.176 -.122 -.116 -.105 -.227 -.241 -.009
Sig. (2-tailed) .320 .479 .500 .553 .190 .170 .957
N 34 36 36 34 35 34 36
BPDiastolic
Pearson Correlation -.204 -.139 -.019 -.048 -.117 -.267 .167
Sig. (2-tailed) .246 .420 .911 .790 .503 .128 .329
N 34 36 36 34 35 34 36
Respiration
Pearson Correlation .019 -.068 -.124 -.085 .022 -.007 .269
Sig. (2-tailed) .915 .692 .471 .634 .899 .970 .112
N 34 36 36 34 35 34 36
Weight
Pearson Correlation -.316 -.035 -.032 -.024 -.058 .004 .299
Sig. (2-tailed) .069 .838 .852 .892 .741 .981 .077
N 34 36 36 34 35 34 36
Height_inches
Pearson Correlation .086 .024 .038 .011 -.007 .118 -.019
Sig. (2-tailed) .628 .891 .824 .953 .969 .505 .913
N 34 36 36 34 35 34 36
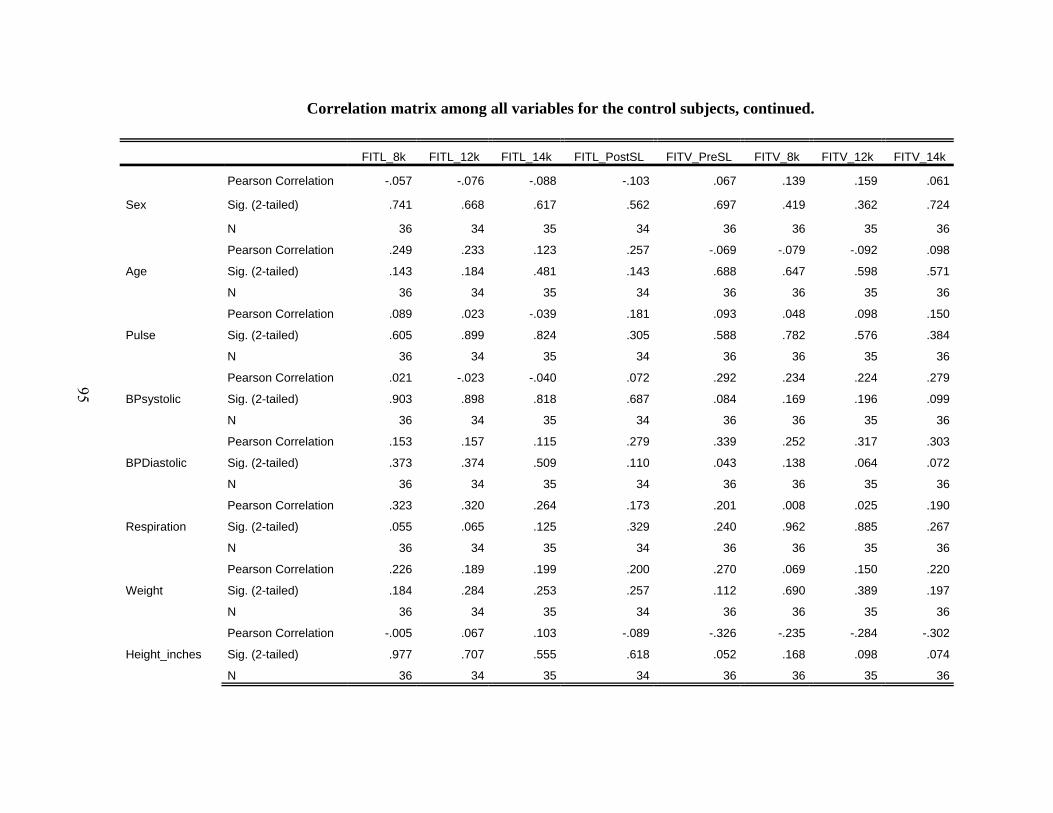
95
Correlation matrix among all variables for the control subjects, continued.
FITL_8k FITL_12k FITL_14k FITL_PostSL FITV_PreSL FITV_8k FITV_12k FITV_14k
Sex
Pearson Correlation -.057 -.076 -.088 -.103 .067 .139 .159 .061
Sig. (2-tailed) .741 .668 .617 .562 .697 .419 .362 .724
N 36 34 35 34 36 36 35 36
Age
Pearson Correlation .249 .233 .123 .257 -.069 -.079 -.092 .098
Sig. (2-tailed) .143 .184 .481 .143 .688 .647 .598 .571
N 36 34 35 34 36 36 35 36
Pulse
Pearson Correlation .089 .023 -.039 .181 .093 .048 .098 .150
Sig. (2-tailed) .605 .899 .824 .305 .588 .782 .576 .384
N 36 34 35 34 36 36 35 36
BPsystolic
Pearson Correlation .021 -.023 -.040 .072 .292 .234 .224 .279
Sig. (2-tailed) .903 .898 .818 .687 .084 .169 .196 .099
N 36 34 35 34 36 36 35 36
BPDiastolic
Pearson Correlation .153 .157 .115 .279 .339 .252 .317 .303
Sig. (2-tailed) .373 .374 .509 .110 .043 .138 .064 .072
N 36 34 35 34 36 36 35 36
Respiration
Pearson Correlation .323 .320 .264 .173 .201 .008 .025 .190
Sig. (2-tailed) .055 .065 .125 .329 .240 .962 .885 .267
N 36 34 35 34 36 36 35 36
Weight
Pearson Correlation .226 .189 .199 .200 .270 .069 .150 .220
Sig. (2-tailed) .184 .284 .253 .257 .112 .690 .389 .197
N 36 34 35 34 36 36 35 36
Height_inches
Pearson Correlation -.005 .067 .103 -.089 -.326 -.235 -.284 -.302
Sig. (2-tailed) .977 .707 .555 .618 .052 .168 .098 .074
N 36 34 35 34 36 36 35 36
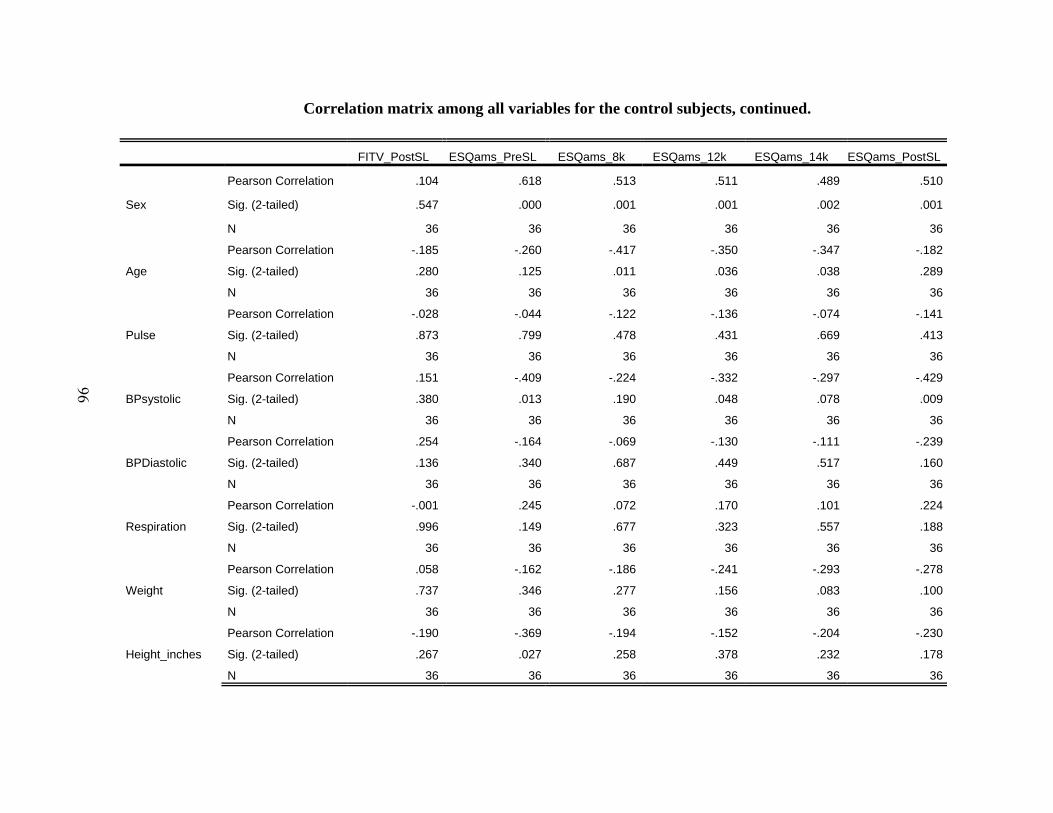
96
Correlation matrix among all variables for the control subjects, continued.
FITV_PostSL ESQams_PreSL ESQams_8k ESQams_12k ESQams_14k ESQams_PostSL
Sex
Pearson Correlation .104 .618 .513 .511 .489 .510
Sig. (2-tailed) .547 .000 .001 .001 .002 .001
N 36 36 36 36 36 36
Age
Pearson Correlation -.185 -.260 -.417 -.350 -.347 -.182
Sig. (2-tailed) .280 .125 .011 .036 .038 .289
N 36 36 36 36 36 36
Pulse
Pearson Correlation -.028 -.044 -.122 -.136 -.074 -.141
Sig. (2-tailed) .873 .799 .478 .431 .669 .413
N 36 36 36 36 36 36
BPsystolic
Pearson Correlation .151 -.409 -.224 -.332 -.297 -.429
Sig. (2-tailed) .380 .013 .190 .048 .078 .009
N 36 36 36 36 36 36
BPDiastolic
Pearson Correlation .254 -.164 -.069 -.130 -.111 -.239
Sig. (2-tailed) .136 .340 .687 .449 .517 .160
N 36 36 36 36 36 36
Respiration
Pearson Correlation -.001 .245 .072 .170 .101 .224
Sig. (2-tailed) .996 .149 .677 .323 .557 .188
N 36 36 36 36 36 36
Weight
Pearson Correlation .058 -.162 -.186 -.241 -.293 -.278
Sig. (2-tailed) .737 .346 .277 .156 .083 .100
N 36 36 36 36 36 36
Height_inches
Pearson Correlation -.190 -.369 -.194 -.152 -.204 -.230
Sig. (2-tailed) .267 .027 .258 .378 .232 .178
N 36 36 36 36 36 36
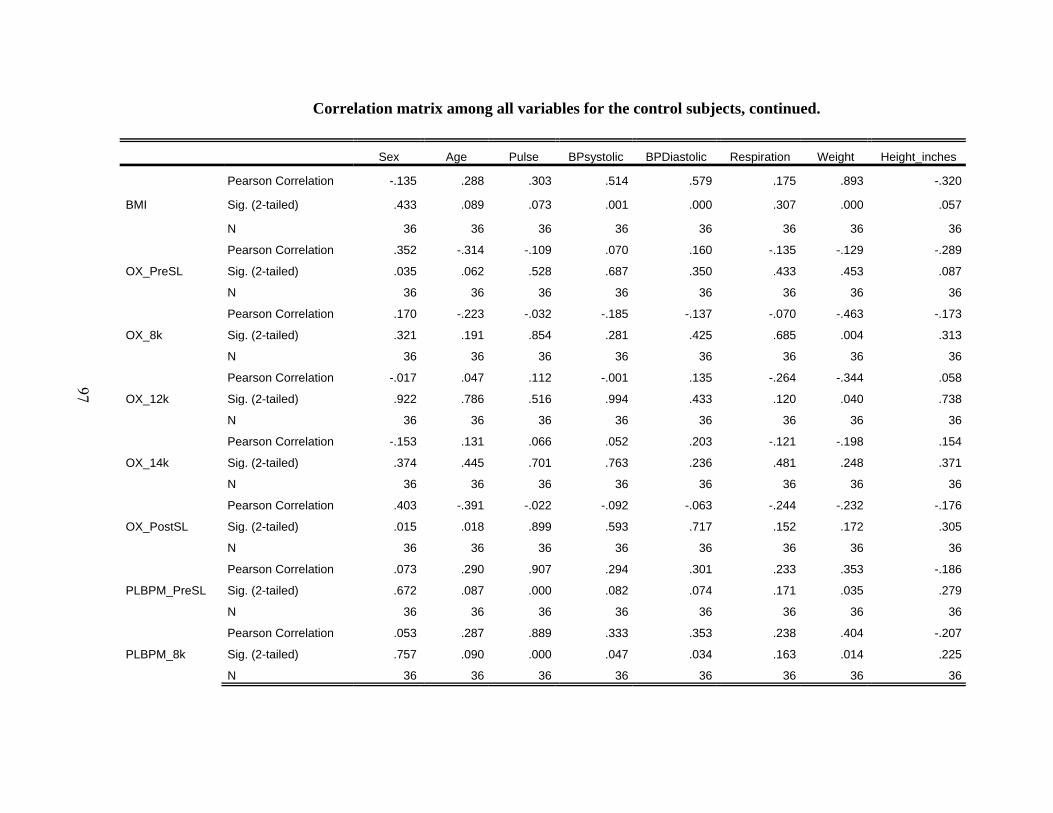
97
Correlation matrix among all variables for the control subjects, continued.
Sex Age Pulse BPsystolic BPDiastolic Respiration Weight Height_inches
BMI
Pearson Correlation -.135 .288 .303 .514 .579 .175 .893 -.320
Sig. (2-tailed) .433 .089 .073 .001 .000 .307 .000 .057
N 36 36 36 36 36 36 36 36
OX_PreSL
Pearson Correlation .352 -.314 -.109 .070 .160 -.135 -.129 -.289
Sig. (2-tailed) .035 .062 .528 .687 .350 .433 .453 .087
N 36 36 36 36 36 36 36 36
OX_8k
Pearson Correlation .170 -.223 -.032 -.185 -.137 -.070 -.463 -.173
Sig. (2-tailed) .321 .191 .854 .281 .425 .685 .004 .313
N 36 36 36 36 36 36 36 36
OX_12k
Pearson Correlation -.017 .047 .112 -.001 .135 -.264 -.344 .058
Sig. (2-tailed) .922 .786 .516 .994 .433 .120 .040 .738
N 36 36 36 36 36 36 36 36
OX_14k
Pearson Correlation -.153 .131 .066 .052 .203 -.121 -.198 .154
Sig. (2-tailed) .374 .445 .701 .763 .236 .481 .248 .371
N 36 36 36 36 36 36 36 36
OX_PostSL
Pearson Correlation .403 -.391 -.022 -.092 -.063 -.244 -.232 -.176
Sig. (2-tailed) .015 .018 .899 .593 .717 .152 .172 .305
N 36 36 36 36 36 36 36 36
PLBPM_PreSL
Pearson Correlation .073 .290 .907 .294 .301 .233 .353 -.186
Sig. (2-tailed) .672 .087 .000 .082 .074 .171 .035 .279
N 36 36 36 36 36 36 36 36
PLBPM_8k
Pearson Correlation .053 .287 .889 .333 .353 .238 .404 -.207
Sig. (2-tailed) .757 .090 .000 .047 .034 .163 .014 .225
N 36 36 36 36 36 36 36 36

98
Correlation matrix among all variables for the control subjects, continued.
BMI OX_PreSL OX_8k OX_12k OX_14k OX_PostSL PLBPM_PreSL PLBPM_8k
BMI
Pearson Correlation 1 .002 -.363 -.345 -.210 -.193 .409 .460
Sig. (2-tailed) .993 .030 .039 .220 .260 .013 .005
N 36 36 36 36 36 36 36 36
OX_PreSL
Pearson Correlation .002 1 .480 .213 .154 .579 -.066 -.119
Sig. (2-tailed) .993 .003 .212 .369 .000 .700 .490
N 36 36 36 36 36 36 36 36
OX_8k
Pearson Correlation -.363 .480 1 .618 .651 .439 -.145 -.206
Sig. (2-tailed) .030 .003 .000 .000 .007 .398 .228
N 36 36 36 36 36 36 36 36
OX_12k
Pearson Correlation -.345 .213 .618 1 .668 .322 -.035 -.016
Sig. (2-tailed) .039 .212 .000 .000 .056 .838 .928
N 36 36 36 36 36 36 36 36
OX_14k
Pearson Correlation -.210 .154 .651 .668 1 .204 -.073 -.114
Sig. (2-tailed) .220 .369 .000 .000 .233 .673 .506
N 36 36 36 36 36 36 36 36
OX_PostSL
Pearson Correlation -.193 .579 .439 .322 .204 1 -.040 -.078
Sig. (2-tailed) .260 .000 .007 .056 .233 .819 .650
N 36 36 36 36 36 36 36 36
PLBPM_PreSL
Pearson Correlation .409 -.066 -.145 -.035 -.073 -.040 1 .963
Sig. (2-tailed) .013 .700 .398 .838 .673 .819 .000
N 36 36 36 36 36 36 36 36
PLBPM_8k
Pearson Correlation .460 -.119 -.206 -.016 -.114 -.078 .963 1
Sig. (2-tailed) .005 .490 .228 .928 .506 .650 .000
N 36 36 36 36 36 36 36 36
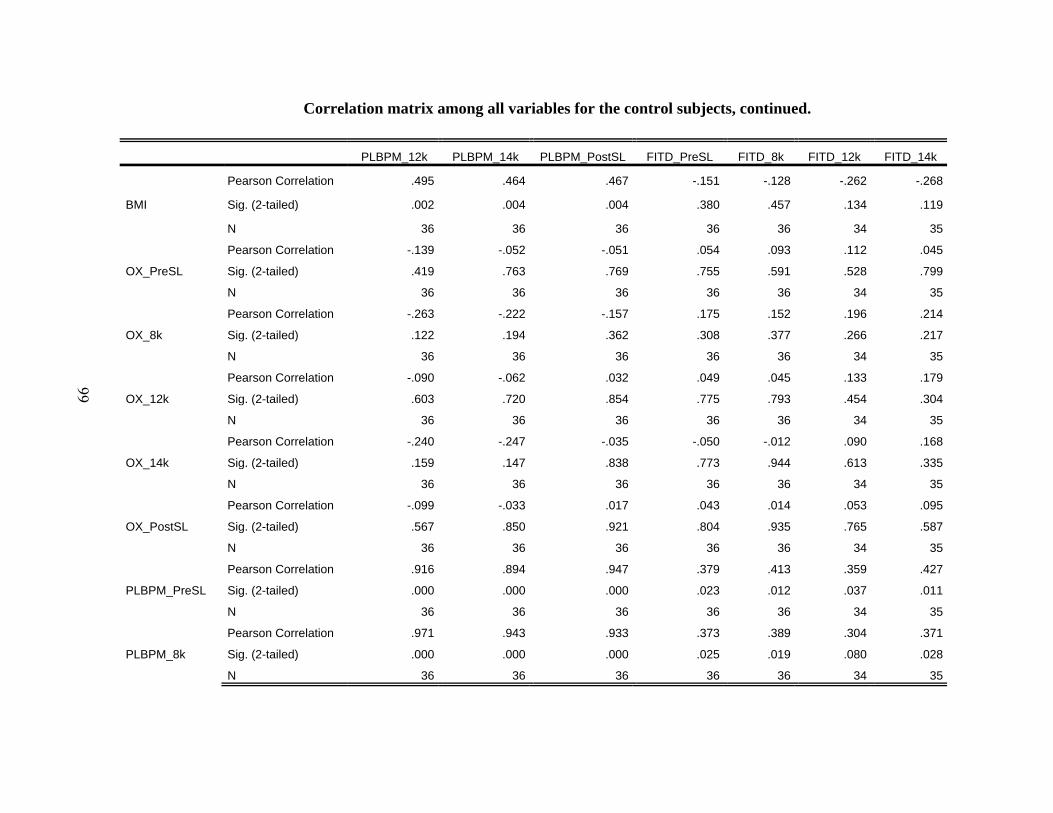
99
Correlation matrix among all variables for the control subjects, continued.
PLBPM_12k PLBPM_14k PLBPM_PostSL FITD_PreSL FITD_8k FITD_12k FITD_14k
BMI
Pearson Correlation .495 .464 .467 -.151 -.128 -.262 -.268
Sig. (2-tailed) .002 .004 .004 .380 .457 .134 .119
N 36 36 36 36 36 34 35
OX_PreSL
Pearson Correlation -.139 -.052 -.051 .054 .093 .112 .045
Sig. (2-tailed) .419 .763 .769 .755 .591 .528 .799
N 36 36 36 36 36 34 35
OX_8k
Pearson Correlation -.263 -.222 -.157 .175 .152 .196 .214
Sig. (2-tailed) .122 .194 .362 .308 .377 .266 .217
N 36 36 36 36 36 34 35
OX_12k
Pearson Correlation -.090 -.062 .032 .049 .045 .133 .179
Sig. (2-tailed) .603 .720 .854 .775 .793 .454 .304
N 36 36 36 36 36 34 35
OX_14k
Pearson Correlation -.240 -.247 -.035 -.050 -.012 .090 .168
Sig. (2-tailed) .159 .147 .838 .773 .944 .613 .335
N 36 36 36 36 36 34 35
OX_PostSL
Pearson Correlation -.099 -.033 .017 .043 .014 .053 .095
Sig. (2-tailed) .567 .850 .921 .804 .935 .765 .587
N 36 36 36 36 36 34 35
PLBPM_PreSL
Pearson Correlation .916 .894 .947 .379 .413 .359 .427
Sig. (2-tailed) .000 .000 .000 .023 .012 .037 .011
N 36 36 36 36 36 34 35
PLBPM_8k
Pearson Correlation .971 .943 .933 .373 .389 .304 .371
Sig. (2-tailed) .000 .000 .000 .025 .019 .080 .028
N 36 36 36 36 36 34 35

100
Correlation matrix among all variables for the control subjects, continued.
FITD_PostSL FITA_PreSL FITA_8k FITA_12k FITA_14k FITA_PostSL FITL_PreSL
BMI
Pearson Correlation -.305 -.049 -.039 -.017 -.026 -.062 .239
Sig. (2-tailed) .079 .778 .820 .925 .883 .730 .160
N 34 36 36 34 35 34 36
OX_PreSL
Pearson Correlation .117 .020 .133 .113 .002 -.004 -.149
Sig. (2-tailed) .510 .909 .441 .526 .993 .983 .385
N 34 36 36 34 35 34 36
OX_8k
Pearson Correlation .255 .212 .245 .256 .335 .097 -.367
Sig. (2-tailed) .146 .214 .149 .144 .049 .586 .028
N 34 36 36 34 35 34 36
OX_12k
Pearson Correlation .031 .010 .049 .162 .143 -.186 -.280
Sig. (2-tailed) .862 .953 .777 .360 .412 .293 .098
N 34 36 36 34 35 34 36
OX_14k
Pearson Correlation .048 -.031 .093 .120 .267 .024 -.132
Sig. (2-tailed) .786 .857 .591 .500 .121 .891 .444
N 34 36 36 34 35 34 36
OX_PostSL
Pearson Correlation .084 .347 .313 .367 .250 .249 -.541
Sig. (2-tailed) .637 .038 .063 .033 .148 .156 .001
N 34 36 36 34 35 34 36
PLBPM_PreSL
Pearson Correlation .295 .049 .114 .106 .121 -.206 .084
Sig. (2-tailed) .090 .775 .506 .550 .490 .242 .628
N 34 36 36 34 35 34 36
PLBPM_8k
Pearson Correlation .238 .044 .129 .130 .100 -.230 .092
Sig. (2-tailed) .176 .799 .452 .462 .568 .191 .592
N 34 36 36 34 35 34 36

101
Correlation matrix among all variables for the control subjects, continued.
FITL_8k FITL_12k FITL_14k FITL_PostSL FITV_PreSL FITV_8k FITV_12k FITV_14k
BMI
Pearson Correlation .192 .135 .114 .205 .302 .096 .201 .259
Sig. (2-tailed) .263 .445 .515 .244 .073 .576 .247 .127
N 36 34 35 34 36 36 35 36
OX_PreSL
Pearson Correlation -.173 -.192 -.206 -.062 .000 .119 .096 .006
Sig. (2-tailed) .312 .276 .235 .726 .998 .488 .583 .972
N 36 34 35 34 36 36 35 36
OX_8k
Pearson Correlation -.362 -.350 -.338 -.076 .104 .099 .124 .105
Sig. (2-tailed) .030 .043 .047 .668 .547 .566 .477 .543
N 36 34 35 34 36 36 35 36
OX_12k
Pearson Correlation -.309 -.355 -.240 -.073 .037 .180 .158 .181
Sig. (2-tailed) .066 .039 .165 .683 .830 .294 .366 .291
N 36 34 35 34 36 36 35 36
OX_14k
Pearson Correlation -.148 -.123 -.072 .029 .095 .077 .130 .123
Sig. (2-tailed) .389 .487 .680 .871 .582 .656 .457 .476
N 36 34 35 34 36 36 35 36
OX_PostSL
Pearson Correlation -.575 -.582 -.524 -.491 .084 .203 .089 .105
Sig. (2-tailed) .000 .000 .001 .003 .627 .235 .612 .542
N 36 34 35 34 36 36 35 36
PLBPM_PreSL
Pearson Correlation .059 .068 -.002 .213 .185 .137 .153 .151
Sig. (2-tailed) .730 .701 .993 .227 .281 .427 .381 .379
N 36 34 35 34 36 36 35 36
PLBPM_8k
Pearson Correlation .052 .066 .015 .230 .210 .164 .180 .206
Sig. (2-tailed) .761 .711 .934 .190 .219 .338 .302 .229
N 36 34 35 34 36 36 35 36

102
Correlation matrix among all variables for the control subjects, continued.
FITV_PostSL ESQams_PreSL ESQams_8k ESQams_12k ESQams_14k ESQams_PostSL
BMI
Pearson Correlation .044 -.060 -.149 -.219 -.245 -.200
Sig. (2-tailed) .798 .727 .385 .200 .150 .241
N 36 36 36 36 36 36
OX_PreSL
Pearson Correlation .036 .364 .436 .333 .359 .259
Sig. (2-tailed) .833 .029 .008 .047 .031 .126
N 36 36 36 36 36 36
OX_8k
Pearson Correlation .139 .165 .100 .129 .089 .230
Sig. (2-tailed) .418 .335 .560 .453 .607 .177
N 36 36 36 36 36 36
OX_12k
Pearson Correlation .292 .041 -.049 -.104 -.113 -.167
Sig. (2-tailed) .084 .811 .778 .545 .511 .329
N 36 36 36 36 36 36
OX_14k
Pearson Correlation .108 -.059 -.142 -.163 -.218 -.082
Sig. (2-tailed) .532 .731 .410 .342 .201 .634
N 36 36 36 36 36 36
OX_PostSL
Pearson Correlation .238 .123 .201 .158 .135 .080
Sig. (2-tailed) .162 .474 .239 .356 .432 .642
N 36 36 36 36 36 36
PLBPM_PreSL
Pearson Correlation .020 -.127 -.155 -.152 -.073 -.229
Sig. (2-tailed) .908 .460 .367 .378 .673 .180
N 36 36 36 36 36 36
PLBPM_8k
Pearson Correlation .072 -.067 -.139 -.162 -.066 -.281
Sig. (2-tailed) .677 .698 .419 .346 .702 .097
N 36 36 36 36 36 36
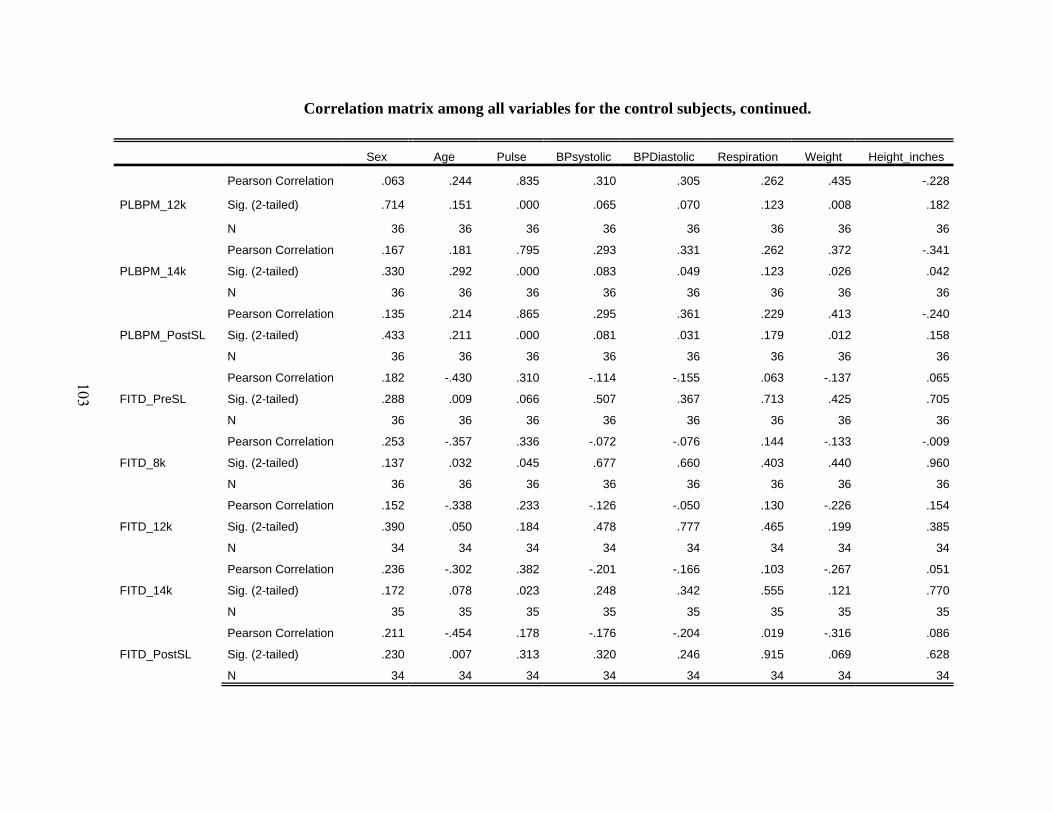
103
Correlation matrix among all variables for the control subjects, continued.
Sex Age Pulse BPsystolic BPDiastolic Respiration Weight Height_inches
PLBPM_12k
Pearson Correlation .063 .244 .835 .310 .305 .262 .435 -.228
Sig. (2-tailed) .714 .151 .000 .065 .070 .123 .008 .182
N 36 36 36 36 36 36 36 36
PLBPM_14k
Pearson Correlation .167 .181 .795 .293 .331 .262 .372 -.341
Sig. (2-tailed) .330 .292 .000 .083 .049 .123 .026 .042
N 36 36 36 36 36 36 36 36
PLBPM_PostSL
Pearson Correlation .135 .214 .865 .295 .361 .229 .413 -.240
Sig. (2-tailed) .433 .211 .000 .081 .031 .179 .012 .158
N 36 36 36 36 36 36 36 36
FITD_PreSL
Pearson Correlation .182 -.430 .310 -.114 -.155 .063 -.137 .065
Sig. (2-tailed) .288 .009 .066 .507 .367 .713 .425 .705
N 36 36 36 36 36 36 36 36
FITD_8k
Pearson Correlation .253 -.357 .336 -.072 -.076 .144 -.133 -.009
Sig. (2-tailed) .137 .032 .045 .677 .660 .403 .440 .960
N 36 36 36 36 36 36 36 36
FITD_12k
Pearson Correlation .152 -.338 .233 -.126 -.050 .130 -.226 .154
Sig. (2-tailed) .390 .050 .184 .478 .777 .465 .199 .385
N 34 34 34 34 34 34 34 34
FITD_14k
Pearson Correlation .236 -.302 .382 -.201 -.166 .103 -.267 .051
Sig. (2-tailed) .172 .078 .023 .248 .342 .555 .121 .770
N 35 35 35 35 35 35 35 35
FITD_PostSL
Pearson Correlation .211 -.454 .178 -.176 -.204 .019 -.316 .086
Sig. (2-tailed) .230 .007 .313 .320 .246 .915 .069 .628
N 34 34 34 34 34 34 34 34

104
Correlation matrix among all variables for the control subjects, continued.
BMI OX_PreSL OX_8k OX_12k OX_14k OX_PostSL PLBPM_PreSL PLBPM_8k
PLBPM_12k
Pearson Correlation .495 -.139 -.263 -.090 -.240 -.099 .916 .971
Sig. (2-tailed) .002 .419 .122 .603 .159 .567 .000 .000
N 36 36 36 36 36 36 36 36
PLBPM_14k
Pearson Correlation .464 -.052 -.222 -.062 -.247 -.033 .894 .943
Sig. (2-tailed) .004 .763 .194 .720 .147 .850 .000 .000
N 36 36 36 36 36 36 36 36
PLBPM_PostSL
Pearson Correlation .467 -.051 -.157 .032 -.035 .017 .947 .933
Sig. (2-tailed) .004 .769 .362 .854 .838 .921 .000 .000
N 36 36 36 36 36 36 36 36
FITD_PreSL
Pearson Correlation -.151 .054 .175 .049 -.050 .043 .379 .373
Sig. (2-tailed) .380 .755 .308 .775 .773 .804 .023 .025
N 36 36 36 36 36 36 36 36
FITD_8k
Pearson Correlation -.128 .093 .152 .045 -.012 .014 .413 .389
Sig. (2-tailed) .457 .591 .377 .793 .944 .935 .012 .019
N 36 36 36 36 36 36 36 36
FITD_12k
Pearson Correlation -.262 .112 .196 .133 .090 .053 .359 .304
Sig. (2-tailed) .134 .528 .266 .454 .613 .765 .037 .080
N 34 34 34 34 34 34 34 34
FITD_14k
Pearson Correlation -.268 .045 .214 .179 .168 .095 .427 .371
Sig. (2-tailed) .119 .799 .217 .304 .335 .587 .011 .028
N 35 35 35 35 35 35 35 35
FITD_PostSL
Pearson Correlation -.305 .117 .255 .031 .048 .084 .295 .238
Sig. (2-tailed) .079 .510 .146 .862 .786 .637 .090 .176
N 34 34 34 34 34 34 34 34
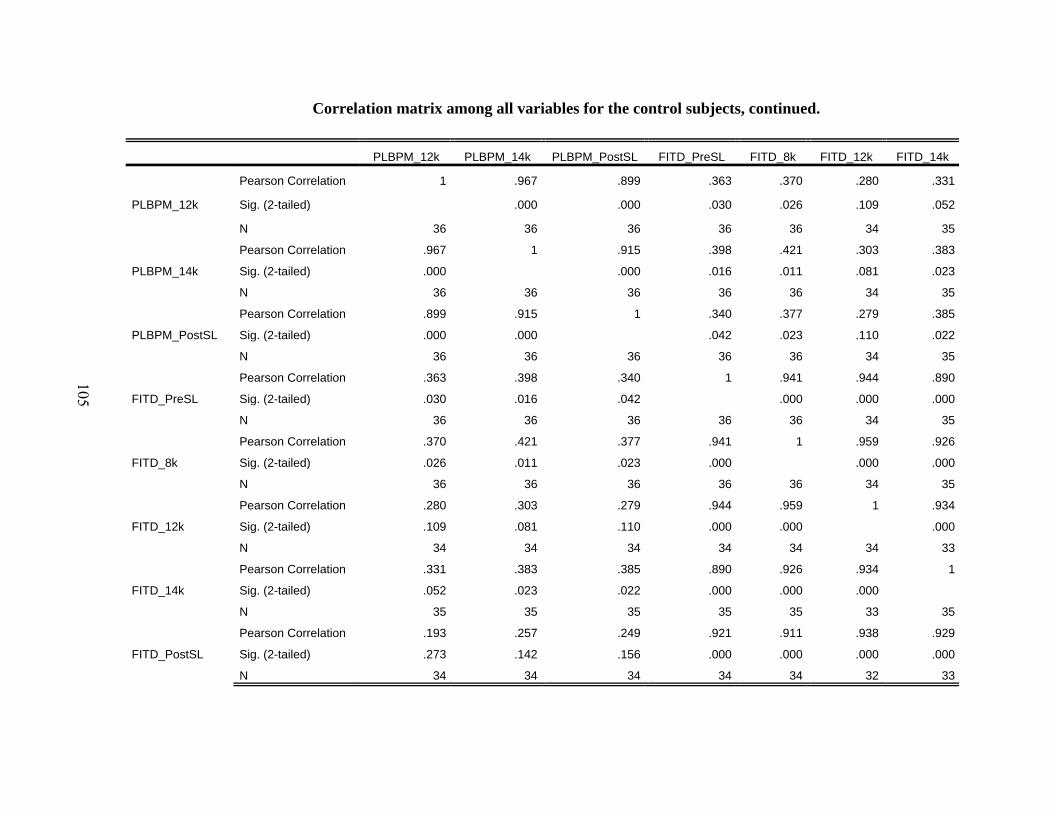
105
Correlation matrix among all variables for the control subjects, continued.
PLBPM_12k PLBPM_14k PLBPM_PostSL FITD_PreSL FITD_8k FITD_12k FITD_14k
PLBPM_12k
Pearson Correlation 1 .967 .899 .363 .370 .280 .331
Sig. (2-tailed) .000 .000 .030 .026 .109 .052
N 36 36 36 36 36 34 35
PLBPM_14k
Pearson Correlation .967 1 .915 .398 .421 .303 .383
Sig. (2-tailed) .000 .000 .016 .011 .081 .023
N 36 36 36 36 36 34 35
PLBPM_PostSL
Pearson Correlation .899 .915 1 .340 .377 .279 .385
Sig. (2-tailed) .000 .000 .042 .023 .110 .022
N 36 36 36 36 36 34 35
FITD_PreSL
Pearson Correlation .363 .398 .340 1 .941 .944 .890
Sig. (2-tailed) .030 .016 .042 .000 .000 .000
N 36 36 36 36 36 34 35
FITD_8k
Pearson Correlation .370 .421 .377 .941 1 .959 .926
Sig. (2-tailed) .026 .011 .023 .000 .000 .000
N 36 36 36 36 36 34 35
FITD_12k
Pearson Correlation .280 .303 .279 .944 .959 1 .934
Sig. (2-tailed) .109 .081 .110 .000 .000 .000
N 34 34 34 34 34 34 33
FITD_14k
Pearson Correlation .331 .383 .385 .890 .926 .934 1
Sig. (2-tailed) .052 .023 .022 .000 .000 .000
N 35 35 35 35 35 33 35
FITD_PostSL
Pearson Correlation .193 .257 .249 .921 .911 .938 .929
Sig. (2-tailed) .273 .142 .156 .000 .000 .000 .000
N 34 34 34 34 34 32 33

106
Correlation matrix among all variables for the control subjects, continued.
FITD_PostSL FITA_PreSL FITA_8k FITA_12k FITA_14k FITA_PostSL FITL_PreSL
PLBPM_12k
Pearson Correlation .193 .036 .085 .105 .049 -.252 .122
Sig. (2-tailed) .273 .834 .621 .554 .779 .150 .478
N 34 36 36 34 35 34 36
PLBPM_14k
Pearson Correlation .257 .009 .073 .088 .013 -.260 .105
Sig. (2-tailed) .142 .957 .673 .619 .942 .137 .544
N 34 36 36 34 35 34 36
PLBPM_PostSL
Pearson Correlation .249 .008 .086 .120 .076 -.186 .104
Sig. (2-tailed) .156 .964 .617 .500 .665 .291 .546
N 34 36 36 34 35 34 36
FITD_PreSL
Pearson Correlation .921 .119 .142 .113 .019 -.041 .131
Sig. (2-tailed) .000 .488 .408 .525 .913 .820 .447
N 34 36 36 34 35 34 36
FITD_8k
Pearson Correlation .911 .065 .142 .119 .047 -.039 .213
Sig. (2-tailed) .000 .707 .408 .504 .787 .827 .212
N 34 36 36 34 35 34 36
FITD_12k
Pearson Correlation .938 .028 .112 .061 .021 -.066 .193
Sig. (2-tailed) .000 .874 .529 .731 .907 .719 .274
N 32 34 34 34 33 32 34
FITD_14k
Pearson Correlation .929 -.001 .036 .030 .045 -.097 .116
Sig. (2-tailed) .000 .995 .835 .869 .797 .593 .508
N 33 35 35 33 35 33 35
FITD_PostSL
Pearson Correlation 1 .005 .096 .023 -.039 -.034 .128
Sig. (2-tailed) .977 .590 .899 .831 .850 .470
N 34 34 34 32 33 34 34

107
Correlation matrix among all variables for the control subjects, continued.
FITL_8k FITL_12k FITL_14k FITL_PostSL FITV_PreSL FITV_8k FITV_12k FITV_14k
PLBPM_12k
Pearson Correlation .090 .086 .049 .242 .200 .133 .157 .209
Sig. (2-tailed) .602 .627 .780 .168 .241 .439 .369 .221
N 36 34 35 34 36 36 35 36
PLBPM_14k
Pearson Correlation .059 .062 .041 .222 .257 .197 .242 .237
Sig. (2-tailed) .733 .728 .817 .207 .130 .248 .162 .165
N 36 34 35 34 36 36 35 36
PLBPM_PostSL
Pearson Correlation .023 .032 -.001 .160 .270 .207 .238 .193
Sig. (2-tailed) .893 .858 .995 .367 .112 .226 .169 .259
N 36 34 35 34 36 36 35 36
FITD_PreSL
Pearson Correlation .122 .202 .245 .274 .055 .085 .184 -.024
Sig. (2-tailed) .478 .253 .156 .116 .748 .621 .290 .891
N 36 34 35 34 36 36 35 36
FITD_8k
Pearson Correlation .219 .284 .310 .345 .091 .083 .215 -.035
Sig. (2-tailed) .199 .104 .070 .045 .598 .632 .215 .838
N 36 34 35 34 36 36 35 36
FITD_12k
Pearson Correlation .226 .319 .344 .350 .058 .084 .164 -.023
Sig. (2-tailed) .199 .066 .050 .050 .746 .636 .354 .897
N 34 34 33 32 34 34 34 34
FITD_14k
Pearson Correlation .142 .193 .284 .238 -.011 .022 .128 -.088
Sig. (2-tailed) .416 .281 .098 .182 .948 .899 .470 .616
N 35 33 35 33 35 35 34 35
FITD_PostSL
Pearson Correlation .112 .255 .285 .206 .002 .061 .131 -.127
Sig. (2-tailed) .529 .158 .109 .241 .992 .731 .466 .474
N 34 32 33 34 34 34 33 34

108
Correlation matrix among all variables for the control subjects, continued.
FITV_PostSL ESQams_PreSL ESQams_8k ESQams_12k ESQams_14k ESQams_PostSL
PLBPM_12k
Pearson Correlation .092 -.062 -.126 -.152 -.047 -.274
Sig. (2-tailed) .594 .721 .464 .376 .786 .105
N 36 36 36 36 36 36
PLBPM_14k
Pearson Correlation .190 .028 -.025 -.051 .083 -.210
Sig. (2-tailed) .268 .869 .887 .769 .629 .220
N 36 36 36 36 36 36
PLBPM_PostSL
Pearson Correlation .151 -.086 -.104 -.133 -.009 -.267
Sig. (2-tailed) .381 .618 .546 .439 .957 .116
N 36 36 36 36 36 36
FITD_PreSL
Pearson Correlation .108 .143 .215 .240 .238 .072
Sig. (2-tailed) .529 .404 .207 .159 .162 .677
N 36 36 36 36 36 36
FITD_8k
Pearson Correlation .098 .143 .163 .166 .170 .012
Sig. (2-tailed) .571 .405 .341 .333 .321 .944
N 36 36 36 36 36 36
FITD_12k
Pearson Correlation .127 .090 .165 .215 .165 .028
Sig. (2-tailed) .474 .614 .350 .221 .350 .874
N 34 34 34 34 34 34
FITD_14k
Pearson Correlation .049 .098 .134 .143 .111 .023
Sig. (2-tailed) .782 .577 .443 .412 .524 .894
N 35 35 35 35 35 35
FITD_PostSL
Pearson Correlation .035 .128 .402 .370 .376 .152
Sig. (2-tailed) .844 .472 .018 .031 .028 .390
N 34 34 34 34 34 34
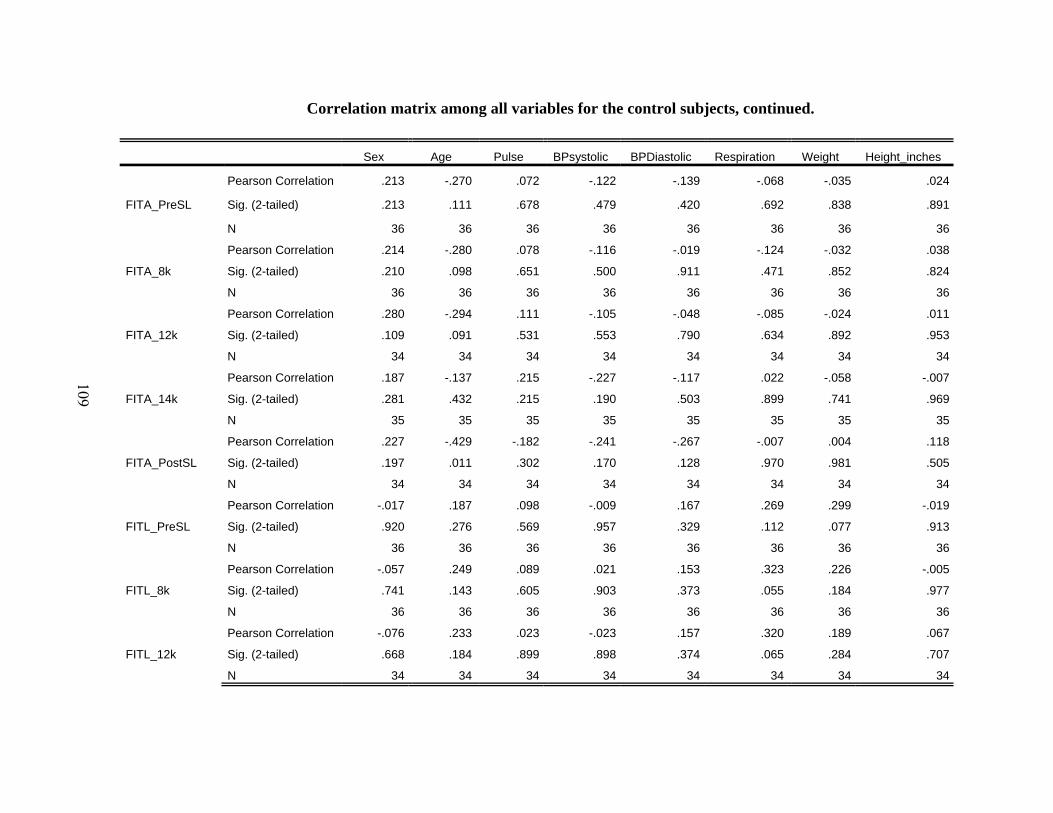
109
Correlation matrix among all variables for the control subjects, continued.
Sex Age Pulse BPsystolic BPDiastolic Respiration Weight Height_inches
FITA_PreSL
Pearson Correlation .213 -.270 .072 -.122 -.139 -.068 -.035 .024
Sig. (2-tailed) .213 .111 .678 .479 .420 .692 .838 .891
N 36 36 36 36 36 36 36 36
FITA_8k
Pearson Correlation .214 -.280 .078 -.116 -.019 -.124 -.032 .038
Sig. (2-tailed) .210 .098 .651 .500 .911 .471 .852 .824
N 36 36 36 36 36 36 36 36
FITA_12k
Pearson Correlation .280 -.294 .111 -.105 -.048 -.085 -.024 .011
Sig. (2-tailed) .109 .091 .531 .553 .790 .634 .892 .953
N 34 34 34 34 34 34 34 34
FITA_14k
Pearson Correlation .187 -.137 .215 -.227 -.117 .022 -.058 -.007
Sig. (2-tailed) .281 .432 .215 .190 .503 .899 .741 .969
N 35 35 35 35 35 35 35 35
FITA_PostSL
Pearson Correlation .227 -.429 -.182 -.241 -.267 -.007 .004 .118
Sig. (2-tailed) .197 .011 .302 .170 .128 .970 .981 .505
N 34 34 34 34 34 34 34 34
FITL_PreSL
Pearson Correlation -.017 .187 .098 -.009 .167 .269 .299 -.019
Sig. (2-tailed) .920 .276 .569 .957 .329 .112 .077 .913
N 36 36 36 36 36 36 36 36
FITL_8k
Pearson Correlation -.057 .249 .089 .021 .153 .323 .226 -.005
Sig. (2-tailed) .741 .143 .605 .903 .373 .055 .184 .977
N 36 36 36 36 36 36 36 36
FITL_12k
Pearson Correlation -.076 .233 .023 -.023 .157 .320 .189 .067
Sig. (2-tailed) .668 .184 .899 .898 .374 .065 .284 .707
N 34 34 34 34 34 34 34 34

110
Correlation matrix among all variables for the control subjects, continued.
BMI OX_PreSL OX_8k OX_12k OX_14k OX_PostSL PLBPM_PreSL PLBPM_8k
FITA_PreSL
Pearson Correlation -.049 .020 .212 .010 -.031 .347 .049 .044
Sig. (2-tailed) .778 .909 .214 .953 .857 .038 .775 .799
N 36 36 36 36 36 36 36 36
FITA_8k
Pearson Correlation -.039 .133 .245 .049 .093 .313 .114 .129
Sig. (2-tailed) .820 .441 .149 .777 .591 .063 .506 .452
N 36 36 36 36 36 36 36 36
FITA_12k
Pearson Correlation -.017 .113 .256 .162 .120 .367 .106 .130
Sig. (2-tailed) .925 .526 .144 .360 .500 .033 .550 .462
N 34 34 34 34 34 34 34 34
FITA_14k
Pearson Correlation -.026 .002 .335 .143 .267 .250 .121 .100
Sig. (2-tailed) .883 .993 .049 .412 .121 .148 .490 .568
N 35 35 35 35 35 35 35 35
FITA_PostSL
Pearson Correlation -.062 -.004 .097 -.186 .024 .249 -.206 -.230
Sig. (2-tailed) .730 .983 .586 .293 .891 .156 .242 .191
N 34 34 34 34 34 34 34 34
FITL_PreSL
Pearson Correlation .239 -.149 -.367 -.280 -.132 -.541 .084 .092
Sig. (2-tailed) .160 .385 .028 .098 .444 .001 .628 .592
N 36 36 36 36 36 36 36 36
FITL_8k
Pearson Correlation .192 -.173 -.362 -.309 -.148 -.575 .059 .052
Sig. (2-tailed) .263 .312 .030 .066 .389 .000 .730 .761
N 36 36 36 36 36 36 36 36
FITL_12k
Pearson Correlation .135 -.192 -.350 -.355 -.123 -.582 .068 .066
Sig. (2-tailed) .445 .276 .043 .039 .487 .000 .701 .711
N 34 34 34 34 34 34 34 34
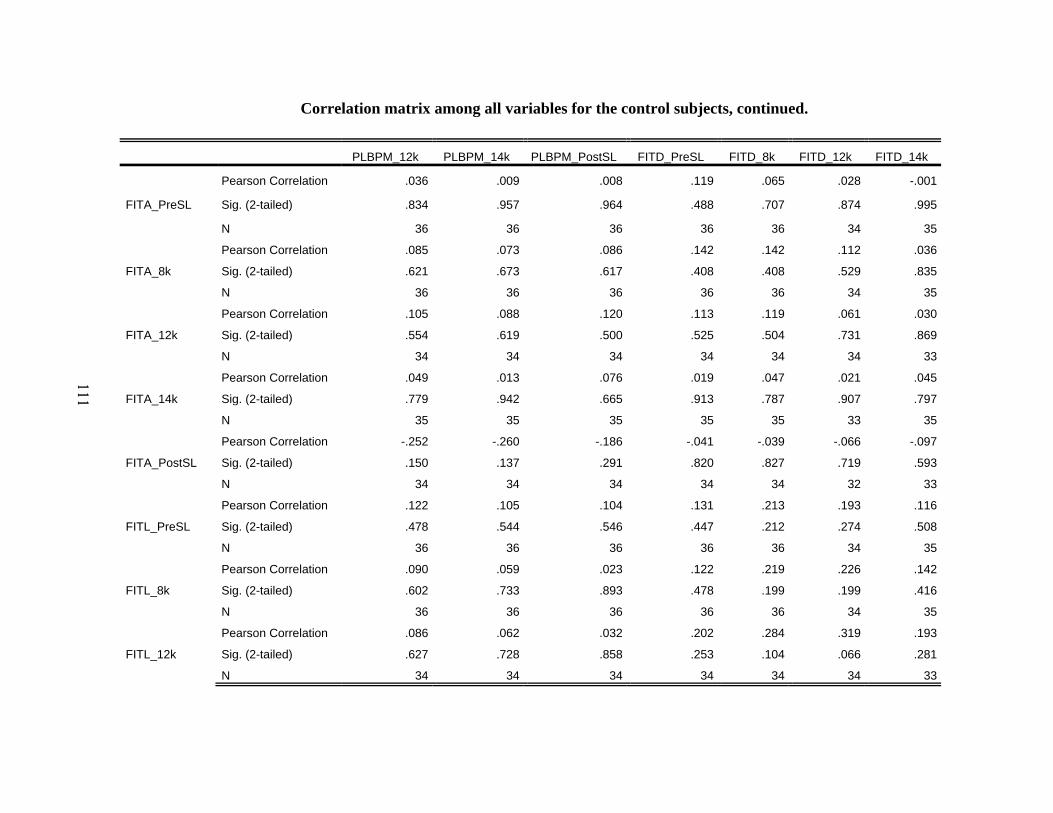
111
Correlation matrix among all variables for the control subjects, continued.
PLBPM_12k PLBPM_14k PLBPM_PostSL FITD_PreSL FITD_8k FITD_12k FITD_14k
FITA_PreSL
Pearson Correlation .036 .009 .008 .119 .065 .028 -.001
Sig. (2-tailed) .834 .957 .964 .488 .707 .874 .995
N 36 36 36 36 36 34 35
FITA_8k
Pearson Correlation .085 .073 .086 .142 .142 .112 .036
Sig. (2-tailed) .621 .673 .617 .408 .408 .529 .835
N 36 36 36 36 36 34 35
FITA_12k
Pearson Correlation .105 .088 .120 .113 .119 .061 .030
Sig. (2-tailed) .554 .619 .500 .525 .504 .731 .869
N 34 34 34 34 34 34 33
FITA_14k
Pearson Correlation .049 .013 .076 .019 .047 .021 .045
Sig. (2-tailed) .779 .942 .665 .913 .787 .907 .797
N 35 35 35 35 35 33 35
FITA_PostSL
Pearson Correlation -.252 -.260 -.186 -.041 -.039 -.066 -.097
Sig. (2-tailed) .150 .137 .291 .820 .827 .719 .593
N 34 34 34 34 34 32 33
FITL_PreSL
Pearson Correlation .122 .105 .104 .131 .213 .193 .116
Sig. (2-tailed) .478 .544 .546 .447 .212 .274 .508
N 36 36 36 36 36 34 35
FITL_8k
Pearson Correlation .090 .059 .023 .122 .219 .226 .142
Sig. (2-tailed) .602 .733 .893 .478 .199 .199 .416
N 36 36 36 36 36 34 35
FITL_12k
Pearson Correlation .086 .062 .032 .202 .284 .319 .193
Sig. (2-tailed) .627 .728 .858 .253 .104 .066 .281
N 34 34 34 34 34 34 33

112
Correlation matrix among all variables for the control subjects, continued.
FITD_PostSL FITA_PreSL FITA_8k FITA_12k FITA_14k FITA_PostSL FITL_PreSL
FITA_PreSL
Pearson Correlation .005 1 .844 .873 .779 .832 -.486
Sig. (2-tailed) .977 .000 .000 .000 .000 .003
N 34 36 36 34 35 34 36
FITA_8k
Pearson Correlation .096 .844 1 .907 .787 .859 -.444
Sig. (2-tailed) .590 .000 .000 .000 .000 .007
N 34 36 36 34 35 34 36
FITA_12k
Pearson Correlation .023 .873 .907 1 .825 .840 -.428
Sig. (2-tailed) .899 .000 .000 .000 .000 .011
N 32 34 34 34 33 32 34
FITA_14k
Pearson Correlation -.039 .779 .787 .825 1 .793 -.512
Sig. (2-tailed) .831 .000 .000 .000 .000 .002
N 33 35 35 33 35 33 35
FITA_PostSL
Pearson Correlation -.034 .832 .859 .840 .793 1 -.299
Sig. (2-tailed) .850 .000 .000 .000 .000 .086
N 34 34 34 32 33 34 34
FITL_PreSL
Pearson Correlation .128 -.486 -.444 -.428 -.512 -.299 1
Sig. (2-tailed) .470 .003 .007 .011 .002 .086
N 34 36 36 34 35 34 36
FITL_8k
Pearson Correlation .112 -.436 -.508 -.460 -.457 -.390 .924
Sig. (2-tailed) .529 .008 .002 .006 .006 .022 .000
N 34 36 36 34 35 34 36
FITL_12k
Pearson Correlation .255 -.446 -.389 -.452 -.484 -.314 .925
Sig. (2-tailed) .158 .008 .023 .007 .004 .080 .000
N 32 34 34 34 33 32 34

113
Correlation matrix among all variables for the control subjects, continued.
FITL_8k FITL_12k FITL_14k FITL_PostSL FITV_PreSL FITV_8k FITV_12k FITV_14k
FITA_PreSL
Pearson Correlation -.436 -.446 -.407 -.204 .122 .122 .067 -.029
Sig. (2-tailed) .008 .008 .015 .248 .479 .480 .704 .869
N 36 34 35 34 36 36 35 36
FITA_8k
Pearson Correlation -.508 -.389 -.362 -.190 .117 .077 .090 -.160
Sig. (2-tailed) .002 .023 .033 .281 .496 .654 .608 .350
N 36 34 35 34 36 36 35 36
FITA_12k
Pearson Correlation -.460 -.452 -.398 -.191 .154 .113 .062 -.045
Sig. (2-tailed) .006 .007 .022 .296 .384 .523 .726 .798
N 34 34 33 32 34 34 34 34
FITA_14k
Pearson Correlation -.457 -.484 -.487 -.326 -.030 -.165 -.098 -.183
Sig. (2-tailed) .006 .004 .003 .064 .864 .345 .582 .292
N 35 33 35 33 35 35 34 35
FITA_PostSL
Pearson Correlation -.390 -.314 -.269 -.310 -.021 -.040 -.036 -.198
Sig. (2-tailed) .022 .080 .130 .074 .905 .824 .842 .261
N 34 32 33 34 34 34 33 34
FITL_PreSL
Pearson Correlation .924 .925 .881 .911 .033 -.010 .057 .105
Sig. (2-tailed) .000 .000 .000 .000 .848 .952 .745 .542
N 36 34 35 34 36 36 35 36
FITL_8k
Pearson Correlation 1 .922 .868 .919 -.007 -.091 -.028 .096
Sig. (2-tailed) .000 .000 .000 .967 .597 .871 .578
N 36 34 35 34 36 36 35 36
FITL_12k
Pearson Correlation .922 1 .920 .940 .008 -.035 .020 .050
Sig. (2-tailed) .000 .000 .000 .964 .844 .911 .781
N 34 34 33 32 34 34 34 34

114
Correlation matrix among all variables for the control subjects, continued.
FITV_PostSL ESQams_PreSL ESQams_8k ESQams_12k ESQams_14k ESQams_PostSL
FITA_PreSL
Pearson Correlation .087 -.138 -.056 .114 -.117 .180
Sig. (2-tailed) .614 .424 .745 .506 .495 .293
N 36 36 36 36 36 36
FITA_8k
Pearson Correlation .068 -.065 -.137 -.040 -.117 -.025
Sig. (2-tailed) .694 .706 .425 .817 .498 .883
N 36 36 36 36 36 36
FITA_12k
Pearson Correlation .082 -.063 -.133 -.026 -.137 .011
Sig. (2-tailed) .643 .723 .454 .886 .441 .952
N 34 34 34 34 34 34
FITA_14k
Pearson Correlation -.068 -.033 -.258 -.160 -.281 -.040
Sig. (2-tailed) .697 .849 .135 .358 .103 .817
N 35 35 35 35 35 35
FITA_PostSL
Pearson Correlation -.032 -.003 -.107 .094 -.142 .205
Sig. (2-tailed) .855 .989 .548 .596 .424 .245
N 34 34 34 34 34 34
FITL_PreSL
Pearson Correlation -.095 .112 .165 .207 .197 .139
Sig. (2-tailed) .582 .517 .336 .226 .249 .420
N 36 36 36 36 36 36
FITL_8k
Pearson Correlation -.173 .054 .187 .228 .165 .200
Sig. (2-tailed) .314 .753 .275 .181 .335 .243
N 36 36 36 36 36 36
FITL_12k
Pearson Correlation -.138 .076 .161 .255 .215 .159
Sig. (2-tailed) .436 .668 .363 .146 .222 .369
N 34 34 34 34 34 34

115
Correlation matrix among all variables for the control subjects, continued.
Sex Age Pulse BPsystolic BPDiastolic Respiration Weight Height_inches
FITL_14k
Pearson Correlation -.088 .123 -.039 -.040 .115 .264 .199 .103
Sig. (2-tailed) .617 .481 .824 .818 .509 .125 .253 .555
N 35 35 35 35 35 35 35 35
FITL_PostSL
Pearson Correlation -.103 .257 .181 .072 .279 .173 .200 -.089
Sig. (2-tailed) .562 .143 .305 .687 .110 .329 .257 .618
N 34 34 34 34 34 34 34 34
FITV_PreSL
Pearson Correlation .067 -.069 .093 .292 .339 .201 .270 -.326
Sig. (2-tailed) .697 .688 .588 .084 .043 .240 .112 .052
N 36 36 36 36 36 36 36 36
FITV_8k
Pearson Correlation .139 -.079 .048 .234 .252 .008 .069 -.235
Sig. (2-tailed) .419 .647 .782 .169 .138 .962 .690 .168
N 36 36 36 36 36 36 36 36
FITV_12k
Pearson Correlation .159 -.092 .098 .224 .317 .025 .150 -.284
Sig. (2-tailed) .362 .598 .576 .196 .064 .885 .389 .098
N 35 35 35 35 35 35 35 35
FITV_14k
Pearson Correlation .061 .098 .150 .279 .303 .190 .220 -.302
Sig. (2-tailed) .724 .571 .384 .099 .072 .267 .197 .074
N 36 36 36 36 36 36 36 36
FITV_PostSL
Pearson Correlation .104 -.185 -.028 .151 .254 -.001 .058 -.190
Sig. (2-tailed) .547 .280 .873 .380 .136 .996 .737 .267
N 36 36 36 36 36 36 36 36
ESQams_PreSL
Pearson Correlation .618 -.260 -.044 -.409 -.164 .245 -.162 -.369
Sig. (2-tailed) .000 .125 .799 .013 .340 .149 .346 .027
N 36 36 36 36 36 36 36 36

116
Correlation matrix among all variables for the control subjects, continued.
BMI OX_PreSL OX_8k OX_12k OX_14k OX_PostSL PLBPM_PreSL PLBPM_8k
FITL_14k
Pearson Correlation .114 -.206 -.338 -.240 -.072 -.524 -.002 .015
Sig. (2-tailed) .515 .235 .047 .165 .680 .001 .993 .934
N 35 35 35 35 35 35 35 35
FITL_PostSL
Pearson Correlation .205 -.062 -.076 -.073 .029 -.491 .213 .230
Sig. (2-tailed) .244 .726 .668 .683 .871 .003 .227 .190
N 34 34 34 34 34 34 34 34
FITV_PreSL
Pearson Correlation .302 .000 .104 .037 .095 .084 .185 .210
Sig. (2-tailed) .073 .998 .547 .830 .582 .627 .281 .219
N 36 36 36 36 36 36 36 36
FITV_8k
Pearson Correlation .096 .119 .099 .180 .077 .203 .137 .164
Sig. (2-tailed) .576 .488 .566 .294 .656 .235 .427 .338
N 36 36 36 36 36 36 36 36
FITV_12k
Pearson Correlation .201 .096 .124 .158 .130 .089 .153 .180
Sig. (2-tailed) .247 .583 .477 .366 .457 .612 .381 .302
N 35 35 35 35 35 35 35 35
FITV_14k
Pearson Correlation .259 .006 .105 .181 .123 .105 .151 .206
Sig. (2-tailed) .127 .972 .543 .291 .476 .542 .379 .229
N 36 36 36 36 36 36 36 36
FITV_PostSL
Pearson Correlation .044 .036 .139 .292 .108 .238 .020 .072
Sig. (2-tailed) .798 .833 .418 .084 .532 .162 .908 .677
N 36 36 36 36 36 36 36 36
ESQams_PreSL
Pearson Correlation -.060 .364 .165 .041 -.059 .123 -.127 -.067
Sig. (2-tailed) .727 .029 .335 .811 .731 .474 .460 .698
N 36 36 36 36 36 36 36 36

117
Correlation matrix among all variables for the control subjects, continued.
PLBPM_12k PLBPM_14k PLBPM_PostSL FITD_PreSL FITD_8k FITD_12k FITD_14k
FITL_14k
Pearson Correlation .049 .041 -.001 .245 .310 .344 .284
Sig. (2-tailed) .780 .817 .995 .156 .070 .050 .098
N 35 35 35 35 35 33 35
FITL_PostSL
Pearson Correlation .242 .222 .160 .274 .345 .350 .238
Sig. (2-tailed) .168 .207 .367 .116 .045 .050 .182
N 34 34 34 34 34 32 33
FITV_PreSL
Pearson Correlation .200 .257 .270 .055 .091 .058 -.011
Sig. (2-tailed) .241 .130 .112 .748 .598 .746 .948
N 36 36 36 36 36 34 35
FITV_8k
Pearson Correlation .133 .197 .207 .085 .083 .084 .022
Sig. (2-tailed) .439 .248 .226 .621 .632 .636 .899
N 36 36 36 36 36 34 35
FITV_12k
Pearson Correlation .157 .242 .238 .184 .215 .164 .128
Sig. (2-tailed) .369 .162 .169 .290 .215 .354 .470
N 35 35 35 35 35 34 34
FITV_14k
Pearson Correlation .209 .237 .193 -.024 -.035 -.023 -.088
Sig. (2-tailed) .221 .165 .259 .891 .838 .897 .616
N 36 36 36 36 36 34 35
FITV_PostSL
Pearson Correlation .092 .190 .151 .108 .098 .127 .049
Sig. (2-tailed) .594 .268 .381 .529 .571 .474 .782
N 36 36 36 36 36 34 35
ESQams_PreSL
Pearson Correlation -.062 .028 -.086 .143 .143 .090 .098
Sig. (2-tailed) .721 .869 .618 .404 .405 .614 .577
N 36 36 36 36 36 34 35
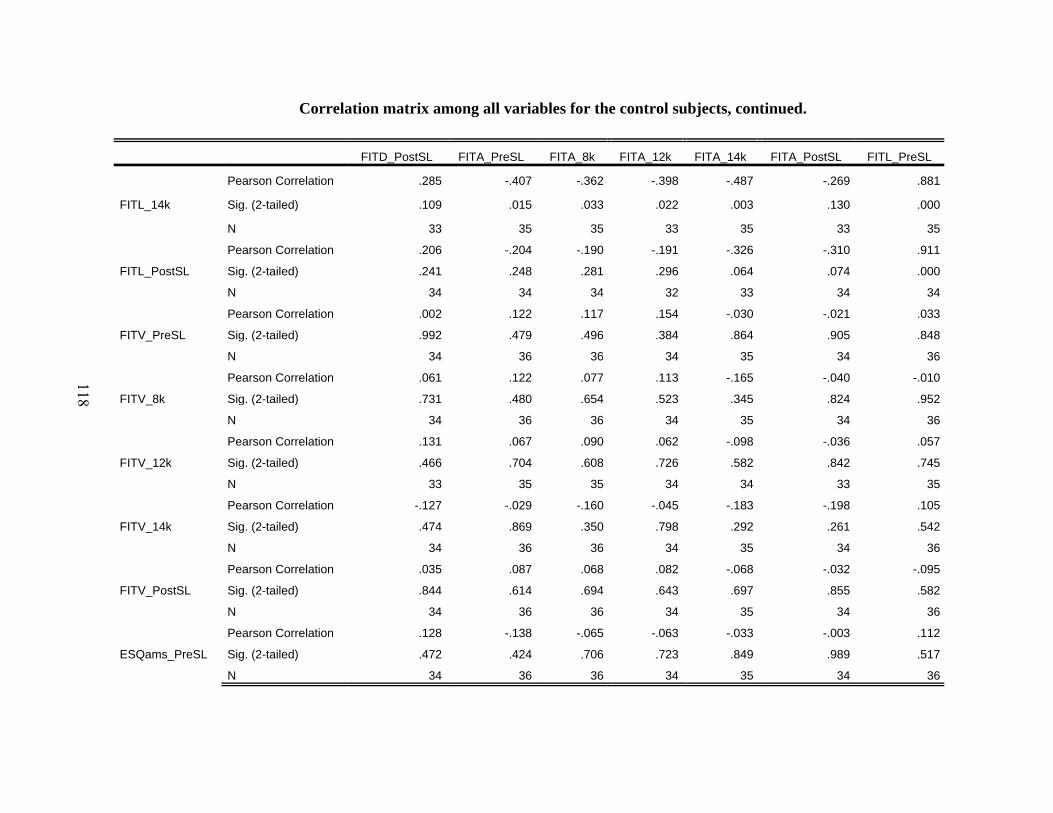
118
Correlation matrix among all variables for the control subjects, continued.
FITD_PostSL FITA_PreSL FITA_8k FITA_12k FITA_14k FITA_PostSL FITL_PreSL
FITL_14k
Pearson Correlation .285 -.407 -.362 -.398 -.487 -.269 .881
Sig. (2-tailed) .109 .015 .033 .022 .003 .130 .000
N 33 35 35 33 35 33 35
FITL_PostSL
Pearson Correlation .206 -.204 -.190 -.191 -.326 -.310 .911
Sig. (2-tailed) .241 .248 .281 .296 .064 .074 .000
N 34 34 34 32 33 34 34
FITV_PreSL
Pearson Correlation .002 .122 .117 .154 -.030 -.021 .033
Sig. (2-tailed) .992 .479 .496 .384 .864 .905 .848
N 34 36 36 34 35 34 36
FITV_8k
Pearson Correlation .061 .122 .077 .113 -.165 -.040 -.010
Sig. (2-tailed) .731 .480 .654 .523 .345 .824 .952
N 34 36 36 34 35 34 36
FITV_12k
Pearson Correlation .131 .067 .090 .062 -.098 -.036 .057
Sig. (2-tailed) .466 .704 .608 .726 .582 .842 .745
N 33 35 35 34 34 33 35
FITV_14k
Pearson Correlation -.127 -.029 -.160 -.045 -.183 -.198 .105
Sig. (2-tailed) .474 .869 .350 .798 .292 .261 .542
N 34 36 36 34 35 34 36
FITV_PostSL
Pearson Correlation .035 .087 .068 .082 -.068 -.032 -.095
Sig. (2-tailed) .844 .614 .694 .643 .697 .855 .582
N 34 36 36 34 35 34 36
ESQams_PreSL
Pearson Correlation .128 -.138 -.065 -.063 -.033 -.003 .112
Sig. (2-tailed) .472 .424 .706 .723 .849 .989 .517
N 34 36 36 34 35 34 36

119
Correlation matrix among all variables for the control subjects, continued.
FITL_8k FITL_12k FITL_14k FITL_PostSL FITV_PreSL FITV_8k FITV_12k FITV_14k
FITL_14k
Pearson Correlation .868 .920 1 .922 .038 -.032 .039 .035
Sig. (2-tailed) .000 .000 .000 .827 .857 .827 .842
N 35 33 35 33 35 35 34 35
FITL_PostSL
Pearson Correlation .919 .940 .922 1 .215 .142 .192 .234
Sig. (2-tailed) .000 .000 .000 .223 .424 .285 .182
N 34 32 33 34 34 34 33 34
FITV_PreSL
Pearson Correlation -.007 .008 .038 .215 1 .855 .868 .821
Sig. (2-tailed) .967 .964 .827 .223 .000 .000 .000
N 36 34 35 34 36 36 35 36
FITV_8k
Pearson Correlation -.091 -.035 -.032 .142 .855 1 .908 .851
Sig. (2-tailed) .597 .844 .857 .424 .000 .000 .000
N 36 34 35 34 36 36 35 36
FITV_12k
Pearson Correlation -.028 .020 .039 .192 .868 .908 1 .794
Sig. (2-tailed) .871 .911 .827 .285 .000 .000 .000
N 35 34 34 33 35 35 35 35
FITV_14k
Pearson Correlation .096 .050 .035 .234 .821 .851 .794 1
Sig. (2-tailed) .578 .781 .842 .182 .000 .000 .000
N 36 34 35 34 36 36 35 36
FITV_PostSL
Pearson Correlation -.173 -.138 -.057 .029 .813 .833 .871 .774
Sig. (2-tailed) .314 .436 .747 .872 .000 .000 .000 .000
N 36 34 35 34 36 36 35 36
ESQams_PreSL
Pearson Correlation .054 .076 .066 .000 .024 .159 .187 .220
Sig. (2-tailed) .753 .668 .708 .999 .891 .353 .281 .197
N 36 34 35 34 36 36 35 36
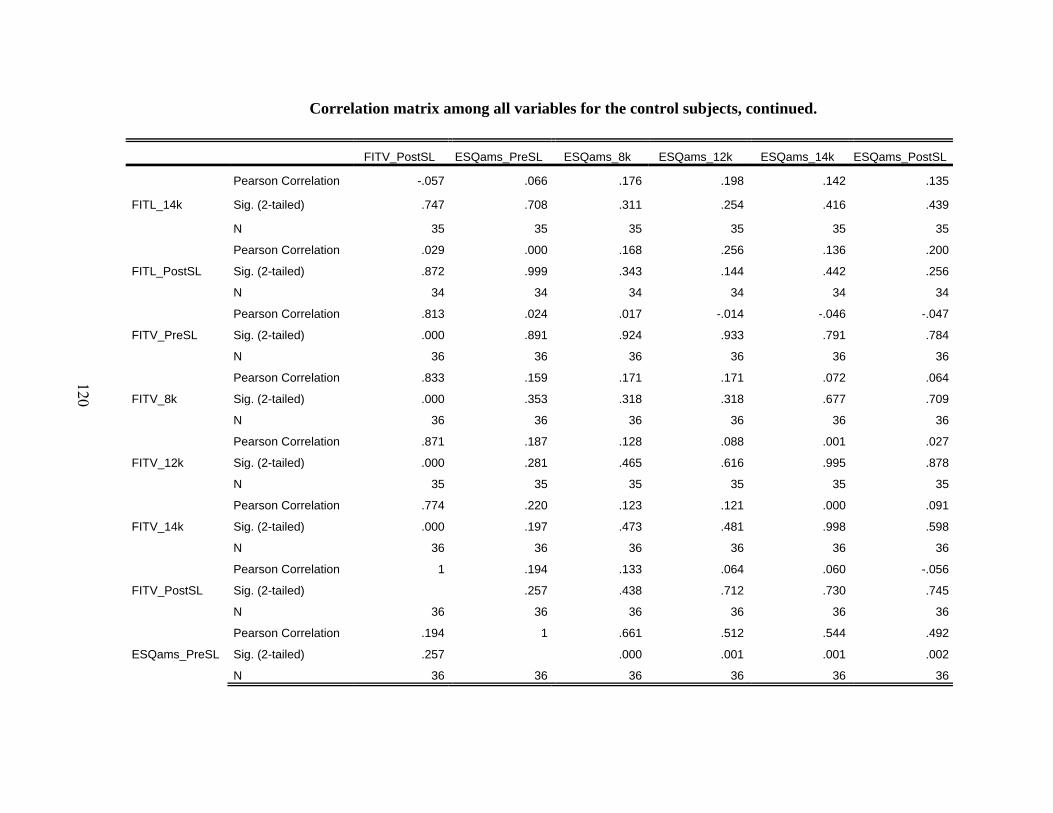
120
Correlation matrix among all variables for the control subjects, continued.
FITV_PostSL ESQams_PreSL ESQams_8k ESQams_12k ESQams_14k ESQams_PostSL
FITL_14k
Pearson Correlation -.057 .066 .176 .198 .142 .135
Sig. (2-tailed) .747 .708 .311 .254 .416 .439
N 35 35 35 35 35 35
FITL_PostSL
Pearson Correlation .029 .000 .168 .256 .136 .200
Sig. (2-tailed) .872 .999 .343 .144 .442 .256
N 34 34 34 34 34 34
FITV_PreSL
Pearson Correlation .813 .024 .017 -.014 -.046 -.047
Sig. (2-tailed) .000 .891 .924 .933 .791 .784
N 36 36 36 36 36 36
FITV_8k
Pearson Correlation .833 .159 .171 .171 .072 .064
Sig. (2-tailed) .000 .353 .318 .318 .677 .709
N 36 36 36 36 36 36
FITV_12k
Pearson Correlation .871 .187 .128 .088 .001 .027
Sig. (2-tailed) .000 .281 .465 .616 .995 .878
N 35 35 35 35 35 35
FITV_14k
Pearson Correlation .774 .220 .123 .121 .000 .091
Sig. (2-tailed) .000 .197 .473 .481 .998 .598
N 36 36 36 36 36 36
FITV_PostSL
Pearson Correlation 1 .194 .133 .064 .060 -.056
Sig. (2-tailed) .257 .438 .712 .730 .745
N 36 36 36 36 36 36
ESQams_PreSL
Pearson Correlation .194 1 .661 .512 .544 .492
Sig. (2-tailed) .257 .000 .001 .001 .002
N 36 36 36 36 36 36
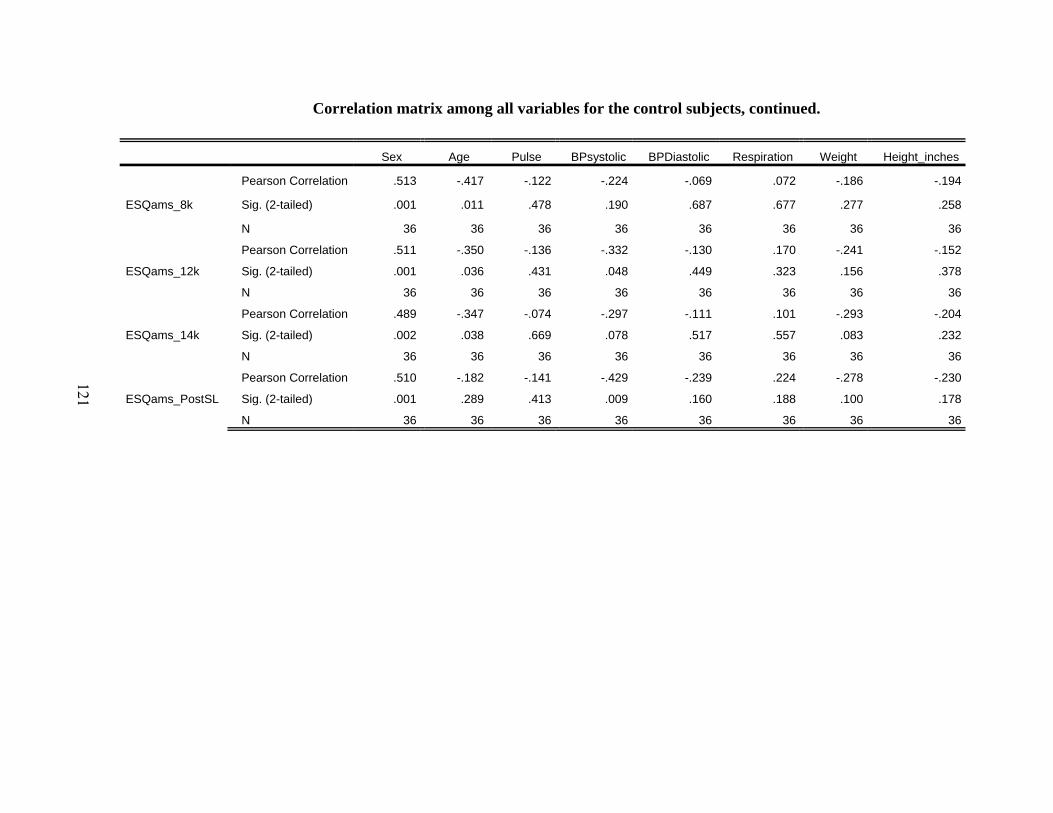
121
Correlation matrix among all variables for the control subjects, continued.
Sex Age Pulse BPsystolic BPDiastolic Respiration Weight Height_inches
ESQams_8k
Pearson Correlation .513 -.417 -.122 -.224 -.069 .072 -.186 -.194
Sig. (2-tailed) .001 .011 .478 .190 .687 .677 .277 .258
N 36 36 36 36 36 36 36 36
ESQams_12k
Pearson Correlation .511 -.350 -.136 -.332 -.130 .170 -.241 -.152
Sig. (2-tailed) .001 .036 .431 .048 .449 .323 .156 .378
N 36 36 36 36 36 36 36 36
ESQams_14k
Pearson Correlation .489 -.347 -.074 -.297 -.111 .101 -.293 -.204
Sig. (2-tailed) .002 .038 .669 .078 .517 .557 .083 .232
N 36 36 36 36 36 36 36 36
ESQams_PostSL
Pearson Correlation .510 -.182 -.141 -.429 -.239 .224 -.278 -.230
Sig. (2-tailed) .001 .289 .413 .009 .160 .188 .100 .178
N 36 36 36 36 36 36 36 36

122
Correlation matrix among all variables for the control subjects, continued.
BMI OX_PreSL OX_8k OX_12k OX_14k OX_PostSL PLBPM_PreSL PLBPM_8k
ESQams_8k
Pearson Correlation -.149 .436 .100 -.049 -.142 .201 -.155 -.139
Sig. (2-tailed) .385 .008 .560 .778 .410 .239 .367 .419
N 36 36 36 36 36 36 36 36
ESQams_12k
Pearson Correlation -.219 .333 .129 -.104 -.163 .158 -.152 -.162
Sig. (2-tailed) .200 .047 .453 .545 .342 .356 .378 .346
N 36 36 36 36 36 36 36 36
ESQams_14k
Pearson Correlation -.245 .359 .089 -.113 -.218 .135 -.073 -.066
Sig. (2-tailed) .150 .031 .607 .511 .201 .432 .673 .702
N 36 36 36 36 36 36 36 36
ESQams_PostSL
Pearson Correlation -.200 .259 .230 -.167 -.082 .080 -.229 -.281
Sig. (2-tailed) .241 .126 .177 .329 .634 .642 .180 .097
N 36 36 36 36 36 36 36 36
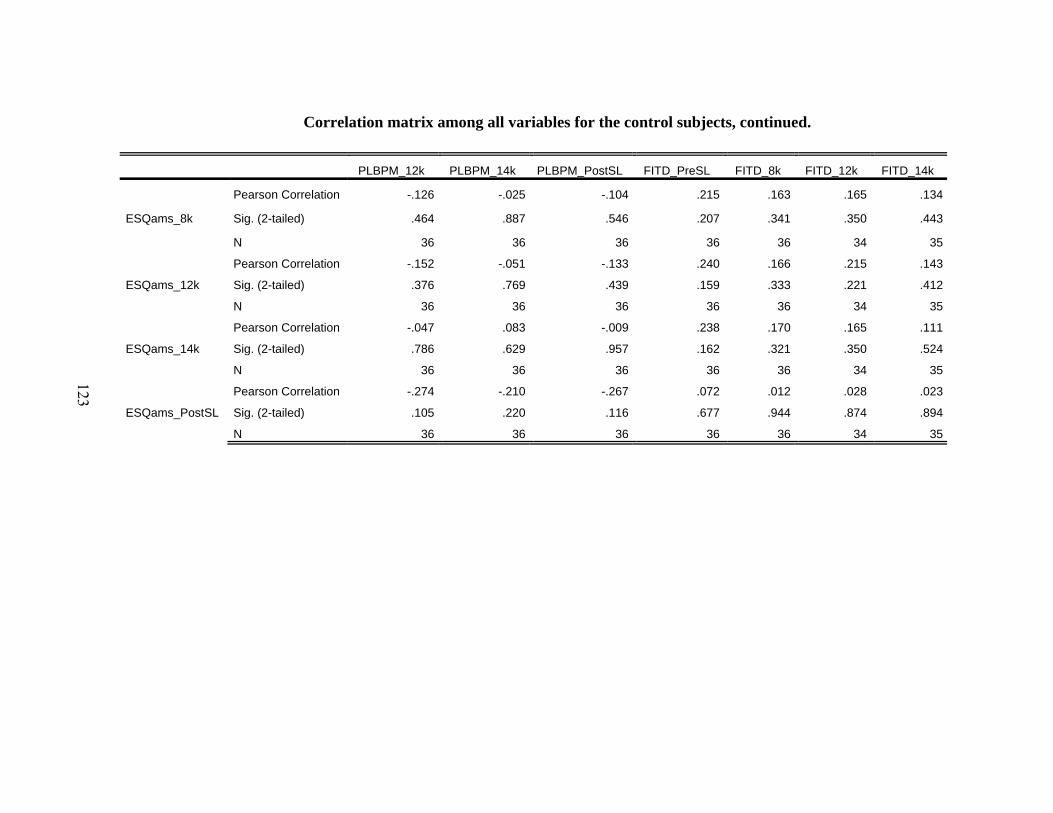
123
Correlation matrix among all variables for the control subjects, continued.
PLBPM_12k PLBPM_14k PLBPM_PostSL FITD_PreSL FITD_8k FITD_12k FITD_14k
ESQams_8k
Pearson Correlation -.126 -.025 -.104 .215 .163 .165 .134
Sig. (2-tailed) .464 .887 .546 .207 .341 .350 .443
N 36 36 36 36 36 34 35
ESQams_12k
Pearson Correlation -.152 -.051 -.133 .240 .166 .215 .143
Sig. (2-tailed) .376 .769 .439 .159 .333 .221 .412
N 36 36 36 36 36 34 35
ESQams_14k
Pearson Correlation -.047 .083 -.009 .238 .170 .165 .111
Sig. (2-tailed) .786 .629 .957 .162 .321 .350 .524
N 36 36 36 36 36 34 35
ESQams_PostSL
Pearson Correlation -.274 -.210 -.267 .072 .012 .028 .023
Sig. (2-tailed) .105 .220 .116 .677 .944 .874 .894
N 36 36 36 36 36 34 35

124
Correlation matrix among all variables for the control subjects, continued.
FITD_PostSL FITA_PreSL FITA_8k FITA_12k FITA_14k FITA_PostSL FITL_PreSL
ESQams_8k
Pearson Correlation .402 -.056 -.137 -.133 -.258 -.107 .165
Sig. (2-tailed) .018 .745 .425 .454 .135 .548 .336
N 34 36 36 34 35 34 36
ESQams_12k
Pearson Correlation .370 .114 -.040 -.026 -.160 .094 .207
Sig. (2-tailed) .031 .506 .817 .886 .358 .596 .226
N 34 36 36 34 35 34 36
ESQams_14k
Pearson Correlation .376 -.117 -.117 -.137 -.281 -.142 .197
Sig. (2-tailed) .028 .495 .498 .441 .103 .424 .249
N 34 36 36 34 35 34 36
ESQams_PostSL
Pearson Correlation .152 .180 -.025 .011 -.040 .205 .139
Sig. (2-tailed) .390 .293 .883 .952 .817 .245 .420
N 34 36 36 34 35 34 36

125
Correlation matrix among all variables for the control subjects, continued.
FITL_8k FITL_12k FITL_14k FITL_PostSL FITV_PreSL FITV_8k FITV_12k FITV_14k
ESQams_8k
Pearson Correlation .187 .161 .176 .168 .017 .171 .128 .123
Sig. (2-tailed) .275 .363 .311 .343 .924 .318 .465 .473
N 36 34 35 34 36 36 35 36
ESQams_12k
Pearson Correlation .228 .255 .198 .256 -.014 .171 .088 .121
Sig. (2-tailed) .181 .146 .254 .144 .933 .318 .616 .481
N 36 34 35 34 36 36 35 36
ESQams_14k
Pearson Correlation .165 .215 .142 .136 -.046 .072 .001 .000
Sig. (2-tailed) .335 .222 .416 .442 .791 .677 .995 .998
N 36 34 35 34 36 36 35 36
ESQams_PostSL
Pearson Correlation .200 .159 .135 .200 -.047 .064 .027 .091
Sig. (2-tailed) .243 .369 .439 .256 .784 .709 .878 .598
N 36 34 35 34 36 36 35 36

126
Correlation matrix among all variables for the control subjects, continued.
FITV_PostSL ESQams_PreSL ESQams_8k ESQams_12k ESQams_14k ESQams_PostSL
ESQams_8k
Pearson Correlation .133 .661 1 .851 .853 .686
Sig. (2-tailed) .438 .000 .000 .000 .000
N 36 36 36 36 36 36
ESQams_12k
Pearson Correlation .064 .512 .851 1 .848 .838
Sig. (2-tailed) .712 .001 .000 .000 .000
N 36 36 36 36 36 36
ESQams_14k
Pearson Correlation .060 .544 .853 .848 1 .640
Sig. (2-tailed) .730 .001 .000 .000 .000
N 36 36 36 36 36 36
ESQams_PostSL
Pearson Correlation -.056 .492 .686 .838 .640 1
Sig. (2-tailed) .745 .002 .000 .000 .000
N 36 36 36 36 36 36

Related Documents


![Normobaric and hyperbaric oxygen therapy for migraine and ... · [Intervention Review] Normobaric and hyperbaric oxygen therapy for migraine and cluster headache Michael H Bennett1,](https://static.cupdf.com/doc/110x72/5d02a60488c9932c7a8cb23f/normobaric-and-hyperbaric-oxygen-therapy-for-migraine-and-intervention.jpg)