1 23 European Journal of Applied Physiology ISSN 1439-6319 Eur J Appl Physiol DOI 10.1007/ s00421-011-2060-7 Acute short-term hyperoxia followed by mild hypoxia does not increase EPO production: resolving the “normobaric oxygen paradox” Tadej Debevec, Michail E. Keramidas, Barbara Norman, Thomas Gustafsson, Ola Eiken & Igor B. Mekjavic

Welcome message from author
This document is posted to help you gain knowledge. Please leave a comment to let me know what you think about it! Share it to your friends and learn new things together.
Transcript

1 23
European Journal of AppliedPhysiology ISSN 1439-6319 Eur J Appl PhysiolDOI 10.1007/s00421-011-2060-7
Acute short-term hyperoxia followedby mild hypoxia does not increase EPOproduction: resolving the “normobaricoxygen paradox”
Tadej Debevec, Michail E. Keramidas,Barbara Norman, Thomas Gustafsson,Ola Eiken & Igor B. Mekjavic

1 23
Your article is protected by copyright and
all rights are held exclusively by Springer-
Verlag. This e-offprint is for personal use only
and shall not be self-archived in electronic
repositories. If you wish to self-archive your
work, please use the accepted author’s
version for posting to your own website or
your institution’s repository. You may further
deposit the accepted author’s version on a
funder’s repository at a funder’s request,
provided it is not made publicly available until
12 months after publication.
ORIGINAL ARTICLE
Acute short-term hyperoxia followed by mild hypoxia doesnot increase EPO production: resolving the ‘‘normobaric oxygenparadox’’
Tadej Debevec • Michail E. Keramidas •
Barbara Norman • Thomas Gustafsson •
Ola Eiken • Igor B. Mekjavic
Received: 14 March 2011 / Accepted: 22 June 2011
� Springer-Verlag 2011
Abstract Recent findings suggest that besides renal tissue
hypoxia, relative decrements in tissue oxygenation, using a
transition of the breathing mixture from hyperoxic to
normoxic, can also stimulate erythropoietin (EPO) pro-
duction. To further clarify the importance of the relative
change in tissue oxygenation on plasma EPO concentration
[EPO], we investigated the effect of a consecutive hyper-
oxic and hypoxic breathing intervention. Eighteen healthy
male subjects were assigned to either IHH (N = 10) or
CON (N = 8) group. The IHH group breathed pure oxygen
(FiO2 * 1.0) for 1 h, followed by a 1-h period of breathing
a hypoxic gas mixture (FiO2 * 0.15). The CON group
breathed a normoxic gas mixture (FiO2 * 0.21) for the
same duration (2 h). Blood samples were taken just before,
after 60 min, and immediately after the 2-h exposure per-
iod. Thereafter, samples were taken at 3, 5, 8, 24, 32, and
48 h after the exposure. During the breathing interventions,
subjects remained in supine position. There were significant
increases in absolute [EPO] within groups at 8 and 32 h in
the CON and at 32 h only in the IHH group. No significant
differences in absolute [EPO] were observed between
groups following the intervention. Relative (D[EPO]) levels
were significantly lower in the IHH than in the CON group,
5 and 8 h following exposure. The tested protocol of con-
secutive hyperoxic-hypoxic gas mixture breathing did not
induce [EPO] synthesis stimulation. Moreover, the transient
attenuation in D[EPO] in the IHH group was most likely due
to a hyperoxic suppression. Hence, our findings provide
further evidence against the ‘‘normobaric O2 paradox’’
theory.
Keywords Erythropoiesis � Hyperoxemia �Individual variation � Diurnal variation
Introduction
The hematopoietic hormone erythropoietin (EPO) is
mainly produced by the kidney interstitial fibroblasts
(Paliege et al. 2010) in response to reduced O2 tissue
availability (cf. Eckardt and Kurtz 2005; Jelkmann 2007).
This hypoxia-induced EPO production is well established
(Erslev 1997; Faura et al. 1969; Ge et al. 2002; Mackenzie
et al. 2008). Eckardt et al. (1989) have also shown that the
EPO response has a dose-dependent nature, since single
exposures to simulated altitudes corresponding to 3,000
and 4,000 m above sea level for 5.5 h caused transient
increases in EPO levels equivalent to 1.8 and 3.0-fold,
respectively.
While it is well accepted that absolute tissue hypoxia
(i.e., decreased PO2) induces EPO production, recently,
Balestra et al. (2004, 2006) reported that EPO production is
markedly enhanced following a return from a short-term
Communicated by Guido Ferretti.
T. Debevec (&) � M. E. Keramidas � I. B. Mekjavic
Department of Automation, Biocybernetics and Robotics,
Jozef Stefan Institute, Jamova 39, 1000 Ljubljana, Slovenia
e-mail: [email protected]
T. Debevec � M. E. Keramidas
Jozef Stefan International Postgraduate School,
Ljubljana, Slovenia
B. Norman � T. Gustafsson
Division of Clinical Physiology, Department of Laboratory
Medicine, Karolinska Institute, Stockholm, Sweden
O. Eiken
Department of Environmental Physiology, School of Technology
and Health, Royal Institute of Technology, Stockholm, Sweden
123
Eur J Appl Physiol
DOI 10.1007/s00421-011-2060-7
Author's personal copy
hyperoxic exposure to normoxia. Namely, they observed an
increase in serum EPO levels 24 and 36 h after a 2-h period
of breathing 100% O2. The transition from normobaric
hyperoxia to normoxia induced a similar response as would
normally be observed during the transition from normoxia
to hypoxia. Thus, they termed this phenomenon the ‘‘nor-
mobaric O2 paradox’’ (NOP), since it paradoxically
appears to be independent of absolute tissue hypoxia
(Balestra et al. 2006).
Although intriguing, the existence of the NOP is still
questionable. In particular, subsequent studies either did
not find augmented EPO production following an acute
normobaric hyperoxic exposure (McGuire et al. 2006;
Momeni et al. 2011) or have even shown a suppressive
effect on EPO production (Keramidas et al. 2011). This is
in line with the results of previous studies showing the
suppression of erythropoietic activity following normo-
baric hyperoxia in humans (Kokot et al. 1994a, b).
To further elucidate the importance of relative changes
in oxygenation on EPO production and to evaluate the
NOP theory, the present study investigated the effect of
consecutive hyperoxic and hypoxic breathing on EPO
production. Based on the assumption that the EPO syn-
thesis is a function of the relative change in, rather than the
absolute level of PO2 (Hofso et al. 2005), we hypothesized
that a greater drop in PO2 (DPO2) would provide a stimulus
for EPO synthesis. We therefore monitored plasma EPO
levels following a relative change in PO2 from hyperoxia
(PO2 = 950 hPa) to hypoxia (PO2 = 140 hPa), reasoning
that a DPO2 = 810 hPa should provide a similar or even
greater plasma EPO concentration than that observed by
Balestra and colleagues, who exposed their subjects to a
drop in PO2 of 765 hPa.
Materials and methods
Subject characteristics
Eighteen active healthy male subjects participated in the
study. All subjects were local residents (altitude = 300 m
above sea level) and were not exposed to altitudes above
2,000 meters within 5 weeks preceding the experiment.
Exclusion criteria were as follows: a history of anemia or
bone marrow dysfunctions (Westenbrink et al. 2010), renal
disease (Patel and Singh 2010), and habitual or occasional
smoking (Tanabe et al. 1997). Subjects were given a
detailed verbal presentation of the protocol and signed their
informed consent to participate in the study. They were
then randomly assigned to either the control (CON, n = 8)
or intermittent hyperoxic/hypoxic (IHH, n = 10) group
(Table 1). The subjects were specifically instructed to
refrain from any heavy physical activity 2 days before and
throughout the experimental period. The study protocol
was approved by the National Committee for Medical
Ethics of the Republic of Slovenia and was conducted
according to the guidelines of the Helsinki Declaration.
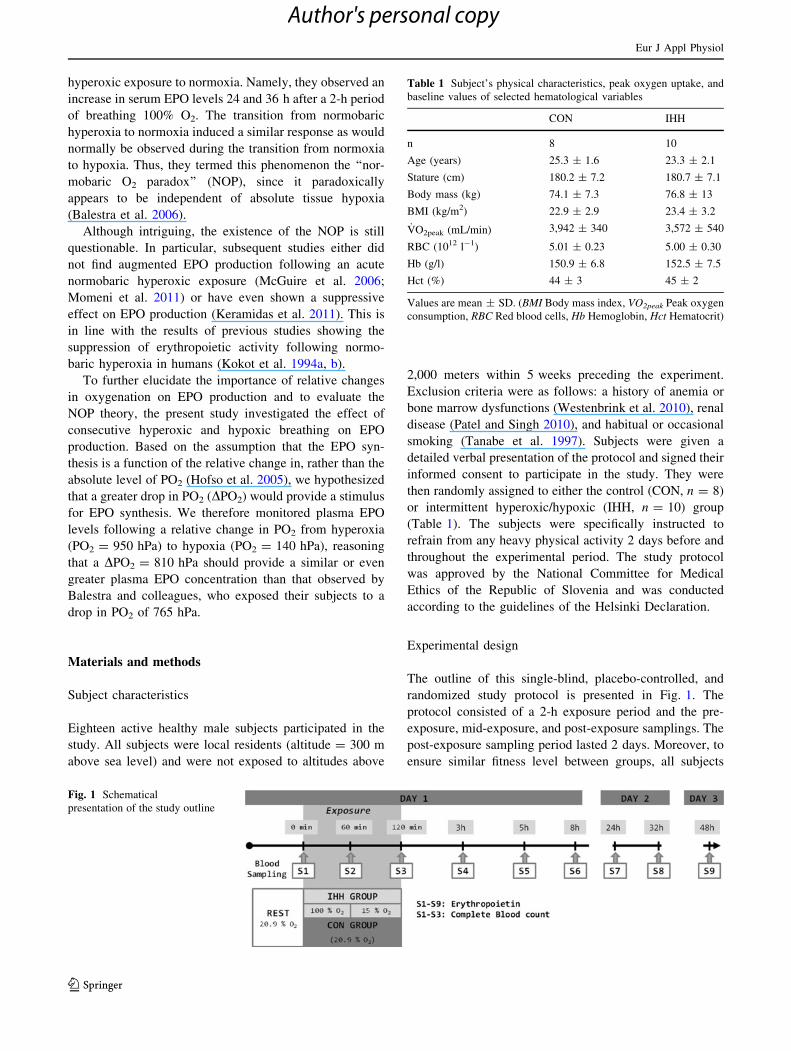
Experimental design
The outline of this single-blind, placebo-controlled, and
randomized study protocol is presented in Fig. 1. The
protocol consisted of a 2-h exposure period and the pre-
exposure, mid-exposure, and post-exposure samplings. The
post-exposure sampling period lasted 2 days. Moreover, to
ensure similar fitness level between groups, all subjects
Table 1 Subject’s physical characteristics, peak oxygen uptake, and
baseline values of selected hematological variables
CON IHH
n 8 10
Age (years) 25.3 ± 1.6 23.3 ± 2.1
Stature (cm) 180.2 ± 7.2 180.7 ± 7.1
Body mass (kg) 74.1 ± 7.3 76.8 ± 13
BMI (kg/m2) 22.9 ± 2.9 23.4 ± 3.2
_VO2peak (mL/min) 3,942 ± 340 3,572 ± 540
RBC (1012 l-1) 5.01 ± 0.23 5.00 ± 0.30
Hb (g/l) 150.9 ± 6.8 152.5 ± 7.5
Hct (%) 44 ± 3 45 ± 2
Values are mean ± SD. (BMI Body mass index, VO2peak Peak oxygen
consumption, RBC Red blood cells, Hb Hemoglobin, Hct Hematocrit)
Fig. 1 Schematical
presentation of the study outline
Eur J Appl Physiol
123
Author's personal copy

performed an incremental exercise test to exhaustion on a
cycle-ergometer (Daum electronics, Furth, Germany) to
determine the peak oxygen consumption ( _VO2peak) on a
separate day, prior to the exposures.
_VO2peak testing
The _VO2peak testing protocol comprised a 5-min resting
period, followed by a 2-min warm-up at 60 W. Thereafter,
the workload was increased each minute (25 W min-1)
until exhaustion. Inability to maintain the pedaling cadence
above 60 rpm, plateau in the oxygen consumption ( _VO2)
and/or a respiratory exchange ratio [1.1 were the criteria
used, to confirm the attainment of the _VO2peak (calculated
as the highest _VO2 averaged over 60 s during the test)._VO2 was measured breath-by-breath with a Quark CPET
metabolic cart (Cosmed, Rome, Italy).
Exposures
Both groups (CON and IHH) followed exactly the same time
schedule on exposure days. They were instructed to eat a
standardized breakfast consisting of bread, honey, and juice,
at least 1.5 h before their arrival. Each subject reported to the
laboratory during the morning hours (7:30–8:00 a.m.). After
being instrumented, subjects were placed in supine position
on a gurney and remained in the same position for the entire
120-min exposure period. The laboratory environmental
conditions [temperature = 21.9 ± 0.8�C; relative humid-
ity = 42 ± 1% and pressure = 978 ± 6.5 hPa] were
maintained stable throughout the experiments. Following a
15-min resting period, subjects breathed the assigned nor-
mobaric gas mixture via an oronasal mask (7920 AL, Hans
Rudolph Inc., Shawnee, USA) with a low resistance
two-way valve (2700 NRBV, Hans Rudolph Inc., Shawnee,
USA) from a 200-L Douglas bag. Hyperoxic and hypoxic
breathing mixtures were decompressed from cylinders,
humidified and accumulated in the Douglas bag. Two
Douglas bags were used for the IHH group, one bag for each
breathing mixture (i.e., hyperoxic and hypoxic). The
normoxic breathing mixture (air) was also humidified and
collected in the Douglas bag. The CON group breathed air
(PO2 = 197 hPa) for 120 min, while the IHH group
breathed the hyperoxic gas mixture (PO2 = 950 hPa) for
60 min followed by a 60-min period of breathing the hyp-
oxic gas mixture (PO2 = 140 hPa). Capillary oxyhemo-
globin saturation (SpO2) (Nellcor, BCI 3301, Boulder, USA)
and heart rate (HR) (Polar S810i, Kempele, Finland) were
continuously measured during the protocol. Subjects also
reported their ratings of perceived exertion for dyspnea
(RPEdys) on a modified Borg scale (scale 0–10).
Blood sampling and analyses
Blood samples were taken just before (S1), after 60 min of
exposure (S2), and immediately after the 120-min exposure
period (S3). Thereafter, the samples were taken at 3, 5, 8,
24, 32, and 48 h after the exposure (S4–S9). All samples
were drawn from the antecubital vein of the subjects’ left
arm. During each visit and prior to obtaining the sample,
subjects continuously rested in the supine position for at
least 15 min. The total quantity of blood taken during the
whole protocol did not exceed 30 ml. Blood samples were
immediately stored in BD Vacutainers (K2E, Becton–
Dickinson, New Jersey, USA) and centrifuged (10 min at
3,000 rpm). The obtained plasma was instantly frozen to
-80�C and stored for further analysis. The [EPO] was
determined in 100 ll of plasma using sandwich enzyme-
linked immunoassay (Quantikine IVD EPO ELISA, R&D
Systems, Minneapolis, USA). The quantification of the
optical density was performed on a microplate reader
Quant (Bio-Tek instruments, Winooski, USA) set at
450 nm and corrected at 600 nm. All samples were assayed
in duplicate, whereas only one microplate was used for
each subject’s samples in order to avoid the possible var-
iability between the plates. All techniques were performed
according to the manufacturer’s instructions. The sensi-
tivity of the analysis was 0.6 mU ml-1, whereas the esti-
mated coefficient of variation (CV) was 2.9%.
At first three samplings (S1–S3), additional blood
samples (500 ll) were taken to determine the complete
blood count (CBC). The samples were analyzed using an
automated laser-based hematology analyzer ADVIA 120
(Siemens, Munchen, Germany). The resulting CBC inclu-
ded red blood cells (RBC), hemoglobin concentration (Hb),
and hematocrit (Hct) with the estimated CV of 0.9, 0.7, and
1.3%, respectively.
Analysis
All data are presented as mean ± SD, unless otherwise
indicated. Anthropometric data and _VO2peak were com-
pared using a Students two-tailed t test for unequal sample
sizes. The [EPO] data were analyzed for normal distribu-
tion using a modified Kolmogorov–Smirnov test. One-way
ANOVA (time) was performed to analyze within group
changes in [EPO] and CBC. Differences between groups in
[EPO] were analyzed using a two-way unbalanced
ANOVA (group 9 time). The same analysis was per-
formed to analyze the changes in HR, SpO2, and RPEdys
during the exposure. When a main effect was observed, a
Tukey post hoc significance test was employed to identify
the specific differences between means. Pearson’s corre-
lation analysis was calculated for selected parameters. All
Eur J Appl Physiol
123
Author's personal copy
analyses were performed using Statistica 5.0 software
(StatSoft, Inc., Tulsa, USA). The alpha level of signifi-
cance was set a priori at 0.05.
Results
Subject characteristics
Subjects’ characteristics are presented in Table 1. There
were no significant differences between groups in anthro-
pometric characteristics, _VO2peak, or in any of the hema-
tological variables.
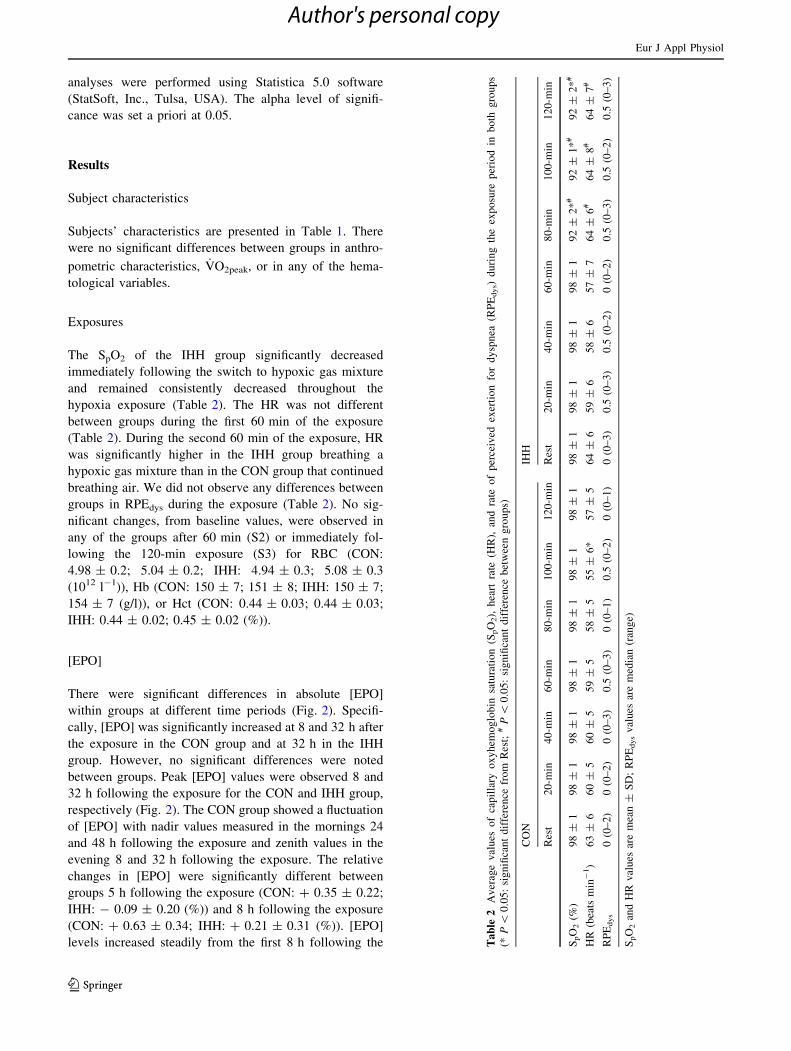
Exposures
The SpO2 of the IHH group significantly decreased
immediately following the switch to hypoxic gas mixture
and remained consistently decreased throughout the
hypoxia exposure (Table 2). The HR was not different
between groups during the first 60 min of the exposure
(Table 2). During the second 60 min of the exposure, HR
was significantly higher in the IHH group breathing a
hypoxic gas mixture than in the CON group that continued
breathing air. We did not observe any differences between
groups in RPEdys during the exposure (Table 2). No sig-
nificant changes, from baseline values, were observed in
any of the groups after 60 min (S2) or immediately fol-
lowing the 120-min exposure (S3) for RBC (CON:
4.98 ± 0.2; 5.04 ± 0.2; IHH: 4.94 ± 0.3; 5.08 ± 0.3
(1012 l-1)), Hb (CON: 150 ± 7; 151 ± 8; IHH: 150 ± 7;
154 ± 7 (g/l)), or Hct (CON: 0.44 ± 0.03; 0.44 ± 0.03;
IHH: 0.44 ± 0.02; 0.45 ± 0.02 (%)).
[EPO]
There were significant differences in absolute [EPO]
within groups at different time periods (Fig. 2). Specifi-
cally, [EPO] was significantly increased at 8 and 32 h after
the exposure in the CON group and at 32 h in the IHH
group. However, no significant differences were noted
between groups. Peak [EPO] values were observed 8 and
32 h following the exposure for the CON and IHH group,
respectively (Fig. 2). The CON group showed a fluctuation
of [EPO] with nadir values measured in the mornings 24
and 48 h following the exposure and zenith values in the
evening 8 and 32 h following the exposure. The relative
changes in [EPO] were significantly different between
groups 5 h following the exposure (CON: ? 0.35 ± 0.22;
IHH: - 0.09 ± 0.20 (%)) and 8 h following the exposure
(CON: ? 0.63 ± 0.34; IHH: ? 0.21 ± 0.31 (%)). [EPO]
levels increased steadily from the first 8 h following the Ta
ble
2A
ver
age
val
ues
of
cap
illa
ryo
xy
hem
og
lob
insa
tura
tio
n(S
pO
2),
hea
rtra
te(H
R),
and
rate
of
per
ceiv
edex
erti
on
for
dy
spn
ea(R
PE
dys)
du
rin
gth
eex
po
sure
per
iod
inb
oth
gro
up
s
(*P
\0
.05
:si
gn
ifica
nt
dif
fere
nce
fro
mR
est;
#P
\0
.05
:si
gn
ifica
nt
dif
fere
nce
bet
wee
ng
rou
ps)
CO
NIH
H
Res
t2
0-m
in4
0-m
in6
0-m
in8
0-m
in1
00
-min
12
0-m
inR
est
20
-min
40
-min
60
-min
80
-min
10
0-m
in1
20
-min
SpO
2(%
)9
8±
19
8±
19
8±
19
8±
19
8±
19
8±
19
8±
19
8±
19
8±
19
8±
19
8±
19
2±
2*
#9
2±
1*
#9
2±
2*
#
HR
(bea
tsm
in-
1)
63
±6
60
±5
60
±5
59
±5
58
±5
55
±6
*5
7±
56
4±
65
9±
65
8±
65
7±
76
4±
6#
64
±8
#6
4±
7#
RP
Edys
0(0
–2
)0
(0–
2)
0(0
–3
)0
.5(0
–3
)0
(0–
1)
0.5
(0–
2)
0(0
–1
)0
(0–
3)
0.5
(0–
3)
0.5
(0–
2)
0(0
–2
)0
.5(0
–3
)0
.5(0
–2
)0
.5(0
–3
)
SpO
2an
dH
Rv
alu
esar
em
ean
±S
D;
RP
Edys
val
ues
are
med
ian
(ran
ge)
Eur J Appl Physiol
123
Author's personal copy

exposure in the CON group. In the IHH group, following
an initial, albeit non-significant decrement (3 and 5 h),
[EPO] began to increase 8 h following the exposure and
resumed a similar pattern thereafter, as observed in the
CON group. A substantial individual variability in [EPO]
response was observed in both groups. The individual
changes in absolute [EPO] levels during all testing periods
ranged from 35 to 225% for the CON subjects and from 33
to 165% for the subjects in the IHH group. These different
responses of [EPO] were not related to either _VO2peak or
baseline Hb and Hct values, with correlation coefficients
(r) of 0.22, 0.13, and 0.24, respectively.
Discussion
Our findings demonstrate that, contrary to the suggestions
of Balestra et al. (2004, 2006), relative hypoxia induced by
a combination of short-term hyperoxia followed by hyp-
oxic gas breathing does not augment EPO de novo pro-
duction. Compared to the placebo, the IHH protocol
induced a transient reduction in [EPO] within the initial 8 h
following the IHH protocol. Our results thus present further
evidence against the existence of NOP and concur with the
findings of Keramidas et al. (2011), McGuire et al. (2006),
and Momeni et al. (2011).
Hypoxic/hyperoxic stimulus
Absolute renal tissue hypoxia, i.e., decreased renal tissue
O2 partial pressure (PO2) has been well documented as the
main trigger of EPO de novo synthesis in humans (Ge et al.
2002; Knaupp et al. 1992; Samaja 2001). Increased [EPO]
intensifies the red bone marrow progenitor cells activity in
red blood-cell production and can subsequently lead to
augmented hematocrit and total hemoglobin mass (Levine
and Stray-Gundersen 1997; Stray-Gundersen et al. 2001).
While short periods (90–120 min) of hypoxic exposure
have been shown to augment endogenous EPO production
(Mackenzie et al. 2008; Rodriguez et al. 2000), a distinct
dose-related response has also been observed. In particular,
Eckardt et al. (1989) observed a dose-dependent response
in EPO release with DPO2 stimuli of 62 and 80 hPa,
resulting from exposures to simulated altitudes, corre-
sponding to 3,000 and 4,000 m, respectively.
Considering the purported importance of the relative
oxygenation changes (Balestra et al. 2006), it is surprising
that DPO2 = 810 hPa, as experienced by the subjects in
the IHH group, did not yield an increase in EPO levels.
Especially, since the simulated altitude (*3,000 m) was
above 2,500 m, a speculated threshold altitude for a sus-
tained, short-term augmentation of EPO production (Ge
et al. 2002; Levine 2002). While the latter could be
explained by the relatively short hypoxic exposure period
(60 min), the effects of the relative PO2 on EPO are more
intriguing. Assuming that the relative decrease in PO2 can
enhance EPO production, as proposed by Balestra et al.
(2004, 2006), one would expect to find augmentation of
EPO production following immediate transition from
hyperoxia to normoxia. On the contrary, the [EPO]
response of the IHH group, compared with that of the CON
group, demonstrated a transient suppression of EPO pro-
duction during the first 8 h following the exposure. Our
data obviously negate the ability of the relative changes in
PO2 induced by breathing pure O2 to enhance EPO pro-
duction. On the other hand, our data support the already
reported suppressive effect of the normobaric hyperoxia on
EPO release (Kokot et al. 1994a, b). This hyperoxic
Fig. 2 Plasma EPO
concentrations before, during,
and after the exposure in both
groups (#P \ 0.05; significant
differences from REST). Values
are mean ± SD
Eur J Appl Physiol
123
Author's personal copy

suppressive effect on EPO production was recently con-
firmed by (Keramidas et al. 2011), demonstrating that 2 h
of O2 breathing leads to a transient attenuation of plasma
EPO levels during the initial 8 h following the exposure.
The ‘‘normobaric O2 paradox’’ theory
The NOP theory (Balestra et al. 2004, 2006) suggests that
in addition to absolute renal tissue hypoxia, relative
changes in PO2 from hyperoxia to normoxia may also
induce EPO de novo synthesis. The importance of relative
decrements in PO2 on EPO synthesis is also supported by
the findings of Hofso et al. (2005). They found increased
plasma EPO in healthy subjects following a deep saturation
dive and speculated that the increased EPO concentration
was induced by the transition from a hyperoxic to a
normoxic breathing mixture. Balestra et al. (2006) specu-
lated that the mechanism for NOP is based on changes in
the equilibrium of different glutathione forms (GSSG &
GSH) and reasoned that an increased cellular concentration
of GSH following hyperoxia can enhance expression of the
main hypoxia-inducible factors. Exposure to hypoxia,
subsequent to a hyperoxic period, as employed in our study
would, according to such theory, further increase the GSH
concentration, since hypoxia has been shown to stimulate
GSSG reduction in GSH (Haddad et al. 2000). Thus,
despite the plausible mechanism proposed for NOP, our
findings do not support this purported paradoxical effect.
Although the absence of direct measurements of arterial O2
pressure is a limitation of the present study, SpO2 showed a
prompt decline in response to the onset of hypoxic gas
breathing following hyperoxia. This acute transition in
tissue oxygenation during the IHH protocol did not trigger
EPO synthesis. Thus, the evidence in support of the NOP
theory remains, at best, equivocal.
Individual variability in the rate of EPO synthesis
Our results, demonstrating substantial subject variability in
the nature and magnitude of the EPO response, concur with
the findings of previous studies (Chapman et al. 1998; Ge
et al. 2002; Savourey et al. 2004). In particular, within the
first 5 h (S5) following the protocol, seven subjects in the
CON and only two subjects in the IHH group exhibited
higher values in EPO compared with that observed prior to
the exposure (S1). The range of subject variability was
similar in both groups and was not related to differences
either in _VO2peak or in any of the baseline hematological
variables. Individual variability in EPO synthesis is likely
dependent on factors regulating the EPO responses (Ou
et al. 1998).
Circadian variation
Although some significant changes were observed within
groups, these are probably attributable to the natural circa-
dian EPO fluctuations (Klausen et al. 1993). The studies
investigating the existence of circadian fluctuations of
[EPO] have provided inconsistent findings and no final
conclusion can be made from available data (cf. Gunga et al.
2007). Some studies have shown a distinct daily variation in
EPO concentration in healthy male subjects (Klausen et al.
1993), while others have shown no such variation (Roberts
and Smith 1996). The results of our study support the notion
that significant changes in EPO levels do in fact occur
during the course of the day. In particular, zenith and nadir
values of [EPO] were noted during the evening (S6 and S8)
and morning hours (S7 and S9), respectively.
Practical considerations
Even though the DPO2 stimulus as a consequence of the
IHH protocol did not induce increases in EPO production,
the potential of augmenting EPO synthesis using changes
in relative PO2 remains intriguing. The aim of inducing
significant erythropoiesis within a short time period is
certainly motivated by clinical and field applications. In
particular, the improved efficiency of the hypoxic protocols
would prove beneficial for endurance athletes, providing
them with competitive advantage (Saunders et al. 2009). In
clinical settings, normobaric O2 breathing is already being
promoted in the treatment of anemia (Burk 2007), and as
an adjunct therapy for cancer patients (De Bels et al. 2011).
Although commendable, our results, and the findings of
other studies investigating NOP, suggest that the use of
NOP for both athletic and clinical application is not war-
ranted. Thus, any recommendations regarding normobaric
O2 breathing as a new training or clinical treatment strategy
are currently premature.
Acknowledgments The authors wish to thank the dedicated par-
ticipants. Our thanks are also extended to Dr. Alenka Nemec-Svete
and Miro Vrhovec for their technical support. This study was foun-
ded, in part, by grants from the Slovene Research Agency (grant no.
L7-2413) and b-Cat (The Netherlands) to Igor B. Mekjavic and Ola
Eiken. Tadej Debevec and Michail E. Keramidas are recipients of
Young Researcher Scholarships from the Slovene Research Agency
Conflict of interest No conflict of interest is declared.
References
Balestra C, Germonpre P, Poortmans J, Marroni A, Schiettecatte J,
Collard JF, Snoeck T (2004) Erythropoietin production can be
enhanced by normobaric oxygen breathing in healthy humans.
Undersea Hyperb Med 31:53–57
Eur J Appl Physiol
123
Author's personal copy

Balestra C, Germonpre P, Poortmans JR, Marroni A (2006) Serum
erythropoietin levels in healthy humans after a short period of
normobaric and hyperbaric oxygen breathing: the ‘‘normobaric
oxygen paradox. J Appl Physiol 100:512–518
Burk R (2007) Oxygen breathing may be a cheaper and safer
alternative to exogenous erythropoietin (EPO). Med Hypotheses
69:1200–1204
Chapman RF, Stray-Gundersen J, Levine BD (1998) Individual
variation in response to altitude training. J Appl Physiol 85:
1448–1456
De Bels D, Corazza F, Germonpre P, Balestra C (2011) The normobaric
oxygen paradox: a novel way to administer oxygen as an adjuvant
treatment for cancer? Med Hypotheses 76:467–470
Eckardt KU, Kurtz A (2005) Regulation of erythropoietin production.
Eur J Clin Invest 35(Suppl 3):13–19
Eckardt KU, Boutellier U, Kurtz A, Schopen M, Koller EA, Bauer C
(1989) Rate of erythropoietin formation in humans in response to
acute hypobaric hypoxia. J Appl Physiol 66:1785–1788
Erslev AJ (1997) Clinical erythrokinetics: a critical review. Blood
Rev 11:160–167
Faura J, Ramos J, Reynafarje C, English E, Finne P, Finch CA (1969)
Effect of altitude on erythropoiesis. Blood 33:668–676
Ge RL, Witkowski S, Zhang Y, Alfrey C, Sivieri M, Karlsen T,
Resaland GK, Harber M, Stray-Gundersen J, Levine BD (2002)
Determinants of erythropoietin release in response to short-term
hypobaric hypoxia. J Appl Physiol 92:2361–2367
Gunga HC, Kirsch KA, Roecker L, Kohlberg E, Tiedemann J,
Steinach M, Schobersberger W (2007) Erythropoietin regula-
tions in humans under different environmental and experimental
conditions. Respir Physiol Neurobiol 158:287–297
Haddad JJ, Olver RE, Land SC (2000) Antioxidant/pro-oxidant
equilibrium regulates HIF-1alpha and NF-kappa B redox sensi-
tivity. Evidence for inhibition by glutathione oxidation in
alveolar epithelial cells. J Biol Chem 275:21130–21139
Hofso D, Ulvik RJ, Segadal K, Hope A, Thorsen E (2005) Changes in
erythropoietin and haemoglobin concentrations in response to
saturation diving. Eur J Appl Physiol 95:191–196
Jelkmann W (2007) Erythropoietin after a century of research:
younger than ever. Eur J Haematol 78:183–205
Keramidas ME, Kounalakis SN, Debevec T, Norman B, Gustafsson
T, Eiken O, Mekjavic IB (2011) Acute normobaric hyperoxia
transiently attenuates plasma erythropoietin concentration in
healthy males: evidence against the ‘normobaric oxygen para-
dox’ theory. Acta Physiol (Oxf) 202:91–98
Klausen T, Dela F, Hippe E, Galbo H (1993) Diurnal variations of
serum erythropoietin in trained and untrained subjects. Eur J
Appl Physiol Occup Physiol 67:545–548
Knaupp W, Khilnani S, Sherwood J, Scharf S, Steinberg H (1992)
Erythropoietin response to acute normobaric hypoxia in humans.
J Appl Physiol 73:837–840
Kokot F, Franek E, Kokot M, Wiecek A (1994a) Erythropoietin
secretion in patients with chronic renal failure after pure oxygen
breathing. Nephron 67:436–440
Kokot M, Kokot F, Franek E, Wiecek A, Nowicki M, Dulawa J
(1994b) Effect of isobaric hyperoxemia on erythropoietin
secretion in hypertensive patients. Hypertension 24:486–490
Levine BD (2002) Intermittent hypoxic training: fact and fancy. High
Alt Med Biol 3:177–193
Levine BD, Stray-Gundersen J (1997) Living high-training low:
effect of moderate-altitude acclimatization with low-altitude
training on performance. J Appl Physiol 83:102–112
Mackenzie RW, Watt PW, Maxwell NS (2008) Acute normobaric
hypoxia stimulates erythropoietin release. High Alt Med Biol
9:28–37
McGuire A, Querido J, Fedoruk M, Wang P, Rupert J, McKenzie D
(2006) Plasma erythropoietin concentration following normo-
baric hyperoxia. Appl Physiol Nutr Metab 31:S58
Momeni M, De Kock M, Devuyst O, Liistro G (2011) Effect of
N-acetyl-cysteine and hyperoxia on erythropoietin production.
Eur J Appl Physiol doi:10.1007/s00421-011-1893-4
Ou LC, Salceda S, Schuster SJ, Dunnack LM, Brink-Johnsen T, Chen
J, Leiter JC (1998) Polycythemic responses to hypoxia: molec-
ular and genetic mechanisms of chronic mountain sickness.
J Appl Physiol 84:1242–1251
Paliege A, Rosenberger C, Bondke A, Sciesielski L, Shina A, Heyman
SN, Flippin LA, Arend M, Klaus SJ, Bachmann S (2010)
Hypoxia-inducible factor-2alpha-expressing interstitial fibro-
blasts are the only renal cells that express erythropoietin under
hypoxia-inducible factor stabilization. Kidney Int 77:312–318
Patel TV, Singh AK (2010) Anemia in chronic kidney disease: new
advances. Heart Fail Clin 6:347–357
Roberts D, Smith DJ (1996) Erythropoietin does not demonstrate
circadian rhythm in healthy men. J Appl Physiol 80:847–851
Rodriguez FA, Ventura JL, Casas M, Casas H, Pages T, Rama R,
Ricart A, Palacios L, Viscor G (2000) Erythropoietin acute
reaction and haematological adaptations to short, intermittent
hypobaric hypoxia. Eur J Appl Physiol 82:170–177
Samaja M (2001) Hypoxia-dependent protein expression: erythropoi-
etin. High Alt Med Biol 2:155–163
Saunders PU, Pyne DB, Gore CJ (2009) Endurance training at
altitude. High Alt Med Biol 10:135–148
Savourey G, Launay JC, Besnard Y, Guinet A, Bourrilhon C, Cabane
D, Martin S, Caravel JP, Pequignot JM, Cottet-Emard JM (2004)
Control of erythropoiesis after high altitude acclimatization. Eur
J Appl Physiol 93:47–56
Stray-Gundersen J, Chapman RF, Levine BD (2001) Living high-
training low altitude training improves sea level performance in
male and female elite runners. J Appl Physiol 91:1113–1120
Tanabe N, Ohnishi K, Fukui H, Ohno R (1997) Effect of smoking on
the serum concentration of erythropoietin and granulocyte-
colony stimulating factor. Intern Med 36:680–684
Westenbrink BD, Voors AA, de Boer RA, Schuringa JJ, Klinkenberg
T, van der Harst P, Vellenga E, van Veldhuisen DJ, van Gilst
WH (2010) Bone marrow dysfunction in chronic heart failure
patients. Eur J Heart Fail 12:676–684
Eur J Appl Physiol
123
Author's personal copy
Related Documents