Normal age-related brain morphometric changes: Nonuniformity across cortical thickness, surface area and grey matter volume? H Lemaitre 1 , AL Goldman 1 , F Sambataro, BA Verchinski, A Meyer-Lindenberg, DR Weinberger, and VS Mattay * Clinical Brain Disorder branch, Gene Cognition and Psychosis program, NIH/NIMH, Bethesda, MD 20892, USA Abstract Normal aging is accompanied by global as well as regional structural changes. While these age- related changes in grey matter volume have been extensively studied, less has been done using newer morphological indices such as cortical thickness and surface area. To this end, we analyzed structural images of 216 healthy volunteers, ranging from 18 to 87 years of age, using a surface- based automated parcellation approach. Linear regressions of age revealed a concomitant global age-related reduction in cortical thickness, surface area and volume. Cortical thickness and volume collectively confirmed the vulnerability of the prefrontal cortex, whereas in other cortical regions such as in the parietal cortex, thickness was the only measure sensitive to the pronounced age- related atrophy. No cortical regions showed more surface area reduction than the global average. The distinction between these morphological measures may provide valuable information to dissect age-related structural changes of the brain, with each of these indices probably reflecting specific histological changes occurring during aging. Keywords Aging; Magnetic resonance imaging; morphology; cortical thickness; cortical volume; cortical surface 1. Introduction Normal brain aging is characterized by an overall cerebral atrophy. This atrophy is associated with shrinkage of grey matter (GM) and white matter (WM) volumes and enlargement of the cerebrospinal fluid (CSF) spaces. As shown by postmortem studies, histological changes underlying these age-related macroscopic variations are more likely related to a loss of neuropil associated with a reduction of dendrites and synapses, and a loss of nerve fibers, rather than related to a direct loss of neurons which is relatively limited with age (Pakkenberg, et al., 2003, Peters, et al., 1998). In vivo studies using Magnetic Resonance Imaging (MRI) have consistently shown an age-related decrease in GM and WM volume * Corresponding Author: Venkata S. Mattay, MD, 10 Center Drive, MSC 1384, Room 3C220, Bethesda, MD 20892, USA, Tel: 301-435-4594, Fax: 301-480-7795, [email protected]. 1 Contributed equally to the manuscript Disclosure Statement: All subjects provided written informed consent, and participated according to the guidelines of the National Institute of Mental Health Institutional Review Board. None of the authors have any conflicts of interest. Publisher's Disclaimer: This is a PDF file of an unedited manuscript that has been accepted for publication. As a service to our customers we are providing this early version of the manuscript. The manuscript will undergo copyediting, typesetting, and review of the resulting proof before it is published in its final citable form. Please note that during the production process errors may be discovered which could affect the content, and all legal disclaimers that apply to the journal pertain. NIH Public Access Author Manuscript Neurobiol Aging. Author manuscript; available in PMC 2013 March 1. Published in final edited form as: Neurobiol Aging. 2012 March ; 33(3): 617.e1–617.e9. doi:10.1016/j.neurobiolaging.2010.07.013. NIH-PA Author Manuscript NIH-PA Author Manuscript NIH-PA Author Manuscript

Welcome message from author
This document is posted to help you gain knowledge. Please leave a comment to let me know what you think about it! Share it to your friends and learn new things together.
Transcript

Normal age-related brain morphometric changes: Nonuniformityacross cortical thickness, surface area and grey matter volume?
H Lemaitre1, AL Goldman1, F Sambataro, BA Verchinski, A Meyer-Lindenberg, DRWeinberger, and VS Mattay*
Clinical Brain Disorder branch, Gene Cognition and Psychosis program, NIH/NIMH, Bethesda,MD 20892, USA
AbstractNormal aging is accompanied by global as well as regional structural changes. While these age-related changes in grey matter volume have been extensively studied, less has been done usingnewer morphological indices such as cortical thickness and surface area. To this end, we analyzedstructural images of 216 healthy volunteers, ranging from 18 to 87 years of age, using a surface-based automated parcellation approach. Linear regressions of age revealed a concomitant globalage-related reduction in cortical thickness, surface area and volume. Cortical thickness and volumecollectively confirmed the vulnerability of the prefrontal cortex, whereas in other cortical regionssuch as in the parietal cortex, thickness was the only measure sensitive to the pronounced age-related atrophy. No cortical regions showed more surface area reduction than the global average.The distinction between these morphological measures may provide valuable information todissect age-related structural changes of the brain, with each of these indices probably reflectingspecific histological changes occurring during aging.
KeywordsAging; Magnetic resonance imaging; morphology; cortical thickness; cortical volume; corticalsurface
1. IntroductionNormal brain aging is characterized by an overall cerebral atrophy. This atrophy isassociated with shrinkage of grey matter (GM) and white matter (WM) volumes andenlargement of the cerebrospinal fluid (CSF) spaces. As shown by postmortem studies,histological changes underlying these age-related macroscopic variations are more likelyrelated to a loss of neuropil associated with a reduction of dendrites and synapses, and a lossof nerve fibers, rather than related to a direct loss of neurons which is relatively limited withage (Pakkenberg, et al., 2003, Peters, et al., 1998). In vivo studies using Magnetic ResonanceImaging (MRI) have consistently shown an age-related decrease in GM and WM volume
*Corresponding Author: Venkata S. Mattay, MD, 10 Center Drive, MSC 1384, Room 3C220, Bethesda, MD 20892, USA, Tel:301-435-4594, Fax: 301-480-7795, [email protected] equally to the manuscriptDisclosure Statement: All subjects provided written informed consent, and participated according to the guidelines of the NationalInstitute of Mental Health Institutional Review Board. None of the authors have any conflicts of interest.Publisher's Disclaimer: This is a PDF file of an unedited manuscript that has been accepted for publication. As a service to ourcustomers we are providing this early version of the manuscript. The manuscript will undergo copyediting, typesetting, and review ofthe resulting proof before it is published in its final citable form. Please note that during the production process errors may bediscovered which could affect the content, and all legal disclaimers that apply to the journal pertain.
NIH Public AccessAuthor ManuscriptNeurobiol Aging. Author manuscript; available in PMC 2013 March 1.
Published in final edited form as:Neurobiol Aging. 2012 March ; 33(3): 617.e1–617.e9. doi:10.1016/j.neurobiolaging.2010.07.013.
NIH
-PA Author Manuscript
NIH
-PA Author Manuscript
NIH
-PA Author Manuscript
concomitant with an increase in CSF volume (Courchesne, et al., 2000, Good, et al., 2001,Lemaitre, et al., 2005, Raz, et al., 1997, Smith, et al., 2007,K. B. Walhovd, et al., 2005).Studies looking at the effect of age using either manual drawing of regions of interest (ROI)(Allen, et al., 2005, Raz, et al., 2004, Raz, et al., 1997) or automated/semi-automatedmethods such as voxel-based morphometry (VBM) (Good, et al., 2001, Smith, et al., 2007,Tisserand, et al., 2002) have reported regionally variable vulnerability to aging across thewhole brain (Raz and Rodrigue, 2006, Kristine B. Walhovd, et al., 2005).
The literature related to regional heterogeneity in age-related changes in brain morphometrycan be grouped into two categories based on the regions involved. The first reflects thevulnerability of the prefrontal region to aging (Tisserand and Jolles, 2003). This region hasbeen shown to be one of the most affected with advancing age (Abe, et al., 2008, Allen, etal., 2005, Good, et al., 2001, Raz, et al., 1997, Tisserand, et al., 2002). Prefrontalvulnerability to aging is supported by evidence of pronounced age-related decline in severalcognitive processes such as speed of processing, working memory, cognitive controlincluding response inhibition and interference suppression all of which depend on theintegrity of the prefrontal cortex (Raz, et al., 1998, West, 1996). The second set of regionsrepeatedly implicated in normal aging includes the hippocampus and the medial temporallobe. Similar to the prefrontal cortex, numerous studies have found an age-related reductionin the volume of the hippocampal region (Bigler, et al., 2002, Du, et al., 2006,K. B.Walhovd, et al., 2005). The medial temporal lobe has received much attention as it isinvolved in both normal as well as pathological aging (Fox, et al., 2001, Killiany, et al.,2002). The growing interest of the affect of aging on this region is also due to its importantrole in episodic memory, which has been shown to decline with age (Verhaeghen, et al.,1993). Studies have also shown that atrophy of medial temporal structures predicts futurememory decline in healthy aging (Rodrigue and Raz, 2004, Rusinek, et al., 2003). Reliablecharacterization of the extent and rate of atrophy, therefore, is an important tool forunderstanding normal human aging and therapeutic interventions targeted at disordersassociated with accelerated atrophy, such as the dementias, making a study of themethodology used to quantify atrophy in humans in vivo important.
VBM is a classical quantitative method based purely on a volumetric representation of thebrain. The local amount of tissue is simply measured as the intensity within each voxel andcan be influenced by local cortical folding as well as local cortical thickness. Computationaladvances in surface reconstruction of inner and outer cortical boundaries have allowed thedevelopment of surface-based morphometry (SBM) methods which provide more specificmorphological measures such as cortical thickness, surface area of the cortical mantle andcortical volume by product of these two first measurements (Dale, et al., 1999, Fischl andDale, 2000, Fischl, et al., 1999). SBM has been shown to be more sensitive to age-relateddecline than VBM which within the cortex provides a local measure of grey matterdependent on both cortical folding and thickness (Hutton, et al., 2009). The SBM approachmay lead to better understanding of global and regional structural changes in the brainassociated with normal aging. Sorting out the different cortical features given by SBM onthe entorhinal and the posterior parahippocampal cortices, Dickerson et al. (2009) reportedthat while volume reduction was seen in both normal aging and Alzheimer’s disease (AD),surface and thickness reductions were exclusively associated with normal aging and ADrespectively. Thus, it appears that exploring age-related changes in thickness and surfacearea, the two components of volume, independently may be more informative. In a wholebrain study of cortical thickness, Salat et al. (2004) reported marked age-related reductionsin prefrontal cortex thickness and relative conservation of temporal and parahippocampalcortical thickness. They also reported thinning of the precentral and calcarine cortices. Theseresults have since been replicated by other groups measuring cortical thickness (Fjell, et al.,2009, Ziegler, et al., 2008).
Lemaitre et al. Page 2
Neurobiol Aging. Author manuscript; available in PMC 2013 March 1.
NIH
-PA Author Manuscript
NIH
-PA Author Manuscript
NIH
-PA Author Manuscript

To date, no study has directly assessed over the whole brain the effect of age on the differentcortical measurements provided by a surface-based reconstruction approach. In the presentstudy, we proposed to examine age-related cortical thickness, surface area, and cortical greymatter volume changes across all cortical regions in a sample of 216 healthy volunteersranging from age 18 to 87 years.
2. Methods2.1 Participants
Two hundred sixteen healthy volunteers were included in this study with ages ranging from18 to 87 years (mean age = 39.86 ± 16.51 years; 119 women; education level = 16.85 ± 2.73years). Subjects were recruited nationwide as part of an ongoing study at the NationalInstitute of Mental Health, Bethesda, MD, which included a neurological exam andStructured Clinical Interview for the DSM-IV (SCID) (First, et al., 1995). Exclusion criteriaincluded a current or past history of neurological or psychiatric disorders, hypertension ordrug abuse. All subjects provided written informed consent, and participated according tothe guidelines of the National Institute of Mental Health Institutional Review Board.
2.2 Imaging and PreprocessingMRI acquisition—Three-dimensional structural MRI scans were acquired on a 1.5T GEscanner using a T1-weighted SPGR sequence (TR/TE/NEX 24/5/1, flip angle 45º, matrixsize 256 × 256, FOV 24 × 24 cm), with 124 sagittal slices (0.94 × 0.94 × 1.5 mmresolution). Images were reconstructed and visually checked for major artifacts (e.g. motion,ringing, wrap around and neurological abnormalities) before further processing.
MRI preprocessing—Images were processed using FreeSurfer version 4.0.1 (Dale, et al.,1999, Fischl, et al., 1999), which produced surface-based data for each subject. MRI datawere re-sampled to a 3D coronal image with 1mm isotropic voxel size, followed by a seriesof preprocessing steps previously described (Dale, et al., 1999). Briefly, images were firstcorrected for intensity nonuniformity using N3 (Sled, et al., 1998) and registered via affinetransformation (12 parameters) to Montreal Neurological Institute (MNI) space (Collins, etal., 1994). Then, images underwent a further intensity normalization using a differentautomated algorithm and were automatically skull stripped (Dale, et al., 1999).
At this juncture, images were visually inspected and data from 71 subjects were deemed torequire manual correction which included manually realigning each subject’s image to theMNI template, setting intensity normalization control points where brain matter waserroneously skull stripped, and adjusting watershed parameters of the skull strip. Using afully-automated method (Fischl, et al., 2002, Fischl, et al., 2004), images were segmentedinto different cerebral compartments and regions of interest, some of which were used to aidsurface reconstruction.
Cortical surfaces were then reconstructed using a validated algorithm (Dale, et al., 1999,Fischl, et al., 2001, Fischl, et al., 1999, Segonne, et al., 2005). Briefly, binary white mattermasks were generated using information from the automated segmentation and corrected inareas that commonly produce topological defects (particularly basal ganglia and lateralventricles). The interhemispheric cutting plane was used to isolate the two hemispheres andto produce their corresponding binary white matter masks (Dale, et al., 1999). A triangle-based mesh of the white matter surface was then produced, and smoothed to alleviate thevoxel-based nature of the initial curvature (Dale, et al., 1999). After automated correction oftopological defects (Fischl, et al., 2001, Segonne, et al., 2005), a deformation algorithm wasused to produce final white matter and pial surfaces (Fischl, et al., 1999). Finally, each
Lemaitre et al. Page 3
Neurobiol Aging. Author manuscript; available in PMC 2013 March 1.
NIH
-PA Author Manuscript
NIH
-PA Author Manuscript
NIH
-PA Author Manuscript

surface was spherically inflated and automatically registered to a canonical sphericaltemplate using cortical features (Fischl, et al., 1999). An automated algorithm thenparcellated the surface into 33 gyrally-based regions of interest (as well as two non-corticalregions, “corpus callosum” and “unknown, ” that we did not analyze) based on a corticalatlas, spatial relationship between regions, and knowledge of curvatures and sulcal depths(Desikan, et al., 2006, Fischl, et al., 2004). Mean thickness, cortical volume, and surfacearea were then extracted for each brain region from each individual subject’s brain image inits native space.
2.3 Statistical AnalysisAge effect on all data was analyzed in SPSS 15.0 using the General Linear Model. First,total cortical volume, total surface area and global average thickness for the whole brainwere derived by combining all cortical regions previously identified. Then, looking at eachcortical region independently, we explored the regional distribution of age-related changeson surface area, cortical volume, and average thickness. Since some regions covered a largerportion of the brain than others, we standardized the age-related changes in surface area andvolume by reporting them as a percentage of the regions’ mean surface area and volumerespectively (% of region per year). This was not an equivalent concern for age-relatedchanges in thickness, which was independent of the regions’ size and kept on a scale of mmreduction per year. Finally, since we expected all three global morphometric measures toshow nearly universal reductions with age, we scaled the regional values by their total brainvalues. In this way, we were not only considering regions for which age-related changesexceeded the global variations but we were also adjusting for head size difference acrosssubjects. For all analyses, age was entered as covariate of interest and gender and years ofeducation as confounding variables. Due to the large number of regions examined, resultswithin each regional measure were corrected for multiple comparisons using a FalseDiscovery Rate (FDR) threshold of 0.05.
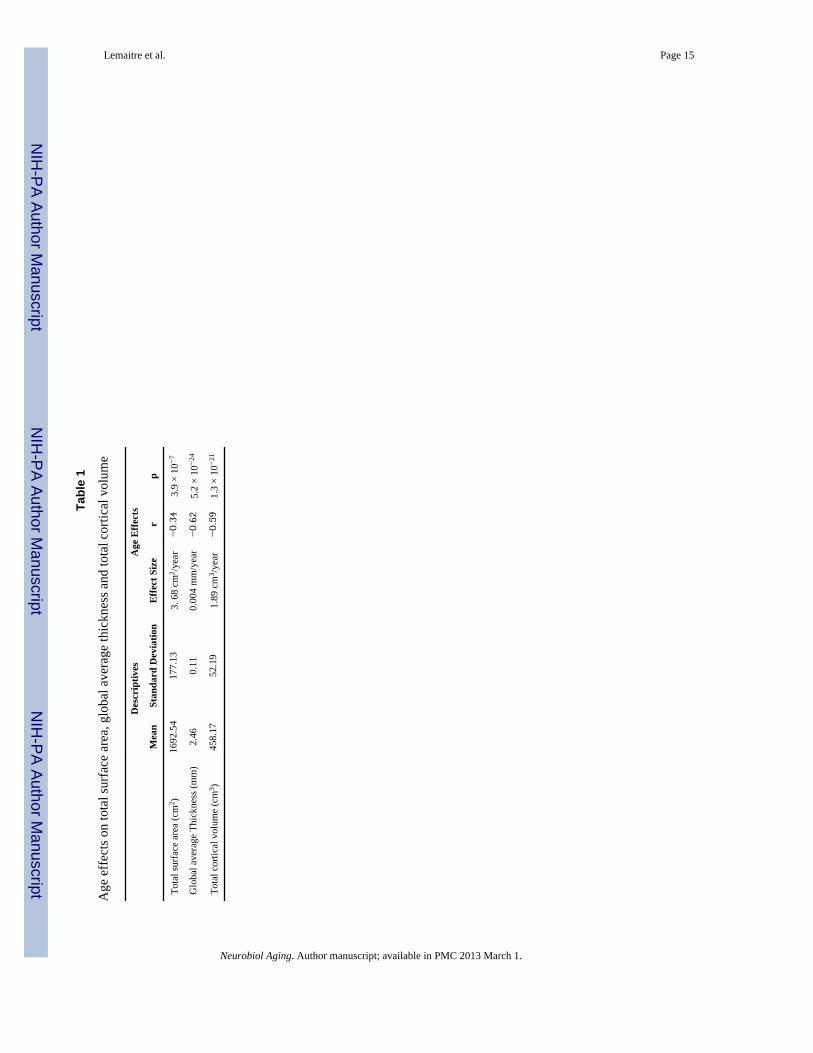
3. ResultsThe average total cortical volume was 458±52 cm3 (See Table). The average total surfaceand thickness for the whole cortex were 1692±117 cm2 and 2.46±0.11 mm respectively.Linear regressions revealed significant age-related reductions (p < 0.001) in total corticalgrey matter volume (r = −0.59), total surface area (r = −0.34), and average cortical thickness(r = −0.62). These effects represented global reductions of 1.89 cm3 per year in total corticalgrey matter volume, 3.68 cm2 per year in total surface area, and 0.004 mm per year in globalaverage thickness (see Table and Figure 1).
The regional counterpart of these global age-related changes is represented in Figure 2. Thecortical regions showing the greatest age-related volume reduction were the middle frontalgyrus, the superior frontal gyrus and the frontal pole (superior to −0.58 % of label’s volumeper year, p < 0.001 FDR). For the regional age-related changes in cortical thickness,predominant reductions were seen in the superior frontal gyrus, the paracentral gyrus and thepars opercularis and triangularis of the inferior frontal gyrus (superior to −0.0055 mm peryear, p < 0.001 FDR). The frontal pole, the middle frontal gyrus and the superior frontalgyrus showed the greatest age-related reduction in surface area (superior to −0.28 % oflabel’s surface per year, p < 0.001 FDR).
In addition, we looked at the pattern of cortical regions with more pronounced age effects ascompared to the global average; this is illustrated in Figure 3. Significantly greater-than-average reductions in volume were seen in the left middle frontal gyrus, the left frontal poleand the right temporal pole (blue regions in Figure 3). For thickness, more markedreductions than the global average reduction were identified in the left hemisphere in the
Lemaitre et al. Page 4
Neurobiol Aging. Author manuscript; available in PMC 2013 March 1.
NIH
-PA Author Manuscript
NIH
-PA Author Manuscript
NIH
-PA Author Manuscript
paracentral gyrus, the posterior cingulate gyrus, the precuneus, the precentral gyrus, and thepars opercularis of the inferior frontal gyrus, and in the right hemisphere in the paracentralgyrus, the inferior parietal gyrus and the inferior frontal gyrus (red regions in Figure 3).Regions showing more marked reductions in both volume and thickness were the left andright superior frontal gyri and the rostral part of the right middle frontal gyrus (green regionsin Figure 3). No cortical regions showed more surface area reduction than the globalaverage.
4. DiscussionAided by automated surface reconstruction (Dale, et al., 1999, Fischl, et al., 2001, Fischl, etal., 1999), the present study examined age-related structural changes upon several distinctmorphometric measures. Total and regional cortical thickness and surface area weremeasured in addition to cortical grey matter volume. Previously, the effects of aging onneuroanatomy have been extensively studied using volumetric techniques such as ROI(Jernigan, et al., 2001, Raz, et al., 1997,Kristine B. Walhovd, et al., 2005) and VBM analysis(Good, et al., 2001, Grieve, et al., 2005, Kalpouzos, et al., 2007), and more recently throughsurface-based measures such as thickness (Fjell, et al., 2006, Salat, et al., 2004), surface area(Dickerson, et al., 2009), and sulcal characteristics (Rettmann, et al., 2006). However,studies analyzing the effect of aging on these surface-based metrics remain scarce,especially for changes in surface area. In the current study, all three morphometric measuredcomponents presented a nearly-ubiquitous global reduction with age. Furthermore, theregional age-related changes for these three measures presented convergent patterns but alsonotable disparities, which are discussed below.
Starting with regions commonly highlighted by these three indicators, of all the brainregions the prefrontal cortex was by far the region that showed the most striking reduction inall three indicators. Particularly, the superior frontal and middle frontal gyri consistentlyshowed the greatest age-related reduction in volume, thickness and surface area. Whencompared to the global trend, the prefrontal cortex showed a significantly accelerateddecrease in volume and thickness with age (as illustrated in Figure 3). Our results are in linewith several reports of a preferential structural vulnerability of the prefrontal cortex (Good,et al., 2001,Raz, et al., 1997,Tisserand, et al., 2002). Thus, the current study supports thelongstanding “last in, first out” hypothesis otherwise known as the phylogenetic/ontogeneticmodel according to which the brain regions that are the last to mature or develop are the firstto be affected by aging (Raz, 2005). Thus, based on the Flechsig’s myelination precedence,the prefrontal cortex is one of the last regions to undergo complete maturation.
Related to disparities between indicators, cortical thickness changes compared to volumechanges showed a more diffuse range of marked age-related reduction. The corticalthickness reduction was observed in the inferior, middle and superior frontal gyri, as well asin the precentral, paracentral, precuneus, and posterior cingulate gyri. These results are notonly contradictory to the anterior-posterior gradient theory as posterior regions such as theprecuneus and inferior parietal gyrus also showed accelerated decline (Raz and Rodrigue,2006), but also to the “first in last out” theory as the precentral gyrus - a primary cortex withearly maturation – also showed pronounced age-related thinning. The age-related structuralchanges in the parietal region that we observed have been more consistently reported bycortical thickness studies (Fjell, et al., 2009, Salat, et al., 2004, Ziegler, et al., 2008) than byvolume-based studies such as VBM (Good, et al., 2001, Resnick, et al., 2003). Thus, corticalthickness might be a more sensitive indicator of morphological aging than volume forcortical regions presenting less pronounced age-related atrophy as within posterior brainareas. One possible explanation could be that the histological parameters involved in theage-related cortical changes affect more specifically cortical thickness than volume per se
Lemaitre et al. Page 5
Neurobiol Aging. Author manuscript; available in PMC 2013 March 1.
NIH
-PA Author Manuscript
NIH
-PA Author Manuscript
NIH
-PA Author Manuscript

which is a more comprehensive measure that integrates changes in cortical folding andthickness. Similarly, for the use of structural neuroimaging phenotypes in the field ofimaging genetics, Winkler et al. (2009) suggest that image processing methods that onlyprovide measurements of grey matter volume may be less sensitive for gene identificationthan those that allow measurement of differences in cortical thickness and/or surface area.With regard to the precentral gyrus, the relative accelerated thinning of this region with agemight be driven by sample characteristics. Prior studies that had a large number of subjectsover 60 years of age tended to include the primary cortices in their patterns of regionsprominently affected by age (Lemaitre, et al., 2005, Resnick, et al., 2003, Salat, et al., 2004,Ziegler, et al., 2008). This is in contrast to studies with a scarce representation of individualsafter the sixth decade (Fjell, et al., 2009, Good, et al., 2001, Sowell, et al., 2003). Based onthis, we could propose the hypothesis that primary cortices also decline with age but muchlater in life, and is therefore noticeable only if the period of time covered by the studyincludes the late ages. Additionally, the involvement of the precentral cortex subservingmotor functions could possibly explain the motor slowness observed with increasing age(Mattay, et al., 2002) even in the absence of peripheral sensory or motor changes (Kolev, etal., 2006). Morphometric studies that report on age-related changes in the primary corticesquite often find a concomitant age-related reduction in the sensorimotor and visual cortex(Lemaitre, et al., 2005, Salat, et al., 2004). In our study, we did not find a significant age-related reduction in volume, thickness or surface area of the occipital cortex. One couldbring up the same reasoning as described above for the premotor cortex in this case too.Though we included subjects over 60 years, they represent only 17 % of the sample and maybe not enough to detect significant late age reduction in grey matter of the visual cortex(Fjell, et al., 2009), given that reduction in this region appears to be not as strong as in in theprecentral region and thereby possibly more difficult to detect (Salat, et al., 2004).
With reference to the cortical regions that show relative preservation with aging, aninteresting result in our study is the relative sparing of the medial temporal lobe includingthe entorhinal and parahippocampal cortices. This result is consistent with the observationsof Salat et al. (2004) who examined cortical thickness in healthy volunteers in a similar agerange as in our study (18 to 97 years old). A combination of two factors may explain thisfinding. The first is the relative preservation of these structures with aging as confirmed byother studies. One of them, in a large sample of subjects ranging from 7 to 79 years, foundstable hippocampal volume across its entire age range (Grieve, et al., 2005). Another studyreported a very late decline in the volume of the hippocampal region; its volume remainedsteady until the 7th decade and then showed a sharp decrease after the 8th decade (Allen, etal., 2005). In our study, we did not assess age-related-hippocampal atrophy as the corticalsurfaces derived from FreeSurfer do not include this region. However, the surroundingcortical regions provide an indirect insight into the age-related changes of this structure. Thesecond factor could be related to a technical limitation of the methodology currently used.The narrow separation between the medial temporal structures (i.e. hippocampus, entorhinaland parahippocampal regions) may hinder accurately outlining the GM/WM surface of thesestructures, which could increase the variability in the derived-measurements of volume,thickness and surface area (Han, et al., 2006). If this limitation is systematically related toage, it may falsely enhance or even create age-relationships (Fjell, et al., 2009). Therefore,these two factors may lead to the observed but artificial preservation of the entorhinalcortex.
Throughout the brain, surface area did not show any regions of more pronounced reductionwith aging. Since the coefficients of variation are smaller on global and regionalmeasurements of surface (10.46 % and 10.31 % respectively) than of volume (11.39 % and11.48 % respectively), this negative result can not simply be explained by a highervariability in the measurement of surface. This implies that while a global reduction of
Lemaitre et al. Page 6
Neurobiol Aging. Author manuscript; available in PMC 2013 March 1.
NIH
-PA Author Manuscript
NIH
-PA Author Manuscript
NIH
-PA Author Manuscript
surface area was observed during aging, the rates of decline were relatively homogeneousacross most of the cortical areas. This makes cortical thickness and grey matter volumequantitatively more informative for age-related morphometric changes across the brain.Measurement of surface area may be less sensitive to morphometric variations with agingthan thickness and volume measurements. To some extent, an analogy to a dry apple couldhelp understand the possible mechanisms underlying these age-related morphometricchanges. When an apple dries, its flesh and thickness reduce and its skin shrivels keeping thesurface area relatively constant but gaining spatial complexity from a flat to an unevensurface. Applied to cerebral aging, the width and depth of cortical sulci might influence thecomplexity metric, such that more atrophied brains might exhibit an increase in gyralcomplexity but not a decrease in surface area (Narr, et al., 2004). Indeed, a studycharacterizing the geometric shape of cortical changes associated with aging is in agreementwith this hypothesis (Rettmann, et al., 2006). Among a set of eight sulcal regions, theyfound age-related reductions in thickness and volume but no changes in surface area. Theyalso found changes in curvatures such as an age-related increase in inward bending of thesurface. It is therefore possible that this mechanism might provide an explanation to therelative conservation of surface area in cortical areas such as the prefrontal regions whichshow significant atrophy with aging.
The morphometric measures - volume, thickness and surface area - are linked and inter-related to each other by a simple mathematical equation, the volume being the product of thesurface area by the thickness of the cortical mantle. However, they may not be equallysensitive to factors associated to cortical atrophy such as in aging or neuropsychiatricdisorders, and thus may present their own specificity. For example, Dickerson et al. (2009)looking at the entorhinal cortex have shown that normal aging exerted a preferential effecton surface area, while Alzheimer’s disease was associated with larger thickness reduction.In our study, we put forward the hypothesis that these measures, particularly volume andthickness, would behave differentially across the cortical regions of the brain to aging. Thehistological correlates of these morphometric measures are not well defined and warrantfurther investigation. However, it is likely that thickness may be related, at least in part, tothe integrity of cellular elements within the cortical mantle; and surface area to the size ofintracortical elements or to local subcortical factors, such as the volume of the white matteradjacent to the given gyrus or sulcus (Feczko, et al., 2009). In those conditions, alterations involume could be associated with at least one of these histological parameters or with a stillundiscovered parameter which would equally target surface and thickness. In any case, thesemeasures put together provide complementary pieces of information, which may help tounderstand mechanisms underlying the differential brain aging across cortical regions.
A possible limitation of our study is inherent in its cross-sectional design. In such studies,age effect is inferred from measurements made from subjects of different ages, which maybias results due to potential cohort differences. For this reason, longitudinal designs, whereeach subject serves as his or her own control, are preferable but are also more difficult toconduct and may suffer from other issues (Klauschen, et al., 2009). The method employed inthe present study has been shown to provide accurate surface-based measures of the cortexas confirmed by using postmortem brains (Rosas, et al., 2002). These measures have alsobeen shown to be highly reliable across MRI scanners and field strengths (Han, et al., 2006),and across different samples of subjects (Fjell, et al., 2009).
5. ConclusionThe present study provides a detailed description of global and regional changes of corticalvolume, thickness and surface area occurring during normal aging. These three corticalmeasures showed common patterns of age-related decline in the prefrontal cortex but also
Lemaitre et al. Page 7
Neurobiol Aging. Author manuscript; available in PMC 2013 March 1.
NIH
-PA Author Manuscript
NIH
-PA Author Manuscript
NIH
-PA Author Manuscript

distinct patterns such as noticed in the parietal lobe with only an age-related reduction ofthickness. These differences may account for the specificity of each of these morphologicalmeasures which may reflect different age-related histological changes. Thus, the distinctionbetween cortical volume, thickness and surface area is an interesting strategy to dissect age-related changes in brain structure and may also be beneficial in the context of pathologicalaging and other brain disorders.
AcknowledgmentsThis work was supported by the Intramural Research Program of the National Institute of Mental Health, NIH,Bethesda, MD 20892, USA.
ReferencesAbe O, Yamasue H, Aoki S, Suga M, Yamada H, Kasai K, Masutani Y, Kato N, Ohtomo K. Aging in
the CNS: comparison of gray/white matter volume and diffusion tensor data. Neurobiol Aging.2008; 29(1):102–16. S0197-4580(06)00330-7 [pii]. 10.1016/j.neurobiolaging.2006.09.003[PubMed: 17023094]
Allen JS, Bruss J, Brown CK, Damasio H. Normal neuroanatomical variation due to age: the majorlobes and a parcellation of the temporal region. Neurobiol Aging. 2005; 26(9):1245–60. discussion79–82. S0197-4580(05)00169-7 [pii]. 10.1016/j.neurobiolaging.2005.05.023 [PubMed: 16046030]
Bigler ED, Anderson CV, Blatter DD. Temporal lobe morphology in normal aging and traumatic braininjury. AJNR Am J Neuroradiol. 2002; 23(2):255–66. [PubMed: 11847051]
Collins DL, Neelin P, Peters TM, Evans AC. Automatic 3D intersubject registration of MR volumetricdata in standardized Talairach space. Journal of computer assisted tomography. 1994; 18(2):192–205. [PubMed: 8126267]
Courchesne E, Chisum HJ, Townsend J, Cowles A, Covington J, Egaas B, Harwood M, Hinds S, PressGA. Normal brain development and aging: quantitative analysis at in vivo MR imaging in healthyvolunteers. Radiology. 2000; 216(3):672–82. [PubMed: 10966694]
Dale AM, Fischl B, Sereno MI. Cortical surface-based analysis. I. Segmentation and surfacereconstruction. Neuroimage. 1999; 9(2):179–94. [PubMed: 9931268]
Desikan RS, Segonne F, Fischl B, Quinn BT, Dickerson BC, Blacker D, Buckner RL, Dale AM,Maguire RP, Hyman BT, Albert MS, Killiany RJ. An automated labeling system for subdividing thehuman cerebral cortex on MRI scans into gyral based regions of interest. Neuroimage. 2006; 31(3):968–80. [PubMed: 16530430]
Dickerson BC, Feczko E, Augustinack JC, Pacheco J, Morris JC, Fischl B, Buckner RL. Differentialeffects of aging and Alzheimer's disease on medial temporal lobe cortical thickness and surfacearea. Neurobiol Aging. 2009; 30(3):432–40. [PubMed: 17869384]
Du AT, Schuff N, Chao LL, Kornak J, Jagust WJ, Kramer JH, Reed BR, Miller BL, Norman D, ChuiHC, Weiner MW. Age effects on atrophy rates of entorhinal cortex and hippocampus. NeurobiolAging. 2006; 27(5):733–40. [PubMed: 15961190]
Feczko E, Augustinack JC, Fischl B, Dickerson BC. An MRI-based method for measuring volume,thickness and surface area of entorhinal, perirhinal, and posterior parahippocampal cortex.Neurobiol Aging. 2009; 30(3):420–31. [PubMed: 17850926]
First, MB.; Spitzer, RL.; Gibbon, M.; Williams, JB. The Structured Clinical Interview for DSM-IVAxis I Disorders. New York State Psychiatric Institute; New York: 1995. Patients Edition (SCID-I/P, Version 2.0)
Fischl B, Dale AM. Measuring the thickness of the human cerebral cortex from magnetic resonanceimages. Proceedings of the National Academy of Sciences of the United States of America. 2000;97(20):11050–5. [PubMed: 10984517]
Fischl B, Liu A, Dale AM. Automated manifold surgery: constructing geometrically accurate andtopologically correct models of the human cerebral cortex. IEEE transactions on medical imaging.2001; 20(1):70–80. [PubMed: 11293693]
Lemaitre et al. Page 8
Neurobiol Aging. Author manuscript; available in PMC 2013 March 1.
NIH
-PA Author Manuscript
NIH
-PA Author Manuscript
NIH
-PA Author Manuscript

Fischl B, Salat DH, Busa E, Albert M, Dieterich M, Haselgrove C, van der Kouwe A, Killiany R,Kennedy D, Klaveness S, Montillo A, Makris N, Rosen B, Dale AM. Whole brain segmentation:automated labeling of neuroanatomical structures in the human brain. Neuron. 2002; 33(3):341–55. [PubMed: 11832223]
Fischl B, Sereno MI, Dale AM. Cortical surface-based analysis. II: Inflation, flattening, and a surface-based coordinate system. Neuroimage. 1999; 9(2):195–207. [PubMed: 9931269]
Fischl B, van der Kouwe A, Destrieux C, Halgren E, Segonne F, Salat DH, Busa E, Seidman LJ,Goldstein J, Kennedy D, Caviness V, Makris N, Rosen B, Dale AM. Automatically parcellatingthe human cerebral cortex. Cereb Cortex. 2004; 14(1):11–22. [PubMed: 14654453]
Fjell AM, Walhovd KB, Reinvang I, Lundervold A, Salat D, Quinn BT, Fischl B, Dale AM. Selectiveincrease of cortical thickness in high-performing elderly--structural indices of optimal cognitiveaging. Neuroimage. 2006; 29(3):984–94. S1053-8119(05)00597-5 [pii]. 10.1016/j.neuroimage.2005.08.007 [PubMed: 16176876]
Fjell AM, Westlye LT, Amlien I, Espeseth T, Reinvang I, Raz N, Agartz I, Salat DH, Greve DN,Fischl B, Dale AM, Walhovd KB. High Consistency of Regional Cortical Thinning in Agingacross Multiple Samples. Cereb Cortex. 2009
Fox NC, Crum WR, Scahill RI, Stevens JM, Janssen JC, Rossor MN. Imaging of onset andprogression of Alzheimer's disease with voxel-compression mapping of serial magnetic resonanceimages. Lancet. 2001; 358(9277):201–5. [PubMed: 11476837]
Good CD, Johnsrude IS, Ashburner J, Henson RN, Friston KJ, Frackowiak RS. A voxel-basedmorphometric study of ageing in 465 normal adult human brains. Neuroimage. 2001; 14(1 Pt 1):21–36. S1053-8119(01)90786-4 [pii]. 10.1006/nimg.2001.0786 [PubMed: 11525331]
Grieve SM, Clark CR, Williams LM, Peduto AJ, Gordon E. Preservation of limbic and paralimbicstructures in aging. Hum Brain Mapp. 2005; 25(4):391–401.10.1002/hbm.20115 [PubMed:15852381]
Han X, Jovicich J, Salat D, van der Kouwe A, Quinn B, Czanner S, Busa E, Pacheco J, Albert M,Killiany R, Maguire P, Rosas D, Makris N, Dale A, Dickerson B, Fischl B. Reliability of MRI-derived measurements of human cerebral cortical thickness: the effects of field strength, scannerupgrade and manufacturer. Neuroimage. 2006; 32(1):180–94. [PubMed: 16651008]
Hutton C, Draganski B, Ashburner J, Weiskopf N. A comparison between voxel-based corticalthickness and voxel-based morphometry in normal aging. Neuroimage. 2009; 48(2):371–80.[PubMed: 19559801]
Jernigan TL, Archibald SL, Fennema-Notestine C, Gamst AC, Stout JC, Bonner J, Hesselink JR.Effects of age on tissues and regions of the cerebrum and cerebellum. Neurobiol Aging. 2001;22(4):581–94. S0197458001002172 [pii]. [PubMed: 11445259]
Kalpouzos G, Chetelat G, Baron JC, Landeau B, Mevel K, Godeau C, Barre L, Constans JM, Viader F,Eustache F, Desgranges B. Voxel-based mapping of brain gray matter volume and glucosemetabolism profiles in normal aging. Neurobiol Aging. 2007 S0197-4580(07)00230-8 [pii].10.1016/j.neurobiolaging.2007.05.019
Killiany RJ, Hyman BT, Gomez-Isla T, Moss MB, Kikinis R, Jolesz F, Tanzi R, Jones K, Albert MS.MRI measures of entorhinal cortex vs hippocampus in preclinical AD. Neurology. 2002; 58(8):1188–96. [PubMed: 11971085]
Klauschen F, Goldman A, Barra V, Meyer-Lindenberg A, Lundervold A. Evaluation of automatedbrain MR image segmentation and volumetry methods. Hum Brain Mapp. 2009; 30(4):1310–27.[PubMed: 18537111]
Kolev V, Falkenstein M, Yordanova J. Motor-response generation as a source of aging-relatedbehavioural slowing in choice-reaction tasks. Neurobiol Aging. 2006; 27(11):1719–30. [PubMed:16246465]
Lemaitre H, Crivello F, Grassiot B, Alperovitch A, Tzourio C, Mazoyer B. Age- and sex-relatedeffects on the neuroanatomy of healthy elderly. Neuroimage. 2005; 26(3):900–11.S1053-8119(05)00145-X [pii]. 10.1016/j.neuroimage.2005.02.042 [PubMed: 15955500]
Mattay VS, Fera F, Tessitore A, Hariri AR, Das S, Callicott JH, Weinberger DR. Neurophysiologicalcorrelates of age-related changes in human motor function. Neurology. 2002; 58(4):630–5.[PubMed: 11865144]
Lemaitre et al. Page 9
Neurobiol Aging. Author manuscript; available in PMC 2013 March 1.
NIH
-PA Author Manuscript
NIH
-PA Author Manuscript
NIH
-PA Author Manuscript
Narr KL, Bilder RM, Kim S, Thompson PM, Szeszko P, Robinson D, Luders E, Toga AW. Abnormalgyral complexity in first-episode schizophrenia. Biological psychiatry. 2004; 55(8):859–67.[PubMed: 15050868]
Pakkenberg B, Pelvig D, Marner L, Bundgaard MJ, Gundersen HJ, Nyengaard JR, Regeur L. Agingand the human neocortex. Experimental gerontology. 2003; 38(1–2):95–9. [PubMed: 12543266]
Peters A, Morrison JH, Rosene DL, Hyman BT. Feature article: are neurons lost from the primatecerebral cortex during normal aging? Cereb Cortex. 1998; 8(4):295–300. [PubMed: 9651126]
Raz N. Ageing and the brain. The Encyclopedia of life sciences. 2005:1–6.Raz N, Gunning-Dixon F, Head D, Rodrigue KM, Williamson A, Acker JD. Aging, sexual
dimorphism, and hemispheric asymmetry of the cerebral cortex: replicability of regionaldifferences in volume. Neurobiol Aging. 2004; 25(3):377–96. S0197458003001180 [pii]. 10.1016/S0197-4580(03)00118-0 [PubMed: 15123343]
Raz N, Gunning-Dixon FM, Head D, Dupuis JH, Acker JD. Neuroanatomical correlates of cognitiveaging: evidence from structural magnetic resonance imaging. Neuropsychology. 1998; 12(1):95–114. [PubMed: 9460738]
Raz N, Gunning FM, Head D, Dupuis JH, McQuain J, Briggs SD, Loken WJ, Thornton AE, Acker JD.Selective aging of the human cerebral cortex observed in vivo: differential vulnerability of theprefrontal gray matter. Cereb Cortex. 1997; 7(3):268–82. [PubMed: 9143446]
Raz N, Rodrigue KM. Differential aging of the brain: patterns, cognitive correlates and modifiers.Neurosci Biobehav Rev. 2006; 30(6):730–48. S0149-7634(06)00070-4 [pii]. 10.1016/j.neubiorev.2006.07.001 [PubMed: 16919333]
Resnick SM, Pham DL, Kraut MA, Zonderman AB, Davatzikos C. Longitudinal magnetic resonanceimaging studies of older adults: a shrinking brain. J Neurosci. 2003; 23(8):3295–301. [PubMed:12716936]
Rettmann ME, Kraut MA, Prince JL, Resnick SM. Cross-sectional and longitudinal analyses ofanatomical sulcal changes associated with aging. Cereb Cortex. 2006; 16(11):1584–94. bhj095[pii]. 10.1093/cercor/bhj095 [PubMed: 16400155]
Rodrigue KM, Raz N. Shrinkage of the entorhinal cortex over five years predicts memory performancein healthy adults. J Neurosci. 2004; 24(4):956–63. [PubMed: 14749440]
Rosas HD, Liu AK, Hersch S, Glessner M, Ferrante RJ, Salat DH, van der Kouwe A, Jenkins BG,Dale AM, Fischl B. Regional and progressive thinning of the cortical ribbon in Huntington'sdisease. Neurology. 2002; 58(5):695–701. [PubMed: 11889230]
Rusinek H, De Santi S, Frid D, Tsui WH, Tarshish CY, Convit A, de Leon MJ. Regional brain atrophyrate predicts future cognitive decline: 6-year longitudinal MR imaging study of normal aging.Radiology. 2003; 229(3):691–6. [PubMed: 14657306]
Salat DH, Buckner RL, Snyder AZ, Greve DN, Desikan RS, Busa E, Morris JC, Dale AM, Fischl B.Thinning of the cerebral cortex in aging. Cereb Cortex. 2004; 14(7):721–30. bhh032 [pii].10.1093/cercor/bhh032 [PubMed: 15054051]
Segonne F, Grimson E, Fischl B. A genetic algorithm for the topology correction of cortical surfaces.Inf Process Med Imaging. 2005; 19:393–405. [PubMed: 17354712]
Sled JG, Zijdenbos AP, Evans AC. A nonparametric method for automatic correction of intensitynonuniformity in MRI data. IEEE transactions on medical imaging. 1998; 17(1):87–97. [PubMed:9617910]
Smith CD, Chebrolu H, Wekstein DR, Schmitt FA, Markesbery WR. Age and gender effects onhuman brain anatomy: a voxel-based morphometric study in healthy elderly. Neurobiol Aging.2007; 28(7):1075–87. [PubMed: 16774798]
Sowell ER, Peterson BS, Thompson PM, Welcome SE, Henkenius AL, Toga AW. Mapping corticalchange across the human life span. Nat Neurosci. 2003; 6(3):309–15. nn1008 [pii]. 10.1038/nn1008 [PubMed: 12548289]
Tisserand DJ, Jolles J. On the involvement of prefrontal networks in cognitive ageing. Cortex; ajournal devoted to the study of the nervous system and behavior. 2003; 39(4–5):1107–28.
Tisserand DJ, Pruessner JC, Sanz Arigita EJ, van Boxtel MP, Evans AC, Jolles J, Uylings HB.Regional frontal cortical volumes decrease differentially in aging: an MRI study to compare
Lemaitre et al. Page 10
Neurobiol Aging. Author manuscript; available in PMC 2013 March 1.
NIH
-PA Author Manuscript
NIH
-PA Author Manuscript
NIH
-PA Author Manuscript

volumetric approaches and voxel-based morphometry. Neuroimage. 2002; 17(2):657–69.S1053811902911730 [pii]. [PubMed: 12377141]
Verhaeghen P, Marcoen A, Goossens L. Facts and fiction about memory aging: a quantitativeintegration of research findings. Journal of gerontology. 1993; 48(4):P157–71. [PubMed:8315232]
Walhovd KB, Fjell AM, Reinvang I, Lundervold A, Dale AM, Eilertsen DE, Quinn BT, Salat D,Makris N, Fischl B. Effects of age on volumes of cortex, white matter and subcortical structures.Neurobiol Aging. 2005; 26(9):1261–70. discussion 75–8. S0197-4580(05)00167-3 [pii]. 10.1016/j.neurobiolaging.2005.05.020 [PubMed: 16005549]
Walhovd KB, Fjell AM, Reinvang I, Lundervold A, Dale AM, Quinn BT, Salat D, Makris N, Fischl B.Neuroanatomical aging: Universal but not uniform. Neurobiology of Aging. 2005; 26(9):1279–82.
West RL. An application of prefrontal cortex function theory to cognitive aging. Psychologicalbulletin. 1996; 120(2):272–92. [PubMed: 8831298]
Winkler AM, Kochunov P, Blangero J, Almasy L, Zilles K, Fox PT, Duggirala R, Glahn DC. Corticalthickness or grey matter volume? The importance of selecting the phenotype for imaging geneticsstudies. Neuroimage. 2009
Ziegler DA, Piguet O, Salat DH, Prince K, Connally E, Corkin S. Cognition in healthy aging is relatedto regional white matter integrity, but not cortical thickness. Neurobiol Aging. 2008
Lemaitre et al. Page 11
Neurobiol Aging. Author manuscript; available in PMC 2013 March 1.
NIH
-PA Author Manuscript
NIH
-PA Author Manuscript
NIH
-PA Author Manuscript

Figure 1.Scatter plots and simple linear regressions of total volume (a.), mean thickness (b.) and totalsurface area (c.) on age for both cerebral hemispheres.
Lemaitre et al. Page 12
Neurobiol Aging. Author manuscript; available in PMC 2013 March 1.
NIH
-PA Author Manuscript
NIH
-PA Author Manuscript
NIH
-PA Author Manuscript

Figure 2.Effects of age on cortical volume (a.), thickness (b.) and surface area (c.) for each region ofthe brain. On the left, regression maps are superimposed onto an average pial surface (n =216) and displayed without statistical threshold in % of region per year for cortical volumeand surface, and in mm per year for cortical thickness (blue color scale for reductions andred color scale for increases). On the right, horizontal barplots of the corresponding age-related effect on the 33 bilateral cortical regions as parcellated by the automatic labelingprocedure in FreeSurfer (*** p < 0.001, ** p < 0.01 corrected for False Discovery Rate).
Lemaitre et al. Page 13
Neurobiol Aging. Author manuscript; available in PMC 2013 March 1.
NIH
-PA Author Manuscript
NIH
-PA Author Manuscript
NIH
-PA Author Manuscript
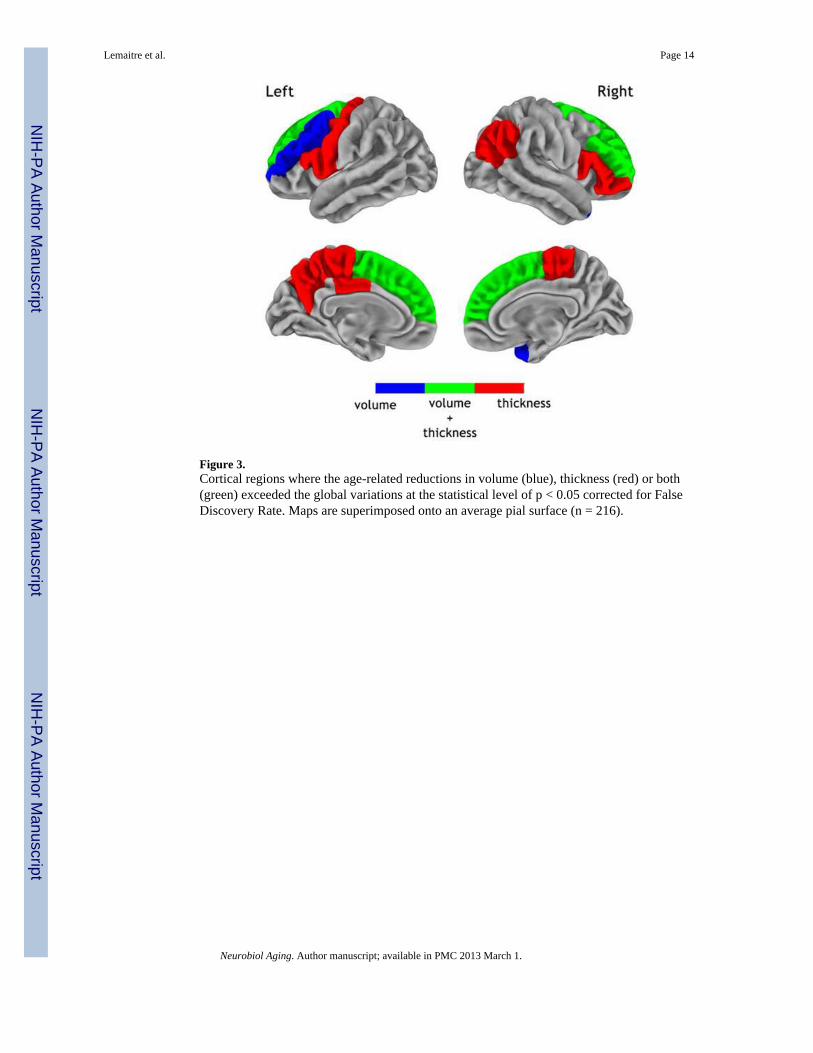
Figure 3.Cortical regions where the age-related reductions in volume (blue), thickness (red) or both(green) exceeded the global variations at the statistical level of p < 0.05 corrected for FalseDiscovery Rate. Maps are superimposed onto an average pial surface (n = 216).
Lemaitre et al. Page 14
Neurobiol Aging. Author manuscript; available in PMC 2013 March 1.
NIH
-PA Author Manuscript
NIH
-PA Author Manuscript
NIH
-PA Author Manuscript
NIH
-PA Author Manuscript
NIH
-PA Author Manuscript
NIH
-PA Author Manuscript
Lemaitre et al. Page 15
Tabl
e 1
Age
eff
ects
on
tota
l sur
face
are
a, g
loba
l ave
rage
thic
knes
s and
tota
l cor
tical
vol
ume
Des
crip
tives
Age
Effe
cts
Mea
nSt
anda
rd D
evia
tion
Effe
ct S
ize
rp
Tota
l sur
face
are
a (c
m2 )
1692
.54
177.
133.
68
cm2 /y
ear
−0.34
3.9
× 10
−7
Glo
bal a
vera
ge T
hick
ness
(mm
)2.
460.
110.
004
mm
/yea
r−0.62
5.2
× 10
−24
Tota
l cor
tical
vol
ume
(cm
3 )45
8.17
52.1
91.
89 c
m3 /y
ear
−0.59
1.3
× 10
−21
Neurobiol Aging. Author manuscript; available in PMC 2013 March 1.
Related Documents