NORC at the University of Chicago The University of Chicago Import Competition and the Great US Employment Sag of the 2000s Author(s): Daron Acemoglu, David Autor, David Dorn, Gordon H. Hanson, and Brendan Price Source: Journal of Labor Economics, Vol. 34, No. S1 (Part 2, January 2016), pp. S141-S198 Published by: The University of Chicago Press on behalf of the Society of Labor Economists and the NORC at the University of Chicago Stable URL: http://www.jstor.org/stable/10.1086/682384 . Accessed: 18/12/2015 07:23 Your use of the JSTOR archive indicates your acceptance of the Terms & Conditions of Use, available at . http://www.jstor.org/page/info/about/policies/terms.jsp . JSTOR is a not-for-profit service that helps scholars, researchers, and students discover, use, and build upon a wide range of content in a trusted digital archive. We use information technology and tools to increase productivity and facilitate new forms of scholarship. For more information about JSTOR, please contact [email protected]. . The University of Chicago Press, Society of Labor Economists, NORC at the University of Chicago, The University of Chicago are collaborating with JSTOR to digitize, preserve and extend access to Journal of Labor Economics. http://www.jstor.org This content downloaded from 23.235.32.0 on Fri, 18 Dec 2015 07:23:05 AM All use subject to JSTOR Terms and Conditions

Welcome message from author
This document is posted to help you gain knowledge. Please leave a comment to let me know what you think about it! Share it to your friends and learn new things together.
Transcript

NORC at the University of ChicagoThe University of Chicago
Import Competition and the Great US Employment Sag of the 2000sAuthor(s): Daron Acemoglu, David Autor, David Dorn, Gordon H. Hanson, and Brendan PriceSource: Journal of Labor Economics, Vol. 34, No. S1 (Part 2, January 2016), pp. S141-S198Published by: The University of Chicago Press on behalf of the Society of Labor Economists andthe NORC at the University of ChicagoStable URL: http://www.jstor.org/stable/10.1086/682384 .
Accessed: 18/12/2015 07:23
Your use of the JSTOR archive indicates your acceptance of the Terms & Conditions of Use, available at .http://www.jstor.org/page/info/about/policies/terms.jsp
.JSTOR is a not-for-profit service that helps scholars, researchers, and students discover, use, and build upon a wide range ofcontent in a trusted digital archive. We use information technology and tools to increase productivity and facilitate new formsof scholarship. For more information about JSTOR, please contact [email protected].
.
The University of Chicago Press, Society of Labor Economists, NORC at the University of Chicago, TheUniversity of Chicago are collaborating with JSTOR to digitize, preserve and extend access to Journal ofLabor Economics.
http://www.jstor.org
This content downloaded from 23.235.32.0 on Fri, 18 Dec 2015 07:23:05 AMAll use subject to JSTOR Terms and Conditions
Import Competition and the GreatUS Employment Sag of the 2000s
Daron Acemoglu, Massachusetts Institute of Technologyand National Bureau of Economic Research
David Autor, Massachusetts Institute of Technologyand National Bureau of Economic Research
David Dorn, University of Zurich and Centre for EconomicPolicy Research
Gordon H. Hanson, University of California, San Diego,and National Bureau of Economic Research
Brendan Price, Massachusetts Institute of Technology
Even before the Great Recession, US employment growth wasunimpressive. Between 2000 and 2007, the economy gave back theconsiderable employment gains achieved during the 1990s, with ahistoric contraction in manufacturing employment being a primecontributor to the slump. We estimate that import competitionfromChina, which surged after 2000, was amajor force behind bothrecent reductions in US manufacturing employment and—throughinput-output linkages and other general equilibrium channels—weak overall US job growth. Our central estimates suggest joblosses from rising Chinese import competition over 1999–2011 inthe range of 2.0–2.4 million.
We thank David Card, Alexandre Mas, Alireza Tahbaz-Salehi, and numerousparticipants at the National Bureau of Economic Research conference titled“The Labor Market in the Aftermath of the Great Recession” for questions and
[ Journal of Labor Economics, 2016, vol. 34, no. 1, pt. 2]© 2015 by The University of Chicago. All rights reserved. 0734-306X/2016/34S1-0011$10.00Submitted September 17, 2013; Accepted May 14, 2015; Electronically published December 16, 2015
S141
This content downloaded from 23.235.32.0 on Fri, 18 Dec 2015 07:23:05 AMAll use subject to JSTOR Terms and Conditions
I. Introduction
During the last decade of the twentieth century—christened the “RoaringNineties” by Krueger and Solow ð2002Þ—the US labor market exhibited avigor not seen since the 1960s. Between 1991 and 2000, the employment-to-population ratio rose by 1.5 percentage points among men and by morethan 3 percentage points among women. Following 5 years of rapid wagegrowth accompanied by minimal inflation, the national unemploymentrate in the year 2000 reached a nadir of 4.0%, its lowest level since 1969.Just 1 year later, the US labor market commenced what Moffitt ð2012Þterms a “historic turnaround” in which the gains of the prior decade wereundone. Between 2001 and 2007, male employment rates lost all of theirground attained between 1991 and 2000. The rapid increase of femaleemployment rates halted simultaneously.1 The growth rate of employ-ment averaged only 0.9% between 2000 and 2007—that is, during the7 years before the onset of the Great Recession—versus 2.6% between1991 and 2000 ðfig. 1Þ.2This pre–Great Recession US employment “sag” of the 2000s is widely
recognized but poorly understood.3 It coincides with a significant increasein import competition from China. Between 1990 and 2011, the share ofworld manufacturing exports originating in China increased from 2% to16% ðHanson 2012Þ. China’s export surge is the outcome of deep eco-nomic reforms in the 1980s and 1990s, which were reinforced by thecountry’s accession to the World Trade Organization ðWTOÞ in 2001
1 See http://www.bls.gov/ilc/#laborforce for data on the size and the employ-ment rate of the working-age population.
2 The employment series plotted in fig. 1, as well as the employment statisticsprovided later in this section, are derived from County Business Patterns ðCBPÞ.As detailed below, CBP covers all US employment except for self-employedindividuals, employees of private households, railroad employees, agricultural pro-duction employees, and most government employees.
3 Moffitt ð2012Þ studies potential causes for the sag, including wage levels, agestructure, family structure, taxes, transfers, minimum wage policies, and popula-tion health. Only declining male wage rates are found to have substantial explana-tory power. Yet this explanation leaves unanswered the question of whymale wagesfell. The concurrence of falling wages and falling employment-to-population ratiossuggests an inward shift in labor demand.
suggestions that improved the article. We are grateful to Christina Pattersonfor excellent research assistance. Dorn acknowledges funding from the SpanishMinistry of Science and Innovation ðECO2010-16726 and JCI2011-09709Þ. Autorand Hanson acknowledge funding from the National Science Foundation ðgrantSES-1227334Þ. Price acknowledges financial support from the Hewlett Founda-tion. Autor, Acemoglu, and Price acknowledge support from the Alfred P. SloanFoundation ðgrant 2011-10-12Þ. Contact the corresponding author, David Autor,at [email protected]. Information concerning access to the data used in this article isavailable as supplementary material online.
S142 Acemoglu et al.
This content downloaded from 23.235.32.0 on Fri, 18 Dec 2015 07:23:05 AMAll use subject to JSTOR Terms and Conditions
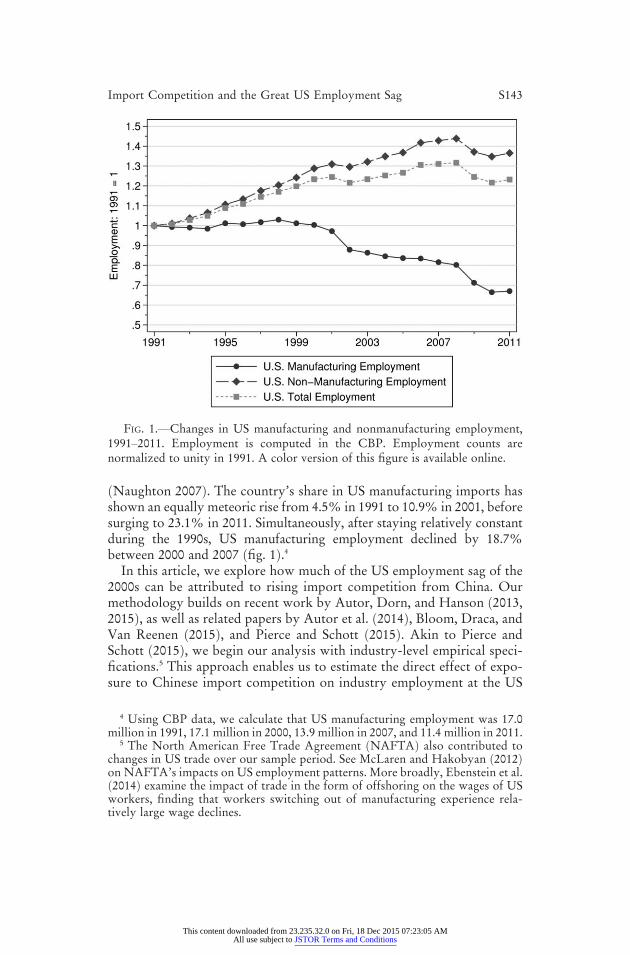
ðNaughton 2007Þ. The country’s share in US manufacturing imports hasshown an equally meteoric rise from 4.5% in 1991 to 10.9% in 2001, beforesurging to 23.1% in 2011. Simultaneously, after staying relatively constantduring the 1990s, US manufacturing employment declined by 18.7%between 2000 and 2007 ðfig. 1Þ.4In this article, we explore how much of the US employment sag of the
2000s can be attributed to rising import competition from China. Ourmethodology builds on recent work by Autor, Dorn, and Hanson ð2013,2015Þ, as well as related papers by Autor et al. ð2014Þ, Bloom, Draca, andVan Reenen ð2015Þ, and Pierce and Schott ð2015Þ. Akin to Pierce andSchott ð2015Þ, we begin our analysis with industry-level empirical speci-fications.5 This approach enables us to estimate the direct effect of expo-sure to Chinese import competition on industry employment at the US
4 Using CBP data, we calculate that US manufacturing employment was 17.0million in 1991, 17.1 million in 2000, 13.9 million in 2007, and 11.4 million in 2011.
5 The North American Free Trade Agreement ðNAFTAÞ also contributed tochanges in US trade over our sample period. See McLaren and Hakobyan ð2012Þon NAFTA’s impacts on US employment patterns. More broadly, Ebenstein et al.ð2014Þ examine the impact of trade in the form of offshoring on the wages of USworkers, finding that workers switching out of manufacturing experience rela-tively large wage declines.
FIG. 1.—Changes in US manufacturing and nonmanufacturing employment,1991–2011. Employment is computed in the CBP. Employment counts arenormalized to unity in 1991. A color version of this figure is available online.
Import Competition and the Great US Employment Sag S143
This content downloaded from 23.235.32.0 on Fri, 18 Dec 2015 07:23:05 AMAll use subject to JSTOR Terms and Conditions
national level. Our direct industry-level employment estimates come fromcomparing changes in employment across four-digit manufacturing in-dustries from 1991 to 2011 as a function of industry exposure to Chineseimport competition. The first part of our article shows that there is a sizableand robust negative effect of growing Chinese imports on US manufactur-ing employment.Quantitatively, our direct estimates imply that had import penetration
from China not grown after 1999, there would have been 560,000 fewermanufacturing jobs lost through the year 2011. Actual US manufacturingemployment declined from 17.2 million workers in 1999 to 11.4 million in2011, making the counterfactual job loss from the direct effect of greaterChinese import penetration amount to approximately 10% of the realizedjob decline in manufacturing.These direct effects do not, however, correspond to the full general
equilibrium impact of growing Chinese imports on US employment, whichalso encompasses several indirect channels through which rising exposureto import competition may affect employment levels. One source of in-direct effects, also studied by Pierce and Schott ð2015Þ, is industry input-output linkages. These linkages can create both positive and negative changesin US industry labor demand, generating a net employment change that isambiguous in sign. If an industry contracts because of Chinese competi-tion, it may reduce both its demand for intermediate inputs produced inthe United States and its supply of inputs to other domestic industries. Anindustry may thus be negatively affected by trade shocks either to its do-mestic suppliers or to its domestic buyers. The sign of the “downstreameffect”—through which import exposure propagates downstream from asupplying industry to its customers—is theoretically ambiguous: while tradecompetition may reduce the domestic supply of certain inputs, such reduc-tions may be offset by the increased supply of imported inputs.6 By con-trast, the “upstream effect”—whereby import exposure within an industrypropagates upstream to its suppliers—should have unambiguously contrac-tionary consequences for the upstream industry.7
We use the US input-output table for 1992 to estimate the effects ofupstream and downstream import exposure for both manufacturing andnonmanufacturing industries. Our initial measure of the upstream ðrespec-
6 Trade shocks to an industry’s suppliers will have negative effects on thatindustry if, because of specific investments, existing supply relationships are moreproductive or are able to provide highly customized inputs as generally presumedin the industrial organization literature on vertical integration ðe.g., Williamson1975; Hart and Moore 1990Þ.
7 An earlier version of this article ðAcemoglu et al. 2014aÞ reversed the termi-nology of upstream and downstream effects. We have adopted the present termi-nology for consistency with common usage in the literature on input-output effects.
S144 Acemoglu et al.
This content downloaded from 23.235.32.0 on Fri, 18 Dec 2015 07:23:05 AMAll use subject to JSTOR Terms and Conditions
tively, downstreamÞ effect for an industry, which sums over the direct im-port exposure experienced by all other industries using as weights theirshare in the total output demands of ðrespectively, their input supplies toÞthe industry in question, captures this notion.8 Estimates from this exer-cise indicate sizable negative upstream effects while, consistent with theanticipated ambiguity of downstream effects, the downstream magnitudesare imprecisely estimated and unstable in sign. Our preferred measure ofindirect trade shocks further accounts not only for shocks to an industry’simmediate buyers or suppliers but also for the full set of input-outputrelationships among all connected industries ðe.g., shocks to an industry’sbuyers, its buyers’ buyers, etc.Þ. Applying this direct plus full input-outputmeasure of exposure increases our estimates of trade-induced job losses for1999–2011 to 985,000 workers in manufacturing alone and to 1.98 millionworkers in the entire economy. Thus, interindustry linkages magnify theemployment effects of trade shocks, doubling the size of the impact withinmanufacturing and producing an equally large employment effect outsideof manufacturing.Our second empirical strategy, which focuses on local labor markets, is
motivated by the fact that analysis at the level of national industries fails tocapture two other potentially important and opposing general equilibriumchannels. One such additional channel is a reallocation effect from grow-ing trade with China, which works through the movement of factors ofproduction from declining sectors to new opportunities and potentially coun-teracts any negative direct or industry linkage effects. In both Heckscher-Ohlin and Ricardo-Viner models of international trade, stronger importcompetition for one sector reduces the relative price of its final good andinduces the reallocation of labor and capital to sectors whose relative priceshave increased ðFeenstra 2003Þ. Under fully inelastic labor supply, no labormarket frictions, and other neoclassical assumptions that ensure that theaggregate economy is always at full employment, reallocation effects would,by definition, exactly offset direct, upstream, and downstream effects so as torestore full employment. However, with imperfections in labor and othermarkets, there is no guarantee that reallocation effects will be sufficient torestore employment to the same level thatwould have emerged in the absenceof trade growth from China.An additional general equilibrium channel operates through aggregate
demand effects, multiplying the negative direct and indirect effects ofimport growth from China. Through familiar Keynesian-type multipliers,domestic consumption and investment may be depressed, extending em-
8 See Long and Plosser ð1983Þ and Acemoglu et al. ð2012Þ for the reasoningbehind this value share definition, which also corresponds to the relevant entries inthe input-output tables. A detailed derivation is provided in app. B.
Import Competition and the Great US Employment Sag S145
This content downloaded from 23.235.32.0 on Fri, 18 Dec 2015 07:23:05 AMAll use subject to JSTOR Terms and Conditions
ployment losses to sectors not otherwise exposed to import competition. Anegative effect of increased import competition on aggregate demandnecessarily requires that employment reallocation in response to a negativetrade shock is incomplete, such that aggregate earnings decline, and thisdecline is multiplied throughout the economy via demand linkages.We jointly estimate reallocation and aggregate demand effects ðin netÞ at
the level of local labor markets by exploiting the impact of trade shockswithin US commuting zones ðCZsÞ. If the reallocation mechanism isoperative, then when an industry contracts in a CZ as a result of Chinesecompetition, some other industry in the same labor market should expand.Some component of aggregate demand effects should also take place withinlocal labor markets, as shown by Mian and Sufi ð2014Þ in the context of therecent US housing bust: if increased trade exposure lowers aggregate em-ployment in a location, reduced earningswill decrease spendingonnontradedlocal goods and services, magnifying the impact throughout the local econ-omy. Because aggregate demand effects also have a national component,which our approach does not capture, focusing on local labor markets islikely to provide a lower bound on the sum of reallocation and aggregatedemand effects.9
Empirically, our second strategy examines changes in employment inCZs that have different levels of exposure to Chinese competition by virtueof differences in their initial pattern of industrial specialization, a strategyalso used by Autor et al. ð2013Þ. The reallocation effect should result in agreater expansion of employment in nonexposed industries—meaningnontradable industries as well as tradable industries not significantly ex-posed to tradewith China. Surprisingly, we find no robust evidence for thiseffect: the estimated impact of import competition on employment in non-exposed industries is very modest in magnitude and statistically indistin-guishable from zero. The reallocation of employment into nonexposed in-dustries appears to be swamped by the adverse effect of the aggregatedemand channel, which presumably inhibits labor reabsorption.Our estimates of local general equilibrium effects imply that import
growth from China between 1999 and 2011 led to an employment re-duction of 2.4 million workers, inclusive of employment changes within
9 Of course, reallocation effects may also have a national component due to themovement of labor across regions. As we discuss in Sec. II, in practice thereappears to be little response of local labor supply to location-specific increases inimport competition from China ðAutor et al. 2013, 2014Þ, leading us to viewreallocation effects as being primarily local in nature. Another complicating factoris that, in the presence of labor and product market imperfections, the decline of anindustry in the local labor market may lead to the expansion of some tradableindustries in other labor markets, making the local reallocation effects a lowerbound on the aggregate reallocation effects.
S146 Acemoglu et al.
This content downloaded from 23.235.32.0 on Fri, 18 Dec 2015 07:23:05 AMAll use subject to JSTOR Terms and Conditions
nonexposed sectors. Consistent with the idea that import competitionmay havenegative general equilibriumeffects on local employment, this fig-ure exceeds our national industry-level estimate of the direct and indirectdisemployment effects of rising import exposure mentioned above. Asnoted below, neither the CZ-level nor the national estimate fully incorpo-rates all of the adjustment channels encompassed by the other. The na-tional industry estimates exclude reallocation and aggregate demand effects,whereas the CZ estimates exclude the national component of these twoeffects, as well as the nonlocal component of input-output linkage effects.Because the CZ-level estimates suggest that general equilibrium forcesmagnify rather than offset the effects of import competition, we view ourindustry-level estimates of employment reduction as providing a conser-vative lower bound.Our analysis of the aggregate employment consequences of import
competition builds on the recent work of Autor et al. ð2013, 2015Þ by ex-panding their CZ-level analysis to include analysis at the level of nationalindustries, a dimension they do not consider, and by characterizing the al-ternative mechanisms—reallocation versus changes in aggregate demand—through which trade induces employment decline at the local level. Ournational industry approach is similar in spirit to that of Bloom et al. ð2015Þand Pierce and Schott ð2015Þ. Pierce and Schott, in particular, explore howChina’s 2001 World Trade Organization accession affected US manufactur-ing employment. Our article, while complementary to theirs, differs in tworespects. The first is in terms of identification strategy. Whereas Pierce andSchott seek to identify the growth in China trade that resulted from the post-2001 removal of uncertainty surrounding China’s most-favored-nation accessto the US market, our identification strategy captures China’s trade growthdue to broader productivity-driven changes in its export supply. Further,our article expands the analysis to include the transmission of trade shocksto nonmanufacturing sectors and the estimation of employment effects re-sulting from reallocation across sectors and changes in aggregate demand.We begin in Section II by outlining the conceptual framework that mo-
tivates our empirical analysis. Section III describes our empirical approachto estimating the effects of exposure to trade shocks and briefly discussesthe data. Section IV gives our primary ordinary least squares ðOLSÞ andtwo-stage least squares ð2SLSÞ estimates of the impact of trade shocks onemployment and also considers additional labor market outcomes. Sec-tion V expands the analysis to include intersectoral linkages. Section VIpresents estimation results for data on local labor markets. Section VII con-cludes the article. Appendix A contains additional empirical results and ro-bustness checks, and appendix B contains the derivation of our upstreamand downstream import exposure measures from a simple general equilib-rium model with input-output linkages.
Import Competition and the Great US Employment Sag S147
This content downloaded from 23.235.32.0 on Fri, 18 Dec 2015 07:23:05 AMAll use subject to JSTOR Terms and Conditions
II. Conceptual Framework
We start with a brief outline of the conceptual framework that motivatesour empirical work. Consider a simple decomposition of the total nationalemployment impact of increased Chinese trade exposure:10
National employment impact
5Direct impact on exposed industries
1 Indirect impact on linked industries
1Aggregate reallocation effects
1Aggregate demand effects:
Here, the direct impact is the reduction in employment in industries whoseoutputs compete with imports from China. Added to this direct effect isan indirect effect arising because other industries linked to the affectedindustry through the input-output matrix are also likely to see changes inoutput.11 For example, the chemical and fertilizer mining industry—whichis in nonmanufacturing—sells 74% of its output to the manufacturingsector. Its largest single manufacturing customer is industrial organicchemicals not elsewhere classified, which accounts for 15% of its sales.Similarly, the iron and ferroalloy ores industry sells 83% of its output tothe manufacturing sector, two-thirds of which goes to the blast furnace andsteel mill industry. Accordingly, a shock to the demand for a given domesticmanufactured good is likely to indirectly affect demand for, and reduce em-ployment in, industries that supply inputs to the affected industry, whetherin manufacturing or nonmanufacturing. We refer to these linkages as up-stream effects, by which industries exposed to import competition indi-rectly affect industries that are located upstream of them in input-outputspace.12
Conversely, a trade shock to the suppliers of a given industry ðe.g., thesuppliers of tires to the automobile industryÞmay also affect the industriesthat are its customers. The direction of this effect is generally ambiguous.On the one hand, from the perspective of purchasing industries, the tradeshock expands input supply and puts downward pressure on input pricesand thus may tend to expand employment in the industries that consume
10 We follow the standard practice in such decompositions and fold the “co-variance” terms into the “main effects” ðso that the magnitudes are not independentof the order in which these different terms are evaluatedÞ.
11 See, among others, Long and Plosser ð1983Þ and Acemoglu et al. ð2012Þ on thepropagation of shocks through the input-output network of the economy.
12 Unfortunately, the terminology of upstream and downstream effects is opento confusion, since upstream effects—i.e., effects that propagate upstream—workthrough the import exposure experienced by downstream industries, and similarlyfor downstream effects.
S148 Acemoglu et al.
This content downloaded from 23.235.32.0 on Fri, 18 Dec 2015 07:23:05 AMAll use subject to JSTOR Terms and Conditions

these inputs ðGoldberg et al. 2010Þ.13 On the other hand, the trade shockmay destroy existing long-term relationships for specialized inputs as do-mestic input suppliers are driven out of business, creating a force towardcontraction in the industries that were their customers. We refer to suchlinkages as downstream effects, since they propagate from an import-exposed industry to industries located downstream in the production chain.We estimate these effects on linked industries using the input-output matrixof the US economy as described below.We begin our empirical analysis with industry-level regressions that es-
timate the direct impact of import competition on employment in exposedindustries ðSec. IVÞ and subsequently add the indirect employment im-pacts arising from input-output linkages between industries ðSec. VÞ. Theindustry-level analysis thus captures the first two components of the ag-gregate national employment effect, the direct impact on exposed indus-tries plus the indirect impact on linked industries. The industry-level re-gressions do not, however, encompass the third and the fourth componentsof the national employment effect: the reallocation effect, which capturesthe potential increase in employment from the expansion of other in-dustries to absorb the factors of production freed by contracting indus-tries, and the aggregate demand effect, which corresponds to the impactof Keynesian-type multipliers operating through local or national shifts inconsumption and investment.14
To obtain estimates of the magnitudes of these two additional effects,we turn in Section VI to local labor market analysis, focusing on the em-ployment impact of increased import competition from China at the CZlevel. The total employment effect observed in a local labor market can bedecomposed as
Local employment impact
5Direct impact on exposed industries
1 Local impact on linked industries
1 Local real location effects1 Local demand effects:
13 Consistent with this reasoning, De Loecker et al. ð2014Þ find substantialnegative domestic product price effects from trade liberalization in India, andGoldberg et al. ð2010Þ document that greater availability of imported intermediateinputs is associated with more rapid introduction of new product varieties bydomestic firms, also in the Indian context.
14 It is in theory possible for the aggregate demand effect to be positive; forinstance, aggregate demand may increase because the aggregate price level declinesas a result of the lower costs of imported products from China. We view this positivechannel as second-order and in general presume that the aggregate demand effect,working in the standard Keynesian fashion, amplifies the potential negative directimpact of trade shocks. This is consistent with the results from our local labormarket analysis, which indicate that the sum of reallocation and demand effects isnegative.
Import Competition and the Great US Employment Sag S149
This content downloaded from 23.235.32.0 on Fri, 18 Dec 2015 07:23:05 AMAll use subject to JSTOR Terms and Conditions
We hypothesize that the direct impact at the local level, when scaled ap-propriately by the size of the industry in the local labor market, is com-parable to the direct impact estimated at the national level. The other threeeffects could potentially differ between the local and the aggregate levels.For instance, even though linked industries tend to co-locate ðe.g., Ellison,Glaeser, and Kerr 2010Þ, only part of the input-output linkages will bewithin the same local labor market, and the local impact on linked in-dustries may thus be much smaller than the aggregate effect.What makes our local labor market analysis informative is that local
reallocation and local demand effects are linked to their aggregate coun-terparts. Consider the reallocation effects first. Local labor markets are aplausible unit of analysis for the study of this channel. As a local labormarket experiences a loss of jobs when local industries contract in responseto rising import competition, there should be an adjustment of quantitieswithin the same labor market, despite the fact that prices are, at least in part,determined in the national or the international equilibrium. If the extent ofworker migration between local labor markets in response to these labormarket shocks is modest, as suggested by the evidence in Autor et al. ð2013,2014Þ and Notowidigdo ð2013Þ, this adjustment will take the form of re-allocation from declining industries to others within this locale.15
An important component of aggregate demand effects also plausiblytakes place within local labor markets. Mian and Sufi ð2014Þ show thatduring the Great Recession, US counties suffering large wealth lossesbecause of particularly severe declines in housing values also saw largedeclines in employment, consistent with local transmission of shocks toaggregate demand. Components of the aggregate demand effect that oper-ate at the national level will not be captured by our analysis, however, as theywill be common across locations. Our empirical strategy seeks to identifythe combined impact of reallocation and aggregate demand effects by quan-tifying how trade-induced shocks have an impact on a CZ’s employmentin nonexposed industries—defined as industries that are not exposed toimports from China either through direct product market competition orthrough interindustry purchases of intermediate inputs.Overall, this discussion suggests that our local labor market strategy
will provide an informative alternative estimate of the aggregate employ-ment impact of greater import competition from China, though this islikely to be an underestimate of the aggregate effects because it ignores partof the impact on linked industries and also excludes demand effects thathave no counterpart at the local level. In what follows, we will separately
15 Complementing this US-based evidence, Balsvik, Jensen, and Salvanes ð2014Þand Dix-Carneiro and Kovak ð2015Þ document weak labor mobility responses totrade-induced employment shocks in Norway and Brazil, respectively. As dis-cussed in footnote 9, there are some components of reallocation that might takeplace outside the local labor market.
S150 Acemoglu et al.
This content downloaded from 23.235.32.0 on Fri, 18 Dec 2015 07:23:05 AMAll use subject to JSTOR Terms and Conditions
compute the implied aggregate effects consisting of the sum of the directimpact and the impact on linked industries from our national industry-level analysis, and the total employment impact from the local analysis.
III. Empirical Approach
Sweeping economic reforms initiated in the 1980s and extended in the1990s permitted China to experience rapid industrial productivity growthðNaughton 2007;Hsieh andOssa 2011; Zhu 2012Þ, rural to urbanmigrationflows in excess of 150 million workers ðLi et al. 2012Þ, and massive capitalaccumulation ðBrandt, Van Biesebroeck, and Zhang 2012Þ, which togethercaused manufacturing to expand at a breathtaking pace. What did thisgrowth mean for US employment inside and outside manufacturing? Weseek to capture the changes in US industry employment induced by shiftsin China’s competitive position and the subsequent increase in its exports,accounting for input-output linkages between industries and other indi-rect channels of transmission. We subsequently consider how these labordemand shifts can be aggregated to national totals.
A. Industry Trade Shocks
Our baseline measure of trade exposure is the change in the importpenetration ratio for a US manufacturing industry over the period 1991–2011, defined as
DIPjt 5DMUC
j;t
Yj;91 1Mj;91 2 Ej;91
; ð1Þ
where for US industry j, DMUCj;t is the change in imports from China over
the period 1991–2011 ðwhich in most of our analysis we divide into twosubperiods, 1991–99 and 1999–2011Þ and Yj,91 1 Mj,91 2 Ej,91 is initialabsorption ðmeasured as industry shipments, Yj,91, plus industry imports,Mj,91, minus industry exports, Ej,91Þ. We choose 1991 as the initial year as itis the earliest period for which we have the requisite disaggregated bi-lateral trade data for a large number of country pairs that we can match toUS manufacturing industries.16 The quantity in ð1Þ can be motivated bytracing export supply shocks in China—due, for example, to productivitygrowth—through to demand for US output in the markets in which theUnited States and China compete. Supply-driven changes in China’s ex-ports will tend to reduce demand for and employment in US industries.
16 Our empirical approach requires data not just on US trade with China butalso on China’s trade with other partners. Specifically, we require trade data re-ported under Harmonized System ðHSÞ product codes in order to match with USStandard Industrial Classification ðSICÞ industries. The year 1991 is the earliest inwhich many countries began using the HS classification.
Import Competition and the Great US Employment Sag S151
This content downloaded from 23.235.32.0 on Fri, 18 Dec 2015 07:23:05 AMAll use subject to JSTOR Terms and Conditions
One concern about ð1Þ as a measure of trade exposure is that observedchanges in the import penetration ratio may in part reflect domestic shocksto US industries that affect US import demand. Even if the dominant factorsdriving China’s export growth are internal supply shocks, US industryimport demand shocks may still contaminate bilateral trade flows. Tocapture this supply-driven component in US imports from China, we in-strument for trade exposure in ð1Þ with the variable
DIPOjt 5DMOC
j;t
Yj;88 1Mj;88 2Xj;88
; ð2Þ
where DMOCj;t is the growth in imports from China in industry j during
the period t ðin this case 1991–2011 or some subperiod thereofÞ in eightother high-income countries excluding the United States.17 The denomi-nator in ð2Þ is initial absorption in the industry in 1988. The motivation forthe instrument in ð2Þ is that high-income economies are similarly exposedto growth in imports from China that is driven by supply shocks in thecountry. The identifying assumption is that industry import demandshocks are uncorrelated across high-income economies and that there areno strong increasing returns to scale in Chinese manufacturing ðwhichmight imply that US demand shocks will increase efficiency in the affectedChinese industries and induce them to export more to other high-incomecountriesÞ.18Figure A1 ðin app. AÞ plots the value in ð1Þ against the value in ð2Þ for
all US manufacturing industries at the four-digit level, as defined below,which is equivalent to the first-stage regression in our subsequent esti-mation without detailed controls. The coefficient is 0.98 and the t-statisticand R-squared are 7.0 and .62, respectively, indicating the strong predictivepower of import growth in other high-income countries for US importgrowth from China.19
17 These countries are Australia, Denmark, Finland, Germany, Japan, NewZealand, Spain, and Switzerland, which represent all high-income countries forwhich we can obtain disaggregated bilateral trade data at the HS level back to 1991.
18 See Autor et al. ð2013, 2014Þ for further discussion of threats to identificationusing this instrumentation approach.
19 Modeling the China trade shock as in eq. ð1Þ does not exclude the role of globalproduction chains. During the 1990s and 2000s, approximately half of China’s man-ufacturing exports were produced by export processing plants, which import partsand components from abroad and assemble these inputs into final export goodsðFeenstra and Hanson 2005Þ. Our instrumental variable strategy does not requireChina to be the sole producer of the goods it ships abroad; rather, we require thatthe growth of its grossmanufacturing exports is driven largely by factors internal toChina ðas opposed to shocks originating in the United StatesÞ, as would be the caseif, plausibly, the recent expansion of global production chains involving China isprimarily the result of its hugely expanded manufacturing capacity.
S152 Acemoglu et al.
This content downloaded from 23.235.32.0 on Fri, 18 Dec 2015 07:23:05 AMAll use subject to JSTOR Terms and Conditions
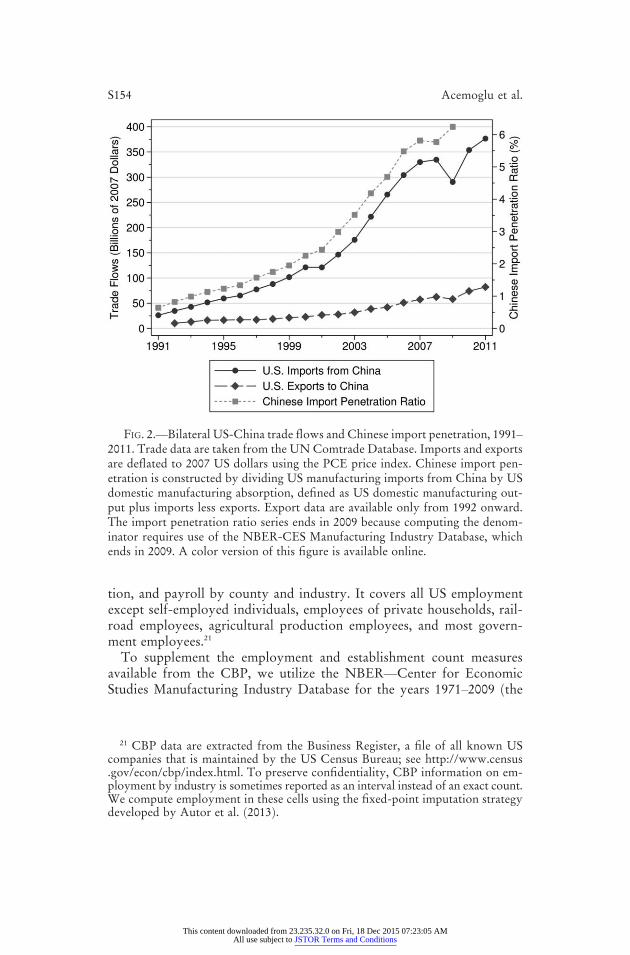
A potential concern about our analysis is that we largely ignore US ex-ports to China, focusing primarily on trade flows in the opposite direction.This is for the simple reason that our instrument, by construction, has lit-tle predictive power for US exports to China. Nevertheless, to the extentthat our instrument is valid, our estimates will correctly identify the directand indirect effects of increased import competition from China in par-ticular because there is no reason for trade to balance at the industry orregion level, so we do not need to simultaneously treat exports to China inour analysisÞ. We also take comfort from the fact that imports from Chinaare much larger—approximately five times as large—than manufacturingexports from the United States to China ðfig. 2Þ.20
B. Data Sources
Data on international trade for 1991–2011 are from the UN ComtradeDatabase ðhttp://comtrade.un.org/db/default.aspxÞ, which gives bilateralimports for six-digit Harmonized Commodity Description and CodingSystem ðHSÞ products. To concord these data to four-digit Standard In-dustrial Classification ðSICÞ industries, we first apply the crosswalk inPierce and Schott ð2012Þ, which assigns 10-digit HS products to four-digitSIC industries ðat which level each HS product maps into a single SICindustryÞ, and aggregate up to the level of six-digit HS products and four-digit SIC industries ðat which level some HS products map into multipleSIC industriesÞ. To perform this aggregation, we use data on US importvalues at the 10-digit HS level, averaged over 1995–2005. The crosswalkassigns HS codes to all but a small number of SIC industries. We thereforeslightly aggregate the four-digit SIC industries so that each of the resulting397 manufacturing industries matches to at least one trade code and noneis immune to trade competition by construction. To ensure compatibilitywith the additional data sources below, we also aggregate together a fewadditional industries such that our final data set contains 392 manufac-turing industries. All import amounts are inflated to 2007 US dollars usingthe Personal Consumption Expenditure ðPCEÞ deflator.Our main source of data on US employment is County Business Pat-
terns ðCBPÞ for the years 1991, 1999, 2007, and 2011. CBP is an annualdata series that provides information on employment, firm size distribu-
20 A second rationale for our import focus is data constraints. Many US exportsto China are in the form of indirect exports via third countries or embodied servicesof intellectual property, management expertise, or other activities involving skilledlabor. These indirect and service exports are difficult to measure because the directexporter may be a foreign affiliate of a US multinational or because they occur via achain of transactions involving third countries. As such exports tend to be intensivein highly skilled labor, they may have only modest direct impacts on the employ-ment of production workers, though their indirect impacts are difficult to gaugewith available data.
Import Competition and the Great US Employment Sag S153
This content downloaded from 23.235.32.0 on Fri, 18 Dec 2015 07:23:05 AMAll use subject to JSTOR Terms and Conditions
tion, and payroll by county and industry. It covers all US employmentexcept self-employed individuals, employees of private households, rail-road employees, agricultural production employees, and most govern-ment employees.21
To supplement the employment and establishment count measuresavailable from the CBP, we utilize the NBER—Center for EconomicStudies Manufacturing Industry Database for the years 1971–2009 ðthe
21 CBP data are extracted from the Business Register, a file of all known UScompanies that is maintained by the US Census Bureau; see http://www.census.gov/econ/cbp/index.html. To preserve confidentiality, CBP information on em-ployment by industry is sometimes reported as an interval instead of an exact count.We compute employment in these cells using the fixed-point imputation strategydeveloped by Autor et al. ð2013Þ.
FIG. 2.—Bilateral US-China trade flows and Chinese import penetration, 1991–2011. Trade data are taken from the UNComtrade Database. Imports and exportsare deflated to 2007 US dollars using the PCE price index. Chinese import pen-etration is constructed by dividing US manufacturing imports from China by USdomestic manufacturing absorption, defined as US domestic manufacturing out-put plus imports less exports. Export data are available only from 1992 onward.The import penetration ratio series ends in 2009 because computing the denom-inator requires use of the NBER-CES Manufacturing Industry Database, whichends in 2009. A color version of this figure is available online.
S154 Acemoglu et al.
This content downloaded from 23.235.32.0 on Fri, 18 Dec 2015 07:23:05 AMAll use subject to JSTOR Terms and Conditions
latter being the latest year availableÞ.22 These data allow us to explore labormarket outcomes not reported in the CBP, as well as to perform a falsifi-cation exercise not possible in the CBP. We additionally draw on theNBER-CES data to compute measures of the production structure in eachindustry, subsequently used as controls, including production workers as ashare of total employment, the log averagewage, the ratio of capital to valueadded, computer investment as a share of total investment, and high-techequipment as a share of total investment. Additionally, we create industrypretrend controls for the years 1976–91, including the changes in industrylog average wages and in the industry share of total US employment.A final data source used in our analysis is the 1992 input-output table
for the US economy ðfrom the US Bureau of Economic Analysis, http://www.bea.gov/industry/io_benchmark.htmÞ, which we use to trace up-stream and downstream demand linkages between industries both insideand outside of US manufacturing. We discuss our application of input-output tables in more detail below.
IV. Estimates of the Direct Impact of TradeExposure on Employment
Webegin by estimating the direct effect of trade exposure on employmentover the period 1991–2011 using aggregate, industry-level regressions.
A. Baseline Results for National Industries
Our initial specification has the following form:
DLjt 5 at 1 b1DIPjt 1 gXj0 1 ejt; ð3Þwhere DLjt is 100 times the annual log change in employment in industry jover time period t; DIPjt is 100 times the annual change in import pene-tration from China in industry j over period t as defined in ð1Þ; Xj0 is a setof industry-specific start-of-period controls ðspecified laterÞ; at is a period-specific constant; and ejt is an error term. We fit this equation separately forstacked first differences covering the two subperiods 1991–99 and 1999–2011, where in some specifications we shorten the second subperiod to1999–2007 in order to evaluate employment impacts prior to the onset ofthe Great Recession. Variables specified in changes ðdenoted by DÞ areannualized since equation ð3Þ is estimated on periods of varying lengths.The elements in the vector of controls Xj0, when included, are each nor-malized with mean zero so that the constant term in ð3Þ reflects the change
22 The NBER-CES database contains annual industry-level data from 1958–2009 on output, employment, payroll and other input costs, investment, capitalstocks, total factor productivity, and various industry-specific price indexesðBecker, Gray, and Marvakov 2013Þ. Data and documentation are at http://www.nber.org/data/nberces5809.html.
Import Competition and the Great US Employment Sag S155
This content downloaded from 23.235.32.0 on Fri, 18 Dec 2015 07:23:05 AMAll use subject to JSTOR Terms and Conditions
in the outcome variable conditional only on the variable of interest, DIPjt.Most outcome variables are measured at the level of 392 four-digit manu-facturing industries, while later models also estimate spillovers to 87 non-manufacturing industries. Regression estimates are weighted by start-of-period industry employment, and standard errors are clustered at thethree-digit industry level to allow for arbitrary error correlations withinlarger industries over time.23
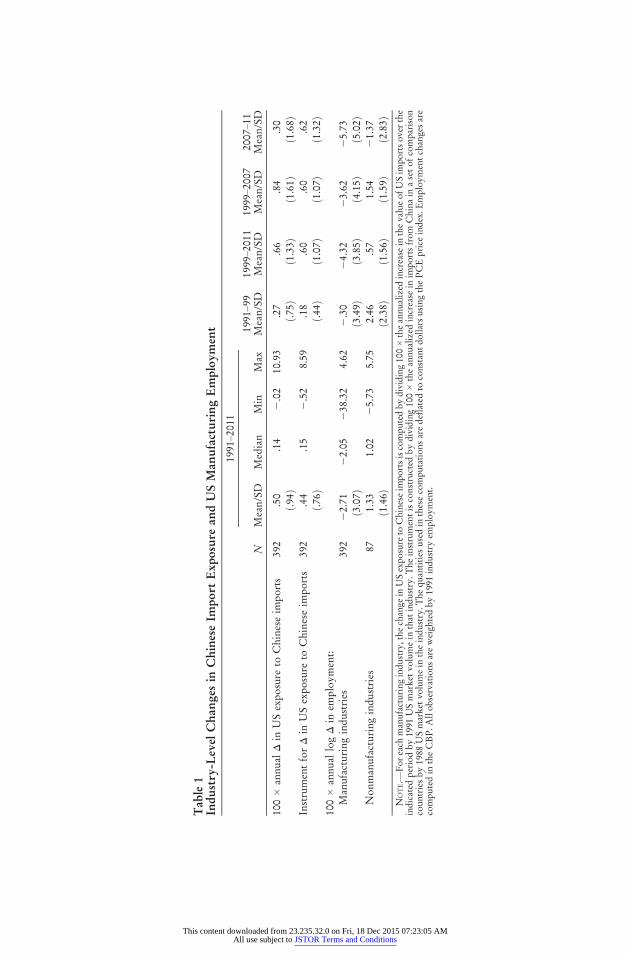
Table 1 summarizes the import exposure and employment variablesused in initial estimates of equation ð3Þ. The employment-weighted meanindustry saw Chinese import exposure rise by 0.5 percentage points peryear between 1991 and 2011, with more rapid penetration during 1999–2007 than during 1991–99: 0.8 versus 0.3 percentage points, respectively.Growth from 2007 to 2011, at 0.3 percentage points per year, indicates amarked slowdown in import expansion in the late 2000s. The slowdownduring that period is the combined effect of a steep decline in US trade in2008 and 2009 and an equally dramatic recovery in 2010 ðLevchenko, Lewis,and Tesar 2010Þ, which together left import penetration rates modestlyhigher.24
Changes in import penetration are highly right skewed across manu-facturing industries, with the mean increase exceeding the median by afactor of 3.5. We find a similar pattern of import penetration change andskewness in the other high-income countries used to construct the importpenetration instrument, where this skewness reflects China’s strong com-parative advantage in labor-intensive industries. Table 1 also shows that themanufacturing decline accelerated throughout the sample: the averageindustry contracted by 0.3 log points per year between 1991 and 1999, by3.6 log points per year between 1999 and 2007, and by 5.7 log points peryear in the final period 2007–11. The within-industry growth rate of non-manufacturing employment also slowed across the three subperiods of oursample, but the deceleration was not nearly as pronounced as in manu-facturing.Table 2 presents a simple stacked first-difference model for the two time
periods 1991–99 and 1999–2011, with the change in import penetrationand a dummy for each time period as the only regressors. Alongside theseestimates, we also present results from stacking the time periods 1991–99
23 There are 135 three-digit manufacturing industry clusters encompassing the392 four-digit industries. Because our nonmanufacturing data have already beenextensively aggregated to 87 industries for concordance with the BEA input-outputtable, we treat each of the 87 nonmanufacturing industries as a single cluster.
24 Explanations for the excess sensitivity of trade flows during the Great Reces-sion include the role of shocks to the credit market and trade finance ðAmiti andWeinstein 2011; Chor and Manova 2012Þ and to global production networksðLevchenko et al. 2010Þ. Other explanations dwell on the large drop in durable goodspending during the crisis ðEaton et al. 2013Þ.
S156 Acemoglu et al.
This content downloaded from 23.235.32.0 on Fri, 18 Dec 2015 07:23:05 AMAll use subject to JSTOR Terms and Conditions
Tab
le1
Indu
stry-L
evel
Cha
nges
inChine
seIm
port
Exp
osur
ean
dUSMan
ufacturing
Employ
men
t
1991–2011
NMean/SD
Median
Min
Max
1991–99
Mean/SD
1999–2011
Mean/SD
1999–2007
Mean/SD
2007–11
Mean/SD
100�
annual
Din
USexposure
toChineseim
ports
392
.50
.14
2.02
10.93
.27
.66
.84
.30
ð.94Þ
ð.75Þ
ð1.33Þ
ð1.61Þ
ð1.68Þ
InstrumentforDin
USexposure
toChineseim
ports
392
.44
.15
2.52
8.59
.18
.60
.60
.62
ð.76Þ
ð.44Þ
ð1.07Þ
ð1.07Þ
ð1.32Þ
100�
annual
logDin
employment:
Manufacturingindustries
392
22.71
22.05
238.32
4.62
2.30
24.32
23.62
25.73
ð3.07Þ
ð3.49Þ
ð3.85Þ
ð4.15Þ
ð5.02Þ
Nonmanufacturingindustries
871.33
1.02
25.73
5.75
2.46
.57
1.54
21.37
ð1.46Þ
ð2.38Þ
ð1.56Þ
ð1.59Þ
ð2.83Þ
NOTE.—
Foreach
manufacturingindustry,thechange
inUSexposure
toChineseim
portsiscomputedbydividing100�theannualized
increase
inthevalueofUSim
portsoverthe
indicated
periodby1991
USmarket
volumein
that
industry.Theinstrumentisconstructed
bydividing100�
theannualized
increase
inim
portsfrom
Chinain
asetofcomparison
countriesby1988
USmarket
volumein
theindustry.T
hequantities
usedin
thesecomputationsaredefl
ated
toconstantdollarsusingthePCEprice
index.E
mploymentchangesare
computedin
theCBP.A
llobservationsareweigh
tedby1991
industry
employment.
This content downloaded from 23.235.32.0 on Fri, 18 Dec 2015 07:23:05 AMAll use subject to JSTOR Terms and Conditions
Tab
le2
Effectof
Impo
rtExp
osur
eon
Log
Employ
men
tin
USMan
ufacturing
Indu
stries:O
LSan
d2S
LSEstim
ates
Stacked
DifferencesðN
5784Þ
SeparatelybyPeriodðN
5392Þ
1991–2011
ð1Þ
ð2Þ
ð3Þ
1991–2
007
ð4Þ
1991–99
ð5Þ
1999–2011
ð6Þ
1999–2007
ð7Þ
1991–2011
ð8Þ
100�
annual
Din
USexposure
toChineseim
ports
2.81***
21.30***
21.24***
22.30**
21.16***
21.12***
21.49***
ð.16Þ
ð.41Þ
ð.37Þ
ð1.12Þ
ð.37Þ
ð.34Þ
ð.47Þ
1f1991–99g
2.30
2.08
.05
.04
ð.37Þ
ð.36Þ
ð.36Þ
ð.36Þ
1f1999–2011g
24.32***
23.79***
23.46***
ð.37Þ
ð.33Þ
ð.33Þ
1f1999–2007g
22.58***
ð.38Þ
Constant
.32
23.55***
22.68***
21.96***
ð.43Þ
ð.34Þ
ð.39Þ
ð.27Þ
Estim
ationmethod
OLS
OLS
2SLS
2SLS
2SLS
2SLS
2SLS
2SLS
NOTE.—
Columns1–
4reportresultsfrom
stackinglogem
ploymentchangesandchangesin
USexposure
toChineseim
portsovertheperiods1991–9
9andeither
1999
–2011
or1999
–2007,as
indicated
ðN5
7845
392four-digitmanufacturingindustries
�tw
operiodsÞ.
Columns5–8reportresultsfrom
regressingtheem
ploymentchange
overthe
indicated
periodonthechange
inUSexposure
toChineseim
portsoverthesameperiodðN
5392Þ.E
mploymentchangesarecomputedin
theCBPandareexpressed
as100�
annuallogchanges.In
2SLSspecifications,thechange
inUSim
portexposure
isinstrumentedas
described
inthetext.Inallspecifications,observationsareweigh
tedby1991
employment.Standarderrors
inparentheses
areclustered
on135three-digitindustries
inallspecifications.
**p<.05.
***
p<.01.
This content downloaded from 23.235.32.0 on Fri, 18 Dec 2015 07:23:05 AMAll use subject to JSTOR Terms and Conditions
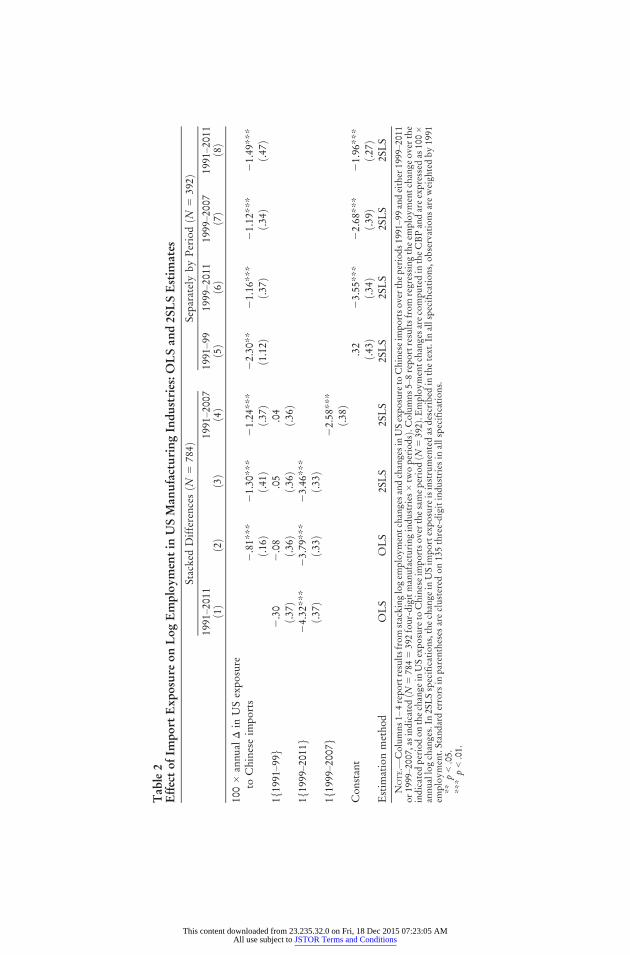
and 1999–2007 and from fitting the model separately for the three sub-periods 1991–99, 1999–2011, and 1999–2007. These additional specifica-tions permit inspection of results before and after the commencement ofthe 2000s US employment sag and allow for comparison of the results forthe 2000s with and without including the Great Recession years. We alsopresent results for the single long difference, 1991–2011, for comparisonagainst the stacked first differences.In column 1, which excludes the import penetration variable, the time
dummies reflect the ðemployment-weightedÞmean annualwithin-industrychange in employment in each period. Column 2 adds the observed importexposure measure without instrumentation. This variable is negative andhighly significant, consistent with the hypothesis that rising import pen-etration lowers domestic industry employment. Nevertheless, as notedabove, this OLS point estimate could be biased because growth in importpenetration is driven partly by changes in domestic supply and demand.Column 3 mitigates this simultaneity bias by instrumenting the observedchanges in industry import penetration with contemporaneous changes inother-country China imports as specified in equation ð2Þ above. The esti-mate in column 3 implies that a 1 percentage point rise in industry importpenetration reduces domestic industry employment by 1.3 percentagepoints ðt-ratio of 3.2Þ. Column 4, which stacks the periods 1991–99 and1999–2007, shows that the coefficient of import penetration is very similarif we restrict attention to the years preceding the Great Recession.The remaining columns of table 2 present bivariate estimates of this
relationship separately by subperiod. The coefficient on trade exposure isnegative and statistically significant in all time periods and is largest inabsolute value for 1991–99 and smallest for 1999–2007. Even though thesensitivity of employment to import penetration is greater before 2000,the much faster growth in China’s imports after 2000 produces an overallimpact of trade on employment that, as we discuss below, is considerablylarger in the latter period. The sensitivity of employment to trade for 1999–2011 is similar to the estimate for 1999–2007, despite the onset of the globalfinancial crisis in 2007 and the associated dislocation of worldwide tradepatterns.25
A simple long-difference model for the change in manufacturing em-ployment over the full 1991–2011 period ðcol. 8Þ also supports a negativerelationship between import penetration and US manufacturing employ-
25 In the United States, imports plus exports divided by GDP fell by a stunning22% from the first quarter of 2008 to the first quarter of 2009. However, importsfully recovered in 2010 and continued to grow in 2011. The exaggerated cyclicalswings in trade surrounding the Great Recession thus mix with the continuedsecular growth in China’s exports to the United States over the period.
Import Competition and the Great US Employment Sag S159
This content downloaded from 23.235.32.0 on Fri, 18 Dec 2015 07:23:05 AMAll use subject to JSTOR Terms and Conditions
ment. The coefficient estimates in column 3, for the stacked first differ-ences, and column 8, for the long time difference, are quite similar, reflect-ing strong persistence in the growth in China’s import penetration withinindustries. Replacing stacked first differences with the long difference mayremove cyclical variation in the data, accounting for the mildly larger co-efficient estimates in the latter case.Returning to the results in column 3 of table 2, we evaluate the economic
magnitude of these estimates by constructing counterfactual changes inemployment that would have occurred in the absence of increases inChinese import competition. Using equation ð3Þ, we write the differencebetween actual and counterfactual manufacturing employment in year t as
DLcft 5 o
j
Ljtð12 e2b1DIP∼
jtÞ; ð4Þ
where b1 is the 2SLS coefficient estimate from ð3Þ and DfIPjt is the increasein import penetration from China that we attribute to China’s improvingcompetitive position in industry j between 1991 ðor 1999Þ and year t.Following Autor et al. ð2013Þ, we estimate DfIPjt by multiplying the ob-served increase in import penetration DIPjt with the partial R-squaredfrom the first-stage regression of ð1Þ on the instrument in ð2Þ, which hasa value of 0.56 in our baseline specification in column 3 in table 2. Whenour instrument is valid and there is no measurement error, this partialR-squared adjusted DfIPjt variable is a consistent estimate of the contri-bution of Chinese import supply shocks to changes in import penetration.In constructing the counterfactuals, we further assume that all other fac-tors, including observed covariates and unobserved shocks captured by theerror term in ð3Þ, would be unaffected by the artificially imposed reductionin the growth of import penetration from China.We collect these counterfactual estimates in table 8 below, where we
compare employment estimates across three different estimation strategies.The first row of table 8 reports counterfactual employment differencesimplied by the estimates in table 2, where we evaluate changes for 1991–99,1999–2011, and the entire 1991–2011 period. Using coefficient estimatesfrom column 3, we calculate that had import penetration from China re-mained unchanged between 1991 and 2011, manufacturing employmentwould have fallen by 837,000 fewer jobs over the full 1991–2011 spanand by 560,000 fewer jobs during the employment sag era of 1999–2011.Observed manufacturing employment changes over these time periodswere25.6 million workers ð11.4 million2 17.0 millionÞ and25.8 millionworkers ð11.4million2 17.2millionÞ, respectively. The larger quantity forthe second period is indicative of the modest growth in manufacturingemployment of 200,000 workers that occurred between 1991 and 1999. Byshutting down China’s import growth, the contraction of US manufac-
S160 Acemoglu et al.
This content downloaded from 23.235.32.0 on Fri, 18 Dec 2015 07:23:05 AMAll use subject to JSTOR Terms and Conditions
turing employment suggested by our estimates would have been 14.9 per-centage points less over 1991–2011 and 9.7 percentage points less for theperiod after 1999. It is also worth noting that counterfactual reductionsin employment for the period 1991–2007—based on the specification incolumn 4 of table 2—amount to 853,000, quite similar to our estimates for1991–2011.
B. Comparison to Other Estimates in the Literature
How do our estimates of the direct effect of import competition on man-ufacturing employment compare with those found in the literature? Thereare few estimates to consider, as the majority of work on the labor marketimplications of globalization addresses not the absolute employment ef-fects of trade but its impact on relative wages and relative employmentlevels by skill ðe.g., Harrison, McLaren, and McMillan 2011Þ. Trade im-pacts on absolute employment levels are a less common object of study,perhaps reflectingmodeling conventions that impose inelastic labor supplyand full employment.In an influential treatment of trade impacts on US manufacturing,
Bernard, Jensen, and Schott ð2006Þ estimate that import penetration fromlow-income countries—with China being the largest member of thisgroup by far—accounts for 14% of the total decline in manufacturingemployment of 675,000 workers that occurred between 1977 and 1997.26
Their specification differs from ours, making a direct comparison of thetwo sets of results difficult to perform. They regress the change in logemployment at the level of the manufacturing plant ðrather than industryÞon the initial level ðrather than changeÞ of the share of low-income coun-tries in industry imports ðrather than the import penetration rateÞ. Despitethese differences, Bernard et al. find a relatively high sensitivity of employ-ment to import competition. But over their period of study, the annualincrease in import penetration from low-income countries in US manu-facturingwas only 0.09 percentage points,27whereas over our sample periodthe annual increase in import penetration from China alone was 0.50 per-
26 In related work, Artuc, Chaudhuri, and McLaren ð2010Þ evaluate how coststo workers of moving between sectors dampen the employment response tochanges in trade barriers, and Muendler and Becker ð2010Þ and Harrison andMcMillan ð2011Þ estimate the responsiveness of employment in multinationalcompanies to changes in foreign wages. This work tends to emphasize the elas-ticity of employment with respect to changes in trade barriers or foreign pro-duction costs, rather than producing estimates of aggregate impacts of foreigncompetition on employment.
27 This figure comes from information provided in table 2 of Bernard et al.ð2006Þ.
Import Competition and the Great US Employment Sag S161
This content downloaded from 23.235.32.0 on Fri, 18 Dec 2015 07:23:05 AMAll use subject to JSTOR Terms and Conditions
centage points ðtable 1Þ. Had their much lower level of import growthobtained over our sample period, the reduction in manufacturing job lossimplied by our coefficient estimates would have been only one-fifth aslarge.28 One reason why Bernard et al.’s analysis may produce higher es-timates of the impact of imports on employment than ours is that theystudy plant-level data as compared to our industry-level regressions. Ag-gregating across plants within an industry is preferable in this instance be-cause it avoids confounding aggregate effects with within-industry reallo-cation, which take place as some workers may exit declining plants to takejobs with establishments in their same sector ðconsistent with the results inAutor et al. ½2014�Þ.Pierce and Schott ð2015Þ use a difference-in-difference strategy to test
whether after 2001 manufacturing employment fell by more in industriesthat were more exposed to China’s WTO accession. They measure thispotential increase in exposure to China trade using the difference betweenthe US MFN ðmost-favored-nationÞ tariff and the US non-MFN tariff, towhich China was potentially subject prior to becoming a WTO memberand whose level was substantially higher than the MFN duty. Pierce andSchott thus identify the growth in China trade after 2001 using the no-tional reduction in US trade barriers confronting China. A complicationwith this approach is that the United States granted China MFN statuson a renewable basis in 1980, 2 decades prior to the country joining theWTO. The US non-MFN tariff is a meaningful predictor of China’s pre-2001 trade only to the extent that there was genuine risk the US govern-ment would choose not to renew China’s MFN privileges, an eventualitythat Congress discussed annually but that never materialized. Pierce andSchott estimate that China’s WTO accession reduced post-2001 manu-facturing employment by 15.1 log points in exposed industries relative tononexposed industries.29 Our estimates, which identify the impact of growthin China’s imports based on the common component of the country’s ex-port expansion across high-income markets, imply that had there been noincrease in import penetration from China after 1999, the 2011 level ofemployment would have been 4.9% higher ð0.560 million/11.4 millionÞthan it otherwise would have been. Comparing our results in table 2 tothose of Bernard et al. ð2006Þ and Pierce and Schott ð2015Þ thus suggeststhat our estimates for the direct industry-level employment effects of Chinatrade are relatively modest.
28 This ratio is based on the calculation ð12 e21:30�:56�:09Þ=ð12 e21:30�:56�:50Þ50:21, where the value 21.30 is the coefficient from col. 3 of table 2 and the value.56 discounts observed changes in import penetration by the partial R-squared ofthe first stage.
29 This estimate is from col. 3 of table 1 of their paper, which we view as closestin spirit to the specifications in our article.
S162 Acemoglu et al.
This content downloaded from 23.235.32.0 on Fri, 18 Dec 2015 07:23:05 AMAll use subject to JSTOR Terms and Conditions
C. Controlling for Industry Confounds and Pretrends
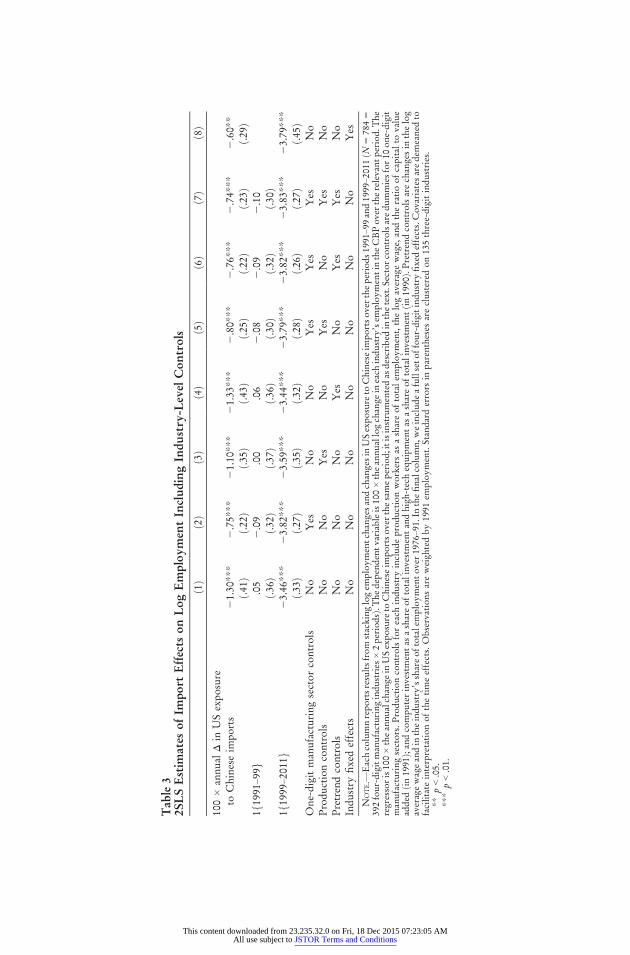
A challenge for our analysis is that industries subject to greater importcompetition may be exposed to other economic shocks that are correlatedwith China trade. We begin to address this concern in table 3 by incor-porating controls for potential industry confounds. We additionally offera set of falsification tests.We consider three groups of control variables. First, we probe the ro-
bustness of our results by including dummies for 10 one-digit manufac-turing sectors. Since our regressions are in first differences, the inclusionof these dummies amounts to allowing for differential trends across theseone-digit sectors. Regressions including these dummies therefore identifythe industry-level impacts of trade exposure while purging common trendswithin the one-digit sectors and using only variation in import growthacross industries with relatively similar skill intensities.Technological progress within manufacturing has been most rapid in
recent decades in computer and skill-intensive sectors ðDoms, Dunne, andTroske 1997; Autor, Katz, and Krueger 1998Þ. To capture the extent towhich industries are exposed to technical change, we next add a second setof control variables, drawn from the NBER-CES database, measuring theintensity of their use of production labor and capital. These variables,summarized in table A1, include the share of production workers in totalemployment, the log of the average wage, the ratio of capital to valueadded ðall measured in 1991Þ, as well as computer and high-tech equip-ment investment in 1990, each expressed as a share of total 1990 invest-ment.US manufacturing as a share of employment has been declining since
the 1950s, and the number of manufacturing employees has also trendeddownward since the 1980s. This long-standing secular trend highlights aconcern that the correlation we document between rising industry tradepenetration and contemporaneous, within-industry declines in manufac-turing employment during 1991–2011 could potentially predate the recentrise in import exposure. In that case, our estimates would likely overstatethe impact of trade exposure in the current period. We therefore finallyadd measures of pretrends in industry employment and earnings in table 3,specifically the change in the industry’s share of total US employment andthe change in the log of the industry average wage, both measured over theinterval 1976–91 ðtable A1Þ.The first seven columns of table 3 permute among combinations of these
three groups of industry controls: the one-digit sector dummies, industry-level controls for production structure, and industry-level controls forpretrends. Column 1 replicates results from column 3 of table 2 to serve as abenchmark. Among the additional groups of covariates, only the one-digitsector dummies have a substantial impact on the point estimates, reducing
Import Competition and the Great US Employment Sag S163
This content downloaded from 23.235.32.0 on Fri, 18 Dec 2015 07:23:05 AMAll use subject to JSTOR Terms and Conditions
Tab
le3
2SLSEstim
ates
ofIm
port
Effects
onLog
Employ
men
tInclud
ingIndu
stry-L
evel
Con
trols
ð1Þ
ð2Þ
ð3Þ
ð4Þ
ð5Þ
ð6Þ
ð7Þ
ð8Þ
100�
annual
Din
USexposure
toChineseim
ports
21.30***
2.75***
21.10***
21.33***
2.80***
2.76***
2.74***
2.60**
ð.41Þ
ð.22Þ
ð.35Þ
ð.43Þ
ð.25Þ
ð.22Þ
ð.23Þ
ð.29Þ
1f1991–99g
.05
2.09
.00
.06
2.08
2.09
2.10
ð.36Þ
ð.32Þ
ð.37Þ
ð.36Þ
ð.30Þ
ð.32Þ
ð.30Þ
1f1999–2011g
23.46***
23.82***
23.59***
23.44***
23.79***
23.82***
23.83***
23.79***
ð.33Þ
ð.27Þ
ð.35Þ
ð.32Þ
ð.28Þ
ð.26 Þ
ð.27Þ
ð.45Þ
One-digitmanufacturingsectorcontrols
No
Yes
No
No
Yes
Yes
Yes
No
Productioncontrols
No
No
Yes
No
Yes
No
Yes
No
Pretrendcontrols
No
No
No
Yes
No
Yes
Yes
No
Industry
fixedeffects
No
No
No
No
No
No
No
Yes
NOTE.—
Eachcolumnreportsresultsfrom
stackinglogem
ploymentchangesandchangesin
USexposure
toChineseim
portsovertheperiods1991–9
9and1999
–2011ðN
57845
392four-digitmanufacturingindustries
�2periodsÞ.
Thedependentvariableis100�theannuallogchange
ineach
industry’sem
ploymentin
theCBPovertherelevantperiod.T
he
regressoris100�theannualchange
inUSexposure
toChineseim
portsoverthesameperiod;itisinstrumentedas
described
inthetext.Sectorcontrolsaredummiesfor10
one-digit
manufacturingsectors.Productioncontrolsforeach
industry
includeproductionworkersas
ashareoftotalem
ployment,thelogaveragewage,
andtheratioofcapital
tovalue
added
ðin1991
Þ;andcomputerinvestmentas
ashareoftotalinvestmentandhigh-techequipmentas
ashareoftotalinvestmentðin
1990
Þ.Pretrendcontrolsarechangesin
thelog
averagewageandin
theindustry’sshareoftotalemploymentover1976–9
1.In
thefinalcolumn,w
eincludeafullsetoffour-digitindustry
fixedeffects.Covariates
aredem
eaned
tofacilitate
interpretationofthetimeeffects.Observationsareweigh
tedby1991
employment.Standarderrors
inparentheses
areclustered
on135three-digitindustries.
**p<.05.
***
p<.01.
This content downloaded from 23.235.32.0 on Fri, 18 Dec 2015 07:23:05 AMAll use subject to JSTOR Terms and Conditions

the ðinstrumentedÞ estimates by about 40%.30 Though the inclusion of thesectoral dummies is an important robustness check for our results, thereare two reasons why these specifications may underestimate the impactof Chinese import competition. First, trade exposure at the four-digitindustry level is likely to be measured with error, and the inclusion of theone-digit sector dummies will then cause significantly greater attenuationof our estimates of the impact of Chinese import growth. Second, if there isa significant increase in imports in some industries within a one-digit sectorðsay, in women’s dresses within textilesÞ, then employers in other similarindustries within this broad sector ðsay, women’s blouses and shirts, alsowithin textilesÞ may anticipate greater competition both from the sub-stitutes already being imported from China and also from future waves ofChinese imports and thuswill bemore likely to downsize and close existingplants and less likely to open new plants. By contrast, neither the pro-duction nor the pretrend variables have an important effect on the mag-nitude or precision of the coefficient of interest. As a further robustnesstest, column 8 includes a full set of dummies for the 392 four-digit manu-facturing industries in our data. These variables serve as industry-specifictrends in our stacked first-difference specification, so the effect of importcompetition on industry employment in this specification is identified bychanges in the growth rates of industry employment and import penetra-tion in 1999–2011 relative to 1991–99. Remarkably, relative to specifica-tions that include one-digit sector dummies, the addition of an exhaustiveset of industry-specific trends onlymodestly reduces the point estimate andprecision of the coefficient of interest, thus highlighting the robustness ofthe relationship. In summary, while our preferred industry-level modelfrom column 3 of table 2 allows for an impact of Chinese trade competitionon employment both within and across broad manufacturing subsectors,the estimates in table 3 document that a sizable negative employment ef-fect remains even when focusing only on the within-subsector or within-industry, over-time variation in trade exposure.As a falsification exercise, table 4 reports results from a regression of
changes in industry employment in earlier decades on the instrumentedchange in industry import exposure between 1991 and 2011. It would beproblematic for our identification strategy if future growth in Chineseimport exposure predicted industry employment declines in the era prior
30 Quantitatively, the specification in col. 2 of table 3 implies that had importpenetration from China remained unchanged between 1991 and 2011, manufac-turing employment would have fallen by 463,000 jobs over the full 1991–2011 spanand by 307,000 jobs between 1999 and 2011; these figures are about 45% lowerthan our baseline numbers.
Import Competition and the Great US Employment Sag S165
This content downloaded from 23.235.32.0 on Fri, 18 Dec 2015 07:23:05 AMAll use subject to JSTOR Terms and Conditions
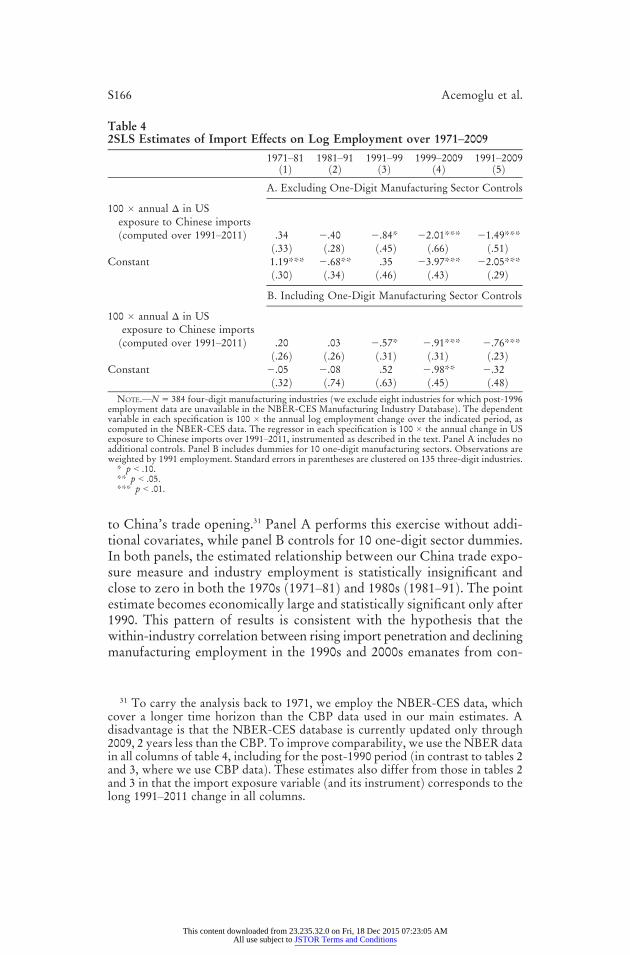
to China’s trade opening.31 Panel A performs this exercise without addi-tional covariates, while panel B controls for 10 one-digit sector dummies.In both panels, the estimated relationship between our China trade expo-sure measure and industry employment is statistically insignificant andclose to zero in both the 1970s ð1971–81Þ and 1980s ð1981–91Þ. The pointestimate becomes economically large and statistically significant only after1990. This pattern of results is consistent with the hypothesis that thewithin-industry correlation between rising import penetration and decliningmanufacturing employment in the 1990s and 2000s emanates from con-
Table 42SLS Estimates of Import Effects on Log Employment over 1971––2009
1971–81ð1Þ
1981–91ð2Þ
1991–99ð3Þ
1999–2009ð4Þ
1991–2009ð5Þ
A. Excluding One-Digit Manufacturing Sector Controls
100 � annual D in USexposure to Chinese importsðcomputed over 1991–2011Þ .34 2.40 2.84* 22.01*** 21.49***
ð.33Þ ð.28Þ ð.45Þ ð.66Þ ð.51ÞConstant 1.19*** 2.68** .35 23.97*** 22.05***
ð.30Þ ð.34Þ ð.46Þ ð.43Þ ð.29ÞB. Including One-Digit Manufacturing Sector Controls
100 � annual D in USexposure to Chinese importsðcomputed over 1991–2011Þ .20 .03 2.57* 2.91*** 2.76***
ð.26Þ ð.26Þ ð.31Þ ð.31Þ ð.23ÞConstant 2.05 2.08 .52 2.98** 2.32
ð.32Þ ð.74Þ ð.63Þ ð.45Þ ð.48ÞNOTE.—N5 384 four-digit manufacturing industries ðwe exclude eight industries for which post-1996
employment data are unavailable in the NBER-CES Manufacturing Industry DatabaseÞ. The dependentvariable in each specification is 100 � the annual log employment change over the indicated period, ascomputed in the NBER-CES data. The regressor in each specification is 100 � the annual change in USexposure to Chinese imports over 1991–2011, instrumented as described in the text. Panel A includes noadditional controls. Panel B includes dummies for 10 one-digit manufacturing sectors. Observations areweighted by 1991 employment. Standard errors in parentheses are clustered on 135 three-digit industries.
* p < .10.** p < .05.*** p < .01.
31 To carry the analysis back to 1971, we employ the NBER-CES data, whichcover a longer time horizon than the CBP data used in our main estimates. Adisadvantage is that the NBER-CES database is currently updated only through2009, 2 years less than the CBP. To improve comparability, we use the NBER datain all columns of table 4, including for the post-1990 period ðin contrast to tables 2and 3, where we use CBP dataÞ. These estimates also differ from those in tables 2and 3 in that the import exposure variable ðand its instrumentÞ corresponds to thelong 1991–2011 change in all columns.
S166 Acemoglu et al.
This content downloaded from 23.235.32.0 on Fri, 18 Dec 2015 07:23:05 AMAll use subject to JSTOR Terms and Conditions
temporaneous trade shocks rather than from long-standing factors driv-ing industry decline.
D. Additional Employment and Establishment-Level Outcomes
We have so far focused on the effects of trade exposure on industry em-ployment, which is but one margin along which industries adjust. Othersinclude the wage bill, establishment size, establishment shutdown, and pro-duction versus nonproduction employment and earnings. Using a combi-nation of CBP and NBER-CES data, we explore these outcomes in table 5.Given our findings on how import penetration affects employment in
tables 2 and 3, many of the results in table 5 are in line with expectations.Stronger import competition reduces the count of establishments ðcol. 2Þ,average employment per establishment ðcol. 3Þ, and total industry wagepayments ðcol. 4Þ. Production employment ðcol. 6Þ declines slightly morethan nonproduction employment ðcol. 7Þ, indicating a larger sensitivity toChinese import competition on the part of lower-skilled labor, a resultconsistent with China’s strong comparative advantage in labor-intensivesectors.The table also contains some informative surprises. Trade exposure pre-
dicts a rise in real industry log wages for production workers ðcol. 8Þ—thatis, the real production worker wage bill divided by the production workerheadcount. The impact on nonproduction worker wages ðcol. 9Þ is nega-tive but small and not statistically significant. Joining these two effectsproduces the positive but insignificant coefficient estimate for average realwages ðcol. 5Þ. The results for production workers that combine stronglynegative employment effects and mildly positive average wage effects aresuggestive of trade-induced changes in the composition of employment.Less highly paid workers may be those more likely to be laid off within thesubgroup of production employees, leading to an upward shift in wagesamong those still employed as a result of unobserved changes in compo-sition. This interpretation is consistentwithAutor et al.’s ð2014Þfinding thatthe earnings of lower-wage workers are most adversely affected by greaterimport competition.32
32 Complementing these results, table A2 reports the impact of Chinese importcompetition on industry output, measured as the value of shipments. In panel A,we find that import exposure has an economically and statistically significant neg-ative effect on nominal shipments ðcol. 1Þ; but when we decompose this effectinto changes in real shipments and changes in the shipments price deflator ðcols. 2and 3Þ, we find no effect on real shipments. This surprising pattern turns out to bedriven by computer-producing industries, which experienced rapid growth in realvalue added, precipitous declines in output prices, and substantial increases inChinese import penetration during our sample period. In panel B, wherewe exclude28 computer-producing industries corresponding to North American Industry
Import Competition and the Great US Employment Sag S167
This content downloaded from 23.235.32.0 on Fri, 18 Dec 2015 07:23:05 AMAll use subject to JSTOR Terms and Conditions
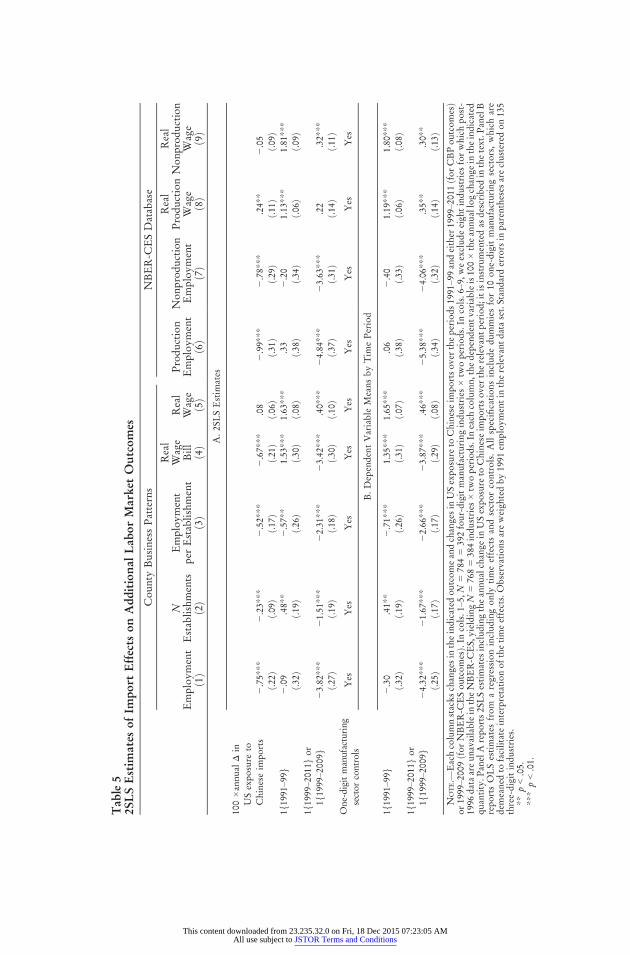
Tab
le5
2SLSEstim
ates
ofIm
port
Effects
onAdd
itiona
lLab
orMarketOutcomes
County
BusinessPatterns
NBER-C
ESDatabase
Employment
ð1Þ
NEstablishments
ð2Þ
Employment
per
Establishment
ð3Þ
Real
Wage
Bill
ð4Þ
Real
Wage
ð5Þ
Production
Employment
ð6Þ
Nonproduction
Employment
ð7Þ
Real
Production
Wage
ð8Þ
Real
Nonproduction
Wage
ð9Þ
A.2SLSEstim
ates
100� a
nnual
Din
USexposure
toChineseim
ports
2.75***
2.23***
2.52***
2.67***
.08
2.99***
2.78***
.24**
2.05
ð.22Þ
ð.09Þ
ð.17Þ
ð.21Þ
ð.06Þ
ð.31Þ
ð.29Þ
ð.11Þ
ð.09Þ
1f1991
–99g
2.09
.48**
2.57**
1.53***
1.63***
.33
2.20
1.13***
1.81***
ð.32Þ
ð.19Þ
ð.26Þ
ð.30Þ
ð.08Þ
ð.38Þ
ð.34Þ
ð.06Þ
ð.09Þ
1f1999
–2011g
or
1f1999
–2009g
23.82***
21.51***
22.31***
23.42***
.40***
24.84***
23.63***
.22
.32***
ð.27Þ
ð.19Þ
ð.18Þ
ð.30Þ
ð.10Þ
ð.37Þ
ð.31Þ
ð.14Þ
ð.11Þ
One-digitmanufacturing
sectorcontrols
Yes
Yes
Yes
Yes
Yes
Yes
Yes
Yes
Yes
B.DependentVariable
MeansbyTim
ePeriod
1f1991
–99g
2.30
.41**
2.71***
1.35***
1.65***
.06
2.40
1.19***
1.80***
ð.32Þ
ð.19Þ
ð.26Þ
ð.31Þ
ð.07Þ
ð.38Þ
ð.33Þ
ð.06Þ
ð.08Þ
1f1999
–2011g
or
1f1999
–2009g
24.32***
21.67***
22.66***
23.87***
.46***
25.38***
24.06***
.35**
.30**
ð.25Þ
ð.17Þ
ð.17Þ
ð.29Þ
ð.08Þ
ð.34Þ
ð.32Þ
ð.14Þ
ð.13Þ
NOTE.—
Eachcolumnstackschangesin
theindicated
outcomeandchangesin
USexposure
toChineseim
portsovertheperiods1991
–99andeither
1999
–2011ðfo
rCBPoutcomesÞ
or1999
–2009ðfo
rNBER-C
ESoutcomesÞ.In
cols.1
–5,N
57845
392four-digitmanufacturingindustries
�tw
operiods.In
cols.6
–9,w
eexcludeeigh
tindustries
forwhichpost-
1996
dataareunavailablein
theNBER-C
ES,yieldingN
57685
384industries
�tw
operiods.In
each
column,thedependentvariableis100�theannuallogchange
intheindicated
quantity.P
anelA
reports2SLSestimates
includingtheannualchange
inUSexposure
toChineseim
portsovertherelevantperiod;itisinstrumentedas
described
inthetext.P
anelB
reportsOLSestimates
from
aregressionincludingonly
timeeffectsandsectorcontrols.Allspecificationsincludedummiesfor10
one-digitmanufacturingsectors,whichare
dem
eaned
tofacilitate
interpretationofthetimeeffects.Observationsareweigh
tedby1991
employmentin
therelevantdataset.Standarderrors
inparentheses
areclustered
on135
three-digitindustries.
**p<.05.
***
p<.01.
This content downloaded from 23.235.32.0 on Fri, 18 Dec 2015 07:23:05 AMAll use subject to JSTOR Terms and Conditions
V. Accounting for Sectoral Linkages
We now expand the scope of the inquiry to encompass the effects oftrade shocks on employment in both manufacturing and nonmanufac-turing industries working through input-output linkages. In appendix B,we present a simple model of Cobb-Douglas production that yields ex-pressions for changes in industry employment resulting from upstreamand downstream import exposure. Here we discuss the empirical imple-mentation of these upstream and downstream effects.To study these interindustry linkages, we envisage an economy along
the lines of that studied by Long and Plosser ð1983Þ and Acemoglu et al.ð2012Þ, where each industry uses with different intensities the output ofother industries as inputs. We apply this methodology to the BEA’s input-output table for 1992. We choose the 1992 input-output table since itlargely predates the China trade shock and hence measures linkages thatare unlikely to be endogenous to the subsequent shock.To estimate the upstream effect—the exposure to import competition
that propagates upstream from an industry’s buyers—we calculate thefollowing quantity for each industry j:
DIPUjt 5 o
g
wUgjDIPgt; ð5Þ
which is equal to the weighted average change in import penetration dur-ing time interval t across all industries, indexed by g, that purchase fromindustry j. These weights wD
gj are defined as
wDgj 5
mUg j
og0mUg0j
; ð6Þ
where mUg j is the 1992 “use” value in the BEA input-output matrix for the
value of industry j’s output purchased by industry g, such that the weightin ð6Þ is the share of industry j’s total sales that are used as inputs byindustry g. Thus, ð5Þ is a weighted average of the trade shocks faced by thepurchasers of j’s output.33 When industry j’s purchasers suffer a negative
33 We use the BEA “make” table to assign commodities to the industries thatproduce them. The summation in the denominator of eq. ð6Þ runs over not onlymanufacturing industries but also nonmanufacturing industries as well as finaldemand. Since our direct shock variable reflects only manufacturing trade, all
Classification System ðNAICSÞ 334, we find comparable effects on nominal ship-ments, but these effects are now driven primarily by relative declines in real ship-ments in trade-exposed industries rather than by relative declines in output prices.We view these results as consistent with a mounting body of evidence that computer-producing industries have an outsized influence onmeasured output and productivityin the manufacturing sector ðAcemoglu et al. 2014b; Houseman, Bartik, and Sturgeon2015Þ.
Import Competition and the Great US Employment Sag S169
This content downloaded from 23.235.32.0 on Fri, 18 Dec 2015 07:23:05 AMAll use subject to JSTOR Terms and Conditions
trade shock, they are likely to reduce demand for j’s output. The theo-retical justification for these expressions is provided in appendix B using asimple model of input-output linkages.Similarly, to compute the downstream effect DIPD
jt experienced by eachindustry j—that is, the exposure to import competition that propagatesdownstream from j’s suppliers—we make the same calculation after re-versing the j and g indexes in the numerator of ð6Þ.34 We instrument boththe upstream and downstream exposure measures analogously to our mainimport shock measure: using contemporaneous changes in China importsin eight other high-income countries to calculate predicted upstream anddownstream exposure for each industry, where these predictions serve asinstruments for the measured domestic values. Concretely, we constructthese instruments by replacing the term DIPgt with DIPOgt in equation ð5Þwhile retaining the same weights.Equation ð5Þ accounts for the direct ðfirst-orderÞ effect on output de-
mand of an industry j stemming from trade-induced changes in demandfrom its immediate buyers. But it ignores further indirect effects on in-dustry j’s demand stemming from changes in demand from its buyers’ buy-ers, and so on. To account for the full chain of linked downstream and up-stream demands, we replace DIPU
jt and DIPDjt ðand their instrumentsÞ with
the full chain of implied responses from the input-output matrix, which isgiven by the Leontief inverse of the matrix of upstream and downstreamlinkages ðsee, e.g., Acemoglu et al. 2012Þ. The details of this computationare given in appendix B.Upstream and downstream exposure measures are summarized in ta-
ble A3. As expected, the indirect exposure measures are substantiallysmaller in magnitude, and have far less cross-industry variation, than thedirect exposure measures. In the average manufacturing industry, directtrade exposure is five times as large as the first-order downstream exposuremeasure and over three times as large as the first-order upstream expo-sure measure. Incorporating higher-order linkages significantly increasesthe magnitude of the upstream and downstream exposure measures. Thefull indirect upstream exposure measure ðgiven by the Leontief inverseÞ isapproximately half as large as the direct exposure measure, while the full
34 When we construct weights for the downstream effect, the summation in thedenominator again runs over industry j’s total sales. Analogously to the case ofupstream effects, downstream effects emanate from trade shocks to these indus-tries’ suppliers in manufacturing ðthough, as just noted, both manufacturers andnonmanufacturers may have suppliers in manufacturingÞ.
upstream effects experienced by a sector emanate by definition from shocks totheir manufacturing purchasers ði.e., DIPgt is defined to equal zero for nonman-ufacturing industries and for final demandÞ. These shocks affect both manufac-turing and nonmanufacturing industries to the degree that they supply inputs tomanufacturing industries g that are directly shocked.
S170 Acemoglu et al.
This content downloaded from 23.235.32.0 on Fri, 18 Dec 2015 07:23:05 AMAll use subject to JSTOR Terms and Conditions
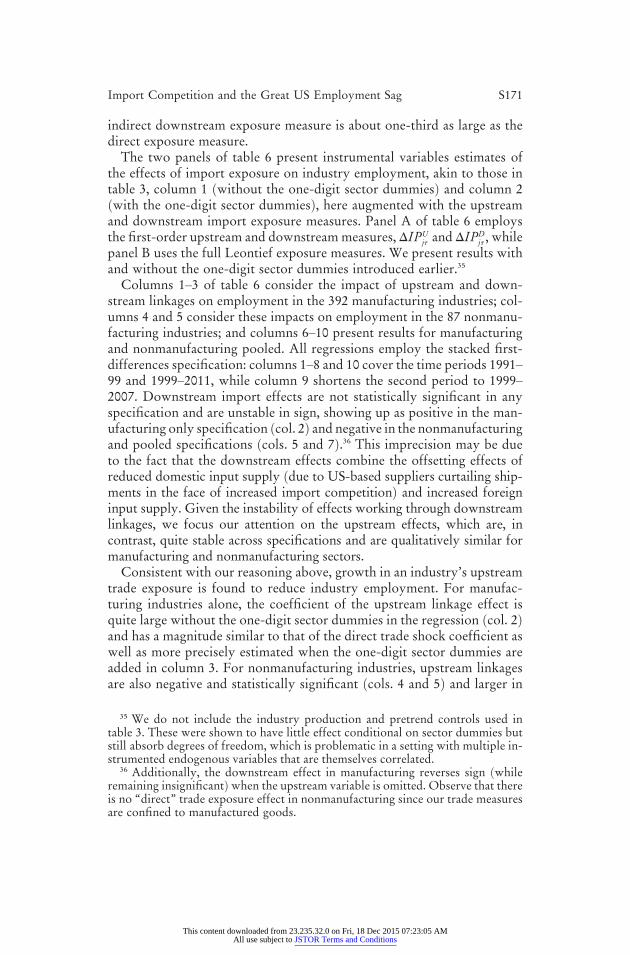
indirect downstream exposure measure is about one-third as large as thedirect exposure measure.The two panels of table 6 present instrumental variables estimates of
the effects of import exposure on industry employment, akin to those intable 3, column 1 ðwithout the one-digit sector dummiesÞ and column 2ðwith the one-digit sector dummiesÞ, here augmented with the upstreamand downstream import exposure measures. Panel A of table 6 employsthe first-order upstream and downstreammeasures, DIPU
jt and DIPDjt , while
panel B uses the full Leontief exposure measures. We present results withand without the one-digit sector dummies introduced earlier.35
Columns 1–3 of table 6 consider the impact of upstream and down-stream linkages on employment in the 392 manufacturing industries; col-umns 4 and 5 consider these impacts on employment in the 87 nonmanu-facturing industries; and columns 6–10 present results for manufacturingand nonmanufacturing pooled. All regressions employ the stacked first-differences specification: columns 1–8 and 10 cover the time periods 1991–99 and 1999–2011, while column 9 shortens the second period to 1999–2007. Downstream import effects are not statistically significant in anyspecification and are unstable in sign, showing up as positive in the man-ufacturing only specification ðcol. 2Þ and negative in the nonmanufacturingand pooled specifications ðcols. 5 and 7Þ.36 This imprecision may be dueto the fact that the downstream effects combine the offsetting effects ofreduced domestic input supply ðdue to US-based suppliers curtailing ship-ments in the face of increased import competitionÞ and increased foreigninput supply. Given the instability of effects working through downstreamlinkages, we focus our attention on the upstream effects, which are, incontrast, quite stable across specifications and are qualitatively similar formanufacturing and nonmanufacturing sectors.Consistent with our reasoning above, growth in an industry’s upstream
trade exposure is found to reduce industry employment. For manufac-turing industries alone, the coefficient of the upstream linkage effect isquite large without the one-digit sector dummies in the regression ðcol. 2Þand has a magnitude similar to that of the direct trade shock coefficient aswell as more precisely estimated when the one-digit sector dummies areadded in column 3. For nonmanufacturing industries, upstream linkagesare also negative and statistically significant ðcols. 4 and 5Þ and larger in
35 We do not include the industry production and pretrend controls used intable 3. These were shown to have little effect conditional on sector dummies butstill absorb degrees of freedom, which is problematic in a setting with multiple in-strumented endogenous variables that are themselves correlated.
36 Additionally, the downstream effect in manufacturing reverses sign ðwhileremaining insignificantÞwhen the upstream variable is omitted. Observe that thereis no “direct” trade exposure effect in nonmanufacturing since our trade measuresare confined to manufactured goods.
Import Competition and the Great US Employment Sag S171
This content downloaded from 23.235.32.0 on Fri, 18 Dec 2015 07:23:05 AMAll use subject to JSTOR Terms and Conditions
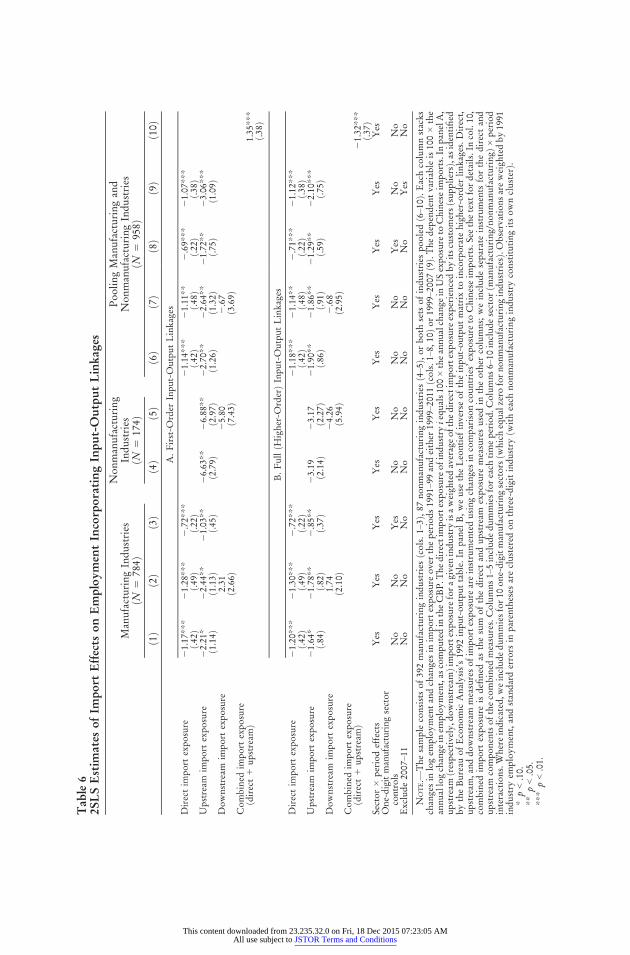
Tab
le6
2SLSEstim
ates
ofIm
port
Effects
onEmploy
men
tIncorporatingInpu
t-Outpu
tLinka
ges
ManufacturingIndustries
ðN5
784Þ
Nonmanufacturing
Industries
ðN5
174Þ
PoolingManufacturingand
NonmanufacturingIndustries
ðN5
958Þ
ð1Þ
ð2Þ
ð3Þ
ð4Þ
ð5Þ
ð6Þ
ð7Þ
ð8Þ
ð9Þ
ð10Þ
A.First-O
rder
Input-OutputLinkages
Directim
port
exposure
21.17***
21.28***
2.72***
21.14***
21.11**
2.69***
21.07***
ð.42Þ
ð.49Þ
ð.22Þ
ð.42Þ
ð.48Þ
ð.22Þ
ð.38Þ
Upstream
import
exposure
22.21*
22.44**
21.03**
26.63**
26.88**
22.70**
22.64**
21.72**
23.06***
ð1.14Þ
ð1.13Þ
ð.45Þ
ð2.79Þ
ð2.97Þ
ð1.26Þ
ð1.32Þ
ð.75Þ
ð1.09Þ
Downstream
import
exposure
2.31
25.80
2.67
ð2.66Þ
ð7.43Þ
ð3.69Þ
Combined
import
exposure
ðdirect1
upstream
Þ1.35***
ð.38Þ
B.FullðH
igher-O
rderÞI
nput-OutputLinkages
Directim
port
exposure
21.20***
21.30***
2.72***
21.18***
21.14**
2.71***
21.12***
ð.42Þ
ð.49Þ
ð.22Þ
ð.42Þ
ð.48Þ
ð.22Þ
ð.38Þ
Upstream
import
exposure
21.64*
21.78**
2.85**
23.19
23.17
21.90**
21.86**
21.29**
22.10***
ð.84Þ
ð.82Þ
ð.37Þ
ð2.14Þ
ð2.27Þ
ð.86Þ
ð.91Þ
ð.59Þ
ð.75Þ
Downstream
import
exposure
1.74
24.26
2.68
ð2.10Þ
ð5.94Þ
ð2.95Þ
Combined
import
exposure
ðdirect1
upstream
Þ21.32***
ð.37Þ
Sector�
periodeffects
Yes
Yes
Yes
Yes
Yes
Yes
Yes
Yes
Yes
Yes
One-digitmanufacturingsector
controls
No
No
Yes
No
No
No
No
Yes
No
No
Exclude2007
–11
No
No
No
No
No
No
No
No
Yes
No
NOTE.—
Thesample
consistsof392manufacturingindustries
ðcols.1–
3Þ,87
nonmanufacturingindustries
ð4–5Þ,orboth
sets
ofindustries
pooledð6–1
0Þ.Eachcolumnstacks
changesin
logem
ploymentandchangesin
importexposure
overtheperiods1991–9
9andeither
1999
–2011ðco
ls.1–
8,10
Þor1999
–2007ð9Þ.Thedependentvariable
is100�
the
annuallogchange
inem
ployment,as
computedin
theCBP.T
hedirectim
portexposure
ofindustry
iequals100�theannualchange
inUSexposure
toChineseim
ports.In
panelA,
upstream
ðrespectively,d
ownstream
Þimportexposure
foragivenindustry
isaweigh
tedaverageofthedirectim
portexposure
experiencedbyitscustomersðsu
ppliersÞ,
asidentified
bytheBureau
ofEconomic
Analysis’s1992
input-outputtable.In
panel
B,weuse
theLeontief
inverseoftheinput-outputmatrixto
incorporate
higher-order
linkages.Direct,
upstream
,anddownstream
measuresofim
portexposure
areinstrumentedusingchangesin
comparisoncountries’exposure
toChineseim
ports.Seethetext
fordetails.Incol.10,
combined
import
exposure
isdefi
ned
asthesum
ofthedirectandupstream
exposure
measuresusedin
theother
columns;weincludeseparateinstruments
forthedirectand
upstream
componentsofthecombined
measures.Columns1–
5includedummiesforeach
timeperiod.C
olumns6–
10includesectorðm
anufacturing/nonmanufacturingÞ
�period
interactions.Whereindicated,w
eincludedummiesfor10
one-digitmanufacturingsectorsðw
hichequalzero
fornonmanufacturingindustriesÞ.O
bservationsareweigh
tedby1991
industry
employment,andstandarderrors
inparentheses
areclustered
onthree-digitindustry
ðwitheach
nonmanufacturingindustry
constitutingitsownclusterÞ.
*p<.10.
**p<.05.
***
p<.01.
This content downloaded from 23.235.32.0 on Fri, 18 Dec 2015 07:23:05 AMAll use subject to JSTOR Terms and Conditions
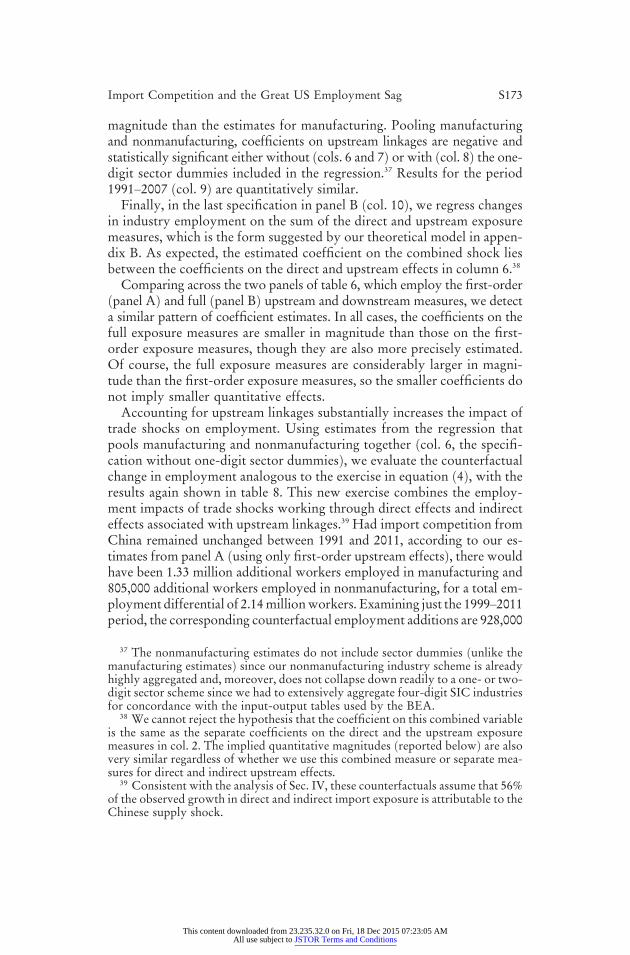
magnitude than the estimates for manufacturing. Pooling manufacturingand nonmanufacturing, coefficients on upstream linkages are negative andstatistically significant either without ðcols. 6 and 7Þ or with ðcol. 8Þ the one-digit sector dummies included in the regression.37 Results for the period1991–2007 ðcol. 9Þ are quantitatively similar.Finally, in the last specification in panel B ðcol. 10Þ, we regress changes
in industry employment on the sum of the direct and upstream exposuremeasures, which is the form suggested by our theoretical model in appen-dix B. As expected, the estimated coefficient on the combined shock liesbetween the coefficients on the direct and upstream effects in column 6.38
Comparing across the two panels of table 6, which employ the first-orderðpanel AÞ and full ðpanel BÞ upstream and downstream measures, we detecta similar pattern of coefficient estimates. In all cases, the coefficients on thefull exposure measures are smaller in magnitude than those on the first-order exposure measures, though they are also more precisely estimated.Of course, the full exposure measures are considerably larger in magni-tude than the first-order exposure measures, so the smaller coefficients donot imply smaller quantitative effects.Accounting for upstream linkages substantially increases the impact of
trade shocks on employment. Using estimates from the regression thatpools manufacturing and nonmanufacturing together ðcol. 6, the specifi-cation without one-digit sector dummiesÞ, we evaluate the counterfactualchange in employment analogous to the exercise in equation ð4Þ, with theresults again shown in table 8. This new exercise combines the employ-ment impacts of trade shocks working through direct effects and indirecteffects associated with upstream linkages.39 Had import competition fromChina remained unchanged between 1991 and 2011, according to our es-timates from panel A ðusing only first-order upstream effectsÞ, there wouldhave been 1.33 million additional workers employed in manufacturing and805,000 additional workers employed in nonmanufacturing, for a total em-ployment differential of 2.14millionworkers. Examining just the 1999–2011period, the corresponding counterfactual employment additions are 928,000
37 The nonmanufacturing estimates do not include sector dummies ðunlike themanufacturing estimatesÞ since our nonmanufacturing industry scheme is alreadyhighly aggregated and, moreover, does not collapse down readily to a one- or two-digit sector scheme since we had to extensively aggregate four-digit SIC industriesfor concordance with the input-output tables used by the BEA.
38 We cannot reject the hypothesis that the coefficient on this combined variableis the same as the separate coefficients on the direct and the upstream exposuremeasures in col. 2. The implied quantitative magnitudes ðreported belowÞ are alsovery similar regardless of whether we use this combined measure or separate mea-sures for direct and indirect upstream effects.
39 Consistent with the analysis of Sec. IV, these counterfactuals assume that 56%of the observed growth in direct and indirect import exposure is attributable to theChinese supply shock.
Import Competition and the Great US Employment Sag S173
This content downloaded from 23.235.32.0 on Fri, 18 Dec 2015 07:23:05 AMAll use subject to JSTOR Terms and Conditions
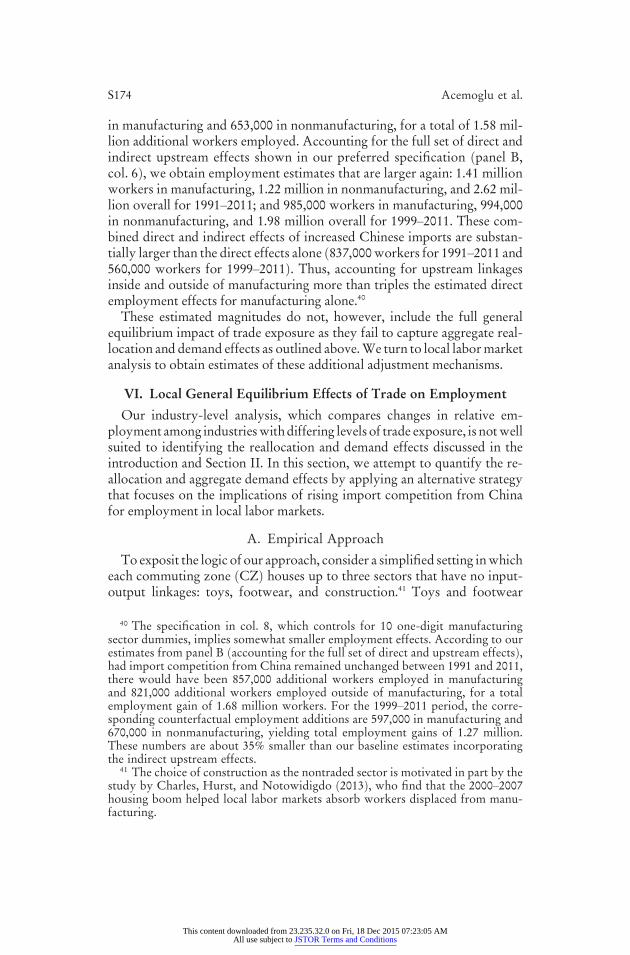
in manufacturing and 653,000 in nonmanufacturing, for a total of 1.58 mil-lion additional workers employed. Accounting for the full set of direct andindirect upstream effects shown in our preferred specification ðpanel B,col. 6Þ, we obtain employment estimates that are larger again: 1.41 millionworkers in manufacturing, 1.22 million in nonmanufacturing, and 2.62 mil-lion overall for 1991–2011; and 985,000 workers in manufacturing, 994,000in nonmanufacturing, and 1.98 million overall for 1999–2011. These com-bined direct and indirect effects of increased Chinese imports are substan-tially larger than the direct effects alone ð837,000workers for 1991–2011 and560,000 workers for 1999–2011Þ. Thus, accounting for upstream linkagesinside and outside of manufacturing more than triples the estimated directemployment effects for manufacturing alone.40
These estimated magnitudes do not, however, include the full generalequilibrium impact of trade exposure as they fail to capture aggregate real-location and demand effects as outlined above.We turn to local labormarketanalysis to obtain estimates of these additional adjustment mechanisms.
VI. Local General Equilibrium Effects of Trade on Employment
Our industry-level analysis, which compares changes in relative em-ployment among industrieswithdiffering levelsof trade exposure, is notwellsuited to identifying the reallocation and demand effects discussed in theintroduction and Section II. In this section, we attempt to quantify the re-allocation and aggregate demand effects by applying an alternative strategythat focuses on the implications of rising import competition from Chinafor employment in local labor markets.
A. Empirical Approach
Toexposit the logic of our approach, consider a simplified setting inwhicheach commuting zone ðCZÞ houses up to three sectors that have no input-output linkages: toys, footwear, and construction.41 Toys and footwear
40 The specification in col. 8, which controls for 10 one-digit manufacturingsector dummies, implies somewhat smaller employment effects. According to ourestimates from panel B ðaccounting for the full set of direct and upstream effectsÞ,had import competition from China remained unchanged between 1991 and 2011,there would have been 857,000 additional workers employed in manufacturingand 821,000 additional workers employed outside of manufacturing, for a totalemployment gain of 1.68 million workers. For the 1999–2011 period, the corre-sponding counterfactual employment additions are 597,000 in manufacturing and670,000 in nonmanufacturing, yielding total employment gains of 1.27 million.These numbers are about 35% smaller than our baseline estimates incorporatingthe indirect upstream effects.
41 The choice of construction as the nontraded sector is motivated in part by thestudy by Charles, Hurst, and Notowidigdo ð2013Þ, who find that the 2000–2007housing boom helped local labor markets absorb workers displaced from manu-facturing.
S174 Acemoglu et al.
This content downloaded from 23.235.32.0 on Fri, 18 Dec 2015 07:23:05 AMAll use subject to JSTOR Terms and Conditions
experience an increase in imports from China, so we label these sectors asexposed. Construction does not experience this shock, and we label it non-exposed. If a particular CZ has many workers employed in toys prior tothe rise of import competition from China, it will experience significantworker displacement as this sector contracts.42 Because of the reallocationeffect, we would expect displaced workers to gain employment in anothersector. This sector is unlikely to be footwear, however, since it is simulta-neously facing rising import competition. In this simple setting, laborwithinthe CZ should therefore reallocate toward construction. Estimating by howmuch employment in construction expands in this CZ as toys and footweardecline can help us to assess the positive general equilibrium effects resultingfrom reallocation.Employment in constructionmay be affected by a second channel as well:
the potentially negative Keynesian aggregate demand multiplier, stemmingfrom reductions in local economic activity. In our simple example, the initialreduction in employment in exposed industries will reduce local incomesand, via this channel, may depress local demand for new home constructionor renovation, further depressing employment.43 The net effect of these re-allocation andaggregatedemandeffectsonemployment in constructionmaybe positive or negative.Now suppose that the third industry in this economy is not construction
but chemicals, which, unlike construction, is tradable within the UnitedStates across local labor markets and, as it happens, has not been subject tosignificant increases in import competition from China. To make progressin this case, suppose that our local labor markets can be thought of as smallopen economies within the United States, so that prices of tradables aredetermined at theUS level ðor onworldmarketsÞ. This does not change thereallocation effect, but it may alter the aggregate demand effect. Even ifaggregate demand for nontradables in the local labor market is depressed,there might be an increase in local employment in chemicals, the output ofwhich is then sold to residents in other CZs. This is simply a reflectionof the fact that the component of the negative aggregate demand effectworking at the national level will not be easily identified from variationacross local labor markets. An implication of this observation is that ourstrategy will tend to underestimate the aggregate demand effect to thedegree it operates nationally rather than locally.
42 This discussion also makes it clear that empirically it is appropriate tocombine the shocks of all of the local industries using weights related to theirlocal employment shares, which is the strategy employed here and in Autor et al.ð2013Þ.
43 It is possible for trade-induced price declines to simultaneously contribute toaggregate demand by spurring additional consumption or investment, as discussedin footnote 14.
Import Competition and the Great US Employment Sag S175
This content downloaded from 23.235.32.0 on Fri, 18 Dec 2015 07:23:05 AMAll use subject to JSTOR Terms and Conditions
B. Estimates
The local labor market analysis is based on 722 CZs that cover the entireUS mainland. These CZs are clusters of counties with strong internalcommuting ties ðsee Tolbert and Sizer 1996; Autor and Dorn 2013Þ.We begin by estimating stacked first-difference models for changes in
CZ employment-to-population rates of the following form:
DEit 5 at 1 bDIPCZit 1 gXi0 1 eit: ð7Þ
Here, the dependent variable DEit is equal to 100 times the annual changein the ratio of employment to working-age population in CZ i over timeperiod t; Xi0 is a set of CZ-by-sector start-of-period controls ðspecifiedlaterÞ; at is a time effect; and eit is an error term.44 The key explanatoryvariable in this model is DIPCZ
it , which measures a CZ’s annual change inexposure to Chinese imports over period t. The coefficient b reveals theimpact of import exposure on overall employment rates, combining em-ployment shifts in both trade-exposed and nonexposed industries. Wedefine a CZ’s change in import exposure as a local employment-weightedaverage of changes in import exposure:
DIPCZit 5 o
j
Lijt
Lit
DIPjt: ð8Þ
In ð8Þ, DIPjt is the measure of Chinese import competition used in ourindustry-level analysis, and Lijt/Lit is industry j’s start-of-period share oftotal employment in CZ i.45 The variation in DIPCZ
it across local labor mar-kets stems entirely from variation in local industry employment structureat the start of period t. As with our industry-level estimates, a concern isthat realized US imports from China in ð8Þmay be correlated with industryimport demand shocks.We again instrument for growth in Chinese importsto the United States using the contemporaneous growth of Chinese importsin eight other developed countries as specified in ð2Þ.46 Table A4 summarizes
44 Throughout this section, local employment is derived from the CBP, andlocal working-age population ðages 15–64Þ is derived from the Census of Popu-lation estimates.
45 This is similar to Autor et al. ð2013, 2014Þ, except that for consistency withour industry-level analysis, we normalize industry-level imports by initial USmarket volume instead of initial employment.
46 Our expression for non-US exposure to Chinese imports, which serves as aninstrument for DIPCZ
it , differs from the expression in eq. ð8Þ in that in place ofrealized changes in US import exposure ðDIPjtÞ, we use the analogous expressionbased on realized imports from China to other high-income markets ðDIPOjtÞ.In addition, we use 1988 employment counts for the construction of the instru-ment to reduce the error covariance between the dependent and independentvariables.
S176 Acemoglu et al.
This content downloaded from 23.235.32.0 on Fri, 18 Dec 2015 07:23:05 AMAll use subject to JSTOR Terms and Conditions
CZ-level changes in exposure to Chinese imports and in employment-to-population rates.To gauge the differential impact of import exposure on different types of
industries within local labor markets, we decompose employment changesinto three broad sectoral groupings. Specifically, we interact the CZ’s changein import exposure with indicator variables for exposed industries, non-exposed tradable industries, and other nonexposed industries:
DEikt 5 akt 1 b1DIPCZit
� 1½Exposedk�1 b2DIP
CZit
� 1½Nonexposed Tradablek�1 b3DIP
CZit
� ð12 1½Exposedk�
2 1½Nonexposed Tradablek�Þ1 gXik0 1 eikt:
ð9Þ
In these regressions, DEikt is the change in employment of sector k in CZ i,expressed in percentage points of working-age population. While thespecification in ð9Þ is similar to that in Autor et al. ð2013Þ, it differs im-portantly by separating the employment effects of import competition inCZs according to sector import exposure and tradability. To computeDEikt,we assign each industry to one of the three mutually exclusive sectors:exposed industries, nonexposed tradable industries, and other nonexposedindustries. First, we define the exposed sector to encompass all manufac-turing industries for which predicted import exposure rose by at least2 percentage points between 1991 and 2011, as well as all industries ðbothwithin and outside ofmanufacturingÞ forwhich the predicted full upstreamimport exposure measure increased by at least 4 percentage points over1991–2011.47Relative to an exposure definition based only onown-industryimport exposure, incorporating upstream linkages expands the exposedsector to include additional manufacturing industries as well as industriesoutside of manufacturing that sell a sizable portion of their outputs toimport-exposed manufacturing firms. For example, the latter group in-cludes forestry, wholesale trade,miscellaneous repair services, and chemicaland fertilizer mining.48 All other industries are designated as nonexposed.Following our simple example of construction versus chemicals as nonex-posed industries, we next subdivide the nonexposed sector into tradables
47 Predicted import exposure is computed from first-stage estimates of eq. ð3Þover the single long period 1991–2011.
48 Despite this broad definition of the exposed sector, our regression analysis inthis section will only partially capture the indirect effects working through input-output linkages we directly estimated previously. While pairs of industries linkedthrough input-output relationships tend to co-locate ðe.g., Ellison et al. 2010Þ,manyfirms purchase and sell inputs beyond the boundaries of theirCZ, and thus any localstrategy will exclude a potentially sizable fraction of these indirect effects.
Import Competition and the Great US Employment Sag S177
This content downloaded from 23.235.32.0 on Fri, 18 Dec 2015 07:23:05 AMAll use subject to JSTOR Terms and Conditions
and nontradables. In our nomenclature, tradable industries are those thatproduce tradable goods or commodities and specifically constitute the man-ufacturing, agriculture, forestry, fishing, and mining sectors. We classify allother sectors, including services, as nontradable, though this approach isadmittedly imperfect since some services are also traded.49
Table 7 presents our estimates. The first set of specifications in col-umns 1–3 pool employment across all sectors to determine the impact ofimport exposure in local labor markets on overall employment. Column 1considers the relationship between CZ import exposure and changes inCZ employment-to-population rates without additional controls. Thestrongly negative and statistically significant point estimate in this columnindicates that a 1 percentage point increase in the average import pene-tration of local industries reduces the employment rate among a CZ’sworking-age population by 1.64 percentage points. We refine the esti-mates and explore robustness in the next pair of columns by controllingfor the initial manufacturing employment share in a local labor marketðcol. 2Þ and for nine census divisions ðcol. 3Þ. By controlling for local man-ufacturing intensity, we allow for differential employment trends in themanufacturing andnonmanufacturing sectors, aswedo inour industry-levelestimates of table 6. The controls for censusdivisions allow for heterogeneityin regional time trends. Adding these covariates has a modest impact on thetrade coefficient, which remains sizable and statistically significant at21.70in column 3.The regressions of columns 4–6 disaggregate the overall employment
effects of columns 1–3 into their sectoral components. Consistent with theresults of the industry analysis, column 4 shows a strongly negative andstatistically significant effect of import exposure on local labor marketemployment in trade-exposed industries. The point estimate indicates thata 1 percentage point increase in local import exposure reduces the shareof a CZ’s working-age population employed in exposed industries by1.95 percentage points. Between 1999 and 2011, mean CZ import exposurerose by 1.21 percentage points, while employment in exposed industries de-clined by 3.64 percentage points of the working-age population. The es-timate in column 4 thus implies that 1.32 percentage points ðor 36%Þ ofthis fall can be explained by rising Chinese import competition.50
49 The exposed sector consists of 293 industries ð285 in manufacturing and eightoutside of manufacturingÞ, which together made up 20.2% of 1991 US employ-ment. The nonexposed tradable sector consists of 113 industries ð107 in manu-facturing, six outside of manufacturingÞ, making up 6.7% of 1991 employment.Finally, the nonexposed nontradable sector consists of 73 industries ðall outsidemanufacturingÞ accounting for 73.1% of 1991 employment.
50 As above, this calculation discounts the growth of imports by the partialR-squared of 0.56 of the first-stage regression: 1.32 5 0.56 � 1.21 � 1.95.
S178 Acemoglu et al.
This content downloaded from 23.235.32.0 on Fri, 18 Dec 2015 07:23:05 AMAll use subject to JSTOR Terms and Conditions
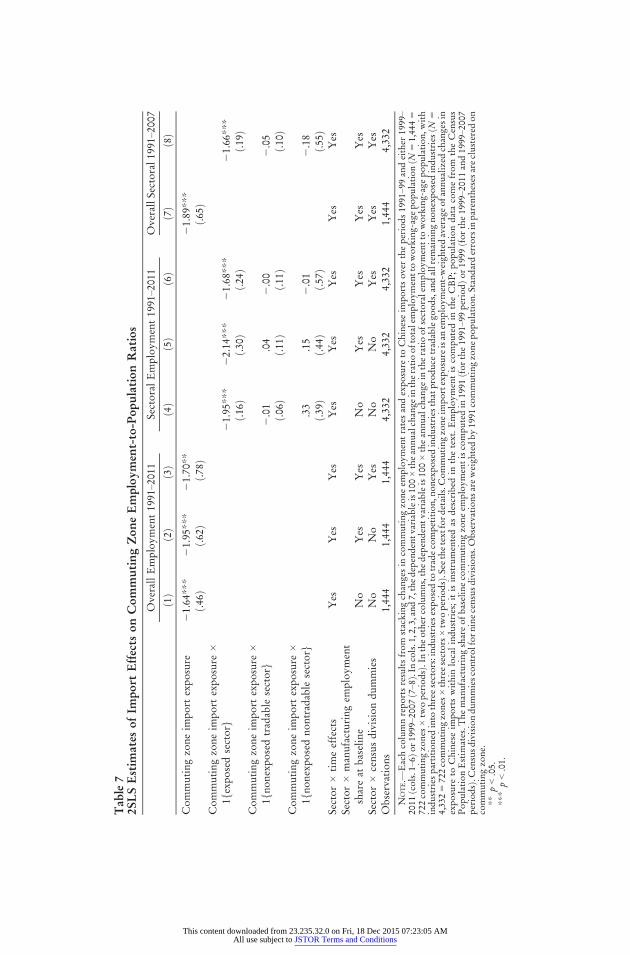
Tab
le7
2SLSEstim
ates
ofIm
port
Effects
onCom
mutingZon
eEmploy
men
t-to-Pop
ulationRatios
OverallEmployment1991–2011
SectoralEmployment1991–2011
OverallSectoral1991–2007
ð1Þ
ð2Þ
ð3Þ
ð4Þ
ð5Þ
ð6Þ
ð7Þ
ð8Þ
Commutingzo
neim
port
exposure
21.64***
21.95***
21.70**
21.89***
ð.46Þ
ð.62Þ
ð.78Þ
ð.65Þ
Commutingzo
neim
port
exposure
�1fexposedsectorg
21.95***
22.14***
21.68***
21.66***
ð.16Þ
ð.30Þ
ð.24Þ
ð.19Þ
Commutingzo
neim
port
exposure
�1fnonexposedtradable
sectorg
2.01
.04
2.00
2.05
ð.06Þ
ð.11Þ
ð.11Þ
ð.10Þ
Commutingzo
neim
port
exposure
�1fnonexposednontradable
sectorg
.33
.15
2.01
2.18
ð.39Þ
ð.44Þ
ð.57Þ
ð.55Þ
Sector�
timeeffects
Yes
Yes
Yes
Yes
Yes
Yes
Yes
Yes
Sector�
manufacturingem
ployment
shareat
baseline
No
Yes
Yes
No
Yes
Yes
Yes
Yes
Sector�
censusdivisiondummies
No
No
Yes
No
No
Yes
Yes
Yes
Observations
1,444
1,444
1,444
4,332
4,332
4,332
1,444
4,332
NOTE.—
Eachcolumnreportsresultsfrom
stackingchangesin
commutingzo
neem
ploymentratesandexposure
toChineseim
portsovertheperiods1991
–99andeither
1999
–2011
ðcols.1–6Þo
r1999
–2007ð7–8
Þ.Incols.1,2,3,and7,thedependentvariableis100�theannualchange
intheratiooftotalemploymentto
working-agepopulationðN
51,4445
722commutingzo
nes
�tw
operiodsÞ.
Intheother
columns,thedependentvariableis100�theannualchange
intheratioofsectoralemploymentto
working-agepopulation,w
ith
industries
partitioned
into
threesectors:industries
exposedto
tradecompetition,n
onexposedindustries
that
produce
tradablego
ods,andallrem
ainingnonexposedindustries
ðN5
4,3325
722commutingzo
nes
�threesectors
�tw
operiodsÞ.
Seethetext
fordetails.C
ommutingzo
neim
portexposure
isan
employment-weigh
tedaverageofannualized
changesin
exposure
toChineseim
portswithin
localindustries;itisinstrumentedas
described
inthetext.Employmentis
computedin
theCBP;populationdatacomefrom
theCensus
PopulationEstim
ates.T
hemanufacturingshareofbaselinecommutingzo
neem
ploymentiscomputedin
1991
ðforthe1991
–99periodÞo
r1999
ðforthe1999
–2011and1999
–2007
periodsÞ.
Censusdivisiondummiescontrolforninecensusdivisions.Observationsareweigh
tedby1991
commutingzo
nepopulation.Standarderrorsin
parentheses
areclustered
on
commutingzo
ne.
**p<.05.
***
p<.01.
This content downloaded from 23.235.32.0 on Fri, 18 Dec 2015 07:23:05 AMAll use subject to JSTOR Terms and Conditions
As our conceptual discussion anticipates, the estimate in column 4 alsoshows some offsetting employment growth in nonexposed industries,corresponding to the net impact of local reallocation and Keynesian de-mand effects. However, the offsetting employment effect is substantiallysmaller than the employment reduction in exposed industries and is neverstatistically significant. These estimates suggest that employment gainsthrough the sectoral reallocation effect are largely offset by negative ag-gregate demand effects. In parallel with our specifications examining over-all employment impacts, we refine the estimates in the next pair of col-umns by controlling for initial local labor market manufacturing intensityðcol. 5Þ and census divisions ðcol. 6Þ, with the coefficients on these controlsallowed to vary by sector. Adding these covariates only modestly changesthe estimated negative impact of import exposure on employment in ex-posed industries, while the small and imprecise estimates for offsettingemployment gains decline to almost zero. The final columns replicate thespecifications from columns 3 and 6 over the stacked periods 1991–99 and1999–2007. The results are similar to those for the full sample period andsuggest negative effects of trade competition on employment in exposedindustries, combined with small and insignificant effects in nonexposedsectors.While our estimates suggest the presence of strong aggregate demand
effects that limit employment gains in the nonexposed sectors of trade-exposed local labor markets, we would anticipate that these local demandeffects primarily have an impact on employment in the nontraded sectorrather than the nonexposed tradable sector. Our results, however, providescant evidence for differential employment impacts in the two nonex-posed sectors. In columns 4 and 5, the point estimates for nontradablesexceed the point estimate for nonexposed tradables; in columns 6 and 8,the relationship is reversed.Why does reallocation fail to accord more clearly with the simple rea-
soning outlined in Section VI.A? It is conceivable that the small increase inemployment in nontradable sectors detected in columns 4 and 5 ðthoughnot in col. 6Þmaybe related to the rapid rise in theUSaggregate trade deficitduring our sample period, a substantial part of which reflects a growingtrade imbalance with China ðfig. 2Þ. In response to import competition, anopen economy normally reallocates resources out of some tradable in-dustries into others, at least under balanced trade. If, however, the tradeshock is accompanied by a rise in the trade deficit, then the reallocationfrom exposed tradables into nonexposed tradablesmay be delayed, shiftingemployment into nontradables instead; that is, the deficit may fuel in-creasing expenditure in the domestic economy, part of which falls onnontradable consumption. While this reasoning is not inconsistent with along-run reallocation toward nonexposed tradables, the large and growing
S180 Acemoglu et al.
This content downloaded from 23.235.32.0 on Fri, 18 Dec 2015 07:23:05 AMAll use subject to JSTOR Terms and Conditions
US trade deficit during the period under study may have significantlyslowed down such a reallocation. This reasoning is, unfortunately, silenton why a rising US trade deficit coincided with China’s growing importpenetration. It nevertheless underscores that shifts in global imbalancesmay complicate the simple adjustment mechanism we posit.Quantitatively, the estimates in column 6 of table 7 encompass four
impacts of Chinese trade competition on local labor market employment:direct employment effects in exposed industries, indirect employmenteffects via local input-output linkages between industries, local realloca-tion effects, and local aggregate demand effects. As summarized in table 8,the coefficient estimates imply that had import competition from Chinanot increased after 1999, trade-exposed industries in local labor marketswould have avoided the loss of 2.35 million jobs. Comparing this quantityto the outcome of our national industry analysis, it is modestly larger thanthe employment effect derived from panel B of table 6 reported above,which incorporated both the direct and the upstream effects of importcompetition and tallied employment reductions in trade-exposed manu-facturing and nonmanufacturing industries at 1.98 million jobs. The factthat employment effects on exposed industries in CZs are slightly largerthan the direct and indirect effects of import competition in nationalindustries is suggestive of negative local aggregate demand spillovers. Suchspillovers imply that multipliers operating at the local level suppressdemand in nonexposed industries as well, inducing further employmentdeclines in trade-exposed industries.Our estimates imply near zero, though imprecisely estimated, employ-
ment effects of trade exposure on nonexposed industries. In the absence offurther increases in import penetration from China after 1999, the resultssummarized in table 8 show that nonexposed industries would have shed18,000 fewer jobs. Combining figures from exposed and nonexposed in-dustries, the overall local impact is 2.37 million jobs whose loss would havebeen averted without further increases in Chinese import competition after1999. With the numerous caveats acknowledged, our conceptual frame-work in Section II suggests that this estimate is a lower bound on the ag-gregate total impact of increased import competition fromChina onnationalemployment. In particular, this estimate does not include the componentsof industry interlinkage effects and aggregate demand effects that work atthe national level. This lower-bound estimate is relatively close to the jobslost on the basis of our industry-level analysis in panel B of table 6 ðshownin table 8Þ, which combines direct competition effects and interindustrylinkages with nonmanufacturing sectors. Recall that table 6’s industry-levelestimate of the jobs lost does not include reallocation and aggregate demandeffects. Since our analysis in this section indicates that employment lossesdue to negative aggregate demand effects dominate employment gains due
Import Competition and the Great US Employment Sag S181
This content downloaded from 23.235.32.0 on Fri, 18 Dec 2015 07:23:05 AMAll use subject to JSTOR Terms and Conditions
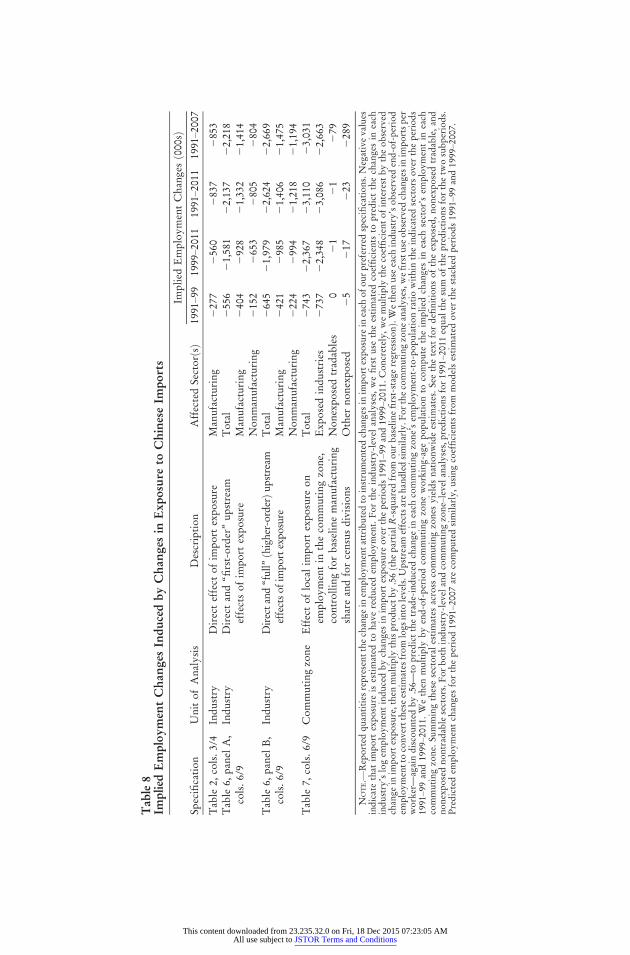
Tab
le8
ImpliedEmploy
men
tCha
nges
Indu
cedby
Cha
nges
inExp
osur
eto
Chine
seIm
ports
Implied
EmploymentChangesð000sÞ
Specification
UnitofAnalysis
Description
AffectedSectorðs
Þ1991–99
1999–2011
1991–2
011
1991–2007
Table
2,cols.3/4
Industry
Directeffect
ofim
port
exposure
Manufacturing
2277
2560
2837
2853
Table
6,panel
A,
cols.6/9
Industry
Directand“fi
rst-order”upstream
effectsofim
port
exposure
Total
Manufacturing
Nonmanufacturing
2556
2404
2152
21,581
2928
2653
22,137
21,332
2805
22,218
21,414
2804
Table
6,panel
B,
cols.6/9
Industry
Directand“full”ðhigher-orderÞu
pstream
effectsofim
portexposure
Total
Manufacturing
Nonmanufacturing
2645
2421
2224
21,979
2985
2994
22,624
21,406
21,218
22,669
21,475
21,194
Table
7,cols.6/9
Commutingzo
ne
Effectoflocalim
port
exposure
on
employmentin
thecommutingzo
ne,
controllingforbaselinemanufacturing
shareandforcensusdivisions
Total
Exp
osedindustries
Nonexposedtradables
Other
nonexposed
2743
2737 0
25
22,367
22,348
21
217
23,110
23,086
21
223
23,031
22,663
279
2289
NOTE.—
Reported
quantities
representthechange
inem
ploymentattributedto
instrumentedchangesin
importexposure
ineach
ofourpreferred
specifications.Negativevalues
indicatethat
import
exposure
isestimated
tohavereducedem
ployment.Fortheindustry-level
analyses,wefirstuse
theestimated
coefficients
topredictthechangesin
each
industry’slogem
ploymentinducedbychangesin
import
exposure
overtheperiods1991–9
9and1999
–2011.
Concretely,wemultiply
thecoefficientofinterest
bytheobserved
change
inim
portexposure,then
multiply
thisproduct
by.56ðth
epartialR-squared
from
ourbaselinefirst-stageregressionÞ.Wethen
use
each
industry’sobserved
end-of-period
employmentto
converttheseestimates
from
logs
into
levels.U
pstream
effectsarehandledsimilarly.F
orthecommutingzo
neanalyses,wefirstuse
observed
changesin
importsper
worker—againdiscountedby.56—
topredictthetrade-inducedchange
ineach
commutingzo
ne’sem
ployment-to-populationratiowithin
theindicated
sectors
overtheperiods
1991
–99and1999
–2011.
Wethen
multiply
byend-of-periodcommutingzo
neworking-agepopulationto
compute
theim
plied
changesin
each
sector’sem
ploymentin
each
commutingzo
ne.
Summingthesesectoralestimates
across
commutingzo
nes
yieldsnationwideestimates.Seethetext
fordefi
nitionsoftheexposed,nonexposedtradable,and
nonexposednontradable
sectors.Forboth
industry-level
andcommutingzo
ne–levelanalyses,predictionsfor1991
–2011equalthesum
ofthepredictionsforthetw
osubperiods.
Predictedem
ploymentchangesfortheperiod1991
–2007arecomputedsimilarly,usingcoefficients
from
modelsestimated
overthestacked
periods1991–9
9and1999
–2007.
This content downloaded from 23.235.32.0 on Fri, 18 Dec 2015 07:23:05 AMAll use subject to JSTOR Terms and Conditions
to reallocation effects, our industry-level estimates of employment reduc-tion should indeed be lower bounds.51
VII. Concluding Discussion
In the years leading up to the Great Recession, overall US employmentgrowth was slow and manufacturing employment experienced a steepcontraction. In this article, we investigate the contribution of the rise inimport competition from China to this employment “sag.”We begin by estimating the direct effect of trade competition on em-
ployment in manufacturing industries that are differentially exposed togrowing Chinese import penetration and then expand the analysis to in-clude multiple general equilibrium channels through which trade exposuremay affect employment: other sectors might be affected because they arerelated to the affected sectors through input-output linkages; employmentmay reallocate away from trade-exposed industries toward nonexposed in-dustries; and Keynesian-type aggregate demand spillovers may significantlymagnify the direct competition effect.In our analysis of US national industries, we estimate upstream and
downstream trade effects for both manufacturing and nonmanufactur-ing sectors. We expect upstream effects to contribute to further job losses,while the impact of downstream effects is ambiguous. Consistent with theseexpectations, we find large negative employment responses when an in-dustry’s customers are exposed to trade competition and unstable effectswhen an industry’s suppliers are exposed to trade competition.As a complementary strategy, we assess the impact of Chinese trade on
US commuting zones to jointly estimate reallocation and aggregate demandeffects at the local level. Theoretically, if an industry contracts in a local labormarket because of Chinese competition, then, barring substantial interre-gional migration, some other industry in the same labor market should ex-pand. In addition, part of any aggregate demand spillovers will also accrueto the local labor market. Our estimates show sizable job losses in exposedindustries and few, if any, offsetting job gains in nonexposed industries, apattern that is consistent with substantial job loss due to aggregate demandspillovers.Our results are a first step in quantifying the employment impact of
increasing import competition on the US labor market. Several questionsremain unanswered that could be addressed in future work. Using plant-level data to achieve a finer distinction between tradable and nontradable
51 In particular, recall that the industry-level numbers could underestimate the netemployment losses due to aggregate demand effects or overestimate these losses dueto reallocation effects. But if reallocation effects are modest and are swamped bydemand effects at the local level, as suggested by the table 7 estimates, we would alsoexpect the demand effects to dominate at the aggregate level—especially since thesedemand effects are themselves underestimated at the local level.
Import Competition and the Great US Employment Sag S183
This content downloaded from 23.235.32.0 on Fri, 18 Dec 2015 07:23:05 AMAll use subject to JSTOR Terms and Conditions
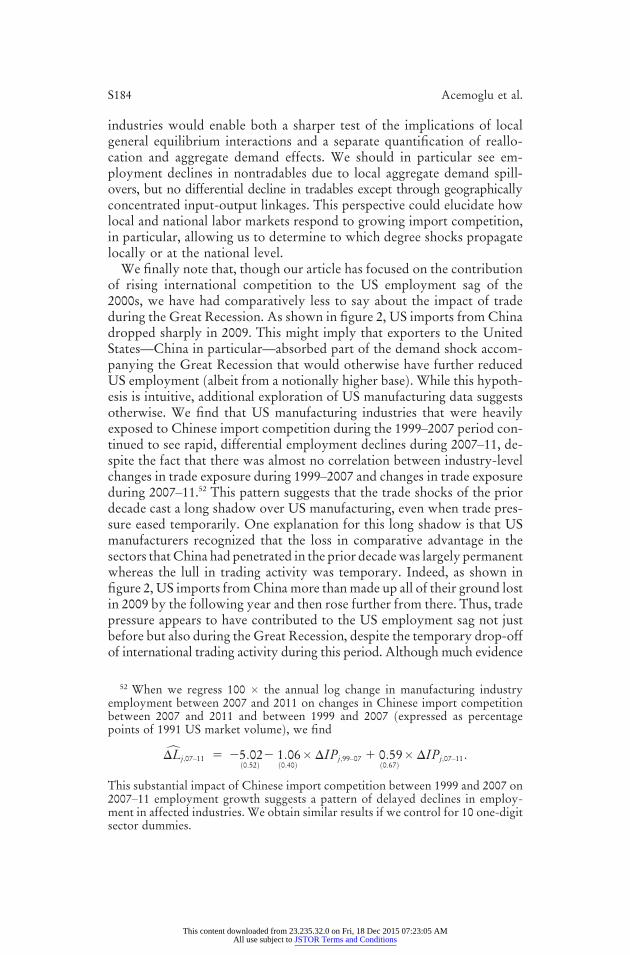
industries would enable both a sharper test of the implications of localgeneral equilibrium interactions and a separate quantification of reallo-cation and aggregate demand effects. We should in particular see em-ployment declines in nontradables due to local aggregate demand spill-overs, but no differential decline in tradables except through geographicallyconcentrated input-output linkages. This perspective could elucidate howlocal and national labor markets respond to growing import competition,in particular, allowing us to determine to which degree shocks propagatelocally or at the national level.We finally note that, though our article has focused on the contribution
of rising international competition to the US employment sag of the2000s, we have had comparatively less to say about the impact of tradeduring the Great Recession. As shown in figure 2, US imports from Chinadropped sharply in 2009. This might imply that exporters to the UnitedStates—China in particular—absorbed part of the demand shock accom-panying the Great Recession that would otherwise have further reducedUS employment ðalbeit from a notionally higher baseÞ. While this hypoth-esis is intuitive, additional exploration of US manufacturing data suggestsotherwise. We find that US manufacturing industries that were heavilyexposed to Chinese import competition during the 1999–2007 period con-tinued to see rapid, differential employment declines during 2007–11, de-spite the fact that there was almost no correlation between industry-levelchanges in trade exposure during 1999–2007 and changes in trade exposureduring 2007–11.52 This pattern suggests that the trade shocks of the priordecade cast a long shadow over US manufacturing, even when trade pres-sure eased temporarily. One explanation for this long shadow is that USmanufacturers recognized that the loss in comparative advantage in thesectors thatChina had penetrated in the prior decadewas largely permanentwhereas the lull in trading activity was temporary. Indeed, as shown infigure 2, US imports fromChina more thanmade up all of their ground lostin 2009 by the following year and then rose further from there. Thus, tradepressure appears to have contributed to the US employment sag not justbefore but also during the Great Recession, despite the temporary drop-offof international trading activity during this period. Although much evidence
52 When we regress 100 � the annual log change in manufacturing industryemployment between 2007 and 2011 on changes in Chinese import competitionbetween 2007 and 2011 and between 1999 and 2007 ðexpressed as percentagepoints of 1991 US market volumeÞ, we find
cDLj;07–11 5 25:02ð0:52Þ
2 1:06ð0:40Þ
� DIPj;99–07 1 0:59ð0:67Þ
� DIPj;07–11:
This substantial impact of Chinese import competition between 1999 and 2007 on2007–11 employment growth suggests a pattern of delayed declines in employ-ment in affected industries. We obtain similar results if we control for 10 one-digitsector dummies.
S184 Acemoglu et al.
This content downloaded from 23.235.32.0 on Fri, 18 Dec 2015 07:23:05 AMAll use subject to JSTOR Terms and Conditions
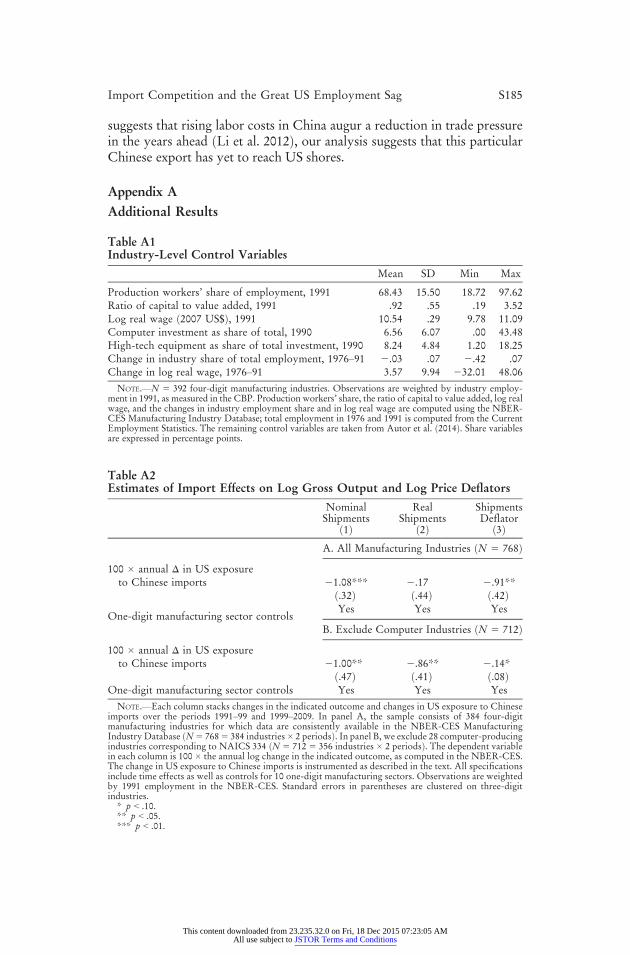
suggests that rising labor costs in China augur a reduction in trade pressurein the years ahead ðLi et al. 2012Þ, our analysis suggests that this particularChinese export has yet to reach US shores.
Appendix AAdditional Results
Table A1Industry-Level Control Variables
Mean SD Min Max
Production workers’ share of employment, 1991 68.43 15.50 18.72 97.62Ratio of capital to value added, 1991 .92 .55 .19 3.52Log real wage ð2007 US$Þ, 1991 10.54 .29 9.78 11.09Computer investment as share of total, 1990 6.56 6.07 .00 43.48High-tech equipment as share of total investment, 1990 8.24 4.84 1.20 18.25Change in industry share of total employment, 1976–91 2.03 .07 2.42 .07Change in log real wage, 1976–91 3.57 9.94 232.01 48.06
NOTE.—N 5 392 four-digit manufacturing industries. Observations are weighted by industry employ-ment in 1991, as measured in the CBP. Production workers’ share, the ratio of capital to value added, log realwage, and the changes in industry employment share and in log real wage are computed using the NBER-CES Manufacturing Industry Database; total employment in 1976 and 1991 is computed from the CurrentEmployment Statistics. The remaining control variables are taken from Autor et al. ð2014Þ. Share variablesare expressed in percentage points.
Table A2Estimates of Import Effects on Log Gross Output and Log Price Deflators
NominalShipments
ð1ÞReal
Shipmentsð2Þ
ShipmentsDeflator
ð3ÞA. All Manufacturing Industries ðN 5 768Þ
100 � annual D in US exposureto Chinese imports 21.08*** 2.17 2.91**
ð.32Þ ð.44Þ ð.42ÞOne-digit manufacturing sector controls
Yes Yes Yes
B. Exclude Computer Industries ðN 5 712Þ100 � annual D in US exposureto Chinese imports 21.00** 2.86** 2.14*
ð.47Þ ð.41Þ ð.08ÞOne-digit manufacturing sector controls Yes Yes Yes
NOTE.—Each column stacks changes in the indicated outcome and changes in US exposure to Chineseimports over the periods 1991–99 and 1999–2009. In panel A, the sample consists of 384 four-digitmanufacturing industries for which data are consistently available in the NBER-CES ManufacturingIndustry Database ðN5 7685 384 industries� 2 periodsÞ. In panel B, we exclude 28 computer-producingindustries corresponding to NAICS 334 ðN 5 712 5 356 industries � 2 periodsÞ. The dependent variablein each column is 100 � the annual log change in the indicated outcome, as computed in the NBER-CES.The change in US exposure to Chinese imports is instrumented as described in the text. All specificationsinclude time effects as well as controls for 10 one-digit manufacturing sectors. Observations are weightedby 1991 employment in the NBER-CES. Standard errors in parentheses are clustered on three-digitindustries.
* p < .10.** p < .05.*** p < .01.
Import Competition and the Great US Employment Sag S185
This content downloaded from 23.235.32.0 on Fri, 18 Dec 2015 07:23:05 AMAll use subject to JSTOR Terms and Conditions
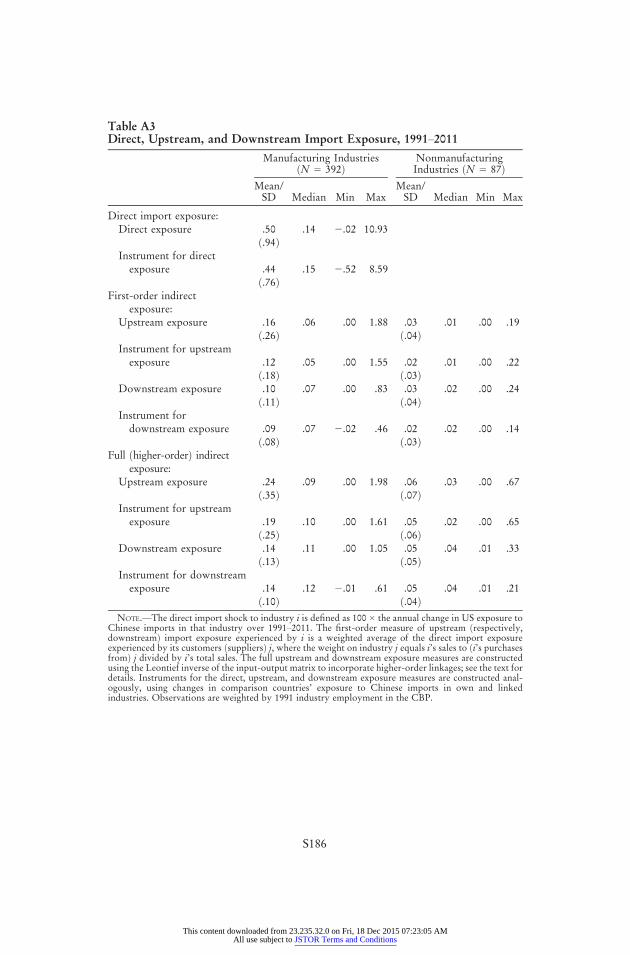
Table A3Direct, Upstream, and Downstream Import Exposure, 1991–2011
Manufacturing IndustriesðN 5 392Þ
NonmanufacturingIndustries ðN 5 87Þ
Mean/SD Median Min Max
Mean/SD Median Min Max
Direct import exposure:Direct exposure .50 .14 2.02 10.93
ð.94ÞInstrument for directexposure .44 .15 2.52 8.59
ð.76ÞFirst-order indirect
exposure:Upstream exposure .16 .06 .00 1.88 .03 .01 .00 .19
ð.26Þ ð.04ÞInstrument for upstreamexposure .12 .05 .00 1.55 .02 .01 .00 .22
ð.18Þ ð.03ÞDownstream exposure .10 .07 .00 .83 .03 .02 .00 .24
ð.11Þ ð.04ÞInstrument fordownstream exposure .09 .07 2.02 .46 .02 .02 .00 .14
ð.08Þ ð.03ÞFull ðhigher-orderÞ indirect
exposure:Upstream exposure .24 .09 .00 1.98 .06 .03 .00 .67
ð.35Þ ð.07ÞInstrument for upstreamexposure .19 .10 .00 1.61 .05 .02 .00 .65
ð.25Þ ð.06ÞDownstream exposure .14 .11 .00 1.05 .05 .04 .01 .33
ð.13Þ ð.05ÞInstrument for downstreamexposure .14 .12 2.01 .61 .05 .04 .01 .21
ð.10Þ ð.04ÞNOTE.—The direct import shock to industry i is defined as 100 � the annual change in US exposure to
Chinese imports in that industry over 1991–2011. The first-order measure of upstream ðrespectively,downstreamÞ import exposure experienced by i is a weighted average of the direct import exposureexperienced by its customers ðsuppliersÞ j, where the weight on industry j equals i’s sales to ði’s purchasesfromÞ j divided by i’s total sales. The full upstream and downstream exposure measures are constructedusing the Leontief inverse of the input-output matrix to incorporate higher-order linkages; see the text fordetails. Instruments for the direct, upstream, and downstream exposure measures are constructed anal-ogously, using changes in comparison countries’ exposure to Chinese imports in own and linkedindustries. Observations are weighted by 1991 industry employment in the CBP.
S186
This content downloaded from 23.235.32.0 on Fri, 18 Dec 2015 07:23:05 AMAll use subject to JSTOR Terms and Conditions
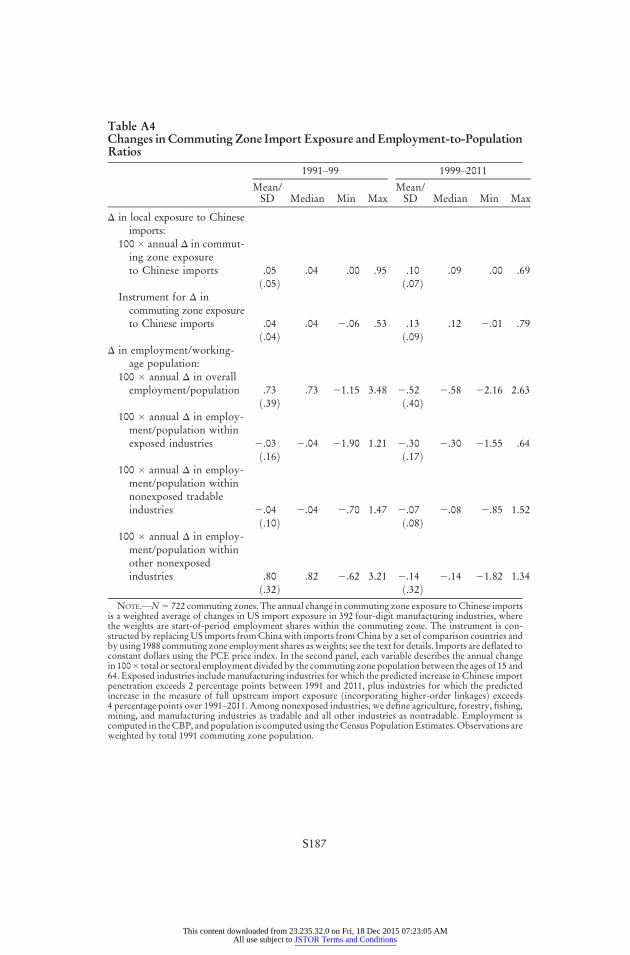
Table A4Changes inCommuting Zone Import Exposure and Employment-to-PopulationRatios
1991–99 1999–2011
Mean/SD Median Min Max
Mean/SD Median Min Max
D in local exposure to Chineseimports:
100 � annual D in commut-ing zone exposureto Chinese imports .05 .04 .00 .95 .10 .09 .00 .69
ð.05Þ ð.07ÞInstrument for D incommuting zone exposureto Chinese imports .04 .04 2.06 .53 .13 .12 2.01 .79
ð.04Þ ð.09ÞD in employment/working-
age population:100 � annual D in overallemployment/population .73 .73 21.15 3.48 2.52 2.58 22.16 2.63
ð.39Þ ð.40Þ100 � annual D in employ-ment/population withinexposed industries 2.03 2.04 21.90 1.21 2.30 2.30 21.55 .64
ð.16Þ ð.17Þ100 � annual D in employ-ment/population withinnonexposed tradableindustries 2.04 2.04 2.70 1.47 2.07 2.08 2.85 1.52
ð.10Þ ð.08Þ100 � annual D in employ-ment/population withinother nonexposedindustries .80 .82 2.62 3.21 2.14 2.14 21.82 1.34
ð.32Þ ð.32ÞNOTE.—N5 722 commuting zones. The annual change in commuting zone exposure toChinese imports
is a weighted average of changes in US import exposure in 392 four-digit manufacturing industries, wherethe weights are start-of-period employment shares within the commuting zone. The instrument is con-structed by replacingUS imports fromChinawith imports fromChina by a set of comparison countries andby using 1988 commuting zone employment shares asweights; see the text for details. Imports are deflated toconstant dollars using the PCE price index. In the second panel, each variable describes the annual changein 100� total or sectoral employment divided by the commuting zone population between the ages of 15 and64. Exposed industries include manufacturing industries for which the predicted increase in Chinese importpenetration exceeds 2 percentage points between 1991 and 2011, plus industries for which the predictedincrease in the measure of full upstream import exposure ðincorporating higher-order linkagesÞ exceeds4 percentage points over 1991–2011. Among nonexposed industries, we define agriculture, forestry, fishing,mining, and manufacturing industries as tradable and all other industries as nontradable. Employment iscomputed in theCBP, andpopulation is computed using theCensus PopulationEstimates.Observations areweighted by total 1991 commuting zone population.
S187
This content downloaded from 23.235.32.0 on Fri, 18 Dec 2015 07:23:05 AMAll use subject to JSTOR Terms and Conditions
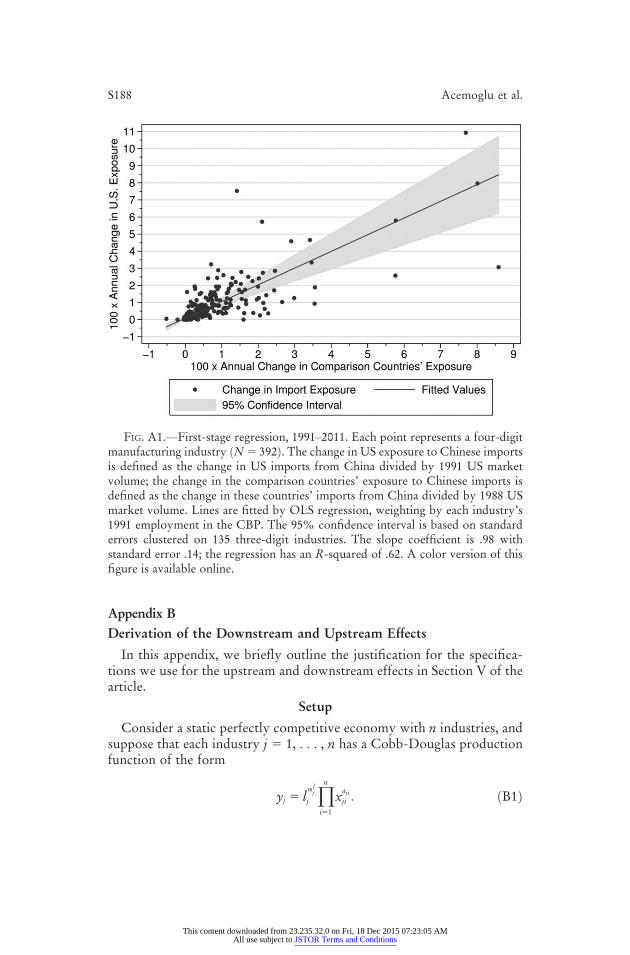
FIG. A1.—First-stage regression, 1991–2011. Each point represents a four-digitmanufacturing industry ðN5 392Þ. The change in US exposure to Chinese importsis defined as the change in US imports from China divided by 1991 US marketvolume; the change in the comparison countries’ exposure to Chinese imports isdefined as the change in these countries’ imports from China divided by 1988 USmarket volume. Lines are fitted by OLS regression, weighting by each industry’s1991 employment in the CBP. The 95% confidence interval is based on standarderrors clustered on 135 three-digit industries. The slope coefficient is .98 withstandard error .14; the regression has an R-squared of .62. A color version of thisfigure is available online.
Appendix BDerivation of the Downstream and Upstream Effects
In this appendix, we briefly outline the justification for the specifica-tions we use for the upstream and downstream effects in Section V of thearticle.
Setup
Consider a static perfectly competitive economy with n industries, andsuppose that each industry j 5 1, . . . , n has a Cobb-Douglas productionfunction of the form
yj 5 la lj
j Pni51
xajiji : ðB1Þ
S188 Acemoglu et al.
This content downloaded from 23.235.32.0 on Fri, 18 Dec 2015 07:23:05 AMAll use subject to JSTOR Terms and Conditions

Here xji is the quantity of goods produced by industry i used as inputs byindustry j. We assume that, for each j, al
j> 0, and aji 0 for all i, and that
alj 1 o
n
i51
aji 5 1;
so that the production function of each industry exhibits constant returnsto scale. ðPhysical capital can also be introduced without affecting theresults, but we omit it to simplify the notation and the discussion.ÞThe output of each industry is used as input for other industries or
consumed in the final-good sector. In addition, there are also importsfrom abroad ðsay ChinaÞ, and we ignore exports for simplicity ðand thusalso ignored is the trade balance conditionÞ. The market-clearing condi-tion for industry j can then be written as
yj 5 cj 1 on
k51
xkj 2mj; ðB2Þ
where cj is final consumption of the output of industry j, and mj denotestotal ðrealÞ imports.The preference side of this economy is summarized by a representative
household with a utility function
uðc1; c2; : : : ; cnÞ:We focus on the competitive equilibrium of this economy.
Main Result
First consider the unit cost function of sector j:
Cðp; wÞ5 Bjwa ljPni51
pajii ; ðB3Þ
where p is the vector of prices, w is the wage rate, and
Bj 5
�1
alj
�aljPni51
�1
aji
�aji
is a sector-specific constant.Cost minimization of industry j ðgiven competitivemarketsÞ implies that
aji 5pixji
pjyj
; ðB4Þ
where pj is the price of the output of industry j. This expression makes itclear that aij’s also correspond to the entries of the input-output matrix,which we denote by A.
Import Competition and the Great US Employment Sag S189
This content downloaded from 23.235.32.0 on Fri, 18 Dec 2015 07:23:05 AMAll use subject to JSTOR Terms and Conditions
Next, given the constant returns to scale production function of eachsector specified in ðB1Þ, prices satisfy the zero profit conditions of the nsectors in the competitive equilibrium. In particular, the price of good jmust be equal to the unit cost function of that sector, ðB3Þ, and thus
pj 5 Bjwa ljPni51
pajii :
Taking logs, we have
ln pj 5 lnBj 1 alj lnw1 o
n
i51
aji lnpi for all j ∈ f1; : : : ; ng:
Let us choose w 5 1 as the numeraire. Then, these equations define ann-equation system in n prices
lnp5 ðI2AÞ21b;
where, as noted above,A is the input-output matrix of the economy, and bis the vector with entries given by ln Bi ðand we are using the fact that lnw 5 0Þ. This implies that prices in this economy are determined inde-pendently of imports ðpurely from the supply sideÞ. Consequently, therewill be only quantity responses to imports.But from consumer maximization, with unchanged prices, relative
consumption levels remain unchanged. How total consumption is affecteddepends on whether there is trade balance or not. With trade balance, theeconomy would have to export some goods to make up for the increasein imports. Here for simplicity, we allow for a trade deficit and thus leavethe entire consumption vector unchanged. With unchanged consumptionlevels, we must have from ðB2Þ combined with ðB4Þ that
ajidð pjyjÞ5 dðpixjiÞ: ðB5Þ
For future reference, let us define nominal values ðwhich are moreuseful for several of the expressions belowÞ with tildes. For example,
~xji ; pixji;
~yj ; pjyj;
~mj ; pjmj:
Then ðB5Þ can be equivalently written as
ajid~yj 5 d~xji: ðB6Þ
S190 Acemoglu et al.
This content downloaded from 23.235.32.0 on Fri, 18 Dec 2015 07:23:05 AMAll use subject to JSTOR Terms and Conditions

Now totally differentiating the resource constraint, ðB2Þ, for sector i,we obtain
dyi 5 dci 1 on
j51
dxji 2 dmi;
which, using ðB6Þ and the fact that consumption levels are not changing,can be written as
dðpiyiÞpiyi
5 on
j51
aji
dð pjyjÞpiyi
2dð pimiÞpiyi
:
Writing this in matrix form, and noting that, because prices are constant,dð piyiÞ=piyi 5 d lnyi, we have
d lny5 A0d lny2 Ldm
5 2ðI2 A0Þ21
Ldm
5 2H0Ldm;
ðB7Þ
where m is the vector with entries given by pimi, H5 ðI2 AÞ21,
A5
a11 a12 � � �a21 a22
���
ann
0BBBB@
1CCCCA;
with entries aij 5 pjxij=pjyj ðas opposed to aij, which is equal to pjxij/piyiÞ,and L is the matrix with 1=~yj on the diagonals and zero on the non-diagonals.53 Intuitively, any import shock creates a direct negative effecton the directly affected sector, which is captured by the matrix L, and theindirect effects are summarized by the Leontief inverse matrix H0
.We can see from this expression that there will be only upstream effects
ðsimply note that it is the transpose of the matrix A, A0, that matters in the
Leontief inverse, thus corresponding to transmission only in the upstreamdirectionÞ. This is a consequence of the fact that there are no changes inprices, and hence quantities will respond to changes in imports; but foreach change in the quantity of a sector directly affected by imports fromChina, the quantities of inputs that it receives from its suppliers will haveto adjust, causing upstream propagation.54 In fact, the matrix H0
is exactly
53 Note that since the largest eigenvalue of A is less than one, I2 A0is invertible.
54 There would be further effects if we were to impose trade balance, becausesome sectors would have to expand in order to compensate for the increase inimports. In that case the matrix L would have nonzero off-diagonals.
Import Competition and the Great US Employment Sag S191
This content downloaded from 23.235.32.0 on Fri, 18 Dec 2015 07:23:05 AMAll use subject to JSTOR Terms and Conditions
what we use in Section V for computing the full ðLeontief inverseÞ up-stream effects.Equation ðB7Þ gives the output responses to import shocks. It is
straightforward to derive from this the employment responses, which areour main focus. In particular, given the Cobb-Douglas form of the pro-duction function in ðB1Þ, cost minimization for industry i implies thatwli 5 al
ipiyi. Since the wage is constant, employment in industry i is pro-portional to its nominal output, enabling us to work with an analogue ofðB7Þ with employment on the left-hand side.We next develop a more heuristic derivation of this result, which pro-
vides further intuition, shows how the full effects summarized by theLeontief inverse matrix H0
come about, and also explains why under moregeneral conditions there might also be some downstream effects.
Heuristic Derivation
Let us first ignore the second- and higher-order input-output linkagesand focus on first-order impacts. Let us use the notation for nominalvariables introduced above and begin by approximating the impact of theincrease in imports in industry j on domestic production in the sameindustry as d~yj ≈ 2d ~mj. ðThis is clearly an approximation, since as ourderivation in the previous section showed, therewill be higher-order effectson the output of sector j as captured by the Leontief inverse matrix H0
.ÞNote further that from ðB4Þ, any reduction in the value of output of an
industry translates into a proportionate reduction in all of the inputs, inparticular,
d~xji
d~yj
5 aji ðB8Þ
for each industry i. Then from ðB8Þ we have
d~yi
d ~mj
≈ 2d~yi
d~yj
5 2aji
for each industry i ≠ j, and we have
d~yj
d ~mj
≈ 2ð11 ajjÞ
for industry j itself, reflecting both direct import substitution and theresultant decline in j’s demand for its own inputs. These two cases can bedealt with succinctly by defining dij ; 1fi5 jg, so that for any industries iand j,
S192 Acemoglu et al.
This content downloaded from 23.235.32.0 on Fri, 18 Dec 2015 07:23:05 AMAll use subject to JSTOR Terms and Conditions

d~yi
d ~mj
≈ 2ðdij 1 ajiÞ:
For small changes in mj, a first-order Taylor approximation gives thetotal impact on domestic production in industry i as
d~yi ≈d~yi
d ~mj
� d ~mj ≈ 2ðdij 1 ajiÞ � d ~mj:
Now turning this into a proportional ðlogÞ effect by normalizing theimpact on industry i relative to its domestic production, we obtain
d~yi
~yi
≈d~yi
d ~mj
� d ~mj �1
~yi
≈ 2ðdij 1 ajiÞ � d ~mj �1
~yi
:
This expression shows how industry i is affected when a single industryj to which it sells inputs is exposed to import competition. We can nextcompute the total effect on industry i from the full vector of import changesby summing this expression across all of i’s customer industries:
ðd ln~yiÞfirst-order ≈�on
j51
d~yi
d ~mj
� d ~mj �1
~yi
�first-order
≈ 2on
j51
ðdij 1 ajiÞ � d ~mj �1
~yi
5 2on
j51
ðdij 1 ajiÞ � d ~mj �1
~yj
;
ðB9Þ
where aij’s correspond to the entries of the matrix A used in equation ðB7Þ.Now using the same matrix notation as in that equation, this relationshipcan be written as
d lnyfirst-order ≈ 2ðI1 A0ÞLDm;
which clarifies that first-order effects take exactly the same form as the fulleffects we just derived, but with only the direct effect working through thetranspose of the matrix A included ðhence the first-order designationrather than the full effectsÞ. This expression is what we use to computefirst-order downstream effects in Section V.55
55 Using ðB4Þ, we can rewrite on
j51aji � d ~mj � 1=~yj as
on
j51
~xji
~yi
d ~mj
~yj
;
Import Competition and the Great US Employment Sag S193
This content downloaded from 23.235.32.0 on Fri, 18 Dec 2015 07:23:05 AMAll use subject to JSTOR Terms and Conditions

Our more rigorous derivation in the previous subsection makes it clearthat the first-order effect cannot be isolated from higher-order effects,since an increase in mj will have an impact on yk and from there on thesectors supplying inputs to k and so on. Letting Ai denote the ith columnof A, A2
i denote the ith column of A2, and so on, we can obtain
ðd ln~yiÞfull 5�on
j51
d~yi
d ~mj
� d ~mj �1
~yi
�full
5 2
�e0i � d ~m � 1
~yi
1 ðAiÞ0 � d ~m � 1
~yi
1 ðA2i Þ0 � d ~m � 1
~yi
1 � � ��
5 2½e0i 1 ðAiÞ0 1 ðA2i Þ0 1 � � �� � d ~m � 1
~yi
5 2½ðI2A0Þ21
i � � d ~m � 1
~yi
:
Using the same notation as above, this can be rewritten as
d lny5 2ðI2 A0Þ21Ldm
5 2H0Ldm;
confirming ðB7Þ.Downstream Effects
Downstream effects simply correspond to effects that spread down-stream following the input-output matrix A, and in our empirical workwe construct first-order and full downstream effects as 2ðI2 A
0Þ21Ldm
and 2ðI2AÞ21Ldm, respectively.
The above derivation confirms that, in our baseline model, there are nodownstream effects fromchanges in imports. This result, however, dependson certain assumptions. First, the focus on competitive equilibrium inwhich there are no relationship-specific investments between input sup-pliers and customers is important. Second, the feature that there are nopriceeffects, which will no longer be true with departures from perfectly com-petitive markets, also plays a major role.
which clarifies that the upstream effect on industry i is a sales-weighted average ofthe proportional import shocks experienced by its customers j. In our empiricalwork, import changes correspond to changes in Chinese import penetration, andthe weights are constructed using the 1992 BEA benchmark input-output table.Our empirical measure also denominates import changes by US market volume ineach industry ðshipments plus imports minus exportsÞ rather than by industryshipments.
S194 Acemoglu et al.
This content downloaded from 23.235.32.0 on Fri, 18 Dec 2015 07:23:05 AMAll use subject to JSTOR Terms and Conditions
In particular, without the competitive equilibrium assumption, the in-crease in importsmay drive some producers out of themarket, and thismayhave a negative impact on firms that are their customers, creating negativedownstream effects. Conversely, if there are declines in the prices of goodsbeing imported more intensively from China, this may create positivedownstream effects as customers using these goods as inputs can expandtheir operations.Ultimately, whether there are downstream effects or not is an empirical
question, and our results do not provide much evidence for sizable down-stream effects.
References
Acemoglu, Daron, David Autor, David Dorn, Gordon H. Hanson, andBrendan Price. 2014a. Import competition and the great U.S. employ-ment sag of the 2000s. NBER Working Paper no. 20395, National Bu-reau of Economic Research, Cambridge, MA.
———. 2014b. Return of the Solow paradox? IT, productivity, andemployment in U.S. manufacturing. American Economic Review Papersand Proceedings 104, no. 5:394–99.
Acemoglu,Daron,VascoCarvalho,AsumanOzdaglar, andAlirezaTahbaz-Salehi. 2012. The network origins of aggregate fluctuations. Econometrica80, no. 5:1977–2016.
Amiti, Mary, and David E. Weinstein. 2011. Exports and financial shocks.Quarterly Journal of Economics 126, no. 4:1841–77.
Artuc, Erhan, ShubhamChaudhuri, and JohnMcLaren. 2010. Trade shocksand labor adjustment: A structural empirical approach. American Eco-nomic Review 100, no. 3:1008–45.
Autor, David H., and David Dorn. 2013. The growth of low-skill servicejobs and the polarization of the U.S. labor market. American EconomicReview 103, no. 5:1553–97.
Autor, David H., David Dorn, and Gordon H. Hanson. 2013. The Chinasyndrome: Local labor market effects of import competition in theUnited States. American Economic Review 103, no. 6:2121–68.
———. 2015. Untangling trade and technology: Evidence from local la-bour markets. Economic Journal 125, no. 584:621–46.
Autor, David H., David Dorn, Gordon H. Hanson, and Jae Song. 2014.Trade adjustment: Worker level evidence. Quarterly Journal of Eco-nomics 129, no. 4:1799–1860.
Autor, David H., Lawrence F. Katz, and Alan B. Krueger. 1998. Com-puting inequality: Have computers changed the labor market? Quar-terly Journal of Economics 113, no. 4:1169–1213.
Balsvik, Ragnhild, Sissel Jensen, and Kjell G. Salvanes. 2014. Made in China,sold in Norway: Local labor market effects of an import shock. IZADiscussion Paper no. 8324, Institute for the Study of Labor, Bonn.
Import Competition and the Great US Employment Sag S195
This content downloaded from 23.235.32.0 on Fri, 18 Dec 2015 07:23:05 AMAll use subject to JSTOR Terms and Conditions

Becker, Randy, Wayne Gray, and Jordan Marvakov. 2013. NBER-CESmanufacturing industry database. Technical notes, National Bureau ofEconomic Research, Cambridge, MA.
Bernard, Andrew B., J. Bradford Jensen, and Peter K. Schott. 2006. Sur-vival of the best fit: Exposure to low-wage countries and the ðunevenÞgrowth of U.S. manufacturing plants. Journal of International Eco-nomics 68, no. 1:219–37.
Bloom, Nicholas, Mirko Draca, and John Van Reenen. 2015. Tradeinduced technical change? The impact of Chinese imports on innova-tion, IT, and productivity. Review of Economic Studies, forthcoming.
Brandt, Loren, Johannes Van Biesebroeck, and Yifan Zhang. 2012. Creativeaccounting or creative destruction? Firm-level productivity growth in Chi-nese manufacturing. Journal of Development Economics 97, no. 2:339–51.
Charles, Kerwin Kofi, Eric Hurst, and Matthew J. Notowidigdo. 2013.Manufacturing decline, housing booms, and non-employment. NBERWorking Paper no. 18949, National Bureau of Economic Research,Cambridge, MA.
Chor, Davin, and Kalina Manova. 2012. Off the cliff and back? Creditconditions and international trade during the global financial crisis.Journal of International Economics 87, no. 1:117–33.
De Loecker, Jan, Pinelopi K. Goldberg, Amit K. Khandelwal, and NinaPavcnik. 2014. Prices, markups, and trade reform. NBERWorking Paperno. 17925, National Bureau of Economic Research, Cambridge, MA.
Dix-Carneiro, Rafael, and Brian K Kovak. 2015. Trade reform and re-gional dynamics: Evidence from 25 years of Brazilianmatched employer-employee data. Unpublished manuscript ðJanuaryÞ, Carnegie MellonUniversity.
Doms, Mark, Timothy Dunne, and Kenneth R. Troske. 1997. Workers,wages, and technology.Quarterly Journal of Economics 112, no. 1:253–90.
Eaton, Jonathan, Samuel Kortum, Brent Neiman, and John Romalis. 2013.Trade and the global recession. Unpublished manuscript ðMayÞ, BoothSchool of Business, University of Chicago.
Ebenstein, Avraham, Ann Harrison, Margaret McMillan, and ShannonPhillips. 2014. Estimating the impact of trade and offshoring on Amer-ican workers using the Current Population Surveys. Review of Eco-nomics and Statistics 96, no. 4:581–95.
Ellison, Glenn, Edward Glaeser, and William Kerr. 2010. What causesindustry agglomeration? Evidence from coagglomeration patterns. Amer-ican Economic Review 100, no. 3:1195–1213.
Feenstra, Robert C. 2003. Advanced international trade: Theory andevidence. Princeton, NJ: Princeton University Press.
Feenstra, Robert C., and Gordon H. Hanson. 2005. Ownership andcontrol in outsourcing to China: Estimating the property rights theoryof the firm. Quarterly Journal of Economics 120, no. 2:729–62.
S196 Acemoglu et al.
This content downloaded from 23.235.32.0 on Fri, 18 Dec 2015 07:23:05 AMAll use subject to JSTOR Terms and Conditions

Goldberg, Pinelopi, Amit Khandelwal, Nina Pavcnik, and Petia Topalova.2010. Imported intermediate inputs and domestic product growth: Evi-dence from India. Quarterly Journal of Economics 125, no. 4:1727–67.
Hanson, Gordon. 2012. The rise of middle kingdoms: Emerging econo-mies in global trade. Journal of Economic Perspectives 26, no. 2:41–64.
Harrison, Ann, John McLaren, and Margaret McMillan. 2011. Recent per-spectives on trade and inequality.Annual Review of Economics 3:261–89.
Harrison, Ann, and Margaret McMillan. 2011. Offshoring jobs? Multi-nationals and U.S. manufacturing employment. Review of Economicsand Statistics 93, no. 3:857–75.
Hart, Oliver, and John Moore. 1990. Property rights and the nature of thefirm. Journal of Political Economy 98, no. 6:1119–58.
Houseman, Susan N., Timothy J. Bartik, and Timothy J. Sturgeon. 2015.Measuring manufacturing: How the computer and semiconductorindustries affect the numbers and perceptions. In Measuring globaliza-tion: Better trade statistics for better policy, vol. 1, ed. Susan N. House-man and Michael Mandel, 151–94. Kalamazoo, MI: W. E. Upjohn In-stitute for Employment Research.
Hsieh, Chang-Tai, and Ralph Ossa. 2011. A global view of productivitygrowth in China. NBER Working Paper no. 16778, National Bureauof Economic Research, Cambridge, MA.
Krueger, Alan B., and Robert M. Solow. 2002. The Roaring Nineties: Canfull employment be sustained? New York: Russell Sage Foundation.
Levchenko, Andrei A., Logan T. Lewis, and Linda L. Tesar. 2010. Thecollapse of international trade during the 2008–09 crisis: In search of thesmoking gun. IMF Economic Review 58, no. 2:214–53.
Li, Hongbin, Lei Li, Binzhen Wu, and Yanyan Xiong. 2012. The end ofcheap Chinese labor. Journal of Economic Perspectives 26, no. 4:57–74.
Long, John B., Jr., and Charles I. Plosser. 1983. Real business cycles.Journal of Political Economy 91, no. 1:39–69.
McLaren, John, and Shushanik Hakobyan. 2012. Looking for local labormarket effects of NAFTA. Unpublished manuscript ðJulyÞ, Universityof Virginia.
Mian, Atif, and Amir Sufi. 2014. What explains the 2007–2009 drop inemployment? Econometrica 82, no. 6:2197–2223.
Moffitt, Robert A. 2012. The reversal of the employment-population ratioin the 2000s: Facts and explanations. Brookings Papers on EconomicActivity, no. 1:201–64.
Muendler, Marc, and Sascha O. Becker. 2010. Margins of multinationallabor substitution. American Economic Review 100, no. 5:1999–2030.
Naughton, Barry. 2007. The Chinese economy: Transitions and growth.Cambridge, MA: MIT Press.
Notowidigdo, Matthew J. 2013. The incidence of local labor demandshocks.Working paper, Booth School of Business, University of Chicago.
Import Competition and the Great US Employment Sag S197
This content downloaded from 23.235.32.0 on Fri, 18 Dec 2015 07:23:05 AMAll use subject to JSTOR Terms and Conditions

Pierce, Justin R., and Peter Schott. 2012. A concordance between ten-digitU.S. Harmonized System codes and SIC/NAICS product classes andindustries. Journal of Economic and Social Measurement 37, nos. 1–2:61–96.
———. 2015. The surprisingly swift decline of U.S. manufacturing em-ployment. Working paper, Department of Economics, Yale University.
Tolbert, Charles M., and Molly Sizer. 1996. U.S. commuting zones andlabor market areas: A 1990 update. Staff Paper no. 9614, EconomicResearch Service, Washington, DC.
Williamson, Oliver. 1975. Markets and hierarchies: Analysis and antitrustimplications. New York: Free Press.
Zhu, Xiaodong. 2012. Understanding China’s growth: Past, present, andfuture. Journal of Economic Perspectives 26, no. 4:103–24.
S198 Acemoglu et al.
This content downloaded from 23.235.32.0 on Fri, 18 Dec 2015 07:23:05 AMAll use subject to JSTOR Terms and Conditions
Related Documents


