HEALTH AND MEDICINE Copyright © 2019 The Authors, some rights reserved; exclusive licensee American Association for the Advancement of Science. No claim to original U.S. Government Works. Distributed under a Creative Commons Attribution NonCommercial License 4.0 (CC BY-NC). Noninvasive monitoring of chronic kidney disease using pH and perfusion imaging KowsalyaDevi Pavuluri 1,2 , Irini Manoli 3 , Alexandra Pass 3 , Yuguo Li 1,2 , Hilary J. Vernon 4 , Charles P. Venditti 3 , Michael T. McMahon 1,2 * Chronic Kidney Disease (CKD) is a cardinal feature of methylmalonic acidemia (MMA), a prototypic organic acide- mia. Impaired growth, low activity, and protein restriction affect muscle mass and lower serum creatinine, which can delay diagnosis and management of renal disease. We have designed an alternative strategy for monitoring renal function based on administration of a pH sensitive MRI agent and assessed this in a mouse model. This protocol produced three metrics: kidney contrast, ~4% for severe renal disease mice compared to ~13% and ~25% for moderate renal disease and healthy controls, filtration fraction (FF), ~15% for severe renal disease mice compared to ~79% and 100% for moderate renal disease and healthy controls, and variation in pH, ~0.45 units for severe disease mice compared to 0.06 and 0.01 for moderate disease and healthy controls. Our results demonstrate that MRI can be used for early detection and monitoring of CKD. INTRODUCTION Organic acidemias represent a group of rare inborn errors of metab- olism caused by disturbances primarily of amino acid metabolism that result in large abnormal accumulations of often toxic organic acids in tissues and body fluids including in the urine. While indi- vidually rare, collectively, this group of inborn errors of metabolism leads to notable morbidity and mortality in infancy and childhood such that many of these disorders are now included in routine newborn screening panels to enable early diagnosis and treatment. Methylmalonic acidemia (MMA) is a common and severe organic acidemia with established knockout and tissue-specific transgenic mouse models that accurately replicate key features of the human disease, including C57BL/6 Mut -/- ;Tg INS-Alb-Mut mice, which have been used to model the renal disease of MMA (1–3). While early identi- fication and treatment have improved the clinical course and life expectancy in MMA, the patients remain at risk for chronic compli- cations, particularly chronic kidney disease (CKD) and, eventually, renal failure (4, 5). The glomerular filtration rate (GFR) is the standard index for de- termining renal function (6); however, direct measurements of GFR (mGFR) are invasive and cumbersome (7). Several types of clearance measurements are possible: 24-hour urine sampling, timed blood sampling, or image acquisitions. Measurements require monitor- ing plasma clearance of a marker, often radioisotopes [ 99m Tc-DTPA (diethylenetriamine pentaacetic acid) and 51 Cr-EDTA (ethylene- diamine tetraacetic acid)] and serial blood samples (inulin, iohexol, iothalamate, and others) that require complex protocols, involving the placement of multiple intravenous lines, repeat blood sampling over up to 8 to 24 hours, timed urination, and hospital monitoring. Furthermore, the downstream measurements typically require sample shipment to highly specialized laboratories, which creates substan- tial administrative burden on clinics and introduces a risk for post- collection errors. An alternative to mGFR is to estimate GFR (eGFR) using serum creatinine and/or cystatin-C (8–10), and is routinely used by clinicians (9). Computing eGFR through blood tests is much less complex be- cause these tests can be simple to perform, are widely available, and are much less expensive than obtaining the mGFR. However, it is well recognized that routine serum biomarkers of renal disease, such as creatinine, are poor screening tests of renal function because of the dependence on muscle mass, which is substantially altered in these severely growth-impaired and protein-restricted patients (11, 12). Furthermore, eGFR is limited for patients with asymptomatic renal disease, especially because they can demonstrate normal serum cre- atinine levels (13). The development of alternative methods to detect the early stages of CKD, and its evolution, is therefore necessary to fa- cilitate treatment of associated comorbidities and enable more timely planning of renoprotective or renal replacement therapies, including transplantation, in many patient populations. As a result, the devel- opment of new tools for detecting renal disease represents an unmet clinical need not only in MMA but also in the CKD population in general. Magnetic resonance imaging (MRI) can produce high-resolution images with exquisite soft tissue contrast and has long been recognized as an outstanding tool for detecting renal tumors (14), renal cysts, and other pathologies. Additional functional information can be acquired through administration of MR contrast agents. MR contrast agents can be used to measure parameters such as kidney clearance or to count the number of glomeruli with impressive results (15, 16) and are included in abdominal imaging protocols to better characterize the kidneys. As the kidney represents the major determinant of acid- base balance in the body, pH is also a useful biomarker of renal func- tion. MRI is also particularly well suited for pH imaging, as has been well described previously by a number of groups (17–19). Chemical exchange saturation transfer (CEST) MRI has now emerged as the premier technology for creating pH images (20, 21). CEST detects low concentrations of contrast agent through the ap- plication of saturation pulses on labile protons to destroy their mag- netization, with the resulting signal loss transferred to water through chemical exchange. The chemical shift dependence is an important fea- ture, allowing discrimination between different agents through what has 1 Division of MR Research, The Russell H. Morgan Department of Radiology and Radiological Science, The Johns Hopkins University School of Medicine, Baltimore, MD, USA. 2 F.M. Kirby Research Center for Functional Brain Imaging, Kennedy Krieger Institute, Baltimore, MD, USA. 3 Medical Genomics and Metabolic Genetics Branch, National Human Genome Research Institute, National Institutes of Health (NIH), Bethesda, MD, USA. 4 McKusick-Nathans Institute of Genetic Medicine, De- partment of Pediatrics, The Johns Hopkins University School of Medicine, Baltimore, MD, USA. *Corresponding author. Email: [email protected] SCIENCE ADVANCES | RESEARCH ARTICLE Pavuluri et al., Sci. Adv. 2019; 5 : eaaw8357 14 August 2019 1 of 10 on May 26, 2020 http://advances.sciencemag.org/ Downloaded from

Welcome message from author
This document is posted to help you gain knowledge. Please leave a comment to let me know what you think about it! Share it to your friends and learn new things together.
Transcript

SC I ENCE ADVANCES | R E S EARCH ART I C L E
HEALTH AND MED IC INE
1Division of MR Research, The Russell H. Morgan Department of Radiology andRadiological Science, The Johns Hopkins University School of Medicine, Baltimore,MD, USA. 2F.M. Kirby Research Center for Functional Brain Imaging, KennedyKrieger Institute, Baltimore, MD, USA. 3Medical Genomics and Metabolic GeneticsBranch, National Human Genome Research Institute, National Institutes of Health(NIH), Bethesda, MD, USA. 4McKusick-Nathans Institute of Genetic Medicine, De-partment of Pediatrics, The Johns Hopkins University School ofMedicine, Baltimore,MD, USA.*Corresponding author. Email: [email protected]
Pavuluri et al., Sci. Adv. 2019;5 : eaaw8357 14 August 2019
Copyright © 2019
The Authors, some
rights reserved;
exclusive licensee
American Association
for the Advancement
of Science. No claim to
originalU.S. Government
Works. Distributed
under a Creative
Commons Attribution
NonCommercial
License 4.0 (CC BY-NC).
Noninvasive monitoring of chronic kidney disease usingpH and perfusion imagingKowsalyaDevi Pavuluri1,2, Irini Manoli3, Alexandra Pass3, Yuguo Li1,2, Hilary J. Vernon4,Charles P. Venditti3, Michael T. McMahon1,2*
Chronic Kidney Disease (CKD) is a cardinal feature of methylmalonic acidemia (MMA), a prototypic organic acide-mia. Impaired growth, low activity, and protein restriction affect muscle mass and lower serum creatinine, whichcan delay diagnosis and management of renal disease. We have designed an alternative strategy for monitoringrenal function based on administration of a pH sensitive MRI agent and assessed this in a mouse model. Thisprotocol produced three metrics: kidney contrast, ~4% for severe renal disease mice compared to ~13% and~25% for moderate renal disease and healthy controls, filtration fraction (FF), ~15% for severe renal disease micecompared to ~79% and 100% for moderate renal disease and healthy controls, and variation in pH, ~0.45 units forsevere diseasemice compared to 0.06 and 0.01 formoderate disease and healthy controls. Our results demonstratethat MRI can be used for early detection and monitoring of CKD.
Do
on May 26, 2020
http://advances.sciencemag.org/
wnloaded from
INTRODUCTIONOrganic acidemias represent a group of rare inborn errors of metab-olism caused by disturbances primarily of amino acid metabolismthat result in large abnormal accumulations of often toxic organicacids in tissues and body fluids including in the urine. While indi-vidually rare, collectively, this group of inborn errors of metabolismleads to notable morbidity and mortality in infancy and childhoodsuch that many of these disorders are now included in routinenewborn screening panels to enable early diagnosis and treatment.Methylmalonic acidemia (MMA) is a common and severe organicacidemia with established knockout and tissue-specific transgenicmouse models that accurately replicate key features of the humandisease, including C57BL/6Mut−/−;TgINS-Alb-Mutmice, which have beenused to model the renal disease of MMA (1–3). While early identi-fication and treatment have improved the clinical course and lifeexpectancy in MMA, the patients remain at risk for chronic compli-cations, particularly chronic kidney disease (CKD) and, eventually, renalfailure (4, 5).
The glomerular filtration rate (GFR) is the standard index for de-termining renal function (6); however, direct measurements of GFR(mGFR) are invasive and cumbersome (7). Several types of clearancemeasurements are possible: 24-hour urine sampling, timed bloodsampling, or image acquisitions. Measurements require monitor-ing plasma clearance of a marker, often radioisotopes [99mTc-DTPA(diethylenetriamine pentaacetic acid) and 51Cr-EDTA (ethylene-diamine tetraacetic acid)] and serial blood samples (inulin, iohexol,iothalamate, and others) that require complex protocols, involvingthe placement of multiple intravenous lines, repeat blood samplingover up to 8 to 24 hours, timed urination, and hospital monitoring.Furthermore, the downstreammeasurements typically require sampleshipment to highly specialized laboratories, which creates substan-
tial administrative burden on clinics and introduces a risk for post-collection errors.
An alternative to mGFR is to estimate GFR (eGFR) using serumcreatinine and/or cystatin-C (8–10), and is routinely used by clinicians(9). Computing eGFR through blood tests is much less complex be-cause these tests can be simple to perform, are widely available, andare much less expensive than obtaining the mGFR. However, it iswell recognized that routine serum biomarkers of renal disease, suchas creatinine, are poor screening tests of renal function because of thedependence on muscle mass, which is substantially altered in theseseverely growth-impaired and protein-restricted patients (11, 12).Furthermore, eGFR is limited for patients with asymptomatic renaldisease, especially because they can demonstrate normal serum cre-atinine levels (13). The development of alternative methods to detectthe early stages of CKD, and its evolution, is therefore necessary to fa-cilitate treatment of associated comorbidities and enable more timelyplanning of renoprotective or renal replacement therapies, includingtransplantation, in many patient populations. As a result, the devel-opment of new tools for detecting renal disease represents an unmetclinical need not only in MMA but also in the CKD population ingeneral.
Magnetic resonance imaging (MRI) can produce high-resolutionimageswith exquisite soft tissue contrast and has long been recognizedas an outstanding tool for detecting renal tumors (14), renal cysts, andother pathologies. Additional functional information can be acquiredthrough administration of MR contrast agents. MR contrast agentscan be used to measure parameters such as kidney clearance or tocount the number of glomeruli with impressive results (15, 16) andare included in abdominal imaging protocols to better characterizethe kidneys. As the kidney represents the major determinant of acid-base balance in the body, pH is also a useful biomarker of renal func-tion. MRI is also particularly well suited for pH imaging, as has beenwell described previously by a number of groups (17–19).
Chemical exchange saturation transfer (CEST) MRI has nowemerged as the premier technology for creating pH images (20, 21).CEST detects low concentrations of contrast agent through the ap-plication of saturation pulses on labile protons to destroy their mag-netization, with the resulting signal loss transferred to water throughchemical exchange. The chemical shift dependence is an important fea-ture, allowing discrimination betweendifferent agents throughwhat has
1 of 10

SC I ENCE ADVANCES | R E S EARCH ART I C L E
been described as multicolor (22–24) or multifrequency MRI (25, 26).For pH imaging, it is important to create pHmaps that are independentof agent concentration, which can be accomplished using probes withtwo distinct labile protons (27, 28). We have long been interested inCEST MRI–based pH imaging using nonradioactive organic contrastagents and have developed methods to quantify chemical exchangerates as a function of pH (29), using imidazoles as CEST MRI pH sen-sors (30) aswell as smart biomaterials, which can be used tomonitor celldeath through pH changes that occur following transplantation (31).Iopamidol is an excellent pH probe with renal excretion that can detectacute kidney injury (AKI), as has been shown recently (28, 32, 33).
In this study, we use CESTMRI to functionally image kidneys andinvestigate the progression to CKD in an MMA mouse model. Wehave designed a time-efficient CESTMRI protocol to study iopamidol,a nonionic contrast agent, which has yielded both perfusion and pHmaps of the kidneys. Ourmethod allows facile determination ofmGFRand should be a useful method to diagnose and monitor CKD.
httpD
ownloaded from
RESULTSCalibration of ratiometric signal for pH mapping usingiopamidol in blood serumWe first prepared phantoms to test the sensitivity of iopamidol andevaluate our pHmapping protocols over a range of pH values relevantto our studies (pH values, 5.3 to 7.3). The structure of iopamidol is
Pavuluri et al., Sci. Adv. 2019;5 : eaaw8357 14 August 2019
shown in Fig. 1A. The Z-spectra of iopamidol in Fig. 1B display labileprotons resonating at 4.2 and 5.5 parts per million (ppm), which arewell resolved for a wide range of pH values.
We tested several radio frequency (RF) saturation powers (w1)from 1 to 5 mΤ and found that 4 mT provided the best ST ratio calibra-tion curve in blood serum (Fig. 1C), which has a relatively simple re-lationshipwith pH under these saturation conditions. Figure S1 showsan alternative w1 = 3 mT, which is the next best and has a shallowerdependence of ST ratio on pH for pH< 6. Figure S2 shows the ST ratioand pH measurement dependence as a function of DB0 for 4-mT sat-uration. The pH is fairly tolerant to B0 inhomogeneity at this satura-tion power, which is part of the reason for selecting it. For example, atpH values 5.7 and 5.9, field inhomogeneities DB0 = ±120 Hz generateerrors of <0.1 pH units. The inhomogeneity tolerance plot for 3-mTsaturation power (fig. S3) shows that DB0 = ±60 Hz has an error of≥0.1 unit at pH 5.7 and 5.9, a lower tolerance, which is less desirable.While the experimental design of using electrode pH for comparingwith calculated CEST MRI pH values on phantoms is a circular one,it is useful to depict the influence of experimental error using thesephantoms. Figure 1D shows the resultant pH maps for our bloodserum phantom, and Fig. 1E shows the SD for these pH determina-tions across each tube in the phantom. These data indicate that whilepH values between 7.3 and 5.7 can be readily measured using ourmultifrequency pH mapping protocol, pH values of 5.5 and beloware challenging. This can also be visualized by the spectra in Fig. 1B,
on May 26, 2020
://advances.sciencemag.org/
Fig. 1. In vitro calibration plots and pH maps using iopamidol in human blood serum. (A) Structure of iopamidol with exchangeable protons highlighted, whichproduce CEST contrast at 4.2 and 5.5 ppm at a relative concentration of 2:1. (B) CEST Z-spectra of iopamidol in blood serum at w1 = 4 mT for pH = 5.3, 6.1, 6.5, 6.9, and 7.3.(C) Calibration plot used to calculate in vitro and in vivo pH; variation of experimental ST ratio at different pH values was given by pH = p1 × (ST ratio)3 + p2 × (ST ratio)2 +p3 × (ST ratio)1 + p4, with p1 = −0.01174, p2 = 0.1653, p3 = −0.927, and p4 = 7.598. The root mean square error of the fit was 0.0714 for pH values from 5.5 to 7.3. (D) pHmaps of iopamidol-serum phantom. In the map, pH values below 5.5 were determined inaccurately. (E) Error bar plot representing the accuracy in MRI pH measure-ments compared to that of electrode pH for iopamidol-serum phantom. Error bars (blue) were obtained by calculating the mean SD in pH over a region of interest (ROI)drawn enclosing the entire tube in the phantom.
2 of 10
SC I ENCE ADVANCES | R E S EARCH ART I C L E
httpD
ownloaded from
which indicate very low contrast at pH5.3.We selected these conditionsfor live animal studies.
Development of an in vivo CEST MRI protocol to study amouse model of MMAWe then proceeded to testing the performance of iopamidol for CESTimaging inC57BL/6Mut−/−;TgINS-Alb-Mutmice (referred to asMut−/− inthe remaining text and figures) and control heterozygote littermates(Mut+/−;TgINS-Alb-Mut, referred asMut+/−). Themicewere divided intofour groups: regular diet (RD) control (Mut+/−), high-protein (HP)diet control (Mut+/−), mild kidney disease (RD Mut−/−), and severekidney disease (HPMut−/−) based on previous studies with this ani-mal model (1). In these mice, exposure to an HP diet was previouslyshown to cause massive elevations of plasma (MMA), associatedwith decreased GFR [extensively studied at the single-nephron andwhole-animal level, by plasma decay of 125I-iothalamate and fluores-cein isothiocyanate (FITC) inulin, respectively], elevated creatinine,and increased expression of lipocalin-2 (Lcn2; in the kidney tissueand plasma) in themutant animals (Mut−/−;TgINS-Alb-Mut). As shownin fig. S4,Mut+/−;TgINS-Alb-Mut mice had normal weight (20 to 30 g),low levels of plasma MMA, and low Lcn2mRNA expression in theirkidneys. For the Mut−/− mice, the plasma (MMA) and kidney Lcn2were significantly elevated when placed on the HP diet. As expected,their weight dropped with time on this diet, replicating the findings ofthe previous studies.We administered iopamidol at aweight-controlled
Pavuluri et al., Sci. Adv. 2019;5 : eaaw8357 14 August 2019
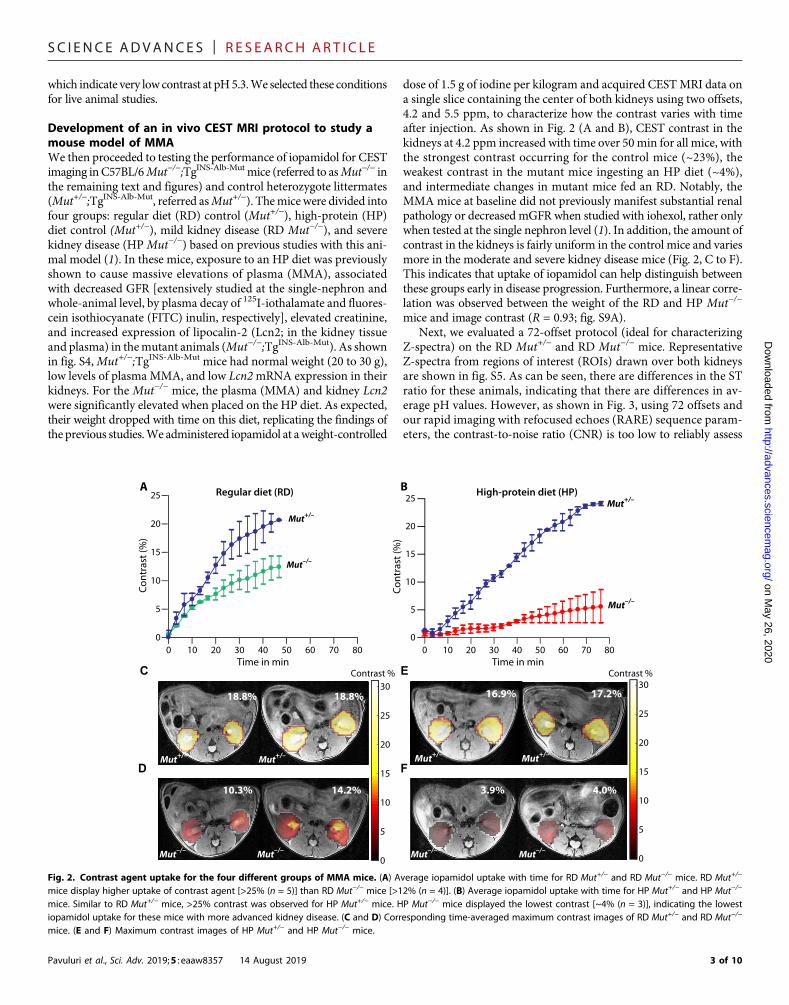
dose of 1.5 g of iodine per kilogram and acquired CESTMRI data ona single slice containing the center of both kidneys using two offsets,4.2 and 5.5 ppm, to characterize how the contrast varies with timeafter injection. As shown in Fig. 2 (A and B), CEST contrast in thekidneys at 4.2 ppm increased with time over 50min for all mice, withthe strongest contrast occurring for the control mice (~23%), theweakest contrast in the mutant mice ingesting an HP diet (~4%),and intermediate changes in mutant mice fed an RD. Notably, theMMA mice at baseline did not previously manifest substantial renalpathology or decreased mGFR when studied with iohexol, rather onlywhen tested at the single nephron level (1). In addition, the amount ofcontrast in the kidneys is fairly uniform in the control mice and variesmore in the moderate and severe kidney disease mice (Fig. 2, C to F).This indicates that uptake of iopamidol can help distinguish betweenthese groups early in disease progression. Furthermore, a linear corre-lation was observed between the weight of the RD and HP Mut−/−
mice and image contrast (R = 0.93; fig. S9A).Next, we evaluated a 72-offset protocol (ideal for characterizing
Z-spectra) on the RD Mut+/− and RD Mut−/− mice. RepresentativeZ-spectra from regions of interest (ROIs) drawn over both kidneysare shown in fig. S5. As can be seen, there are differences in the STratio for these animals, indicating that there are differences in av-erage pH values. However, as shown in Fig. 3, using 72 offsets andour rapid imaging with refocused echoes (RARE) sequence param-eters, the contrast-to-noise ratio (CNR) is too low to reliably assess
on May 26, 2020
://advances.sciencemag.org/
3.9% 4.0%
0
5
10
15
20
25
30Contrast %
A
C E
FD
B
0
5
10
15
20
25
30Contrast %
10.3% 14.2%
Mut–/–Mut–/– Mut–/– Mut–/–
0
5
10
15
20
25
0 10 20 30 40 50 60 70 80Time in min
Mut+/–
Mut–/–
Cont
rast
(%)
0
5
10
15
20
25
0 10 20 30 40 50 60 70 80Time in min
Cont
rast
(%)
Mut+/–
Mut–/–
16.9% 17.2%
Mut+/– Mut+/–
18.8% 18.8%
Mut+/– Mut+/–
Regular diet (RD) High-protein diet (HP)
Fig. 2. Contrast agent uptake for the four different groups of MMA mice. (A) Average iopamidol uptake with time for RD Mut+/− and RD Mut−/− mice. RD Mut+/−
mice display higher uptake of contrast agent [>25% (n = 5)] than RD Mut−/− mice [>12% (n = 4)]. (B) Average iopamidol uptake with time for HP Mut+/− and HP Mut−/−
mice. Similar to RD Mut+/− mice, >25% contrast was observed for HP Mut+/− mice. HP Mut−/− mice displayed the lowest contrast [~4% (n = 3)], indicating the lowestiopamidol uptake for these mice with more advanced kidney disease. (C and D) Corresponding time-averaged maximum contrast images of RD Mut+/− and RD Mut−/−
mice. (E and F) Maximum contrast images of HP Mut+/− and HP Mut−/− mice.
3 of 10

SC I ENCE ADVANCES | R E S EARCH ART I C L E
on May 26, 2020
http://advances.sciencemag.org/
Dow
nloaded from
filtration fraction (FF) even for the strong contrast Mut+/− controlmice, with an example mouse showing FF = 84% in Fig. 3A, let alonefor the lower average contrast RDMut−/− or HPMut−/−mice. For pHmapping, which requires calculating the ST ratio, the CNR becomesa bigger problem, as shown in Fig. 3B, as a large percentage of thepixels for the RD Mut−/− mice do not show sufficient contrast. Wealso characterized the B0 homogeneity for these mice, as shown infig. S6. The B0 variation across the kidneys is very small (averagevariation, ~60 Hz) compared to the saturation power B1 = 4 mT(w1 = 1073 Hz). Because of this, we chose to test a minimal satura-tion frequency protocol for pHmapping, two offsets, which can pro-vide an increase in CNR by factors as large as
ffiffiffiffiffiffiffiffiffiffi72=2
p ¼ 6:0. As seenin Fig. 3C, the FF becomes larger in the perfusion map because ofthis additional CNR. Furthermore, the pH maps in Fig. 3D becomemuch sharper because of the improved contrast using this protocol.On the basis of this set of data, we decided that the two-offset pro-tocol had excellent performance and proceeded to comparing theresults of this protocol on all groups, including the lowest contrastHPMut−/−mice. Using this two-offset protocol allows the time res-olution to be very short (10 s per time point), allowing the use of amoving time average to reduce the systematic and random contri-butions to noise as shown. A comparison of 2-, 38-, and 72-offsetprotocols is shown in fig. S10.
Comparison of perfusion results across all groups ofMMA miceTo assess the capability of imaging iopamidol perfusion to detect kidneydisease, we calculated FF using our CESTMRI data for the four groupsof mice (Fig. 4). As can be seen in Fig. 4 (A, B, andD), both RD andHPMut+/− controls (n = 5) display FF >98%. In contrast, moderate kidneydisease mice (n = 4) display a moderate reduction in iopamidol perfu-sion (FF, ~79%), and severe kidney disease mice (n = 3) display a verysubstantial reduction in iopamidol perfusion (FF, <50%). Furthermore,as shown in Fig. 4A, the FF was linearly correlated with mouse weightwhen considering all groups (R = 0.76). The correlation improves fur-
Pavuluri et al., Sci. Adv. 2019;5 : eaaw8357 14 August 2019
ther by considering only the RD andHPMut−/−mice (R= 0.9; fig. S7B),which is due, in part, to the lower average weight of the controlMut+/−
mice than the Mut−/− mice.
Comparison of pH mapping results across MMA miceTo establish the suitability of our MRI protocol, we calculated pHmaps using our CEST MRI data for the four groups of mice (Fig. 5).Both RD and HP Mut+/− mice displayed homogeneous pH values of6.50 across the entire slice, as shown in Fig. 5 (A, B, D, and E) and fig.S7. In contrast, RDMut−/− mice displayed a lower average pH (~6.1)and an order ofmagnitude larger range of pHvalues (denoted asDpH)in the kidney across the slice (±0.09; Fig. 5, A and C, and fig. S8, A toD). Furthermore,HPMut−/−mice displayed a slightly lower pH (~6.0)and a significantly larger range of pH values in the kidney across theslice (±0.45; Fig. 5, D and F, and fig. S8, E to G). While the correlationbetween pH and mouse weight was poor (R = 0.0624; fig. S9C), thecorrelation between DpH and mouse weight was quite reasonable(R = 0.85; fig. S9D). Overall, these in vivo imaging data are consistentwith the blood work and weights of these animals.
DISCUSSIONWe have successfully developed a CEST MRI protocol based on ad-ministration of iopamidol and using a two-offset protocol to char-acterize the perfusion and pH changes observed in mice and todetect differences in renal function. The metric that we use for per-fusion, FF, estimates how widely iopamidol perfuses through thekidneys with units of % as opposed to GFR, which is a rate constantwith units of ml/min. We chose to use FF because of the minimalmodeling needed to measure this metric. To measure GFR usingMRI, it is conventional to use images of the abdominal aorta to de-termine the arterial input function, which can lead to errors (34).Our CEST MRI protocol was designed by minimizing the numberof frequencies collected to allow smoothing and signal averaging toovercome the challenges produced by the significant reduction in
6.43 6.25
A C
B
84.0% 60.0%
5.05.25.45.65.86.06.26.46.66.87.0
pH
Perfusion maps
pH maps
5.05.25.45.65.86.06.26.46.66.87.0
pH
99.9% 79.4%
6.50 6.05
D
Perfusion maps
pH maps
72-offset 2-offset
Mut+/–
Mut+/–
Mut–/–
Mut–/–
Mut+/– Mut–/–
Mut+/– Mut–/–
Fig. 3. Comparison of 72-offset and 2-offset acquisition methods for producing FF and pH maps. (A and B) The 72-offset and (C and D) 2-offset data of RD Mut+/−
and RD Mut−/− mice, with the blue and green colors in the perfusion maps used to denote the RD Mut+/− and RD Mut−/−mice, respectively. (A) Perfusion maps tocalculate FF using the 72-offset protocol. The RD Mut+/− mouse has an FF of 84%, whereas the RD Mut−/− mouse has an FF of 60%, indicating that fewer pixels wereperfused with contrast agent. (B) pH maps generated using the 72-offset protocol and the calibration plot (Fig. 2). The RD Mut+/− mouse was observed to have a pH of6.43, and the RD Mut−/− mouse has a pH of 6.25. (C) Two-offset perfusion maps for calculating FF based on taking the time average for 10 images. The RD Mut+/− mousehas an FF of 99.9%, and the RD Mut−/− mouse has an FF of 79.4%. FF calculated using the 2-offset protocol was approximately 20% higher than that calculated using the72-offset protocol. (D) pH maps obtained using the two-offset protocol for RD Mut+/− and RD Mut−/− mice. pH values calculated were 6.50 and 6.05, respectively.
4 of 10

SC I ENCE ADVANCES | R E S EARCH ART I C L E
on May 26, 2020
http://advances.sciencemag.org/
Dow
nloaded from
contrast observed for the severe kidney diseasemice and kidneymo-tion and allow for robust measurements. Measurement of GFR usingiopamidol would have been more challenging for these animals. Asshown in fig. S4C, the most sensitive measurement of health wasmouse weight, which dropped over time when mice were placedon an HP diet. Three of the four MRI metrics that we developedcorrelated with this measurement (R = 0.93, 0.90, and 0.85, respec-tively, for contrast, FF, and DpH).
At this stage, a number of MRI pH imaging studies have beenperformed, including on the bladder, within tumors, and within kid-neys (18, 30). Most of the kidney pH imaging studies have focused ontesting probes on healthy control rodents, and the mean renal pHvalues of healthy control mice measured in this study are very similarto those reported (19, 28, 32, 35). In some cases, subtle differenceswere observed between calyx and cortex; we did not detect these inour maps using either the 72-offset or the 2-offset protocol. Ourstudy was performed on a higher field strength scanner (11.7 T) thanthe other studies, which results in a larger frequency difference be-tween labile protons and water. This enhances the resolution of theCEST Z-spectrum, which affects the intensity ratio measurementand, hence, the pH calculation. Additional changes include our useof a reduced set of offsets and oversampling to reduce noise. Appli-cation of a moving time average, smoothening the impact of motionon signal intensities, will result in CEST contrast smearing. On thebasis of our pH mapping results of healthy control using 72- and2-offset protocols, the smearing has a negligible effect on pH calcu-lation. This approach is sound and necessary to observe the smallcontrast effects in mice with severe renal disease. Additional refine-ment of the CEST MRI protocol by using radial sampling or otherstrategies may result in further improvements in CNR or may furtherreduce the influence of motion on the resulting maps.
Longo and colleagues (32) also studied how AKIs created usingclamp occlusion of arteries affect pH and perfusion maps. They ob-served increases in average pH values peaking at 7.0 ± 0.2 and forshorter occlusion times (20-min occlusion) returning to normal
Pavuluri et al., Sci. Adv. 2019;5 : eaaw8357 14 August 2019
within 1 week; for longer occlusion times, the pH remained elevatedat 1 week after AKI (6.9 ± 0.2). For our study on a mouse model ofMMA-induced CKD, the average pH dropped slightly, but this wasnot as sensitive as the variation in pH across the kidneys in our study,which was not reported for short or long occlusion AKIs. Longo andcolleagues also reported large changes in FF for AKI (lowest FF ~56%for short occlusion AKI and lowest FF ~38% for longer occlusion AKIversus FF ~84% for healthy controls); however, they used a differentdefinition to calculate FF. Their definition of FF computed the per-centage of pixels within the kidneys displaying larger than 2% con-trast, whereas our definition calculated the number of pixels above20% of the peak contrast observed in the kidneys. We prefer our def-inition as, in principle, our definition using this relative contrastshould allow FF to be more comparable on scanners with differentfield strengths.
There are a number of CEST agents available (36–44); we selectediopamidol for several reasons. First, pH is an appropriate biomarkerfor kidney disease (21), and because iopamidol has two labile protonswith distinct shifts and exchange rates, ratiometric protocols can beused to isolate pH changes from concentration. Themoderately largechemical shifts (>3 ppm) enable detection on clinical 3-T MRI scan-ners (28, 32, 36, 45, 46). Iopamidol is a nonionic contrast agent safelyadministered for over 30 years to patients for angiography, includingto a large number of patients known to have kidney disease (47, 48).Nonionic iodinated agents are in routine use in pediatric radiology,including pediatric computed tomography (CT) and excretory urog-raphy. In one study onmore than 11,000 pediatric injections, allergicreactions were found to be rare (estimated to be 0.18% with 80%considered mild) (49, 50). The nephrotoxicity of iopamidol has beenstudied in the case of childrenwith bonemarrow transplantationswhoreceived nephrotoxic drugs and received between one and seven re-peated injections of iopamidol and judged to be negligible (51). Whilewe used a dose of 1.5 g of iodine per kilogram in this study, as shownin the results, the resulting contrast was well above what was neededto differentiate between the groups.
A B
C E
D
78.4%79.4%
99.9% 99.8%
17.8% 12.0%
98.2% 99.9%
Mut+/– Mut+/– Mut+/– Mut+/–
Mut–/–Mut–/– Mut–/–Mut–/–
30 28 26 24 22 20 18 16 140
20
40
60
80
100
Filtr
atio
n fr
actio
n (%
)
Weight (g)
Control RD HP
Regular diet (RD) High-protein diet (HP)
Fig. 4. In vivo FF results for MMA mice. (A) FF calculated by taking the time-averaged FF for 10 images. The FF is defined as the percentage of kidney pixels with>20% of maximum contrast, and the SD in FF is calculated by comparing the 10 time points used. RD and HP Mut+/− controls display FF of ~100% (n = 5), whereas HPMut−/− mice show the lowest FF, indicating that FF could be a CEST MRI metric for detecting renal disease. The blue, green, and red colors in the perfusion maps areused to denote the Mut+/−, RD Mut−/−, and HP Mut−/− mice, respectively. The decrease in FF was in accordance with a decrease in weight of the mice, which is asecondary indicator of disease progression for these mice. A linear correlation was observed between weights of mice and FF with R = 0.86 (for all groups of mice) andR = 0.9 (only considering the RD and HP Mut−/− mice; fig. S9B). (B and C) Time-averaged FF images of RD mice. (D and E) Time-averaged FF images of HP mice. RD Mut−/−
mice (n = 4) have lower FF than RD Mut+/− controls but have higher FF than HP Mut−/− mice (n = 3).
5 of 10

SC I ENCE ADVANCES | R E S EARCH ART I C L E
on May 26, 2020
http://advances.sciencemag.org/
Dow
nloaded from
In addition to the methods we present in this work, other non-invasive imaging modalities can be used for assessment of renalfunction, including gadolinium-based MR renography, CT, and nu-clear imaging. MR renography can derive functional parameters thatestimate GFR (52); however, there are challenges for widespreadadoption because of the known safety issues of gadolinium for low-GFR patients, which can lead to nephrogenic systemic fibrosis (53).The number and volume of glomeruli in the kidneys can also be assessedusing MRI to detect ferritin-labeled glomerular basement membrane,which is another alternative, although it might be difficult to performthis serially (16). DynamicCTusing iodinated imaging agents can pro-vide renal clearance data, which correlates well with GFR (54, 55);however, this method uses ionizing radiation, which can provide anotable burden in the case that this measurement should be repeatedperiodically and cannot measure pH, which is an additional bio-marker for renal function. Nuclear imaging techniques using probessuch as 99mTc-DTPA and 99mTc-MAG3 (mercaptoacetyltriglycine)are other options that are currently in clinical use; however, theseprobes can producemisleading results due to many factors includingROI selection, motion artifacts, and others (13, 56). MRI has regu-larly been used to produce high spatial resolution images of the kid-
Pavuluri et al., Sci. Adv. 2019;5 : eaaw8357 14 August 2019
neys, but the MRI metrics that we evaluated in the current study, FFand pHmaps, provedmore sensitive to differences between the controland moderate kidney disease mice than other renal function measure-ments performed previously including, importantly, mGFR in thismouse model. CEST MRI has been translated to patients for detectingendogenous biomarkers associated with tumor aggressiveness (57)and for highlighting tumor microenvironment following injection ofexogenous CEST agents (36, 58). On the basis of our results, this newCEST MRI protocol is promising for assessing disease progressionover time or for treatment responses in animal models of kidney dis-ease and could be immediately translated to patients with a range ofdisorders that, similarly to MMA, cause CKD.
METHODSIn vitro phantom preparationIopamidol (molecular weight, 777.1) was obtained fromBracco Imag-ing (Italy). Seronorm (5 ml), a normalized human blood serum, waspurchased fromSero (USA). A set of 40mM iopamidol phantomswasprepared by carefully dissolving Seronorm in 10ml of deionizedwaterwith 40 mM iopamidol to avoid the formation of foam. Titrations
B
A
C
D
E
F
5.0
5.2
5.4
5.6
5.8
6.0
6.2
6.4
6.6
6.8
7.0pH
5.0
5.2
5.4
5.6
5.8
6.0
6.2
6.4
6.6
6.8
7.0pH
5.45.8
6.26.6
7.0 01020304050607080
% o
f pix
els
% o
f pix
els
pH5.4
5.86.2
6.67.0 0
1020304050607080
pHMut+/–
Mut+/–Mut–/–
Mut–/–
Mut+/– Mut+/– Mut+/– Mut+/–
Mut–/–Mut–/– Mut–/–Mut–/–
Mut+/–Mut+/–
Mut–/–Mut–/–
Regular diet (RD) High-protein diet (HP)
6.50 ± 0.01
6.10 ± 0.30
6.5 ± 0.01
5.83 ± 0.46
6.50 ± 0.02 6.50 ± 0.01
6.32 ± 0.096.05 ± 0.06
Fig. 5. In vivo pH results of two groups of mice maintained on RD and HP diets. (A) pH histograms calculated for two representative RD Mut+/− and two repre-sentative RDMut−/−mice. ForMut+/−mice (n = 5), more than 80% of the detected pixels display pH = 6.50, whereas for RDMut−/−mice (n = 4), an acidic pH of 6.05 to 6.32was observed for >20% of the kidney pixels. (B and C) Time-averaged pH maps of these RDMut+/− and RDMut−/− mice. The average pH dropped to 6.05 to 6.32 for RDMut−/− compared to 6.50 for RD Mut+/− controls. The pH ranges of RD Mut−/− mice were ±0.06 and ±0.09 pH units compared to ±0.02 and ±0.01 pH units for RD Mut+/−
mice. (D) pH histograms calculated for two representative HPMut+/− mice and two representative HPMut−/− mice. For HPMut+/− mice, more than 80% of the detectedpixels display a mean pH of 6.50, whereas for HPMut−/− mice (n = 3), an acidic mean pH of 6.10 to 5.83 was observed. (E and F) Time-averaged pH images ofMut+/−andMut−/− controls of HP mice. pH was further lowered to 5.83 for the most severely diseased mice. The pH was distributed over a narrow range of 6.50 ± 0.02 for both RDand HPMut+/−mice, while this range significantly increased to ±0.30 and ±0.46 along with a decrease in mean pH for HPMut−/−mice. A linear correlation was observedfor RD and HP Mut−/− mice between DpH and mouse weight with R = 0.85 (fig. S9D).
6 of 10

SC I ENCE ADVANCES | R E S EARCH ART I C L E
on May 26, 2020
http://advances.sciencemag.org/
Dow
nloaded from
were performed to produce pH values of 5.3, 5.5, 5.7, 5.9, 6.1, 6.3, 6.5,6.7, 6.9, 7.1, and 7.3, respectively, in aliquots of 0.3 ml. These solutionswere placed in 5-mm nuclear magnetic resonance tubes andassembled along with 0.3-ml serum-only control tube to obtain theiopamidol-serum phantom for CEST MRI.
In vitro MR data acquisitionMRI experiments were performed on a Bruker 11.7-T vertical borescanner using a 25-mm transmit/receive volume coil. CEST imageswere acquired using continuous-wave RF saturation pulse of 3 sfollowed by a RARE imaging sequence. CEST data were acquiredusing six different saturation power (B1) from 1 to 6 mΤ for optimiza-tion. Seventy-one CEST offsets between ±7 ppm with 0.2-ppm dif-ference were acquired to produce saturation images and Z-spectraplus 1 at +20,000 Hz as M0. Other sequence parameters include thefollowing: centric encoding; acquisition matrix size, 64 × 48; slicethickness, 1-mm slice; and repetition time (TR)/echo time (TE),5000/3.39 ms. For pixel-by-pixel B0 inhomogeneity calculation, watersaturation shift referencing (WASSR) images were calculated usingB1 = 0.5 mΤ with 42 offsets from −1.5 to +1.5 ppm.
In vitro pH calculationWeperformed all postprocessing and pH calculations usingMATLAB(MathWorks, USA) for our phantom. This was based on calculatingthe ST ratio at 4.2 and 5.5 ppm, as described previously (33). On thebasis of examining the data at six B1 values, CEST images with B1 = 3and 4 mΤ were processed to generate the pH maps. Pixel-by-pixelZ-spectra were also calculated from the CEST data. Pixel-by-pixelB0 inhomogeneity corrections were performed using the WASSRdataset and spline interpolation method, as described previously(23). The value ST = (1 − Mz/M0) was calculated pixel by pixel togenerate ST maps corresponding to the two CEST peaks at 4.2 and5.5 ppm, respectively. An ROI was drawn, and the mean ST ratio =Mz4:2�ðM0�Mz5:5ÞMz5:5�ðM0�Mz4:2Þversus pH plot was obtained and fit to a polynomial to
generate a pH calibration curve. Using this calibration equation, thepH for each pixel in the phantom could then be calculated to deter-mine how susceptible this quantity was to experimental noise.
In vitro ST ratio tolerance to B0 inhomogeneityIn vitro experiments on the iopamidol-serum phantom were ana-lyzed to study the tolerance of our pH measurements to DB0 (Hz).The ST ratio of 4.2 and 5.5 ppm was calculated for each pH between5.7 and 7.3 for DB0 values up to ±301.4 Hz in steps of 27.4 Hz usingour experimental Z-spectra. Using the in vitro calibration equation,corresponding pH values were obtained at DB0 = 0, ±60, ±120, and±180 Hz for w1 = 3 mT and w1 = 4 mT.
MMA mouse model for CKDMale transgenicmice expressingmethylmalonyl–coenzymeA–mutase(Mut) in the liver under the control of an albumin promoter on aknockout background Mut−/−;TgINS-Alb-Mut, designated as Mut−/−
(n = 8), or littermate controls,Mut+/− (n = 5), were used. Themice werefurther subdivided by placing half on a regular mouse chow diet (RD)and the remainder on anHPdiet, containing 70% (w/w) casein (HP), asdescribed previously (TD.06723; Harlan Laboratories). HP mice lostweight (P < 0.0001) and had elevated plasma MMA (1330 mM;P= 0.017 compared to controls), associatedwith increased Lcn2mRNAexpression in their kidneys (P = 0.002), similar to previous findings
Pavuluri et al., Sci. Adv. 2019;5 : eaaw8357 14 August 2019
in this model. Notably, no significant renal histological changes wereevident on hematoxylin and eosin staining at this stage of renal dis-ease in these mice. Exposure to an HP diet for 6 months was necessaryto induce tubulointerstitial nephritis, as has been previously described(1). GFR measurements, on the other hand, were abnormal even onRD, when measured by 125I-iothalamate clearance in single-nephronmicroperfusion studies, and significantly decreased on an HP dietafter 2 months, as assessed by the FITC inulin plasma decay methodat the whole-animal level (1).
In vivo MR data acquisition and experimental designAll animal experiments were performed under a protocol approved byboth the Johns Hopkins University Animal Care and Use Committeeand the Animal Care and Use Committee of the National HumanGenome Research Institute (NHGRI), National Institutes of Health(NIH). Eachmouse was placed on amouse tail illuminator restrainerto catheterize the tail vein. In vivo experiments were performed onan 11.7-T Bruker BioSpec horizontal scanner using an eight-channelmouse body phase array coil. The mouse was then placed on a cradlefor imaging and anesthetized using 0.5 to 1.5% isoflurane, with therespiration rate continuously monitored. The body temperature wasmaintained at 37°C using a hot water circulation bed. A three-planelocalizer sequence was used for finding the spatial location of themouse kidneys. A multislice T2W RARE sequence was used to acquirethe axial slice images. Twenty-one contiguous axial slices, each with athickness of 1.5 mm, were collected using TE/TR of 6.6 ms/4 s, RAREfactor of 8, and field of viewof 128× 128. A center slice of width 1.5mmwas chosen for CEST imaging, and high-resolution T2W image wasobtained using RARE for anatomical overlay with CEST processedimages. The acquisition time for high-resolution T2W images was2 min and 8 s with a matrix size of 256 × 256. For CEST data acqui-sition, the RARE pulse sequence was used. Saturation pulses withB1 = 4 mΤ were applied for a total duration of 3 s, which consistedof 10 rectangular block pulses 300 ms long with a 10-ms delay be-tween the pulses. WASSR images were collected for generating B0maps using 42 offsets from −1.5 to +1.5 ppm and B1 = 1.5 mT. Forthe 72-offset CEST data acquisition, the offset frequency was incre-mented between ±7 ppm with an interval of 0.2 ppm for 1 to 2 hoursafter injection. The time taken for each set of 72 offsets was 6 minand 0 s, and the other sequence parameters were as follows: TE/TR,3.49ms/5 s; number of averages, 1; RARE factor, 32; matrix size, 48 ×48; field of view, 28 × 20 mm2; spatial resolution, 0.58 × 0.41 mm2;and centric encoding. Three sets of 72 offsets were collected with thesame experimental parameters before administration of iopamidol.Iopamidol was injected through the tail vein at a dose of 1.5 g of io-dine per kilogram. For the two-frequency offset data acquisition, theoffset frequency was toggled between 4.2 and 5.5 ppm repeatedly,and CEST images at these two offsets were collected for 1 to 2 hoursjust after administering iopamidol. The time taken for each CESTimage acquisition was 5 s. Eight to 10 pre-injection sets of 4.2 and5.5 ppm images were collected. Field of view was 30 × 20 mm2, in-plane spatial resolution was 0.62 × 0.41 mm2, and other parameterswere the same as in the 72-offset protocol.
MRI data analysis of contrast maps and FFCEST MRI data (both before and after injection) were extractedusing custom-written MATLAB functions to calculate the Z-spectraof mean pre-injection images. For the analysis of the results, themean pre-injection Z-spectra were subtracted from all post-injection
7 of 10
SC I ENCE ADVANCES | R E S EARCH ART I C L E
on May 26, 2020
http://advances.sciencemag.org/
Dow
nloaded from
images. The “smooth” function in MATLAB was used to apply amoving average filter at each frequency. This moving average filterwas applied on the time series data to remove fluctuations in signaldue tomotion. The smoothening factor used in the averaging processwas ~40 neighboring images, with this choice based on the size of thedata and the range of fluctuations. After smoothening, 10 to 20 imageswere averaged to generate the corresponding parameter maps (con-trast, FF, and pH). Images acquired between 40 and 50 min afterinjection were considered for the calculation of parametric maps onMut+/− and Mut−/− mice. For calculating the contrast and FF, CESTimages at 4.2 ppm were used. Time-contrast uptake curves were ob-tained by calculating the average ST over pixels selected by two ROIs,one over each kidney. Maximum contrast maps were generated bycalculating the pixel-by-pixel maximum ST on two ROIs, one over eachkidney, overlaid on the corresponding T2W image. The time-averagedmaximum contrast images were calculated by taking 10 to 20 images atcorrespondingpost-injection time. TheFFwas calculated bydeterminingthe percentage of pixels in the kidneys with a contrast >20% of the max-imum contrast detected at 4.2 ppm for each mouse. The time-averagedFF over 10 images was used to generate the FF bar plot.
In vivo MRI pH calculationIn vivo pH was calculated in a similar manner to the in vitro pH cal-culation. The calibration equation used was pH = p1 × (ST ratio)3 +p2 × (ST ratio)2 + p3 × (ST ratio)1 + p4 with p1 = − 0.0317, p2 = 0.4463,p3 = − 2.5029, and p4 = 20.5146. The root mean square error of the fitis 0.0714. From the images corresponding to the two offsets, 4.2 and5.5 ppm over time, ~16 images were selected, with the initial imageoccurring 40 to 50 min after injection for both Mut+/− and Mut−/−
mice for time averaging. The pixel-by-pixel ST ratio was calculatedfor these images, and using the in vitro calibration equation, the pixel-by-pixel pH was calculated. This was masked using the >20% con-trast criteria found for the FF pixels. Mean pHmaps were generated,and the mean pH range observed was calculated by averaging the pHof the images selected. Histogram plots of pH for both RD and HPdiet mice were calculated for the pH images by keeping the bin size of200 between the pH values of 4 and 10. After producing the histo-grams, these data were fit to a normal distribution (Gaussian functionwas used) to obtain the mean or the most probable pH and range inpH for each mouse. The full width at half maximum of this Gaussianfunction was used to quantify the DpH values across the kidneys.
In vivo B0 inhomogeneity mapsIn vivo B0 inhomogeneity maps were generated from the WASSRexperiment performed before the injection for each mouse. WASSRZ-spectra for ROIs drawn over both the kidneys were extracted andinterpolated inMATLAB using cubic spline interpolation. The watershift was measured pixel by pixel, as described previously, to obtainthe DB0 maps over the kidney. DB0 maps were overlaid on the cor-responding high-resolution T2W images to obtain the DB0 mapsshown in fig. S6.
Blood and histological analysis of renal tissueBefore and after the MR imaging session, the weights of each mousewere determined. Blood samples were collected serially before andat 1 and 2 months on the RD or HP diet. The collected blood wascentrifuged for 15 to 20 min at 3000 rpm to separate plasma fromcells. Mice were sacrificed to extract the renal tissues, and axial cutportions of left and right kidneys were fixed separately using 4%
Pavuluri et al., Sci. Adv. 2019;5 : eaaw8357 14 August 2019
paraformaldehyde solution and stored in a 4°C refrigerator. Otheraxial cut portions were frozen at −80°C for RNA extraction andreal-time polymerase chain reaction to assess Lcn2 (or neutrophilgelatinase–associated lipocalin) mRNA expression (TaqMan probesused: Mm01324470_m1, for Lcn2, normalized to Gapdh expression:Mm99999915_g1), as previously described.
SUPPLEMENTARY MATERIALSSupplementary material for this article is available at http://advances.sciencemag.org/cgi/content/full/5/8/eaaw8357/DC1Fig. S1. In vitro results at RF saturation field strength of 3 mΤ.Fig. S2. In vitro pH measurement variation as a function of DΒ0 shift at 4-mΤ RF saturationpower.Fig. S3. In vitro pH measurement variation with DΒ0 shift at 3-mΤ RF saturation power.Fig. S4. Biochemical and clinical measures in the RD and HP Mut−/−;TgINS-Alb-Mut mice ascompared to heterozygote littermates.Fig. S5. In vivo Z-spectra.Fig. S6. Representative DB0 maps for RD and HP diet mice.Fig. S7. pH-histogram plots depicting the percentage of pixels across the detectable pH rangeand normal distribution analysis for all control (Mut+/−) mice imaged in this study.Fig. S8. pH-histogram plots depicting the percentage of pixels across the detectable pH rangeand normal distribution analysis for all Mut−/− mice imaged in this study.Fig. S9. MRI metrics versus weight correlation plots for HP and RD Mut−/− mice.Fig. S10. pH images calculated for a healthy control mouse using our 72, 38, and 2-offsetprotocols.
REFERENCES AND NOTES1. I. Manoli, J. R. Sysol, L. Li, P. Houillier, C. Garone, C. Wang, P. M. Zerfas, K. Cusmano-Ozog,
S. Young, N. S. Trivedi, J. Cheng, J. L. Sloan, R. J. Chandler, M. Abu-Asab, M. Tsokos,A. G. Elkahloun, S. Rosen, G. M. Enns, G. T. Berry, V. Hoffmann, S. DiMauro, J. Schnermann,C. P. Venditti, Targeting proximal tubule mitochondrial dysfunction attenuates therenal disease of methylmalonic acidemia. Proc. Natl. Acad. Sci. U.S.A. 110, 13552–13557(2013).
2. R. J. Chandler, C. P. Venditti, Adenovirus-mediated gene delivery rescues a neonatallethal murine model of mut(0) methylmalonic acidemia. Hum. Gene Ther. 19, 53–60(2008).
3. I. Manoli, J. R. Sysol, M. W. Epping, L. Li, C. Wang, J. L. Sloan, A. Pass, J. Gagne, Y. P. Ktena,L. Li, N. S. Trivedi, B. Ouattara, P. M. Zerfas, V. Hoffmann, M. Abu-Asab, M. G. Tsokos,D. E. Kleiner, C. Garone, K. Cusmano-Ozog, G. M. Enns, H. J. Vernon, H. C. Andersson,S. Grunewald, A. G. Elkahloun, C. L. Girard, J. Schnermann, S. DiMauro, E. Andres-Mateos,L. H. Vandenberghe, R. J. Chandler, C. P. Venditti, FGF21 underlies a hormetic responseto metabolic stress in methylmalonic acidemia. JCI Insight 3, 124351 (2018).
4. I. Manoli, J. L. Sloan, C. P. Venditti, Isolated methylmalonic acidemia, in GeneReviews,M. P. Adam, H. H. Ardinger, R. A. Pagon, S. E. Wallace, L. J. H. Bean, K. Stephens,A. Amemiya, Eds. (University of Washington, 1993).
5. F. Hörster, M. R. Baumgartner, C. Viardot, T. Suormala, P. Burgard, B. Fowler,G. F. Hoffmann, S. F. Garbade, S. Kölker, E. R. Baumgartner, Long-term outcome inmethylmalonic acidurias is influenced by the underlying defect (mut0, mut-, cblA, cblB).Pediatr. Res. 62, 225–230 (2007).
6. L. A. Stevens, A. S. Levey, Measured GFR as a confirmatory test for estimated GFR.J. Am. Soc. Nephrol. 20, 2305–2313 (2009).
7. G. J. Schwartz, S. L. Furth, Glomerular filtration rate measurement and estimation inchronic kidney disease. Pediatr. Nephrol. 22, 1839–1848 (2007).
8. W. G. Miller, Reporting estimated GFR: A laboratory perspective. Am. J. Kidney Dis. 52,645–648 (2008).
9. G. Filler, N. Lepage, Should the Schwartz formula for estimation of GFR be replaced bycystatin C formula? Pediatr. Nephrol. 18, 981–985 (2003).
10. Y. Bouvet, F. Bouissou, Y. Coulais, S. Seronie-Vivien, M. Tafani, S. Decramer, E. Chatelut,GFR is better estimated by considering both serum cystatin C and creatinine levels.Pediatr. Nephrol. 21, 1299–1306 (2006).
11. J. H. Walter, A. Michalski, W. M. Wilson, J. V. Leonard, T. M. Barratt, M. J. Dillon, Chronicrenal failure in methylmalonic acidaemia. Eur. J. Pediatr. 148, 344–348 (1989).
12. P. S. Kruszka, I. Manoli, J. L. Sloan, J. B. Kopp, C. P. Venditti, Renal growth in isolatedmethylmalonic acidemia. Genet. Med. 15, 990–996 (2013).
13. X. Yuan, J. Zhang, K. Tang, C. Quan, Y. Tian, H. Li, G. Ao, L. Qiu, Determination ofglomerular filtration rate with CT measurement of renal clearance of iodinated contrast
8 of 10

SC I ENCE ADVANCES | R E S EARCH ART I C L E
on May 26, 2020
http://advances.sciencemag.org/
Dow
nloaded from
material versus 99mTc-DTPA dynamic imaging “gates” method: A validation study inasymmetrical renal disease. Radiology 282, 552–560 (2017).
14. J. L. Zhang, G. Morrell, H. Rusinek, E. E. Sigmund, H. Chandarana, L. O. Lerman, P. V. Prasad,D. Niles, N. Artz, S. Fain, P. H. Vivier, A. K. Cheung, V. S. Lee, New magnetic resonanceimaging methods in nephrology. Kidney Int. 85, 768–778 (2014).
15. H. Rusinek, Y. Boykov, M. Kaur, S. Wong, L. Bokacheva, J. B. Sajous, A. J. Huang, S. Heller,V. S. Lee, Performance of an automated segmentation algorithm for 3D MR renography.Magn. Reson. Med. 57, 1159–1167 (2007).
16. S. C. Beeman, M. Zhang, L. Gubhaju, T. Wu, J. F. Bertram, D. H. Frakes, B. R. Cherry,K. M. Bennett, Measuring glomerular number and size in perfused kidneys using MRI.Am. J. Physiol. Renal Physiol. 300, F1454–F1457 (2011).
17. R. J. Gillies, N. Raghunand, M. L. Garcia-Martin, R. A. Gatenby, pH imaging. A review ofpH measurement methods and applications in cancers. IEEE Eng. Med. Biol. Mag. 23,57–64 (2004).
18. R. van Sluis, Z. M. Bhujwalla, N. Raghunand, P. Ballesteros, J. Alvarez, S. Cerdán,J. P. Galons, R. J. Gillies, In vivo imaging of extracellular pH using 1H MRSI.Magn. Reson. Med. 41, 743–750 (1999).
19. N. Raghunand, C. Howison, A. D. Sherry, S. Zhang, R. J. Gillies, Renal and systemicpH imaging by contrast-enhanced MRI. Magn. Reson. Med. 49, 249–257 (2003).
20. M. T. McMahon, A. A. Gilad, J. W. M. Bulte, P. C. M. van Zijl, Chemical Exchange SaturationTransfer Imaging: Advances and Applications (Pan Stanford Publishing, ed. 1, 2017),479 pp.
21. K. Pavuluri, M. T. McMahon, pH imaging using chemical exchange saturation transfer(CEST) MRI. Isr. J. Chem. 57, 862–879 (2017).
22. G. Liu, M. Moake, Y.-e. Har-el, C. M. Long, K. W. Y. Chan, A. Cardona, M. Jamil, P. Walczak,A. A. Gilad, G. Sgouros, P. C. M. van Zijl, J. W. M. Bulte, M. T. McMahon, In vivo multicolormolecular MR imaging using diamagnetic chemical exchange saturation transferliposomes. Magn. Reson. Med. 67, 1106–1113 (2012).
23. G. Liu, A. A. Gilad, J. W. M. Bulte, P. C. M. van Zijl, M. T. McMahon, High-throughputscreening of chemical exchange saturation transfer MR contrast agents. Contrast MediaMol. Imaging 5, 162–170 (2010).
24. M. T. McMahon, A. A. Gilad, M. A. DeLiso, S. M. Berman, J. W. Bulte, P. C. van Zijl,New “multicolor” polypeptide diamagnetic chemical exchange saturation transfer (DIACEST)contrast agents for MRI. Magn. Reson. Med. 60, 803–812 (2008).
25. E. Terreno, D. D. Castelli, S. Aime, Encoding the frequency dependence in MRI contrastmedia: The emerging class of CEST agents. Contrast Media Mol. Imaging 5, 78–98(2010).
26. S. Viswanathan, S. J. Ratnakar, K. N. Green, Z. Kovacs, L. M. De León-Rodriguez,A. D. Sherry, Multi-frequency PARACEST agents based on europium(III)-DOTA-tetraamideligands. Angew. Chem. Int. Ed. Engl. 48, 9330–9333 (2009).
27. K. Ward, R. Balaban, Determination of pH using water protons and chemical exchangedependent saturation transfer (CEST). Magn. Reson. Med. 44, 799–802 (2000).
28. Y. Wu, I. Y. Zhou, T. Igarashi, D. L. Longo, S. Aime, P. Z. Sun, A generalized ratiometricchemical exchange saturation transfer (CEST) MRI approach for mapping renal pH usingiopamidol. Magn. Reson. Med. 79, 1553–1558 (2018).
29. M. T. McMahon, A. A. Gilad, J. Y. Zhou, P. Z. Sun, J. W. M. Bulte, P. C. M. van Zijl,Quantifying exchange rates in chemical exchange saturation transfer agentsusing the saturation time and saturation power dependencies of the magnetizationtransfer effect on the magnetic resonance imaging signal (QUEST and QUESP):pH calibration for poly-L-lysine and a starburst dendrimer. Magn. Reson. Med. 55,836–847 (2006).
30. X. Yang, X. Song, S. Ray Banerjee, Y. Li, Y. Byun, G. Liu, Z. M. Bhujwalla, M. G. Pomper,M. T. McMahon, Developing imidazoles as CEST MRI pH sensors. Contrast Media Mol.Imaging 11, 304–312 (2016).
31. K. W. Chan, G. Liu, X. Song, H. Kim, T. Yu, D. R. Arifin, A. A. Gilad, J. Hanes, P. Walczak,P. C. van Zijl, J. W. Bulte, M. T. McMahon, MRI-detectable pH nanosensors incorporatedinto hydrogels for in vivo sensing of transplanted-cell viability. Nat. Mater. 12, 268–275(2013).
32. D. L. Longo, J. C. Cutrin, F. Michelotti, P. Irrera, S. Aime, Noninvasive evaluation of renal pHhomeostasis after ischemia reperfusion injury by CEST-MRI. NMR Biomed. 30, (2017).
33. D. L. Longo, A. Busato, S. Lanzardo, F. Antico, S. Aime, Imaging the pH evolution ofan acute kidney injury model by means of iopamidol, a MRI-CEST pH-responsive contrastagent. Magn. Reson. Med. 70, 859–864 (2013).
34. M. Cutajar, I. A. Mendichovszky, P. S. Tofts, I. Gordon, The importance of AIF ROI selectionin DCE-MRI renography: Reproducibility and variability of renal perfusion and filtration.Eur. J. Radiol. 74, E154–E160 (2010).
35. Y. K. Wu, S. R. Zhang, T. C. Soesbe, J. Yu, E. Vinogradov, R. E. Lenkinski, A. D. Sherry,pH imaging of mouse kidneys in vivo using a frequency-dependent paraCEST agent.Magn. Reson. Med. 75, 2432–2441 (2016).
36. K. M. Jones, E. A. Randtke, E. S. Yoshimaru, C. M. Howison, P. Chalasani, R. R. Klein,S. K. Chambers, P. H. Kuo, M. D. Pagel, Clinical translation of tumor acidosismeasurements with AcidoCEST MRI. Mol. Imaging Biol. 19, 617–625 (2017).
Pavuluri et al., Sci. Adv. 2019;5 : eaaw8357 14 August 2019
37. A. Anemone, L. Consolino, D. L. Longo, MRI-CEST assessment of tumour perfusion usingx-ray iodinated agents: Comparison with a conventional Gd-based agent. Eur. Radiol.27, 2170–2179 (2017).
38. D. L. Longo, F. Michelotti, L. Consolino, P. Bardini, G. Digilio, G. Xiao, P. Z. Sun, S. Aime,In vitro and in vivo assessment of nonionic iodinated radiographic molecules aschemical exchange saturation transfer magnetic resonance imaging tumor perfusionagents. Invest. Radiol. 51, 155–162 (2016).
39. X. Yang, N. N. Yadav, X. Song, S. Ray Banerjee, H. Edelman, I. Minn, P. C. van Zijl,M. G. Pomper, M. T. McMahon, Tuning phenols with intra-molecular bond shiftedhydrogens (IM-SHY) as diaCEST MRI contrast agents. Chemistry 20, 15824–15832(2014).
40. X. Song, X. Yang, S. Ray Banerjee, M. G. Pomper, M. T. McMahon, Anthranilic acid analogsas diamagnetic CEST MRI contrast agents that feature an intramolecular-bond shiftedhydrogen. Contrast Media Mol. Imaging 10, 74–80 (2015).
41. A. Bar-Shir, G. Liu, Y. Liang, N. N. Yadav, M. T. McMahon, P. Walczak, S. Nimmagadda,M. G. Pomper, K. A. Tallman, M. M. Greenberg, P. C. M. van Zijl, J. W. M. Bulte, A. A. Gilad,Transforming thymidine into a magnetic resonance imaging probe for monitoringgene expression. J. Am. Chem. Soc. 135, 1617–1624 (2013).
42. D. D. Castelli, E. Terreno, D. Longo, S. Aime, Nanoparticle-based chemical exchangesaturation transfer (CEST) agents. NMR Biomed. 26, 839–849 (2013).
43. D. V. Hingorani, L. A. Montano, E. A. Randtke, Y. S. Lee, J. Cardenas-Rodriguez, M. D. Pagel,A single diamagnetic catalyCEST MRI contrast agent that detects cathepsin B enzymeactivity by using a ratio of two CEST signals. Contrast Media Mol. Imaging 11, 130–138(2016).
44. L. Zhang, O. M. Evbuomwan, M. Tieu, P. Zhao, A. F. Martins, A. D. Sherry, Protonation ofcarboxyl groups in EuDOTA-tetraamide complexes results in catalytic prototropicexchange and quenching of the CEST signal. Philos. Trans. A Math. Phys. Eng. Sci. 375,20170113 (2017).
45. A. Müller-Lutz, N. Khalil, B. Schmitt, V. Jellus, G. Pentang, G. Oeltzschner, G. Antoch,R. S. Lanzman, H. J. Wittsack, Pilot study of iopamidol-based quantitative pH imaging on aclinical 3T MR scanner. MAGMA 27, 477–485 (2014).
46. P. Z. Sun, D. L. Longo, W. Hu, G. Xiao, R. Wu, Quantification of iopamidol multi-sitechemical exchange properties for ratiometric chemical exchange saturation transfer(CEST) imaging of pH. Phys. Med. Biol. 59, 4493–4504 (2014).
47. H. S. Thomsen, S. K. Morcos, Risk of contrast-medium-induced nephropathy in high-riskpatients undergoing MDCT—A pooled analysis of two randomized trials. Eur. Radiol. 19,891–897 (2009).
48. R. J. Solomon, M. K. Natarajan, S. Doucet, S. K. Sharma, C. S. Staniloae, R. E. Katholi,J. L. Gelormini, M. Labinaz, A. E. Moreyra, Cardiac angiography in renally impairedpatients (CARE) study: A randomized double-blind trial of contrast-inducednephropathy in patients with chronic kidney disease. Circulation 115, 3189–3196(2007).
49. K. R. Beckett, A. K. Moriarity, J. M. Langer, Safe use of contrast media: What the radiologistneeds to know. Radiographics 35, 1738–1750 (2015).
50. J. R. Dillman, P. J. Strouse, J. H. Ellis, R. H. Cohan, S. C. Jan, Incidence and severity ofacute allergic-like reactions to i.v. nonionic iodinated contrast material in children.AJR Am. J. Roentgenol. 188, 1643–1647 (2007).
51. A. E. Haight, S. C. Kaste, O. G. Goloubeva, X. P. Xiong, L. C. Bowman, Nephrotoxicity ofiopamidol in pediatric, adolescent, and young adult patients who have undergoneallogeneic bone marrow transplantation. Radiology 226, 399–404 (2003).
52. J. L. Zhang, H. Rusinek, L. Bokacheva, L. O. Lerman, Q. Chen, C. Prince, N. Oesingmann,T. Song, V. S. Lee, Functional assessment of the kidney from magnetic resonance andcomputed tomography renography: Impulse retention approach to a multicompartmentmodel. Magn. Reson. Med. 59, 278–288 (2008).
53. E. Kanal, M. F. Tweedle, Residual or retained gadolinium: Practical implications forradiologists and our patients. Radiology 275, 630–634 (2015).
54. F. Gaspari, N. Perico, P. Ruggenenti, L. Mosconi, C. S. Amuchastegui, E. Guerini, E. Daina,G. Remuzzi, Plasma clearance of nonradioactive iohexol as a measure of glomerularfiltration rate. J. Am. Soc. Nephrol. 6, 257–263 (1995).
55. Y. Tsushima, M. J. K. Blomley, S. Kusano, K. Endo, Use of contrast-enhanced computedtomography to measure clearance per unit renal volume: A novel measurementof renal function and fractional vascular volume. Am. J. Kidney Dis. 33, 754–760(1999).
56. Y. Qi, P. Hu, Y. Xie, K. Wei, M. Jin, G. Ma, Q. Li, B. Xu, X. Chen, Glomerular filtration ratemeasured by (99m)Tc-DTPA renal dynamic imaging is significantly lower than thatestimated by the CKD-EPI equation in horseshoe kidney patients. Nephrology 21,499–505 (2016).
57. J. Y. Zhou, H. Zhu, M. Lim, L. Blair, A. Quinones-Hinojosa, S. A. Messina, C. G. Eberhart,M. G. Pomper, J. Laterra, P. B. Barker, P. C. M. van Zijl, J. O. Blakeley, Three-dimensional amide proton transfer MR imaging of gliomas: Initial experience andcomparison with gadolinium enhancement. J. Magn. Reson. Imaging 38, 1119–1128(2013).
9 of 10
SC I ENCE ADVANCES | R E S EARCH ART I C L E
58. X. Xu, N. N. Yadav, L. Knutsson, J. Hua, R. Kalyani, E. Hall, J. Laterra, J. Blakeley,R. Strowd, M. Pomper, P. Barker, K. W. Y. Chan, G. Liu, M. T. McMahon,R. D. Stevens, P. C. M. van Zijl, Dynamic glucose-enhanced (DGE) MRI: Translationto human scanning and first results in glioma patients. Tomography 1, 105–114(2015).
Acknowledgments: We thank I. Ginty and D. Romero (NHGRI, NIH) for skilled assistance withmouse maintenance and transport. Funding: This project was supported by the MarylandStem Cell Research Foundation (grant 2829), the NIH (grant P41EB024495), and the IntramuralResearch Program of the NHGRI, NIH. Author contributions: K.P. and M.T.M. conceivedthe project, designed the experiments, and wrote the manuscript with input from all authors.K.P., A.P., and I.M. performed the experiments. Y.L. assisted with animal studies. I.M., A.P., H.J.V.,and C.P.V. provided expertise on MMA, assisted with the design of animal studies, andperformed disease-related measurements. Competing interests: The authors declare that
Pavuluri et al., Sci. Adv. 2019;5 : eaaw8357 14 August 2019
they have no competing interests. Data and materials availability: All data needed toevaluate the conclusions in the paper are present in the paper and/or the SupplementaryMaterials. Correspondence and requests for materials should be addressed to M.T.M. Themouse models can be provided by C.P.V., pending scientific review and a completed materialtransfer agreement. Requests for the mouse models should be submitted to C.P.V.
Submitted 29 January 2019Accepted 8 July 2019Published 14 August 201910.1126/sciadv.aaw8357
Citation: KD. Pavuluri, I. Manoli, A. Pass, Y. Li, H. J. Vernon, C. P. Venditti, M. T. McMahon,Noninvasive monitoring of chronic kidney disease using pH and perfusion imaging. Sci. Adv.5, eaaw8357 (2019).
10 of 10
on May 26, 2020
http://advances.sciencemag.org/
Dow
nloaded from

Noninvasive monitoring of chronic kidney disease using pH and perfusion imagingKowsalyaDevi Pavuluri, Irini Manoli, Alexandra Pass, Yuguo Li, Hilary J. Vernon, Charles P. Venditti and Michael T. McMahon
DOI: 10.1126/sciadv.aaw8357 (8), eaaw8357.5Sci Adv
ARTICLE TOOLS http://advances.sciencemag.org/content/5/8/eaaw8357
MATERIALSSUPPLEMENTARY http://advances.sciencemag.org/content/suppl/2019/08/12/5.8.eaaw8357.DC1
REFERENCES
http://advances.sciencemag.org/content/5/8/eaaw8357#BIBLThis article cites 55 articles, 4 of which you can access for free
PERMISSIONS http://www.sciencemag.org/help/reprints-and-permissions
Terms of ServiceUse of this article is subject to the
is a registered trademark of AAAS.Science AdvancesYork Avenue NW, Washington, DC 20005. The title (ISSN 2375-2548) is published by the American Association for the Advancement of Science, 1200 NewScience Advances
License 4.0 (CC BY-NC).Science. No claim to original U.S. Government Works. Distributed under a Creative Commons Attribution NonCommercial Copyright © 2019 The Authors, some rights reserved; exclusive licensee American Association for the Advancement of
on May 26, 2020
http://advances.sciencemag.org/
Dow
nloaded from
Related Documents