Sensors 2015, 15, 565-591; doi:10.3390/s150100565 sensors ISSN 1424-8220 www.mdpi.com/journal/sensors Article Non-Invasive UWB Sensing of Astronauts’ Breathing Activity Marco Baldi, Graziano Cerri, Franco Chiaraluce *, Lorenzo Eusebi and Paola Russo Università Politecnica delle Marche, Dipartimento di Ingegneria dell’Informazione, Via Brecce Bianche 12, Ancona 60131, Italy; E-Mails: [email protected] (M.B.); [email protected] (G.C.); [email protected] (L.E.); [email protected] (P.R.) * Author to whom correspondence should be addressed; E-Mail: [email protected]; Tel.: +39-071-220-4467; Fax: +39-071-220-4224. Academic Editor: Stefano Mariani Received: 11 November 2014 / Accepted: 24 December 2014 / Published: 30 December 2014 Abstract: The use of a UWB system for sensing breathing activity of astronauts must account for many critical issues specific to the space environment. The aim of this paper is twofold. The first concerns the definition of design constraints about the pulse amplitude and waveform to transmit, as well as the immunity requirements of the receiver. The second issue concerns the assessment of the procedures and the characteristics of the algorithms to use for signal processing to retrieve the breathing frequency and respiration waveform. The algorithm has to work correctly in the presence of surrounding electromagnetic noise due to other sources in the environment. The highly reflecting walls increase the difficulty of the problem and the hostile scenario has to be accurately characterized. Examples of signal processing techniques able to recover breathing frequency in significant and realistic situations are shown and discussed. Keywords: breath detection; electromagnetic compatibility; sensors; radiated emission; radiated susceptibility; signal processing; space missions; spectral analysis; ultra wide bandwidth 1. Introduction The possibility of using ultra wide bandwidth (UWB) technology for monitoring some physiological parameters, for example, concerning the respiration activity of astronauts, has been the objective of the project entitled “Non Invasive Monitoring by Ultra wide band Radar of Respiratory Activity of people inside a spatial environment” (NIMURRA), funded by the Italian Space Agency (ASI). The project has involved four Universities, namely: “La Sapienza” University in Rome, University of L’Aquila, OPEN ACCESS

Welcome message from author
This document is posted to help you gain knowledge. Please leave a comment to let me know what you think about it! Share it to your friends and learn new things together.
Transcript
Sensors 2015, 15, 565-591; doi:10.3390/s150100565
sensors ISSN 1424-8220
www.mdpi.com/journal/sensors
Article
Non-Invasive UWB Sensing of Astronauts’ Breathing Activity
Marco Baldi, Graziano Cerri, Franco Chiaraluce *, Lorenzo Eusebi and Paola Russo
Università Politecnica delle Marche, Dipartimento di Ingegneria dell’Informazione,
Via Brecce Bianche 12, Ancona 60131, Italy; E-Mails: [email protected] (M.B.);
[email protected] (G.C.); [email protected] (L.E.); [email protected] (P.R.)
* Author to whom correspondence should be addressed; E-Mail: [email protected];
Tel.: +39-071-220-4467; Fax: +39-071-220-4224.
Academic Editor: Stefano Mariani
Received: 11 November 2014 / Accepted: 24 December 2014 / Published: 30 December 2014
Abstract: The use of a UWB system for sensing breathing activity of astronauts must account
for many critical issues specific to the space environment. The aim of this paper is twofold.
The first concerns the definition of design constraints about the pulse amplitude and waveform
to transmit, as well as the immunity requirements of the receiver. The second issue concerns
the assessment of the procedures and the characteristics of the algorithms to use for signal
processing to retrieve the breathing frequency and respiration waveform. The algorithm has
to work correctly in the presence of surrounding electromagnetic noise due to other sources in
the environment. The highly reflecting walls increase the difficulty of the problem and the hostile
scenario has to be accurately characterized. Examples of signal processing techniques able
to recover breathing frequency in significant and realistic situations are shown and discussed.
Keywords: breath detection; electromagnetic compatibility; sensors; radiated emission; radiated
susceptibility; signal processing; space missions; spectral analysis; ultra wide bandwidth
1. Introduction
The possibility of using ultra wide bandwidth (UWB) technology for monitoring some physiological
parameters, for example, concerning the respiration activity of astronauts, has been the objective of the
project entitled “Non Invasive Monitoring by Ultra wide band Radar of Respiratory Activity of people
inside a spatial environment” (NIMURRA), funded by the Italian Space Agency (ASI). The project has
involved four Universities, namely: “La Sapienza” University in Rome, University of L’Aquila,
OPEN ACCESS
Sensors 2015, 15 566
University of Bologna and Polytechnical University of Marche, and two Italian small/medium
enterprises, Advanced Computer Systems (ACS) and Kayser Italia, whose main core business is the
development of systems in support of space missions.
The chance to estimate in real time the frequency and depth of respiratory acts is of particular
importance [1], because, as the environment pressure varies, compensation mechanisms can be triggered,
which indirectly highlight a possible suffering state of the organism because of a lack of oxygen. Despite
subjective symptoms are extremely variegated, a modification of both frequency and depth of respiratory
acts is always present, and can be considered as a marker in case of hypoxic suffering (lack of oxygen).
It is evident that in such conditions it would be extremely useful to be able to monitor the respiratory activity
of the astronauts, an investigation which cannot be carried out by means of the classical optoelectronic
plethysmography technique [2] both for the limitations that the needed petticoat would impose and
because this technique requires immobility from the patient. Starting from the previous considerations,
the rationale of the project for sensing the respiratory activity concerned the design of a completely
non-invasive technique, which also allows the subject under examination to freely move.
The monitoring of the astronauts can be performed in different environments and situations, for example
when they are working inside the space station modules, during the extra vehicular activity (EVA), or
when they are resting. In particular, the project focused on the monitoring of the astronauts when they
are inside the crew quarter devoted to rest. In fact, rest and sleep have been consistently reported as being
of poor quality in microgravity, both by American astronauts and Russian cosmonauts [3,4], but up to
now only few studies have addressed the combined action of microgravity and rest on respiration and
chest wall mechanics.
Radio frequency (RF) systems for the detection of the physiological activities have been proposed in
the literature, but, to the authors’ knowledge, they were never specifically addressed for aerospace
applications; such equipment can be grouped into two main families: Doppler and UWB systems.
Historically, Doppler systems were considered first for the detection of vital signs. The idea consists of
revealing thorax movements to obtain the respiratory frequency using radar techniques in the microwave
region [5–10]. Most of the research effort is devoted to the processing of the received signal, and several
techniques which make the processing more robust were described and implemented [11,12] to investigate
also the capability to detect heartbeat. More recent papers are essentially addressed to overcome existing
difficulties for applications to realistic environments, introducing more effective processing
strategies [13,14], whereas other works deal with practical aspects related to the electronic device
fabrication [15–17].
A different choice is offered by the capability of UWB radars to pass through obstacles, by their
high resolution, low costs, low energy consumption, low power spectral density levels, associated with
ultra-short pulse transmission and immunity against multipath interference [18]. The first applications
to cardio-respiratory activity monitoring of UWB radar have been proposed by McEwan in [19], where
a baseband radar with “range gating” receiver is proposed. The features of the UWB radar were also
exploited to extract human vital signs in complex environments [20–23], whereas specific UWB radar
systems [24–27] were designed for the rescue of victims trapped in rubble.
The novelty of the NIMURRA project is represented by the application of the UWB technique to
monitor astronauts’ respiration in a space environment. Despite the premises above, in fact, the use of a
biomedical radar in this involved scenario has not been extensively studied in previous literature. This
Sensors 2015, 15 567
very specific contest requires an accurate electro-magnetic (EM) characterization of the module. More
precisely, two aspects of paramount importance for the system design are analyzed in this paper. The
first aspect regards the compatibility of the system with the surrounding environment in terms of emitted
electromagnetic noise, because both the UWB system and external equipment can be considered at the
same time culprit and victim of malfunctioning. As a consequence the analysis of robust algorithms to
cancel out interfering signals for a correct detection of the breathing frequency is the second
mandatory requirement.
The installation of equipment on board the International Space Station (ISS), that could be assumed
as a valuable testbed for the application of the proposed system, involves a detailed analysis of the
electromagnetic compatibility (EMC) aspects. The importance of this issue is proved by previous
experimental analysis on airplanes [28–30] where emission of UWB signals have been evaluated within
the bandwidth of some aerospace electronics. Therefore, at first, we show how some design constraints
have been assessed in order to take into account the presence of other electronic equipment already on
board of the station, to avoid any undesired electromagnetic emissions which may cause malfunctioning
of other devices (emission issues) and to withstand different radiated and conducted emissions from
other sources (immunity issues).
However, compliance with electromagnetic interference (EMI) international standards is not the only
requirement, because the capability of the system to recover the correct breathing frequency has to be
assured also in the presence of low level disturbing signals, both narrow band and broad band,
superimposed on the received pulses. Suitable signal processing algorithms must be developed for such
a purpose. Conceptually, the breathing rate can be obtained by means of a Fourier analysis, that is, a fast
Fourier transform (FFT), if necessary through effective implementations like the chirp-Z transform (CZT),
which allows to isolate the fundamental frequency of an “essentially periodic” signal as the breath is (at
least in normal conditions). The fundamental frequency corresponds to identifying the position of the major
peak in the spectrum. However, the correct identification of the breathing rate should occur, as
mentioned, in a noisy environment and in the presence of reflected signals due to obstacles and objects
around the monitored astronaut. This may require the adoption of smart numerical tools and procedures,
for example consisting of the adoption of multi-peak detection [31] or multicolumn FFT [32]. Although
we have also taken into account these variants, the results we will show throughout the paper will be
mostly referred to the classical approach, which consists of searching for the major peak only. In fact, such
a method is often sufficient for estimating the breathing rate, even in the complex space environment
considered. Moreover, in this paper, besides the evaluation of the breathing rate, another target is the
reconstruction of the entire breathing signal. This goal has been pursued as well, through the employment
of a suitable reference signal. We have also faced the problem of compensating possible random movements
during rest, by introducing suitable tools in the signal processor. Both the EM and signal processing
approaches have been validated through laboratory experiments in order to assess the reliability of the
simulation tools that have been used to model the complex and critical space applications.
The paper is organized as follows: in Section 2 a brief description of the whole system is reported; in
Section 3 the system compliance to international EMI standards is addressed; in Section 4 the algorithms
for the signal processing are presented; in Section 5 significant results concerning the application of the
algorithms to a signal degraded by environmental electromagnetic interference are reported; finally some
conclusions are summarized in Section 6.
Sensors 2015, 15 568
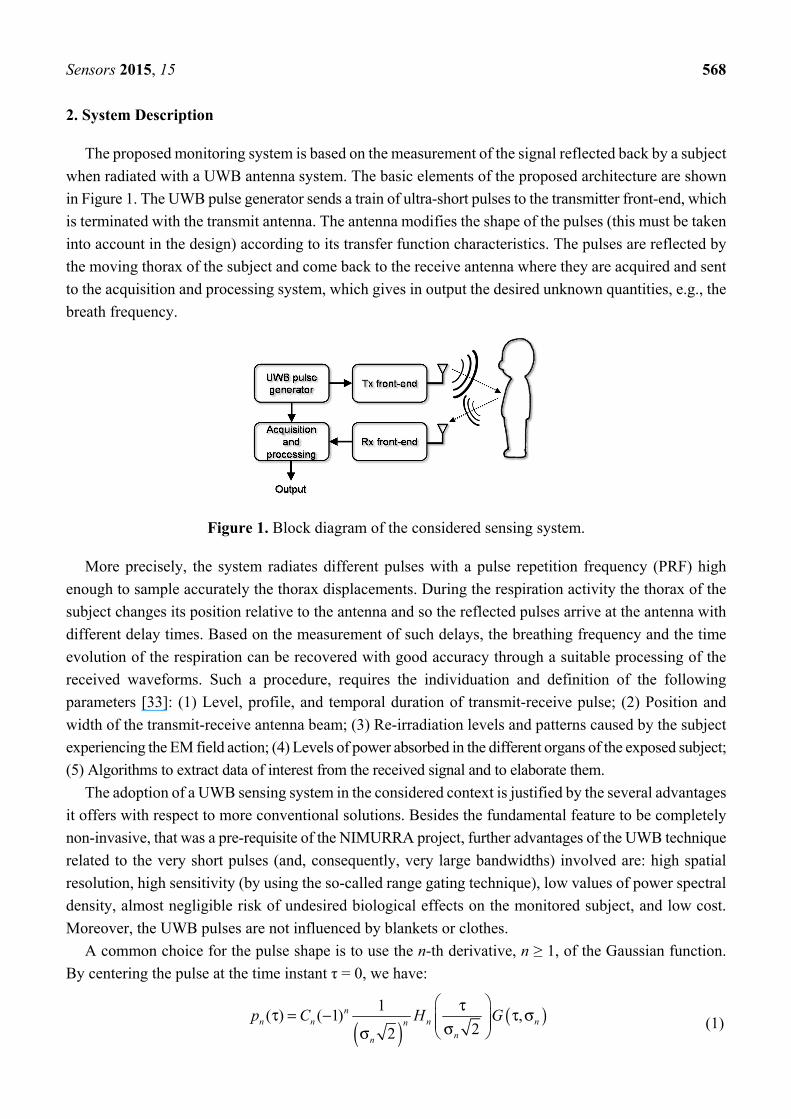
2. System Description
The proposed monitoring system is based on the measurement of the signal reflected back by a subject
when radiated with a UWB antenna system. The basic elements of the proposed architecture are shown
in Figure 1. The UWB pulse generator sends a train of ultra-short pulses to the transmitter front-end, which
is terminated with the transmit antenna. The antenna modifies the shape of the pulses (this must be taken
into account in the design) according to its transfer function characteristics. The pulses are reflected by
the moving thorax of the subject and come back to the receive antenna where they are acquired and sent
to the acquisition and processing system, which gives in output the desired unknown quantities, e.g., the
breath frequency.
Figure 1. Block diagram of the considered sensing system.
More precisely, the system radiates different pulses with a pulse repetition frequency (PRF) high
enough to sample accurately the thorax displacements. During the respiration activity the thorax of the
subject changes its position relative to the antenna and so the reflected pulses arrive at the antenna with
different delay times. Based on the measurement of such delays, the breathing frequency and the time
evolution of the respiration can be recovered with good accuracy through a suitable processing of the
received waveforms. Such a procedure, requires the individuation and definition of the following
parameters [33]: (1) Level, profile, and temporal duration of transmit-receive pulse; (2) Position and
width of the transmit-receive antenna beam; (3) Re-irradiation levels and patterns caused by the subject
experiencing the EM field action; (4) Levels of power absorbed in the different organs of the exposed subject;
(5) Algorithms to extract data of interest from the received signal and to elaborate them.
The adoption of a UWB sensing system in the considered context is justified by the several advantages
it offers with respect to more conventional solutions. Besides the fundamental feature to be completely
non-invasive, that was a pre-requisite of the NIMURRA project, further advantages of the UWB technique
related to the very short pulses (and, consequently, very large bandwidths) involved are: high spatial
resolution, high sensitivity (by using the so-called range gating technique), low values of power spectral
density, almost negligible risk of undesired biological effects on the monitored subject, and low cost.
Moreover, the UWB pulses are not influenced by blankets or clothes.
A common choice for the pulse shape is to use the n-th derivative, n ≥ 1, of the Gaussian function.
By centering the pulse at the time instant τ = 0, we have:
( )( )1
( ) ( 1) ,22
nn n n nn
nn
p C H G ττ = − τ σ σ σ
(1)
Sensors 2015, 15 569
where Cn is a constant determining the pulse amplitude, pn(τ) is the pulse waveform as a function of the
time τ, Hn is the Hermite polynomial of order n and G is the Gaussian function with zero mean and standard
deviation σn. The latter determines the effective pulse duration. For example, in the case of n = 1 (Gaussian
monocycle), σn = τp/2, where τp is the time gap between the maximum and the minimum of the monocycle.
As the pulses so defined have nominally infinite extension in time, their effective duration τd must be
properly defined. For example, we can consider the interval outside which the pulse assumes, in modulus,
values not greater than 1‰ of the maximum amplitude. In the case of n = 1, this corresponds to have
τd ≈ 3.75τp. Finally, for the same case of n = 1, we have τp = 1/(πfc), where fc is the frequency at which the
spectrum of the pulse is maximum (central frequency). The UWB signal spectrum has a central role in
the analysis and will be discussed in Section 3.
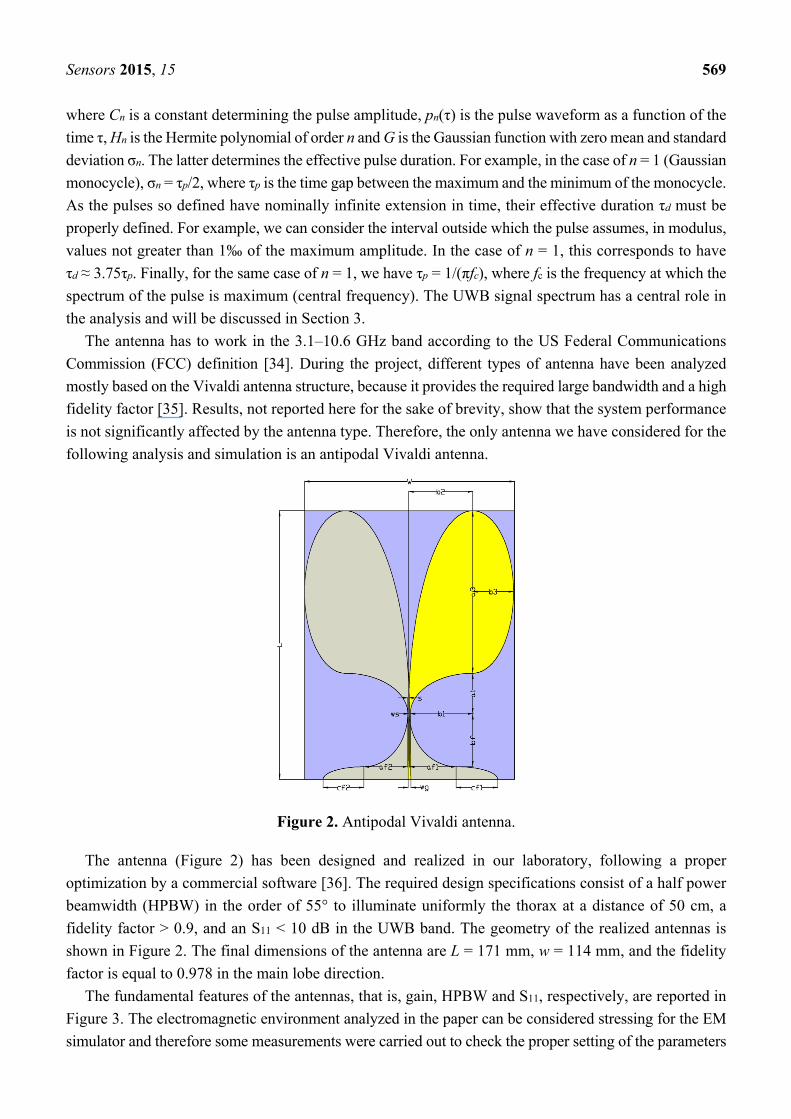
The antenna has to work in the 3.1–10.6 GHz band according to the US Federal Communications
Commission (FCC) definition [34]. During the project, different types of antenna have been analyzed
mostly based on the Vivaldi antenna structure, because it provides the required large bandwidth and a high
fidelity factor [35]. Results, not reported here for the sake of brevity, show that the system performance
is not significantly affected by the antenna type. Therefore, the only antenna we have considered for the
following analysis and simulation is an antipodal Vivaldi antenna.
Figure 2. Antipodal Vivaldi antenna.
The antenna (Figure 2) has been designed and realized in our laboratory, following a proper
optimization by a commercial software [36]. The required design specifications consist of a half power
beamwidth (HPBW) in the order of 55° to illuminate uniformly the thorax at a distance of 50 cm, a
fidelity factor > 0.9, and an S11 < 10 dB in the UWB band. The geometry of the realized antennas is
shown in Figure 2. The final dimensions of the antenna are L = 171 mm, w = 114 mm, and the fidelity
factor is equal to 0.978 in the main lobe direction.
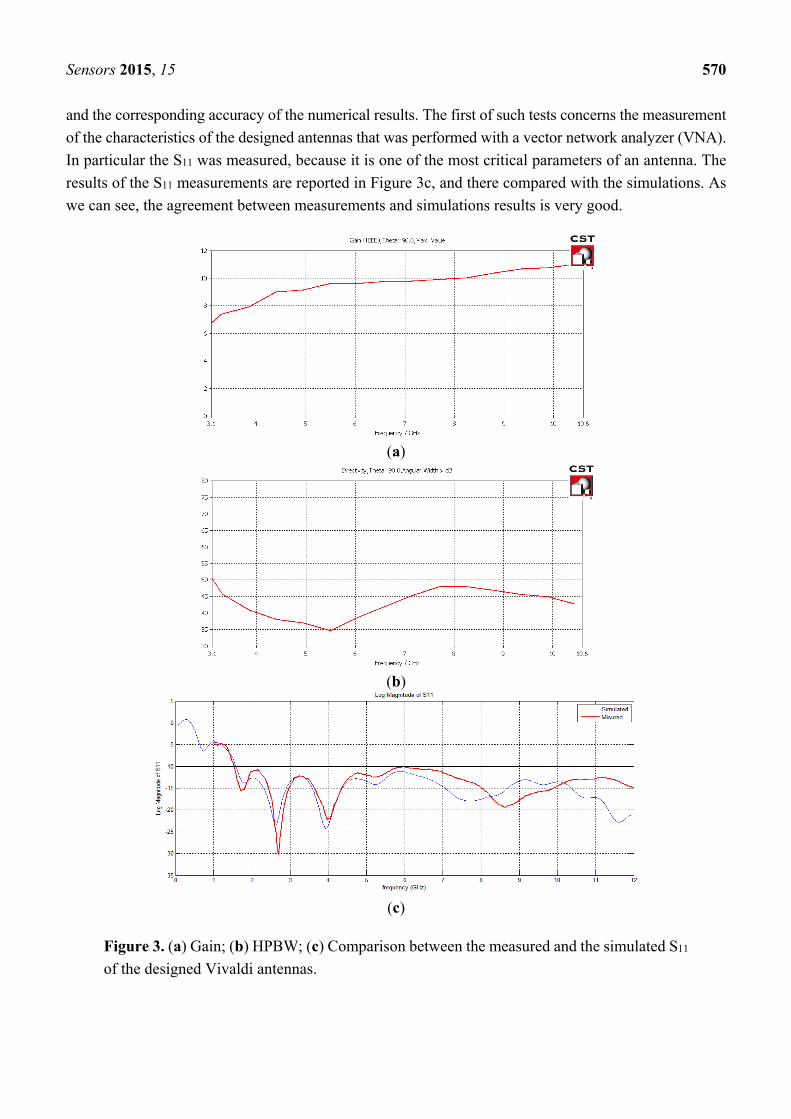
The fundamental features of the antennas, that is, gain, HPBW and S11, respectively, are reported in
Figure 3. The electromagnetic environment analyzed in the paper can be considered stressing for the EM
simulator and therefore some measurements were carried out to check the proper setting of the parameters
Sensors 2015, 15 570
and the corresponding accuracy of the numerical results. The first of such tests concerns the measurement
of the characteristics of the designed antennas that was performed with a vector network analyzer (VNA).
In particular the S11 was measured, because it is one of the most critical parameters of an antenna. The
results of the S11 measurements are reported in Figure 3c, and there compared with the simulations. As
we can see, the agreement between measurements and simulations results is very good.
(a)
(b)
(c)
Figure 3. (a) Gain; (b) HPBW; (c) Comparison between the measured and the simulated S11
of the designed Vivaldi antennas.
Sensors 2015, 15 571
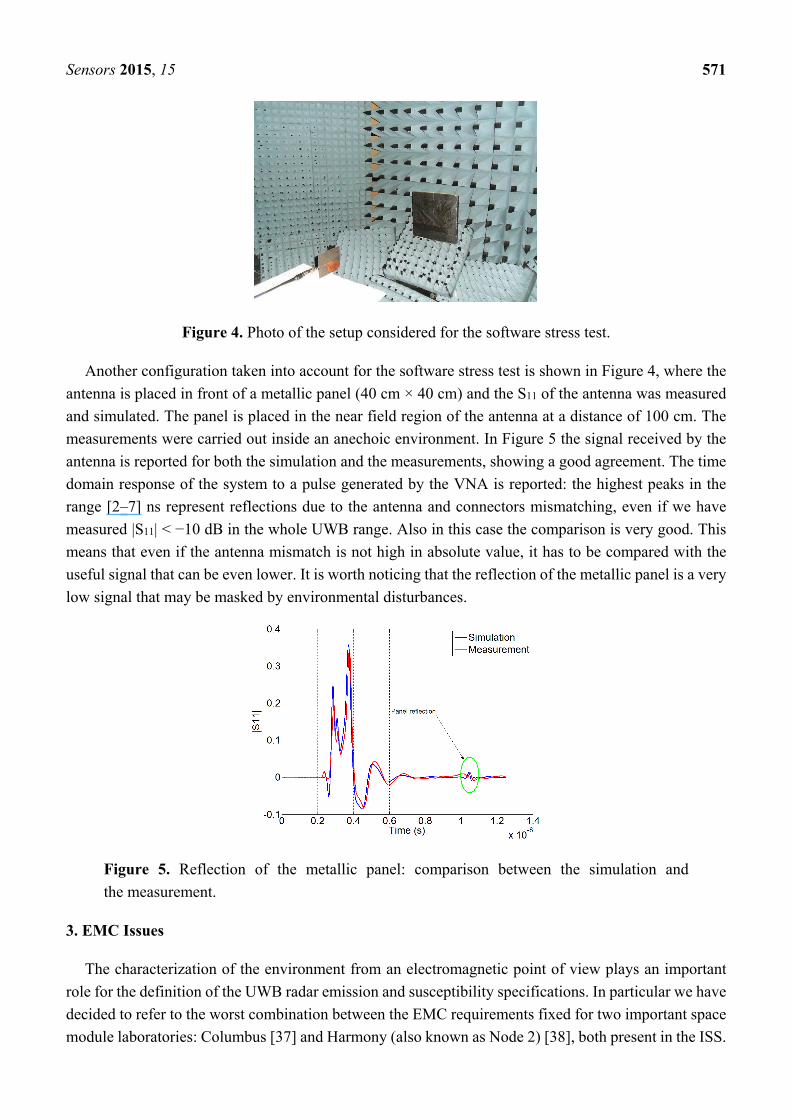
Figure 4. Photo of the setup considered for the software stress test.
Another configuration taken into account for the software stress test is shown in Figure 4, where the
antenna is placed in front of a metallic panel (40 cm × 40 cm) and the S11 of the antenna was measured
and simulated. The panel is placed in the near field region of the antenna at a distance of 100 cm. The
measurements were carried out inside an anechoic environment. In Figure 5 the signal received by the
antenna is reported for both the simulation and the measurements, showing a good agreement. The time
domain response of the system to a pulse generated by the VNA is reported: the highest peaks in the
range [2–7] ns represent reflections due to the antenna and connectors mismatching, even if we have
measured |S11| < −10 dB in the whole UWB range. Also in this case the comparison is very good. This
means that even if the antenna mismatch is not high in absolute value, it has to be compared with the
useful signal that can be even lower. It is worth noticing that the reflection of the metallic panel is a very
low signal that may be masked by environmental disturbances.
Figure 5. Reflection of the metallic panel: comparison between the simulation and
the measurement.
3. EMC Issues
The characterization of the environment from an electromagnetic point of view plays an important
role for the definition of the UWB radar emission and susceptibility specifications. In particular we have
decided to refer to the worst combination between the EMC requirements fixed for two important space
module laboratories: Columbus [37] and Harmony (also known as Node 2) [38], both present in the ISS.

Sensors 2015, 15 572
3.1. Compliance with Standard for Emissions
Radiated emission (RE) measurement procedures are defined by the MIL-STD 461 [39] and 462 [40],
and the maximum allowed radiated emission levels are reported in Figure 6. As the measurement
distance from the antenna is fixed at 1 m, the far field antenna behavior cannot be assumed for the RE
prediction and a field computation in near field is required.
The aim of the analysis is the assessment of the design specification concerning the maximum input
voltage feeding the antenna that allows system compliance with the emission standards. For such
purpose, the field radiated by different kinds of antenna (a double ridge antenna, a printed Vivaldi
antenna, and a solid Vivaldi antenna) has been analyzed, using the CST software [36] to test the robustness
of the approach with respect to the radiating systems. In particular, the relationship between the allowed
electric field limits, the pulse spectral density and the pulse waveform has been determined.
Figure 6. Electric field limits as a worst-case combination of Columbus and Harmony
EMC requirements.
As the EMC standards are given in the frequency domain, the transfer function H(f) between the
Fourier transform of the 1 m electric field, E(f), and the Fourier transform of the antenna input voltage,
V(f), is computed:
1( )( ) m
( )
E fH f
V f− = (2)
This quantity is used to recover the voltage spectral density limit S(f) for the UWB pulse applicable
to the antenna, in order to fulfill the electric field limits Elimit previously shown in Figure 6:
[ ]limit( ) V/Hz( ) RBW
ES f
H f=
⋅ (3)
where RBW is the resolution bandwidth of the measurement instruments.
The emission level measured with the standard procedure depends on the PRF of the UWB signal
compared to the RBW of the instrument. In Equation (3) we assume that PRF << RBW, so that the
emission level is simply the inverse of the RBW of the instrument.
Figure 7 reports |S(f)| from Equation (3) when RBW = 1 MHz (as prescribed by standard) for the
considered Vivaldi antenna. This figure provides the root mean square (RMS) value of an upper limit to
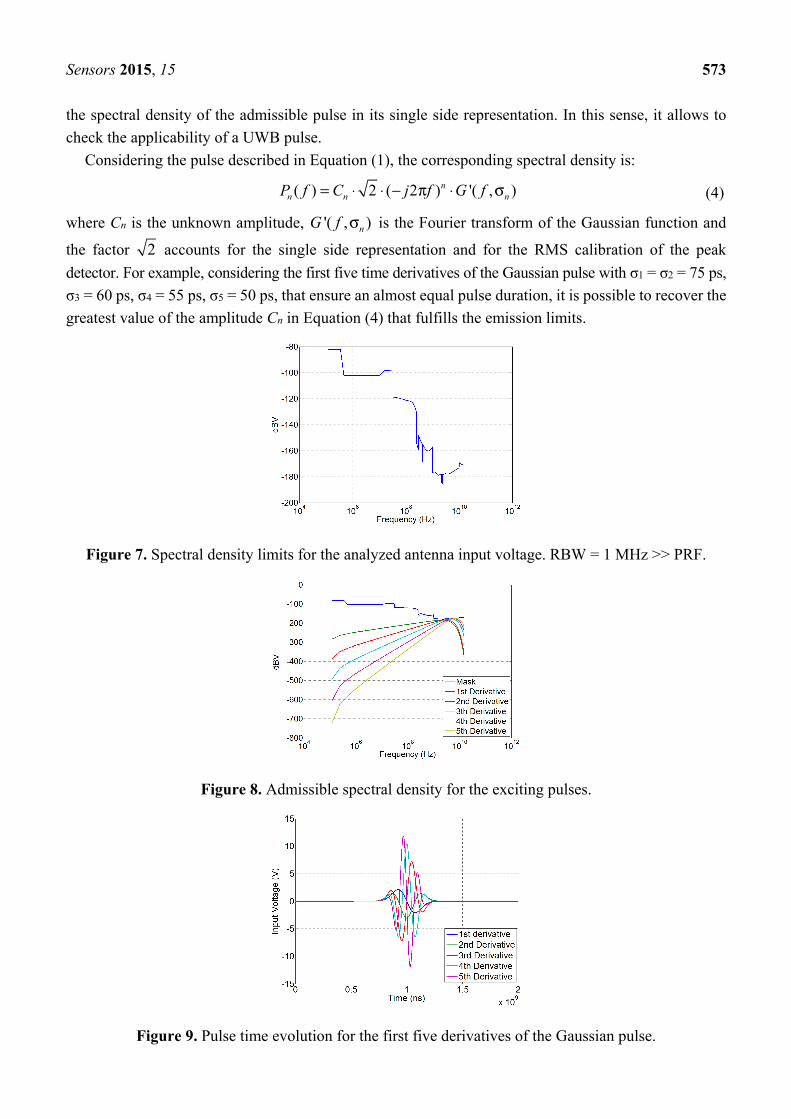
Sensors 2015, 15 573
the spectral density of the admissible pulse in its single side representation. In this sense, it allows to
check the applicability of a UWB pulse.
Considering the pulse described in Equation (1), the corresponding spectral density is:
( ) 2 ( 2 ) '( , )nn n nP f C j f G f= ⋅ ⋅ − π ⋅ σ (4)
where Cn is the unknown amplitude, '( , )nG f σ is the Fourier transform of the Gaussian function and
the factor 2 accounts for the single side representation and for the RMS calibration of the peak
detector. For example, considering the first five time derivatives of the Gaussian pulse with σ1 = σ2 = 75 ps,
σ3 = 60 ps, σ4 = 55 ps, σ5 = 50 ps, that ensure an almost equal pulse duration, it is possible to recover the
greatest value of the amplitude Cn in Equation (4) that fulfills the emission limits.
Figure 7. Spectral density limits for the analyzed antenna input voltage. RBW = 1 MHz >> PRF.
Figure 8. Admissible spectral density for the exciting pulses.
Figure 9. Pulse time evolution for the first five derivatives of the Gaussian pulse.
Sensors 2015, 15 574
Figure 8 shows the spectral densities of the UWB input signals corresponding to the time impulse
reported in Figure 9. It is noticeable that the deep notch at 2.45 GHz produces the highest limitation in the
pulse amplitude up to the third derivative, whereas for higher order derivatives its effect is less evident.
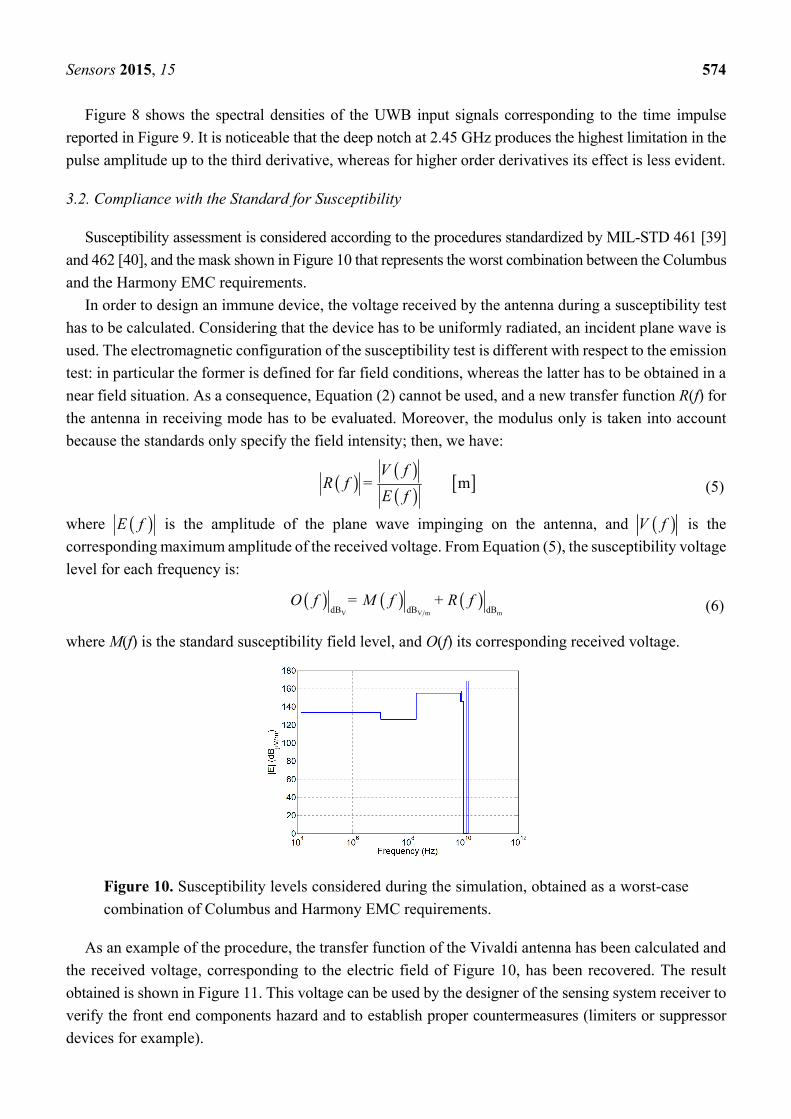
3.2. Compliance with the Standard for Susceptibility
Susceptibility assessment is considered according to the procedures standardized by MIL-STD 461 [39]
and 462 [40], and the mask shown in Figure 10 that represents the worst combination between the Columbus
and the Harmony EMC requirements.
In order to design an immune device, the voltage received by the antenna during a susceptibility test
has to be calculated. Considering that the device has to be uniformly radiated, an incident plane wave is
used. The electromagnetic configuration of the susceptibility test is different with respect to the emission
test: in particular the former is defined for far field conditions, whereas the latter has to be obtained in a
near field situation. As a consequence, Equation (2) cannot be used, and a new transfer function R(f) for
the antenna in receiving mode has to be evaluated. Moreover, the modulus only is taken into account
because the standards only specify the field intensity; then, we have:
( ) ( )( ) [ ]m
V fR f =
E f (5)
where ( )E f is the amplitude of the plane wave impinging on the antenna, and ( )V f is the
corresponding maximum amplitude of the received voltage. From Equation (5), the susceptibility voltage
level for each frequency is:
( ) ( ) ( )V V m mdB dB dB
O f = M f + R f (6)
where M(f) is the standard susceptibility field level, and O(f) its corresponding received voltage.
Figure 10. Susceptibility levels considered during the simulation, obtained as a worst-case
combination of Columbus and Harmony EMC requirements.
As an example of the procedure, the transfer function of the Vivaldi antenna has been calculated and
the received voltage, corresponding to the electric field of Figure 10, has been recovered. The result
obtained is shown in Figure 11. This voltage can be used by the designer of the sensing system receiver to
verify the front end components hazard and to establish proper countermeasures (limiters or suppressor
devices for example).

Sensors 2015, 15 575
Figure 11. Susceptibility voltage level for the Vivaldi antenna.
4. Signal Processing Solutions
In this section, we describe the theoretical and software tools we have adopted for extracting the
respiration features and, in particular, the breath frequency from the received signal. Some preliminary
numerical examples will be also provided, that however do not take into account the EMC issues. The
latter will be instead considered in Section 5, which is devoted to the presentation of some results in
realistic environments.
4.1. Breath Rate Detection
The core of the signal processing algorithm consists of the acquisition of an elaboration matrix R that
collects a number of received waveforms, comprehensive of the useful signal (i.e., reflected from the
thorax) and undesired ones (due to fixed obstacles in the environment, thermal noise, disturbing signals
from electronic apparatus—here neglected for the reasons explained in the premise—, etc.). More precisely,
each row of R contains the samples of a received waveform. The time-axis along each received waveform
is termed “fast-time” (τ) and has a rather small sampling time Tf (e.g., Tf = 10 ps). The interval between
subsequent acquisitions (that is, two adjacent rows of R) is indicated by Ts and is in the order of 0.1 s. The
corresponding time-axis is termed “slow-time” (t). The duration of the measurement interval is denoted by
Tmeas and the ratio between Tmeas and Ts provides the number of rows of R.
The difficulty in achieving small values of Ts and, most of all, of Tf is a critical point of the
experimental system since, in the absence of an efficient sampling and real time communication of the
sampled data, the performance may degrade. However, if the target is to detect only the breath frequency,
the theoretical constraints on the sampling interval can be relaxed while continuing to obtain satisfactory
results. The impact is more pronounced as concerns the reconstruction of the entire waveform (if desired)
where, however, limited sampling can be partly compensated through the adoption of more refined (and
therefore complex) detection techniques.
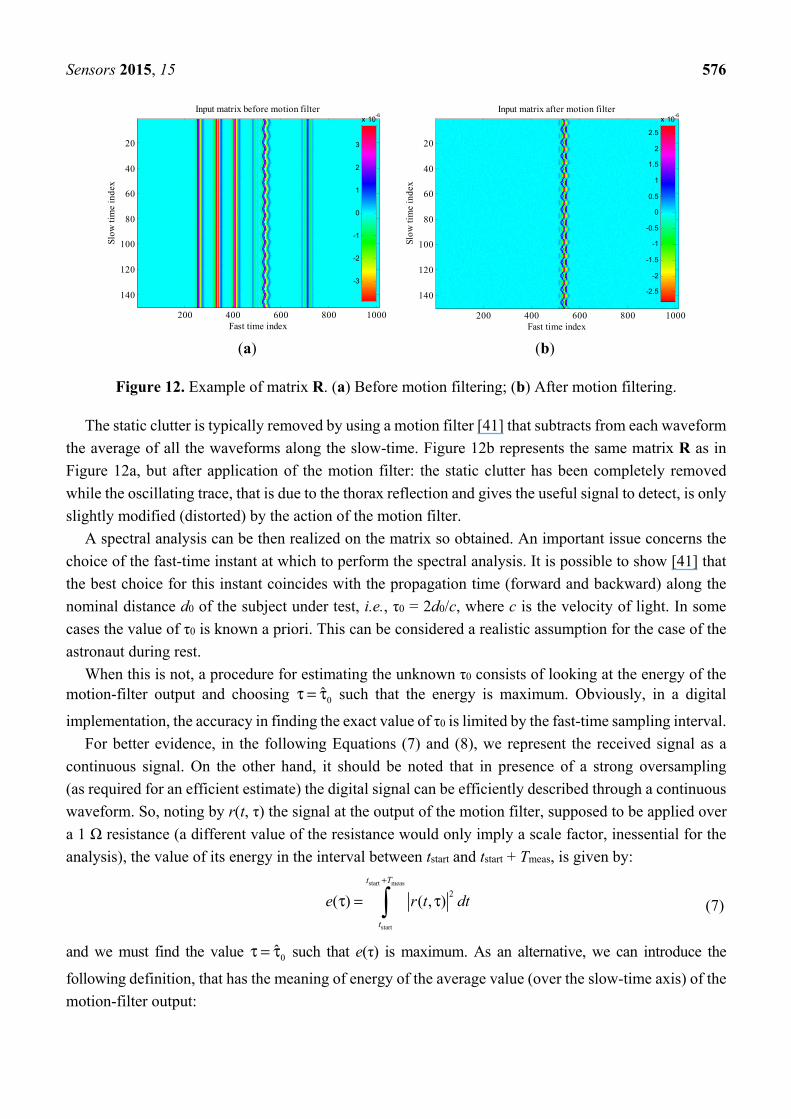
A pictorial example of matrix R at the receiver input is shown in Figure 12a: vertical, multi-colored,
straight lines denote the presence of static clutter contributions due to some fixed obstacles present in
the considered environment; these undesired echoes can be identified and removed through suitable
signal processing algorithms.
Sensors 2015, 15 576
(a) (b)
Figure 12. Example of matrix R. (a) Before motion filtering; (b) After motion filtering.
The static clutter is typically removed by using a motion filter [41] that subtracts from each waveform
the average of all the waveforms along the slow-time. Figure 12b represents the same matrix R as in
Figure 12a, but after application of the motion filter: the static clutter has been completely removed
while the oscillating trace, that is due to the thorax reflection and gives the useful signal to detect, is only
slightly modified (distorted) by the action of the motion filter.
A spectral analysis can be then realized on the matrix so obtained. An important issue concerns the
choice of the fast-time instant at which to perform the spectral analysis. It is possible to show [41] that
the best choice for this instant coincides with the propagation time (forward and backward) along the
nominal distance d0 of the subject under test, i.e., τ0 = 2d0/c, where c is the velocity of light. In some
cases the value of τ0 is known a priori. This can be considered a realistic assumption for the case of the
astronaut during rest.
When this is not, a procedure for estimating the unknown τ0 consists of looking at the energy of the motion-filter output and choosing 0ˆτ = τ such that the energy is maximum. Obviously, in a digital
implementation, the accuracy in finding the exact value of τ0 is limited by the fast-time sampling interval.
For better evidence, in the following Equations (7) and (8), we represent the received signal as a
continuous signal. On the other hand, it should be noted that in presence of a strong oversampling
(as required for an efficient estimate) the digital signal can be efficiently described through a continuous
waveform. So, noting by r(t, τ) the signal at the output of the motion filter, supposed to be applied over
a 1 Ω resistance (a different value of the resistance would only imply a scale factor, inessential for the
analysis), the value of its energy in the interval between tstart and tstart + Tmeas, is given by:
start meas
start
2( ) ( , )
t T
t
e r t dt
+
τ = τ (7)
and we must find the value 0ˆτ = τ such that e(τ) is maximum. As an alternative, we can introduce the
following definition, that has the meaning of energy of the average value (over the slow-time axis) of the
motion-filter output:
Input matrix before motion filter
Fast time index
Slow
tim
e in
dex
200 400 600 800 1000
20
40
60
80
100
120
140
-3
-2
-1
0
1
2
3
x 10-6
Input matrix after motion filter
Fast time index
Slow
tim
e in
dex
200 400 600 800 1000
20
40
60
80
100
120
140 -2.5
-2
-1.5
-1
-0.5
0
0.5
1
1.5
2
2.5
x 10-6
Sensors 2015, 15 577
start meas
start
2
meas
( , )
'( )
t T
t
r t dt
eT
+
τ
τ =
(8)
Potentially, the use of Equation (8) in the place of Equation (7) has the advantage to reduce the effect
of the thermal noise, since the latter is averaged through the integral operation. An example in this sense
is provided in [42]. An intermediate situation occurs when the value of τ0 is known only approximately.
Once again, this scenario is significant for the specific application we are considering as, during rest, it
is possible that the astronaut makes some limited and slow movements, around the nominal position,
that slightly modify the distance between the thorax and the antenna. In this case, a “robust” procedure
for counter estimation errors in the local value of τ0 consists of computing the Fourier transform not only at the selected 0τ but also in a range around that value.
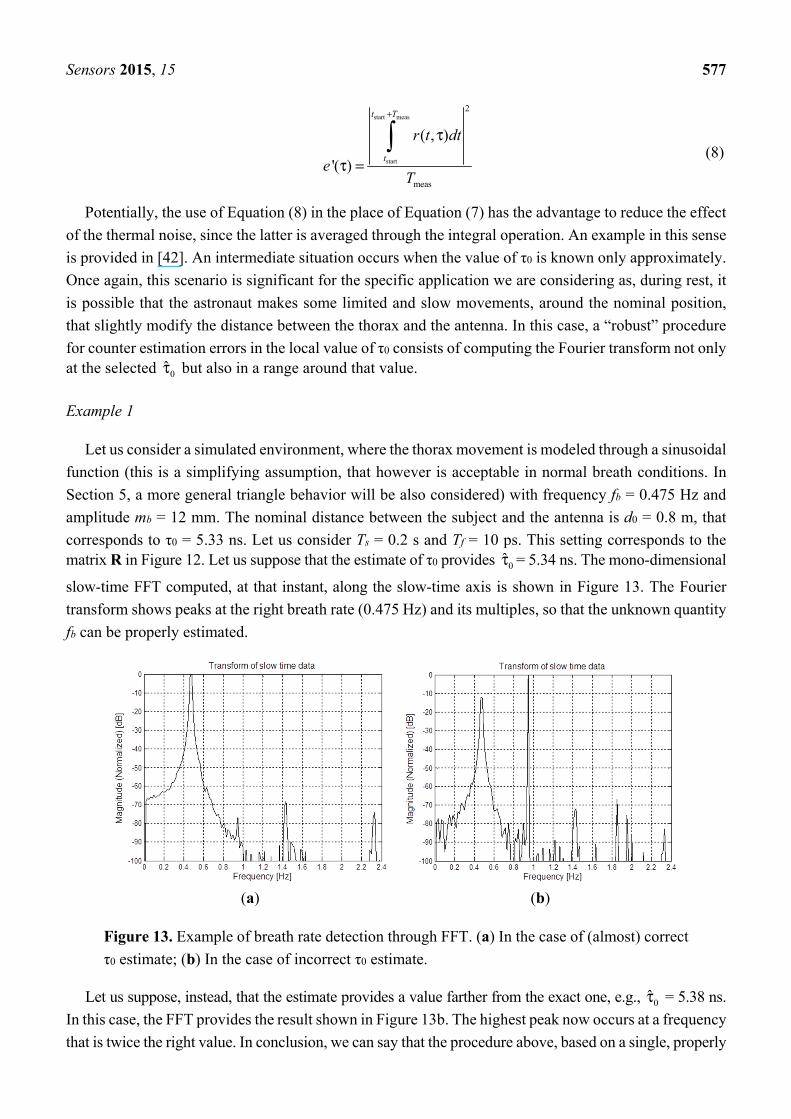
Example 1
Let us consider a simulated environment, where the thorax movement is modeled through a sinusoidal
function (this is a simplifying assumption, that however is acceptable in normal breath conditions. In
Section 5, a more general triangle behavior will be also considered) with frequency fb = 0.475 Hz and
amplitude mb = 12 mm. The nominal distance between the subject and the antenna is d0 = 0.8 m, that
corresponds to τ0 = 5.33 ns. Let us consider Ts = 0.2 s and Tf = 10 ps. This setting corresponds to the matrix R in Figure 12. Let us suppose that the estimate of τ0 provides 0τ = 5.34 ns. The mono-dimensional
slow-time FFT computed, at that instant, along the slow-time axis is shown in Figure 13. The Fourier
transform shows peaks at the right breath rate (0.475 Hz) and its multiples, so that the unknown quantity
fb can be properly estimated.
(a) (b)
Figure 13. Example of breath rate detection through FFT. (a) In the case of (almost) correct
τ0 estimate; (b) In the case of incorrect τ0 estimate.
Let us suppose, instead, that the estimate provides a value farther from the exact one, e.g., 0τ = 5.38 ns.
In this case, the FFT provides the result shown in Figure 13b. The highest peak now occurs at a frequency
that is twice the right value. In conclusion, we can say that the procedure above, based on a single, properly

Sensors 2015, 15 578
selected, FFT fast-time instant, produces reliable and unambiguous results only on condition that the
estimate of τ0 is very accurate. As mentioned above, the inaccuracy in the estimate of τ0 can be
compensated by extending the computation of the Fourier transform to a range centered around 0τ .
Figure 14 shows, in a color map, the values of the Fourier transform computed on the set of columns in
a range equivalent to ±5 mm around the estimated nominal distance, when 0τ = 5.38 ns. We see that
most of the Fourier transforms, in the considered range of fast-time values, show a peak at fb. Obviously,
coherent with the previous analysis, some transforms have a peak at 2fb, and this may yield an error if
evaluation is done on single vectors. The impact of such wrong estimates is smoothed by averaging the
results on the ensemble of transforms. This is shown in Figure 15, that reports the “average” transform
so obtained; from the figure, we see that this average spectrum has a peak at fb that, therefore, can be
correctly estimated also in the presence of some error in the estimated value of τ0.
Figure 14. Iterated FFT around the τ0 estimate.
Figure 15. Average FFT for the considered example.
4.2. Thorax Movement Reconstruction
The accurate reconstruction of the instantaneous thorax position is possible, at least in principle, by
using a correlation-based radar. A block scheme of a system of this type is shown in Figure 16. Apart from
the possible introduction of suitable scaling factors, the correlation function is defined as the integral (i.e.,

Sensors 2015, 15 579
low-pass filtering) of the product between the received signal r(t, τ) and a reference signal s(t, τ). The
position of the maximum of the correlation function allows to determine directly the target distance.
Computation of the correlation must be repeated at any acquisition, i.e., for any value of the slow-time t.
Figure 16. Schematic representation of correlation-based detection.
The main problem when using correlation-based methods is the choice of the reference signal. Various
options are possible. The simplest choice for the reference signal consists of assuming the same pulse shape
as in the transmitter [43]; this, however, makes detection highly vulnerable to possible distortion of the
signal. The best correlation, in fact, is obtained when the shape of the reference signal matches well the
received pulse (rather than the transmitted one).
For this reason, in [44] a method is proposed that is based on the continuous wavelet transform (CWT).
Thanks to the property of wavelets to be localized in time and frequency, they can be adapted, through
optimization of the dilatation and translation scale factors, to the received waveform. The main drawback
of the method in [44] is the rather long processing time it requires. On the other hand, once having specified
the environment, an approximation of the expected received pulse shape can be determined in advance.
In the experiment described in [45], for example, a received signal was found, that was very similar to
the seventh derivative of the Gaussian function, so that the latter was assumed as the reference.
In [46], we have proposed a different approach, which consists of considering, as the reference signal,
the same waveform of the received signal. More precisely, by exploiting the range-gating capability that
is inherent to the UWB radar, the significant part of the received signal is isolated and then used as
the reference.
Example 2
Let us consider the same scenario hinted in Example 1. Following [46], the received signal has been
used as the reference signal. The reconstructed thorax movement, originally described through a
sinusoidal function with frequency fb = 0.475 Hz and amplitude mb = 12 mm, is plotted in Figure 17.
Qualitatively, we see that both the values of fb and mb are estimated with good accuracy.
The goodness of the thorax movement reconstruction can be measured by computing the correlation
coefficient between the original and reconstructed respiration waveforms, defined as:
2 2
ˆ
ˆ
i ii
i ii i
z zr
z z=
(9)
Integrator
Shaper Delay
Received signal
Pulsegenerator
Transmitted signal
Correlator output
Controller

Sensors 2015, 15 580
where zi is the actual value of the chest displacement at the i-th sampling instant and ˆiz its estimated
value. Alternatively, we can compute the normalized-square-error (NSE), defined as:
( )2
2
ˆNSE
i ii
ii
z z
z
−=
(10)
Figure 17. Example of reconstruction of the thorax movement: original waveform (+) against
reconstructed waveform (o).
Example 2 (ctd.)
The normalized-square-error for the waveform shown in Figure 17, where the received signal has
been used as the local reference, is NSE = 2.35 × 10⁻⁴. By using the method in [44] for the same example,
the error is smaller, resulting in NSE = 7.18 × 10⁻⁵. As a drawback, however, the processing time for the
method based on CWT is significantly higher (more than 10 times greater). The processing time is also
small when using the transmitted waveform as the reference signal but, in this case, the error becomes
significantly larger: for the considered example, it is NSE = 1.99 × 10⁻².
4.3. Body Movement Compensation
Obviously, the UWB radar detection techniques is altered by the body movement and, in the absence
of proper countermeasures, detecting the respiration waveform and even its rate can become impossible.
In spite of its importance, this problem has rarely been faced in previous literature. The solution proposed
in [47], for the case of a Doppler radar sensor, adopts a complex signal demodulation technique. The
system uses multiple antennas and transceivers to perform detection both from the front and from the back
of the human body. Through theory and experiments, the authors demonstrate that a small random body
movement (in the order of 5 cm in a time of 5 s) can be completely canceled out. Such a limited and slow
movement may be significant when the subject is in rest position (as in the NIMURRA reference scenario),
while, in general, wider and faster excursions could be investigated as well. In [13], such an approach is
extended by considering a different demodulation method for noncontact vital sign detection, i.e., the
arctangent demodulation. In this case, the measurement efficiency is related to the calibration accuracy
of the baseband dc offset. A further solution, presented in [48], adopts a differential front-end Doppler
0 2 4 6 8 10-15
-10
-5
0
5
10
15
Time[s]
Dis
plac
emen
t [m
m]
Chest displacement

Sensors 2015, 15 581
radar operating at two different frequencies. All these methods exploit Doppler radar sensors and require
at least two antennas.
In [49], we have proposed a method to compensate for the body movement also in monostatic UWB
radars, with only one antenna placed in front of the body. The method extends the procedure described
in Section 4.1 for the case of still subjects. Similar to the latter, the best fast-time instant, τ0, must be
identified, at which performing the spectral analysis. As described in Section 4.1 when the subject is
still, this can be done searching for the value of τ at which the energy is maximum. In this case the energy
can be averaged, for each fast-time instant, over the whole slow-time axis t. On the contrary, when the
subject is moving, such approach becomes inefficient, and the value of τ0 needs to be determined
separately for each row (or block of rows, if the subject movement is slow) of matrix R. Since τ0
measures the “nominal” subject distance d0, by estimating it we can follow the body movement,
compensate it and, finally, recover the unknown parameters.
More precisely, for each row of the matrix, we must estimate the distance between the antenna and the
chest, which is influenced by both the respiration activity and the subject movement. In order to assess
the respiration parameters, we need to separate these two contributions. For such purpose, we use the
estimated distance values as input for a fitting function that interpolates them, as a function of the slow-time,
by means of a sum of m sinusoidal functions (m is the order of the interpolating law). It should be noted that
a similar fitting technique is used in [50] to model and cancel the respiration motion when reconstructing
the cardiac motion. In that case, however, besides the different target, the authors use a polynomial of order
m instead of sinusoidal functions. A fitting function suitable for our purposes is available, for example, in
Matlab®, with 1 ≤ m ≤ 8. By adjusting its parameters, the fitting function allows to estimate the subject
movement (i.e., the variation of d0), and to separate it from the breath activity. In principle, separation
would be possible by using simple pass-band filters. However, these filters often have overlapped harmonics,
which make filtering inefficient. The use of the fitting tool permits us to overcome this drawback. The
received waveforms are then realigned by shifting each of them by a quantity that is equal to the estimated
subject movement at the corresponding row. This allows to obtain a “compensated” elaboration matrix,
which is equivalent to have a still subject placed at the initial distance from the antenna, and to perform
a spectral analysis in the same manner as when the subject is still. Moreover, by isolating the chest
movement, the value of mb can be estimated as well. Numerical examples are reported in [49].
In order to assess and validate the considered techniques in a real life environment, an experimental
setup has been prepared and a measurement campaign has been carried out. The experimental setup models
a bistatic UWB radar exploiting two double-ridge antennas. The equipment involves a Picosecond Pulse
Labs 2600C pulse generator (Picosecond Pulse Labs, Boulder, CO, USA) and a Tektronix TDS 7404
oscilloscope (Tektronix, Inc., Beaverton, OR, USA) with digital data acquisition feature, each connected to
one antenna. The pulse generator has PRF equal to 1 kHz and pulse length of about 1.5 ns. The oscilloscope
has sampling rate equal to 20 GSamples/s and works in “fast frame” acquisition mode. The
measurements were performed inside a semi anechoic environment, with anechoic walls placed behind
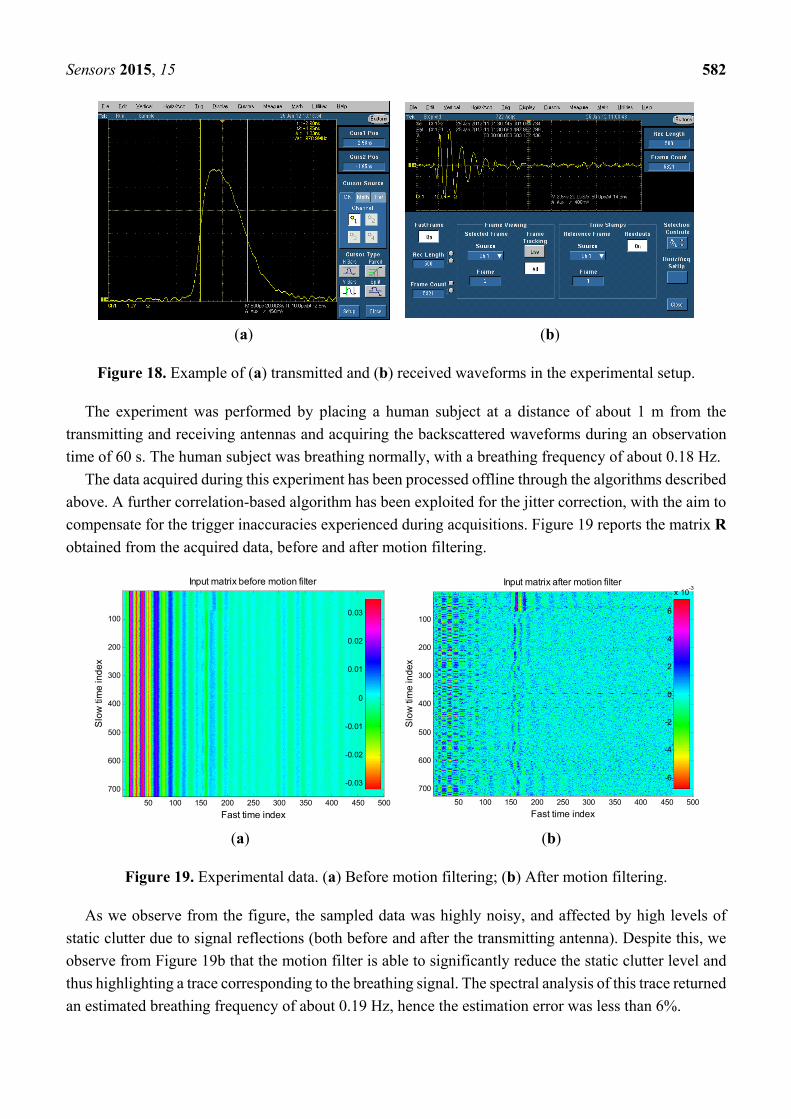
the subject under test, to simulate a low-reflection scenario (like an open environment). Figure 18 reports
an example of the transmitted and received waveform in the considered experimental setup.
Sensors 2015, 15 582
(a) (b)
Figure 18. Example of (a) transmitted and (b) received waveforms in the experimental setup.
The experiment was performed by placing a human subject at a distance of about 1 m from the
transmitting and receiving antennas and acquiring the backscattered waveforms during an observation
time of 60 s. The human subject was breathing normally, with a breathing frequency of about 0.18 Hz.
The data acquired during this experiment has been processed offline through the algorithms described
above. A further correlation-based algorithm has been exploited for the jitter correction, with the aim to
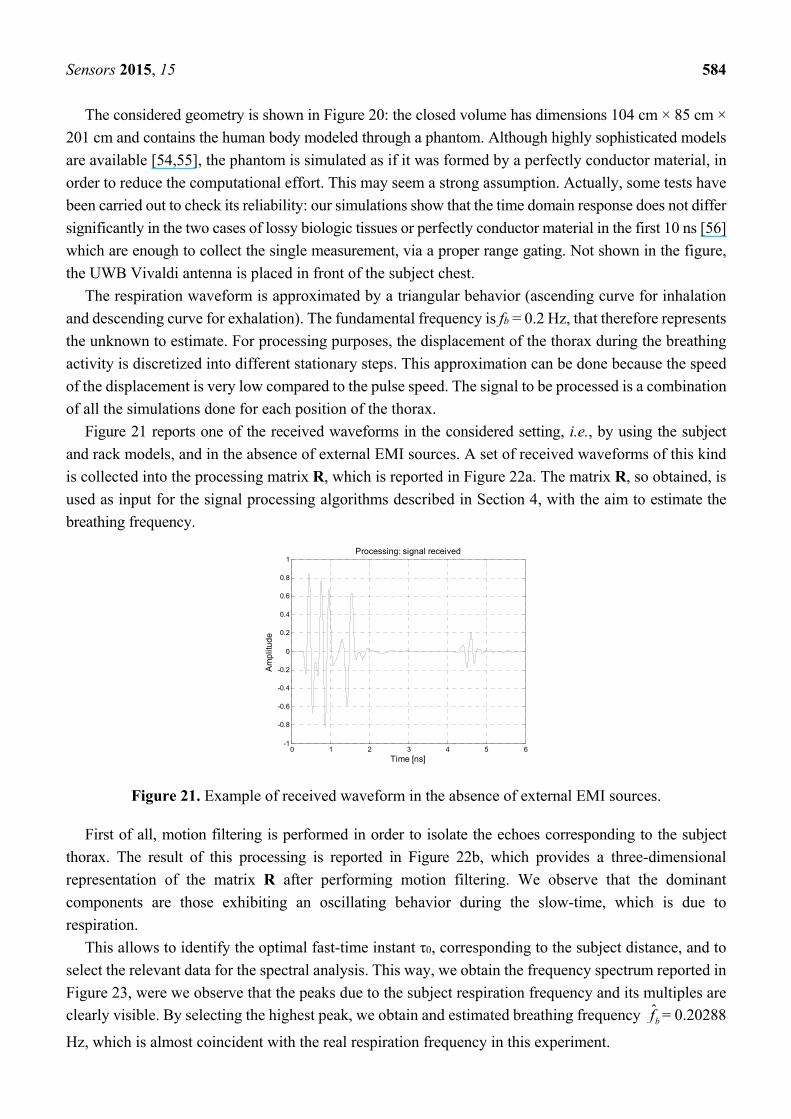
compensate for the trigger inaccuracies experienced during acquisitions. Figure 19 reports the matrix R
obtained from the acquired data, before and after motion filtering.
(a) (b)
Figure 19. Experimental data. (a) Before motion filtering; (b) After motion filtering.
As we observe from the figure, the sampled data was highly noisy, and affected by high levels of
static clutter due to signal reflections (both before and after the transmitting antenna). Despite this, we
observe from Figure 19b that the motion filter is able to significantly reduce the static clutter level and
thus highlighting a trace corresponding to the breathing signal. The spectral analysis of this trace returned
an estimated breathing frequency of about 0.19 Hz, hence the estimation error was less than 6%.
Fast time index
Slo
w ti
me
ind
ex
Input matrix before motion filter
50 100 150 200 250 300 350 400 450 500
100
200
300
400
500
600
700-0.03
-0.02
-0.01
0
0.01
0.02
0.03
Fast time index
Slo
w ti
me
ind
ex
Input matrix after motion filter
50 100 150 200 250 300 350 400 450 500
100
200
300
400
500
600
700-6
-4
-2
0
2
4
6
x 10-3

Sensors 2015, 15 583
5. Application to the Space Environment
The examples presented in Section 4 give an idea of the potentialities of the approach. However, the
peculiarity of our analysis is to apply the UWB sensing system to the detection of the breath signal in a
complex scenario like that of a space module. For this purpose, it has to be considered that the system
works in a highly resonant environment and, moreover, it suffers all the possible EMI signals coming
from other sources. The system has to work properly also in this highly noisy environment.
Based on these premises, it is evident that, in order to analyze the performance of the system, a complete
characterization of the environment is necessary. The UWB system is intended to be placed inside the
racks where the astronauts rest. The choice of locating the system for breathing detection inside the rack
where the astronauts sleep was adopted after a long preliminary study concerning the propagation of
electromagnetic pulses in the ISS typical environment. The study has permitted us to highlight many
critical situations due to multipath [51]. The racks have a metallic structure closed with special fabric for
acoustic and solar radiation protection, and a door is placed in the front side of each rack. In order to take
into account the presence of the rack, the numerical analysis has been divided in two parts. Firstly, the
space module environment and an open rack were analyzed [51]. The results show that, as expected, the
reflecting behavior of the module creates a very noisy environment due to the multiple reflections of the
structure. The reflected pulses can be considered as a broadband noise superposed to the useful signal
coming from the body. It is important to observe that, for the goals of our analysis, it is sufficient to
consider, and properly simulate, only the reflections due to the metallic walls of the rack. As mentioned
above, the situation would be different if sensing were realized when the astronauts freely move inside the
space station; in this case a complete characterization of the multipath profile would be necessary, like that
realized in designing a wi-fi network on board of the ISS [52,53]. A sensing of this kind, though certainly
interesting, still exhibits several practical problems that make its implementation rather difficult. For this
reason, the NIMURRA project has been focused on breath sensing during the rest.
Then, in the second part of the study, the performance of the system was assessed in presence of
broadband and narrowband noise sources external to the rack, while considering the human body inside
the rack. The effect of the EMI sources could induce errors in the calculation of the breathing frequency,
even though their emission levels are sufficiently low to avoid the risk of component damage, as discussed
in Section 3.
Figure 20. Geometry considered for the calculation of the interfering signal.
Sensors 2015, 15 584
The considered geometry is shown in Figure 20: the closed volume has dimensions 104 cm × 85 cm ×
201 cm and contains the human body modeled through a phantom. Although highly sophisticated models
are available [54,55], the phantom is simulated as if it was formed by a perfectly conductor material, in
order to reduce the computational effort. This may seem a strong assumption. Actually, some tests have
been carried out to check its reliability: our simulations show that the time domain response does not differ
significantly in the two cases of lossy biologic tissues or perfectly conductor material in the first 10 ns [56]
which are enough to collect the single measurement, via a proper range gating. Not shown in the figure,
the UWB Vivaldi antenna is placed in front of the subject chest.
The respiration waveform is approximated by a triangular behavior (ascending curve for inhalation
and descending curve for exhalation). The fundamental frequency is fb = 0.2 Hz, that therefore represents
the unknown to estimate. For processing purposes, the displacement of the thorax during the breathing
activity is discretized into different stationary steps. This approximation can be done because the speed
of the displacement is very low compared to the pulse speed. The signal to be processed is a combination
of all the simulations done for each position of the thorax.
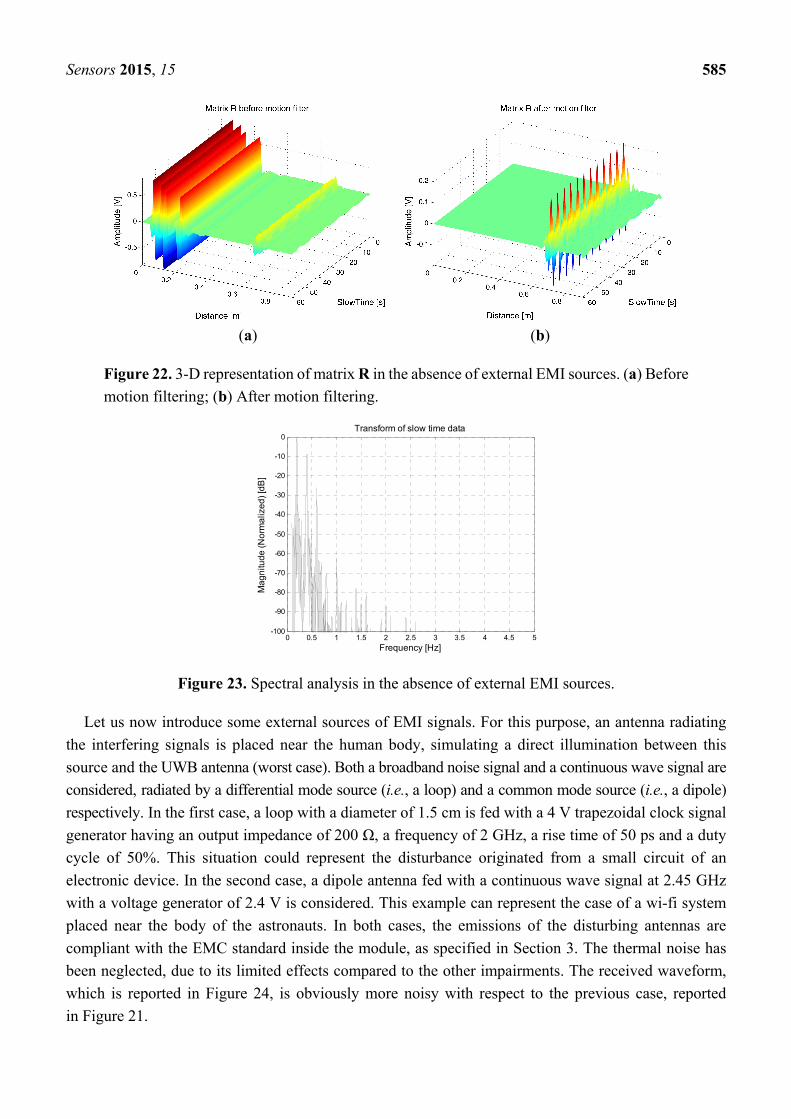
Figure 21 reports one of the received waveforms in the considered setting, i.e., by using the subject
and rack models, and in the absence of external EMI sources. A set of received waveforms of this kind
is collected into the processing matrix R, which is reported in Figure 22a. The matrix R, so obtained, is
used as input for the signal processing algorithms described in Section 4, with the aim to estimate the
breathing frequency.
Figure 21. Example of received waveform in the absence of external EMI sources.
First of all, motion filtering is performed in order to isolate the echoes corresponding to the subject
thorax. The result of this processing is reported in Figure 22b, which provides a three-dimensional
representation of the matrix R after performing motion filtering. We observe that the dominant
components are those exhibiting an oscillating behavior during the slow-time, which is due to
respiration.
This allows to identify the optimal fast-time instant τ0, corresponding to the subject distance, and to
select the relevant data for the spectral analysis. This way, we obtain the frequency spectrum reported in
Figure 23, were we observe that the peaks due to the subject respiration frequency and its multiples are
clearly visible. By selecting the highest peak, we obtain and estimated breathing frequency bf = 0.20288
Hz, which is almost coincident with the real respiration frequency in this experiment.
0 1 2 3 4 5 6-1
-0.8
-0.6
-0.4
-0.2
0
0.2
0.4
0.6
0.8
1
Time [ns]
Am
plit
ude
Processing: signal received
Sensors 2015, 15 585
(a) (b)
Figure 22. 3-D representation of matrix R in the absence of external EMI sources. (a) Before
motion filtering; (b) After motion filtering.
Figure 23. Spectral analysis in the absence of external EMI sources.
Let us now introduce some external sources of EMI signals. For this purpose, an antenna radiating
the interfering signals is placed near the human body, simulating a direct illumination between this
source and the UWB antenna (worst case). Both a broadband noise signal and a continuous wave signal are
considered, radiated by a differential mode source (i.e., a loop) and a common mode source (i.e., a dipole)
respectively. In the first case, a loop with a diameter of 1.5 cm is fed with a 4 V trapezoidal clock signal
generator having an output impedance of 200 Ω, a frequency of 2 GHz, a rise time of 50 ps and a duty
cycle of 50%. This situation could represent the disturbance originated from a small circuit of an
electronic device. In the second case, a dipole antenna fed with a continuous wave signal at 2.45 GHz
with a voltage generator of 2.4 V is considered. This example can represent the case of a wi-fi system
placed near the body of the astronauts. In both cases, the emissions of the disturbing antennas are
compliant with the EMC standard inside the module, as specified in Section 3. The thermal noise has
been neglected, due to its limited effects compared to the other impairments. The received waveform,
which is reported in Figure 24, is obviously more noisy with respect to the previous case, reported
in Figure 21.
0 0.5 1 1.5 2 2.5 3 3.5 4 4.5 5-100
-90
-80
-70
-60
-50
-40
-30
-20
-10
0
Ma
gn
itud
e (
No
rma
lize
d)
[dB
]
Transform of slow time data
Frequency [Hz]
Sensors 2015, 15 586
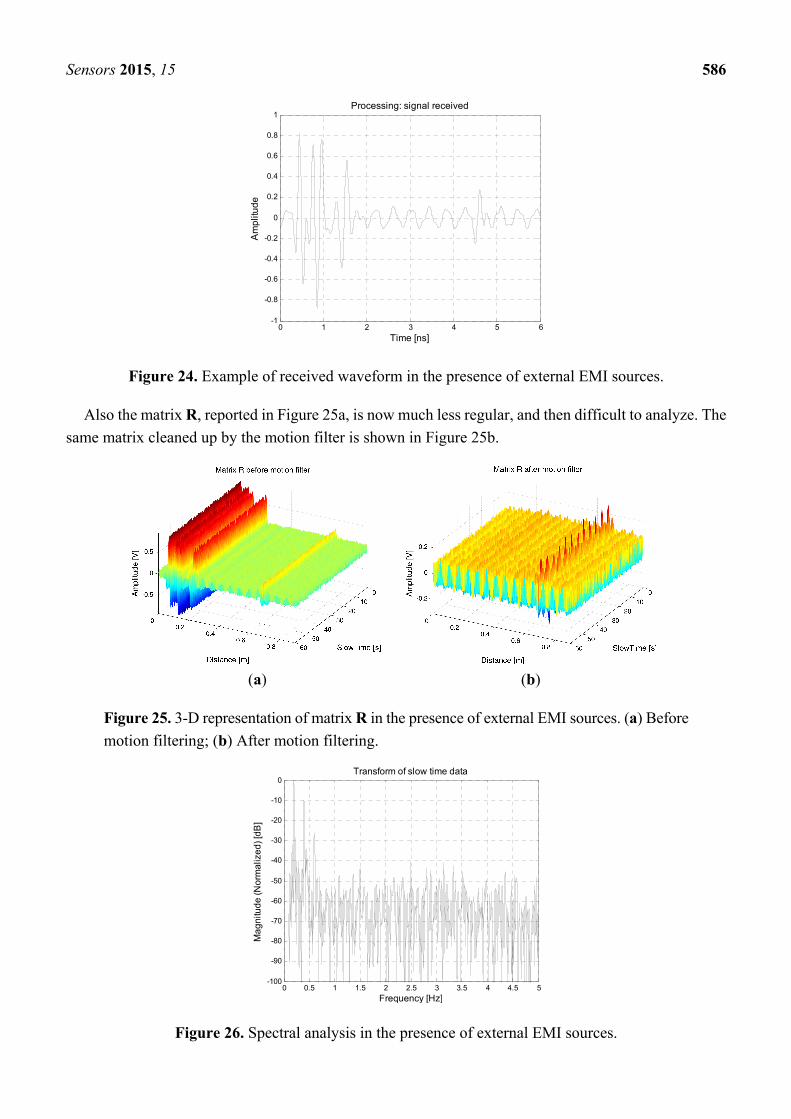
Figure 24. Example of received waveform in the presence of external EMI sources.
Also the matrix R, reported in Figure 25a, is now much less regular, and then difficult to analyze. The
same matrix cleaned up by the motion filter is shown in Figure 25b.
(a) (b)
Figure 25. 3-D representation of matrix R in the presence of external EMI sources. (a) Before
motion filtering; (b) After motion filtering.
Figure 26. Spectral analysis in the presence of external EMI sources.
0 1 2 3 4 5 6-1
-0.8
-0.6
-0.4
-0.2
0
0.2
0.4
0.6
0.8
1
Time [ns]
Am
plit
ud
e
Processing: signal received
0 0.5 1 1.5 2 2.5 3 3.5 4 4.5 5-100
-90
-80
-70
-60
-50
-40
-30
-20
-10
0
Ma
gn
itud
e (
No
rma
lize
d)
[dB
]
Transform of slow time data
Frequency [Hz]
Sensors 2015, 15 587
Apparently the samples are very noisy; actually, however, the trace of the breathing signal is still
clearly visible. Consequently, the spectral analysis provides the curve shown in Figure 26, from which
we observe that the peaks corresponding to the breathing frequency and its multiples are still clearly
distinguishable. This confirms that, even in the presence of the considered external EMI sources, the
breathing frequency can be estimated correctly. In fact, we obtain the same estimated frequency value
as before.
6. Conclusions
The feasibility study of a system for remote breathing sensing of astronauts was the main goal of
the ASI NIMURRA project. One of the main problems faced during the project development was the
definition of the system design specifications, because each electronic device on board of the space
station has to undergo to regulations much more severe than those addressed to terrestrial environments.
In this paper a thorough analysis of the presence of the breath sensor inside the rack where the astronaut
rests has been presented. The study was based on simulation of realistic situations as far as the environment
characteristics, both in terms of geometry and EMI sources, is concerned. To perform accurate simulations
in a critical environment, an experimental validation of the numerical results has been carried out. As the
main feature of the system is the contactless sensing through UWB pulses, the radiation of electromagnetic
pulses has been analyzed and compared with emission standards in order to assess the most suitable
duration, amplitude and waveform of the pulses to be radiated to retrieve respiration frequency. The impact
of the electromagnetic environment has been also considered because the highly resonant structure may
cause susceptibility problems and malfunctions due to the interference with other electromagnetic sources
nearby and with pulse echoes reflected by metallic walls of the rack instead of the thorax movements of
the monitored astronauts. The study has also concerned the definition and implementation of suitable signal
processing tools able to remove the static clutter from the received waveforms and to isolate the contributions
due to the breathing activity. By performing a spectral analysis after an initial filtering, the breathing
rate is reliably detected. The whole respiration waveform can also be recovered through the use of a
correlation-based approach exploiting a reference signal. The devised signal processing tools have been
also validated through an experimental campaign carried out, in the laboratory, on human subjects. Based
on our results, we can conclude that the solution based on UWB signals for respiration sensing of
astronauts is feasible, robust and it offers sufficient accuracy to highlight conditions of suffering due to
lack of oxygen.
Acknowledgments
This research has been funded in part by the Italian Space Agency (ASI), within the NIMURRA project,
under contract No. I/009/11/0. The authors wish to thank Adelmo De Santis and Alfredo De Leo for
their contribution concerning the laboratory experiments.
Author Contributions
G. Cerri, L. Eusebi and P. Russo have investigated the electromagnetic aspects, as regards both the
theoretical and the experimental issues. M. Baldi and F. Chiaraluce have investigated the signal

Sensors 2015, 15 588
processing aspects, developing the software for elaborating the signals and extracting from them the
relevant quantities. All the authors have contributed to the writing and critical review of the manuscript.
Conflicts of Interest
The authors declare no conflict of interest.
References
1. Roshan Fekr, A.; Janidarmian, M.; Radecka, K.; Zilic, Z. A medical cloud-based platform for
respiration rate measurement and hierarchical classification of breath disorders. Sensors 2014, 14,
11204–11224.
2. Zhang, Z.; Zheng, J.; Wu, H.; Wang, W.; Wang, B.; Liu, H. Development of a respiratory inductive
plethysmography module supporting multiple sensors for wearable systems. Sensors 2012, 12,
13167–13184.
3. Santy, P.A.; Kapanka, H.; Davis, J.R.; Stewart, D.F. Analysis of sleep on Shuttle missions.
Aviat. Space Environ. Med. 1988, 59, 1094–1097.
4. Stampi, C. Sleep and circadian rhythms in space. J. Clin. Pharmacol. 1994, 34, 518–534.
5. Li, C.; Lubecke, V.M.; Boric-Lubecke, O.; Lin, J. A review on recent advances in Doppler radar sensors
for noncontact healthcare monitoring. IEEE Trans. Microw. Theory Tech. 2013, 61, 2046–2060.
6. Chang, Y.J.; Chen, C.H.; Lin, L.F.; Han, R.P.; Huang, W.T.; Lee, G.C. Wireless sensor
networks for vital signs monitoring: Application in a nursing home. Int. J. Distr. Sens. Netw. 2012,
2012, doi:10.1155/2012/685107.
7. Franks, C.I.; Brown, B.H.; Johnston, D.M. Contactless respiration monitoring of infants.
Med. Biol. Eng. 1976, 14, 306–318.
8. Lee, J.Y.; Lin, J.C. A microprocessor-based non-invasive arterial pulse wave analyzer.
IEEE Trans. Biomed. 1985, 32, 451–455.
9. Chen, K.M.; Misra, D.; Wang, H.; Chuang, H.R.; Postov, E. An X-band microwave life-detection
system. IEEE Trans. Biomed. 1986, 33, 697–701.
10. Lohman, B.; Boric-Lubecke, O.; Ong, P.W.; Sondhi, M.M. A digital signal processor for Doppler
radar sensing of vital signs. IEEE Eng. Med. Biol. 2002, 21, 161–164.
11. Boric-Lubecke, O.; Lubecke, V.; Madsen, A.H.; Samardzija, A.; Cheung, K. Doppler radar sensing
of multiple subjects in single and multiple antenna systems. In Proceedings of the 7th International
Conference on Telecommunications in Modern Satellite, Cable and Broadcasting Services, Niš,
Serbia and Montenegro, 28–30 September 2005; Volume 1, pp. 7–11.
12. Zhou, Q.; Liu, J.; Madsen, A.H.; Boric-Lubecke, O.; Lubecke, V. Detection of multiple heartbeats
using Doppler radar. In Proceedings of the IEEE International Conference on Acoustics, Speech
and Signal Processing, Toulouse, France, 14–19 May 2006; Volume 1, pp. 1160–1163.
13. Li, C.; Lin, J. Random body movement cancellation in Doppler radar vital sign detection.
IEEE Trans. Microw. Theory Tech. 2008, 56, 3143–3152.
14. D’Urso, M.; Leone, G.; Soldovieri, F. A simple strategy for life signs detection via an X-band
experimental set-up. Prog. Electromagn. Res. C 2009, 9, 119–129.
Sensors 2015, 15 589
15. Li, C.; Yanming, X.; Jenshan, L. Experiment and spectral analysis of a low-power Ka-band
heartbeat detector measuring from four sides of a human body. IEEE Trans. Microw. Theory Tech.
2006, 54, 4464–4471.
16. Park, B.K.; Boric-Lubecke, O.; Lubecke, V.M. Arctangent demodulation with DC offset compensation
in quadrature Doppler radar receiver systems. IEEE Trans. Microw. Theory Tech. 2007, 55, 1073–1079.
17. Wang, F.K.; Li, C.J.; Hsiao, C.H.; Horng, T.S.; Lin, J.; Peng, K.C.; Jau, J.K.; Li, J.Y.; Chen, C.C.
A novel vital-sign sensor based on a self-injection-locked oscillator. IEEE Trans. Microw. Theory Tech.
2010, 58, 4112–4120.
18. Yilmaz, T.; Foster, R.; Hao, Y. Detecting vital signs with wearable wireless sensors. Sensors 2010,
10, 10837–10862.
19. Azevedo, S.G.; McEwan, T.E. Micropower impulse radar. IEEE Potentials 1997, 16, 15–20.
20. Yarovoy, A.; Ligthart, L.; Matuzas, J.; Levitas, B. UWB radar for human being detection.
IEEE Aerosp. Electron. Syst. Mag. 2006, 23, 22–26.
21. Nezirovic, A.; Yarovoy, A.G.; Ligthart, L.P. Signal processing for improved detection of trapped
victims using UWB radar. IEEE Trans. Geosci. Remote Sens. 2010, 48, 2005–2014.
22. Li, J.; Liu, L.; Zeng, Z.; Liu, F. Advanced signal processing for vital sign extraction with applications
in UWB radar detection of trapped victims in complex environments. IEEE J. Sel. Top. Appl. Earth
Obs. Remote Sens. 2013, 7, 783–791.
23. Lu, B.; Sun, X.; Zhao, Y.; Zhou, Z. Spatial spectrum-based imaging for UWB through-the-wall
MIMO arrays. Int. J. Antennas Propag. 2014, 2014, doi:10.1155/2014/825403.
24. Arai, I. Survivor search radar system for persons trapped under earthquake rubble. In Proceedings
of the Asia-Pacific Microwave Conference, Taipei, Taiwan, 3–6 December 2001; Volume 2,
pp. 663–668.
25. Labarthe, C.; Mutzig, J.; Jecko, B.; Hamieh, H.; Martinod, E.; Feix, N.; Lalande, M.; Denoual, J.;
Floch, J.; Bertrand, V.; et al. An ultra-wideband radar concept for the detection of buried victims
beneath building rubble. In Proceedings of the International Radar Conference—Surveillance for a
Safer World, Bordeaux, France, 12–16 October 2009; pp. 1–6.
26. Li, J.; Zeng, Z.; Sun, J.; Liu, F. Through-wall detection of human being’s movement by UWB radar.
IEEE Geosci. Remote Sens. Lett. 2012, 9, 1079–1083.
27. Grazzini, G.; Pieraccini, M.; Parrini, F.; Spinetti, A.; Macaluso, G.; Dei D.; Atzeni, C. An
ultra-wideband high-dynamic range GPR for detecting buried people after collapse of buildings.
In Proceedings of the 13th International Conference on Ground Penetrating Radar, Lecce, Italy,
21–25 June 2010; pp. 1–6.
28. NASA/TM-2002–211949. Ultrawideband Electromagnetic Interference to Aircraft Radios Results of
Limited Functional Testing With United Airlines and Eagles Wings Incorporated. Available online:
http://ntrs.nasa.gov/search.jsp?R=20020085182 (accessed on 28 October 2014).
29. Ely, J.J.; Martin, W.L.; Fuller, G.L.; Shaver, T.W.; Zimmerman, J.; Larsen, W.E. UWB EMI to
aircraft radios: Field evaluation on operational commercial transport airplanes. In Proceeding of
the 23rd Digital Avionics Systems Conference, Salt Lake City, UT, USA, 24–28 October 2004;
pp. 9D4.1–9D4.11.
Sensors 2015, 15 590
30. NASA/TP-2005–213606. UWB EMI to Aircraft Radios: Field Evaluation on Operational
Commercial Transport Airplanes. Available online: http://ntrs.nasa.gov/search.jsp?R=20050176486
(accessed on 28 October 2014).
31. Lai, J.C.Y.; Xu, Y.; Gunawan, E.; Chua, E.C.P.; Maskooki, A.; Guan, Y.L.; Low, K.S.; So, C.B.;
Poh, C.L. Wireless sensing of human respiratory parameters by low-power ultrawideband impulse
radio radar. IEEE Trans. Instrum. Meas. 2011, 60, 928–938.
32. Nezirovic, A. Stationary clutter- and linear-trend suppression in impulse-radar-based respiratory
motion detection. In Proceedings of the IEEE International Conference on Ultra-Wideband, Bologna,
Italy, 14–16 September 2011; pp. 331–335.
33. Bernardi, P.; Cicchetti, R.; Pisa, S.; Pittella, E.; Piuzzi, E.; Testa, O. Design, realization, and test of
a UWB radar sensor for breath activity monitoring. IEEE Sens. J. 2014, 14, 584–596.
34. FCC. Revision of Part 15 of the Commission’s Rules Regarding Ultra-Wideband Transmission
Systems; Federal Communications Commission Std.: Washington, DC, USA, 2002.
35. Lamensdorf, D.; Susman, L. Baseband-pulse-antenna techniques. IEEE Antennas Propag. Mag.
1994, 36, 20–30.
36. Microwave Studio. CST-Computer Simulation Technology. Available online: https://www.cst.com/
Products/CSTMWS (accessed on 28 October 2014).
37. COL-ESA-RQ-014. Columbus EMC & Power Quality Requirements; European Space Agency,
Directorate of Manned Spaceflight and Microgravity: Noordwijk, The Netherlands, 2000.
38. SSP 30237—Revision F. Space Station Electromagnetic Emission and Susceptibility Requirements.
International Space Station Program, 2001. Available online: http://snebulos.mit.edu/projects/
reference (accessed on 29 December 2014).
39. MIL-STD-461-E. Requirements for the Control of Electromagnetic Interference Characteristics of
Subsystems and Equipment; Department of Defense: Englewood, CO, USA, 1999.
40. MIL-STD-462-D. Test Method Standard for Measurement of Electromagnetic Interference
Characteristics; Department of Defense: Englewood, CO, USA, 1999.
41. Venkatesh, S.; Anderson, C.R.; Rivera, N.V.; Buehrer, R.M. Implementation and analysis of
respiration-rate estimation using impulse-based UWB. In Proceedings of the IEEE Military
Communication Conference, Atlantic City, NJ, USA, 17–20 October 2005; Volume 5,
pp. 3314–3320.
42. Baldi, M.; Chiaraluce, F.; Moretti, M.; Venieri, F.; Zanaj, B. Signal modeling and processing
for physiological sensing through UWB radars. In Proceedings of the 19th International Conference
on Software, Telecommunications & Computer Networks, Split, Croatia, 15–17 September 2011.
43. Leib, M.; Menzel, W.; Schleicher, B.; Schumacher, H. Vital signs monitoring with a UWB
radar based on a correlation receiver. In Proceedings of the 4th European Conference on Antennas
Propagation, Barcelona, Spain, 12–16 April 2010; pp. 3425–3429.
44. Ossberger, G.; Buchegger, T.; Schimback, B.; Stelzer, A.; Weigel, R. Non-invasive respiratory
movement detection and monitoring of hidden humans using ultra wideband pulse radar.
In Proceedings of the International Workshop on Ultrawide Bandwidth System & Conference on
Ultra System Technology, Kyoto, Japan, 18–21 May 2004; pp. 395–399.

Sensors 2015, 15 591
45. Schleicher, B.; Dederer, J.; Leib, M.; Nasr, I.; Trasser, A.; Menzel, W.; Schumacher, H. Highly
compact impulse UWB transmitter for high resolution movement detection. In Proceedings of the
IEEE International Conference on Ultra-Wideband, Hannover, Germany, 10–12 September 2008;
Volume 1, pp. 89–92.
46. Baldi, M.; Chiaraluce, F.; Zanaj, B.; Moretti, M. Analysis and simulation of algorithms for
vital signs detection using UWB radars. In Proceedings of the IEEE International Conference on
Ultra-Wideband, Bologna, Italy, 14–16 September 2011; pp. 341–345.
47. Li, C.; Lin, J. Complex signal demodulation and random body movement cancellation techniques
for non-contact vital sign detection. In Proceedings of the IEEE International Microwave Symposium
Digest, Atlanta, GA, USA, 15–20 June 2008; pp. 567–570.
48. Fletcher, R.; Han, J. Low-cost differential front-end for Doppler radar vital sign monitoring.
In Proceedings of the IEEE International Microwave Symposium Digest, Boston, MA, USA,
7–12 June 2009; pp. 1325–1328.
49. Baldi, M.; Appignani, F.; Zanaj, B.; Chiaraluce, F. Body movement compensation in UWB radars for
respiration monitoring. In Proceedings of the IEEE First AESS European Conference on Satellite
Telecommunications, Rome, Italy, 2–5 October 2012.
50. Wang, J.; Wang, X.; Zhu, Z.; Huangfu, J.; Li, C.; Ran, L. 1-D microwave imaging of human cardiac
motion: An ab-initio investigation. IEEE Trans. Microw. Theory Tech. 2013, 61, 2101–2107.
51. Di Carlofelice, A.; di Giampaolo, E.; Tognolatti, P. A numerical investigation of UWB wave
propagation inside a module of the International Space Station. In Proceedings of the International
Symposium on Electromagnetic Compatibility, Rome, Italy, 17–21 September 2012.
52. Gutierrez, F., Jr.; Zitrick, D.; Ragan, L.; Rappaport, T. Multipath Study for A Wi-Fi Network in a
Space Station Environment; Technical Report, WNCG-TR-2005-09-01; The University of Texas:
Austin, TX, USA, 2005.
53. Hwu, S.U.; Loh, Y.C.; Sham, C.C. Space station wireless local area network signal characteristics
modeling and measurements. In Proceedings of the 25th IEEE/AIAA Conference on Digital Avionics
Systems, Portland, OR, USA, 15–19 October 2006; pp. 1–8.
54. Ackerman, M.J. The visible human project. Proc. IEEE 1998, 86, 504–511.
55. Christ, A.; Kainz, W.; Hahn, E.G.; Honegger, K.; Zefferer, M.; Neufeld, E.; Rascher, W.; Janka, R.;
Bautz, W.; Chen, J.; et al. The virtual family—Development of surface-based anatomical models of two
adults and two children for dosimetric simulations. Phys. Med. Biol. 2010, 55, N23–N38.
56. Russo, P.; Mariani Primiani, V.; de Leo, A.; Cerri, G. Radiated susceptibility of breath monitoring
system based on UWB pulses in spacecraft modules. In Proceedings of the International Symposium
on Electromagnetic Compatibility, Rome, Italy, 17–21 September 2012.
© 2014 by the authors; licensee MDPI, Basel, Switzerland. This article is an open access article
distributed under the terms and conditions of the Creative Commons Attribution license
(http://creativecommons.org/licenses/by/4.0/).
Related Documents